Key Performance Indicators (KPIs) of road safety in the ... · KPI 1. Observance of Speed Limits...
27
Kostas Papandreou - HELLASTRON Chief Executive Officer: Olympia Odos Operation S.A. Head of: permanent Committee COPER I, HELLASTRON Key Performance Indicators (KPIs) of road safety in the HELLASTRON network Charalambos Malimoglou Chief Operation Officer: InVision Consulting S.A. Technical Consultant: HELLASTRON
Transcript of Key Performance Indicators (KPIs) of road safety in the ... · KPI 1. Observance of Speed Limits...
Kostas Papandreou - HELLASTRON
Chief Executive Officer: Olympia Odos Operation S.A.Head of: permanent Committee COPER I, HELLASTRON
Key Performance Indicators (KPIs)
of road safety in the
HELLASTRON network
Charalambos MalimoglouChief Operation Officer: InVision Consulting S.A.
Technical Consultant: HELLASTRON
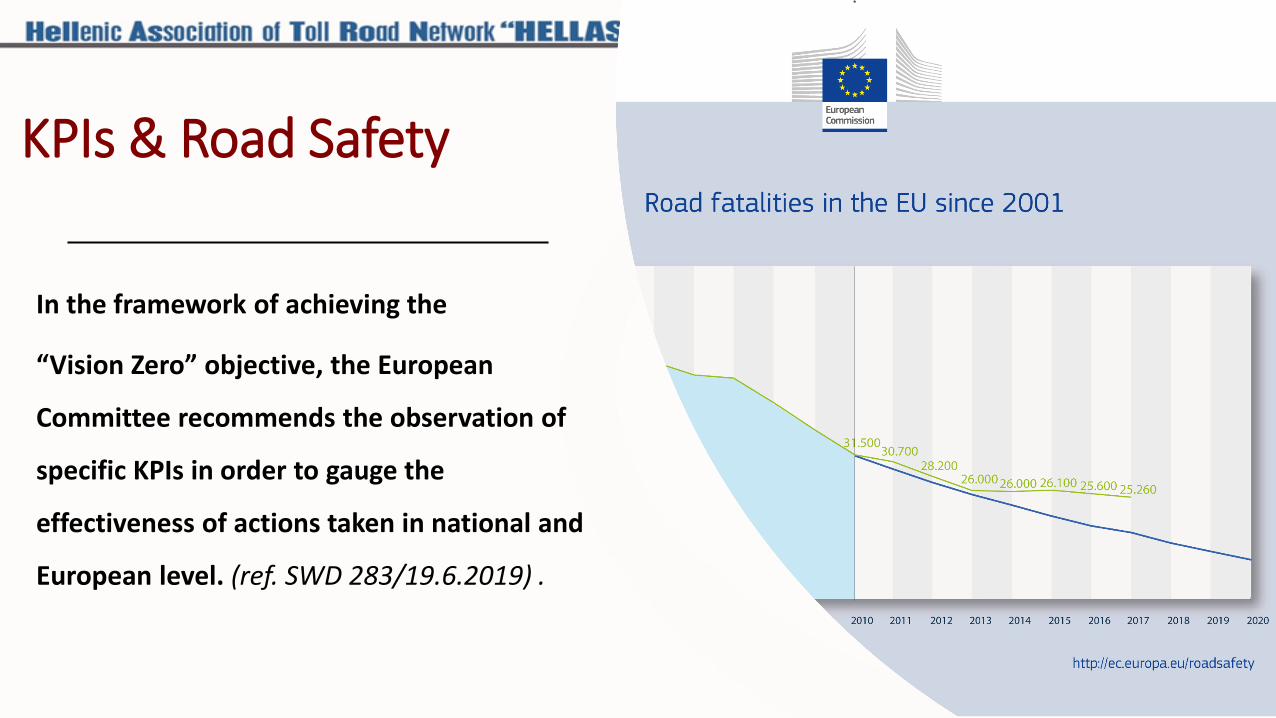
KPIs & Road Safety
In the framework of achieving the
“Vision Zero” objective, the European
Committee recommends the observation of
specific KPIs in order to gauge the
effectiveness of actions taken in national and
European level. (ref. SWD 283/19.6.2019) .

Vision “ZERO”Vision
“ZERO”
Long term Objective
Zero Fatalities or Serious Injury
Until 2050
Medium-term Objective
50% Less Fatalities and or Serious Injuries between 2020 and 2030
Intermediate Objectives (today)
Based on the improvement of the KPIs directly related to the reduction of Fatalities and Serious Injuries
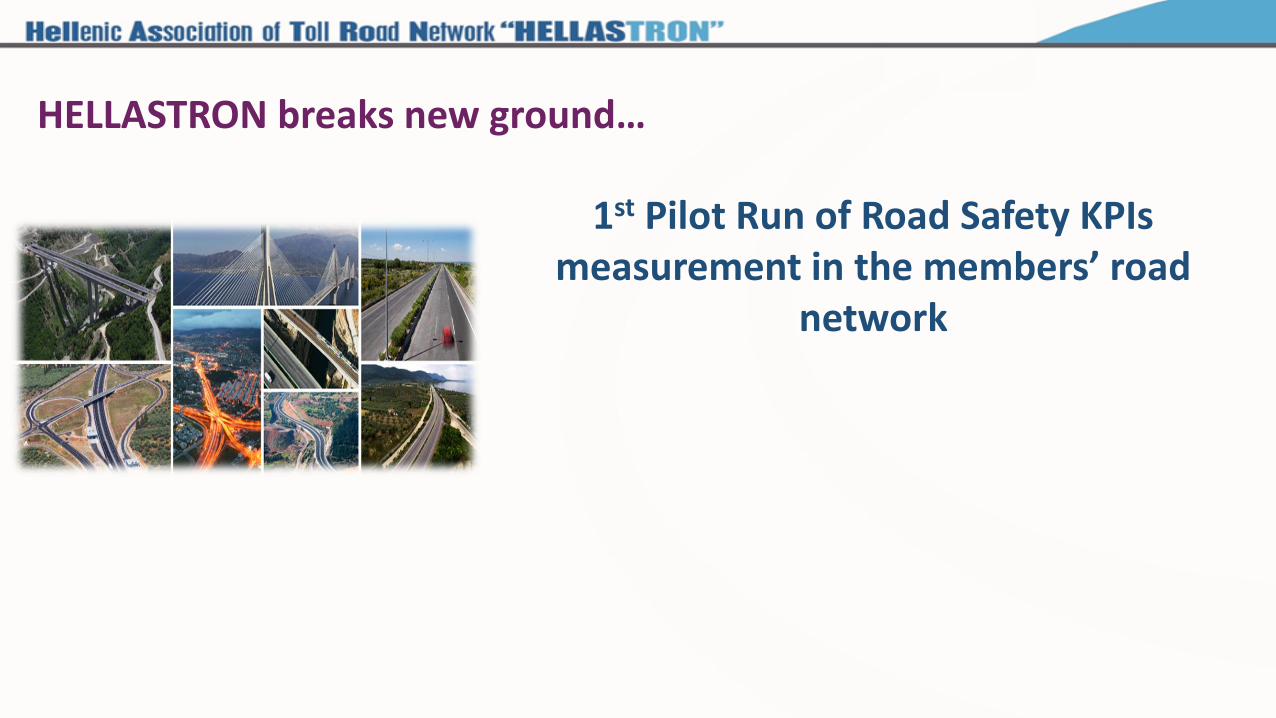
1st Pilot Run of Road Safety KPIs measurement in the members’ road
network
HELLASTRON breaks new ground…

Profits from the use of KPIs in Road Safety:
Improvement
Timely adjustment of applied policies
through continuous monitoring of
their results
Effectiveness
Measurement of taken actions results and resources spent
within individual policies in the framework of Road Safety
improvement
Efficiency
Pointing out the basic factors making up the Road
Safety, contributing to the actions identifications and
the more effective usage of the resources spent
KPIs
Communication
Complete and transparent communication
of data & information
in all implicated parties: Drivers, Competent Authorities,
Motorway Operators,
Regions, European Committee etc.

Current situation in Europe: Fatalities in Motorways per 1000 km. of motorway , 2007 and 2016
Source: Traffic Safety Basic Facts 2018,European Road Safety Observatory (ERSO)

Main KPIs for Road Safety:
KPI 1.Observance of Speed Limits
KPI 2.Use of Seat-belts and child safety seats
KPI 3.Use of helmet by Motorcyclists
KPI 4.Driving under the influence of alcohol
KPI 5.Distractions while Driving (Mobile phone, Tablet)
KPI 6.Vehicles Safety
KPI 7.Road Infrastructures Safety
KPI 8.Care of injured person after a road accident
person
vehicle
road
immediateintervention
Measured in the HELLASTRON network
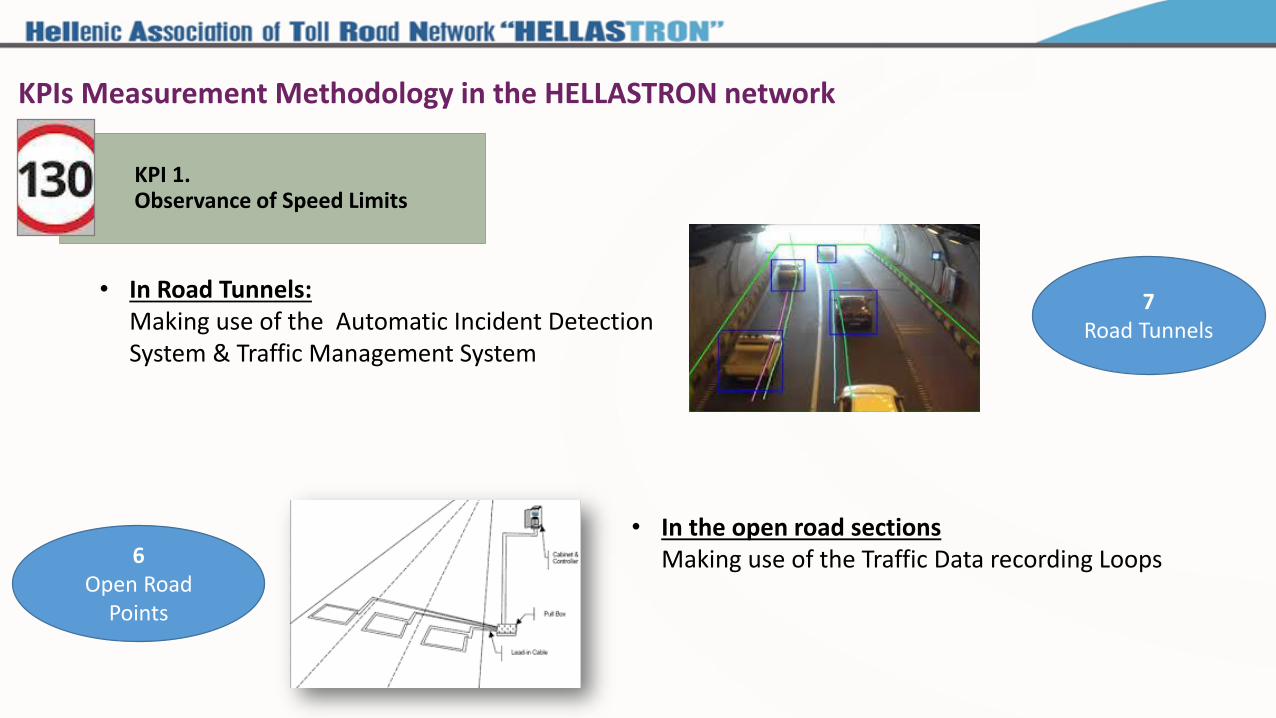
KPIs Measurement Methodology in the HELLASTRON network
KPI 1.Observance of Speed Limits
• In Road Tunnels: Making use of the Automatic Incident Detection System & Traffic Management System
• In the open road sectionsMaking use of the Traffic Data recording Loops
7 Road Tunnels
6Open Road
Points
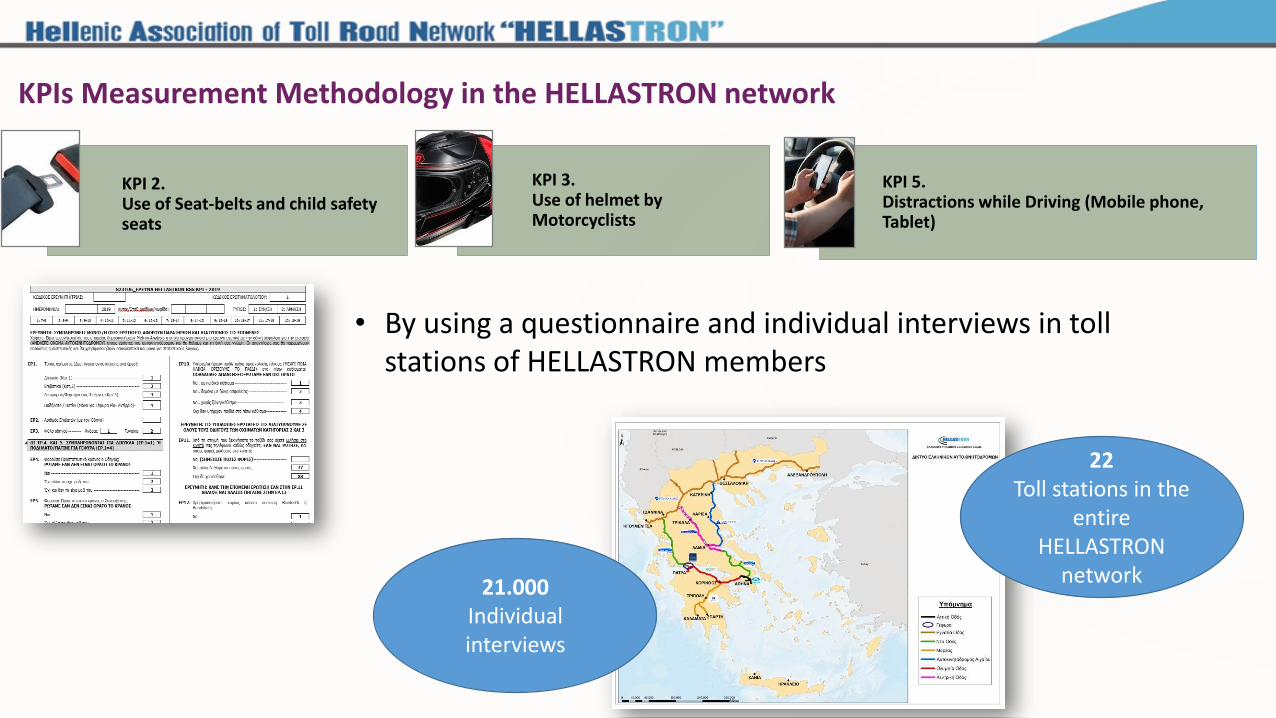
KPIs Measurement Methodology in the HELLASTRON network
KPI 2.Use of Seat-belts and child safety seats
KPI 3.Use of helmet by Motorcyclists
KPI 5.Distractions while Driving (Mobile phone, Tablet)
• By using a questionnaire and individual interviews in toll stations of HELLASTRON members
22Toll stations in the
entire HELLASTRON
network21.000
Individual interviews
-10-
0%
10%
20%
30%
40%
50%
60%
70%
80%
90%
100%
27,3%
68,2%
23,4%
51,7%
Πέμπτη 12/9/2019 Κυριακή 15/9/2019
ROAD TUNNELS OPEN ROAD SECTIONS
Sunday 15/9/2019
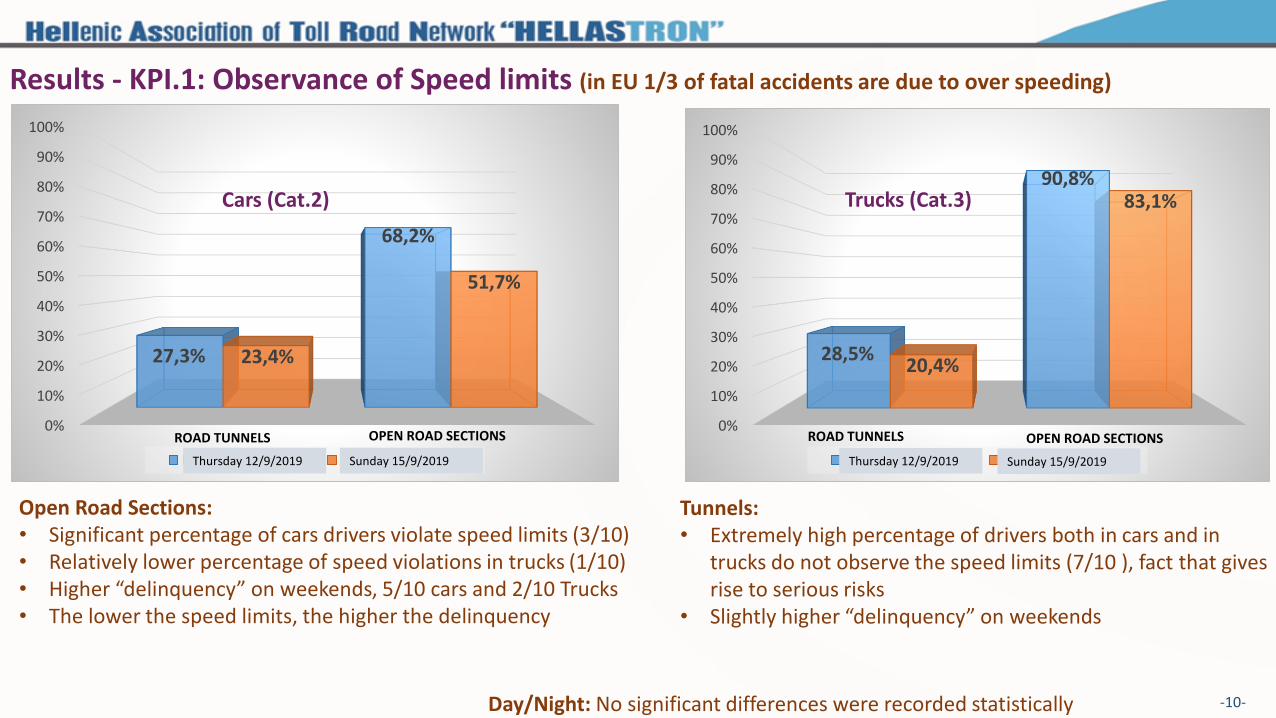
Results - KPI.1: Observance of Speed limits (in EU 1/3 of fatal accidents are due to over speeding)
0%
10%
20%
30%
40%
50%
60%
70%
80%
90%
100%
28,5%
90,8%
20,4%
83,1%
Πέμπτη 12/9/2019 Κυριακή 15/9/2019
ROAD TUNNELS OPEN ROAD SECTIONS
Thursday 12/9/2019 Sunday 15/9/2019
Cars (Cat.2) Trucks (Cat.3)
Open Road Sections:• Significant percentage of cars drivers violate speed limits (3/10)• Relatively lower percentage of speed violations in trucks (1/10)• Higher “delinquency” on weekends, 5/10 cars and 2/10 Trucks• The lower the speed limits, the higher the delinquency
Tunnels:• Extremely high percentage of drivers both in cars and in
trucks do not observe the speed limits (7/10 ), fact that gives rise to serious risks
• Slightly higher “delinquency” on weekends
Day/Night: No significant differences were recorded statistically
Thursday 12/9/2019

-11-
Results - KPI.1: Speed limits violation– cars (Cat.2)
15%
8%
4%2%
2%1%
17%
13%
8%
5%
3%
2%0%
5%
10%
15%
20%
25%
30%
35%
40%
45%
110% 120% 130% 140% 150% 160%+
Πέμπτη 12/9/2019 Κυριακή 15/9/2019Thursday 12/9/2019 Sunday 15/9/2019
Open road sections
17%
20%
16%
10%
6% 4%
18%
21%
17%
11%
6%
4%
0%
5%
10%
15%
20%
25%
30%
35%
40%
45%
110% 120% 130% 140% 150% 160%+
Πέμπτη 12/9/2019 Κυριακή 15/9/2019Thursday 12/9/2019 Sunday 15/9/2019
Tunnels
Tunnels:From 7/10 exceeding the speed limits, 6 exceed it at least by 20%
Open road sections:• Half of 3/10 violating the speed limits on weekdays, exceed it
at least by 20%• From 5/10 exceeding the limits on weekends, more than 3
exceed it at least by 20%
-12-
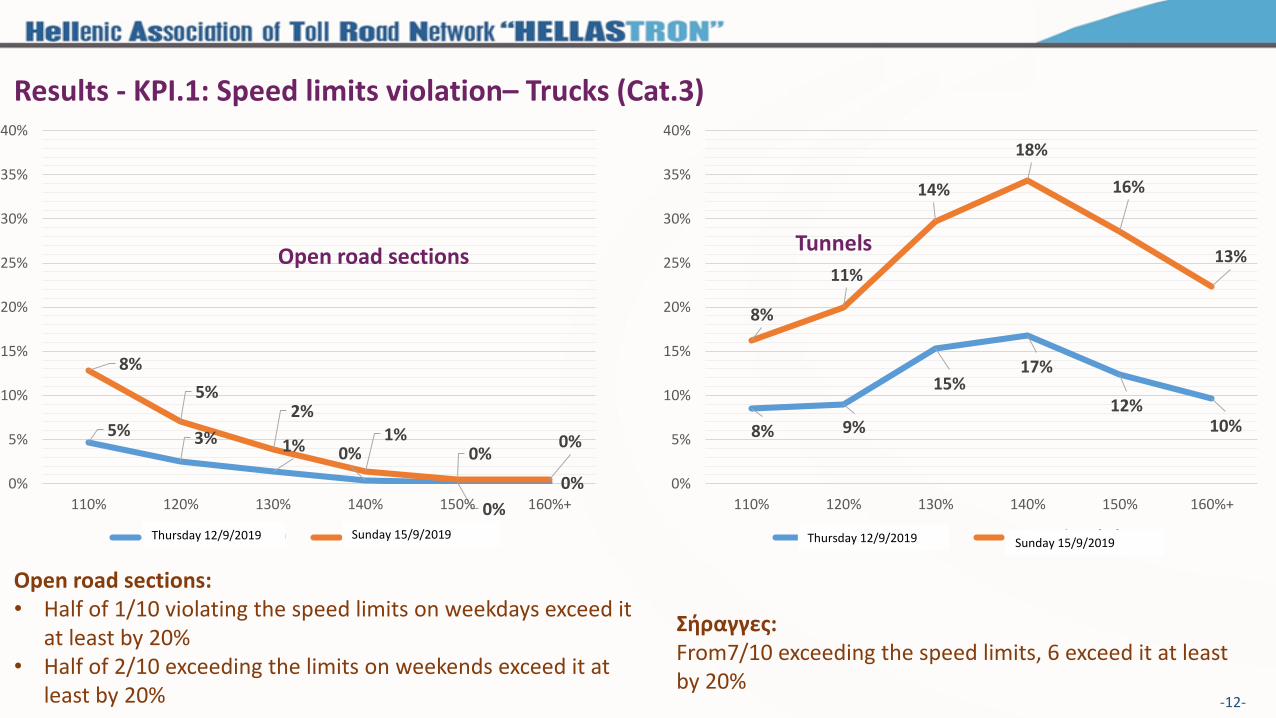
Results - KPI.1: Speed limits violation– Trucks (Cat.3)
5% 3% 1% 0%
0%
0%
8%
5%2%
1%0%
0%
0%
5%
10%
15%
20%
25%
30%
35%
40%
110% 120% 130% 140% 150% 160%+
Πέμπτη 12/9/2019 Κυριακή 15/9/2019Thursday 12/9/2019 Sunday 15/9/2019
Open road sections
8% 9%
15%17%
12%10%
8%
11%
14%
18%
16%
13%
0%
5%
10%
15%
20%
25%
30%
35%
40%
110% 120% 130% 140% 150% 160%+
Πέμπτη 12/9/2019 Κυριακή 15/9/2019Thursday 12/9/2019 Sunday 15/9/2019
Tunnels
Σήραγγες:From7/10 exceeding the speed limits, 6 exceed it at least by 20%
Open road sections:• Half of 1/10 violating the speed limits on weekdays exceed it
at least by 20%• Half of 2/10 exceeding the limits on weekends exceed it at
least by 20%

84,21%
81,63%
88,10%
86,44%
78%
80%
82%
84%
86%
88%
90%
Ποσοστό Οδηγών που φορούσαν Ζώνη Ασφάλειας Ποσοστό συνοδηγών που φορούσαν ζώνηΑσφάλειας
Πέμπτη 12/9/2019 Κυριακή 15/9/2019Thursday 12/9/2019 Sunday 15/9/2019
Percentage of drivers wearing a seat-belt Percentage of co- drivers wearing a seat-belt
Results - KPI.2: Use of Seat-belts and child safety seats

29,71%
48,03%
33,66%
49,03%
0%
10%
20%
30%
40%
50%
60%
Ποσοστό επιβατών πίσω καθισμάτων που φορούσαν ζώνη Ασφάλειας
Ποσοστό Παιδιών που κάθονταν σε ειδικά καθισματάκια
Πέμπτη 12/9/2019 Κυριακή 15/9/2019Thursday 12/9/2019 Sunday 15/9/2019
Percentage of kids sitting on child safety seat
Results - KPI.2: Use of Seat-belts and child safety seats
Percentage of back seat passengers wearing a seat-belt
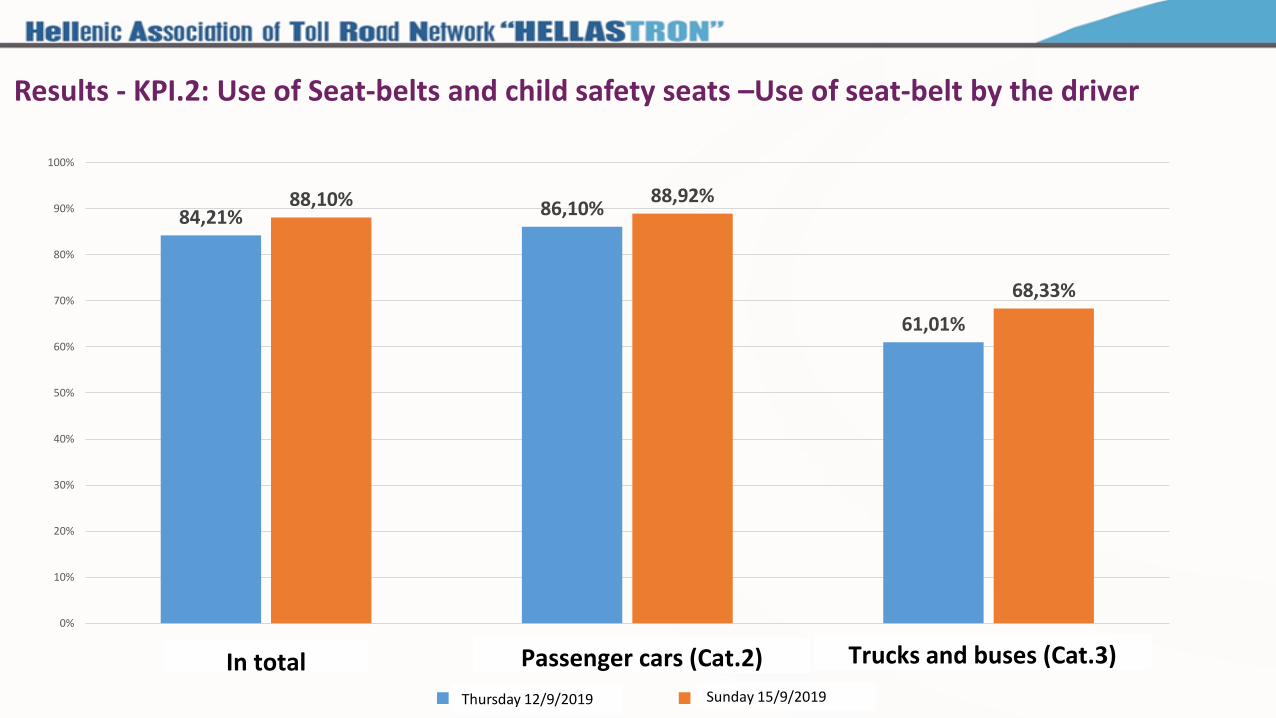
Results - KPI.2: Use of Seat-belts and child safety seats –Use of seat-belt by the driver
84,21% 86,10%
61,01%
88,10% 88,92%
68,33%
0%
10%
20%
30%
40%
50%
60%
70%
80%
90%
100%
Συνολικά Επιβατηγά Οχήματα (Κατ 2) Φορτηγά & Λεωφορεία (Κατ 3)
Πέμπτη 12/9/2019 Κυριακή 15/9/2019Thursday 12/9/2019 Sunday 15/9/2019
In total Passenger cars (Cat.2) Trucks and buses (Cat.3)
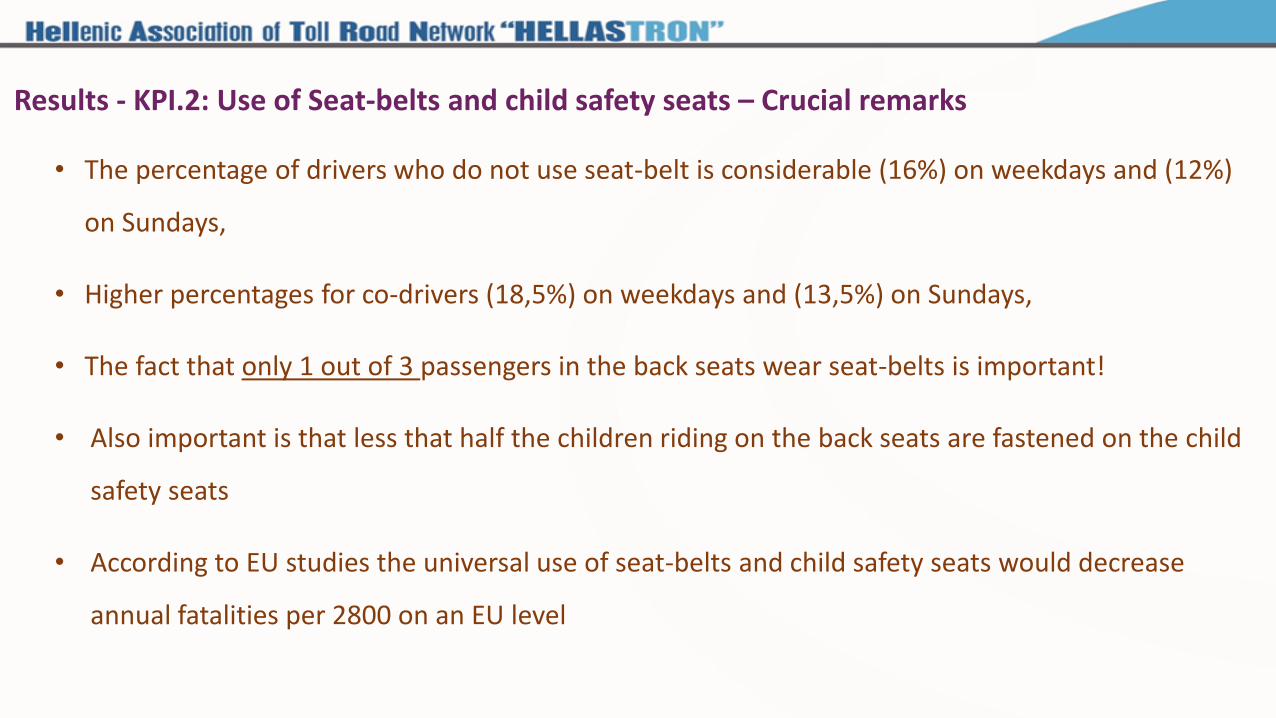
• The percentage of drivers who do not use seat-belt is considerable (16%) on weekdays and (12%)
on Sundays,
• Higher percentages for co-drivers (18,5%) on weekdays and (13,5%) on Sundays,
• The fact that only 1 out of 3 passengers in the back seats wear seat-belts is important!
• Also important is that less that half the children riding on the back seats are fastened on the child
safety seats
• According to EU studies the universal use of seat-belts and child safety seats would decrease
annual fatalities per 2800 on an EU level
Results - KPI.2: Use of Seat-belts and child safety seats – Crucial remarks
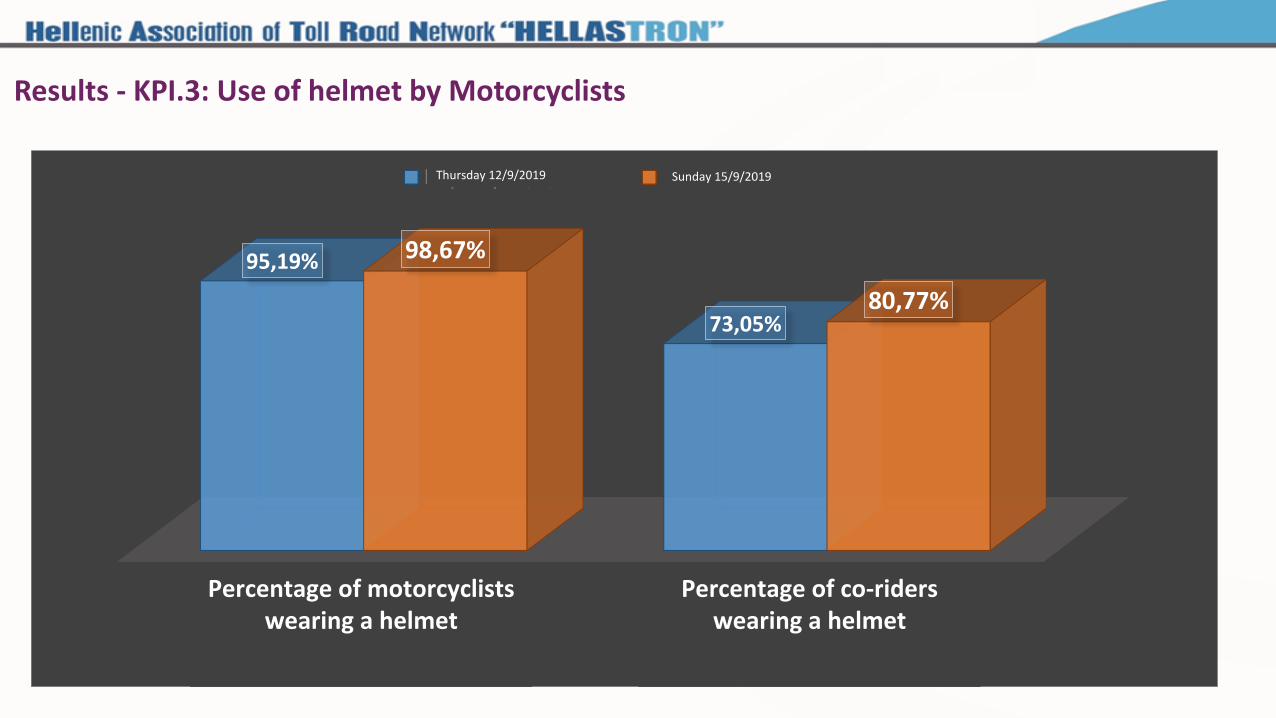
Results - KPI.3: Use of helmet by Motorcyclists
Ποσοστό Οδηγών που φορούσαν
Κράνος
Ποσοστό Συνοδηγών που φορούσαν
Κράνος
95,19%
73,05%
98,67%
80,77%
Πέμπτη 12/9/2019 Κυριακή 15/9/2019Thursday 12/9/2019 Sunday 15/9/2019
Percentage of motorcyclists wearing a helmet
Percentage of co-riders wearing a helmet
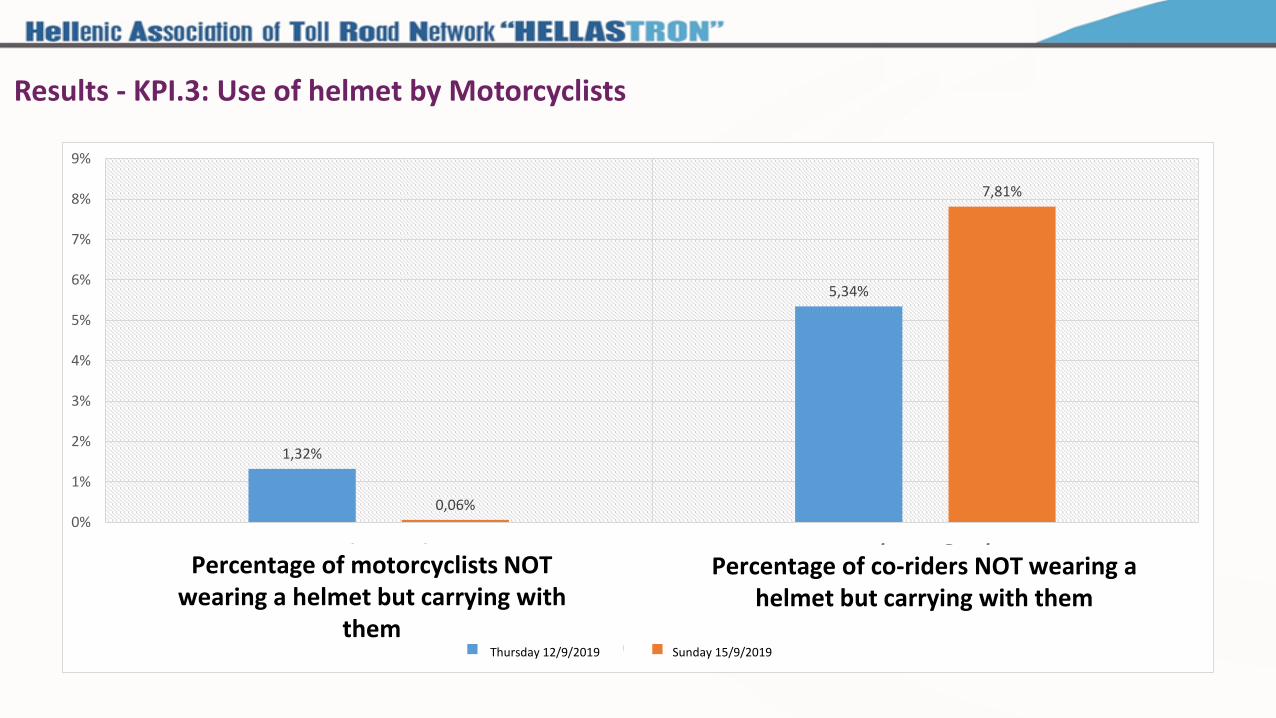
Results - KPI.3: Use of helmet by Motorcyclists
1,32%
5,34%
0,06%
7,81%
0%
1%
2%
3%
4%
5%
6%
7%
8%
9%
Ποσοστό Οδηγών που ΔΕΝ
φορούσαν Κράνος αλλά είχαν μαζί τους
Ποσοστό Συνοδηγών που ΔΕΝ
φορούσαν Κράνος αλλά είχαν μαζί τους
Πέμπτη 12/9/2019 Κυριακή 15/9/2019Thursday 12/9/2019 Sunday 15/9/2019
Percentage of motorcyclists NOT wearing a helmet but carrying with
them
Percentage of co-riders NOT wearing a helmet but carrying with them
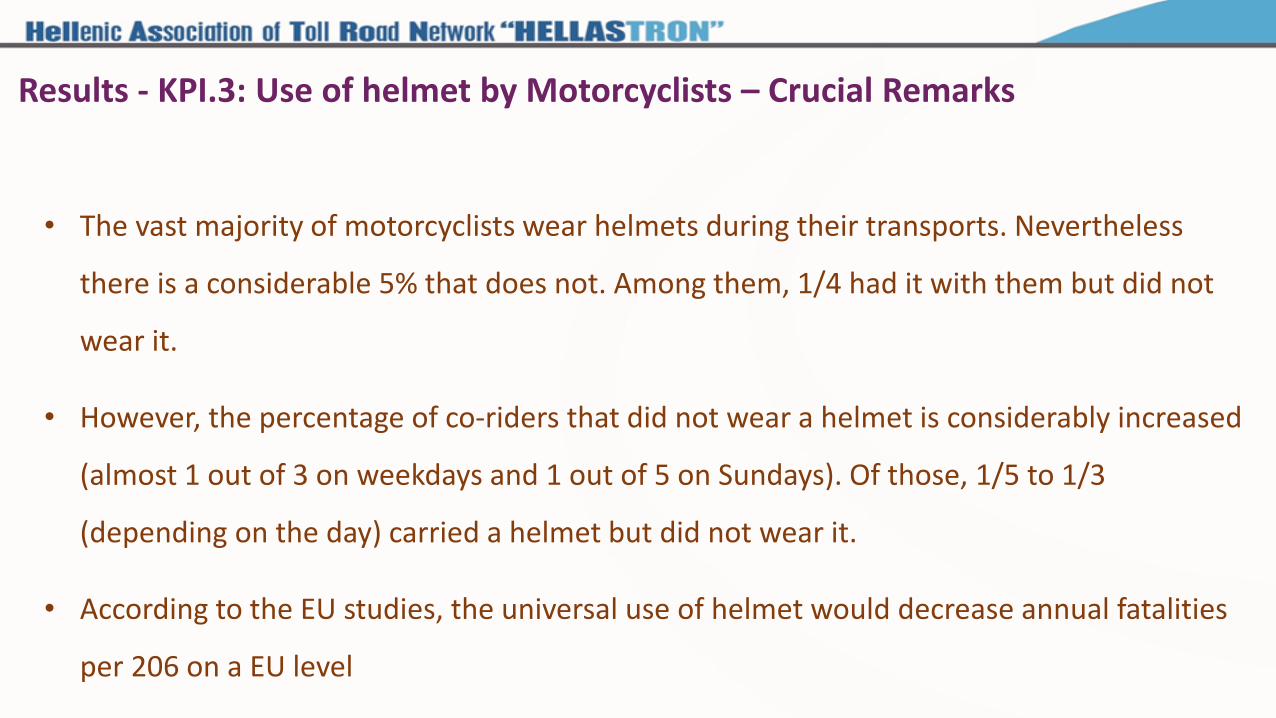
• The vast majority of motorcyclists wear helmets during their transports. Nevertheless
there is a considerable 5% that does not. Among them, 1/4 had it with them but did not
wear it.
• However, the percentage of co-riders that did not wear a helmet is considerably increased
(almost 1 out of 3 on weekdays and 1 out of 5 on Sundays). Of those, 1/5 to 1/3
(depending on the day) carried a helmet but did not wear it.
• According to the EU studies, the universal use of helmet would decrease annual fatalities
per 206 on a EU level
Results - KPI.3: Use of helmet by Motorcyclists – Crucial Remarks
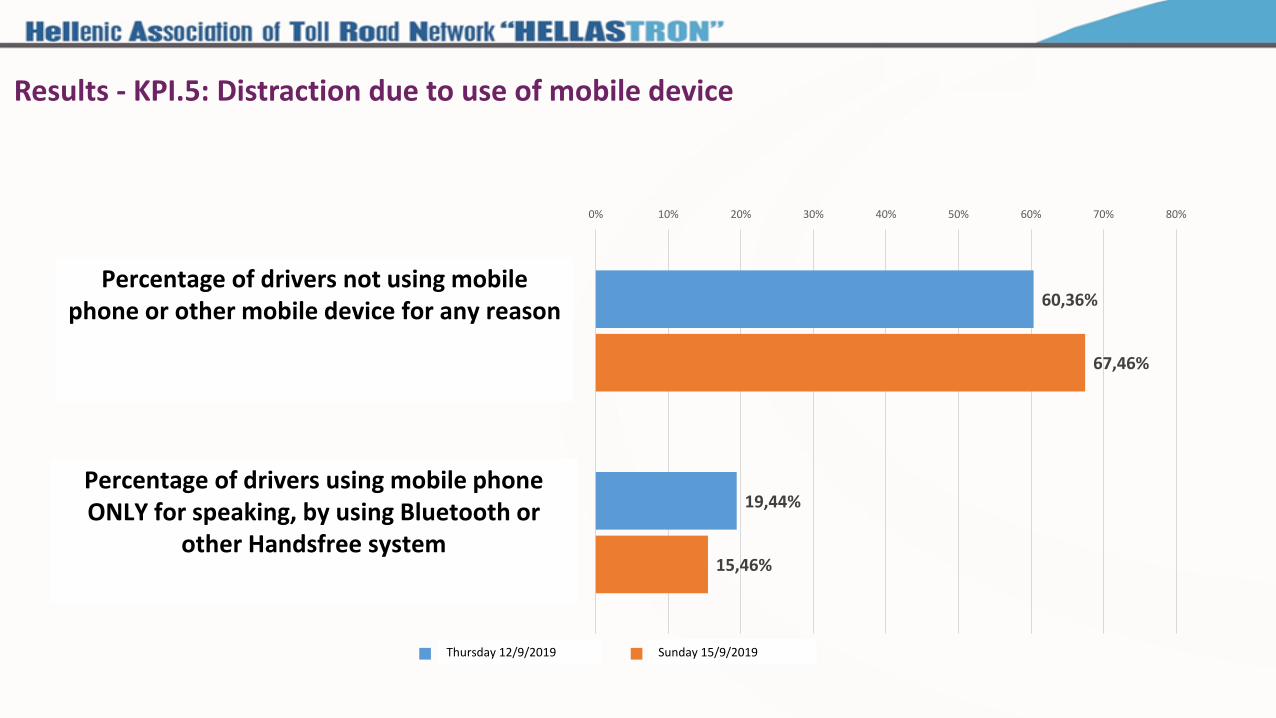
60,36%
19,44%
67,46%
15,46%
0% 10% 20% 30% 40% 50% 60% 70% 80%
Ποσοστό Οδηγών που δεν χρησιμοποίησαν Κινητό Τηλέφωνο ή Άλλη
Κινητή Συσκευή για κάποιο λόγο
Ποσοστό Οδηγών που χρησιμοποίησαν Κινητό Τηλέφωνο MONO για
Ομιλία, ΜΕ χρήση Bluetooth ή άλλουHandsFree συστήματος
Πέμπτη 12/9/2019 Κυριακή 15/9/2019Thursday 12/9/2019 Sunday 15/9/2019
Percentage of drivers not using mobile phone or other mobile device for any reason
Percentage of drivers using mobile phone ONLY for speaking, by using Bluetooth or
other Handsfree system
Results - KPI.5: Distraction due to use of mobile device
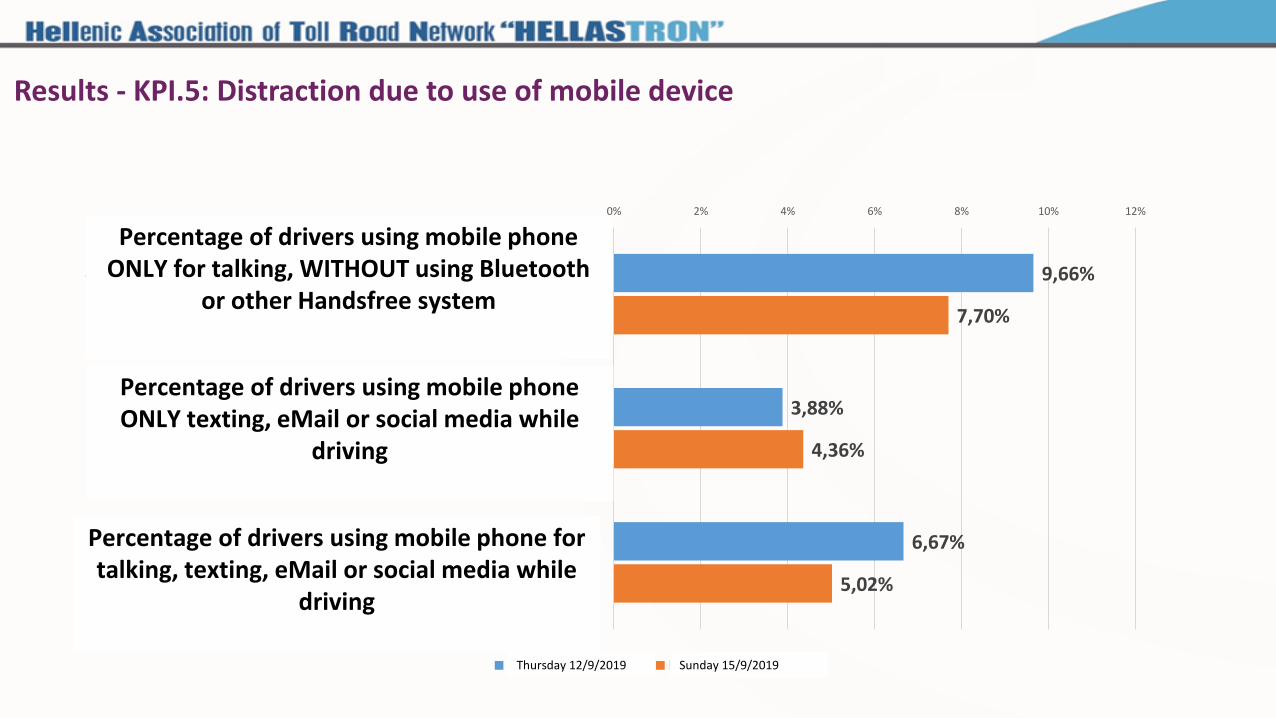
9,66%
3,88%
6,67%
7,70%
4,36%
5,02%
0% 2% 4% 6% 8% 10% 12%
Ποσοστό Οδηγών που χρησιμοποίησαν Κινητό Τηλέφωνο MONO για
Ομιλία, ΧΩΡΙΣ τη χρήση Bluetooth ή άλλουHandsFree συστήματος
Ποσοστό Οδηγών που Χρησιμοποίησαν το Κινητό MONO για SMS, eMail ή "Μέσα Κοινωνικής
Δικτύωσης" ενώ Οδηγούσαν
Ποσοστό Οδηγών που Χρησιμοποίησαν το Κινητό για Ομιλία και για SMS, eMail ή "Μέσα Κοινωνικής
Δικτύωσης" ενώ Οδηγούσαν
Πέμπτη 12/9/2019 Κυριακή 15/9/2019Thursday 12/9/2019 Sunday 15/9/2019
Percentage of drivers using mobile phone ONLY for talking, WITHOUT using Bluetooth
or other Handsfree system
Percentage of drivers using mobile phone ONLY texting, eMail or social media while
driving
Percentage of drivers using mobile phone for talking, texting, eMail or social media while
driving
Results - KPI.5: Distraction due to use of mobile device

Results - KPI.5: Distraction due to use of mobile device -Cars (Cat.2)
62%
19%
68%
15%
0% 10% 20% 30% 40% 50% 60% 70% 80%
Ποσοστό Οδηγών που δεν χρησιμοποίησαν Κινητό
Τηλέφωνο ή Άλλη Κινητή Συσκευή για κάποιο λόγο
Ποσοστό Οδηγών που χρησιμοποίησαν Κινητό Τηλέφωνο
MONO για Ομιλία, ΜΕ χρήση Bluetooth ή άλλου
HandsFree συστήματος
Passenger cars
Πέμπτη 12/9/2019 Κυριακή 15/9/2019Sunday 15/9/2019
Percentage of drivers not using mobile phone or other mobile
device for any reason
Percentage of drivers using mobile phone ONLY for speaking, by using
Bluetooth or other Handsfree system
41%
29%
48%
24%
0% 10% 20% 30% 40% 50% 60% 70% 80%
Trucks
Πέμπτη 12/9/2019 Κυριακή 15/9/2019Thursday 12/9/2019 Sunday 15/9/2019Thursday 12/9/2019
• The results are based on answers given by the drivers of the vehicles on relevant questions and not on researchers
observations
• 4/10 drivers use mobile phones or other mobile device while driving. Half of them (2/10) use them inappropriately
(without using Bluetooth/handsfree, texting…)
• Especially for trucks, 6/10 drivers use mobile phone or other mobile device while driving and half of them (3/10)
inappropriately.
• According to EU studies the use of mobile devices increases the risk of accident from 6 to 12 times and is responsible for
10-30% of collisions.
• It should be born in mind that when we are travelling at 100 km per hour and turn our attention to our phone to see who
is calling, we will cover about 100 meters without looking at the road.
• In addition, more that 5% Επίσης περισσότερο από 5% stated that used their mobile phones for texting or social media,
thus impairing their perception by 50% at that moment.
Results - KPI.5: Distraction due to use of mobile device- Crucial Remarks

Results - KPI 8. Care of injured person upon a road accident
18,6
19,02
18,0917,56
16,5
17
17,5
18
18,5
19
19,5
2015 2016 2017 2018
Min
ute
s
Average time of Ambulance arrival in case of accident with injuries(within minutes):

• The time lag between the moment of the accident until the paramedics arrival is decreased over
the years. However, the first 10 minutes of the injury define at large its evolution.
• According to EU studies it is estimated that if the paramedics arrival time falls from 25 to 15
minutes, the victims could decrease per 30%
• For this indicator to be essential, a doctor or other specialized personnel should be present in the
ambulance for the provision of primary health care to the injured person.
Results - KPI 8. Care of injured person after a road accident- Crucial remarks

Conclusion
• The experience and pilot study presented, points out for one more time the need for continuous and systematic effort in all levels / parameters of the road safety. Not only in road infrastructure, but also with regard to the vehicles, the human factor and of course the immediate intervention in the undesirable case of accident.
• The above results from the HELLASTRON network can be used for improving road safety through prioritized and focused actions of information, raising awareness and Policing
• Similar measurements could be applied to the entire National Road Network
• HELLASTRON can offer its experience for supporting common actions with the competent Services.

Thank you !
Kostas Papandreou - HELLASTRONChief Executive Officer: Olympia Odos Operation S.A.Head of: permanent Committee COPER I, HELLASTRON
Charalambos MalimoglouChief Operation Officer: InVision Consulting S.A.
Technical Consultant: HELLASTRON