Key messages of today - files.shareholder.comfiles.shareholder.com/downloads/ABEA-4ZFRFB/... ·...
162
Transcript of Key messages of today - files.shareholder.comfiles.shareholder.com/downloads/ABEA-4ZFRFB/... ·...
2
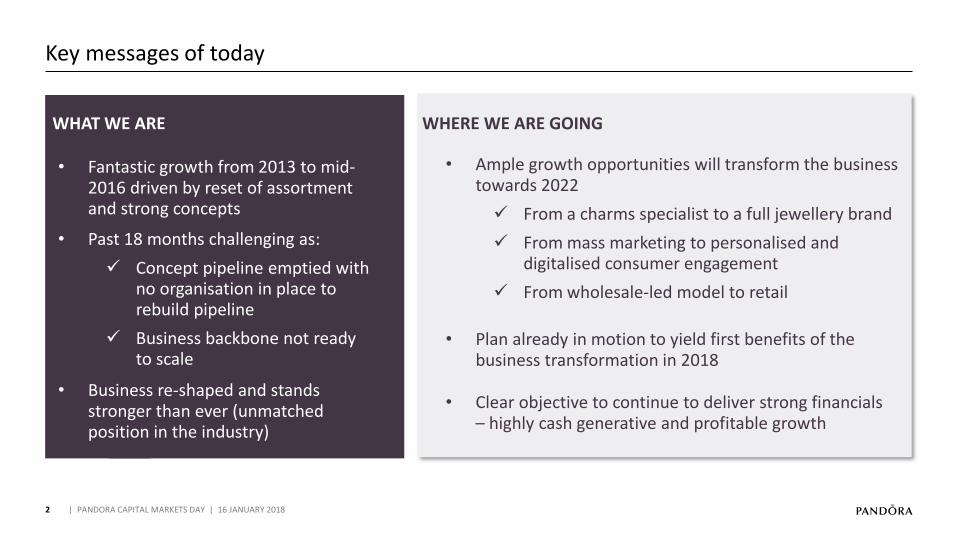
Key messages of today
| PANDORA CAPITAL MARKETS DAY | 16 JANUARY 2018
WHAT WE ARE WHERE WE ARE GOING
• Fantastic growth from 2013 to mid-2016 driven by reset of assortment and strong concepts
• Business re-shaped and stands stronger than ever (unmatched position in the industry)
• Ample growth opportunities will transform the business towards 2022
✓ From a charms specialist to a full jewellery brand
✓ From mass marketing to personalised and digitalised consumer engagement
✓ From wholesale-led model to retail
• Past 18 months challenging as:
✓ Concept pipeline emptied with no organisation in place to rebuild pipeline
✓ Business backbone not ready to scale
• Clear objective to continue to deliver strong financials – highly cash generative and profitable growth
• Plan already in motion to yield first benefits of the business transformation in 2018

3
The PANDORA investment case towards 2022
| PANDORA CAPITAL MARKETS DAY | 16 JANUARY 2018
A UNIQUE INTEGRATED BUSINESS MODEL DELIVERING STRONG FINANCIALS
5X
LARGE AND PROFITABLE DISTRIBUTION
NETWORK
LEADING POSITION IN BRANDED
MANUFACTURING
AFFORDABLE JEWELLERY LEADER
WORLD´S MOST RECOGNISED
JEWELLERY BRAND
SUSTAINABLE GROWTH
~7-10%
STRONG MARGINS
~35%
ASSET LIGHT
~5% CAPEX
CASH GENERATIVE
High pay-out
EBITDA margin
Revenue growth(local currency)
4
Introduction of today’s presenters
| PANDORA CAPITAL MARKETS DAY | 16 JANUARY 2018
ANDERS COLDING FRIIS
President & CEO
STEPHEN FAIRCHILD
SVP & Chief Creative Officer
PETER VEKSLUND
EVP & CFO
THOMAS TOUBORG
SVP, Group Operations
PEDER TUBORGH
Chairman of the Board
MINNA PHILIPSON
SVP & Chief Marketing Officer
DAVID ALLEN
President, EMEA
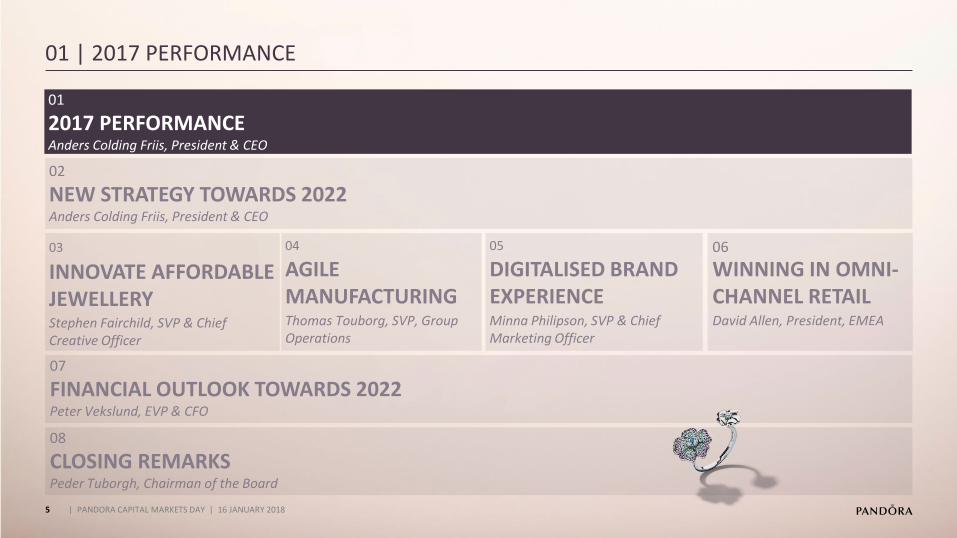
01
2017 PERFORMANCEAnders Colding Friis, President & CEO
02
NEW STRATEGY TOWARDS 2022Anders Colding Friis, President & CEO
07
FINANCIAL OUTLOOK TOWARDS 2022Peter Vekslund, EVP & CFO
06
WINNING IN OMNI-CHANNEL RETAILDavid Allen, President, EMEA
05
Minna Philipson, SVP & Chief Marketing Officer
DIGITALISED BRAND EXPERIENCE
03
Stephen Fairchild, SVP & Chief Creative Officer
INNOVATE AFFORDABLE JEWELLERY
5
01 | 2017 PERFORMANCE
| PANDORA CAPITAL MARKETS DAY | 16 JANUARY 2018
04
Thomas Touborg, SVP, Group Operations
AGILE MANUFACTURING
08
CLOSING REMARKSPeder Tuborgh, Chairman of the Board
6
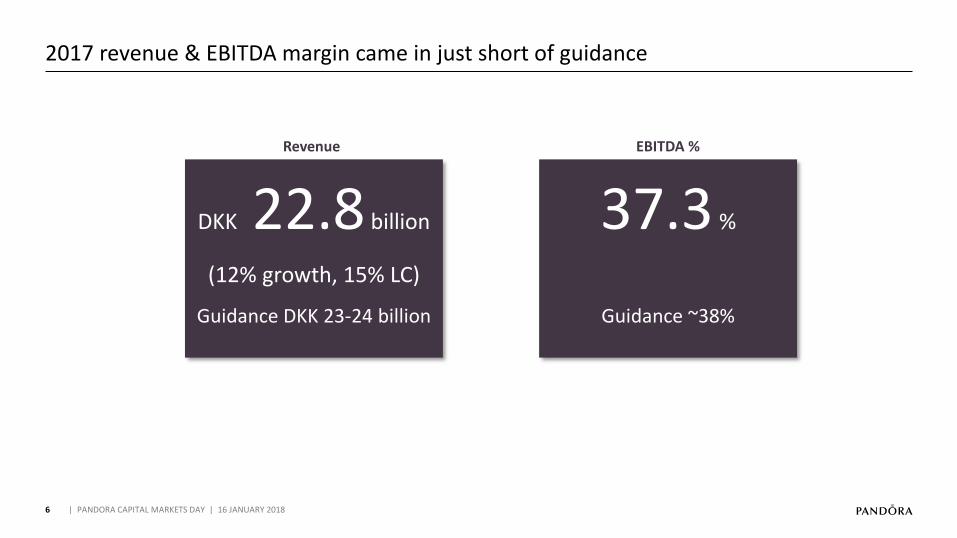
2017 revenue & EBITDA margin came in just short of guidance
DKK 22.8 billion
(12% growth, 15% LC)
Guidance DKK 23-24 billion
37.3 %
Guidance ~38%
Revenue EBITDA %
| PANDORA CAPITAL MARKETS DAY | 16 JANUARY 2018
7
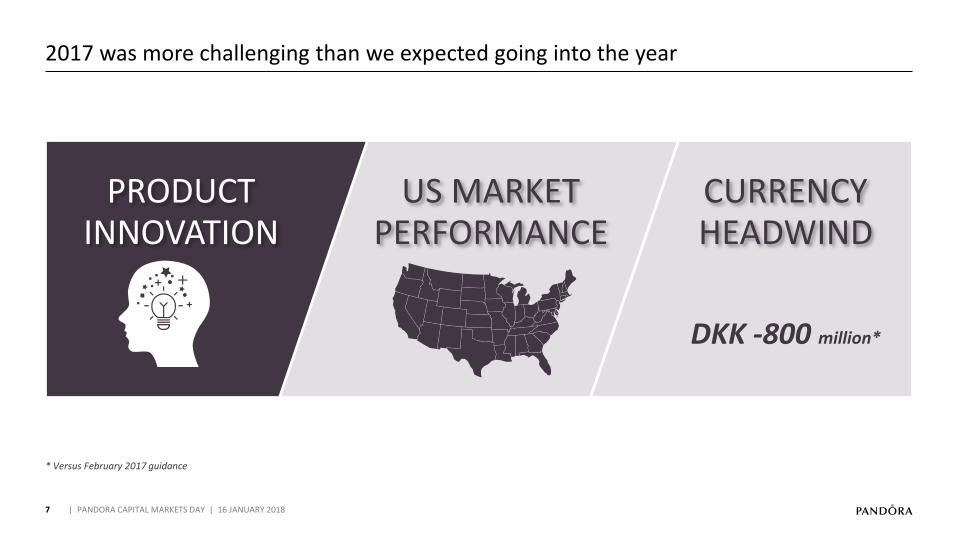
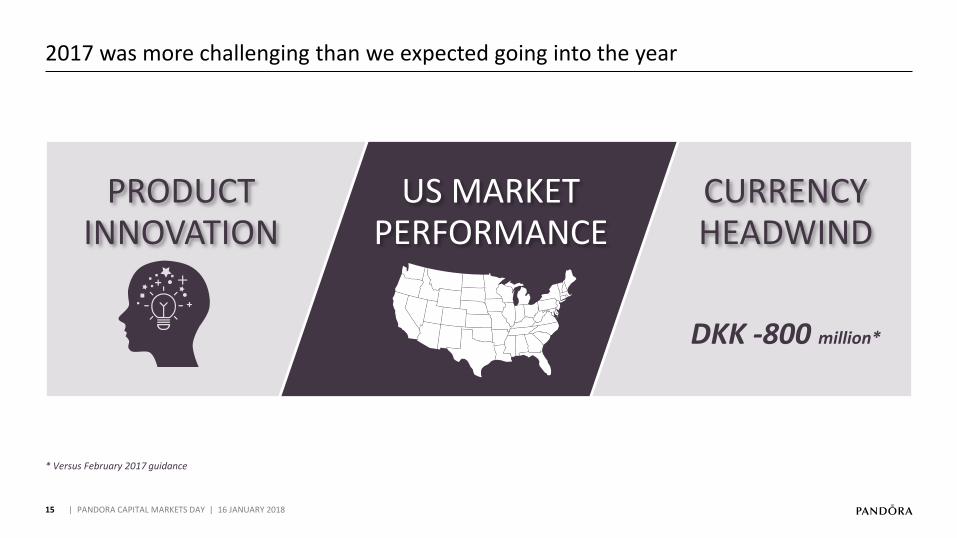
2017 was more challenging than we expected going into the year
| PANDORA CAPITAL MARKETS DAY | 16 JANUARY 2018
* Versus February 2017 guidance
PRODUCT INNOVATION
US MARKET PERFORMANCE
DKK -800 million*
CURRENCY HEADWIND
8
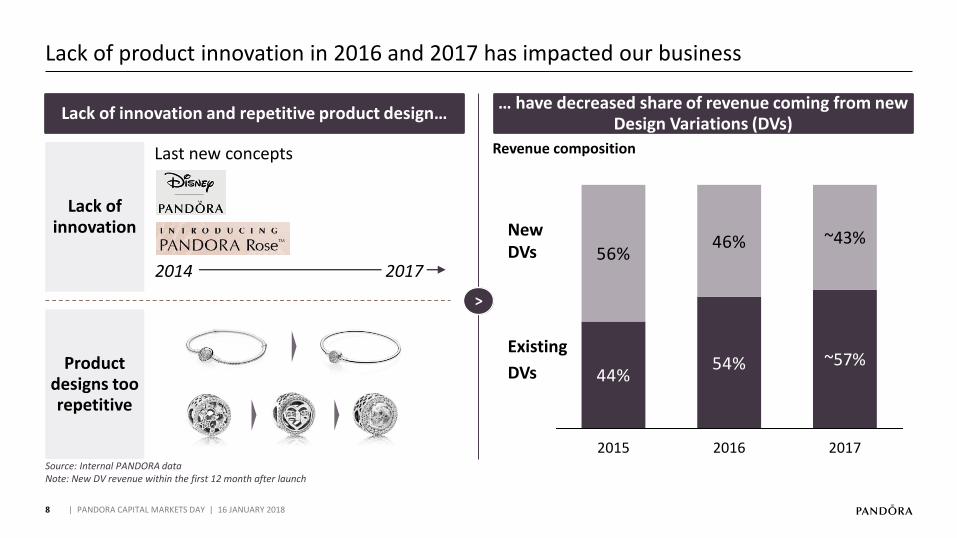
Lack of product innovation in 2016 and 2017 has impacted our business
| PANDORA CAPITAL MARKETS DAY | 16 JANUARY 2018
>
Lack of innovation and repetitive product design…… have decreased share of revenue coming from new
Design Variations (DVs)
44%54%
56%46%
2016
~57%
~43%
20172015
New DVs
Existing
DVs
Revenue composition
Product designs too repetitive
Source: Internal PANDORA dataNote: New DV revenue within the first 12 month after launch
Lack of innovation
Last new concepts
2014 2017
9
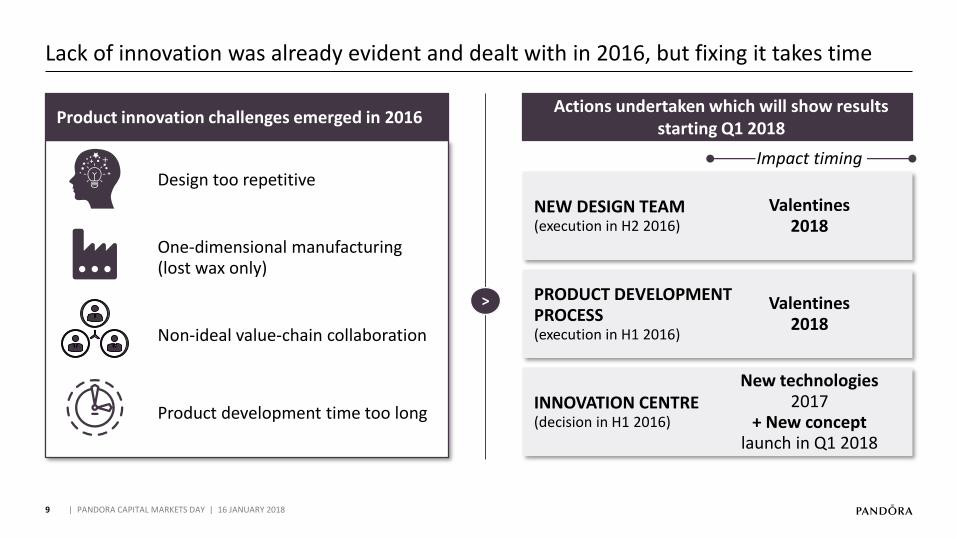
Lack of innovation was already evident and dealt with in 2016, but fixing it takes time
| PANDORA CAPITAL MARKETS DAY | 16 JANUARY 2018
Product innovation challenges emerged in 2016
Design too repetitive
One-dimensional manufacturing (lost wax only)
Product development time too long
Non-ideal value-chain collaboration
>
Actions undertaken which will show results starting Q1 2018
NEW DESIGN TEAM(execution in H2 2016)
PRODUCT DEVELOPMENT PROCESS(execution in H1 2016)
INNOVATION CENTRE (decision in H1 2016)
Impact timing
Valentines 2018
Valentines 2018
New technologies 2017
+ New concept launch in Q1 2018

10
We fast-tracked innovative products and launched Disney in EMEA in 2017
| PANDORA CAPITAL MARKETS DAY | 16 JANUARY 2018
#1 in Summer collection in the UK
… and successful Disney launch in EMEA in Q4 2017Good performance from fast-tracked products…
Open bracelets
Meshbracelet
#1 bestseller in Autumn collection in EMEA
New charms
Source: PANDORA data
11
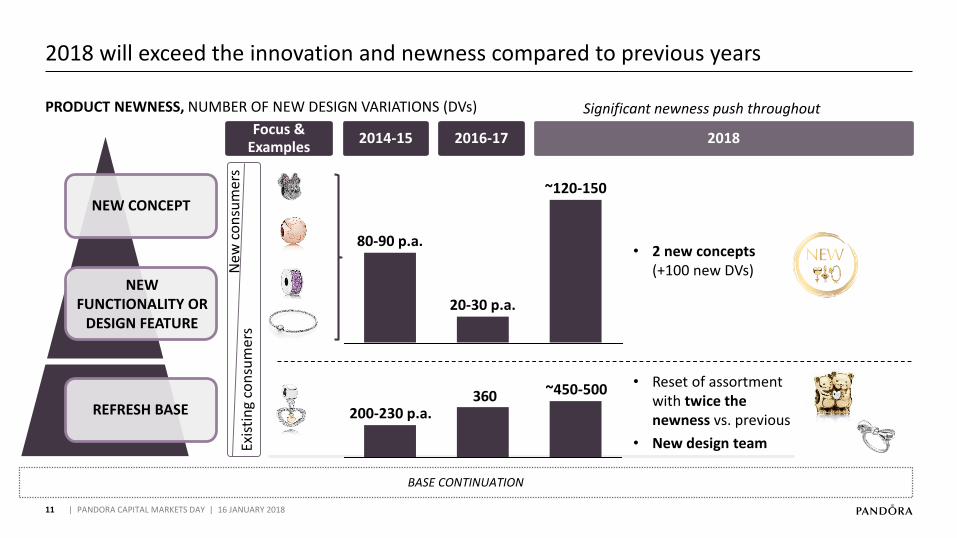
2018 will exceed the innovation and newness compared to previous years
| PANDORA CAPITAL MARKETS DAY | 16 JANUARY 2018
BASE CONTINUATION
NEW CONCEPT
NEW FUNCTIONALITY OR
DESIGN FEATURE
REFRESH BASE
2014-15 2016-17
PRODUCT NEWNESS, NUMBER OF NEW DESIGN VARIATIONS (DVs)
2018
20-30 p.a.
~120-150
80-90 p.a.
360 ~450-500
200-230 p.a.
Significant newness push throughout
• 2 new concepts (+100 new DVs)
• Reset of assortment with twice thenewness vs. previous
• New design team
Focus & Examples
Pic Sell-out % Pic Sell-out % Pic Sell-out % Pic Sell-out % Pic Sell-out %
1 17,6% 14,1% 14,4% 15,6% 18,4%
2 16,4% 13,7% 14,4% 11,2% 11,9%
3 16,3% 11,7% 10,6% 10,0% 9,6%
4 9,8% 10,8% 9,0% 9,0% 9,1%
5 9,5% 8,8% 8,2% 8,7% 8,9%
6 8,8% 7,9% 7,5% 8,7% 7,0%
7 8,5% 6,9% 6,3% 8,4% 6,7%
8 5,8% 5,9% 5,4% 8,2% 6,5%
9 4,4% 5,8% 5,1% 7,5% 4,8%
10 3,0% 5,3% 5,1% 3,8% 4,8%
Valentine's 2017Valentine's 2016Valentine's 2015Valentine's 2014Valentine's 2013
727 N/A
10
926 +37% 1208 -13% 1506 -7% 1462 -8%
13 171314
New
co
nsu
mer
sEx
isti
ng
con
sum
ers
SPRINGPRODUCT EXAMPLES
12
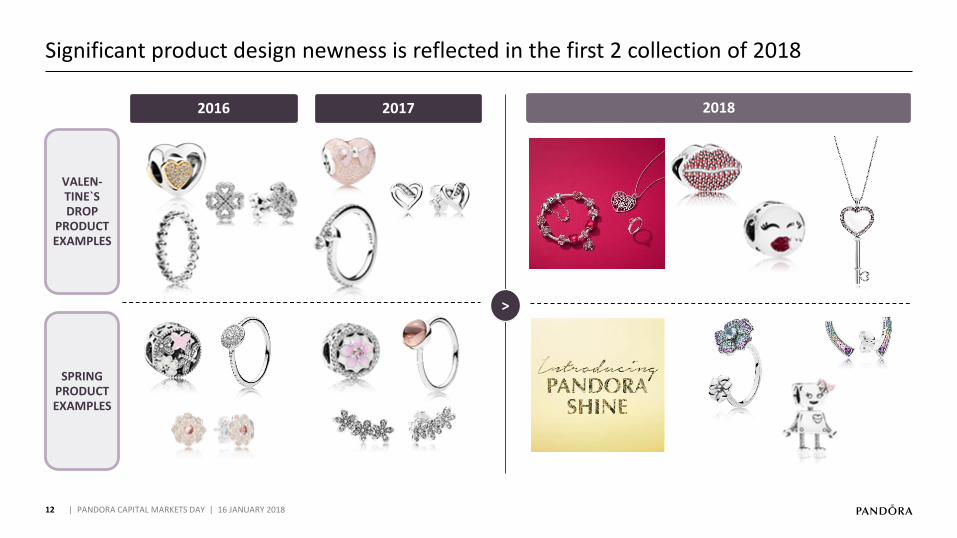
Significant product design newness is reflected in the first 2 collection of 2018
| PANDORA CAPITAL MARKETS DAY | 16 JANUARY 2018
>
VALEN-TINE`S DROP
PRODUCT EXAMPLES
20182016 2017

13 | PANDORA CAPITAL MARKETS DAY | 16 JANUARY 2018
14
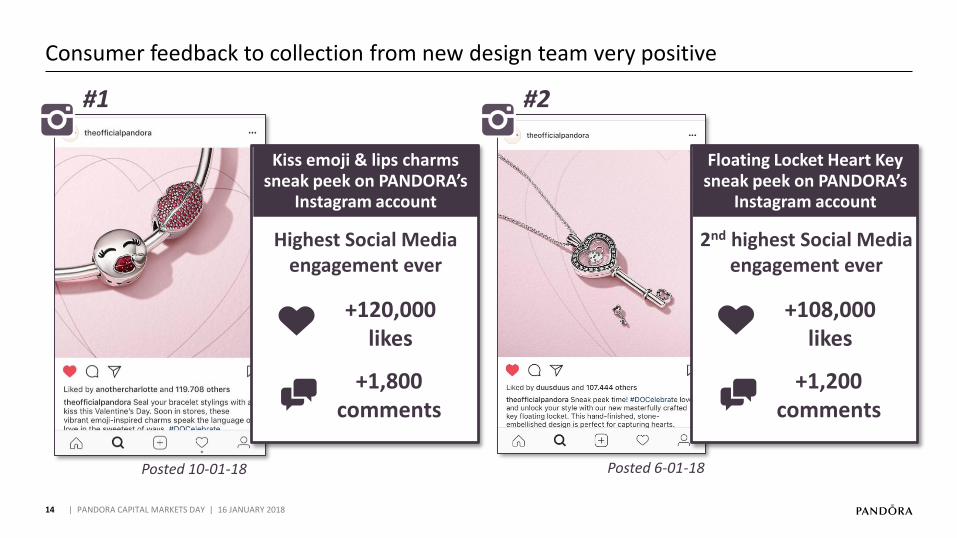
Consumer feedback to collection from new design team very positive
| PANDORA CAPITAL MARKETS DAY | 16 JANUARY 2018
#1
Posted 6-01-18
Highest Social Media engagement ever
Kiss emoji & lips charms sneak peek on PANDORA’s
Instagram account
+1,800 comments
+120,000 likes
Posted 10-01-18
#2
2nd highest Social Media engagement ever
Floating Locket Heart Key sneak peek on PANDORA’s
Instagram account
+1,200 comments
+108,000 likes
15
2017 was more challenging than we expected going into the year
| PANDORA CAPITAL MARKETS DAY | 16 JANUARY 2018
* Versus February 2017 guidance
PRODUCT INNOVATION
US MARKET PERFORMANCE
CURRENCY HEADWIND
DKK -800 million*
16
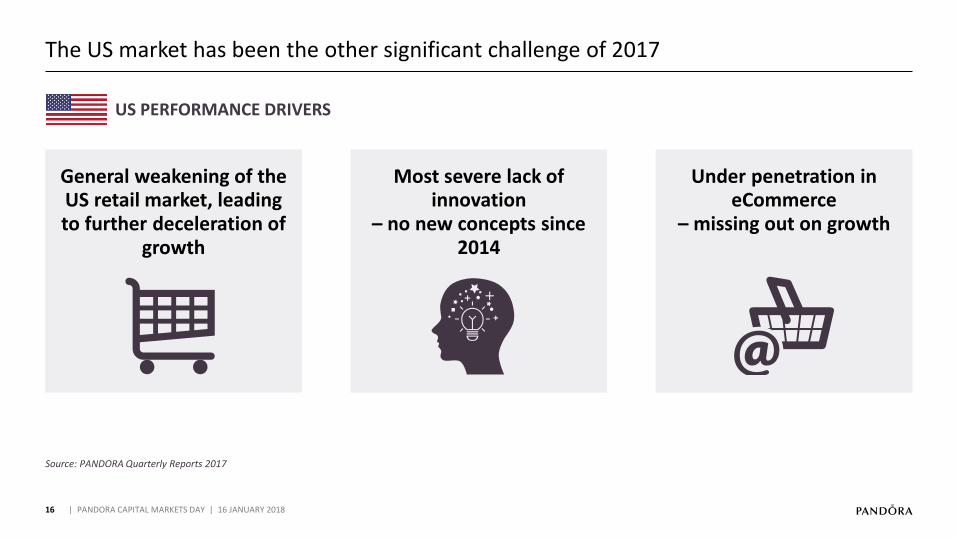
The US market has been the other significant challenge of 2017
| PANDORA CAPITAL MARKETS DAY | 16 JANUARY 2018
Source: PANDORA Quarterly Reports 2017
US PERFORMANCE DRIVERS
General weakening of the US retail market, leading to further deceleration of
growth
Most severe lack of innovation
– no new concepts since 2014
Under penetration in eCommerce
– missing out on growth
17
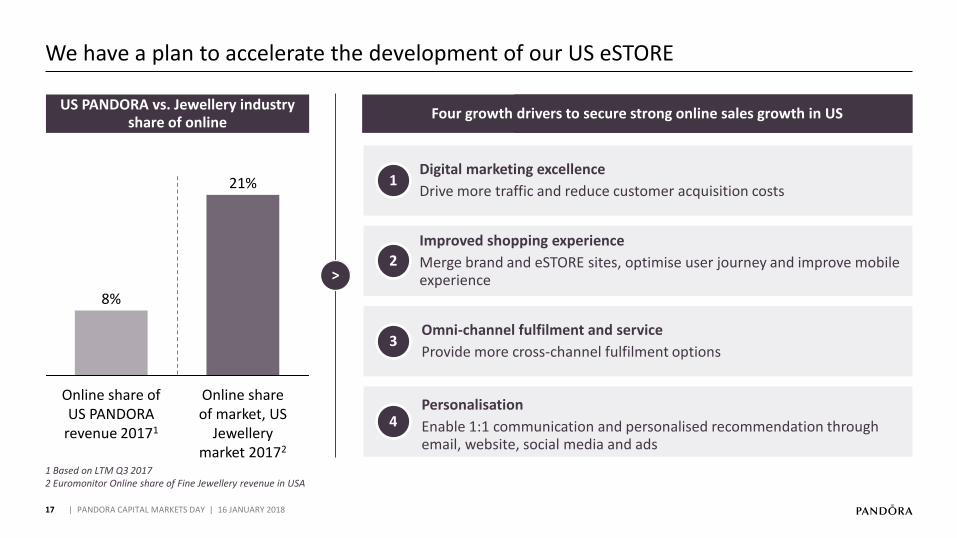
We have a plan to accelerate the development of our US eSTORE
| PANDORA CAPITAL MARKETS DAY | 16 JANUARY 2018
US PANDORA vs. Jewellery industry share of online
>
Four areas to secure strong eSTORE growth
Online share of market, US
Jewellery market 20172
21%
Online share of US PANDORA
revenue 20171
8%
Four growth drivers to secure strong online sales growth in US
1Digital marketing excellence
Drive more traffic and reduce customer acquisition costs
2
Improved shopping experience
Merge brand and eSTORE sites, optimise user journey and improve mobile experience
3Omni-channel fulfilment and service
Provide more cross-channel fulfilment options
4Personalisation
Enable 1:1 communication and personalised recommendation through email, website, social media and ads
1 Based on LTM Q3 20172 Euromonitor Online share of Fine Jewellery revenue in USA
18
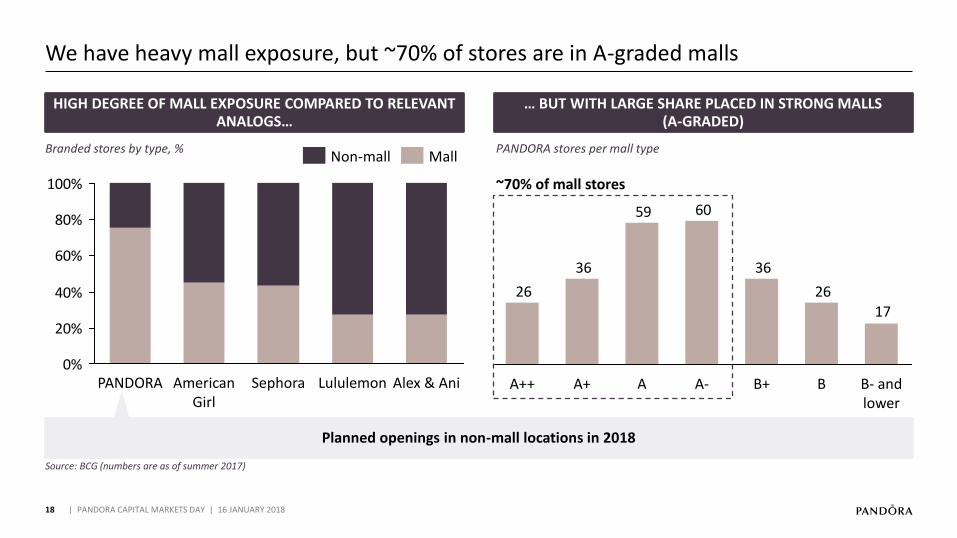
We have heavy mall exposure, but ~70% of stores are in A-graded malls
| PANDORA CAPITAL MARKETS DAY | 16 JANUARY 2018
HIGH DEGREE OF MALL EXPOSURE COMPARED TO RELEVANT ANALOGS…
… BUT WITH LARGE SHARE PLACED IN STRONG MALLS (A-GRADED)
Source: BCG (numbers are as of summer 2017)
0%
20%
40%
60%
80%
100%
PANDORA SephoraAmerican Girl
Alex & AniLululemon
Branded stores by type, %MallNon-mall
Planned openings in non-mall locations in 2018
17
26
36
6059
36
26
BAA+ A- B+ B- and lower
A++
PANDORA stores per mall type
~70% of mall stores
19
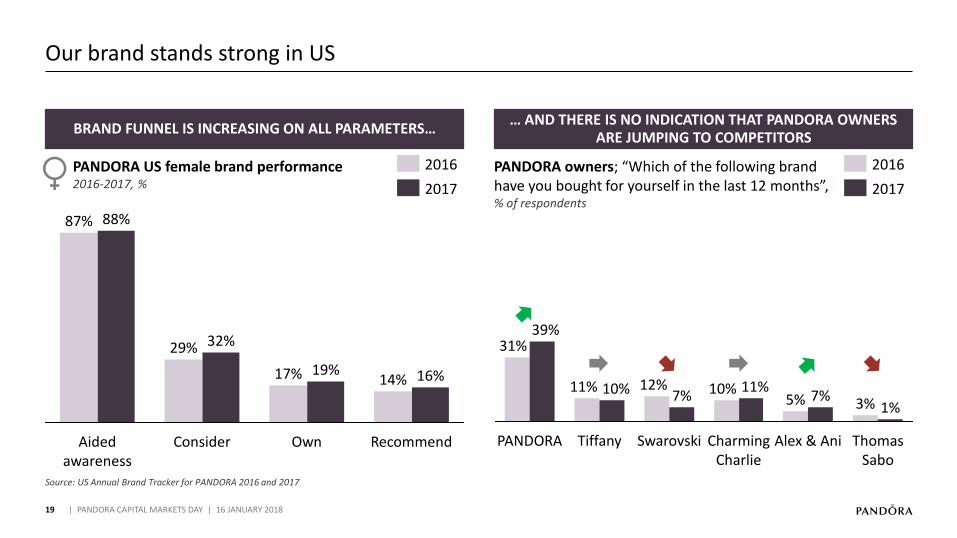
Source: US Annual Brand Tracker for PANDORA 2016 and 2017
Our brand stands strong in US
| PANDORA CAPITAL MARKETS DAY | 16 JANUARY 2018
BRAND FUNNEL IS INCREASING ON ALL PARAMETERS…
32%29%
Consider
14%
Recommend
16%
Aided awareness
88%87%
Own
19%17%
PANDORA US female brand performance2016-2017, %
2016
2017
… AND THERE IS NO INDICATION THAT PANDORA OWNERS ARE JUMPING TO COMPETITORS
PANDORA owners; “Which of the following brand have you bought for yourself in the last 12 months”, % of respondents
Thomas Sabo
7%12%
Swarovski
11%
Charming Charlie
10%10%
Tiffany Alex & Ani
7%11%
PANDORA
5%
39%31%
1%3%
2017
2016
01
2017 PERFORMANCEAnders Colding Friis, President & CEO
02
NEW STRATEGY TOWARDS 2022Anders Colding Friis, President & CEO
07
FINANCIAL OUTLOOK TOWARDS 2022Peter Vekslund, EVP & CFO
06
WINNING IN OMNI-CHANNEL RETAILDavid Allen, President, EMEA
05
Minna Philipson, SVP & Chief Marketing Officer
DIGITALISED BRAND EXPERIENCE
03
Stephen Fairchild, SVP & Chief Creative Officer
INNOVATE AFFORDABLE JEWELLERY
20
02 | NEW STRATEGY TOWARDS 2022
| PANDORA CAPITAL MARKETS DAY | 16 JANUARY 2018
04
Thomas Touborg, SVP, Group Operations
AGILE MANUFACTURING
08
CLOSING REMARKSPeder Tuborgh, Chairman of the Board
LEADING POSITION IN BRANDED MANUFACTURING
21
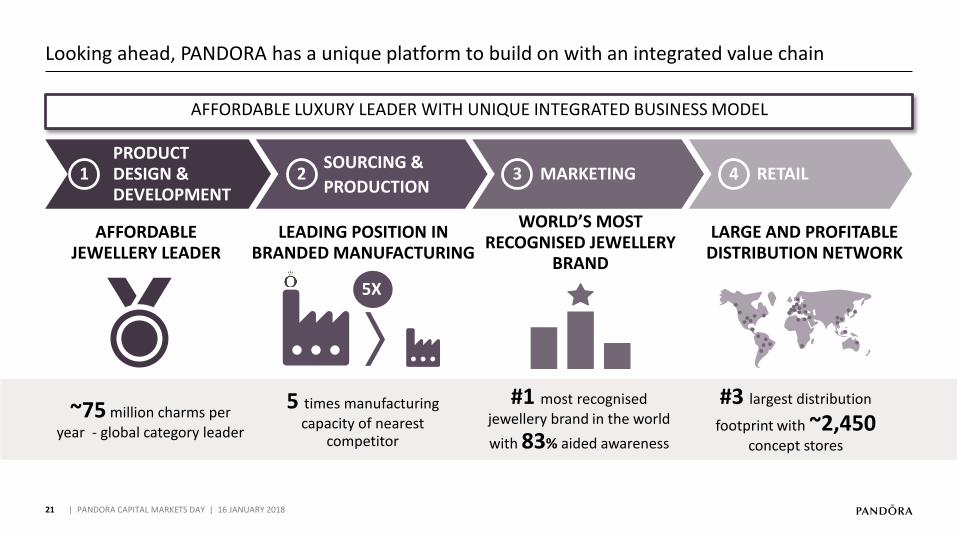
Looking ahead, PANDORA has a unique platform to build on with an integrated value chain
AFFORDABLE JEWELLERY LEADER
WORLD’S MOST RECOGNISED JEWELLERY
BRAND
LARGE AND PROFITABLE DISTRIBUTION NETWORK
PRODUCT DESIGN & DEVELOPMENT
SOURCING &
PRODUCTIONMARKETING RETAIL1 2 3 4
AFFORDABLE LUXURY LEADER WITH UNIQUE INTEGRATED BUSINESS MODEL
~75 million charms per year - global category leader
5 times manufacturing capacity of nearest
competitor
#1 most recognised
jewellery brand in the world
with 83% aided awareness
#3 largest distribution
footprint with ~2,450 concept stores
5X
| PANDORA CAPITAL MARKETS DAY | 16 JANUARY 2018
22
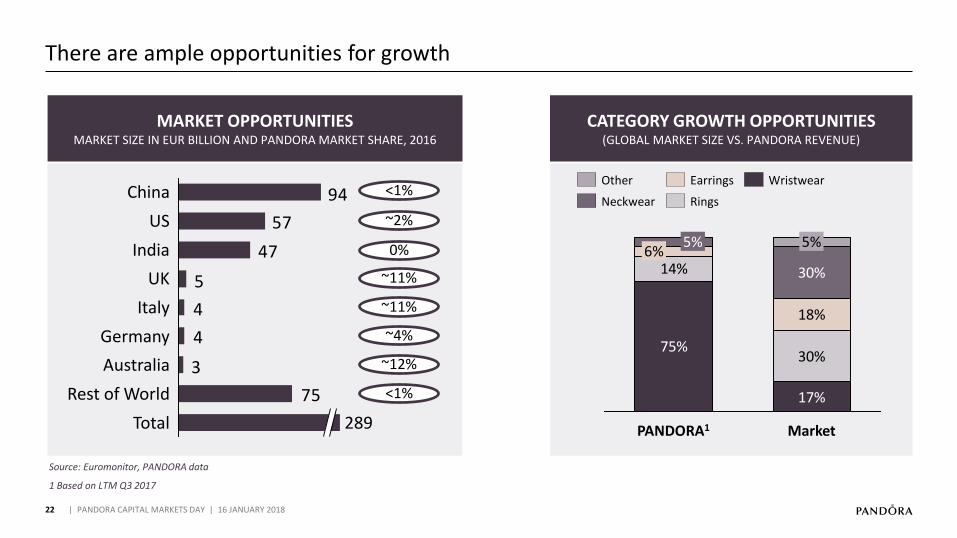
There are ample opportunities for growth
| PANDORA CAPITAL MARKETS DAY | 16 JANUARY 2018
MARKET OPPORTUNITIESMARKET SIZE IN EUR BILLION AND PANDORA MARKET SHARE, 2016
Source: Euromonitor, PANDORA data
75%
17%
14%
30%
18%
30%
6%5%5%
MarketPANDORA1
Other WristwearEarrings
Neckwear Rings
CATEGORY GROWTH OPPORTUNITIES(GLOBAL MARKET SIZE VS. PANDORA REVENUE)
47
57
94
75
3
4
4
5
Italy
China
Germany
US
UK
India
Total 289
Australia
Rest of World
<1%
~2%
0%
~11%
~11%
~4%
~12%
<1%
1 Based on LTM Q3 2017
23
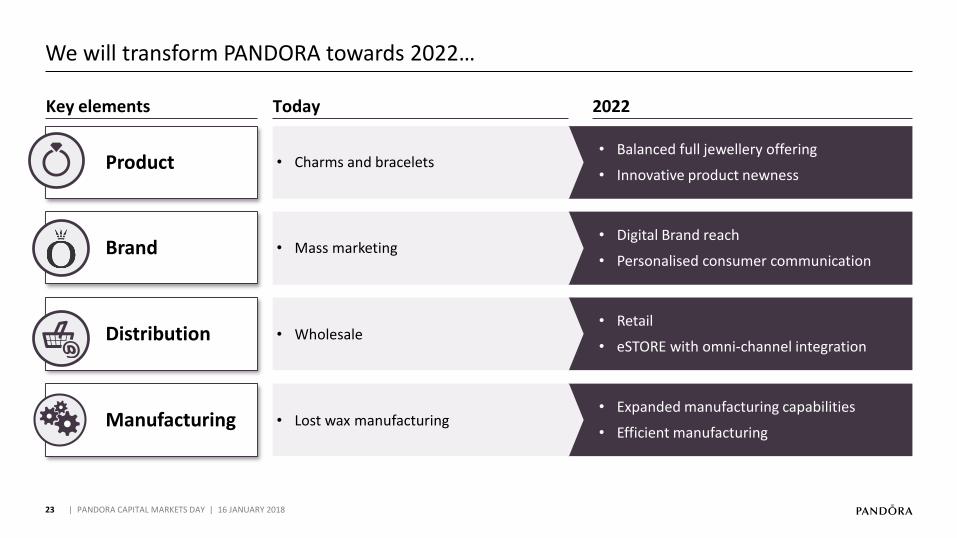
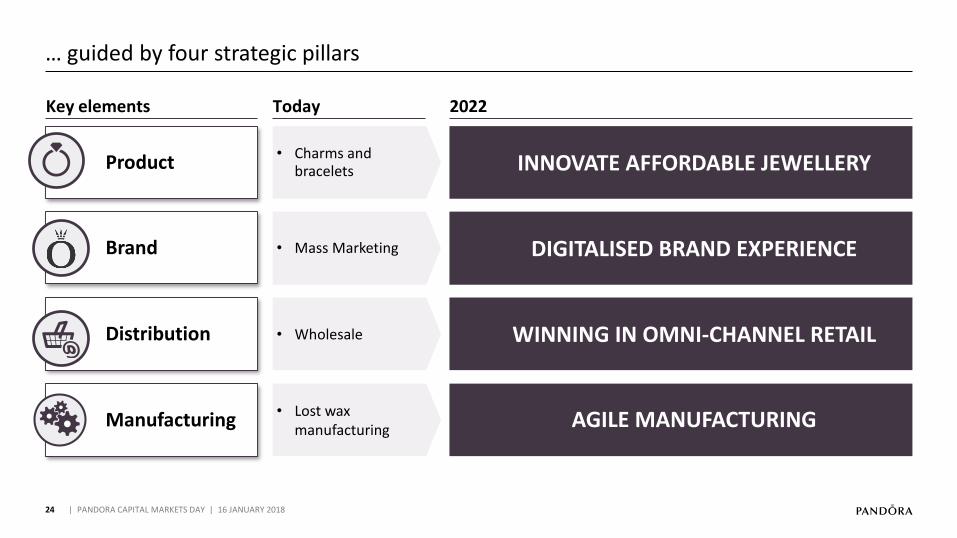
We will transform PANDORA towards 2022…
| PANDORA CAPITAL MARKETS DAY | 16 JANUARY 2018
• Balanced full jewellery offering
• Innovative product newness• Charms and bracelets
Manufacturing
Brand
Distribution
Product
Key elements Today 2022
• Digital Brand reach
• Personalised consumer communication• Mass marketing
Retail•
eSTORE with • omni-channel integration• Wholesale
• Expanded manufacturing capabilities
• Efficient manufacturing• Lost wax manufacturing
24
… guided by four strategic pillars
| PANDORA CAPITAL MARKETS DAY | 16 JANUARY 2018
INNOVATE AFFORDABLE JEWELLERYCharms and •bracelets
Manufacturing
Brand
Distribution
Product
Key elements Today 2022
DIGITALISED BRAND EXPERIENCE• Mass Marketing
WINNING IN OMNI-CHANNEL RETAIL• Wholesale
AGILE MANUFACTURING• Lost wax manufacturing
25
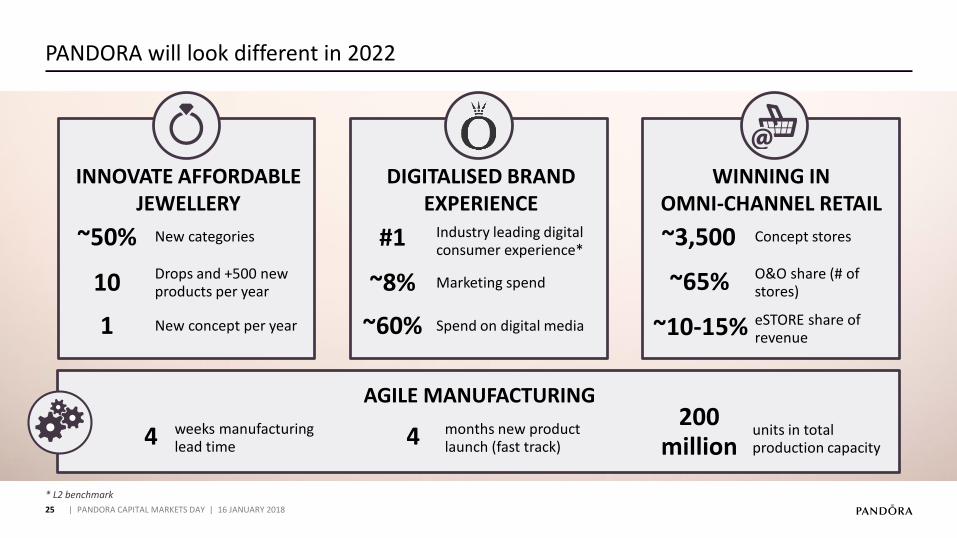
PANDORA will look different in 2022
New categories~50%
Drops and +500 new products per year10
New concept per year1
Industry leading digital consumer experience*
#1
Marketing spend~8%
Spend on digital media~60%
Concept stores~3,500
O&O share (# of stores)~65%
eSTORE share of revenue~10-15%
WINNING IN OMNI-CHANNEL RETAIL
DIGITALISED BRAND EXPERIENCE
INNOVATE AFFORDABLE JEWELLERY
AGILE MANUFACTURING
weeks manufacturing lead time4 months new product
launch (fast track)4 units in total production capacity
200 million
* L2 benchmark
| PANDORA CAPITAL MARKETS DAY | 16 JANUARY 2018
26
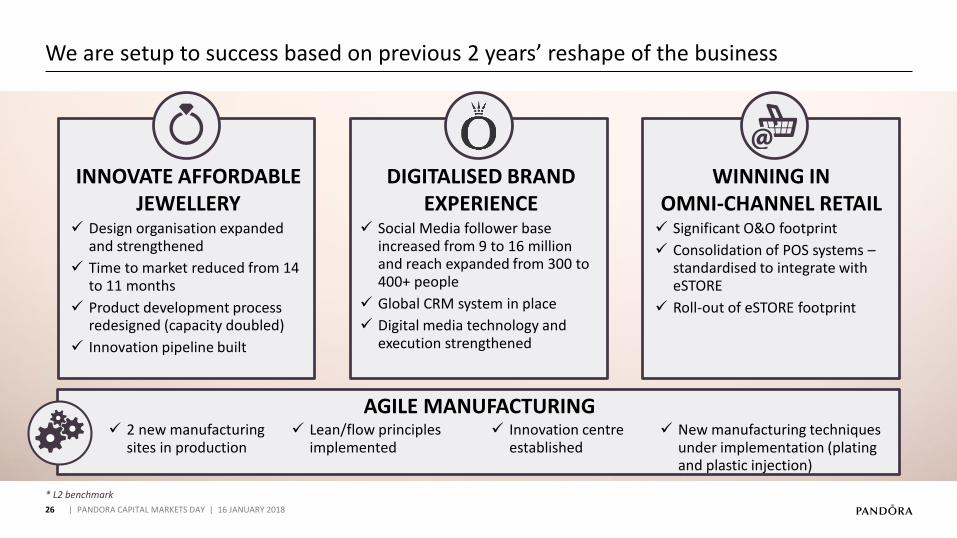
We are setup to success based on previous 2 years’ reshape of the business
✓ Design organisation expanded and strengthened
✓ Time to market reduced from 14 to 11 months
✓ Product development process redesigned (capacity doubled)
✓ Innovation pipeline built
✓ 2 new manufacturing sites in production
✓ Innovation centre established
✓ Lean/flow principles implemented
✓ Social Media follower base increased from 9 to 16 million and reach expanded from 300 to 400+ people
✓ Global CRM system in place
✓ Digital media technology and execution strengthened
✓ Significant O&O footprint
✓ Consolidation of POS systems –standardised to integrate with eSTORE
✓ Roll-out of eSTORE footprint
AGILE MANUFACTURINGNew manufacturing techniques ✓
under implementation (plating and plastic injection)
* L2 benchmark
| PANDORA CAPITAL MARKETS DAY | 16 JANUARY 2018
WINNING IN OMNI-CHANNEL RETAIL
DIGITALISED BRAND EXPERIENCE
INNOVATE AFFORDABLE JEWELLERY
27
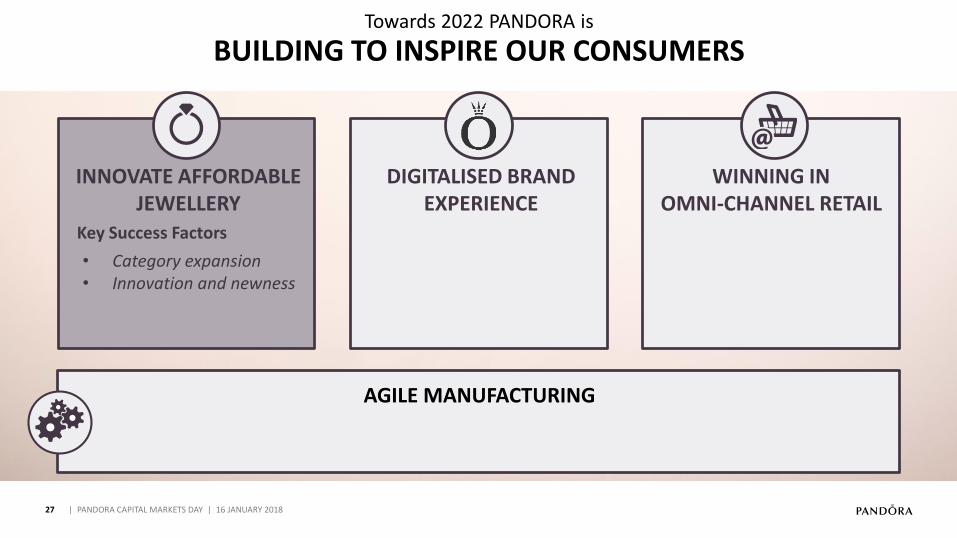
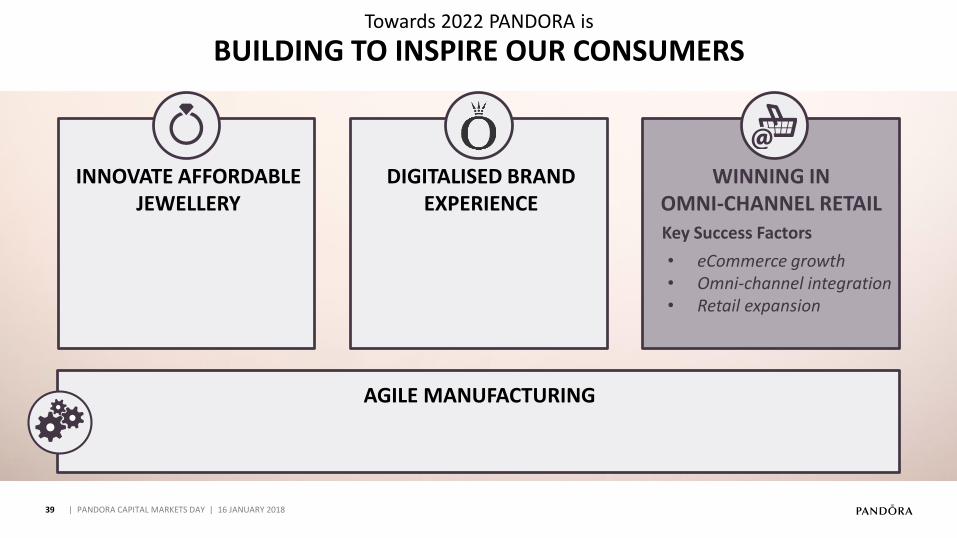
WE WILL TRANSFORM PANDORA TOWARDS 2022
Towards 2022 PANDORA is
BUILDING TO INSPIRE OUR CONSUMERS
• Category expansion• Innovation and newness
Key Success Factors
AGILE MANUFACTURING
WINNING IN OMNI-CHANNEL RETAIL
DIGITALISED BRAND EXPERIENCE
INNOVATE AFFORDABLE JEWELLERY
| PANDORA CAPITAL MARKETS DAY | 16 JANUARY 2018
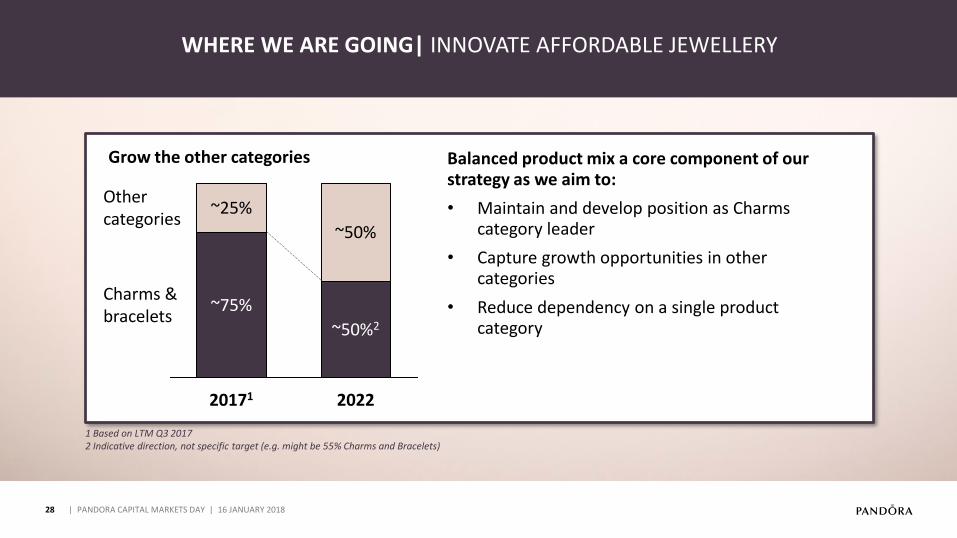
Grow the other categories Balanced product mix a core component of our strategy as we aim to:
• Maintain and develop position as Charms category leader
• Capture growth opportunities in other categories
• Reduce dependency on a single product category
28
XXX
| PANDORA CAPITAL MARKETS DAY | 16 JANUARY 2018
Other categories
Charms & bracelets
2022
~50%2
~75%
~25%
20171
~50%
WHERE WE ARE GOING| INNOVATE AFFORDABLE JEWELLERY
1 Based on LTM Q3 20172 Indicative direction, not specific target (e.g. might be 55% Charms and Bracelets)

29
XXX
| PANDORA CAPITAL MARKETS DAY | 16 JANUARY 2018
Lead & innovate the charms category
• Continuously refresh Moments offering• Develop new charm/bracelet platforms
Win the other categories
• Add net 400 products in Rings, Earrings and Necklaces & Pendants (to 800 in total)
• Broaden design style (new designs and materials)
Concept innovation
• Launch minimum 1 new concept annually• Design and innovation team linked to
manufacturing
Fast, timely & wide design newness
• 10 drops per year (up from 7)• ~550 new product annually (up from 400)• Reduce new product time to market – as
fast as 4 months
OUR RECIPE FOR GROWTH | INNOVATE AFFORDABLE JEWELLERY
30
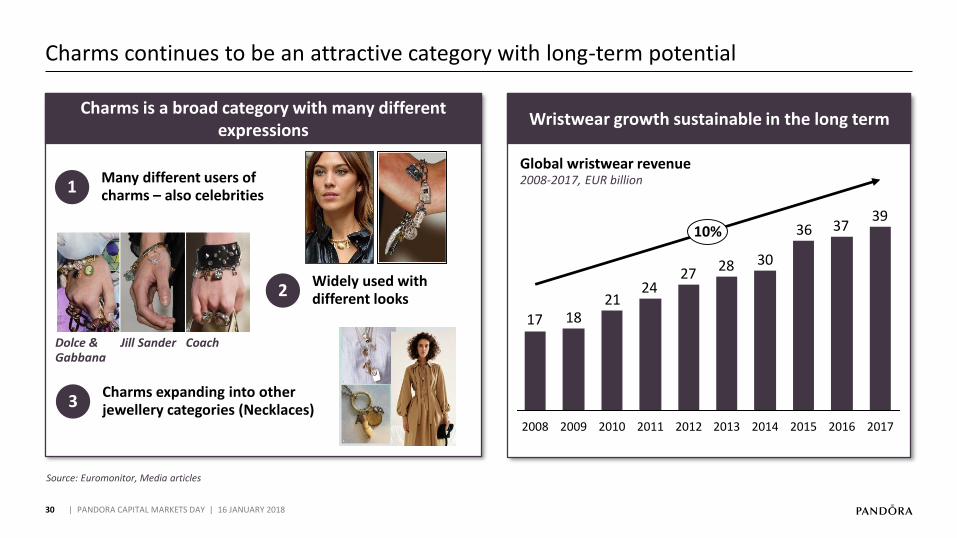
Charms continues to be an attractive category with long-term potential
| PANDORA CAPITAL MARKETS DAY | 16 JANUARY 2018
Wristwear growth sustainable in the long term
Source: Euromonitor, Media articles
Charms is a broad category with many different expressions
393736
30282724
211817
2017
10%
20142013 2015 20162010 201120092008 2012
Global wristwear revenue2008-2017, EUR billion
Dolce & Gabbana
Jill Sander Coach
Many different users of charms – also celebrities 1
Widely used with different looks2
Charms expanding into other jewellery categories (Necklaces)3
31
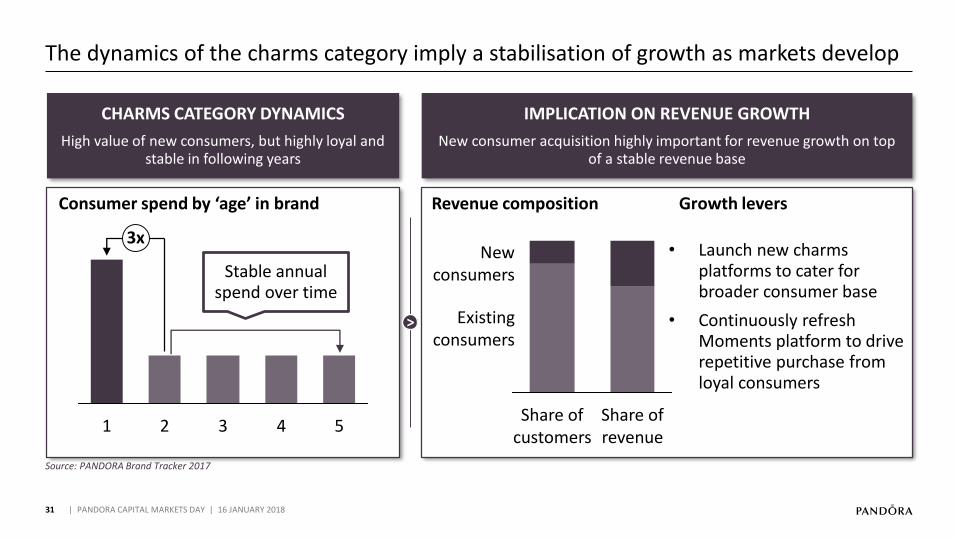
The dynamics of the charms category imply a stabilisation of growth as markets develop
| PANDORA CAPITAL MARKETS DAY | 16 JANUARY 2018
CHARMS CATEGORY DYNAMICS
High value of new consumers, but highly loyal and stable in following years
IMPLICATION ON REVENUE GROWTH
New consumer acquisition highly important for revenue growth on top of a stable revenue base
Launch new charms •platforms to cater for broader consumer base
Continuously refresh •Moments platform to drive repetitive purchase from loyal consumers
21
3x
543
Consumer spend by ‘age’ in brand
Stable annual spend over time
Share of revenue
Existingconsumers
Share of customers
Newconsumers
Revenue composition
Source: PANDORA Brand Tracker 2017
Growth levers
>
32
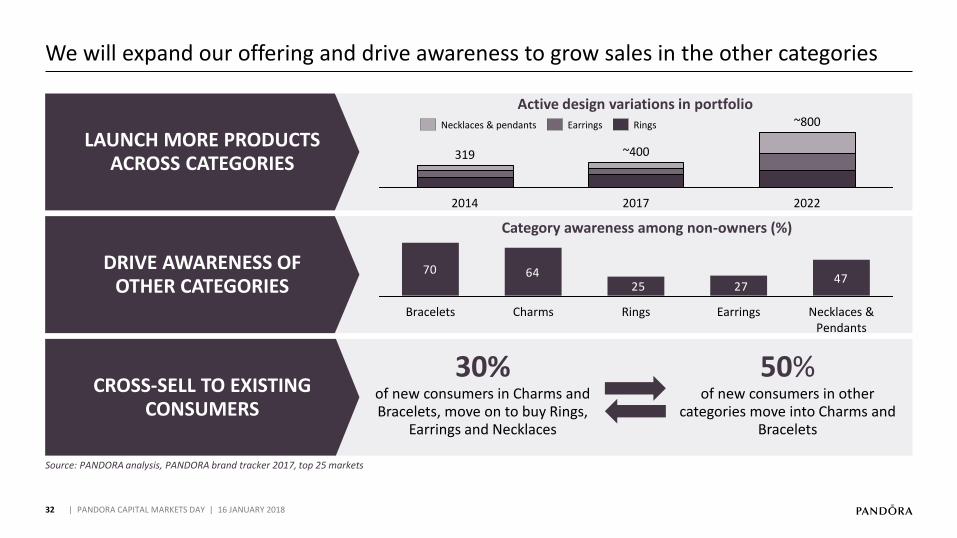
We will expand our offering and drive awareness to grow sales in the other categories
| PANDORA CAPITAL MARKETS DAY | 16 JANUARY 2018
Source: PANDORA analysis, PANDORA brand tracker 2017, top 25 markets
LAUNCH MORE PRODUCTS ACROSS CATEGORIES
DRIVE AWARENESS OF OTHER CATEGORIES
CROSS-SELL TO EXISTING CONSUMERS
~400
2014 2017 2022
~800
319
Active design variations in portfolio
70 64 472725
Rings EarringsCharmsBracelets Necklaces &Pendants
Category awareness among non-owners (%)
30%of new consumers in Charms and Bracelets, move on to buy Rings,
Earrings and Necklaces
50%of new consumers in other
categories move into Charms and Bracelets
RingsEarringsNecklaces & pendants
33
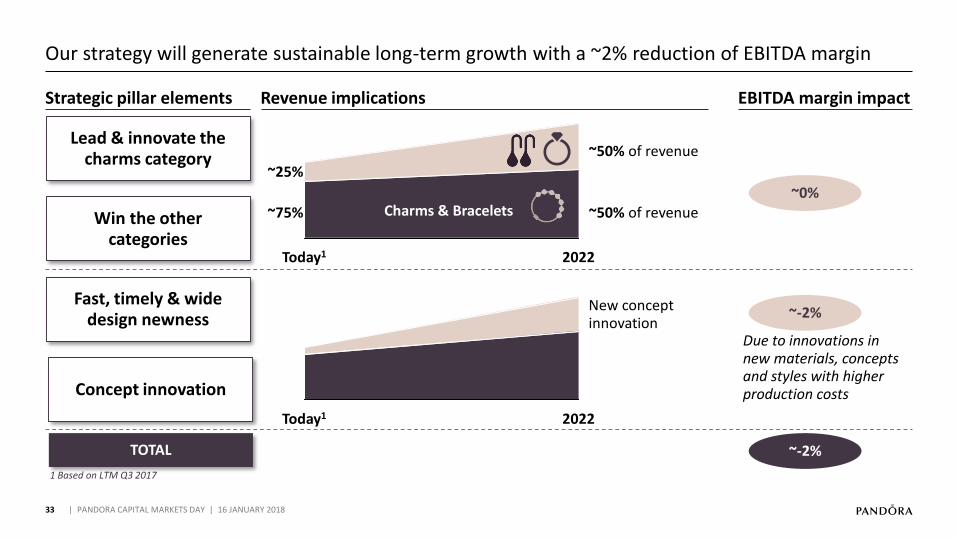
Our strategy will generate sustainable long-term growth with a ~2% reduction of EBITDA margin
| PANDORA CAPITAL MARKETS DAY | 16 JANUARY 2018
TOTAL
~-2%
~0%
~-2%
2022Today1
~50% of revenue
~50% of revenue
Lead & innovate the charms category
Revenue implications EBITDA margin impact
Win the other categories
Fast, timely & wide design newness
Concept innovation
2022Today1
New concept innovation
Strategic pillar elements
Charms & Bracelets
Other Jewellery Categories
Due to innovations in new materials, concepts and styles with higher production costs
~25%
~75%
1 Based on LTM Q3 2017
34
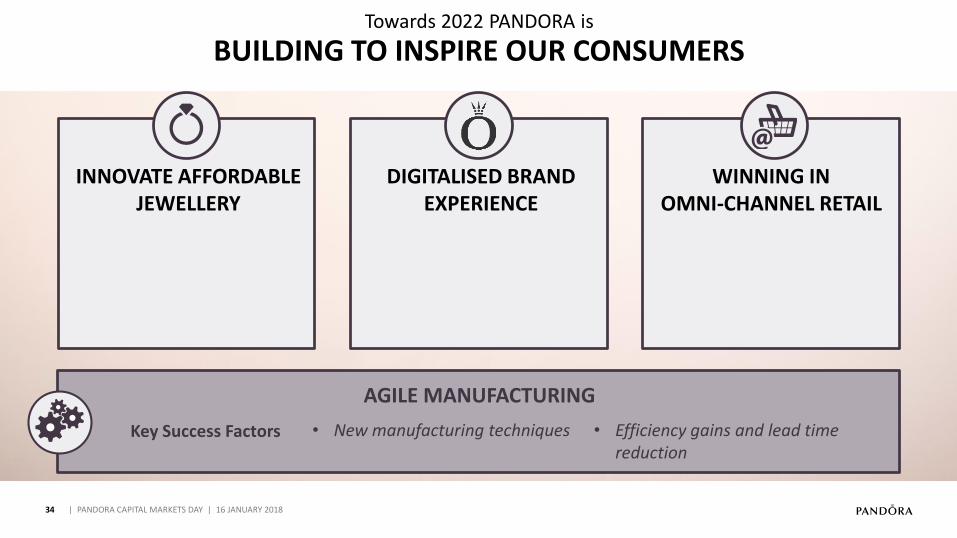
WE WILL TRANSFORM PANDORA TOWARDS 2022
Towards 2022 PANDORA is
BUILDING TO INSPIRE OUR CONSUMERS
AGILE MANUFACTURING
WINNING IN OMNI-CHANNEL RETAIL
DIGITALISED BRAND EXPERIENCE
INNOVATE AFFORDABLE JEWELLERY
Key Success Factors • Efficiency gains and lead time reduction
• New manufacturing techniques
| PANDORA CAPITAL MARKETS DAY | 16 JANUARY 2018
NEXT LEVEL PRODUCT INNOVATION
35
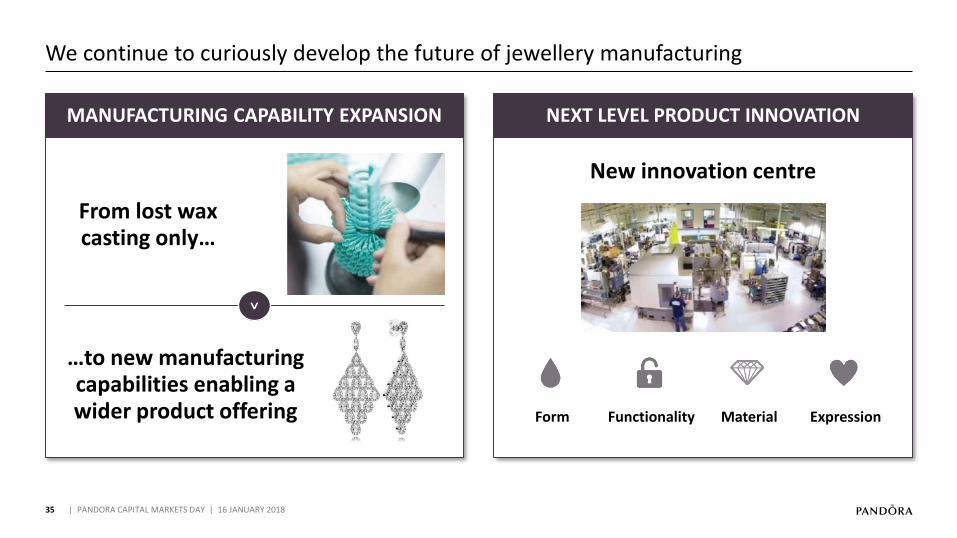
We continue to curiously develop the future of jewellery manufacturing
| PANDORA CAPITAL MARKETS DAY | 16 JANUARY 2018
MANUFACTURING CAPABILITY EXPANSION
New innovation centre
MaterialFunctionality ExpressionForm
>
From lost wax casting only…
…to new manufacturing capabilities enabling a wider product offering
36
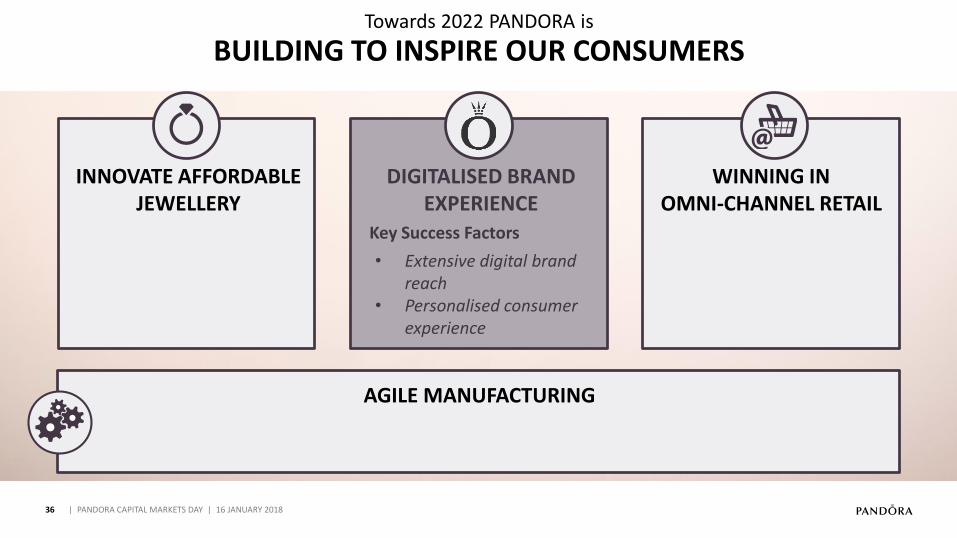
WE WILL TRANSFORM PANDORA TOWARDS 2022
Towards 2022 PANDORA is
BUILDING TO INSPIRE OUR CONSUMERS
• Extensive digital brand reach
• Personalised consumer experience
Key Success Factors
AGILE MANUFACTURING
WINNING IN OMNI-CHANNEL RETAIL
DIGITALISED BRAND EXPERIENCE
INNOVATE AFFORDABLE JEWELLERY
| PANDORA CAPITAL MARKETS DAY | 16 JANUARY 2018
37
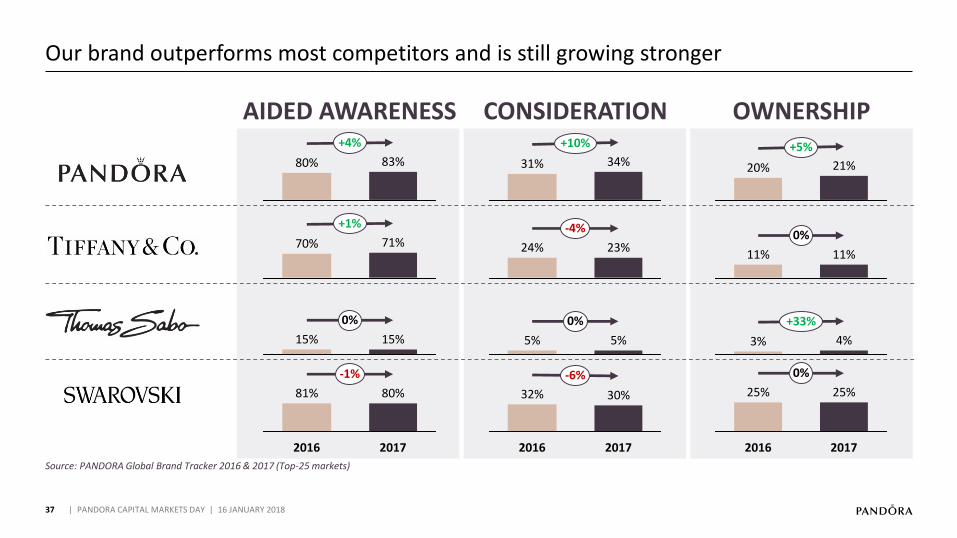
Our brand outperforms most competitors and is still growing stronger
| PANDORA CAPITAL MARKETS DAY | 16 JANUARY 2018
Source: PANDORA Global Brand Tracker 2016 & 2017 (Top-25 markets)
CONSIDERATION OWNERSHIPAIDED AWARENESS
83%80%
+4%
70% 71%
+1%
15%
0%
15%
2017
-1%
2016
80%81%
31%
+10%
34%
24% 23%
-4%
0%
5% 5%
30%
2017
-6%
2016
32%
21%
+5%
20%
0%
11% 11%
3% 4%
+33%
0%
2016
25%
2017
25%
38
XXX
| PANDORA CAPITAL MARKETS DAY | 16 JANUARY 2018
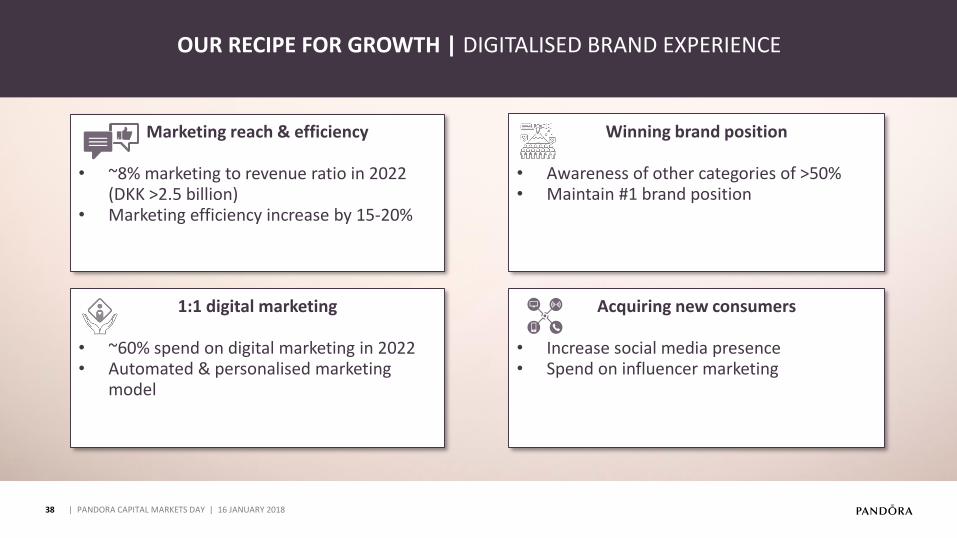
Acquiring new consumers
• Increase social media presence• Spend on influencer marketing
1:1 digital marketing
• ~60% spend on digital marketing in 2022• Automated & personalised marketing
model
OUR RECIPE FOR GROWTH | DIGITALISED BRAND EXPERIENCE
Marketing reach & efficiency
• ~8% marketing to revenue ratio in 2022 (DKK >2.5 billion)Marketing efficiency increase by • 15-20%
Winning brand position
• Awareness of other categories of >50%• Maintain #1 brand position
39
WE WILL TRANSFORM PANDORA TOWARDS 2022
Towards 2022 PANDORA is
BUILDING TO INSPIRE OUR CONSUMERS
• eCommerce growth• Omni-channel integration• Retail expansion
Key Success Factors
AGILE MANUFACTURING
WINNING IN OMNI-CHANNEL RETAIL
DIGITALISED BRAND EXPERIENCE
INNOVATE AFFORDABLE JEWELLERY
| PANDORA CAPITAL MARKETS DAY | 16 JANUARY 2018
40
2-3 MARKETING SLIDES BEING ADDED THIS WEEK
| PANDORA CAPITAL MARKETS DAY | 16 JANUARY 2018
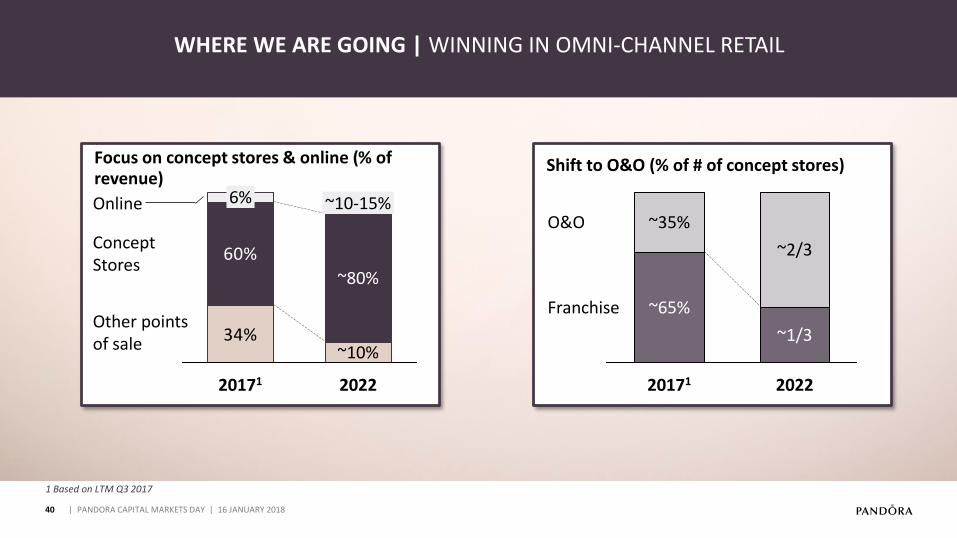
Focus on concept stores & online (% of revenue)
34%
60%
2022
Online
~80%
~10-15%
Other points of sale
Concept Stores
~10%
20171
6%
Shift to O&O (% of # of concept stores)
~65%
20171
~1/3
2022
~35%O&O
Franchise
~2/3
WHERE WE ARE GOING | WINNING IN OMNI-CHANNEL RETAIL
1 Based on LTM Q3 2017
41
XXX
| PANDORA CAPITAL MARKETS DAY | 16 JANUARY 2018
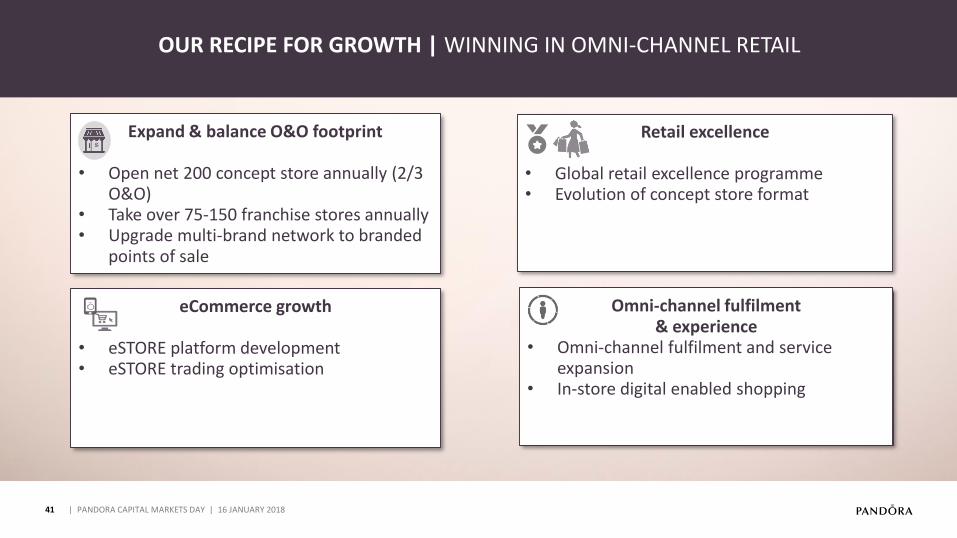
Expand & balance O&O footprint
Open net • 200 concept store annually (2/3 O&O) Take over • 75-150 franchise stores annuallyUpgrade multi• -brand network to branded points of sale
Retail excellence
• Global retail excellence programme• Evolution of concept store format
Omni-channel fulfilment & experience
• Omni-channel fulfilment and service expansion
• In-store digital enabled shopping
eCommerce growth
• eSTORE platform development• eSTORE trading optimisation
<
OUR RECIPE FOR GROWTH | WINNING IN OMNI-CHANNEL RETAIL
42
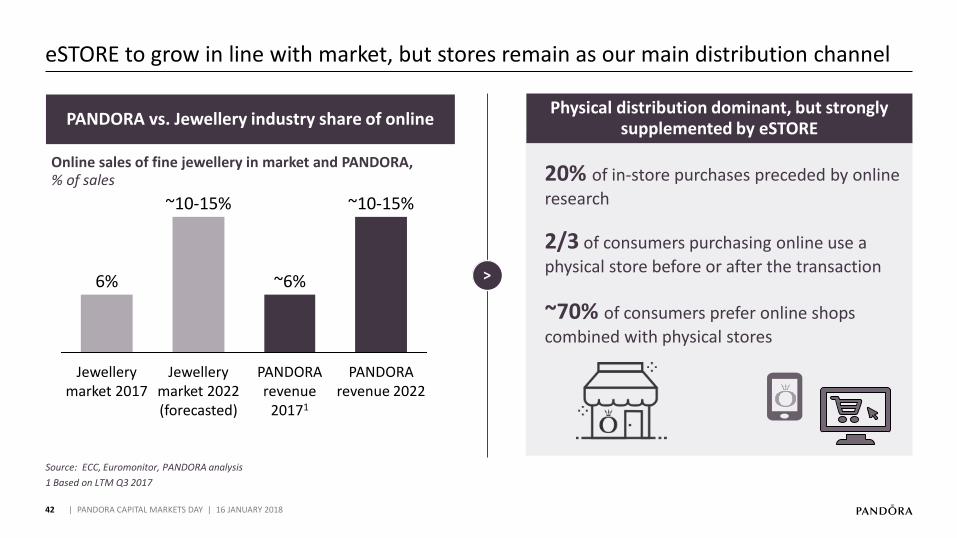
eSTORE to grow in line with market, but stores remain as our main distribution channel
| PANDORA CAPITAL MARKETS DAY | 16 JANUARY 2018
Online sales of fine jewellery in market and PANDORA,% of sales
Source: ECC, Euromonitor, PANDORA analysis
>
Physical distribution dominant, but strongly supplemented by eSTORE
20% of in-store purchases preceded by online
research
2/3 of consumers purchasing online use a
physical store before or after the transaction
~70% of consumers prefer online shops
combined with physical stores
~10-15%
6% ~6%
Jewellery market 2022 (forecasted)
Jewellery market 2017
~10-15%
PANDORA revenue 2022
PANDORA revenue
20171
PANDORA vs. Jewellery industry share of online
1 Based on LTM Q3 2017
43
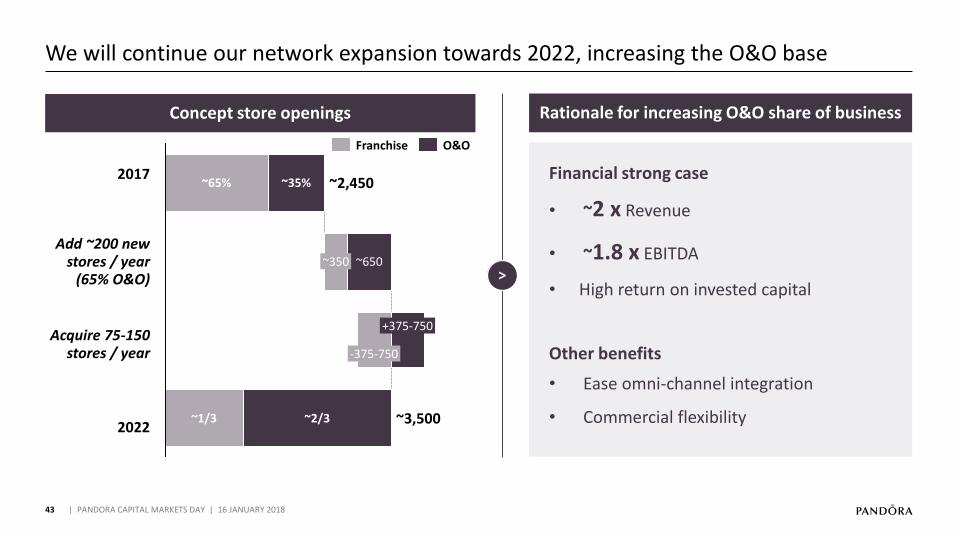
We will continue our network expansion towards 2022, increasing the O&O base
| PANDORA CAPITAL MARKETS DAY | 16 JANUARY 2018
Concept store openings Rationale for increasing O&O share of business
~2/3~1/3
-375-750
~3,500
+375-750
~350
~2,450~65%
~650
~35%
O&OFranchise
2017
Add ~200 new stores / year
(65% O&O)
Acquire 75-150 stores / year
2022
>
Financial strong case
• ~2 x Revenue
• ~1.8 x EBITDA
• High return on invested capital
Other benefits
• Ease omni-channel integration
• Commercial flexibility
44
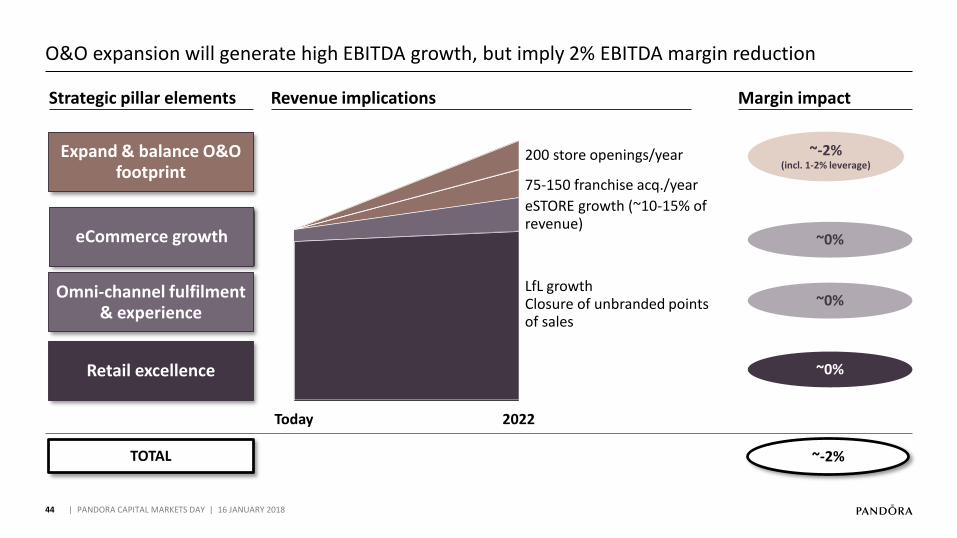
O&O expansion will generate high EBITDA growth, but imply 2% EBITDA margin reduction
| PANDORA CAPITAL MARKETS DAY | 16 JANUARY 2018
Retail excellence
Expand & balance O&O footprint
eCommerce growth
Omni-channel fulfilment & experience
Revenue implications Margin impact
~0%
~0%
~-2%
~-2% (incl. 1-2% leverage)
Strategic pillar elements
2022Today
200 store openings/year
TOTAL
~0%
75-150 franchise acq./year
eSTORE growth (~10-15% of revenue)
LfL growthClosure of unbranded points of sales
45
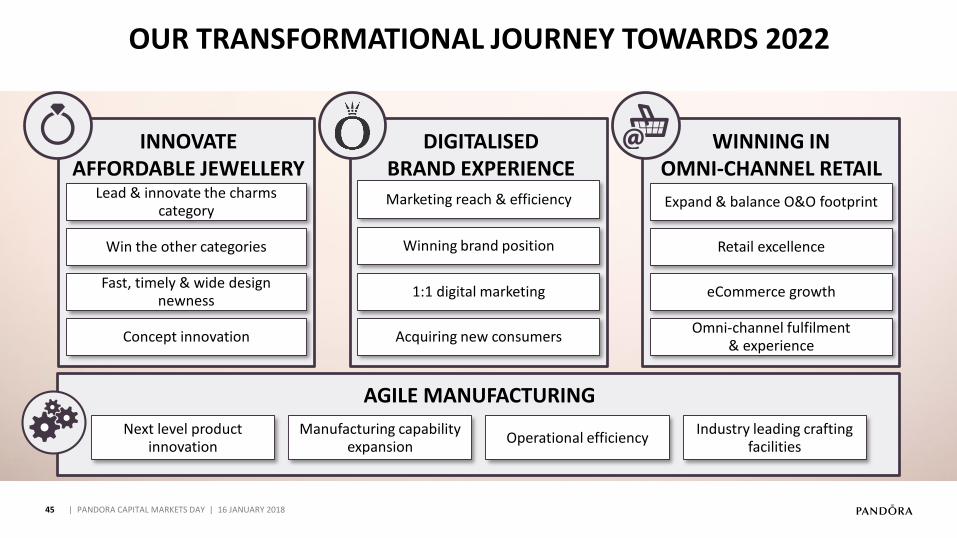
WE WILL TRANSFORM PANDORA TOWARDS 2022
OUR TRANSFORMATIONAL JOURNEY TOWARDS 2022
AGILE MANUFACTURING
WINNING IN OMNI-CHANNEL RETAIL
DIGITALISED BRAND EXPERIENCE
INNOVATE AFFORDABLE JEWELLERY
Next level product innovation
Industry leading crafting facilities
Manufacturing capability expansion
Operational efficiency
Lead & innovate the charms category
Win the other categories
Fast, timely & wide design newness
Concept innovation
Winning brand position
Marketing reach & efficiency
Acquiring new consumers
1:1 digital marketing
Expand & balance O&O footprint
Retail excellence
eCommerce growth
Omni-channel fulfilment & experience
| PANDORA CAPITAL MARKETS DAY | 16 JANUARY 2018
46
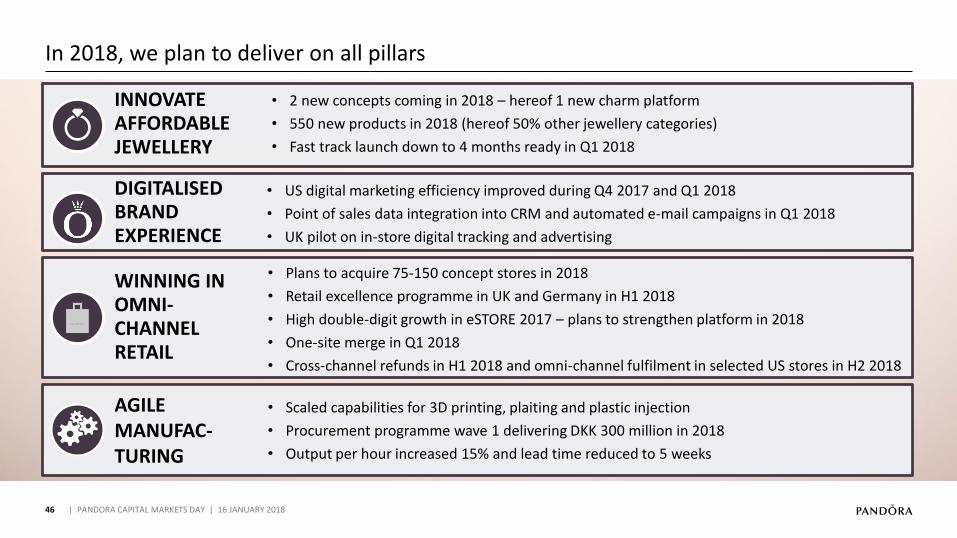
In 2018, we plan to deliver on all pillars
| PANDORA CAPITAL MARKETS DAY | 16 JANUARY 2018
• 2 new concepts coming in 2018 – hereof 1 new charm platform
• 550 new products in 2018 (hereof 50% other jewellery categories)
• Fast track launch down to 4 months ready in Q1 2018
INNOVATE AFFORDABLE JEWELLERY
• Plans to acquire 75-150 concept stores in 2018
• Retail excellence programme in UK and Germany in H1 2018
• High double-digit growth in eSTORE 2017 – plans to strengthen platform in 2018
• One-site merge in Q1 2018
• Cross-channel refunds in H1 2018 and omni-channel fulfilment in selected US stores in H2 2018
WINNING IN OMNI-CHANNEL RETAIL
• US digital marketing efficiency improved during Q4 2017 and Q1 2018
• Point of sales data integration into CRM and automated e-mail campaigns in Q1 2018
• UK pilot on in-store digital tracking and advertising
DIGITALISED BRAND EXPERIENCE
Scaled capabilities for • 3D printing, plaiting and plastic injection
Procurement • programme wave 1 delivering DKK 300 million in 2018
Output per hour increased • 15% and lead time reduced to 5 weeks
AGILE MANUFAC-TURING
47
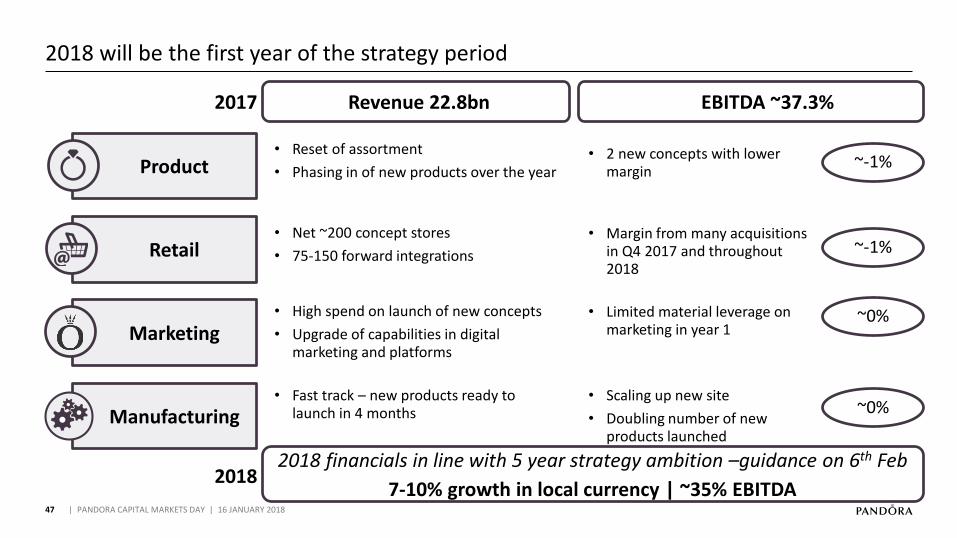
2018 will be the first year of the strategy period
| PANDORA CAPITAL MARKETS DAY | 16 JANUARY 2018
Manufacturing
Product
Marketing
Retail
• Reset of assortment
• Phasing in of new products over the year• 2 new concepts with lower
margin
• Net ~200 concept stores
• 75-150 forward integrations
• Margin from many acquisitions in Q4 2017 and throughout 2018
• High spend on launch of new concepts
• Upgrade of capabilities in digital marketing and platforms
• Limited material leverage on marketing in year 1
• Scaling up new site
• Doubling number of new products launched
EBITDA ~37.3%Revenue 22.8bn2017
~-1%
~-1%
~0%
~0%
2018 financials in line with 5 year strategy ambition –guidance on 6th Feb
7-10% growth in local currency | ~35% EBITDA
Fast track • – new products ready to launch in 4 months
2018

48
The PANDORA investment case towards 2022
| PANDORA CAPITAL MARKETS DAY | 16 JANUARY 2018
A UNIQUE INTEGRATED BUSINESS MODEL DELIVERING STRONG FINANCIALS
5X
LARGE AND PROFITABLE DISTRIBUTION
NETWORK
LEADING POSITION IN BRANDED
MANUFACTURING
AFFORDABLE JEWELLERY LEADER
WORLD´S MOST RECOGNISED
JEWELLERY BRAND
SUSTAINABLE GROWTH
~7-10%
STRONG MARGINS
~35%
ASSET LIGHT
~5% CAPEX
CASH GENERATIVE
High pay-out
EBITDA margin
Revenue growth(local currency)
01
2017 PERFORMANCEAnders Colding Friis, President & CEO
02
NEW STRATEGY TOWARDS 2022Anders Colding Friis, President & CEO
07
FINANCIAL OUTLOOK TOWARDS 2022Peter Vekslund, EVP & CFO
06
WINNING IN OMNI-CHANNEL RETAILDavid Allen, President, EMEA
05
Minna Philipson, SVP & Chief Marketing Officer
DIGITALISED BRAND EXPERIENCE
03
Stephen Fairchild, SVP & Chief Creative Officer
INNOVATE AFFORDABLE JEWELLERY
49
03 | INNOVATE AFFORDABLE JEWELLERY
| PANDORA CAPITAL MARKETS DAY | 16 JANUARY 2018
04
Thomas Touborg, SVP, Group Operations
AGILE MANUFACTURING
08
CLOSING REMARKSPeder Tuborgh, Chairman of the Board
50
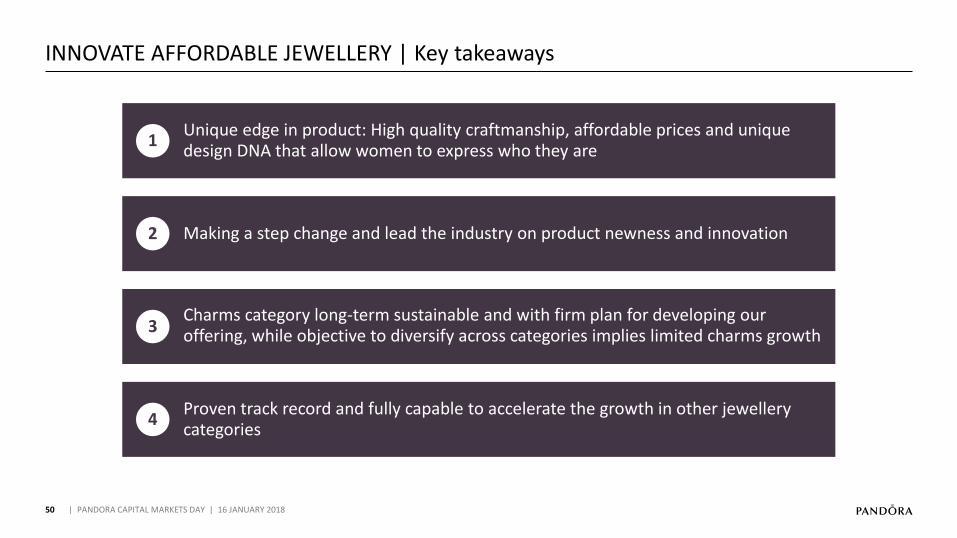
INNOVATE AFFORDABLE JEWELLERY | Key takeaways
| PANDORA CAPITAL MARKETS DAY | 16 JANUARY 2018
1Unique edge in product: High quality craftmanship, affordable prices and unique design DNA that allow women to express who they are
2 Making a step change and lead the industry on product newness and innovation
3Charms category long-term sustainable and with firm plan for developing our offering, while objective to diversify across categories implies limited charms growth
4Proven track record and fully capable to accelerate the growth in other jewellery categories
51
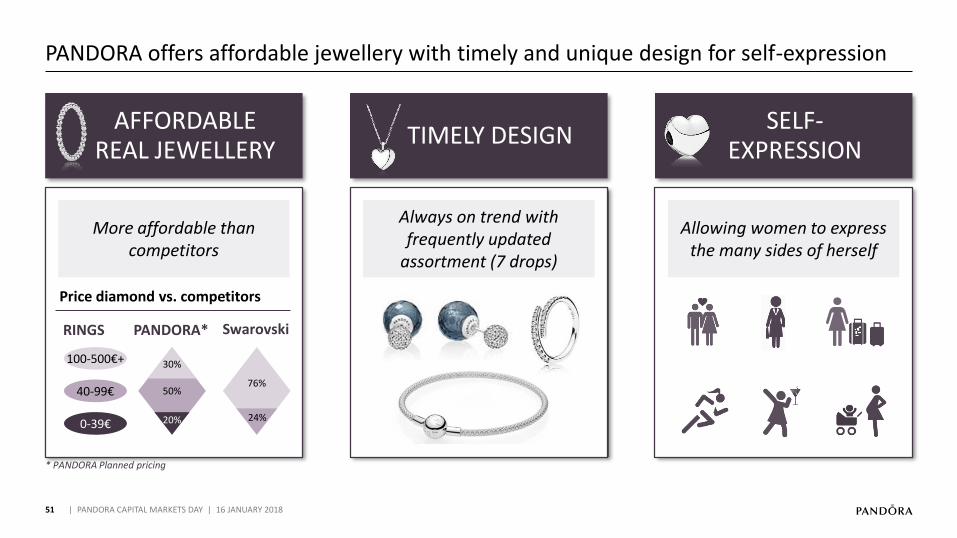
* PANDORA Planned pricing
PANDORA offers affordable jewellery with timely and unique design for self-expression
| PANDORA CAPITAL MARKETS DAY | 16 JANUARY 2018
TIMELY DESIGNSELF-
EXPRESSIONAFFORDABLE
REAL JEWELLERY
40-99€
100-500€+
0-39€
PANDORA* Swarovski
30%
50%
20%
76%
28%24%
RINGS
Price diamond vs. competitors
More affordable than competitors
Always on trend with frequently updated
assortment (7 drops)
Allowing women to express the many sides of herself
52
XXX
| PANDORA CAPITAL MARKETS DAY | 16 JANUARY 2018
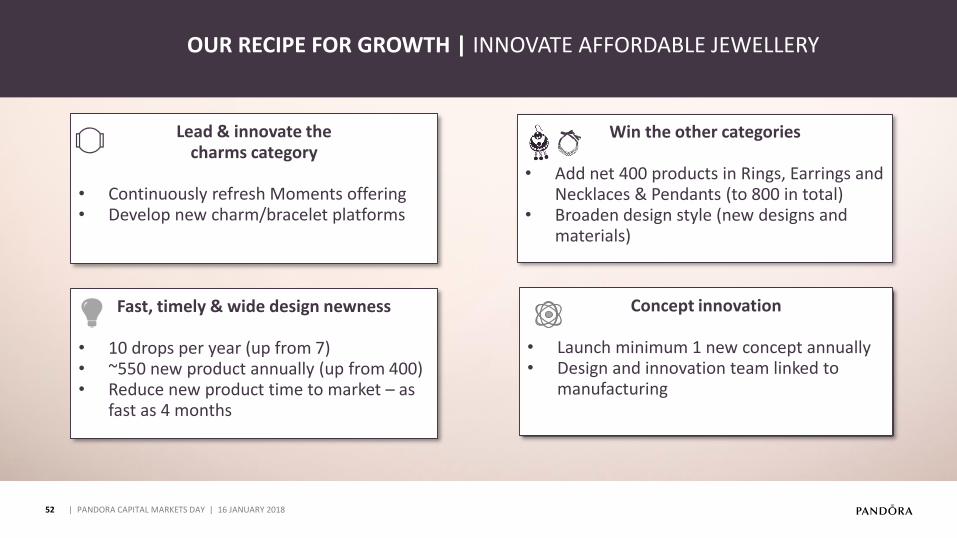
Lead & innovate the charms category
• Continuously refresh Moments offering• Develop new charm/bracelet platforms
Win the other categories
Add net • 400 products in Rings, Earrings and Necklaces & Pendants (to 800 in total)Broaden design style (new designs and •materials)
Concept innovation
• Launch minimum 1 new concept annually• Design and innovation team linked to
manufacturing
Fast, timely & wide design newness
• 10 drops per year (up from 7)• ~550 new product annually (up from 400)• Reduce new product time to market – as
fast as 4 months
OUR RECIPE FOR GROWTH | INNOVATE AFFORDABLE JEWELLERY
53
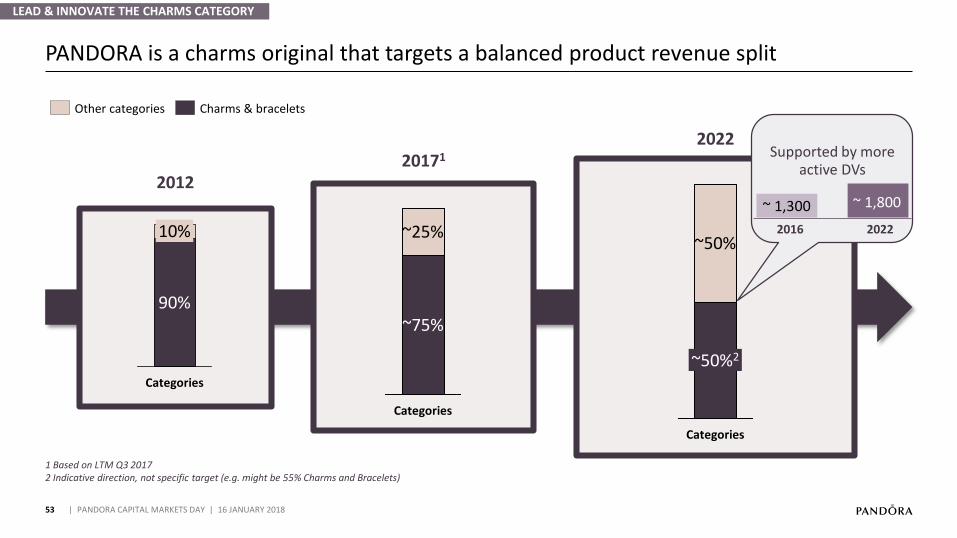
PANDORA is a charms original that targets a balanced product revenue split
| PANDORA CAPITAL MARKETS DAY | 16 JANUARY 2018
201220171
2022
90%
Categories
10% ~25%
~75%
Categories
~50%2
~50%
Categories
Other categories Charms & bracelets
Supported by more active DVs
2016 2022
~ 1,300 ~ 1,800
LEAD & INNOVATE THE CHARMS CATEGORY
1 Based on LTM Q3 20172 Indicative direction, not specific target (e.g. might be 55% Charms and Bracelets)
54
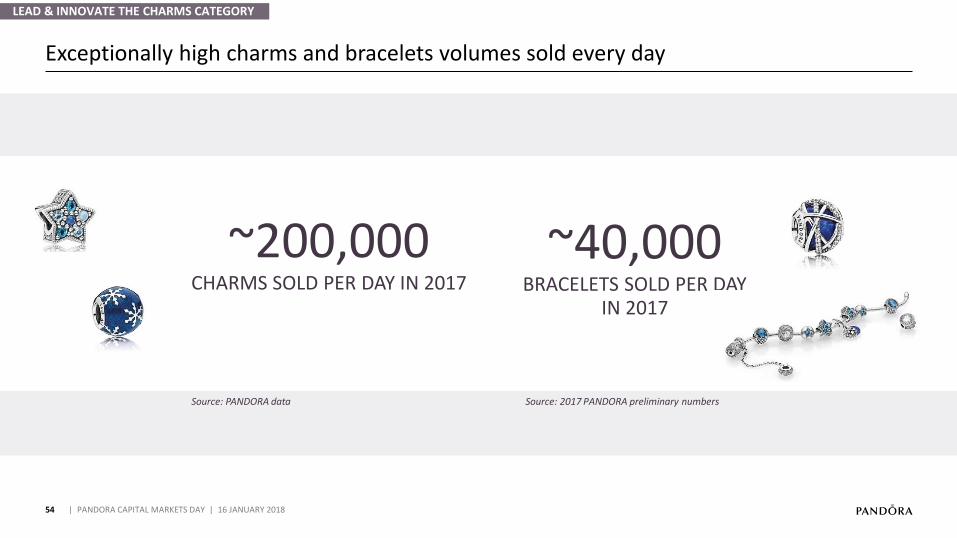
Exceptionally high charms and bracelets volumes sold every day
| PANDORA CAPITAL MARKETS DAY | 16 JANUARY 2018
~200,000CHARMS SOLD PER DAY IN 2017
Source: PANDORA data Source: 2017 PANDORA preliminary numbers
~40,000BRACELETS SOLD PER DAY
IN 2017
LEAD & INNOVATE THE CHARMS CATEGORY
55
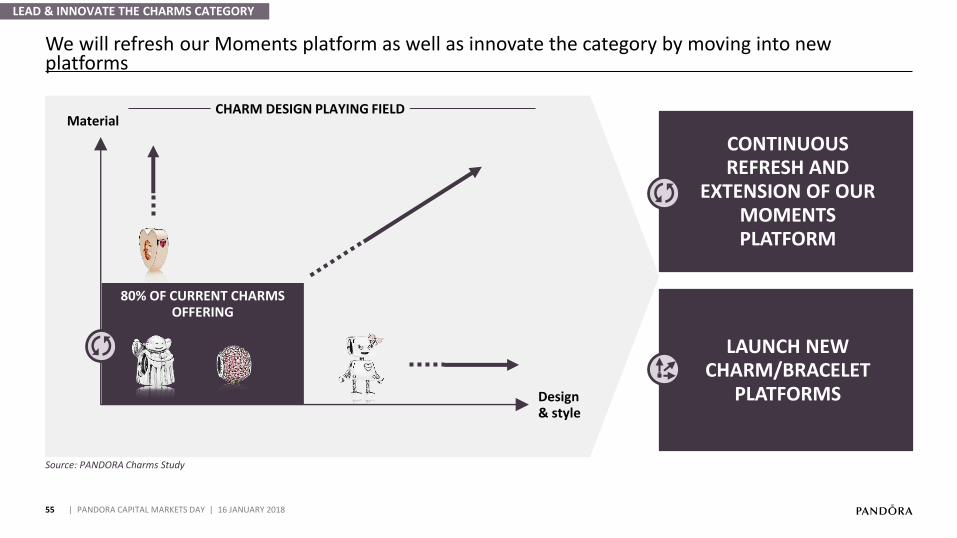
We will refresh our Moments platform as well as innovate the category by moving into new platforms
| PANDORA CAPITAL MARKETS DAY | 16 JANUARY 2018
LEAD & INNOVATE THE CHARMS CATEGORY
80% OF CURRENT CHARMS OFFERING
Design & style
Material
CONTINUOUS REFRESH AND
EXTENSION OF OUR MOMENTS PLATFORM
LAUNCH NEW CHARM/BRACELET
PLATFORMS
CHARM DESIGN PLAYING FIELD
Source: PANDORA Charms Study
56
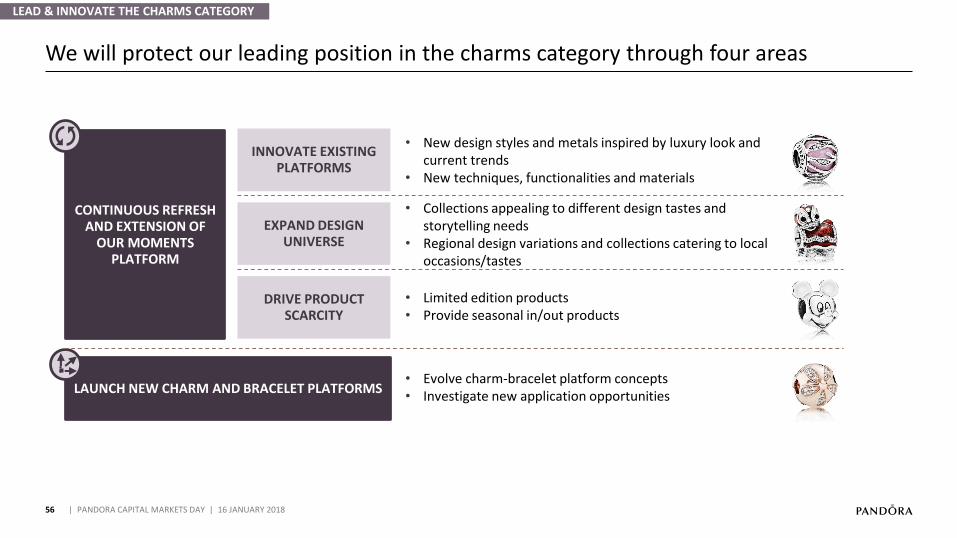
We will protect our leading position in the charms category through four areas
| PANDORA CAPITAL MARKETS DAY | 16 JANUARY 2018
CONTINUOUS REFRESH AND EXTENSION OF
OUR MOMENTS PLATFORM
LAUNCH NEW CHARM AND BRACELET PLATFORMS
EXPAND DESIGN UNIVERSE
• Collections appealing to different design tastes and storytelling needs
• Regional design variations and collections catering to local occasions/tastes
INNOVATE EXISTING PLATFORMS
• New design styles and metals inspired by luxury look and current trends
• New techniques, functionalities and materials
DRIVE PRODUCT SCARCITY
• Limited edition products• Provide seasonal in/out products
• Evolve charm-bracelet platform concepts• Investigate new application opportunities
LEAD & INNOVATE THE CHARMS CATEGORY
57
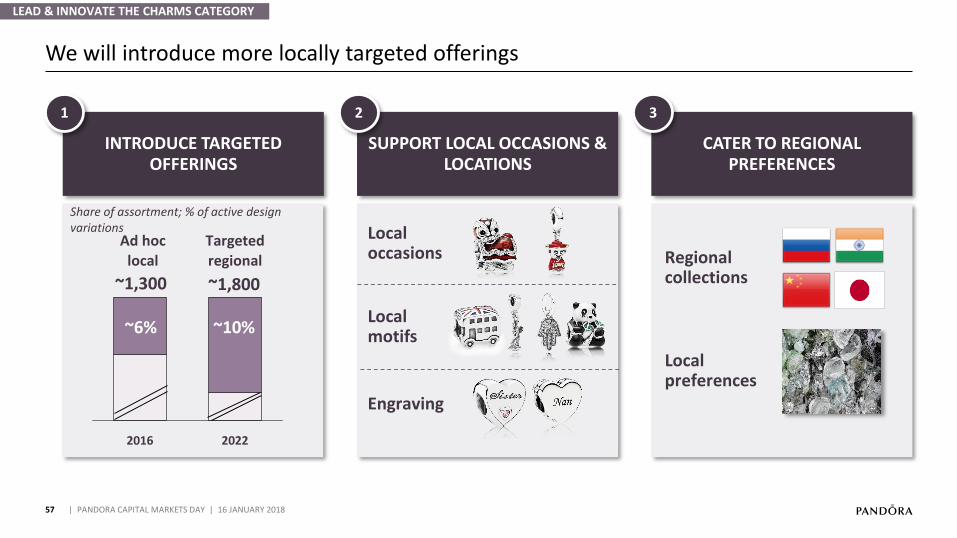
We will introduce more locally targeted offerings
| PANDORA CAPITAL MARKETS DAY | 16 JANUARY 2018
INTRODUCE TARGETED OFFERINGS
1
SUPPORT LOCAL OCCASIONS & LOCATIONS
2
CATER TO REGIONAL PREFERENCES
3
2022
~1,800
~10%
2016
~1,300
~6%
Targeted regional
Ad hoc local
Share of assortment; % of active design variations Local
occasions
Engraving
Local motifs
Regional collections
Local preferences
LEAD & INNOVATE THE CHARMS CATEGORY
58
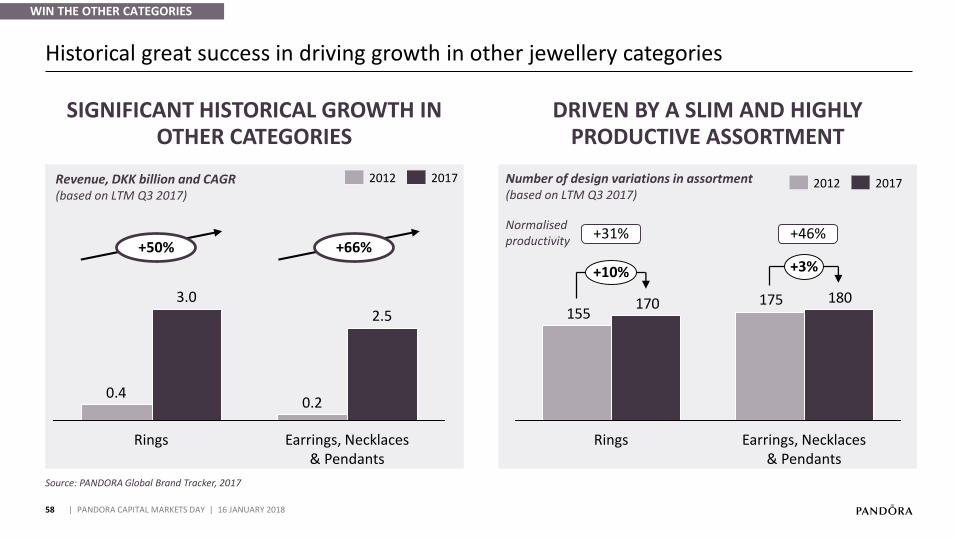
Historical great success in driving growth in other jewellery categories
| PANDORA CAPITAL MARKETS DAY | 16 JANUARY 2018
WIN THE OTHER CATEGORIES
Source: PANDORA Global Brand Tracker, 2017
Rings
3.0
0.40.2
Earrings, Necklaces & Pendants
2.5
2012 2017Revenue, DKK billion and CAGR(based on LTM Q3 2017)
SIGNIFICANT HISTORICAL GROWTH IN OTHER CATEGORIES
DRIVEN BY A SLIM AND HIGHLY PRODUCTIVE ASSORTMENT
175155
180170
Earrings, Necklaces & Pendants
+3%+10%
Rings
20172012Number of design variations in assortment(based on LTM Q3 2017)
+31% +46%Normalisedproductivity+50% +66%
59
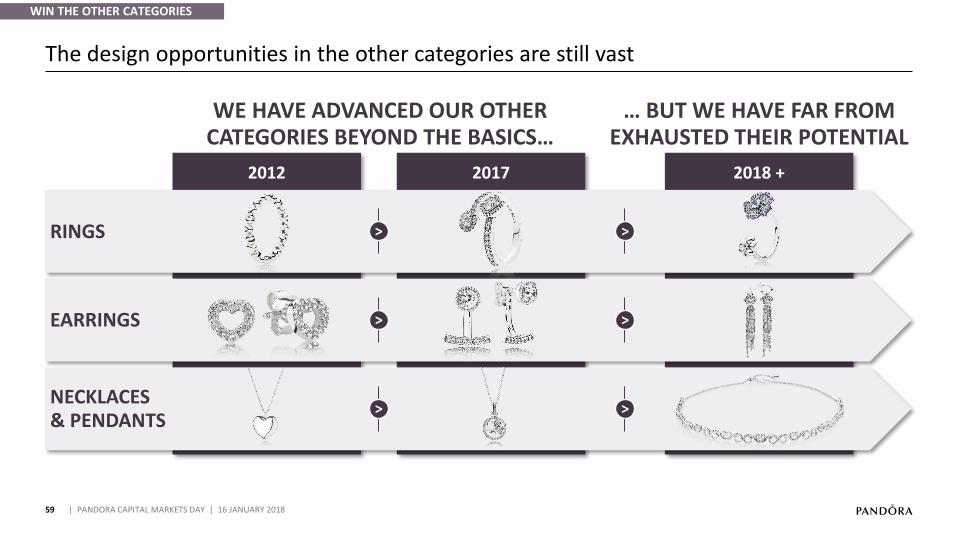
The design opportunities in the other categories are still vast
| PANDORA CAPITAL MARKETS DAY | 16 JANUARY 2018
WIN THE OTHER CATEGORIES
2018 +2017
WE HAVE ADVANCED OUR OTHER CATEGORIES BEYOND THE BASICS…
… BUT WE HAVE FAR FROM EXHAUSTED THEIR POTENTIAL
RINGS
EARRINGS
NECKLACES & PENDANTS
2012
>
>
>
>
>
>
60
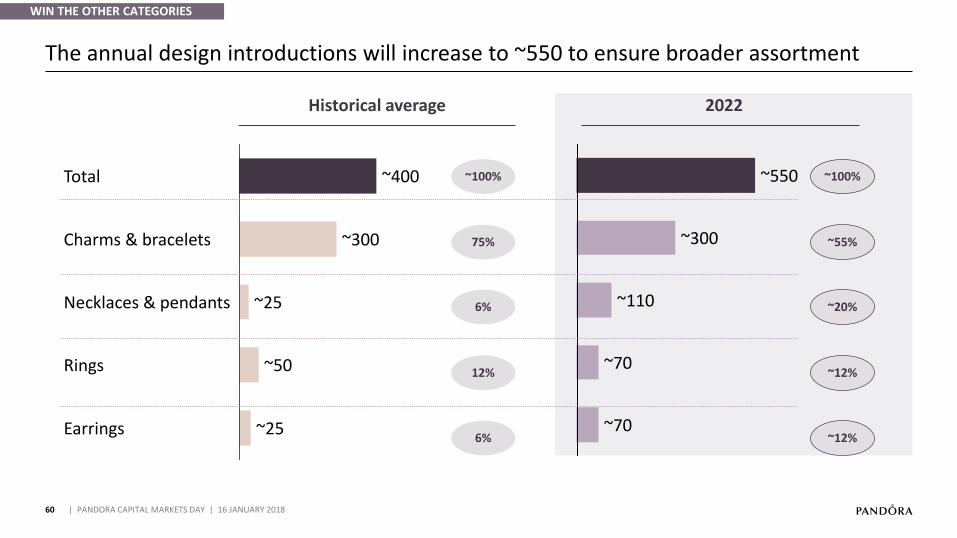
The annual design introductions will increase to ~550 to ensure broader assortment
| PANDORA CAPITAL MARKETS DAY | 16 JANUARY 2018
WIN THE OTHER CATEGORIES
~300
~550
~70
~110
~70Rings
Necklaces & pendants
Charms & bracelets
Total
Earrings
~50
~300
~25
~25
~400
Historical average 2022
~100%
75%
6%
12%
6%
~100%
~55%
~20%
~12%
~12%
61
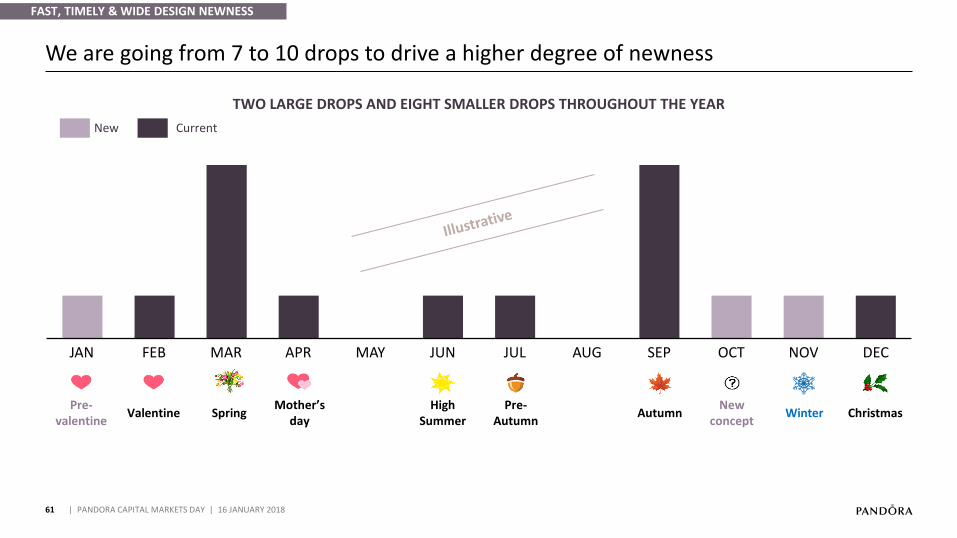
We are going from 7 to 10 drops to drive a higher degree of newness
| PANDORA CAPITAL MARKETS DAY | 16 JANUARY 2018
FAST, TIMELY & WIDE DESIGN NEWNESS
MAY SEPAUGAPR JUN NOVJUL DECOCTJAN FEB MAR
Pre-valentine
ValentineMother’s
dayPre-
AutumnChristmasSpring Autumn Winter
HighSummer
Newconcept
TWO LARGE DROPS AND EIGHT SMALLER DROPS THROUGHOUT THE YEAR
New Current
62
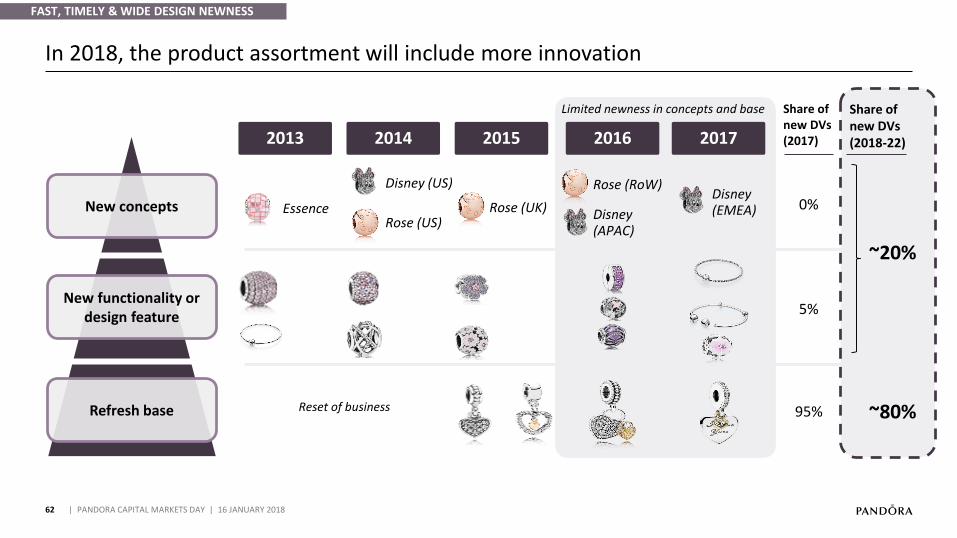
In 2018, the product assortment will include more innovation
| PANDORA CAPITAL MARKETS DAY | 16 JANUARY 2018
New concepts
Refresh base
2013 2014 2015 2016
EssenceRose (US)
Disney (US)
Rose (UK)
2017
Pic Sell-out % Pic Sell-out % Pic Sell-out % Pic Sell-out % Pic Sell-out %
1 17,6% 14,1% 14,4% 15,6% 18,4%
2 16,4% 13,7% 14,4% 11,2% 11,9%
3 16,3% 11,7% 10,6% 10,0% 9,6%
4 9,8% 10,8% 9,0% 9,0% 9,1%
5 9,5% 8,8% 8,2% 8,7% 8,9%
6 8,8% 7,9% 7,5% 8,7% 7,0%
7 8,5% 6,9% 6,3% 8,4% 6,7%
8 5,8% 5,9% 5,4% 8,2% 6,5%
9 4,4% 5,8% 5,1% 7,5% 4,8%
10 3,0% 5,3% 5,1% 3,8% 4,8%
Valentine's 2017Valentine's 2016Valentine's 2015Valentine's 2014Valentine's 2013
727 N/A
10
926 +37% 1208 -13% 1506 -7% 1462 -8%
13 171314
Rose (RoW)Disney (EMEA)Disney
(APAC)
Limited newness in concepts and base
Reset of business
Share ofnew DVs(2017)
Share ofnew DVs(2018-22)
0%
5%
95% ~80%
New functionality or design feature
~20%
FAST, TIMELY & WIDE DESIGN NEWNESS

63 | PANDORA CAPITAL MARKETS DAY | 16 JANUARY 2018
64
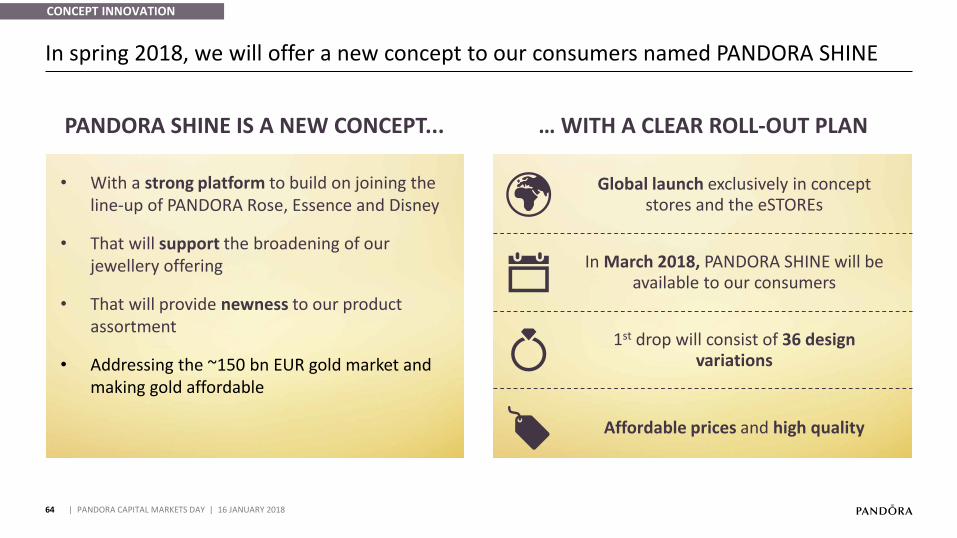
In spring 2018, we will offer a new concept to our consumers named PANDORA SHINE
| PANDORA CAPITAL MARKETS DAY | 16 JANUARY 2018
• With a strong platform to build on joining the line-up of PANDORA Rose, Essence and Disney
• That will support the broadening of our jewellery offering
• That will provide newness to our product assortment
Addressing the ~• 150 bn EUR gold market and making gold affordable
PANDORA SHINE IS A NEW CONCEPT...
Global launch exclusively in concept stores and the eSTOREs
1st drop will consist of 36 design variations
In March 2018, PANDORA SHINE will be available to our consumers
… WITH A CLEAR ROLL-OUT PLAN
Affordable prices and high quality
CONCEPT INNOVATION
65
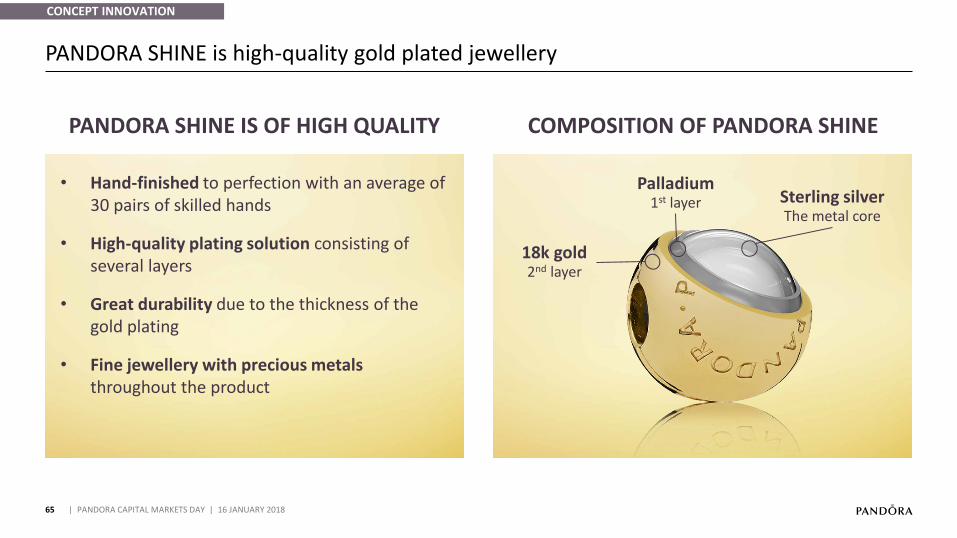
PANDORA SHINE is high-quality gold plated jewellery
| PANDORA CAPITAL MARKETS DAY | 16 JANUARY 2018
18k gold2nd layer
Palladium1st layer Sterling silver
The metal core
• Hand-finished to perfection with an average of 30 pairs of skilled hands
• High-quality plating solution consisting of several layers
• Great durability due to the thickness of the gold plating
• Fine jewellery with precious metals throughout the product
COMPOSITION OF PANDORA SHINEPANDORA SHINE IS OF HIGH QUALITY
CONCEPT INNOVATION

66 | PANDORA CAPITAL MARKETS DAY | 16 JANUARY 2018
67
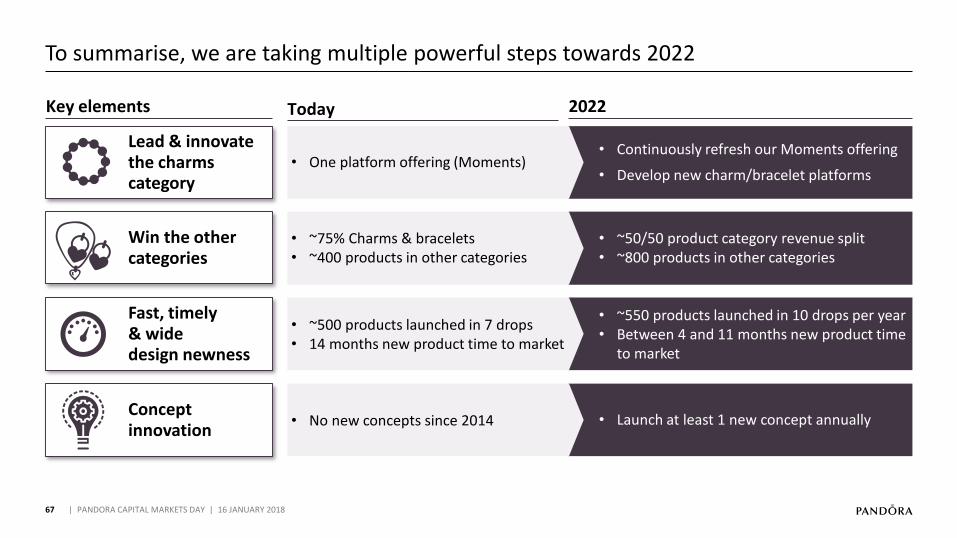
To summarise, we are taking multiple powerful steps towards 2022
| PANDORA CAPITAL MARKETS DAY | 16 JANUARY 2018
• Continuously refresh our Moments offering
• Develop new charm/bracelet platformsOne platform offering (Moments)•
Concept innovation
Win the other categories
Fast, timely & wide design newness
Lead & innovate the charms category
Key elements Today 2022
• ~50/50 product category revenue split• ~800 products in other categories
• ~75% Charms & bracelets• ~400 products in other categories
• ~550 products launched in 10 drops per year• Between 4 and 11 months new product time
to market
• ~500 products launched in 7 drops • 14 months new product time to market
• Launch at least 1 new concept annually• No new concepts since 2014
01
2017 PERFORMANCEAnders Colding Friis, President & CEO
02
NEW STRATEGY TOWARDS 2022Anders Colding Friis, President & CEO
07
FINANCIAL OUTLOOK TOWARDS 2022Peter Vekslund, EVP & CFO
06
WINNING IN OMNI-CHANNEL RETAILDavid Allen, President, EMEA
05
Minna Philipson, SVP & Chief Marketing Officer
DIGITALISED BRAND EXPERIENCE
03
Stephen Fairchild, SVP & Chief Creative Officer
INNOVATE AFFORDABLE JEWELLERY
68
04 | AGILE MANUFACTURING
| PANDORA CAPITAL MARKETS DAY | 16 JANUARY 2018
04
Thomas Touborg, SVP, Group Operations
AGILE MANUFACTURING
08
CLOSING REMARKSPeder Tuborgh, Chairman of the Board
69
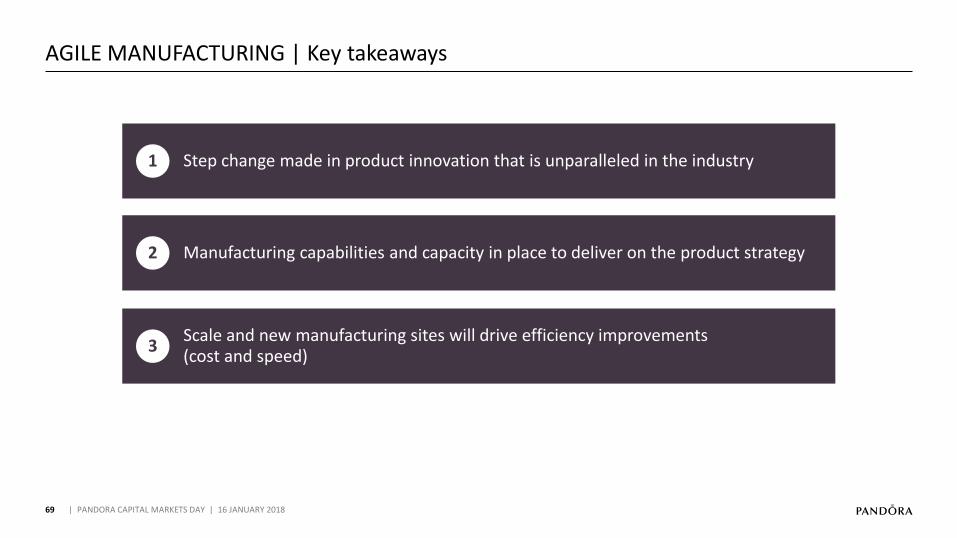
AGILE MANUFACTURING | Key takeaways
| PANDORA CAPITAL MARKETS DAY | 16 JANUARY 2018
1 Step change made in product innovation that is unparalleled in the industry
2 Manufacturing capabilities and capacity in place to deliver on the product strategy
3Scale and new manufacturing sites will drive efficiency improvements (cost and speed)

70 | PANDORA CAPITAL MARKETS DAY | 16 JANUARY 2018
Next level productinnovation
71
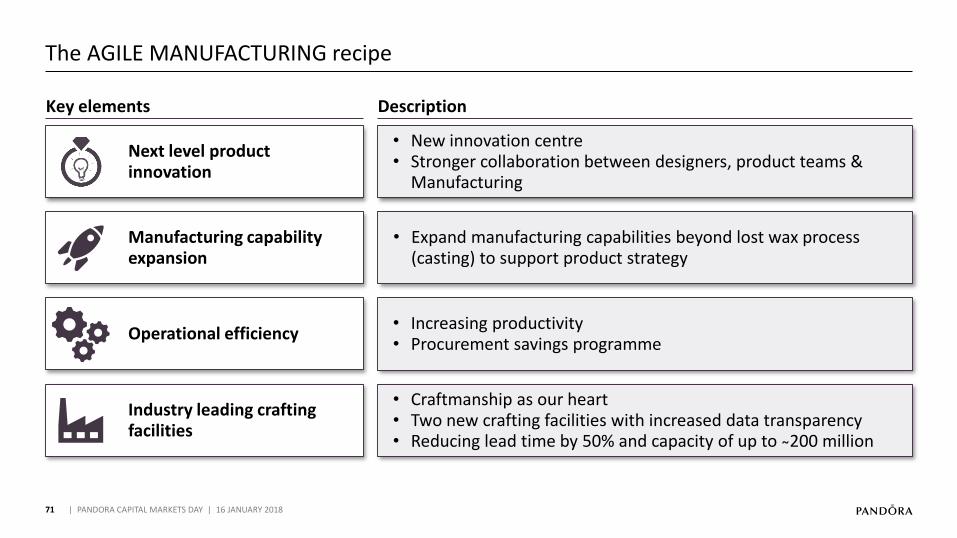
The AGILE MANUFACTURING recipe
| PANDORA CAPITAL MARKETS DAY | 16 JANUARY 2018
• Expand manufacturing capabilities beyond lost wax process (casting) to support product strategy
• Increasing productivity• Procurement savings programme
• New innovation centre• Stronger collaboration between designers, product teams &
Manufacturing
Description
Manufacturing capability expansion
Operational efficiency
Key elements
• Craftmanship as our heart Two new crafting facilities with increased data transparency•Reducing lead time by • 50% and capacity of up to ̴200 million
Industry leading crafting facilities
72 | PANDORA CAPITAL MARKETS DAY | 16 JANUARY 2018
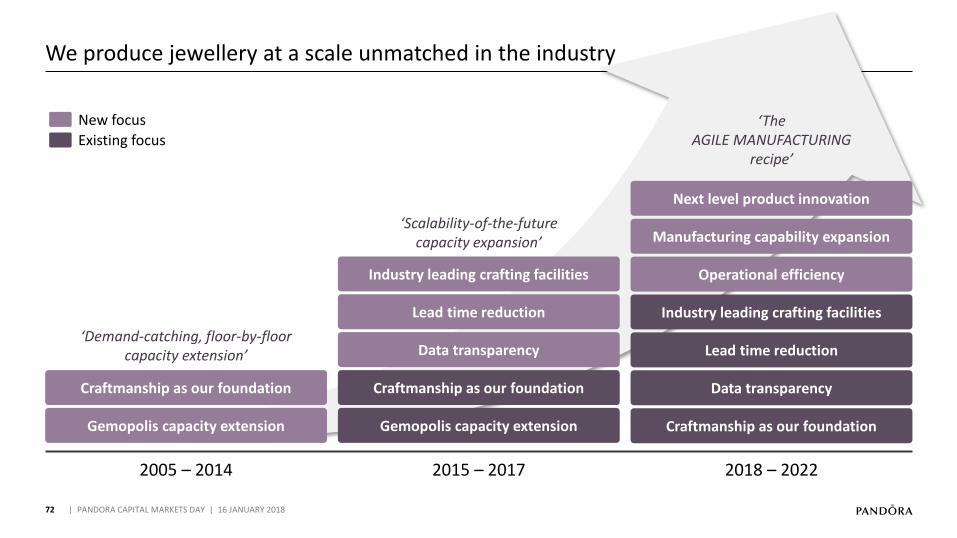
2005 – 2014 2015 – 2017 2018 – 2022
‘Demand-catching, floor-by-floor capacity extension’
‘Scalability-of-the-futurecapacity expansion’
‘TheAGILE MANUFACTURING
recipe’
Gemopolis capacity extension Gemopolis capacity extension
Data transparency
Lead time reduction
Industry leading crafting facilities
Data transparency
Lead time reduction
Industry leading crafting facilities
Operational efficiency
Manufacturing capability expansion
Next level product innovation
Craftmanship as our foundation Craftmanship as our foundation
Craftmanship as our foundation
New focus
Existing focus
We produce jewellery at a scale unmatched in the industry
73
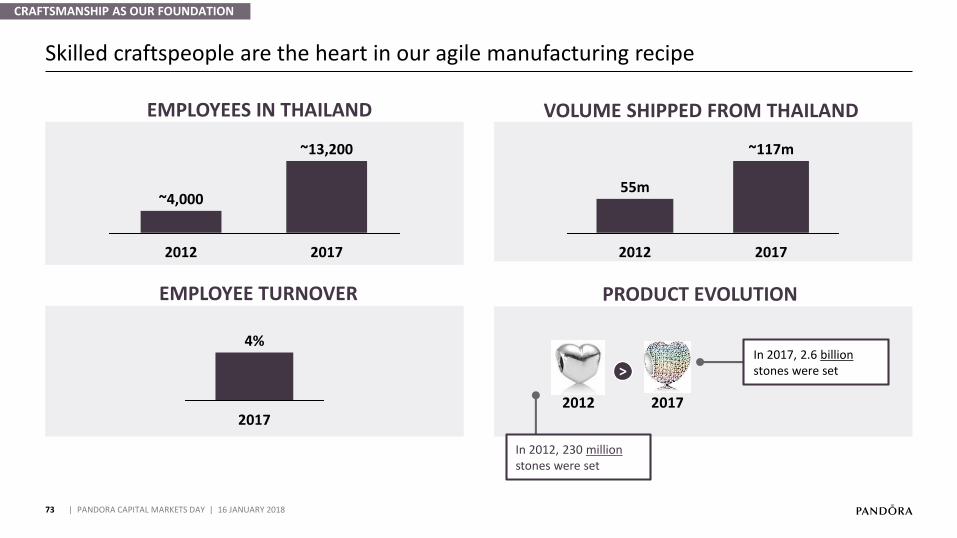
Skilled craftspeople are the heart in our agile manufacturing recipe
| PANDORA CAPITAL MARKETS DAY | 16 JANUARY 2018
PRODUCT EVOLUTION
EMPLOYEES IN THAILAND
EMPLOYEE TURNOVER
VOLUME SHIPPED FROM THAILAND
2012
~4,000
~13,200
2017
55m
2012
~117m
2017
2017
4%
2012 2017
>In 2017, 2.6 billionstones were set
In 2012, 230 millionstones were set
CRAFTSMANSHIP AS OUR FOUNDATION
74
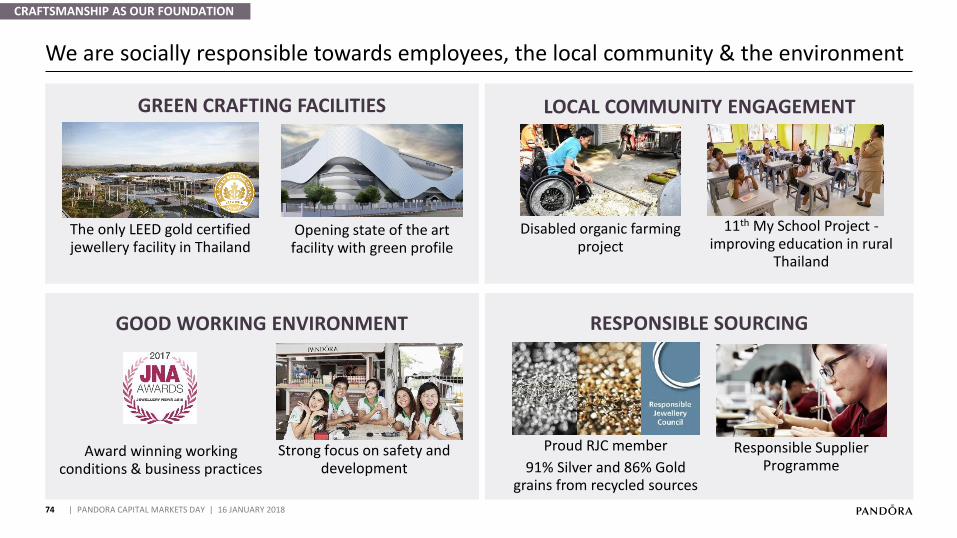
We are socially responsible towards employees, the local community & the environment
| PANDORA CAPITAL MARKETS DAY | 16 JANUARY 2018
CRAFTSMANSHIP AS OUR FOUNDATION
GOOD WORKING ENVIRONMENT RESPONSIBLE SOURCING
GREEN CRAFTING FACILITIES LOCAL COMMUNITY ENGAGEMENT
The only LEED gold certified jewellery facility in Thailand
Opening state of the art facility with green profile
Disabled organic farming project
11th My School Project -improving education in rural
Thailand
Award winning working conditions & business practices
Strong focus on safety and development
Proud RJC member
91% Silver and 86% Gold grains from recycled sources
Responsible Supplier Programme
75
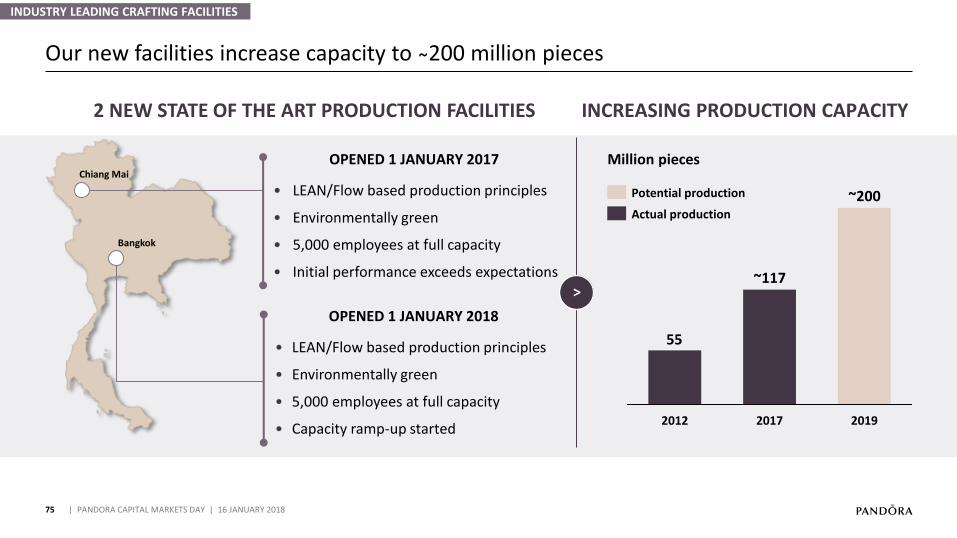
Our new facilities increase capacity to ̴200 million pieces
| PANDORA CAPITAL MARKETS DAY | 16 JANUARY 2018
INDUSTRY LEADING CRAFTING FACILITIES
OPENED 1 JANUARY 2017
• LEAN/Flow based production principles
• Environmentally green
• 5,000 employees at full capacity
• Initial performance exceeds expectations
OPENED 1 JANUARY 2018
• LEAN/Flow based production principles
• Environmentally green
• 5,000 employees at full capacity
• Capacity ramp-up started
Bangkok
Chiang Mai
55
2019
~200
2017
~117
2012
Actual production
Potential production
>
INCREASING PRODUCTION CAPACITY2 NEW STATE OF THE ART PRODUCTION FACILITIES
Million pieces
76
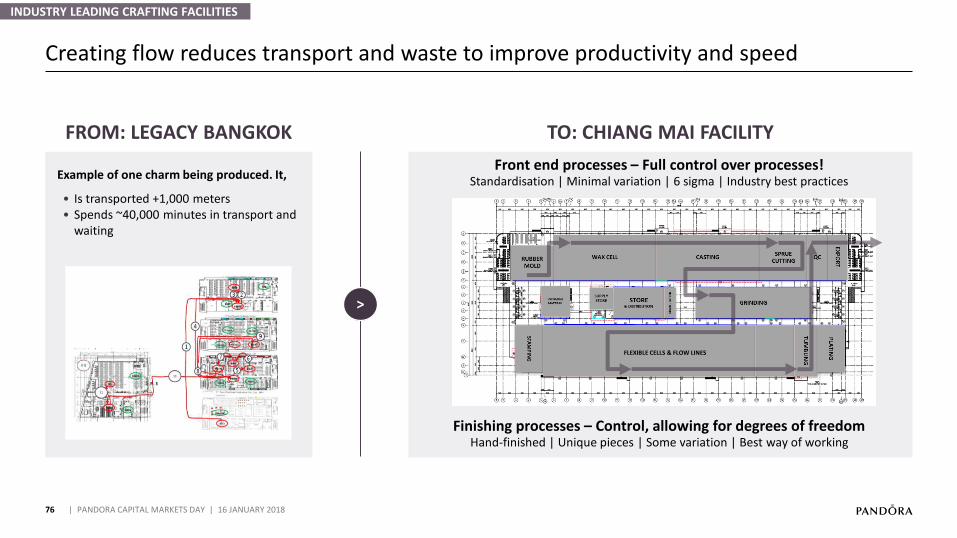
Creating flow reduces transport and waste to improve productivity and speed
| PANDORA CAPITAL MARKETS DAY | 16 JANUARY 2018
Example of one charm being produced. It,
Is transported +• 1,000 metersSpends ~• 40,000 minutes in transport and waiting
FROM: LEGACY BANGKOK TO: CHIANG MAI FACILITY
Front end processes – Full control over processes!Standardisation | Minimal variation | 6 sigma | Industry best practices
Finishing processes – Control, allowing for degrees of freedomHand-finished | Unique pieces | Some variation | Best way of working
FLEXIBLE CELLS & FLOW LINES
>
INDUSTRY LEADING CRAFTING FACILITIES

77 | PANDORA CAPITAL MARKETS DAY | 16 JANUARY 2018
78
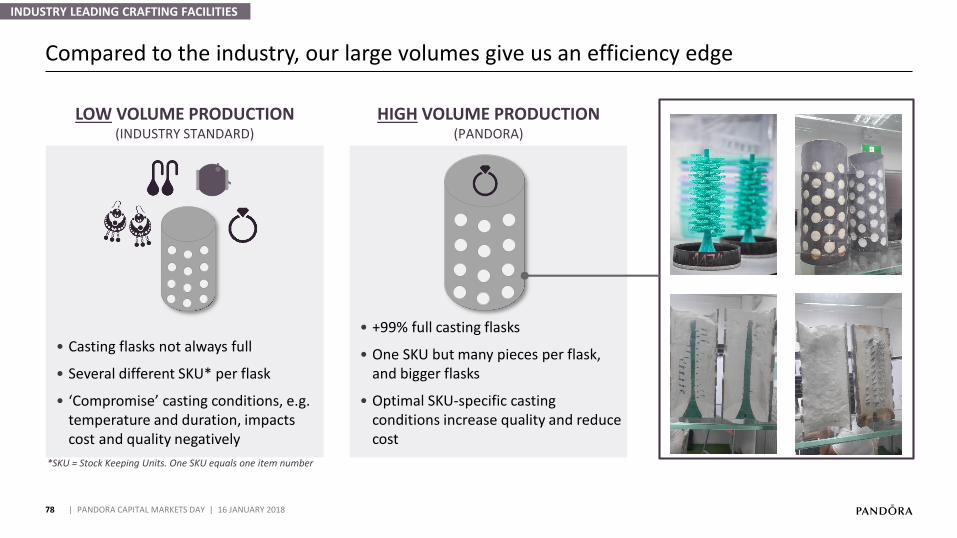
Compared to the industry, our large volumes give us an efficiency edge
| PANDORA CAPITAL MARKETS DAY | 16 JANUARY 2018
LOW VOLUME PRODUCTION(INDUSTRY STANDARD)
• Casting flasks not always full
• Several different SKU* per flask
• ‘Compromise’ casting conditions, e.g. temperature and duration, impacts cost and quality negatively
HIGH VOLUME PRODUCTION(PANDORA)
• +99% full casting flasks
One SKU but many pieces per flask, •and bigger flasks
Optimal SKU• -specific casting conditions increase quality and reduce cost
INDUSTRY LEADING CRAFTING FACILITIES
*SKU = Stock Keeping Units. One SKU equals one item number
79
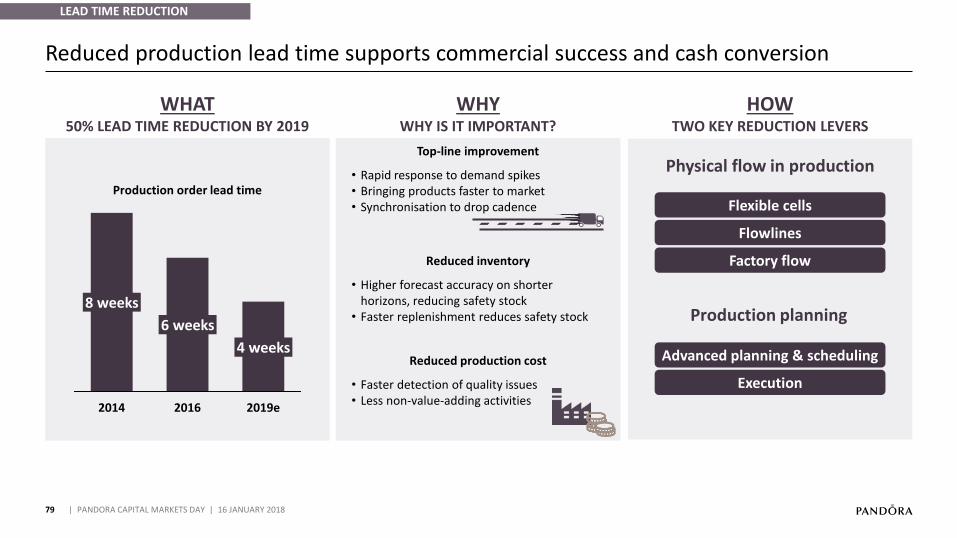
Reduced production lead time supports commercial success and cash conversion
| PANDORA CAPITAL MARKETS DAY | 16 JANUARY 2018
LEAD TIME REDUCTION
WHYWHY IS IT IMPORTANT?
Top-line improvement
Rapid response to demand spikes•
Bringing products faster to market•
Synchronisation• to drop cadence
Reduced inventory
• Higher forecast accuracy on shorter horizons, reducing safety stock
• Faster replenishment reduces safety stock
Reduced production cost
• Faster detection of quality issues• Less non-value-adding activities
WHAT50% LEAD TIME REDUCTION BY 2019
2016
8 weeks
2019e
4 weeks
6 weeks
2014
Production order lead time
Physical flow in production
Production planning
Flexible cells
Flowlines
Execution
Factory flow
HOWTWO KEY REDUCTION LEVERS
Advanced planning & scheduling
80
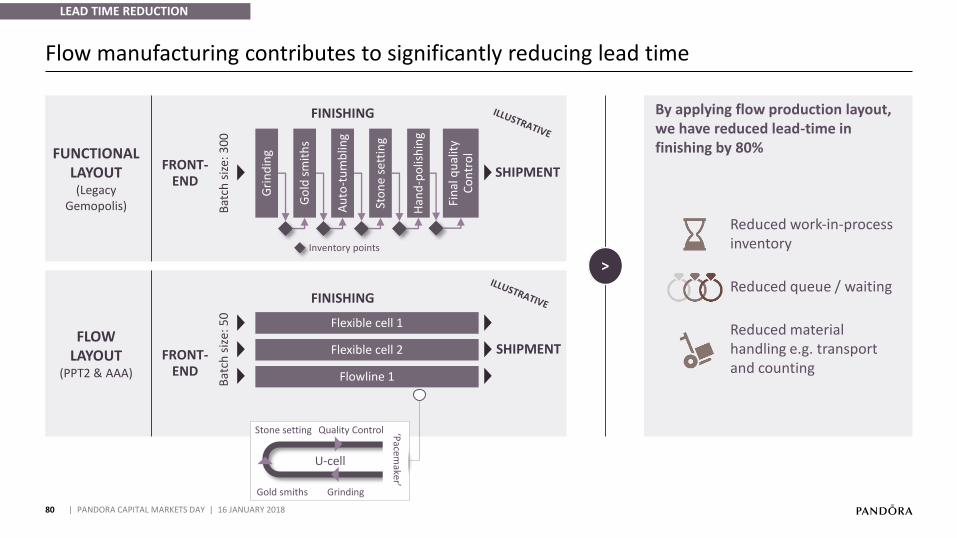
Flow manufacturing contributes to significantly reducing lead time
| PANDORA CAPITAL MARKETS DAY | 16 JANUARY 2018
LEAD TIME REDUCTION
Flexible cell 2
Flowline 1
Flexible cell 1
FRONT-END
FINISHING
SHIPMENT
Gri
nd
ing
Go
ld s
mit
hs
Au
to-t
um
blin
g
Sto
ne
sett
ing
Han
d-p
olis
hin
g
FINISHING
By applying flow production layout, we have reduced lead-time in finishing by 80%
Reduced work-in-process inventory
Reduced queue / waiting
Reduced material handling e.g. transport and counting
FUNCTIONAL LAYOUT(Legacy
Gemopolis)
FLOW LAYOUT
(PPT2 & AAA)
U-cell
GrindingGold smiths
Bat
ch s
ize:
50
Bat
ch s
ize:
30
0
Inventory points
FRONT-END
SHIPMENT
>
Fin
al q
ual
ity
Co
ntr
ol
Stone setting Quality Control ‘Pacem
aker’
81
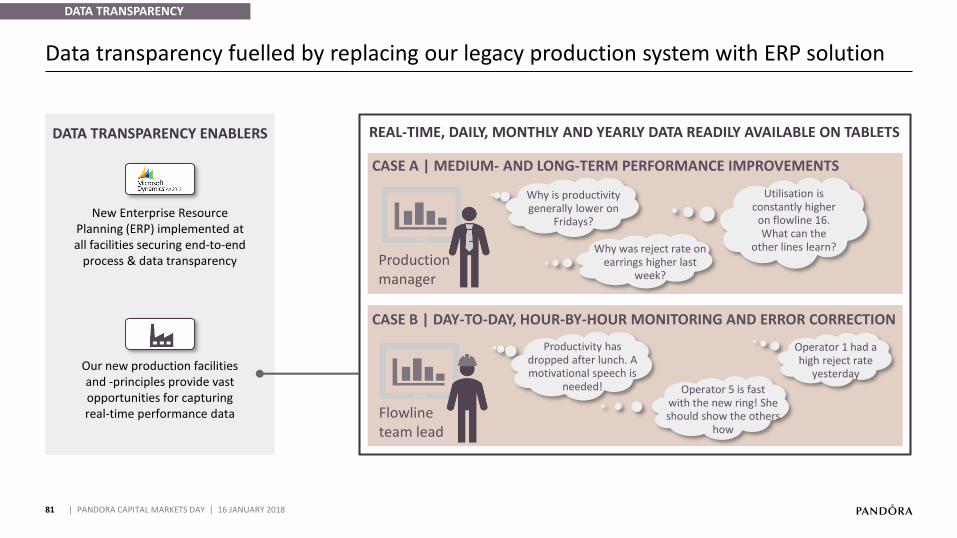
Data transparency fuelled by replacing our legacy production system with ERP solution
| PANDORA CAPITAL MARKETS DAY | 16 JANUARY 2018
DATA TRANSPARENCY
Focus on floor management
Focus on floor management
DATA TRANSPARENCY ENABLERS
New Enterprise Resource Planning (ERP) implemented at all facilities securing end-to-end
process & data transparency
Our new production facilities and -principles provide vast opportunities for capturing real-time performance data
CASE A | MEDIUM- AND LONG-TERM PERFORMANCE IMPROVEMENTS
CASE B | DAY-TO-DAY, HOUR-BY-HOUR MONITORING AND ERROR CORRECTION
Utilisation isconstantly higher
on flowline 16.What can the
other lines learn?
Operator 1 had a high reject rate
yesterday
Operator 5 is fast with the new ring! She should show the others
how
Productivity has dropped after lunch. A motivational speech is
needed!
Why is productivity generally lower on
Fridays?
Why was reject rate on earrings higher last
week?Production manager
Flowlineteam lead
REAL-TIME, DAILY, MONTHLY AND YEARLY DATA READILY AVAILABLE ON TABLETS
82
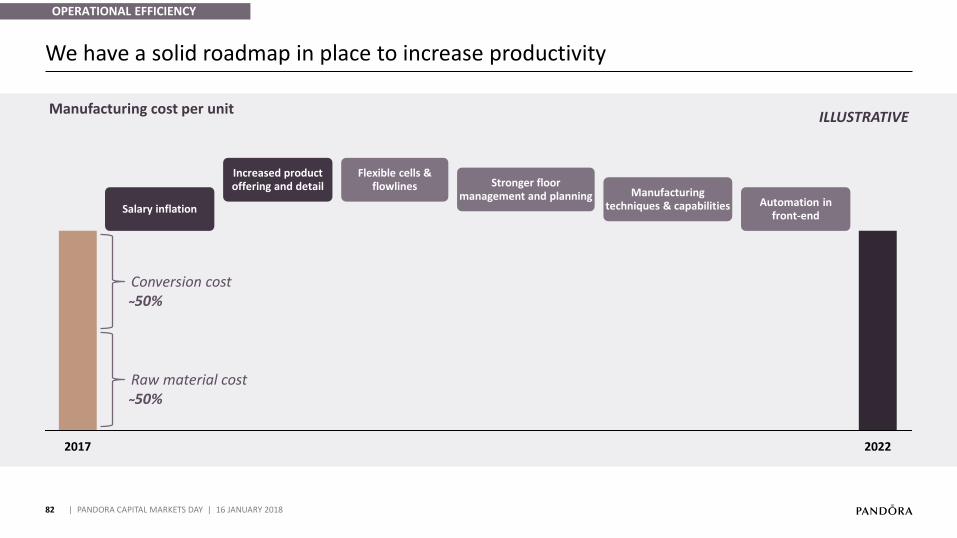
We have a solid roadmap in place to increase productivity
| PANDORA CAPITAL MARKETS DAY | 16 JANUARY 2018
OPERATIONAL EFFICIENCY
20222017
Automation in front-end
Stronger floor management and planning Manufacturing
techniques & capabilities
Flexible cells & flowlines
Salary inflation
Increased product offering and detail
ILLUSTRATIVEManufacturing cost per unit
Raw material cost ̴50%
Conversion cost ̴50%
83
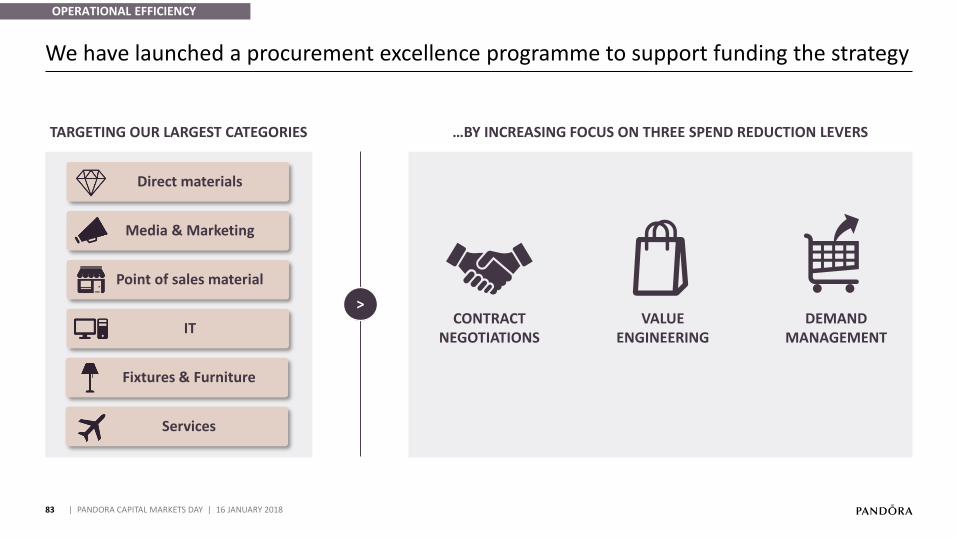
We have launched a procurement excellence programme to support funding the strategy
| PANDORA CAPITAL MARKETS DAY | 16 JANUARY 2018
OPERATIONAL EFFICIENCY
TARGETING OUR LARGEST CATEGORIES
>
…BY INCREASING FOCUS ON THREE SPEND REDUCTION LEVERS
Direct materials
Services
Fixtures & Furniture
IT
Point of sales material
Media & Marketing
DEMANDMANAGEMENT
VALUEENGINEERING
CONTRACTNEGOTIATIONS
84
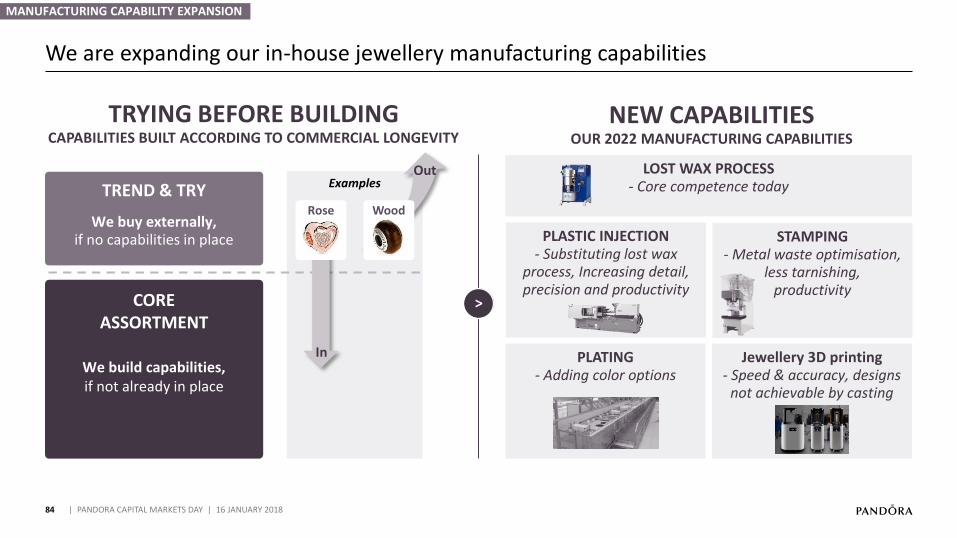
We are expanding our in-house jewellery manufacturing capabilities
| PANDORA CAPITAL MARKETS DAY | 16 JANUARY 2018
Examples
Jewellery 3D printing- Speed & accuracy, designs
not achievable by casting
PLASTIC INJECTION- Substituting lost wax
process, Increasing detail, precision and productivity
PLATING- Adding color options
STAMPING- Metal waste optimisation,
less tarnishing,productivity
>
Rose Wood
COREASSORTMENT
We build capabilities, if not already in place
TREND & TRY
We buy externally,if no capabilities in place
TRYING BEFORE BUILDINGCAPABILITIES BUILT ACCORDING TO COMMERCIAL LONGEVITY
NEW CAPABILITIESOUR 2022 MANUFACTURING CAPABILITIES
Out
In
MANUFACTURING CAPABILITY EXPANSION
LOST WAX PROCESS- Core competence today

85 | PANDORA CAPITAL MARKETS DAY | 16 JANUARY 2018
86
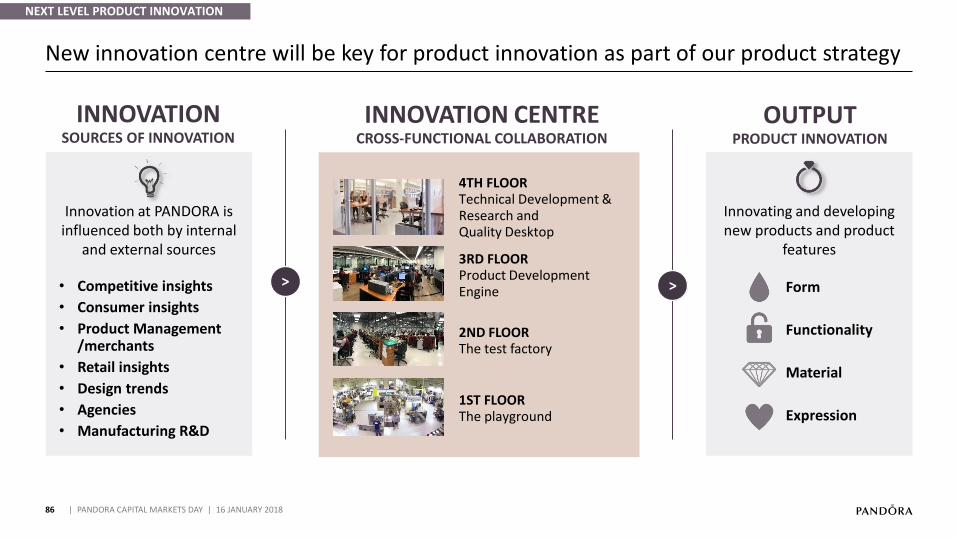
New innovation centre will be key for product innovation as part of our product strategy
| PANDORA CAPITAL MARKETS DAY | 16 JANUARY 2018
NEXT LEVEL PRODUCT INNOVATION
1ST FLOORThe playground
2ND FLOORThe test factory
3RD FLOORProduct Development Engine
4TH FLOOR Technical Development & Research and Quality Desktop
Innovation at PANDORA is influenced both by internal
and external sources
• Competitive insights
• Consumer insights
• Product Management /merchants
• Retail insights
• Design trends
• Agencies
• Manufacturing R&D
>
Innovating and developingnew products and product
features
Material
Functionality
Form
Expression
>
INNOVATIONSOURCES OF INNOVATION
OUTPUTPRODUCT INNOVATION
INNOVATION CENTRECROSS-FUNCTIONAL COLLABORATION
Next level productinnovation
87
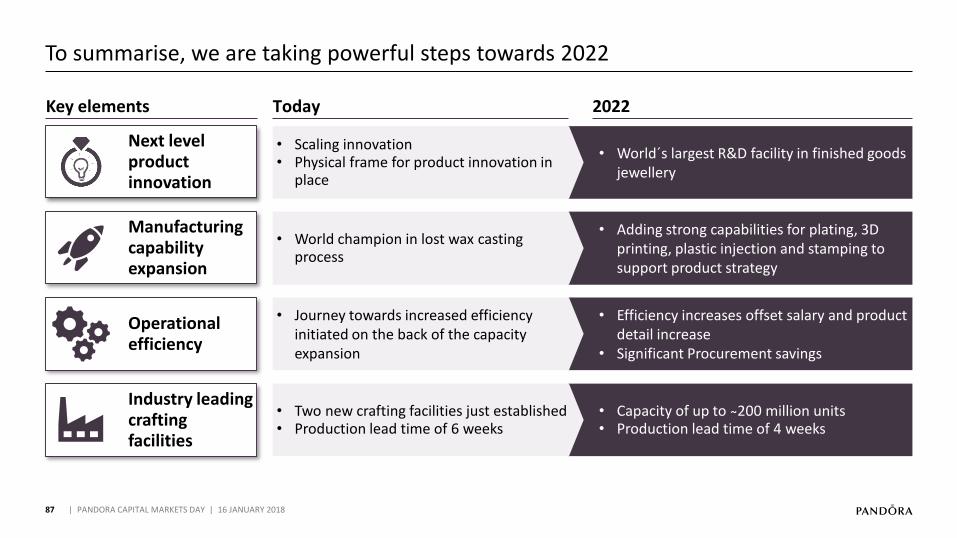
To summarise, we are taking powerful steps towards 2022
| PANDORA CAPITAL MARKETS DAY | 16 JANUARY 2018
Manufacturing capability expansion
Operational efficiency
Key elements
World• ´s largest R&D facility in finished goods jewellery
• Scaling innovation• Physical frame for product innovation in
place
Today 2022
• Adding strong capabilities for plating, 3D printing, plastic injection and stamping to support product strategy
• World champion in lost wax casting process
• Efficiency increases offset salary and product detail increase
• Significant Procurement savings
Journey towards increased efficiency •
initiated on the back of the capacity expansion
Industry leading crafting facilities
Capacity of up to • ̴200 million unitsProduction lead time of • 4 weeks
• Two new crafting facilities just established• Production lead time of 6 weeks
01
2017 PERFORMANCEAnders Colding Friis, President & CEO
02
NEW STRATEGY TOWARDS 2022Anders Colding Friis, President & CEO
07
FINANCIAL OUTLOOK TOWARDS 2022Peter Vekslund, EVP & CFO
06
WINNING IN OMNI-CHANNEL RETAILDavid Allen, President, EMEA
05
Minna Philipson, SVP & Chief Marketing Officer
DIGITALISED BRAND EXPERIENCE
03
Stephen Fairchild, SVP & Chief Creative Officer
INNOVATE AFFORDABLE JEWELLERY
88
05 | DIGITALISED BRAND EXPERIENCE
| PANDORA CAPITAL MARKETS DAY | 16 JANUARY 2018
04
Thomas Touborg, SVP, Group Operations
AGILE MANUFACTURING
08
CLOSING REMARKSPeder Tuborgh, Chairman of the Board
89
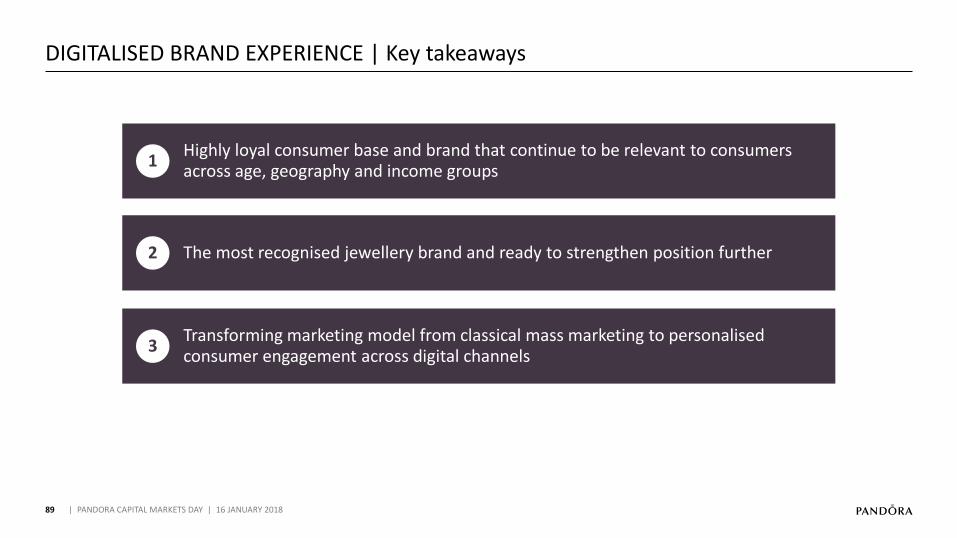
DIGITALISED BRAND EXPERIENCE | Key takeaways
| PANDORA CAPITAL MARKETS DAY | 16 JANUARY 2018
1Highly loyal consumer base and brand that continue to be relevant to consumers across age, geography and income groups
2 The most recognised jewellery brand and ready to strengthen position further
3Transforming marketing model from classical mass marketing to personalised consumer engagement across digital channels
90
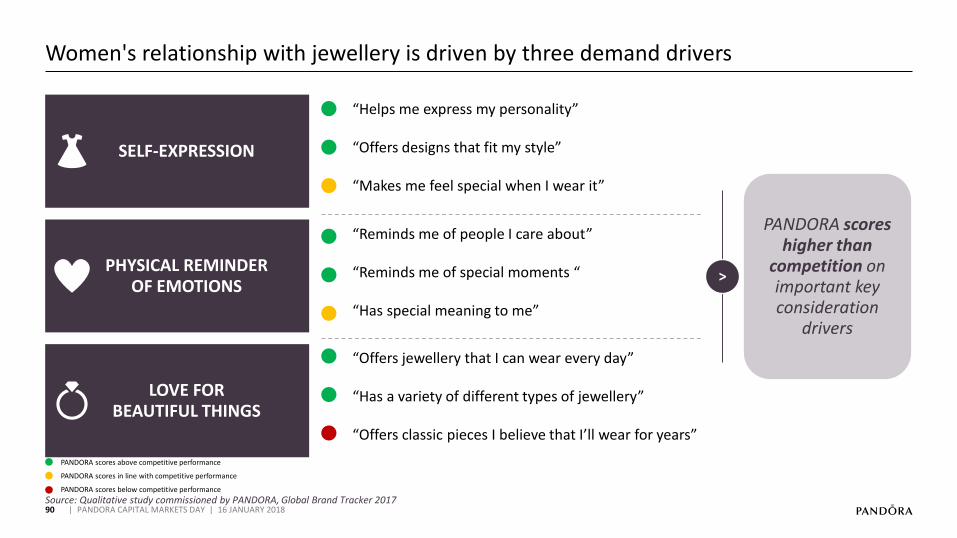
Women's relationship with jewellery is driven by three demand drivers
| PANDORA CAPITAL MARKETS DAY | 16 JANUARY 2018
SELF-EXPRESSION
“Helps me express my personality”
“Offers designs that fit my style”
“Makes me feel special when I wear it”
PHYSICAL REMINDEROF EMOTIONS
LOVE FORBEAUTIFUL THINGS
“Reminds me of people I care about”
“Reminds me of special moments “
“Has special meaning to me”
“Offers jewellery that I can wear every day”
“Has a variety of different types of jewellery”
“Offers classic pieces I believe that I’ll wear for years”
PANDORA scores higher than
competition on important key consideration
drivers
Source: Qualitative study commissioned by PANDORA, Global Brand Tracker 2017
PANDORA scores above competitive performance
PANDORA scores in line with competitive performance
PANDORA scores below competitive performance
>
91
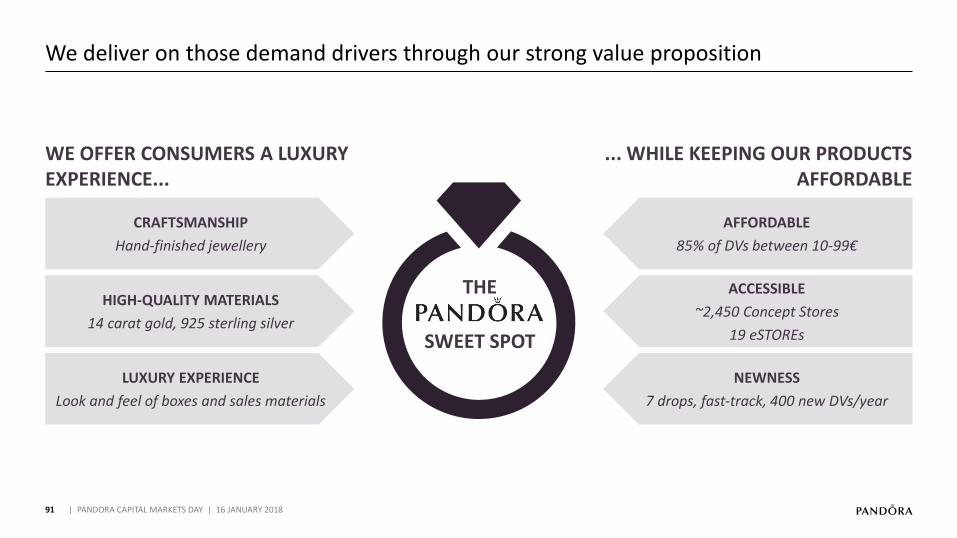
We deliver on those demand drivers through our strong value proposition
| PANDORA CAPITAL MARKETS DAY | 16 JANUARY 2018
WE OFFER CONSUMERS A LUXURY EXPERIENCE...
... WHILE KEEPING OUR PRODUCTS AFFORDABLE
THE
SWEET SPOT
CRAFTSMANSHIP
Hand-finished jewellery
HIGH-QUALITY MATERIALS
14 carat gold, 925 sterling silver
LUXURY EXPERIENCE
Look and feel of boxes and sales materials
AFFORDABLE
85% of DVs between 10-99€
ACCESSIBLE
~2,450 Concept Stores
19 eSTOREs
NEWNESS
7 drops, fast-track, 400 new DVs/year
92
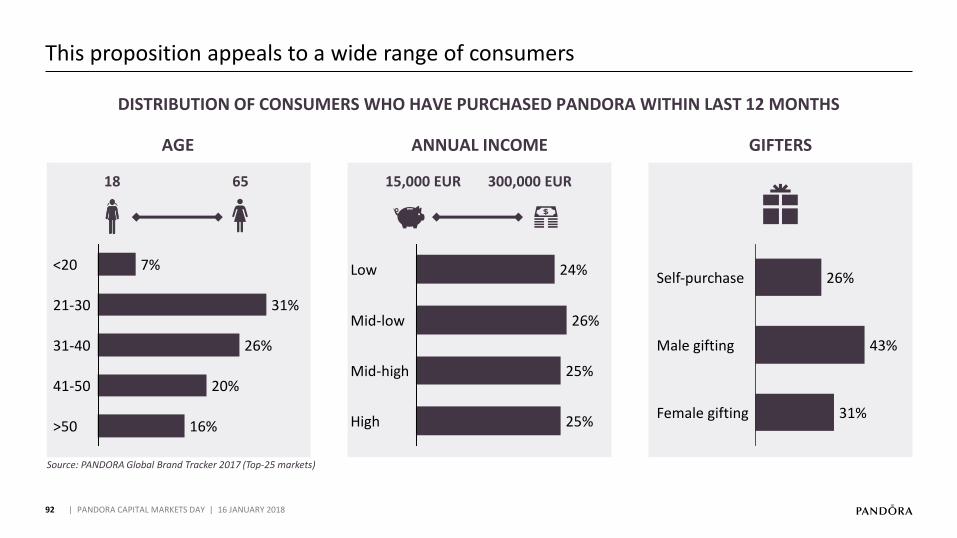
This proposition appeals to a wide range of consumers
| PANDORA CAPITAL MARKETS DAY | 16 JANUARY 2018
AGE ANNUAL INCOME
31%
31-40
7%<20
41-50 20%
21-30
26%
>50 16% High 25%
Mid-high 25%
26%
Low
Mid-low
24%
Source: PANDORA Global Brand Tracker 2017 (Top-25 markets)
15,000 EUR 300,000 EUR18 65
DISTRIBUTION OF CONSUMERS WHO HAVE PURCHASED PANDORA WITHIN LAST 12 MONTHS
GIFTERS
43%
Female gifting
26%Self-purchase
Male gifting
31%
93
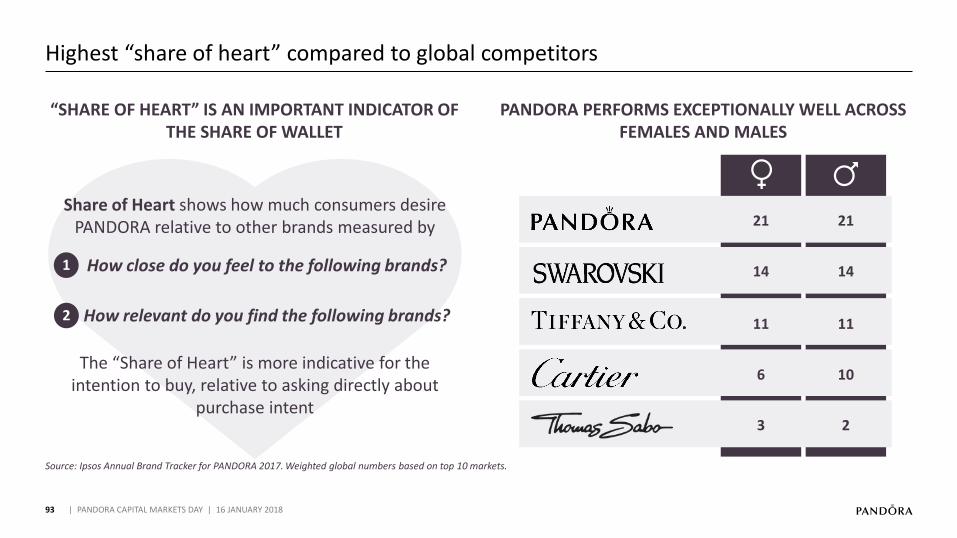
Highest “share of heart” compared to global competitors
| PANDORA CAPITAL MARKETS DAY | 16 JANUARY 2018
Source: Ipsos Annual Brand Tracker for PANDORA 2017. Weighted global numbers based on top 10 markets.
PANDORA PERFORMS EXCEPTIONALLY WELL ACROSS FEMALES AND MALES
“SHARE OF HEART” IS AN IMPORTANT INDICATOR OF THE SHARE OF WALLET
21
14
11
6
3
21
14
11
10
2
Share of Heart shows how much consumers desire PANDORA relative to other brands measured by
How close do you feel to the following brands?
How relevant do you find the following brands?
The “Share of Heart” is more indicative for the intention to buy, relative to asking directly about
purchase intent
1
2
94
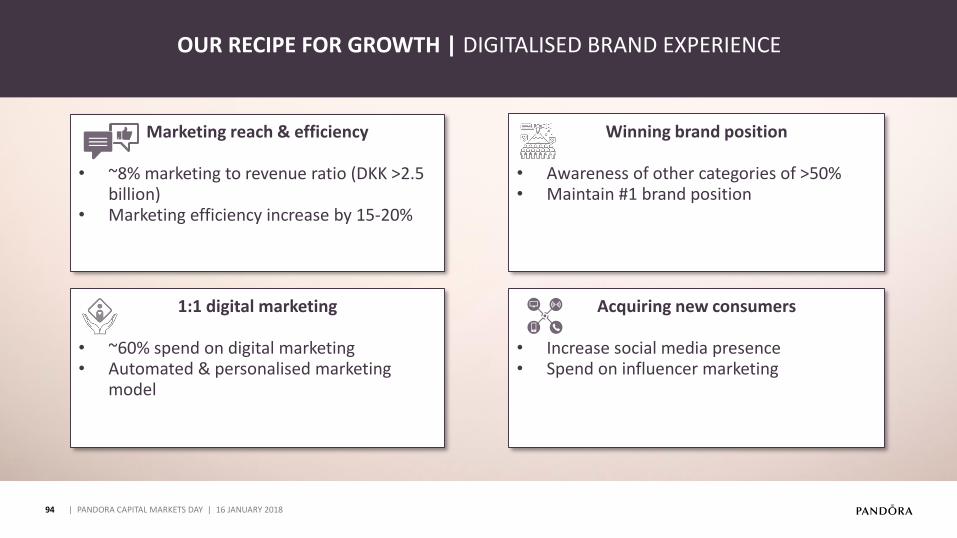
XXX
| PANDORA CAPITAL MARKETS DAY | 16 JANUARY 2018
Acquiring new consumers
• Increase social media presence• Spend on influencer marketing
1:1 digital marketing
• ~60% spend on digital marketing• Automated & personalised marketing
model
OUR RECIPE FOR GROWTH | DIGITALISED BRAND EXPERIENCE
Marketing reach & efficiency
• ~8% marketing to revenue ratio (DKK >2.5 billion)Marketing efficiency increase by • 15-20%
Winning brand position
Awareness of other categories of >• 50%Maintain #• 1 brand position
95
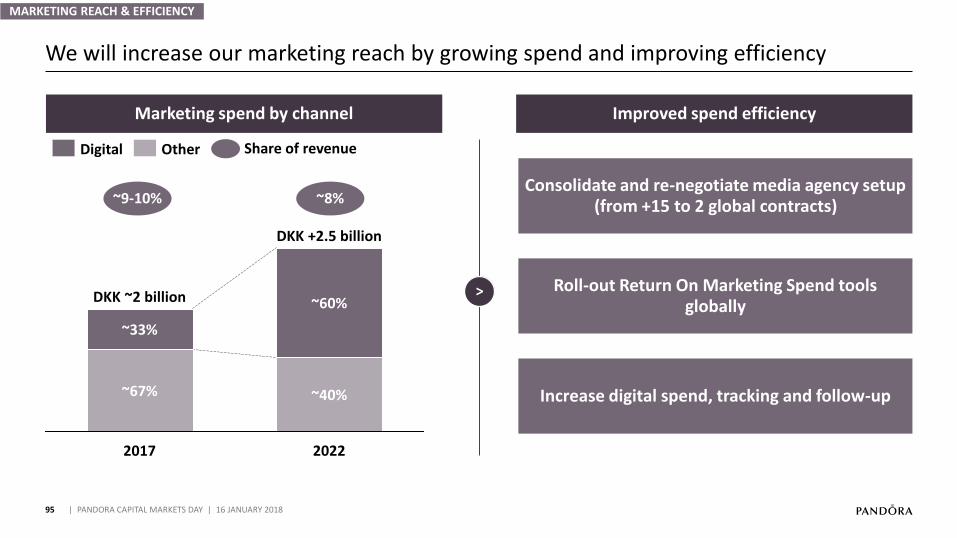
We will increase our marketing reach by growing spend and improving efficiency
| PANDORA CAPITAL MARKETS DAY | 16 JANUARY 2018
Marketing spend by channel
>
Improved spend efficiency
~67%
DKK ~2 billion
~33%
2022
~60%
2017
DKK +2.5 billion
~40%
Digital Other Share of revenue
~9-10% ~8%Consolidate and re-negotiate media agency setup
(from +15 to 2 global contracts)
Increase digital spend, tracking and follow-up
Roll-out Return On Marketing Spend tools globally
MARKETING REACH & EFFICIENCY
… WHILE EVOLVING OUR CONSUMER PERCEPTION TOWARDS A FULL JEWELLERY COMPANY
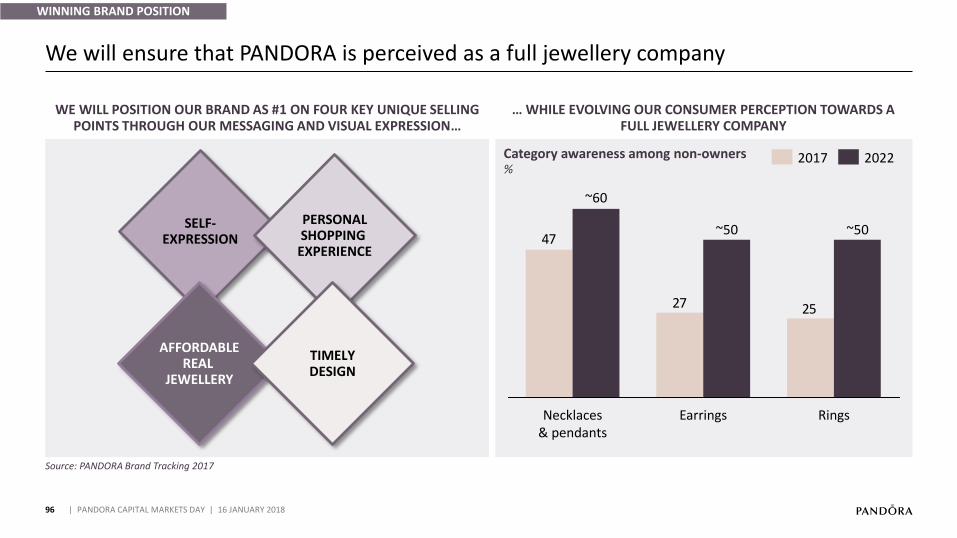
WE WILL POSITION OUR BRAND AS #1 ON FOUR KEY UNIQUE SELLING POINTS THROUGH OUR MESSAGING AND VISUAL EXPRESSION…
96
Source: PANDORA Brand Tracking 2017
We will ensure that PANDORA is perceived as a full jewellery company
| PANDORA CAPITAL MARKETS DAY | 16 JANUARY 2018
WINNING BRAND POSITION
SELF-EXPRESSION
AFFORDABLEREAL
JEWELLERY
PERSONALSHOPPING
EXPERIENCE
TIMELYDESIGN
2527
47
~60
~50
Necklaces & pendants
Rings
~50
Earrings
20222017Category awareness among non-owners%
97
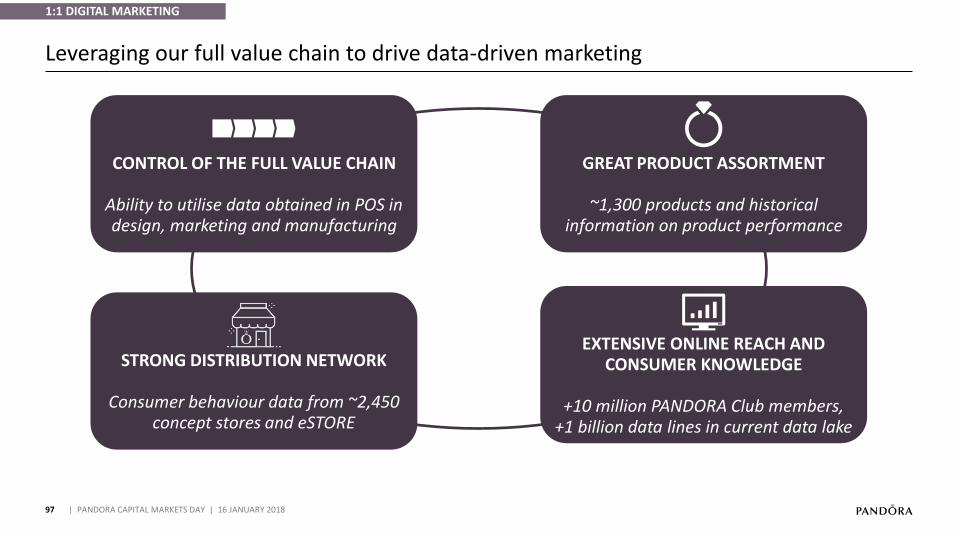
Leveraging our full value chain to drive data-driven marketing
| PANDORA CAPITAL MARKETS DAY | 16 JANUARY 2018
CONTROL OF THE FULL VALUE CHAIN
Ability to utilise data obtained in POS in design, marketing and manufacturing
GREAT PRODUCT ASSORTMENT
~1,300 products and historical information on product performance
STRONG DISTRIBUTION NETWORK
Consumer behaviour data from ~2,450 concept stores and eSTORE
EXTENSIVE ONLINE REACH AND CONSUMER KNOWLEDGE
+10 million PANDORA Club members,+1 billion data lines in current data lake
1:1 DIGITAL MARKETING
98
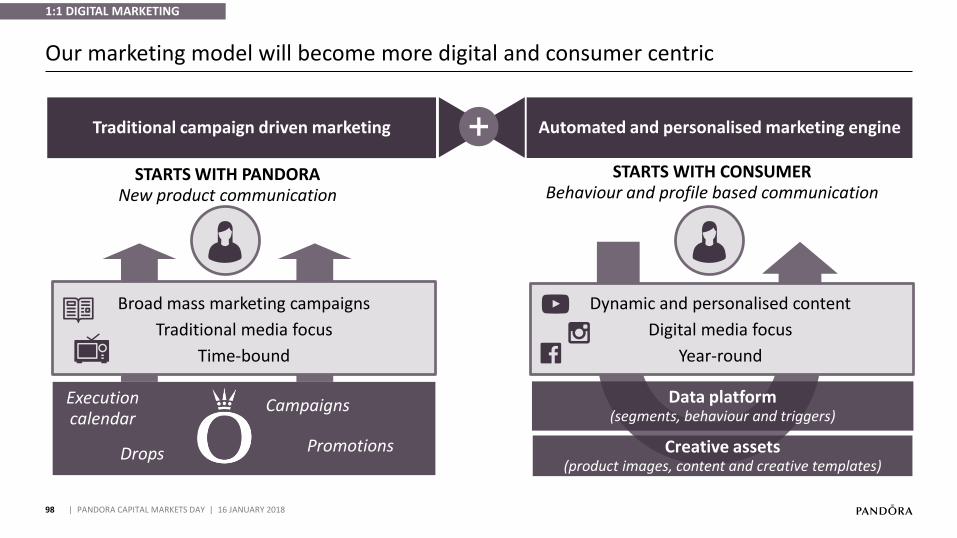
Our marketing model will become more digital and consumer centric
| PANDORA CAPITAL MARKETS DAY | 16 JANUARY 2018
Traditional campaign driven marketing Automated and personalised marketing engine
Broad mass marketing campaigns
Traditional media focus
Time-bound
Creative assets (product images, content and creative templates)
Drops
Campaigns
Promotions
STARTS WITH PANDORANew product communication
STARTS WITH CONSUMERBehaviour and profile based communication
1:1 DIGITAL MARKETING
Data platform (segments, behaviour and triggers)
Dynamic and personalised content
Digital media focus
Year-round
Execution calendar
99
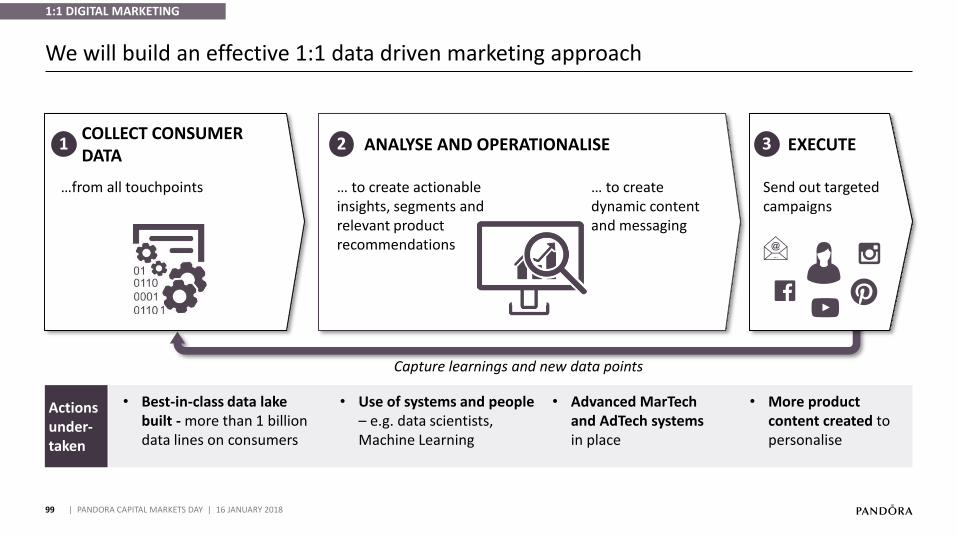
We will build an effective 1:1 data driven marketing approach
| PANDORA CAPITAL MARKETS DAY | 16 JANUARY 2018
COLLECT CONSUMER DATA
1 EXECUTE3
… to create actionable insights, segments and relevant product recommendations
… to create dynamic content and messaging
ANALYSE AND OPERATIONALISE2
…from all touchpoints Send out targeted campaigns
Capture learnings and new data points
Actions under-taken
• Best-in-class data lake built - more than 1 billion data lines on consumers
• Use of systems and people – e.g. data scientists, Machine Learning
• Advanced MarTechand AdTech systems in place
More product •
content created to personalise
1:1 DIGITAL MARKETING

100
We will deliver truly personal activations with the 1:1 digital marketing approach
| PANDORA CAPITAL MARKETS DAY | 16 JANUARY 2018
Examples (non-exhaustive)
Dynamic image space based on segment profile (demographics, collection or product preference)
Relevant messaging based on life stage / event
Gifting-related creative and messaging
Personal call to action: “Give her the gift…”
Pre-allocated gifting set to ease the choice
Personal recognition based on consumer data – “Dear Jennifer, get the perfect BIRTHDAY gift”
Targeted product recommendations based on previous purchases and wishlist
C
D
E
C
D
E
F
GF
G
A B
A
BPAID DISPLAYS
WEBSITE
EMAIL MARKETING
FOCUS AREAS
1:1 DIGITAL MARKETING

101
Targeted emails will significantly increase repurchases
| PANDORA CAPITAL MARKETS DAY | 16 JANUARY 2018
E-mail from pilot (sent to ~7,000 consumers)
Specific products from the •
recipients PANDORA wishlist
1
1
2
43
• Greeting the recipient by name
2
Stating that it is a very •
limited offer, only available for PANDORA’s most loyal consumers
3
>
Pilot results
Open rate
Click-to-open rate
Conver-sion rate
PANDORA benchmark
Market benchmark
Pilot result
22.0% 25.1%49.7%
+126%
18.8% 12.9%33.7%
+79%
0.1%
6.4%
+6,300%
1:1 DIGITAL MARKETING
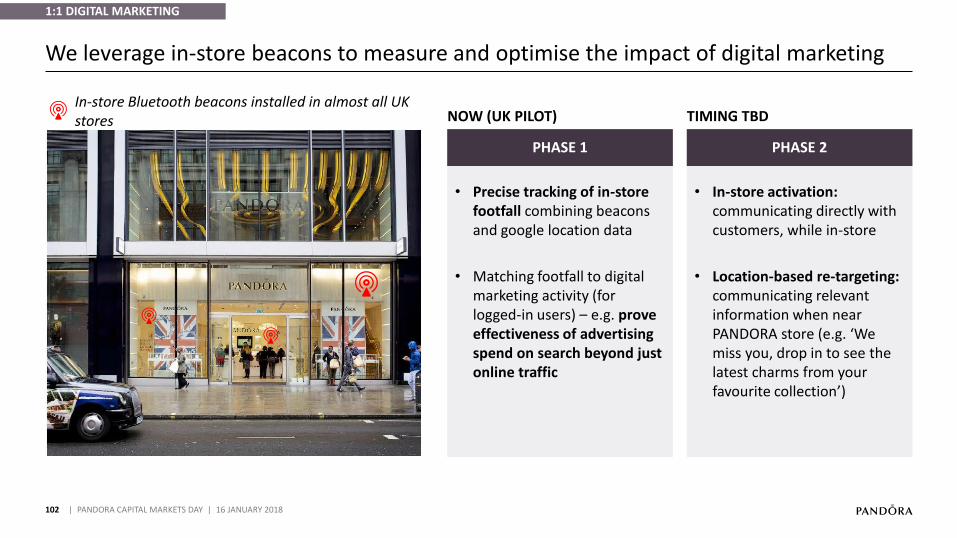
• In-store activation: communicating directly with customers, while in-store
• Location-based re-targeting: communicating relevant information when near PANDORA store (e.g. ‘We miss you, drop in to see the latest charms from your favourite collection’)
102
We leverage in-store beacons to measure and optimise the impact of digital marketing
| PANDORA CAPITAL MARKETS DAY | 16 JANUARY 2018
In-store Bluetooth beacons installed in almost all UK stores
PHASE 1 PHASE 2
NOW (UK PILOT) TIMING TBD
• Precise tracking of in-store footfall combining beacons and google location data
• Matching footfall to digital marketing activity (for logged-in users) – e.g. prove effectiveness of advertising spend on search beyond just online traffic
1:1 DIGITAL MARKETING
103
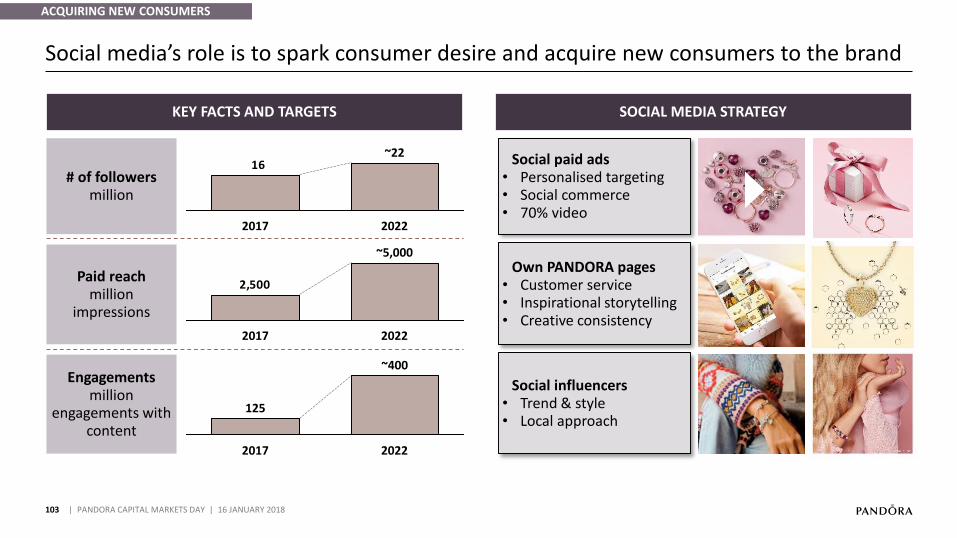
Social media’s role is to spark consumer desire and acquire new consumers to the brand
| PANDORA CAPITAL MARKETS DAY | 16 JANUARY 2018
SOCIAL MEDIA STRATEGYKEY FACTS AND TARGETS
16
2022
~22
2017
# of followersmillion
Paid reachmillion
impressions
Engagementsmillion
engagements with content
2,500
2022
~5,000
2017
125
~400
2017 2022
Social paid ads• Personalised targeting • Social commerce• 70% video
Social influencersTrend & style•Local approach•
Own PANDORA pages• Customer service• Inspirational storytelling• Creative consistency
ACQUIRING NEW CONSUMERS
EXAMPLE: Fashion & lifestyle local influencer collaboration
104
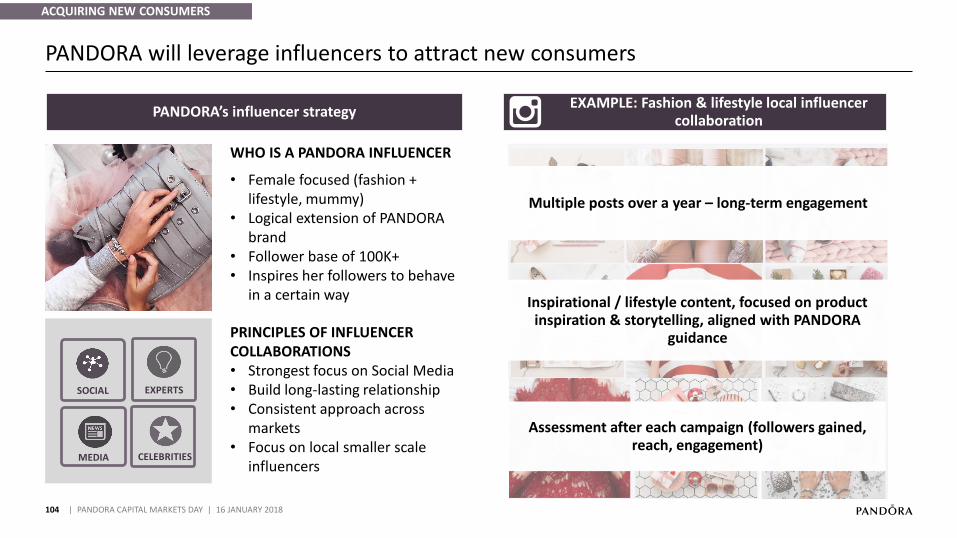
PANDORA will leverage influencers to attract new consumers
| PANDORA CAPITAL MARKETS DAY | 16 JANUARY 2018
PANDORA’s influencer strategy
WHO IS A PANDORA INFLUENCER
Female focused (fashion + •
lifestyle, mummy)Logical extension of PANDORA •
brandFollower base of • 100K+Inspires her followers to behave •
in a certain way
SOCIAL
CELEBRITIES
EXPERTS
MEDIA
ACQUIRING NEW CONSUMERS
PRINCIPLES OF INFLUENCER COLLABORATIONS
Strongest focus on Social Media•
Build long• -lasting relationshipConsistent approach across •
marketsFocus on local smaller scale •
influencers
Multiple posts over a year – long-term engagement
Inspirational / lifestyle content, focused on product inspiration & storytelling, aligned with PANDORA
guidance
Assessment after each campaign (followers gained, reach, engagement)
105
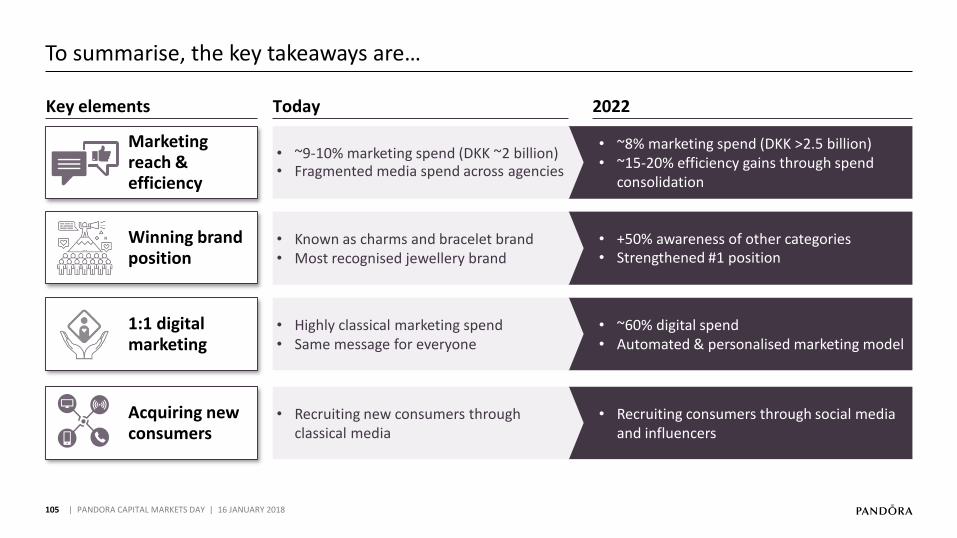
To summarise, the key takeaways are…
• ~8% marketing spend (DKK >2.5 billion)• ~15-20% efficiency gains through spend
consolidation
• ~9-10% marketing spend (DKK ~2 billion)Fragmented media spend across agencies•
1:1 digital marketing
Winning brand position
Acquiring new consumers
Marketing reach & efficiency
Key elements Today 2022
• +50% awareness of other categoriesStrengthened #• 1 position
Known as charms and bracelet brand•
Most recognised jewellery brand•
• Recruiting consumers through social media and influencers
Recruiting new consumers through •
classical media
• ~60% digital spend• Automated & personalised marketing model
• Highly classical marketing spend • Same message for everyone
| PANDORA CAPITAL MARKETS DAY | 16 JANUARY 2018105
01
2017 PERFORMANCEAnders Colding Friis, President & CEO
02
NEW STRATEGY TOWARDS 2022Anders Colding Friis, President & CEO
07
FINANCIAL OUTLOOK TOWARDS 2022Peter Vekslund, EVP & CFO
06
WINNING IN OMNI-CHANNEL RETAILDavid Allen, President, EMEA
05
Minna Philipson, SVP & Chief Marketing Officer
DIGITALISED BRAND EXPERIENCE
03
Stephen Fairchild, SVP & Chief Creative Officer
INNOVATE AFFORDABLE JEWELLERY
106
06 | WINNING IN OMNI-CHANNEL RETAIL
| PANDORA CAPITAL MARKETS DAY | 16 JANUARY 2018
04
Thomas Touborg, SVP, Group Operations
AGILE MANUFACTURING
08
CLOSING REMARKSPeder Tuborgh, Chairman of the Board
107
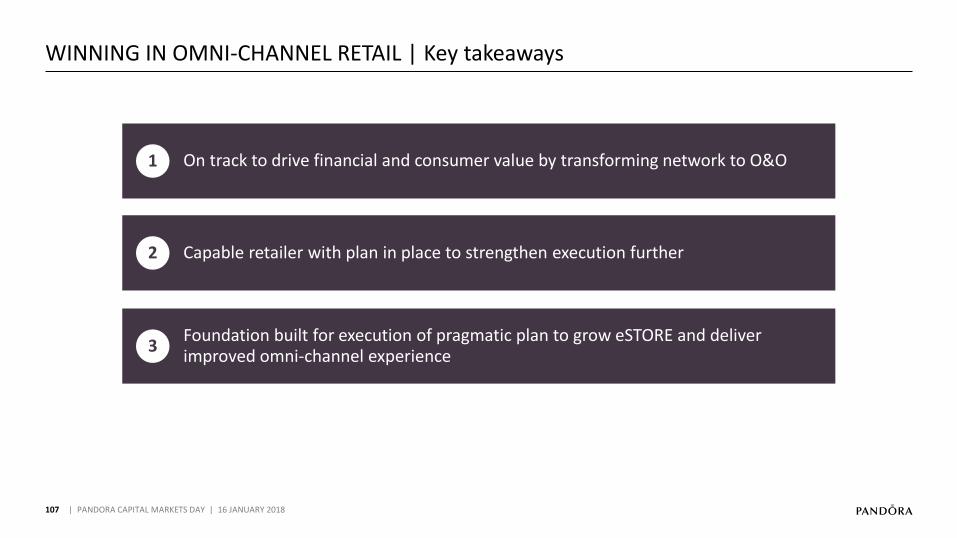
WINNING IN OMNI-CHANNEL RETAIL | Key takeaways
| PANDORA CAPITAL MARKETS DAY | 16 JANUARY 2018
1 On track to drive financial and consumer value by transforming network to O&O
2 Capable retailer with plan in place to strengthen execution further
3Foundation built for execution of pragmatic plan to grow eSTORE and deliver improved omni-channel experience
108
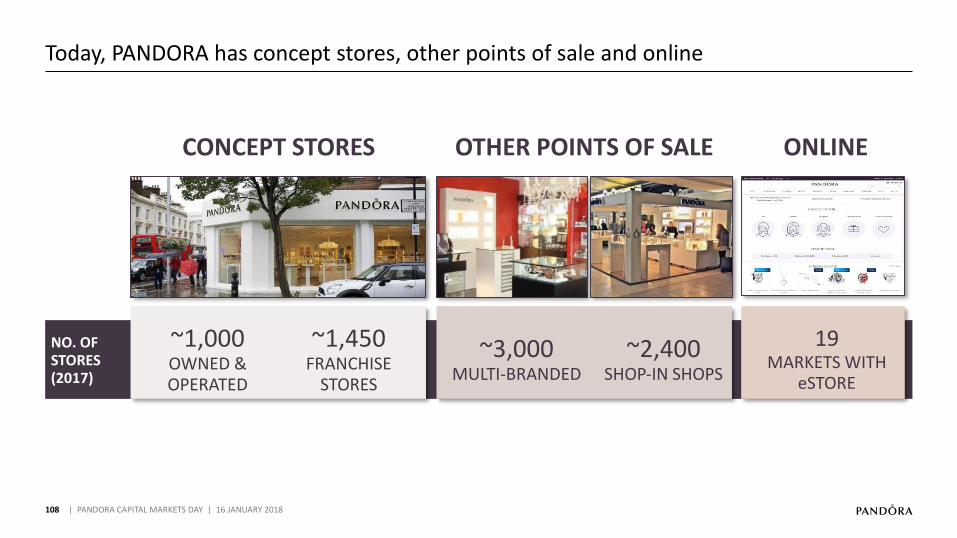
Today, PANDORA has concept stores, other points of sale and online
| PANDORA CAPITAL MARKETS DAY | 16 JANUARY 2018
CONCEPT STORES OTHER POINTS OF SALE ONLINE
~1,000OWNED & OPERATED
19MARKETS WITH
eSTORE
~1,450FRANCHISE
STORES
~3,000MULTI-BRANDED
~2,400SHOP-IN SHOPS
NO. OF STORES(2017)
Consumers
109
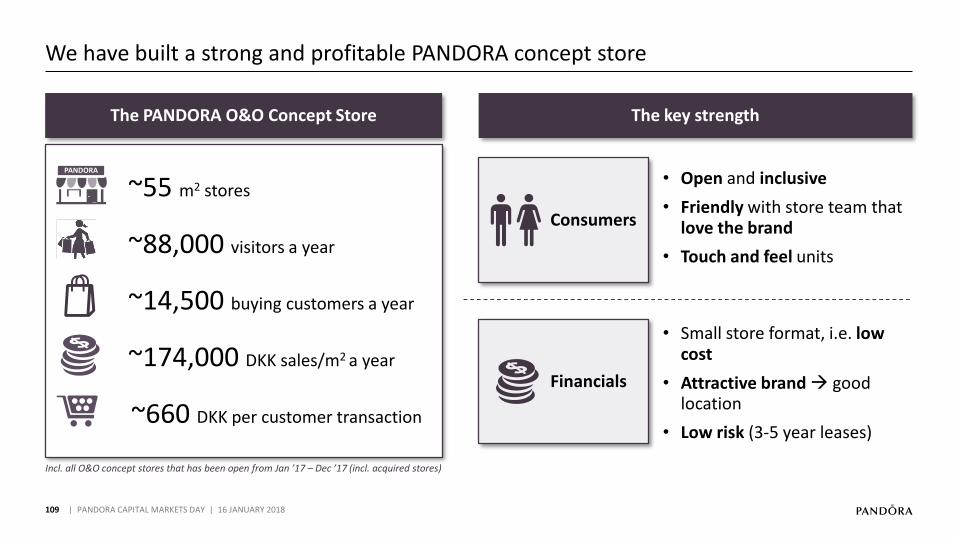
Incl. all O&O concept stores that has been open from Jan ’17 – Dec ’17 (incl. acquired stores)
We have built a strong and profitable PANDORA concept store
| PANDORA CAPITAL MARKETS DAY | 16 JANUARY 2018
~55 m2 stores
~88,000 visitors a year
~14,500 buying customers a year
~174,000 DKK sales/m2 a year
~660 DKK per customer transaction
The PANDORA O&O Concept Store
PANDORA
The key strength
Financials
• Open and inclusive
• Friendly with store team that love the brand
• Touch and feel units
• Small store format, i.e. low cost
• Attractive brand good location
• Low risk (3-5 year leases)
110
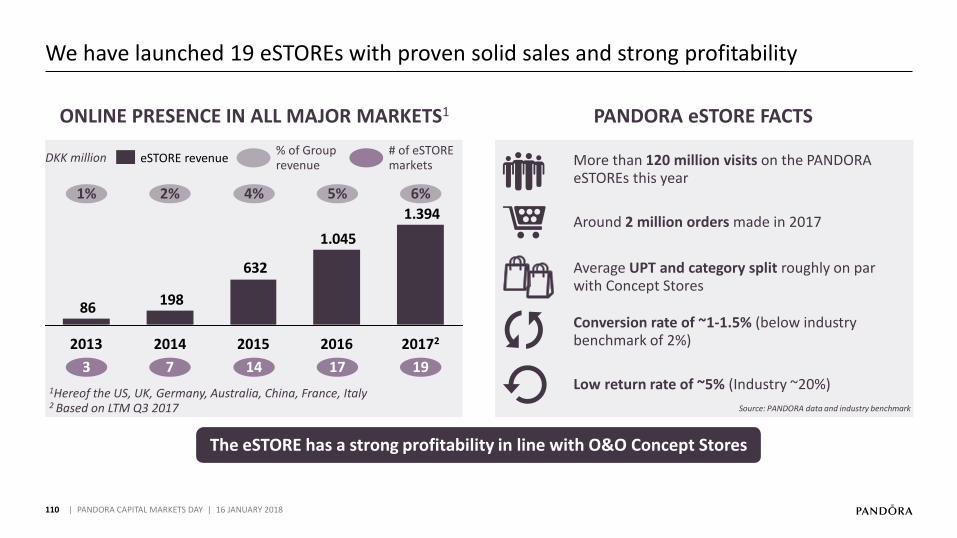
We have launched 19 eSTOREs with proven solid sales and strong profitability
| PANDORA CAPITAL MARKETS DAY | 16 JANUARY 2018
eSTORE revenue
ONLINE PRESENCE IN ALL MAJOR MARKETS1 PANDORA eSTORE FACTS
1.045
632
19886
1.394
2013 2015 20162014 20172
% of Group revenue
1% 2% 4% 5% 6%
1Hereof the US, UK, Germany, Australia, China, France, Italy2 Based on LTM Q3 2017
The eSTORE has a strong profitability in line with O&O Concept Stores
3 147 17 19
# of eSTORE markets
DKK million More than 120 million visits on the PANDORA eSTOREs this year
Around 2 million orders made in 2017
Low return rate of ~5% (Industry ~20%)
Conversion rate of ~1-1.5% (below industry benchmark of 2%)
Average UPT and category split roughly on par with Concept Stores
Source: PANDORA data and industry benchmark
111
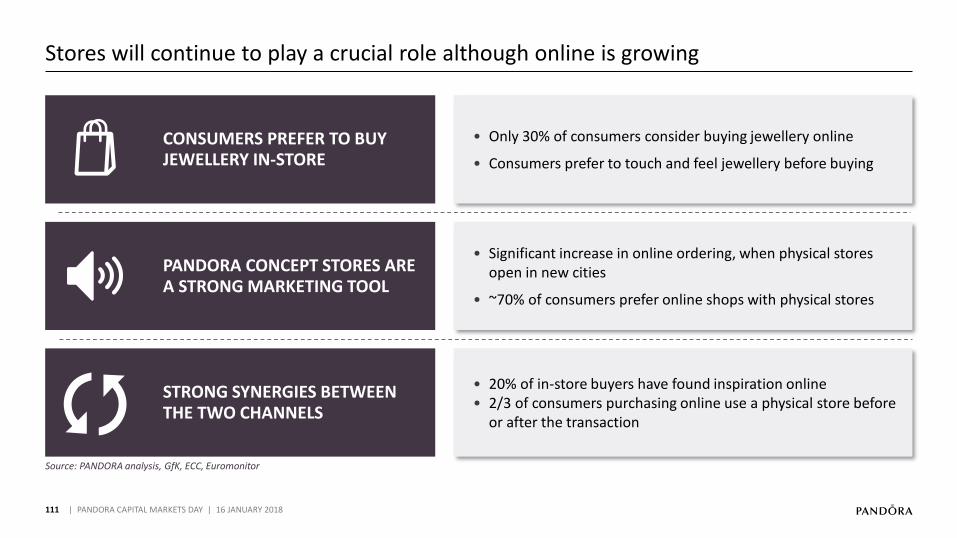
Source: PANDORA analysis, GfK, ECC, Euromonitor
Stores will continue to play a crucial role although online is growing
| PANDORA CAPITAL MARKETS DAY | 16 JANUARY 2018
STRONG SYNERGIES BETWEEN THE TWO CHANNELS
PANDORA CONCEPT STORES ARE A STRONG MARKETING TOOL
CONSUMERS PREFER TO BUY JEWELLERY IN-STORE
• Only 30% of consumers consider buying jewellery online
• Consumers prefer to touch and feel jewellery before buying
• Significant increase in online ordering, when physical stores open in new cities
• ~70% of consumers prefer online shops with physical stores
20• % of in-store buyers have found inspiration online• 2/3 of consumers purchasing online use a physical store before
or after the transaction
112
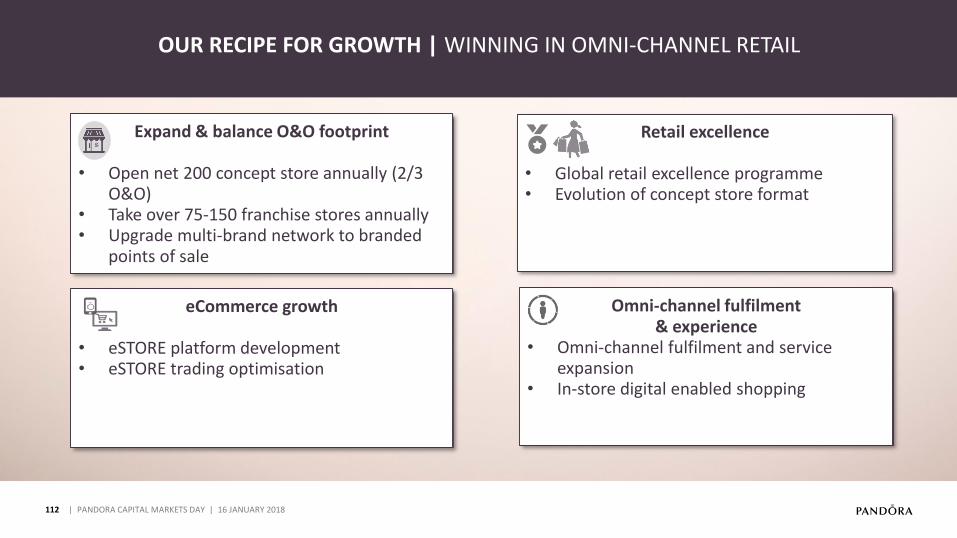
XXX
| PANDORA CAPITAL MARKETS DAY | 16 JANUARY 2018
Expand & balance O&O footprint
Open net • 200 concept store annually (2/3 O&O) Take over • 75-150 franchise stores annuallyUpgrade multi• -brand network to branded points of sale
Retail excellence
• Global retail excellence programme• Evolution of concept store format
Omni-channel fulfilment & experience
• Omni-channel fulfilment and service expansion
• In-store digital enabled shopping
eCommerce growth
• eSTORE platform development• eSTORE trading optimisation
<
OUR RECIPE FOR GROWTH | WINNING IN OMNI-CHANNEL RETAIL
113
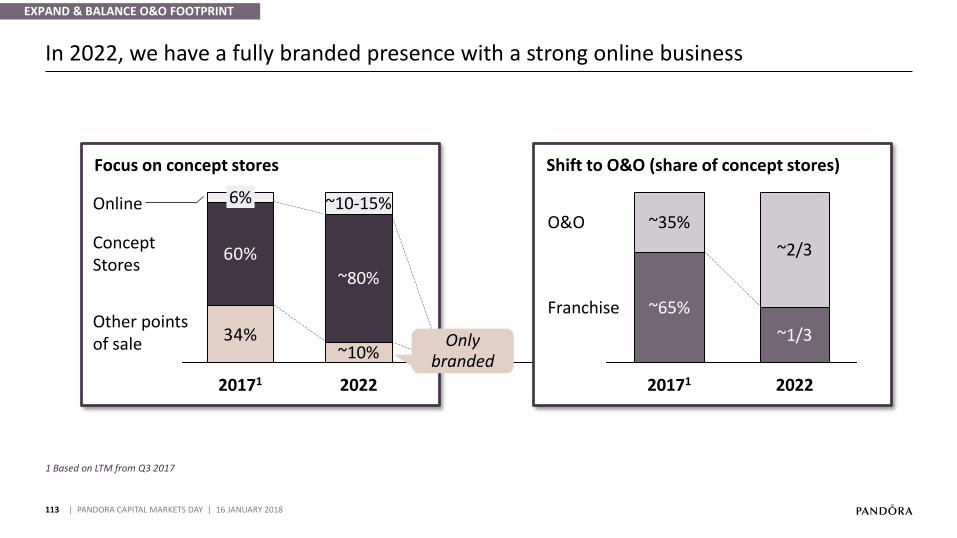
In 2022, we have a fully branded presence with a strong online business
| PANDORA CAPITAL MARKETS DAY | 16 JANUARY 2018
EXPAND & BALANCE O&O FOOTPRINT
Focus on concept stores
34%
60%
20171 2022
Online ~10-15%6%
~10%
~80%
Concept Stores
Other points of sale
Shift to O&O (share of concept stores)
O&O
~2/3
~65%
~1/3
20171
~35%
Franchise
2022
Only branded
1 Based on LTM from Q3 2017
114
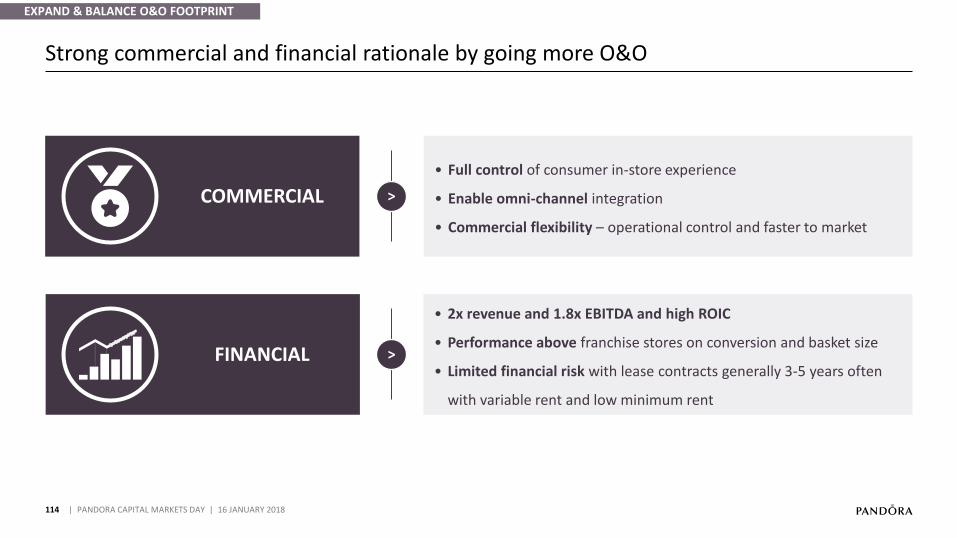
Strong commercial and financial rationale by going more O&O
| PANDORA CAPITAL MARKETS DAY | 16 JANUARY 2018
COMMERCIAL
Full control • of consumer in-store experience
Enable omni• -channel integration
Commercial flexibility • – operational control and faster to market
• 2x revenue and 1.8x EBITDA and high ROIC
Performance above• franchise stores on conversion and basket size
Limited financial risk • with lease contracts generally 3-5 years often
with variable rent and low minimum rent
FINANCIAL
>
>
EXPAND & BALANCE O&O FOOTPRINT
115
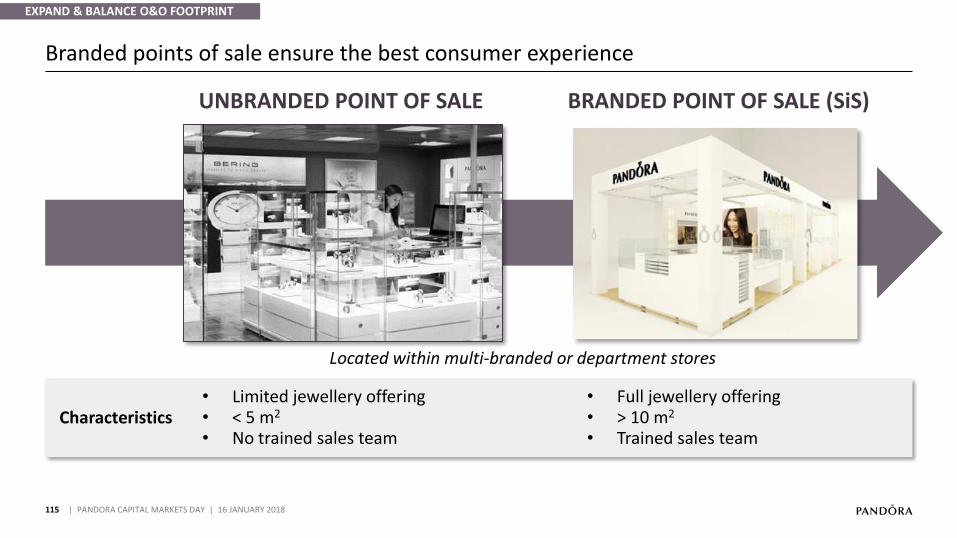
Branded points of sale ensure the best consumer experience
| PANDORA CAPITAL MARKETS DAY | 16 JANUARY 2018
UNBRANDED POINT OF SALE BRANDED POINT OF SALE (SiS)
Characteristics• Limited jewellery offering• < 5 m2
• No trained sales team
Full jewellery offering•> • 10 m2
Trained sales team•
Located within multi-branded or department stores
EXPAND & BALANCE O&O FOOTPRINT
116
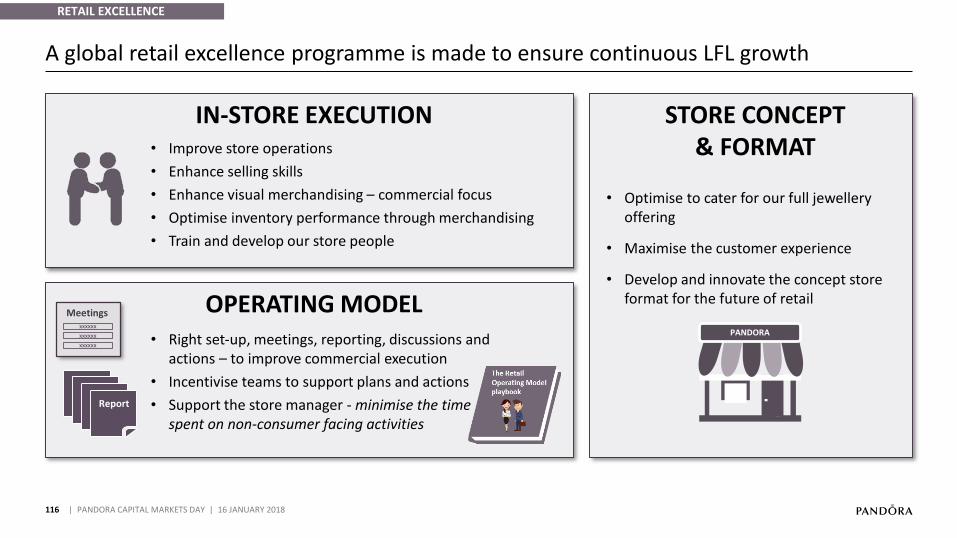
A global retail excellence programme is made to ensure continuous LFL growth
| PANDORA CAPITAL MARKETS DAY | 16 JANUARY 2018
RETAIL EXCELLENCE
IN-STORE EXECUTION STORE CONCEPT & FORMAT
OPERATING MODELMeetingsxxxxxx
xxxxxx
xxxxxx
Report
Right set• -up, meetings, reporting, discussions and actions – to improve commercial execution
Incentivise teams to support plans and actions•
Support the store manager • - minimise the time spent on non-consumer facing activities
Improve store operations•
Enhance selling skills •
Enhance visual merchandising • – commercial focus
Optimise• inventory performance through merchandising
Train and develop our store people•
Optimise• to cater for our full jewelleryoffering
Maximise• the customer experience
Develop and innovate the concept store •
format for the future of retail
PANDORA
117
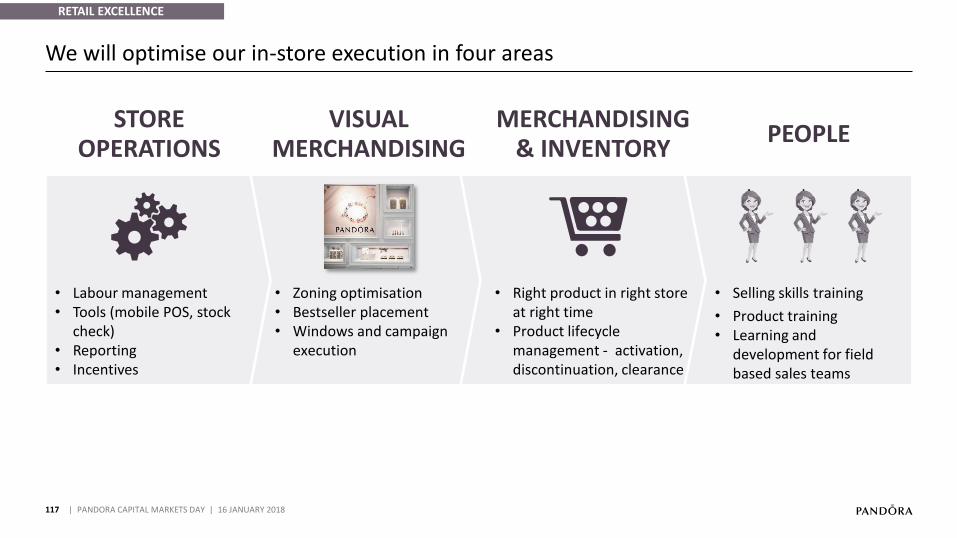
We will optimise our in-store execution in four areas
| PANDORA CAPITAL MARKETS DAY | 16 JANUARY 2018
STORE OPERATIONS
MERCHANDISING & INVENTORY
PEOPLEVISUAL
MERCHANDISING
Labour management•
Tools (mobile POS, stock •
check)Reporting•
Incentives•
• Zoning optimisation• Bestseller placement• Windows and campaign
execution
• Right product in right store at right time
• Product lifecycle management - activation, discontinuation, clearance
• Selling skills training
• Product training• Learning and
development for field based sales teams
RETAIL EXCELLENCE
118
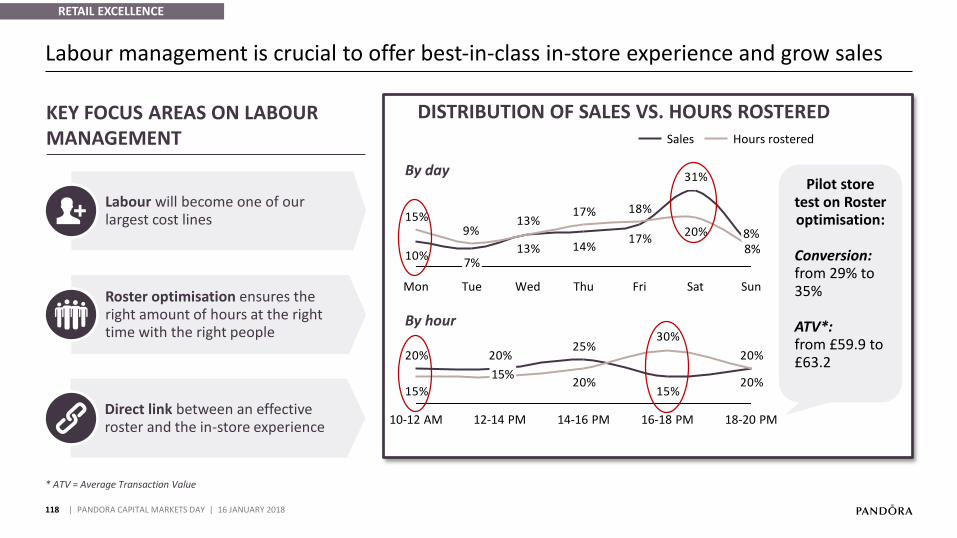
Labour management is crucial to offer best-in-class in-store experience and grow sales
| PANDORA CAPITAL MARKETS DAY | 16 JANUARY 2018
RETAIL EXCELLENCE
31%
17%14%13%
10%
20%
18%17%13%
9%15%
FriThu Sun
8%
Sat
8%7%
Mon Tue Wed
20%15%
25%20%20% 20%
30%
20%15%
10-12 AM 16-18 PM14-16 PM12-14 PM
15%
18-20 PM
Sales Hours rostered
KEY FOCUS AREAS ON LABOUR MANAGEMENT
DISTRIBUTION OF SALES VS. HOURS ROSTERED
By day
By hour
Roster optimisation ensures the right amount of hours at the right time with the right people
Labour will become one of our largest cost lines
Direct link between an effective roster and the in-store experience
Pilot store test on Roster optimisation:
Conversion: from 29% to 35%
ATV*:from £59.9 to £63.2
* ATV = Average Transaction Value
119
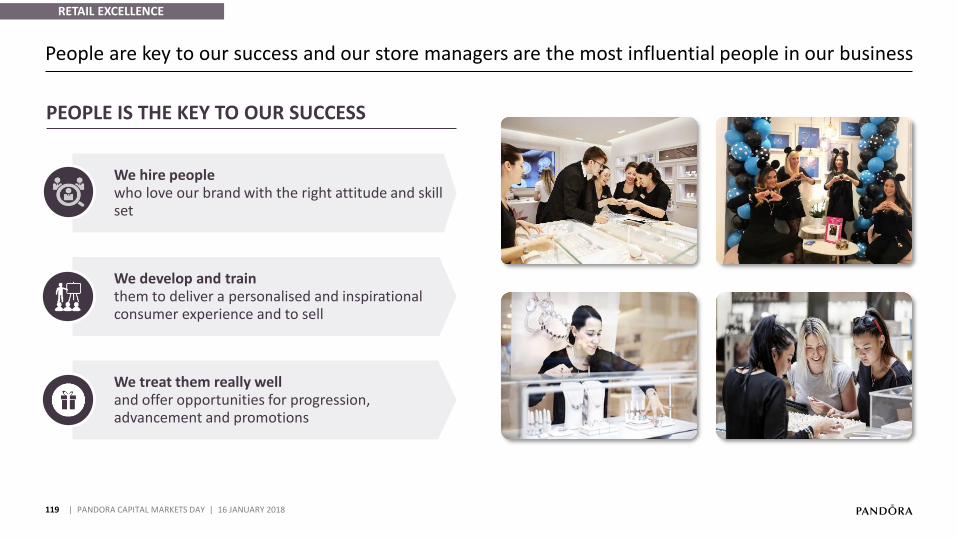
People are key to our success and our store managers are the most influential people in our business
| PANDORA CAPITAL MARKETS DAY | 16 JANUARY 2018
We hire peoplewho love our brand with the right attitude and skill set
We develop and trainthem to deliver a personalised and inspirational consumer experience and to sell
We treat them really welland offer opportunities for progression, advancement and promotions
RETAIL EXCELLENCE
PEOPLE IS THE KEY TO OUR SUCCESS

CAMPAIGNS & COLLECTIONS
Overarching and new product launches
PROMOTIONS
In-store and online activity to support campaigns and collections to drive sales
ACTIVATIONS
Key products or concepts to be called out in-store and
online
120
Our commercial execution is centred around three core activities
| PANDORA CAPITAL MARKETS DAY | 16 JANUARY 2018
RETAIL EXCELLENCE
21 3
> > >
121
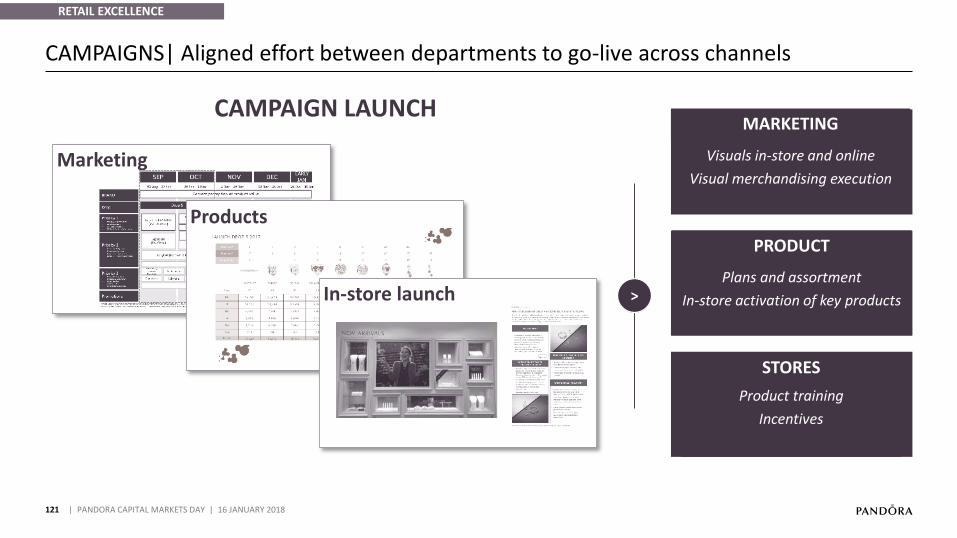
CAMPAIGNS| Aligned effort between departments to go-live across channels
| PANDORA CAPITAL MARKETS DAY | 16 JANUARY 2018
RETAIL EXCELLENCE
CAMPAIGN LAUNCH
Marketing
Products
In-store launch >
PRODUCT
Plans and assortment
In-store activation of key products
STORES
Product training
Incentives
MARKETING
Visuals in-store and online
Visual merchandising execution
122
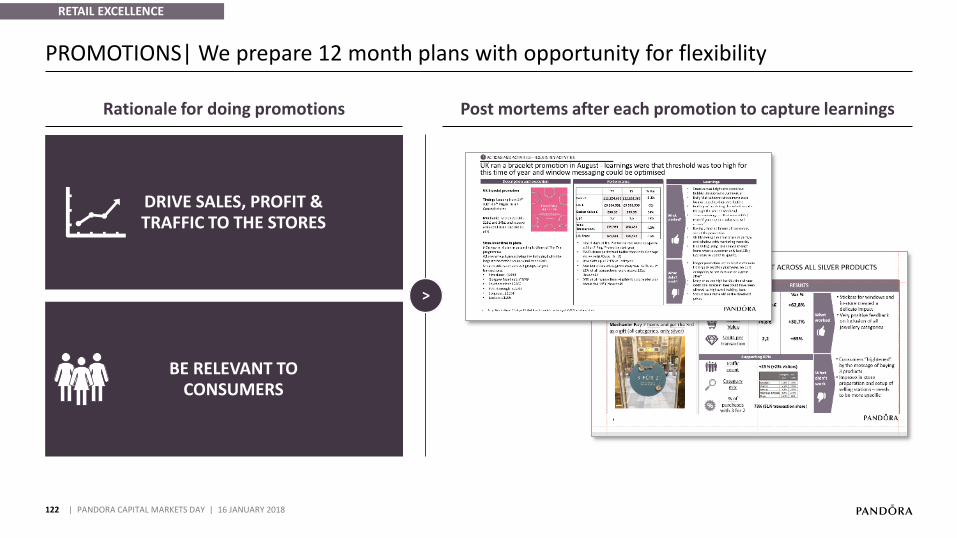
PROMOTIONS| We prepare 12 month plans with opportunity for flexibility
| PANDORA CAPITAL MARKETS DAY | 16 JANUARY 2018
Rationale for doing promotions Post mortems after each promotion to capture learnings
DRIVE SALES, PROFIT &TRAFFIC TO THE STORES
BE RELEVANT TOCONSUMERS
RETAIL EXCELLENCE
>
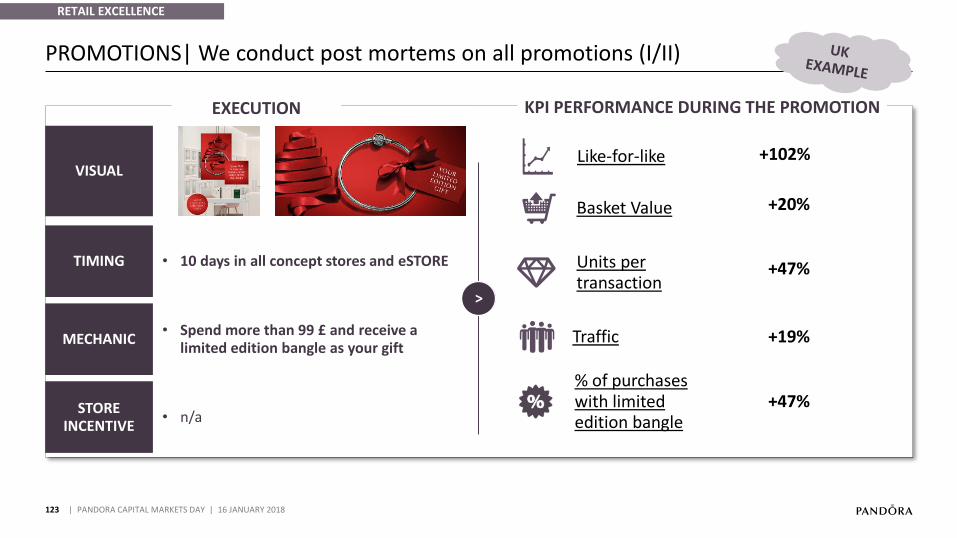
123
PROMOTIONS| We conduct post mortems on all promotions (I/II)
| PANDORA CAPITAL MARKETS DAY | 16 JANUARY 2018
RETAIL EXCELLENCE
Like-for-like +102%
TIMING
MECHANIC
STORE INCENTIVE
10 • days in all concept stores and eSTORE
• Spend more than 99 £ and receive a limited edition bangle as your gift
• n/a
EXECUTION KPI PERFORMANCE DURING THE PROMOTION
Units pertransaction
+47%
Basket Value +20%
Traffic +19%
% of purchaseswith limited edition bangle
+47%
>
VISUAL
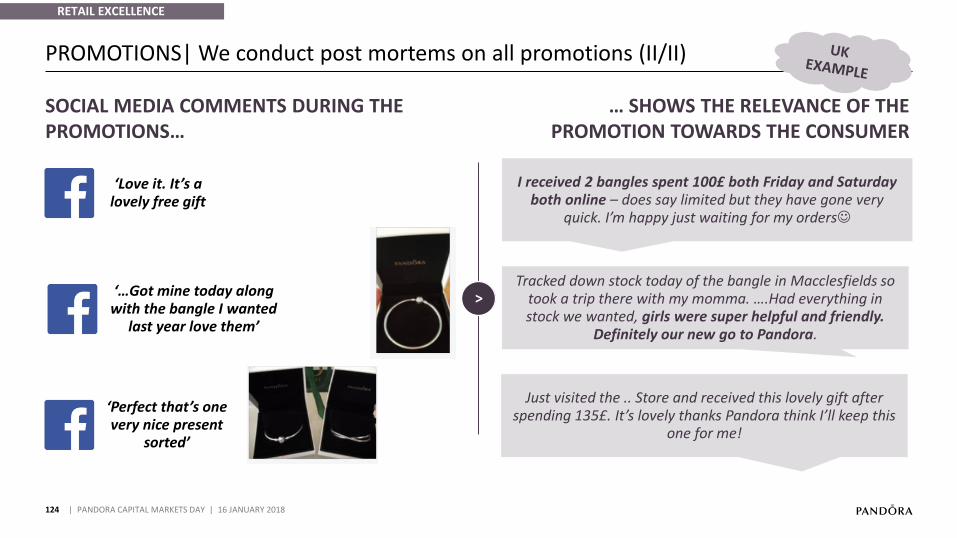
124
PROMOTIONS| We conduct post mortems on all promotions (II/II)
| PANDORA CAPITAL MARKETS DAY | 16 JANUARY 2018
RETAIL EXCELLENCE
SOCIAL MEDIA COMMENTS DURING THE PROMOTIONS…
I received 2 bangles spent 100£ both Friday and Saturday both online – does say limited but they have gone very
quick. I’m happy just waiting for my orders☺
Tracked down stock today of the bangle in Macclesfields so took a trip there with my momma. ….Had everything in stock we wanted, girls were super helpful and friendly.
Definitely our new go to Pandora.
>
… SHOWS THE RELEVANCE OF THE PROMOTION TOWARDS THE CONSUMER
Just visited the .. Store and received this lovely gift after spending 135£. It’s lovely thanks Pandora think I’ll keep this
one for me!
‘Perfect that’s one very nice present
sorted’
‘Love it. It’s a lovely free gift
‘…Got mine today along with the bangle I wanted
last year love them’
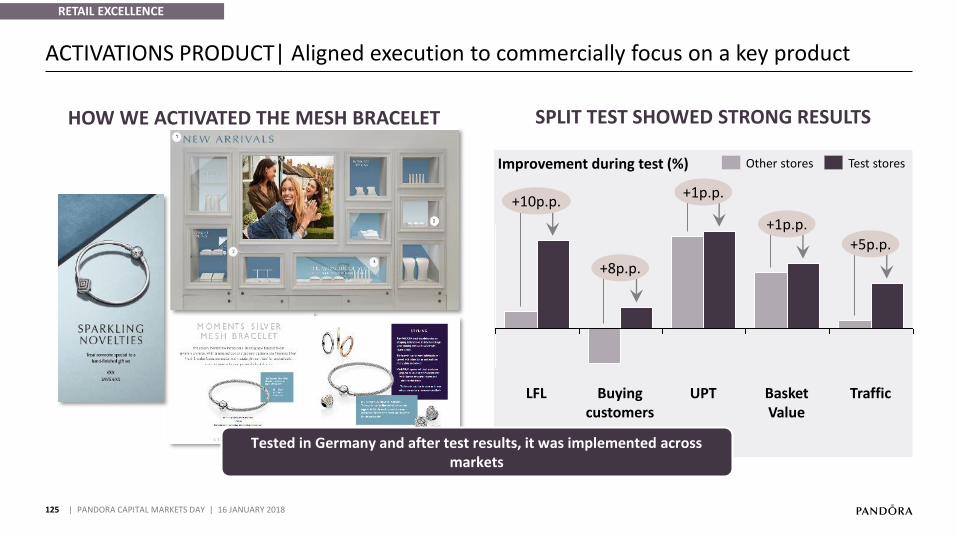
Test storesOther stores
125 | PANDORA CAPITAL MARKETS DAY | 16 JANUARY 2018
HOW WE ACTIVATED THE MESH BRACELET SPLIT TEST SHOWED STRONG RESULTS
+1p.p.
+1p.p.
TrafficUPT Basket Value
Buying customers
LFL
+8p.p.
+10p.p.
+5p.p.
Improvement during test (%)
RETAIL EXCELLENCE
Tested in Germany and after test results, it was implemented across markets
ACTIVATIONS PRODUCT| Aligned execution to commercially focus on a key product
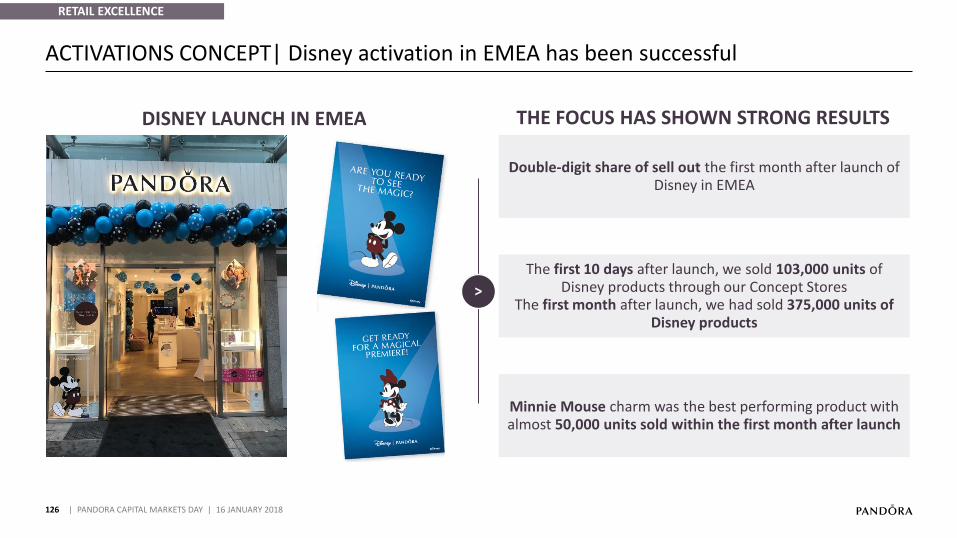
126
ACTIVATIONS CONCEPT| Disney activation in EMEA has been successful
| PANDORA CAPITAL MARKETS DAY | 16 JANUARY 2018
RETAIL EXCELLENCE
DISNEY LAUNCH IN EMEA THE FOCUS HAS SHOWN STRONG RESULTS
>
Double-digit share of sell out the first month after launch of Disney in EMEA
The first 10 days after launch, we sold 103,000 units of Disney products through our Concept Stores
The first month after launch, we had sold 375,000 units of Disney products
Minnie Mouse charm was the best performing product with almost 50,000 units sold within the first month after launch
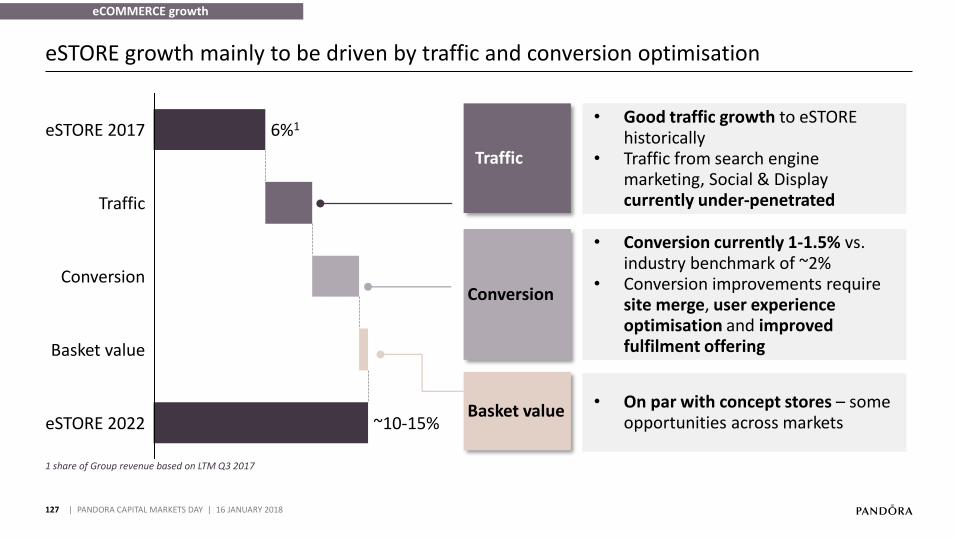
127
1 share of Group revenue based on LTM Q3 2017
eSTORE growth mainly to be driven by traffic and conversion optimisation
| PANDORA CAPITAL MARKETS DAY | 16 JANUARY 2018
eSTORE 2017
Basket value
Conversion
eSTORE 2022
Traffic
~10-15%
6%1Good traffic growth • to eSTOREhistoricallyTraffic from search engine •marketing, Social & Display currently under-penetrated
• Conversion currently 1-1.5% vs. industry benchmark of ~2%
• Conversion improvements require site merge, user experience optimisation and improved fulfilment offering
• On par with concept stores – some opportunities across markets
eCOMMERCE growth
Traffic
Conversion
Basket value
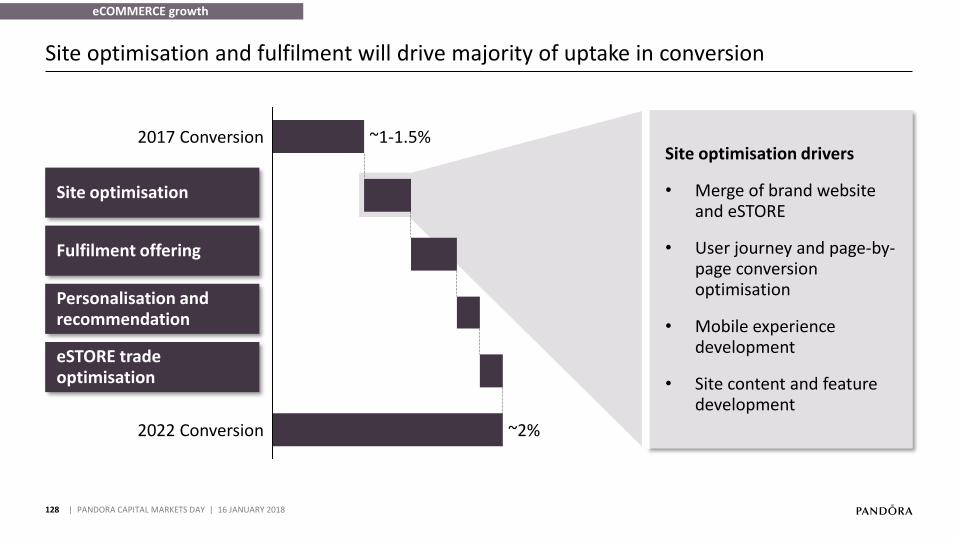
128
Site optimisation and fulfilment will drive majority of uptake in conversion
| PANDORA CAPITAL MARKETS DAY | 16 JANUARY 2018
2022 Conversion
~1-1.5%
~2%
2017 Conversion
Site optimisation
Site optimisation drivers
• Merge of brand website and eSTORE
• User journey and page-by-page conversion optimisation
• Mobile experience development
• Site content and feature development
Fulfilment offering
Personalisation and recommendation
eSTORE trade optimisation
eCOMMERCE growth
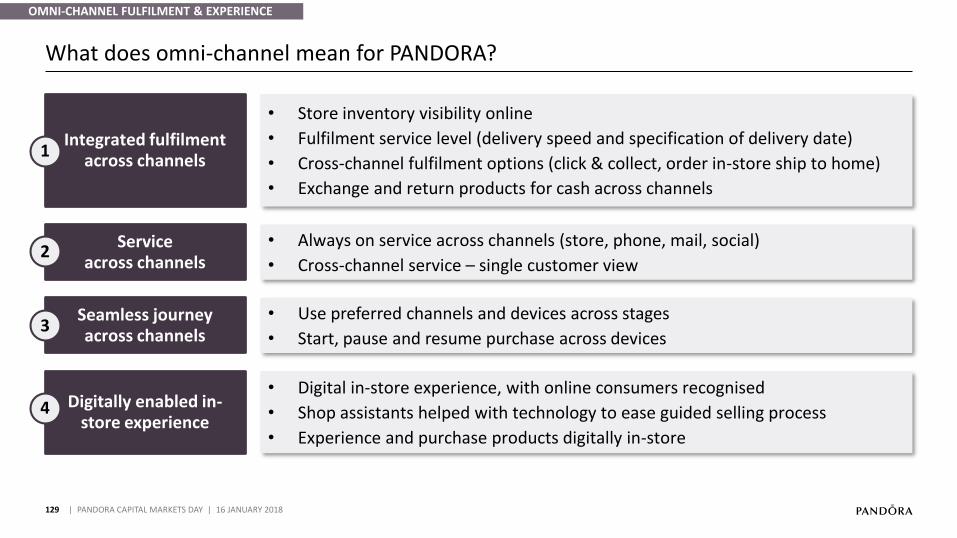
129
What does omni-channel mean for PANDORA?
| PANDORA CAPITAL MARKETS DAY | 16 JANUARY 2018
Integrated fulfilment across channels
1
• Store inventory visibility online
• Fulfilment service level (delivery speed and specification of delivery date)
• Cross-channel fulfilment options (click & collect, order in-store ship to home)
• Exchange and return products for cash across channels
Service across channels
• Always on service across channels (store, phone, mail, social)
• Cross-channel service – single customer view2
Seamless journeyacross channels
Use preferred channels and devices across stages•
Start, pause and resume purchase across devices•3
Digitally enabled in-store experience
• Digital in-store experience, with online consumers recognised
• Shop assistants helped with technology to ease guided selling process
• Experience and purchase products digitally in-store
4
OMNI-CHANNEL FULFILMENT & EXPERIENCE
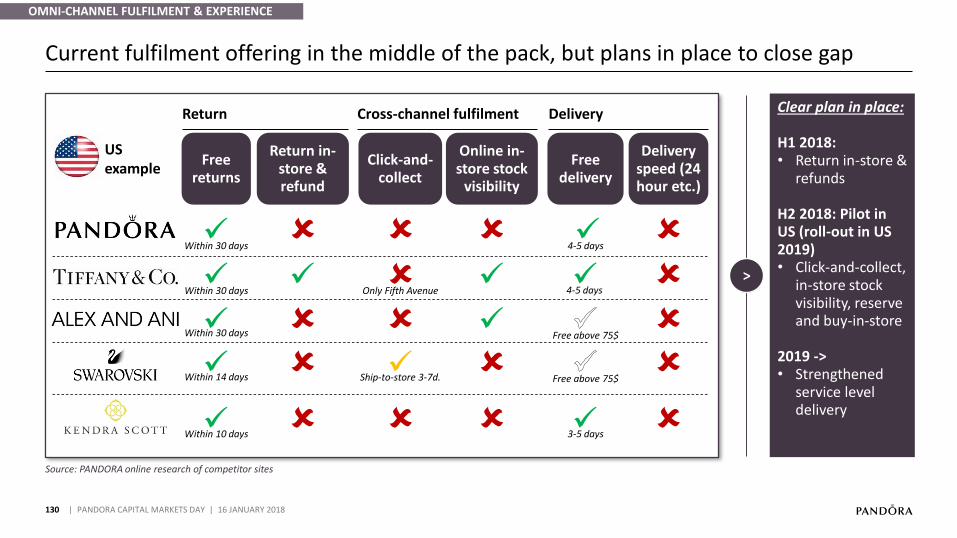
130
Source: PANDORA online research of competitor sites
Current fulfilment offering in the middle of the pack, but plans in place to close gap
| PANDORA CAPITAL MARKETS DAY | 16 JANUARY 2018
Free delivery
Free above 75$
4-5 days
3-5 days
Free above 75$
4-5 days
Delivery speed (24 hour etc.)
Click-and-collect
Only Fifth Avenue
Ship-to-store 3-7d.
Within 10 days
Free returns
Within 30 days
Within 30 days
Within 30 days
Within 14 days
Return in-store & refund
Online in-store stock
visibility
Return
US example
Cross-channel fulfilment Delivery
>
Clear plan in place:
H1 2018:• Return in-store &
refunds
H2 2018: Pilot in US (roll-out in US 2019)• Click-and-collect,
in-store stock visibility, reserve and buy-in-store
2019 ->• Strengthened
service level delivery
OMNI-CHANNEL FULFILMENT & EXPERIENCE
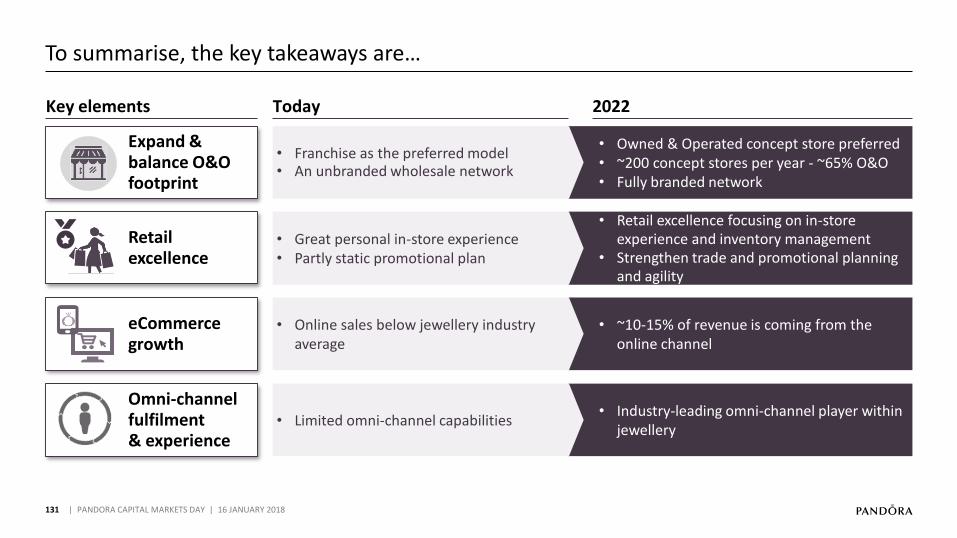
131
To summarise, the key takeaways are…
| PANDORA CAPITAL MARKETS DAY | 16 JANUARY 2018
Owned & Operated concept store preferred•
• ~200 concept stores per year - ~65% O&OFully branded network•
Franchise as the preferred model•An unbranded wholesale network•
Omni-channel fulfilment & experience
Retail excellence
eCommerce growth
Expand & balance O&O footprint
Key elements Today 2022
Retail excellence focusing on in• -store experience and inventory managementStrengthen trade and promotional planning •and agility
Great personal in• -store experiencePartly static promotional plan•
• ~10-15% of revenue is coming from the online channel
Online sales below jewellery industry •
average
• Industry-leading omni-channel player within jewellery
• Limited omni-channel capabilities
<
01
2017 PERFORMANCEAnders Colding Friis, President & CEO
02
NEW STRATEGY TOWARDS 2022Anders Colding Friis, President & CEO
07
FINANCIAL OUTLOOK TOWARDS 2022Peter Vekslund, EVP & CFO
06
WINNING IN OMNI-CHANNEL RETAILDavid Allen, President, EMEA
05
Minna Philipson, SVP & Chief Marketing Officer
DIGITALISED BRAND EXPERIENCE
03
Stephen Fairchild, SVP & Chief Creative Officer
INNOVATE AFFORDABLE JEWELLERY
132
07 | FINANCIAL OUTLOOK TOWARDS 2022
| PANDORA CAPITAL MARKETS DAY | 16 JANUARY 2018
04
Thomas Touborg, SVP, Group Operations
AGILE MANUFACTURING
08
CLOSING REMARKSPeder Tuborgh, Chairman of the Board
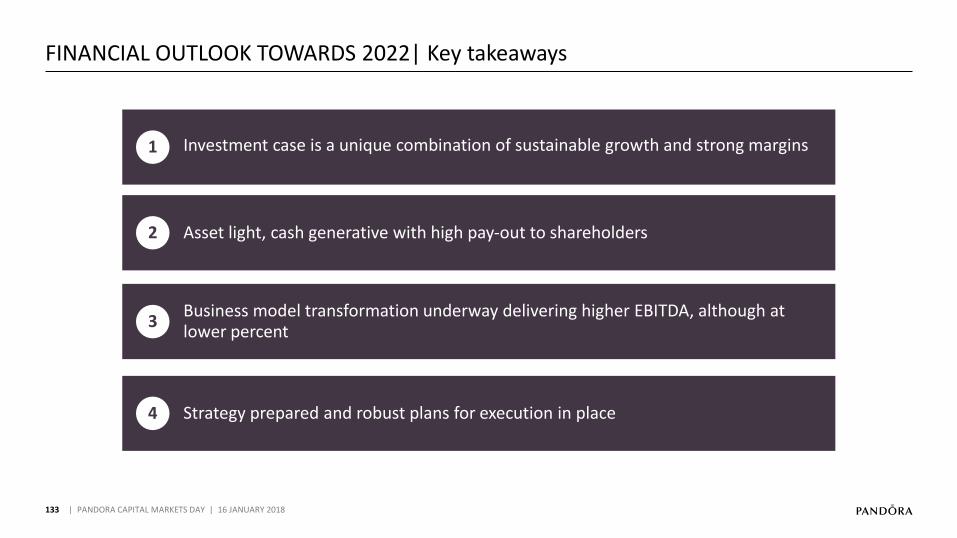
133
FINANCIAL OUTLOOK TOWARDS 2022| Key takeaways
| PANDORA CAPITAL MARKETS DAY | 16 JANUARY 2018
1 Investment case is a unique combination of sustainable growth and strong margins
2 Asset light, cash generative with high pay-out to shareholders
4 Strategy prepared and robust plans for execution in place
3Business model transformation underway delivering higher EBITDA, although at lower percent

134
The PANDORA investment case towards 2022
| PANDORA CAPITAL MARKETS DAY | 16 JANUARY 2018
A UNIQUE INTEGRATED BUSINESS MODEL DELIVERING STRONG FINANCIALS
5X
LARGE AND PROFITABLE DISTRIBUTION
NETWORK
LEADING POSITION IN BRANDED
MANUFACTURING
AFFORDABLE JEWELLERY LEADER
WORLD´S MOST RECOGNISED
JEWELLERY BRAND
SUSTAINABLE GROWTH
~7-10%
STRONG MARGINS
~35%
ASSET LIGHT
~5% CAPEX
CASH GENERATIVE
High pay-out
EBITDA margin
Revenue growth(local currency)
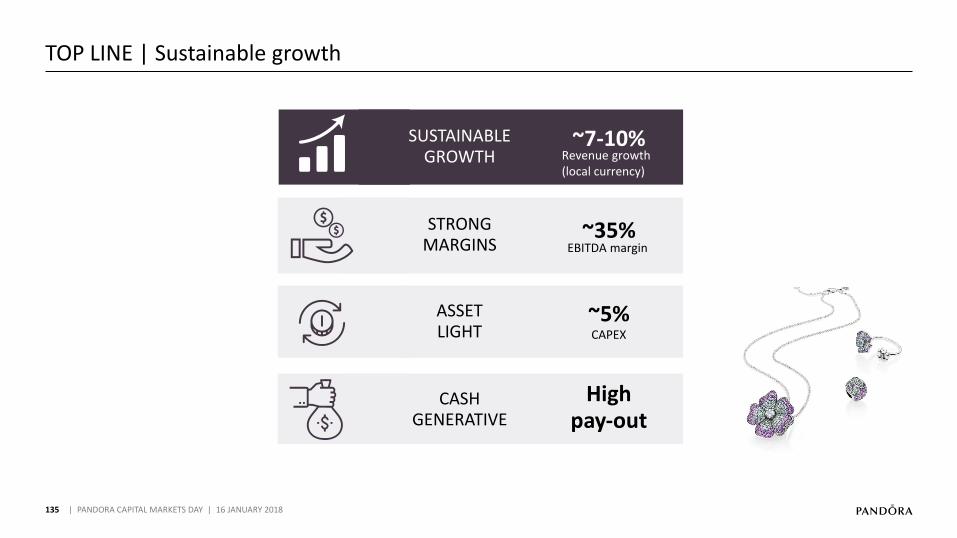
135
TOP LINE | Sustainable growth
| PANDORA CAPITAL MARKETS DAY | 16 JANUARY 2018
SUSTAINABLE GROWTH
~7-10%
STRONG MARGINS
~35%
ASSET LIGHT
~5% CAPEX
CASH GENERATIVE
High pay-out
EBITDA margin
Revenue growth(local currency)
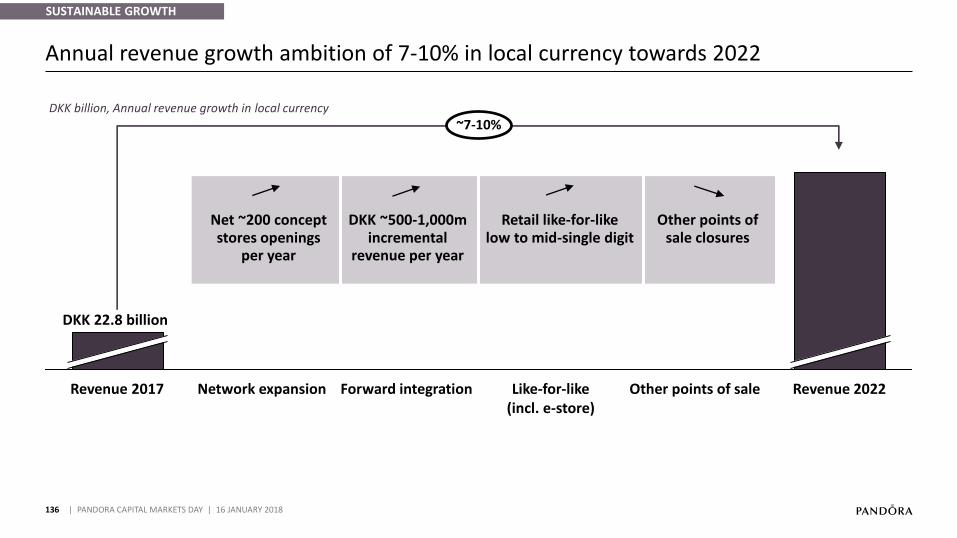
136
Annual revenue growth ambition of 7-10% in local currency towards 2022
| PANDORA CAPITAL MARKETS DAY | 16 JANUARY 2018
Like-for-like (incl. e-store)
Network expansionRevenue 2017
DKK 22.8 billion
Revenue 2022Forward integration Other points of sale
DKK ~500-1,000m incremental
revenue per year
Other points of sale closures
Retail like-for-like low to mid-single digit
Net ~200 concept stores openings
per year
~7-10%DKK billion, Annual revenue growth in local currency
SUSTAINABLE GROWTH
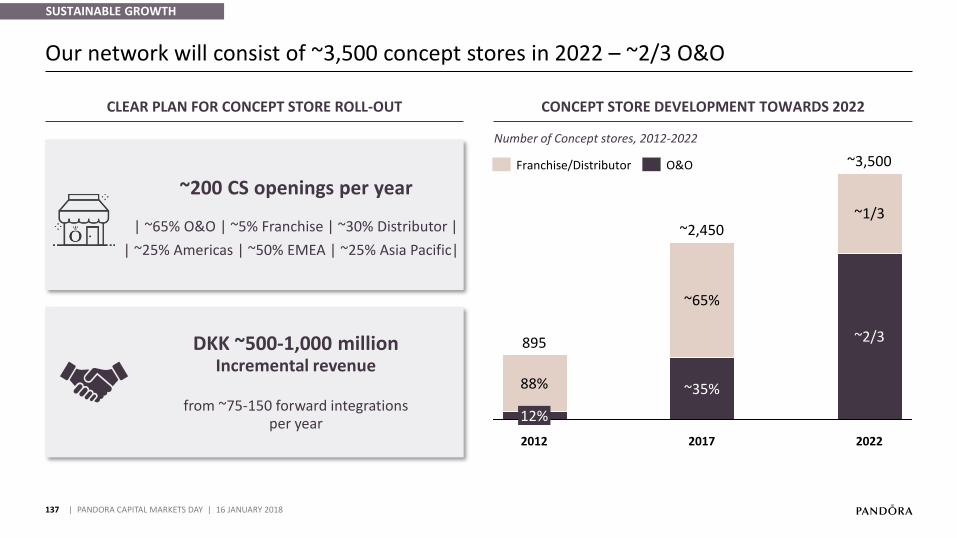
137
Our network will consist of ~3,500 concept stores in 2022 – ~2/3 O&O
| PANDORA CAPITAL MARKETS DAY | 16 JANUARY 2018
~200 CS openings per year
| ~65% O&O | ~5% Franchise | ~30% Distributor |
DKK ~500-1,000 millionIncremental revenue
from ~75-150 forward integrationsper year
CLEAR PLAN FOR CONCEPT STORE ROLL-OUT CONCEPT STORE DEVELOPMENT TOWARDS 2022
88%
~65%
~1/3
12%
2022
~35%
~3,500
~2/3
2012
~2,450
2017
895
Franchise/Distributor O&O
SUSTAINABLE GROWTH
| ~25% Americas | ~50% EMEA | ~25% Asia Pacific|
Number of Concept stores, 2012-2022
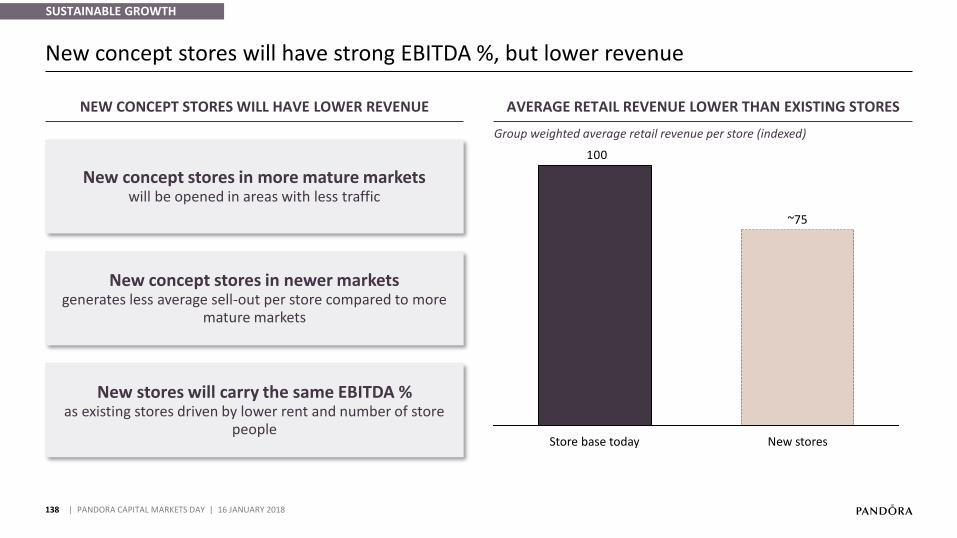
100
New storesStore base today
~75
138
New concept stores will have strong EBITDA %, but lower revenue
| PANDORA CAPITAL MARKETS DAY | 16 JANUARY 2018
NEW CONCEPT STORES WILL HAVE LOWER REVENUE AVERAGE RETAIL REVENUE LOWER THAN EXISTING STORES
Group weighted average retail revenue per store (indexed)
New concept stores in more mature marketswill be opened in areas with less traffic
New concept stores in newer marketsgenerates less average sell-out per store compared to more
mature markets
New stores will carry the same EBITDA %as existing stores driven by lower rent and number of store
people
SUSTAINABLE GROWTH
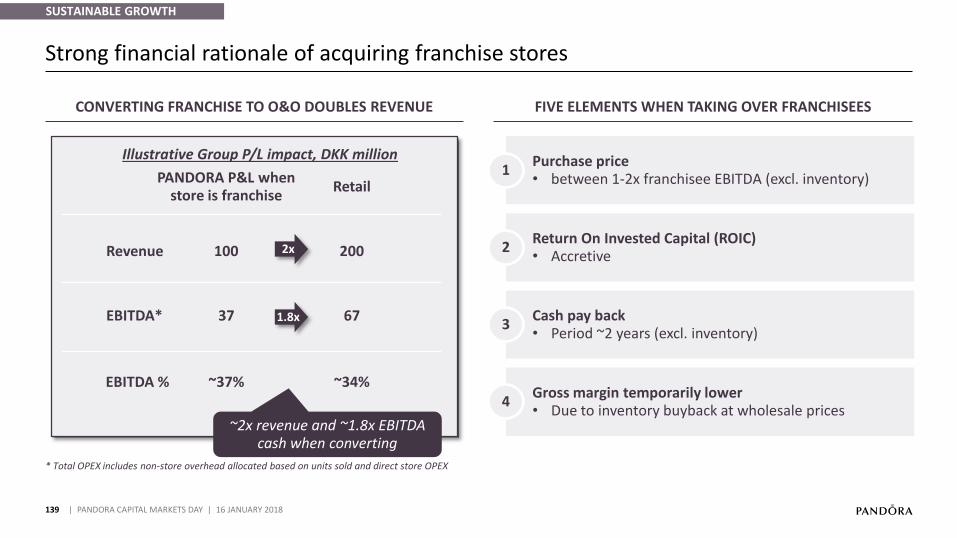
139
* Total OPEX includes non-store overhead allocated based on units sold and direct store OPEX
Strong financial rationale of acquiring franchise stores
| PANDORA CAPITAL MARKETS DAY | 16 JANUARY 2018
Illustrative Group P/L impact, DKK million
PANDORA P&L when store is franchise
Retail
2xRevenue 100 200
EBITDA % ~37% ~34%
EBITDA* 37 671.8x
FIVE ELEMENTS WHEN TAKING OVER FRANCHISEESCONVERTING FRANCHISE TO O&O DOUBLES REVENUE
Purchase pricebetween • 1-2x franchisee EBITDA (excl. inventory)
1
Return On Invested Capital (ROIC)Accretive•
2
Cash pay back • Period ~2 years (excl. inventory)
3
Gross margin temporarily lowerDue to inventory buyback at wholesale prices•
4
~2x revenue and ~1.8x EBITDA cash when converting
SUSTAINABLE GROWTH
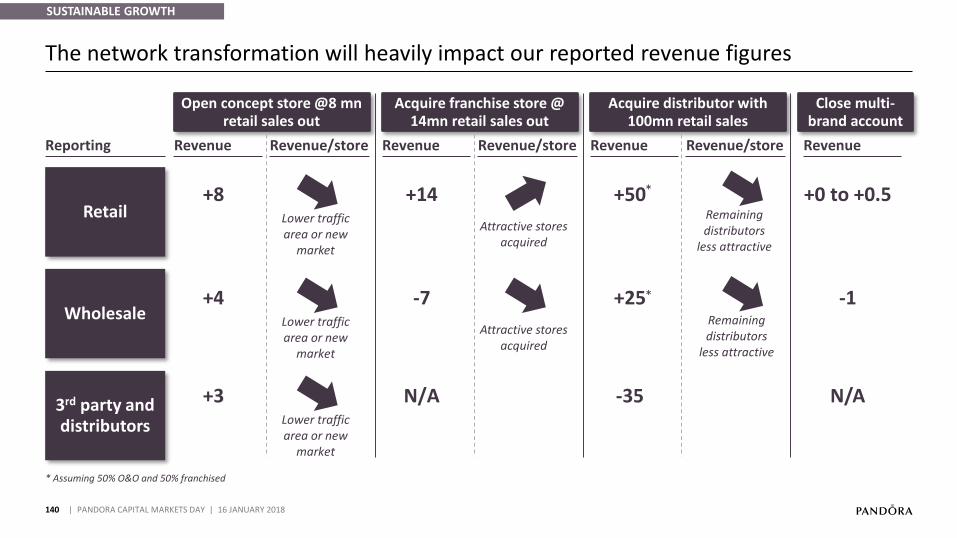
140
* Assuming 50% O&O and 50% franchised
The network transformation will heavily impact our reported revenue figures
| PANDORA CAPITAL MARKETS DAY | 16 JANUARY 2018
Retail
Wholesale
3rd party and distributors
Reporting
Close multi-brand account
Open concept store @8 mnretail sales out
Revenue Revenue/store
+8Lower traffic area or new
market
+4Lower traffic area or new
market
+3Lower traffic area or new
market
Revenue
+0 to +0.5
-1
N/A
Acquire distributor with 100mn retail sales
Revenue Revenue/store
+50
+25
-35
Remaining distributors
less attractive
Remaining distributors
less attractive
*
*
Acquire franchise store @ 14mn retail sales out
Revenue Revenue/store
+14
Attractive stores acquired
-7
Attractive stores acquired
N/A
SUSTAINABLE GROWTH
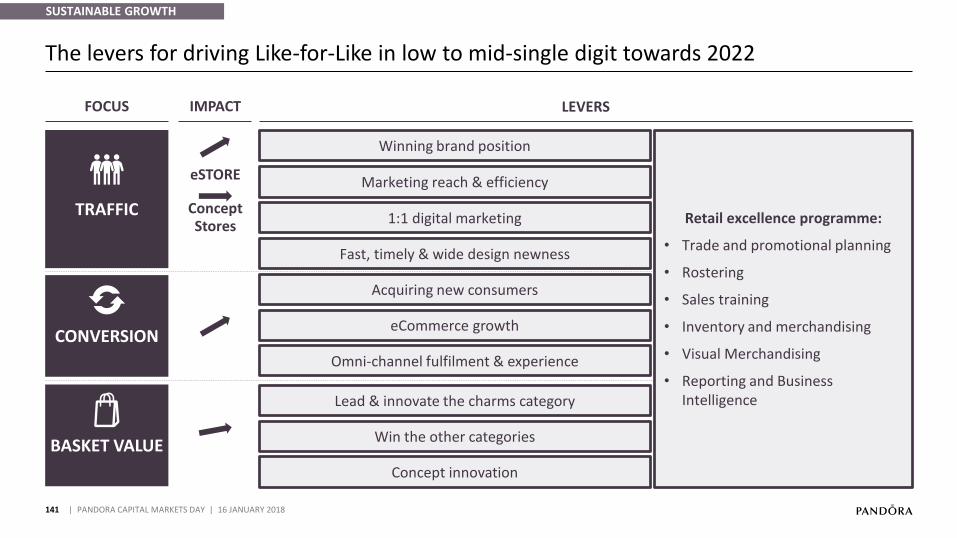
141
The levers for driving Like-for-Like in low to mid-single digit towards 2022
| PANDORA CAPITAL MARKETS DAY | 16 JANUARY 2018
TRAFFIC
CONVERSION
BASKET VALUE
eSTORE
Concept Stores
Winning brand position
Marketing reach & efficiency
1:1 digital marketing
Omni-channel fulfilment & experience
eCommerce growth
Lead & innovate the charms category
FOCUS IMPACT LEVERS
Retail excellence programme:
• Trade and promotional planning
• Rostering
• Sales training
• Inventory and merchandising
• Visual Merchandising
• Reporting and Business Intelligence
SUSTAINABLE GROWTH
Concept innovation
Win the other categories
Acquiring new consumers
Fast, timely & wide design newness
141
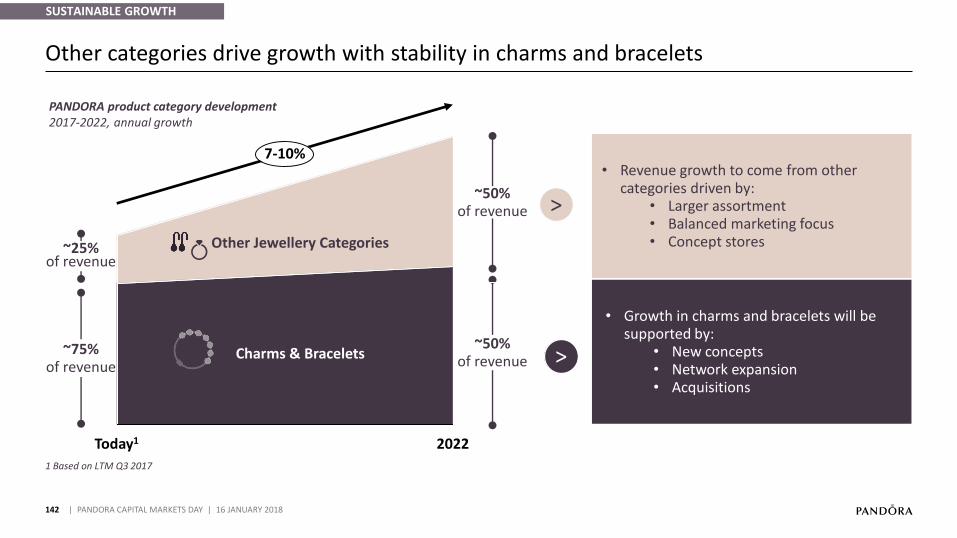
142
1 Based on LTM Q3 2017
Other categories drive growth with stability in charms and bracelets
| PANDORA CAPITAL MARKETS DAY | 16 JANUARY 2018
~25%of revenue
~75%of revenue
~50%of revenue
~50%of revenue
Today1 2022
7-10%
Charms & Bracelets
Other Jewellery Categories
Growth in charms and bracelets will be •supported by:
New concepts •Network expansion•Acquisitions•
>
PANDORA product category development2017-2022, annual growth
• Revenue growth to come from other categories driven by:
• Larger assortment• Balanced marketing focus• Concept stores
>
SUSTAINABLE GROWTH
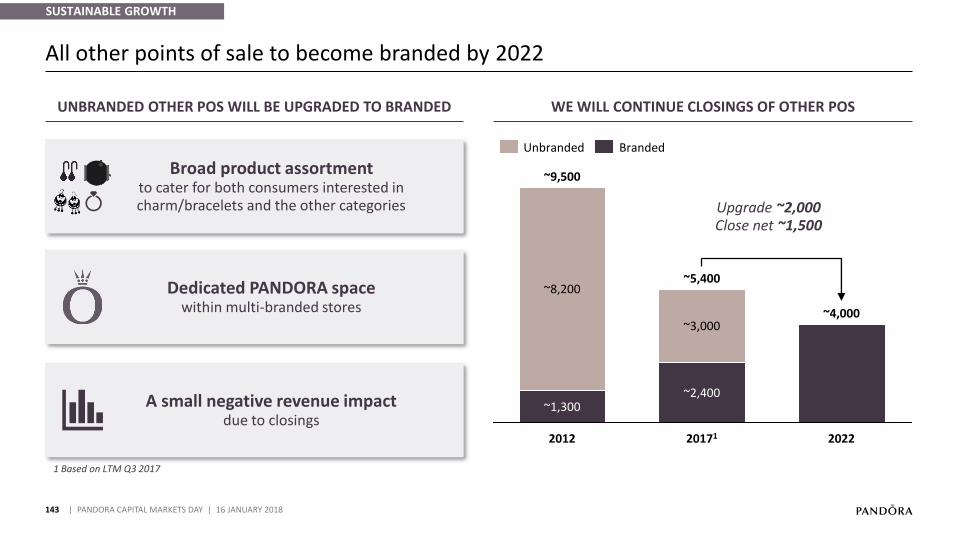
143
All other points of sale to become branded by 2022
| PANDORA CAPITAL MARKETS DAY | 16 JANUARY 2018
~9,500
~1,300
~8,200
20171
~5,400
2022
~4,000
~2,400
2012
~3,000
Unbranded Branded
WE WILL CONTINUE CLOSINGS OF OTHER POSUNBRANDED OTHER POS WILL BE UPGRADED TO BRANDED
Dedicated PANDORA spacewithin multi-branded stores
Broad product assortmentto cater for both consumers interested incharm/bracelets and the other categories
A small negative revenue impactdue to closings
Upgrade ~2,000Close net ~1,500
SUSTAINABLE GROWTH
1 Based on LTM Q3 2017
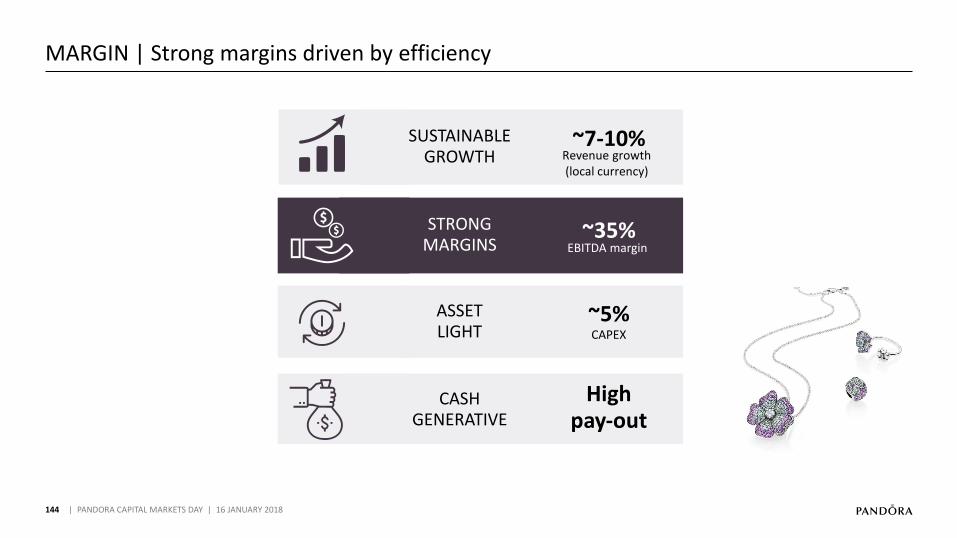
144
MARGIN | Strong margins driven by efficiency
| PANDORA CAPITAL MARKETS DAY | 16 JANUARY 2018
SUSTAINABLE GROWTH
~7-10%
STRONG MARGINS
~35%
ASSET LIGHT
~5% CAPEX
CASH GENERATIVE
High pay-out
EBITDA margin
Revenue growth(local currency)
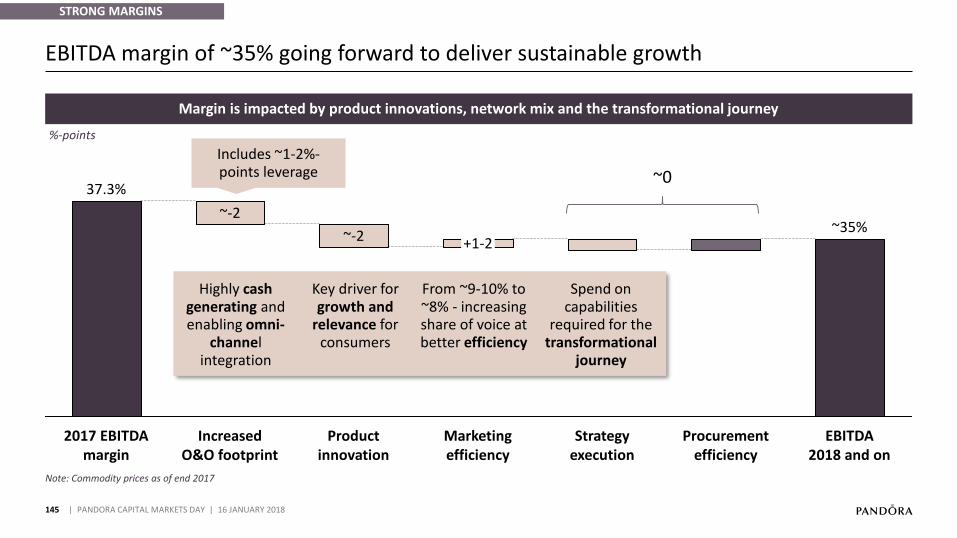
145
EBITDA margin of ~35% going forward to deliver sustainable growth
| PANDORA CAPITAL MARKETS DAY | 16 JANUARY 2018
~-2 +1-2
Procurement efficiency
2017 EBITDAmargin
Increased O&O footprint
Product innovation
Marketing efficiency
~-2
Strategy execution
37.3%
EBITDA 2018 and on
~35%
%-points
Key driver for growth and
relevance for consumers
Highly cash generating and enabling omni-
channel integration
From ~9-10% to ~8% - increasing share of voice at better efficiency
Margin is impacted by product innovations, network mix and the transformational journey
~0
Includes ~1-2%-points leverage
Spend on capabilities
required for the transformational
journey
Note: Commodity prices as of end 2017
STRONG MARGINS
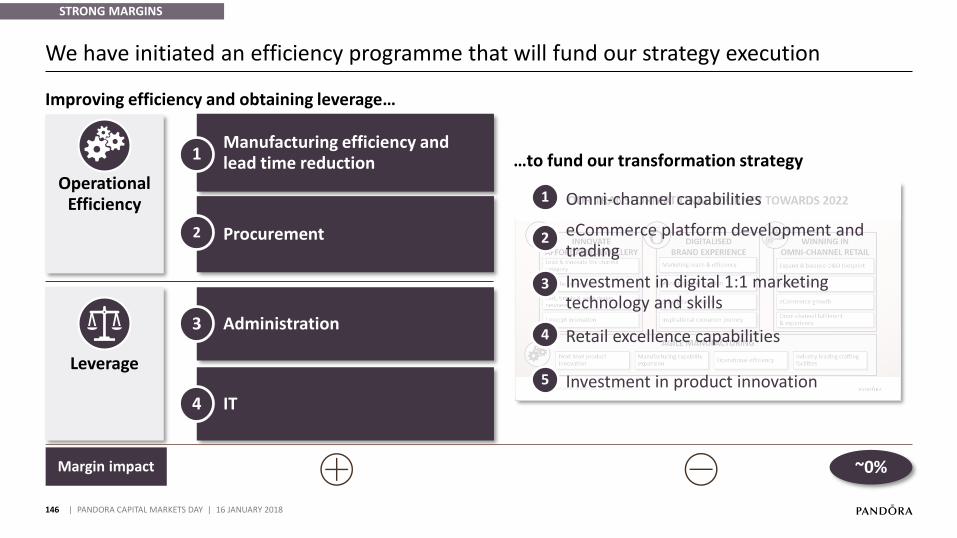
Leverage
146
We have initiated an efficiency programme that will fund our strategy execution
| PANDORA CAPITAL MARKETS DAY | 16 JANUARY 2018
Manufacturing efficiency and lead time reduction1
Operational Efficiency
Procurement2
Administration3
IT4
Improving efficiency and obtaining leverage…
Margin impact ~0%
1 Omni-channel capabilities
Investment in digital 1:1 marketing technology and skills
Retail excellence capabilities
Investment in product innovation
3
…to fund our transformation strategy
4
5
2 eCommerce platform development and trading
STRONG MARGINS
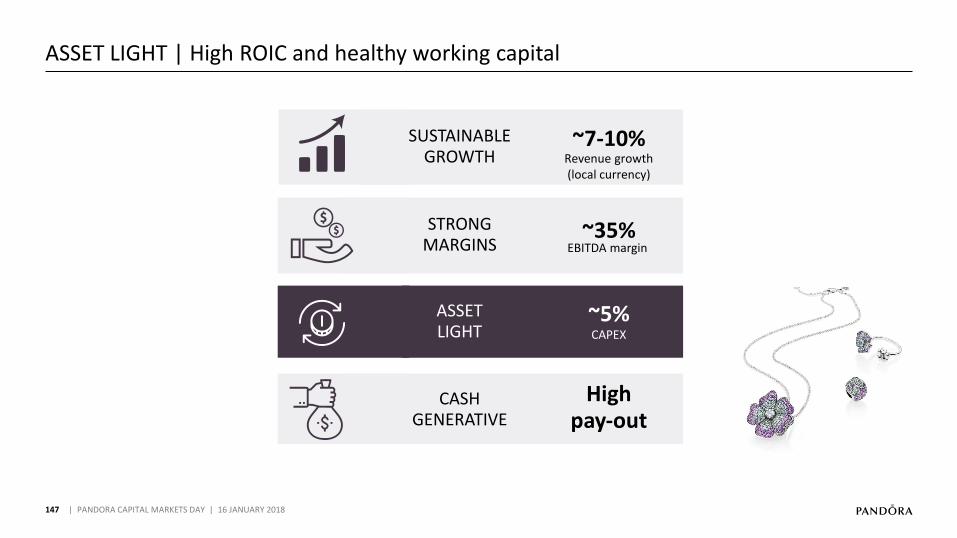
147
ASSET LIGHT | High ROIC and healthy working capital
| PANDORA CAPITAL MARKETS DAY | 16 JANUARY 2018
SUSTAINABLE GROWTH
~7-10%
ASSET LIGHT
~5% CAPEX
CASH GENERATIVE
High pay-out
STRONG MARGINS
~35%EBITDA margin
Revenue growth(local currency)
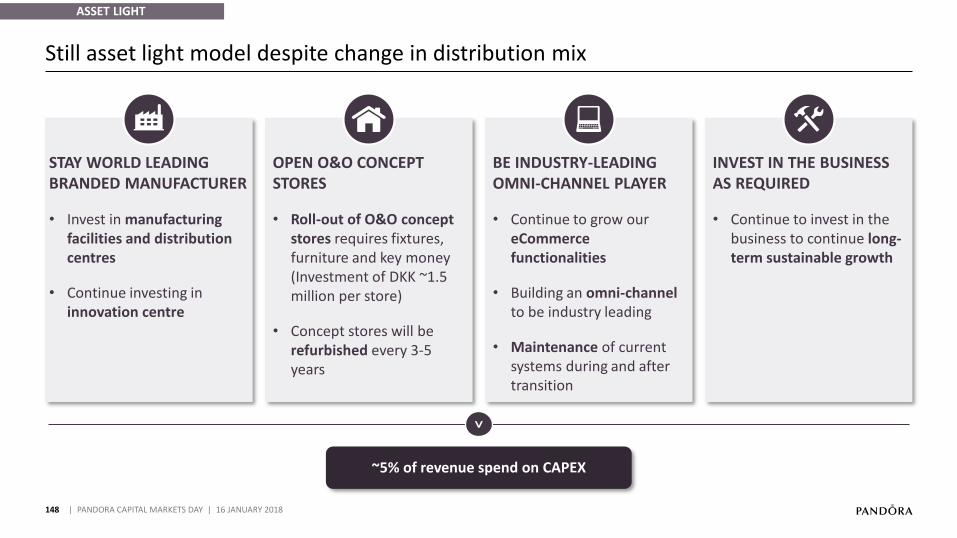
STAY WORLD LEADING BRANDED MANUFACTURER
• Invest in manufacturing facilities and distribution centres
• Continue investing in innovation centre
BE INDUSTRY-LEADING OMNI-CHANNEL PLAYER
• Continue to grow our eCommerce functionalities
• Building an omni-channelto be industry leading
• Maintenance of current systems during and after transition
OPEN O&O CONCEPT STORES
Roll• -out of O&O concept stores requires fixtures, furniture and key money (Investment of DKK ~1.5 million per store)
Concept stores will be •
refurbished every 3-5 years
INVEST IN THE BUSINESS AS REQUIRED
Continue to invest in the •
business to continue long-term sustainable growth
148
Still asset light model despite change in distribution mix
| PANDORA CAPITAL MARKETS DAY | 16 JANUARY 2018
ASSET LIGHT
~5% of revenue spend on CAPEX>
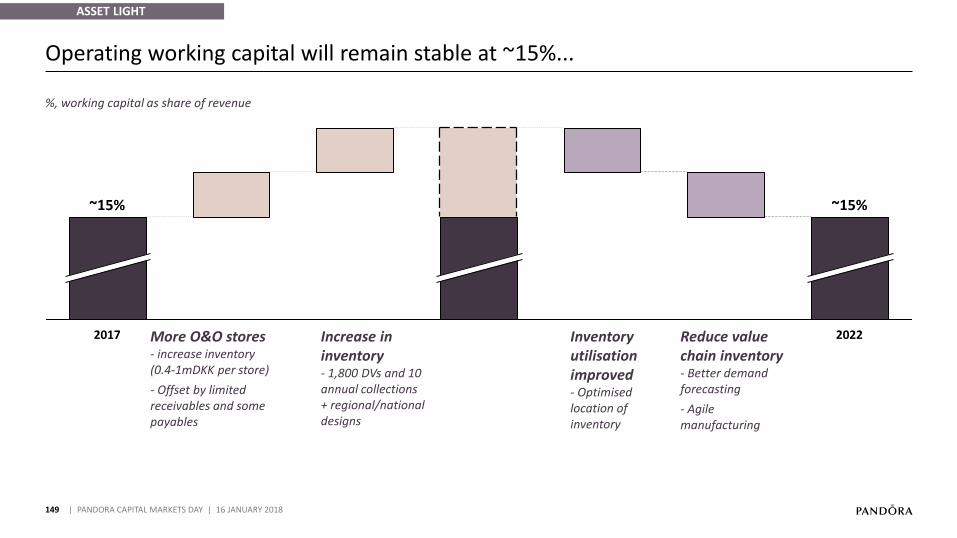
149
Operating working capital will remain stable at ~15%...
| PANDORA CAPITAL MARKETS DAY | 16 JANUARY 2018
2022
~15%~15%
2017
%, working capital as share of revenue
More O&O stores - increase inventory (0.4-1mDKK per store)
- Offset by limited receivables and some payables
Increase in inventory- 1,800 DVs and 10 annual collections + regional/national designs
Inventory utilisation improved- Optimised location of inventory
Reduce value chain inventory - Better demand forecasting
- Agile manufacturing
ASSET LIGHT
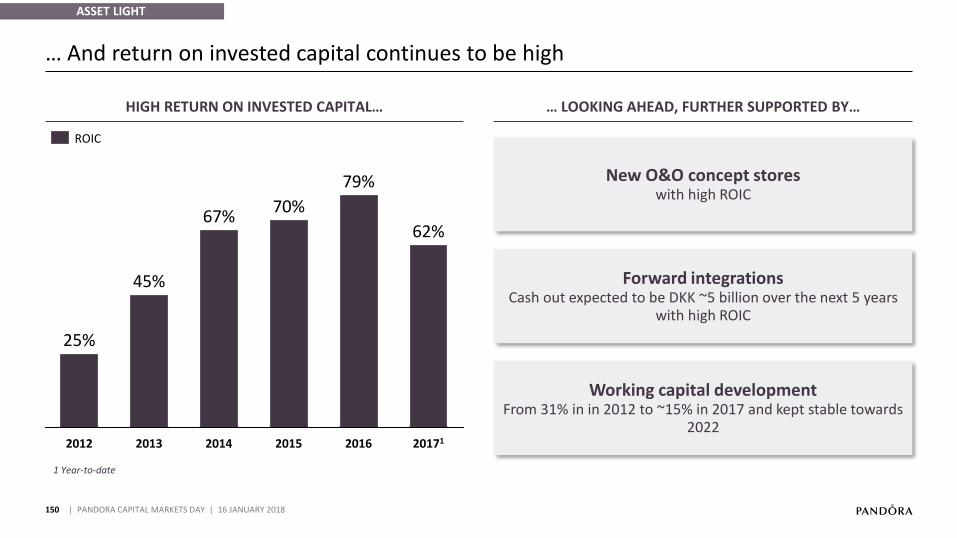
150
… And return on invested capital continues to be high
| PANDORA CAPITAL MARKETS DAY | 16 JANUARY 2018
ASSET LIGHT
20142013
67%
45%
25%
2012 201712016
79%
2015
62%
70%
ROIC
… LOOKING AHEAD, FURTHER SUPPORTED BY…HIGH RETURN ON INVESTED CAPITAL…
New O&O concept storeswith high ROIC
Forward integrationsCash out expected to be DKK ~5 billion over the next 5 years
with high ROIC
Working capital developmentFrom 31% in in 2012 to ~15% in 2017 and kept stable towards
2022
1 Year-to-date
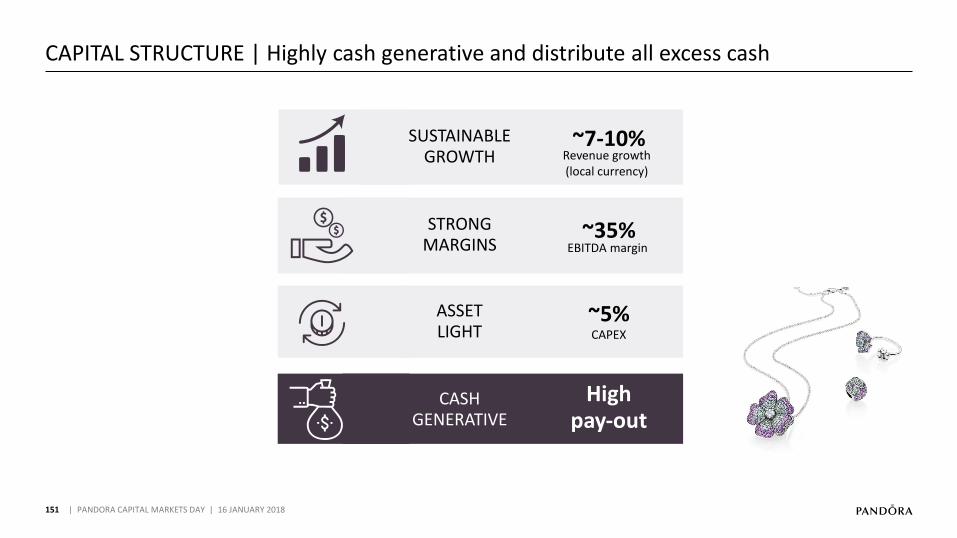
151
CAPITAL STRUCTURE | Highly cash generative and distribute all excess cash
| PANDORA CAPITAL MARKETS DAY | 16 JANUARY 2018
SUSTAINABLE GROWTH
~7-10%
ASSET LIGHT
~5% CAPEX
CASH GENERATIVE
High pay-out
STRONG MARGINS
~35%EBITDA margin
Revenue growth(local currency)
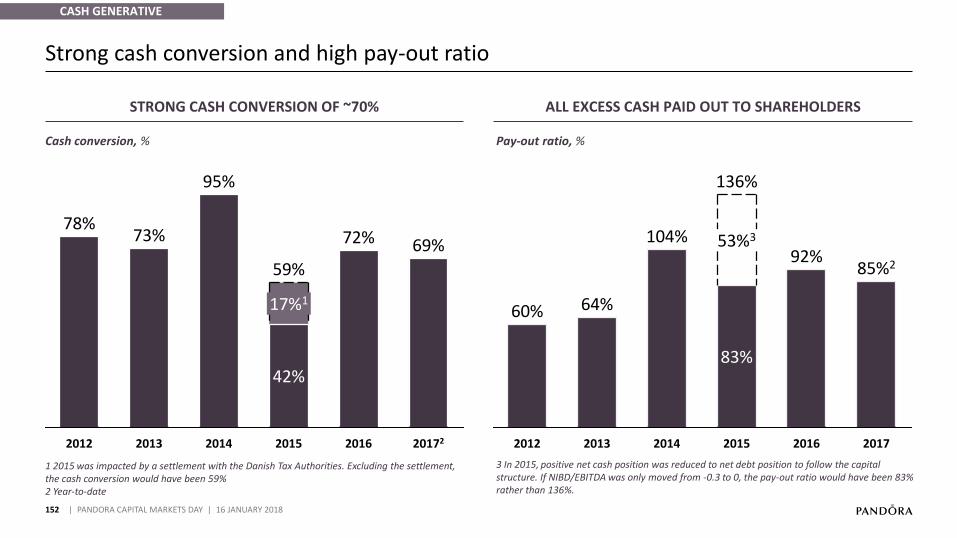
152
1 2015 was impacted by a settlement with the Danish Tax Authorities. Excluding the settlement, the cash conversion would have been 59%2 Year-to-date
Strong cash conversion and high pay-out ratio
| PANDORA CAPITAL MARKETS DAY | 16 JANUARY 2018
Pay-out ratio, %Cash conversion, %
2017220142012
73%78%
2016
59%
72%
2015
42%
17%1
95%
2013
69%
CASH GENERATIVE
ALL EXCESS CASH PAID OUT TO SHAREHOLDERSSTRONG CASH CONVERSION OF ~70%
3 In 2015, positive net cash position was reduced to net debt position to follow the capital structure. If NIBD/EBITDA was only moved from -0.3 to 0, the pay-out ratio would have been 83% rather than 136%.
53%3
136%
104%
64%
2014
83%
60%
2013 2016
85%2
20172015
92%
2012
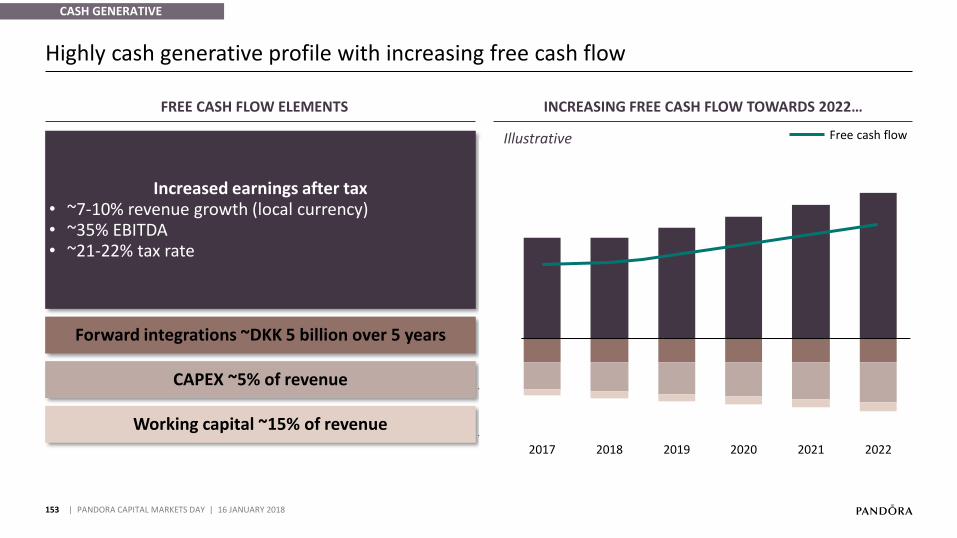
-4
-2
0
2
4
6
8
-4
-2
0
2
4
6
8
10
12
14
2017 2018 20212020 20222019
153
Highly cash generative profile with increasing free cash flow
| PANDORA CAPITAL MARKETS DAY | 16 JANUARY 2018
FREE CASH FLOW ELEMENTS INCREASING FREE CASH FLOW TOWARDS 2022…
Increased earnings after tax• ~7-10% revenue growth (local currency)• ~35% EBITDA• ~21-22% tax rate
Forward integrations ~DKK 5 billion over 5 years
CAPEX ~5% of revenue
Working capital ~15% of revenue
CASH GENERATIVE
Free cash flowIllustrative
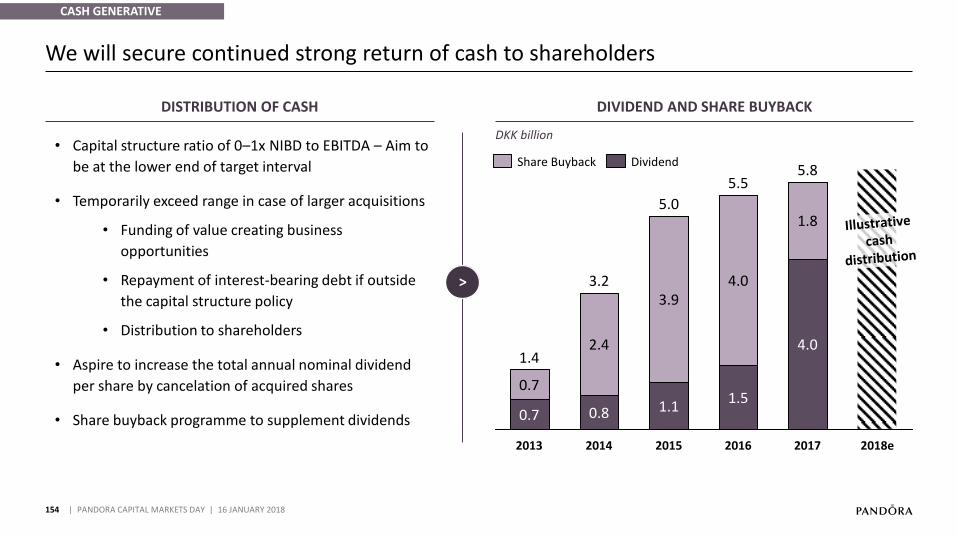
154
We will secure continued strong return of cash to shareholders
| PANDORA CAPITAL MARKETS DAY | 16 JANUARY 2018
2015
4.0
2017
5.8
1.5
2018e
1.8
5.5
4.0
2016
3.93.2
0.8
2.4
2013
1.4
2014
0.7
0.7
1.1
5.0
Share Buyback Dividend
>
• Capital structure ratio of 0–1x NIBD to EBITDA – Aim to
be at the lower end of target interval
• Temporarily exceed range in case of larger acquisitions
• Funding of value creating business
opportunities
• Repayment of interest-bearing debt if outside
the capital structure policy
• Distribution to shareholders
• Aspire to increase the total annual nominal dividend
per share by cancelation of acquired shares
• Share buyback programme to supplement dividends
DISTRIBUTION OF CASH DIVIDEND AND SHARE BUYBACK
DKK billion
CASH GENERATIVE
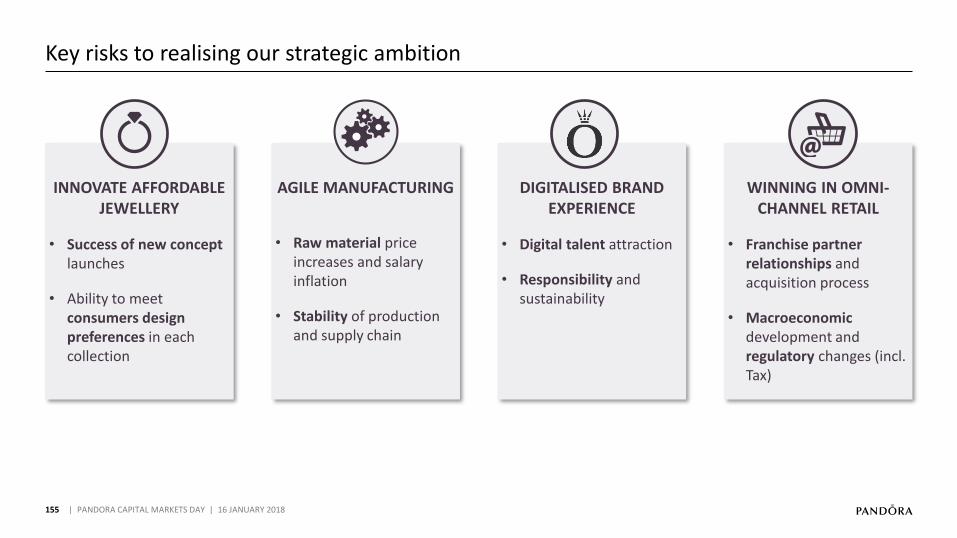
155
Key risks to realising our strategic ambition
| PANDORA CAPITAL MARKETS DAY | 16 JANUARY 2018
INNOVATE AFFORDABLE JEWELLERY
• Success of new concept launches
• Ability to meet consumers design preferences in each collection
AGILE MANUFACTURING
• Raw material price increases and salary inflation
• Stability of production and supply chain
DIGITALISED BRAND EXPERIENCE
Digital talent • attraction
Responsibility • and sustainability
WINNING IN OMNI-CHANNEL RETAIL
Franchise partner •
relationships and acquisition process
Macroeconomic •
development and regulatory changes (incl. Tax)
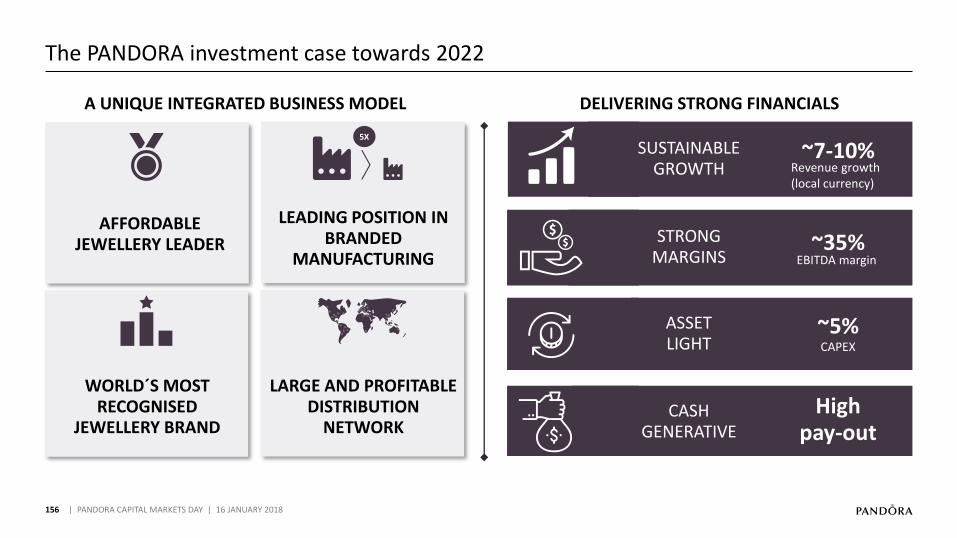
156
The PANDORA investment case towards 2022
| PANDORA CAPITAL MARKETS DAY | 16 JANUARY 2018
A UNIQUE INTEGRATED BUSINESS MODEL DELIVERING STRONG FINANCIALS
5X
LARGE AND PROFITABLE DISTRIBUTION
NETWORK
LEADING POSITION IN BRANDED
MANUFACTURING
AFFORDABLE JEWELLERY LEADER
WORLD´S MOST RECOGNISED
JEWELLERY BRAND
SUSTAINABLE GROWTH
~7-10%
STRONG MARGINS
~35%
ASSET LIGHT
~5% CAPEX
CASH GENERATIVE
High pay-out
EBITDA margin
Revenue growth(local currency)
01
2017 PERFORMANCEAnders Colding Friis, President & CEO
02
NEW STRATEGY TOWARDS 2022Anders Colding Friis, President & CEO
07
FINANCIAL OUTLOOK TOWARDS 2022Peter Vekslund, EVP & CFO
06
WINNING IN OMNI-CHANNEL RETAILDavid Allen, President, EMEA
05
Minna Philipson, SVP & Chief Marketing Officer
DIGITALISED BRAND EXPERIENCE
03
Stephen Fairchild, SVP & Chief Creative Officer
INNOVATE AFFORDABLE JEWELLERY
157
08 | CLOSING REMARKS
| PANDORA CAPITAL MARKETS DAY | 16 JANUARY 2018
04
Thomas Touborg, SVP, Group Operations
AGILE MANUFACTURING
08
CLOSING REMARKSPeder Tuborgh, Chairman of the Board
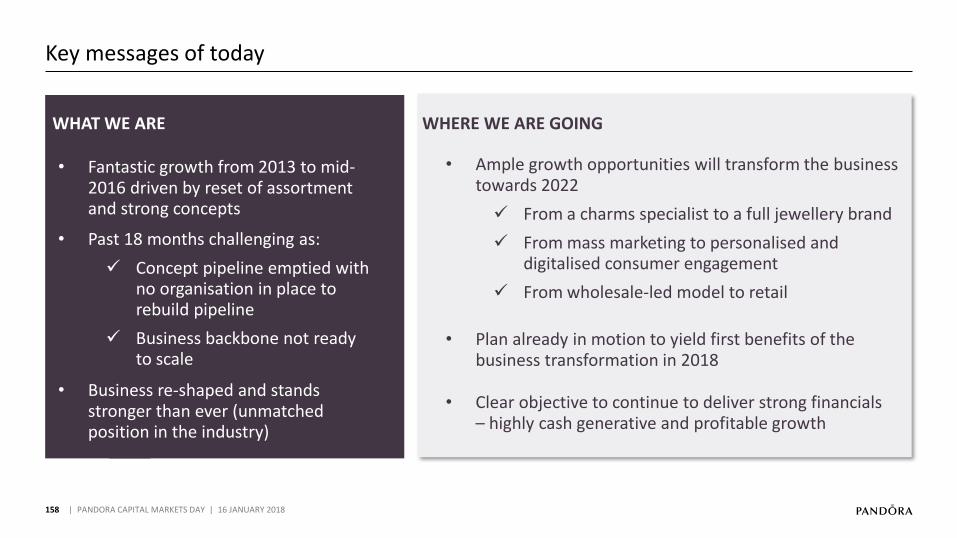
158
Key messages of today
| PANDORA CAPITAL MARKETS DAY | 16 JANUARY 2018
WHAT WE ARE WHERE WE ARE GOING
• Fantastic growth from 2013 to mid-2016 driven by reset of assortment and strong concepts
• Business re-shaped and stands stronger than ever (unmatched position in the industry)
Ample growth opportunities will transform the business •towards 2022
From a charms specialist to a full jewellery brand✓
From mass marketing to personalised and ✓
digitalised consumer engagement
From wholesale✓ -led model to retail
Past • 18 months challenging as:
Concept pipeline emptied with ✓
no organisation in place to rebuild pipeline
Business backbone not ready ✓
to scale
Clear objective to continue to deliver strong financials •– highly cash generative and profitable growth
• Plan already in motion to yield first benefits of the business transformation in 2018

LEADING POSITION IN BRANDED MANUFACTURING
159
Looking ahead, PANDORA has a unique platform to build on with an integrated value chain
AFFORDABLE JEWELLERY LEADER
WORLD’S MOST RECOGNISED JEWELLERY
BRAND
LARGE AND PROFITABLE DISTRIBUTION NETWORK
PRODUCT DESIGN & DEVELOPMENT
SOURCING &
PRODUCTIONMARKETING RETAIL1 2 3 4
AFFORDABLE LUXURY LEADER WITH UNIQUE INTEGRATED BUSINESS MODEL
~75 million charms per year - global category leader
5 times manufacturing capacity of nearest
competitor
#1 most recognised
jewellery brand in the world
with 83% aided awareness
#3 largest distribution
footprint with ~2,450 concept stores
5X
| PANDORA CAPITAL MARKETS DAY | 16 JANUARY 2018

160
PANDORA will look different in 2022
New categories~50%
Drops and +500 new products per year10
New concept per year1
Industry leading digital consumer experience*
#1
Marketing spend~8%
Spend on digital media~60%
Concept stores~3,500
O&O share (# of stores)~65%
eSTORE share of revenue~10-15%
WINNING IN OMNI-CHANNEL RETAIL
DIGITALISED BRAND EXPERIENCE
INNOVATE AFFORDABLE JEWELLERY
AGILE MANUFACTURING
weeks manufacturing lead time4 months new product
launch (fast track)4 units in total production capacity
200 million
* L2 benchmark
| PANDORA CAPITAL MARKETS DAY | 16 JANUARY 2018

161
The PANDORA investment case towards 2022
| PANDORA CAPITAL MARKETS DAY | 16 JANUARY 2018
A UNIQUE INTEGRATED BUSINESS MODEL DELIVERING STRONG FINANCIALS
5X
LARGE AND PROFITABLE DISTRIBUTION
NETWORK
LEADING POSITION IN BRANDED
MANUFACTURING
AFFORDABLE JEWELLERY LEADER
WORLD´S MOST RECOGNISED
JEWELLERY BRAND
SUSTAINABLE GROWTH
~7-10%
STRONG MARGINS
~35%
ASSET LIGHT
~5% CAPEX
CASH GENERATIVE
High pay-out
EBITDA margin
Revenue growth(local currency)

Certain statements in this presentation constitute forward-looking statements. Forward-looking statements are statements(other than statements of historical fact) relating to futureevents and our anticipated or planned financial and operationalperformance. The words “targets,” “believes,” “expects,”“aims,” “intends,” “plans,” “seeks,” “will,” “may,” “might,”“anticipates,” “would,” “could,” “should,” “continues,”“estimates” or similar expressions or the negatives thereof,identify certain of these forward-looking statements. Otherforward-looking statements can be identified in the context inwhich the statements are made. Forward-looking statementsinclude, among other things, statements addressing matterssuch as our future results of operations; our financial condition;our working capital, cash flows and capital expenditures; andour business strategy, plans and objectives for future operationsand events, including those relating to our ongoing operationaland strategic reviews, expansion into new markets, futureproduct launches, points of sale and production facilities; and
Although we believe that the expectations reflected in theseforward-looking statements are reasonable, such forward-looking statements involve known and unknown risks,uncertainties and other important factors that could cause ouractual results, performance or achievements or industry results,to differ materially from any future results, performance orachievements expressed or implied by such forward-lookingstatements. Such risks, uncertainties and other importantfactors include, among others: global and local economic
conditions; changes in market trends and end-consumerpreferences; fluctuations in the prices of raw materials, currencyexchange rates, and interest rates; our plans or objectives forfuture operations or products, including our ability to introducenew jewellery and non-jewellery products; our ability to expandin existing and new markets and risks associated with doingbusiness globally and, in particular, in emerging markets;competition from local, national and international companies inthe United States, Australia, Germany, the United Kingdom andother markets in which we operate; the protection andstrengthening of our intellectual property rights, includingpatents and trademarks; the future adequacy of our currentwarehousing, logistics and information technology operations;changes in Danish, E.U., Thai or other laws and regulations orany interpretation thereof, applicable to our business; increasesto our effective tax rate or other harm to our business as a resultof governmental review of our transfer pricing policies,conflicting taxation claims or changes in tax laws; and otherfactors referenced to in this presentation.
Should one or more of these risks or uncertainties materialise,or should any underlying assumptions prove to be incorrect, ouractual financial condition, cash flows or results of operationscould differ materially from that described herein as anticipated,believed, estimated or expected.
We do not intend, and do not assume any obligation, to updateany forward-looking statements contained herein, except as
may be required by law or the rules of Nasdaq Copenhagen. Allsubsequent written and oral forward-looking statementsattributable to us or to persons acting on our behalf areexpressly qualified in their entirety by the cautionary statementsreferred to above and contained elsewhere in this presentation.
162
DISCLAIMER
| PANDORA CAPITAL MARKETS DAY | 16 JANUARY 2018