Key Features of Electricity Spot Market · PDF fileKey Features of Electricity Spot Market...
25
Key Features of Electricity Spot Market Risk PowerGen Asia 2015 Sarah Fairhurst
Transcript of Key Features of Electricity Spot Market · PDF fileKey Features of Electricity Spot Market...

The Lantau Group
Key Features of Electricity Spot Market Risk PowerGen Asia 2015
Sarah Fairhurst

The Lantau Group
Oranges and electricity spot markets
• Imagine you wish to buy an orange… …you choose your grocer or supermarket, enter,
pick up an orange, check it has no flaws, note the price, take it to the checkout and pay. Then
you take it home and eat it. Simple.
• But what if the orange was instead electricity purchased from an electricity spot market?
– No choice of shop – you have to go to the spot market
– You cannot just enter, first you have to meet a number of requirements, including prudentials which
require letters of credit or other financial guarantees
– The only electricity on offer is the one at the spot price…”quality” is defined by the market
– It’s all real time, you have to “consume” your electricity there and then, before you pay for it
– And the price of the electricity is changing all the time. By the time you “check out” it may be very
expensive… but you already consumed it!
Trading electricity in spot markets is a risky business
Fruit analogies, or indeed lessons from other industries, may be unhelpful in understanding the risks
1
The Lantau Group
Even stock exchanges are not much like electricity
markets… after all.. When was the last time you
absolutely HAD to buy a stock at 2:06pm irrespective of
its price?
Lesson 1: Electricity is unlike any other market or
trading arrangement.
Extrapolating from other industries without
understanding the details of the electricity market can
be very risky indeed
2

The Lantau Group
Key risks include
• The big risk is the price risk:
– The price at which electricity is bought and sold varies by the hour or half hour (in some markets every 5
minutes)
• But electricity markets are also “real time” and purchasers pay after they take the power
• The real-time nature of the market combines with the price risk to create other risks for market
participants
– Credit risks for generators if purchasers take electricity but do not pay the price
– Tariff risks for retailers if they cannot predict or manage the price of supply to consumers
• And for non participants
– Supply risks for consumers if the market does not incentivise enough generation or if the retailers cannot
manage purchasing
– Political risks for Governments if the market does not work and power does not flow
Management of risk is not just prudent, it’s essential for spot markets to operate in the long term. Markets where risk is
not managed will ultimately fail
3

The Lantau Group
Analysing electricity spot markets without their context
will miss some of the biggest risks market participants
face, particularly in developing countries
Lesson 2: There are the obvious large risks in
electricity markets…. And then there are the less
obvious, often even larger risks associated with all
the arrangements around the market and the political
and economic environment the market exists in
4

The Lantau Group
So – what is driving the prices and price risk?
• At its core, energy pricing is simple supply and demand
5
Singapore Merit Order
0
50
100
150
200
250
300
350
400
0 1,000 2,000 3,000 4,000 5,000 6,000 7,000 8,000 9,000
Capacity (MW)
Dis
pa
tch
Co
st
(S$
/MW
h)
KeppelNEASembCorpTuasSenokoSerayaNew Entry Load
Market
Price
Supply
Curve
The Lantau Group
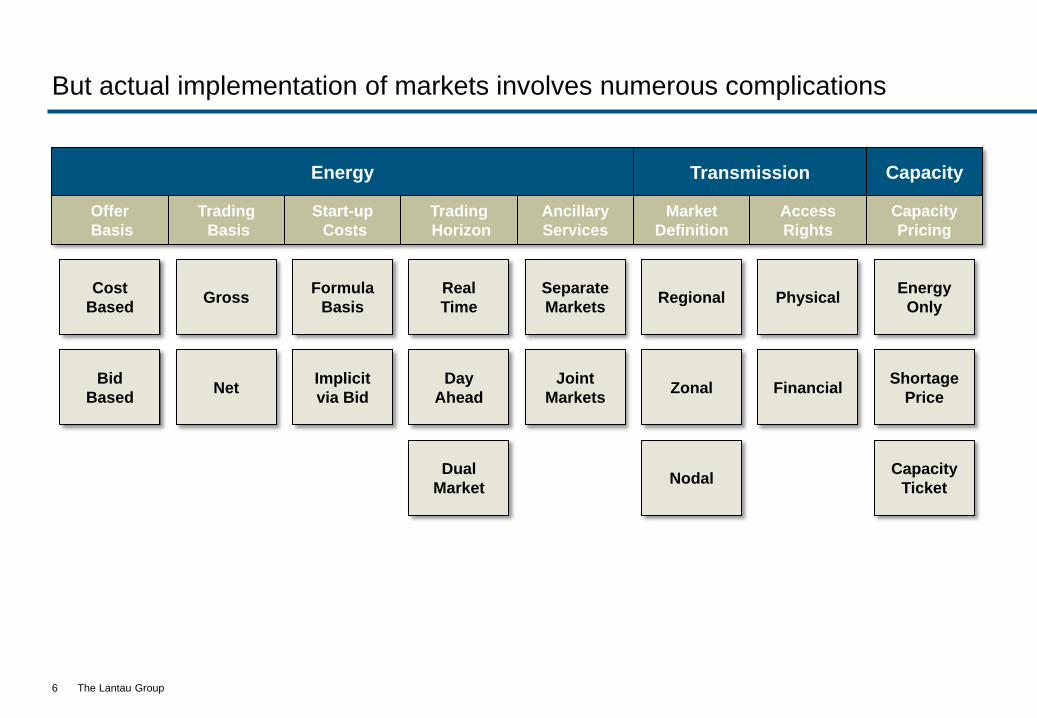
But actual implementation of markets involves numerous complications
6
Cost
Based
Bid
Based
Formula
Basis
Implicit
via Bid
Real
Time
Day
Ahead
Dual
Market
Separate
Markets
Joint
Markets
Regional
Zonal
Nodal
Energy
Only
Shortage
Price
Capacity
Ticket
Gross
Net
Physical
Financial
Energy Transmission Capacity
Offer
Basis
Start-up
Costs
Trading
Horizon
Ancillary
Services
Trading
Basis
Access
Rights
Market
Definition
Capacity
Pricing

The Lantau Group
Resulting in markets with many different designs
7
Component Element Singapore Philippines Korea Western
Australia
Eastern
Australia
New
Zealand
Energy Offer
Basis Bid-based Bid-based Cost-based Confused Bid-based Bid-based
Trading
Basis Gross Gross Gross Net Gross Gross
Start-Up
Costs Via bid Via bid Formula Via bid Via Bid Via Bid
Trading
Horizon Real-time Joint Day-ahead Day-ahead Real-time Real-time
Ancillary
Services Joint Separate Separate Confused Joint Joint
Transmission Market
Definition Nodal Nodal Zonal Regional
Regional
nodes Nodal
Access
Rights None None None
Access
Arrangement None Financial
Capacity Capacity
Pricing Energy-only Energy-only
Shortage
price
Fixed pricing
(originally) Energy-only Energy-only

The Lantau Group
The absolute size of price risk is a function of how high prices can go .. And
markets have very different price caps
Comparison of Selected Market Price Caps
USD/kWh (approx)
Due to increase
in 2015
0
2
4
6
8
10
12
14
WESM (2013) WESM (post 2013) Singapore NEMS Australian NEM US ERCOT
8

The Lantau Group
Even on the monthly average basis, the volatility in spot markets is apparent.
These high prices are necessary support investment
9
New Zealand historical monthly average final prices
2000-Current at 3 major nodes
Eastern Australia historical monthly average final prices
2000-Current at 3 major nodes
Without investment, price spikes get worse, the market fails, and huge value is destroyed

The Lantau Group
What drives price volatility in spot markets?
• Electricity spot price is set in each trading interval where the supply of electricity (offered by
generators) intersects with the demand for electricity (by customers)
• Thus factors which affect price are those which affect supply and demand
Supply
Demand
Price
10

The Lantau Group
Supply side price drivers
• The mix of plant (usually due to the mix of available fuels and policy choices in the past) drives
the shape of the supply curve
• A steeper supply curve tends to result in more volatile pricing
• Additional supply volatility may be caused by
– outages
– transmission constraints
– constrained fuels (e.g. hydro)
– intermittent generators (solar, wind)
11

The Lantau Group
Even relatively close markets can have quite different supply curves
0
25
50
75
100
125
150
175
0 5000 10000 15000 20000
Cumulative MW
Ind
ica
tiv
e M
arg
inal
Co
st
($/M
Wh
)
Approx. Peak Demand
(1999)Approx.Average Demand
(1999)
Cumulative MW 0 500 1000 1500 2000 2500 3000
Ind
icative C
ost ($
/MW
h)
Approx
Peak Demand
Marg
inal C
ost ($
/MW
h)
Market with very flat supply curve –
small changes in demand have very
little impact on prices
Market with steep supply curve –
small changes in demand have a
significant impact on prices
The example above is a historical snapshot of South Australia and Victoria, two adjacent sub-markets in Australia
But Luzon and Visayas, for example, also have quite different supply characteristics
12

The Lantau Group
Demand Side Price Drivers
• A steeper load duration curve tends to drive more volatility
– Steep load duration curves occur when some periods of time have much higher demand than others
• Fluctuations in demand cause by things such as:
– Weather fluctuations
– Seasonal weather (hot summers vs cold winters)
– Seasonal industries (Christmas or Chinese New Year shut downs)
13

The Lantau Group
Weather can have a significant impact in some markets – both within and
between years
7.0
7.5 2012
6.0
9.0
8.5
8.0
Jul Apr Mar Feb Jun May Jan Oct Aug Sep Nov Dec
6.5
5.5
2009
2008
2015
2010
2011
2013
2014
2007
+35%
GW
WESM Luzon grid monthly peak demand (2007-2015)
25
26
27
28
29
30
31
32
Feb Jan Mar Dec Nov Oct Sep Aug Jul Jun May Apr
Monthly average temperatures (Manila)
2015
2014
2013
2012
2011
2010
deg. Celsius
Relationship between hourly GDP-normalised*
demand and temperature in Luzon by time of day
(2006-2014)
Cooling and heating requirements throughout the year mean
that electricity demand is related to temperature.
Electricity is used for both cooling and heating, so weather
fluctuations cause significant impacts on demand
0
1
2
3
4
5
6
7
8
9
15 20 25 30 35 40
Shoulder
Peak
Off-peak
14

The Lantau Group
The shape of demand can vary significantly between different markets
On the one hand, very flat supply curves like
Singapore have relatively small daily
fluctuations in price
On the other hand, peaky markets like
those in the Philippines are much more
volatile
3,000
3,500
4,000
4,500
5,000
5,500
6,000
6,500
7,000
7,500
8,000
1 2 3 4 5 6 7 8 9 10 11 12 13 14 15 16 17 18 19 20 21 22 23 24
SingaporeWeekend Singapore
15

The Lantau Group
Behaviour of participants also drives price outcomes – some markets are more
concentrated than others but all are more concentrated than many other
industries
16
0%
20%
40%
60%
80%
100%
Other
NEM-QSL
CS
Energy
Stanwell
Intergen
Other
NEM-NSW
Macquarie
Origin
Other
WESM
Power
Seraya
SMC
PSALM
Aboitiz
Alinta
Tuas
Other
WEM
NewGen
Verve
NEM-SA
Other
Senoko
Snowy
Hydro
NEMS
Int’l
Power
Alinta
AGL
Energy
Other
Energy
Australia
First
Gen
Source: PEMC (2012 Annual Report); EMC (2012 Annual Report); AER (State of the Energy Market 2013); ERA (2013/14 capacity credits)
NEM
Generation company market share
Oligopoly market power exists in some degree in all energy markets, but so too does significant confusion between “bad”
market power (gaming) and the high prices that arise during periods of true economic scarcity

The Lantau Group
Analysing risk is specific to the market in question and
generic approaches are often unhelpful
Lesson 3: Understanding Market A does not
necessarily mean you understand Market B
17

The Lantau Group
Managing Electricity Spot Market risk depends on the market
• Firstly – understand what drives it: Example Philippines WESM
18
0
2
4
6
8
10
12
14
16
18
20
22
24
26
Jan-14 Jul-13 Jan-13 Jul-12 Jan-12 Jul-11 Jan-11 Jul-10 Jan-10 Jul-09 Jan-09 Jul-08 Jan-08 Jul-07 Jan-07
PhP/kWh
Low
hydro
Gas curtailments
and low hydro
Plant forced maintenance
outages and HVDC link
maintenance
Transformer breakdown and San
Jose substation congestion
Plant outages and
coal limitations
Plant outages
Gas curtailments
and plant outages
Average monthly WESM spot settlement price* (2007-14)
Gas scheduled outage
and plant outages
ERC-
regulated
price
reduction

The Lantau Group
Then decide what your objectives are, and how the risks might affect you
• A generator may wish to secure a minimum generation price and thus contract its output
– How does it manage the risk of being unavailable when the contract is called?
• A retailer may need to sell to franchise customers at a fixed tariff
– How does it ensure volatile spot prices do not result in purchase losses?
19

The Lantau Group
Understand what tools you have available to manage the risk – which also
varies by market
• Financial contracts are one of the most popular ways to manage spot market risk
• Australian NEM - deep and liquid derivative contract market, with a myriad type of contracts and
counterparties including exchange traded contracts that are settled through a clearing house
• Singapore - financial contract market exists but is much less liquid, fewer contract options.
Some hedging of fuel price as a proxy for electricity price
• Philippines - no financial contracts at all; physical bilaterals only and often for “whole of power
station” rather than flexible risk mitigation tools
20

The Lantau Group
Where contracts are not available, consider other mitigation mechanisms
• Vertical integration
– Generators entering into retailing and retailers building generation – is a physical way to mitigate spot
market risks
• Regulation
– In Philippines the regulation is effectively used as risk mitigation mechanism by retailers– gaining approval
for a contract allows fluctuating prices to be passed through to consumers
• Portfolio strategies
– Building a portfolio of supply options mitigates supply risks; having a portfolio of customers may assist in
managing demand side risks
• Customer management
– For contestable retailers choosing customers whose demand profile matches their supply available can be
very helpful (e.g. solar generators)
21
The Lantau Group
And finally, don’t forget the “other” risks also need attention in some markets
• Regulatory management – in markets where regulatory decisions have a surprisingly large
impact on the spot market behaviours and even prices (E.g. Philippines)
• Government management – where policy decisions can change the lay of the land completely
(E.g. carbon in Australia)
• Media management – high electricity prices are big news; manage the story before it manages
your business
22
The Lantau Group
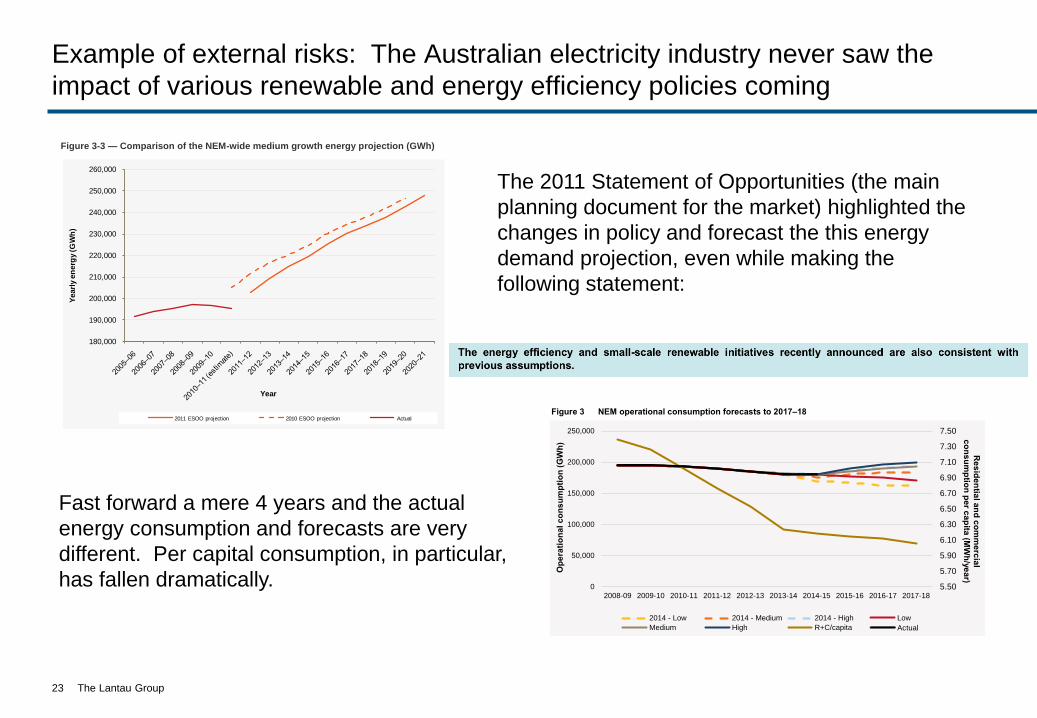
Example of external risks: The Australian electricity industry never saw the
impact of various renewable and energy efficiency policies coming
© AEMO 2011 Energy and demand projections 3-9
Figure 3-3 — Comparison of the NEM-wide medium growth energy projection (GWh)
3.2.2 Maximum demand
Table 3-5 and Table 3-6 present actual and projected summer and winter MDs for the NEM. The 90%, 50%, and
10% POE MD projections are shown for the medium, high, and low growth scenarios.
The summer 10% POE MD is projected to increase over the next 10 years at an annual average rate of:
2.6% under the medium growth scenario, and
3.3% and 2.1% under the high and low growth scenarios, respectively.
The winter 10% POE MD is projected to increase over the next 10 years at an annual average rate of:
2.4% under the medium growth scenario, and
3.3% and 1.8% under the high and low growth scenarios, respectively.
180,000
190,000
200,000
210,000
220,000
230,000
240,000
250,000
260,000
2011 ESOO projection 2010 ESOO projection Actual
Year
Yearl
y e
nerg
y (G
Wh
)
The 2011 Statement of Opportunities (the main
planning document for the market) highlighted the
changes in policy and forecast the this energy
demand projection, even while making the
following statement:
Fast forward a mere 4 years and the actual
energy consumption and forecasts are very
different. Per capital consumption, in particular,
has fallen dramatically.
NATIONAL ELECTRICITY FORECASTING REPORT OVERVIEW
1.2 Comparison to the 2014 NEFR
As shown in Figure 3 below, the medium forecast for operational consumption is higher than the
published 2014 NEFR medium forecast. It is, in fact, closer to the 2014 high consumption forecast.
The changes in the 2015 NEFR forecasts are due to:
A recovery in underlying consumption in the residential and commercial sector, driven by a fall in
electricity prices after the repeal of the carbon price. Per capita consumption is falling more slowly
than in the last two years, and more slowly than AEMO forecast in the 2014 NEFR:
In the 2014 NEFR, per capita consumption was forecast to decrease by 4.4% from 2014–15
to 2017–18, to 5.9 megawatt hours (MWh) per year.
The 2015 NEFR forecasts show a smaller decline, with per capita consumption reducing
by only 2% from 2014–15 to 2017–18, to 6.1 MWh/year.
A decrease in forecast rooftop PV, which increases consumption drawn from the grid. This update
is due to an overestimate of uptake over the last year, and separate modelling in the 2015 NEFR
of rooftop PV in the residential and commercial sectors.
Revisions to the estimated electricity used per terajoule of LNG produced, which have increased
forecast LNG consumption.9 (The estimated volume of exports remains the same.)
Recovery in industrial consumption in some sectors, due to factors including the fall in the
Australian dollar.
1.3 Overview of historical operational consumption
As shown in Figure 3, operational consumption has been declining in the NEM since 2008–09.
In the five years to 2014–15, operational consumption declined by 14,461 GWh to an estimated
180,390 GWh, an average annual decline of 1.5%.
Figure 3 NEM operational consumption forecasts to 2017–18
9 Converting raw gas to LNG requires energy across the supply chain. While the LNG projects source much of their electricity from embedded generators, they also consumer electricity from the grid. See Lewis Grey Advisory, Projections of Gas and Electricity Used in LNG, 15 April 2015 for more details.
5.50
5.70
5.90
6.10
6.30
6.50
6.70
6.90
7.10
7.30
7.50
0
50,000
100,000
150,000
200,000
250,000
2008-09 2009-10 2010-11 2011-12 2012-13 2013-14 2014-15 2015-16 2016-17 2017-18
Re
sid
en
tial a
nd
co
mm
erc
ial
co
nsu
mp
tion
pe
r ca
pita
(MW
h/y
ea
r)
Op
era
tio
na
l c
on
su
mp
tio
n (
GW
h)
2014 - Low 2014 - Medium 2014 - High Low
Medium High R+C/capita Actual
© AEMO 2015 8
23

The Lantau Group
Contact Details
For more information please contact us:
By email General Capabilities Inquiries
Direct Communications
By phone +852 2521 5501 (office)
By mail 4602-4606 Tower 1, Metroplaza
223 Hing Fong Road,
Kwai Fong, Hong Kong
Online www.lantaugroup.com
Rigour
Value
Insight
Networks Electricity Gas
24