Electricity Spot Markets: The Singapore Experience · Electricity Spot Markets: The Singapore...
28
Electricity Spot Markets: The Singapore Experience GCCIA 3 rd Regional Power Trade Forum GCCIA 3 Regional Power Trade Forum Abu Dhabi 29 September 2014 Presented by Tan Liang Ching Vice President, Energy Market Company, Singapore 1 1
Transcript of Electricity Spot Markets: The Singapore Experience · Electricity Spot Markets: The Singapore...
Electricity Spot Markets:
The Singapore Experience
GCCIA 3rd Regional Power Trade ForumGCCIA 3rd Regional Power Trade Forum
Abu Dhabi
29 September 2014
Presented by Tan Liang Ching
Vice President, Energy Market Company, Singapore
1
1
Presentation Outline
• Path to Market Liberalization
– Background and Considerations
• NEMS: The First Few Years
– Steps taken and Market Performance
2
– Steps taken and Market Performance
• Looking Forward
– Further Enhancements
2
Path to Market Liberalization
3
3
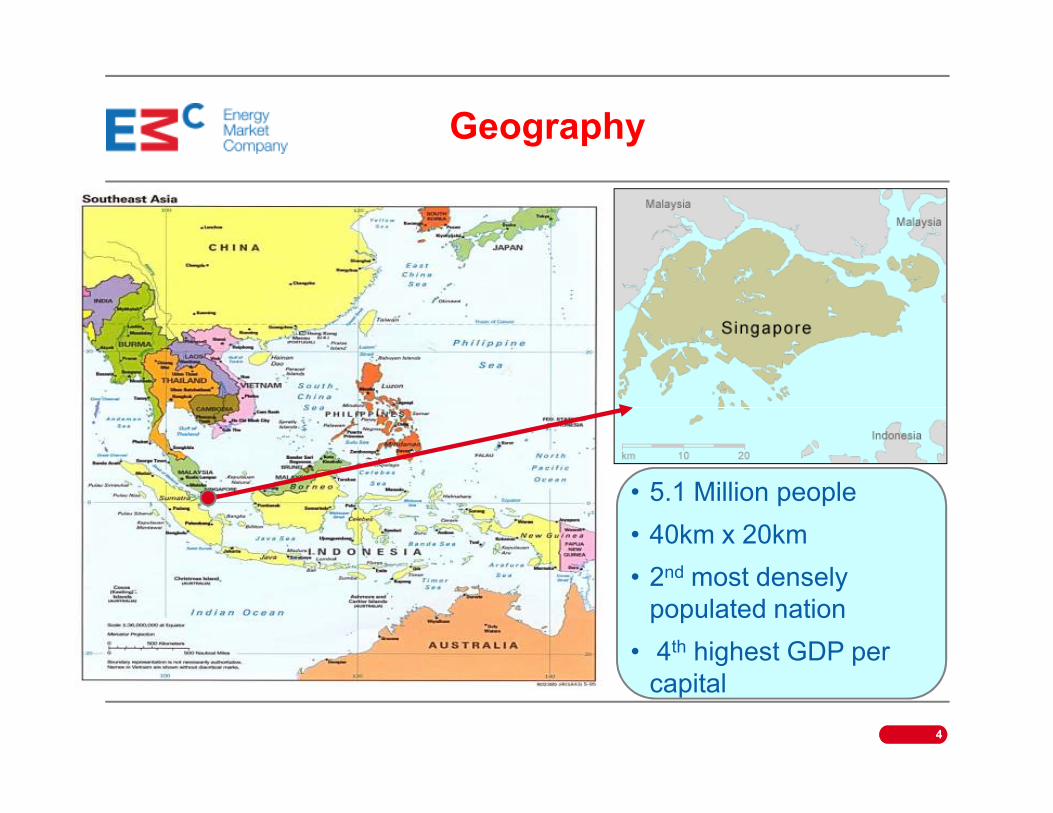
Geography
4
• 5.1 Million people
• 40km x 20km
• 2nd most densely
populated nation
• 4th highest GDP per
capital
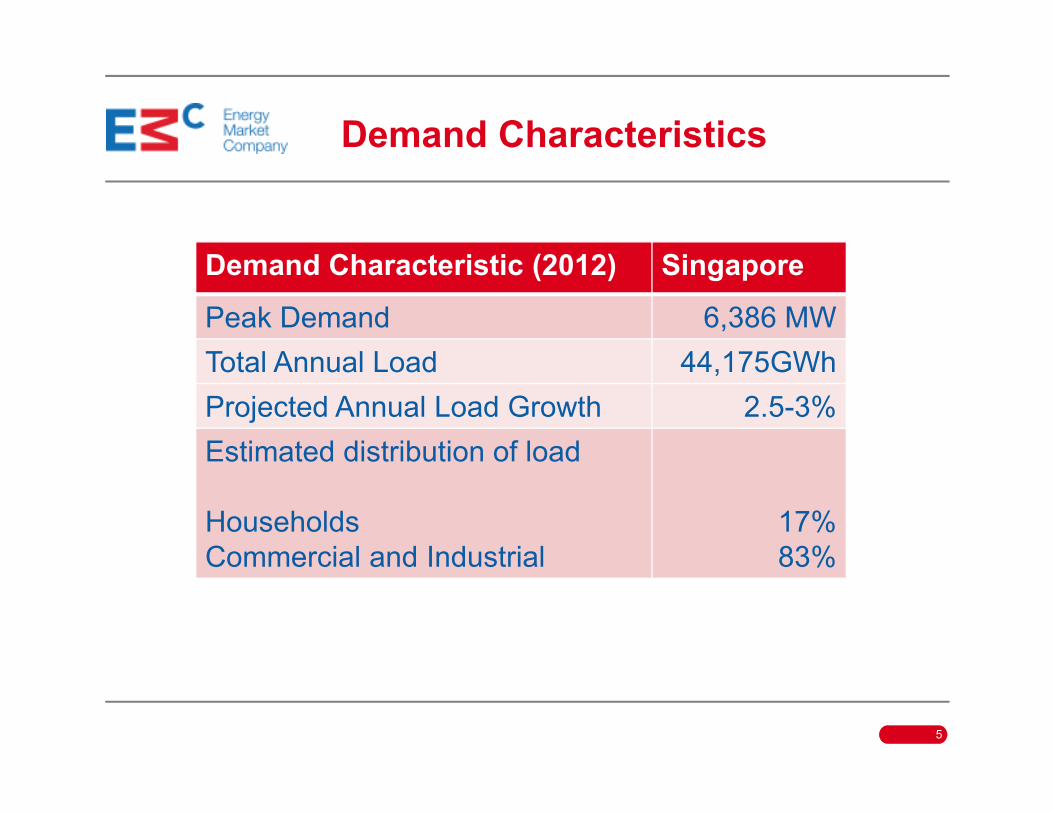
Demand Characteristics
Demand Characteristic (2012) Singapore
Peak Demand 6,386 MW
Total Annual Load 44,175GWh
Projected Annual Load Growth 2.5-3%Projected Annual Load Growth 2.5-3%
Estimated distribution of load
Households
Commercial and Industrial
17%
83%
5
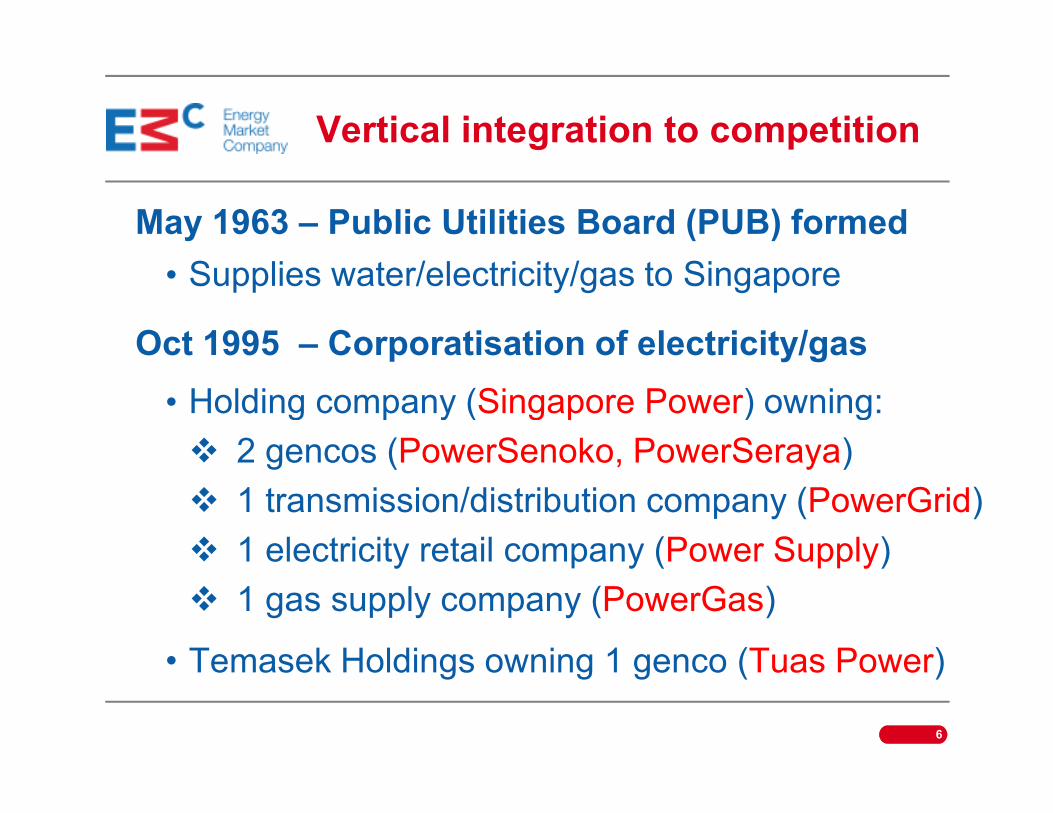
Vertical integration to competition
May 1963 – Public Utilities Board (PUB) formed
• Supplies water/electricity/gas to Singapore
Oct 1995 – Corporatisation of electricity/gas
• Holding company (Singapore Power) owning:• Holding company (Singapore Power) owning:
� 2 gencos (PowerSenoko, PowerSeraya)
� 1 transmission/distribution company (PowerGrid)
� 1 electricity retail company (Power Supply)
� 1 gas supply company (PowerGas)
• Temasek Holdings owning 1 genco (Tuas Power)
6
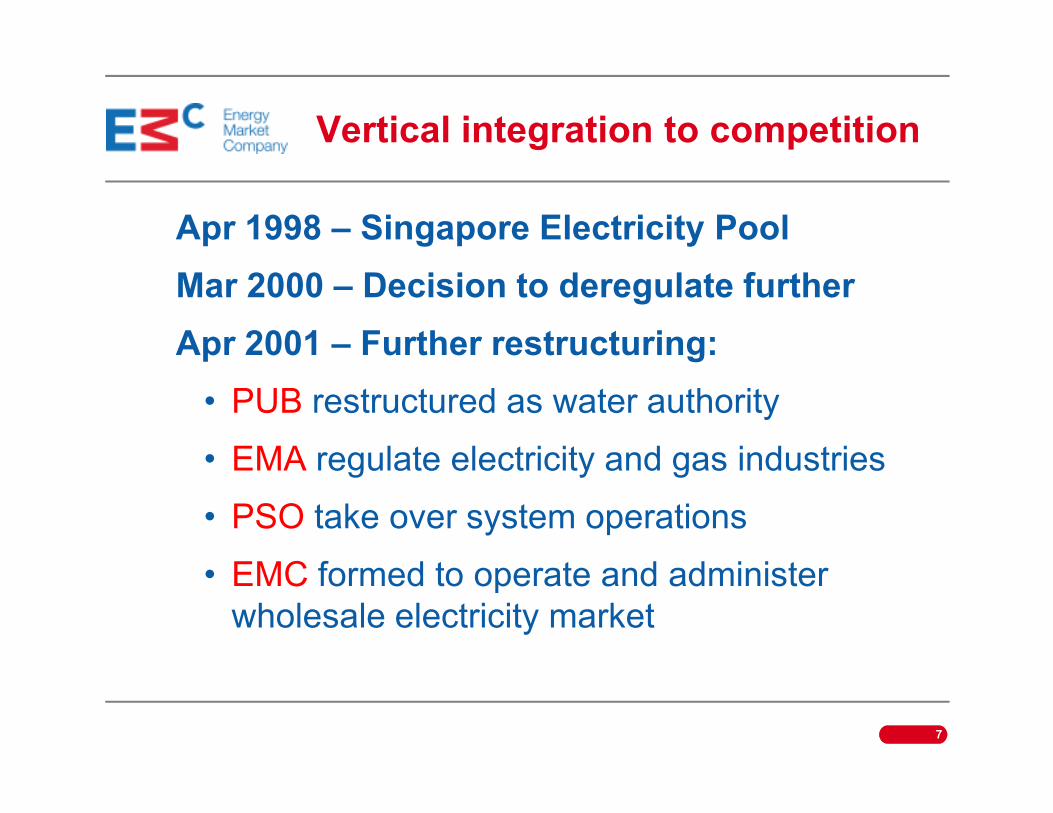
Vertical integration to competition
Apr 1998 – Singapore Electricity Pool
Mar 2000 – Decision to deregulate further
Apr 2001 – Further restructuring:
• PUB restructured as water authority• PUB restructured as water authority
• EMA regulate electricity and gas industries
• PSO take over system operations
• EMC formed to operate and administer
wholesale electricity market
7
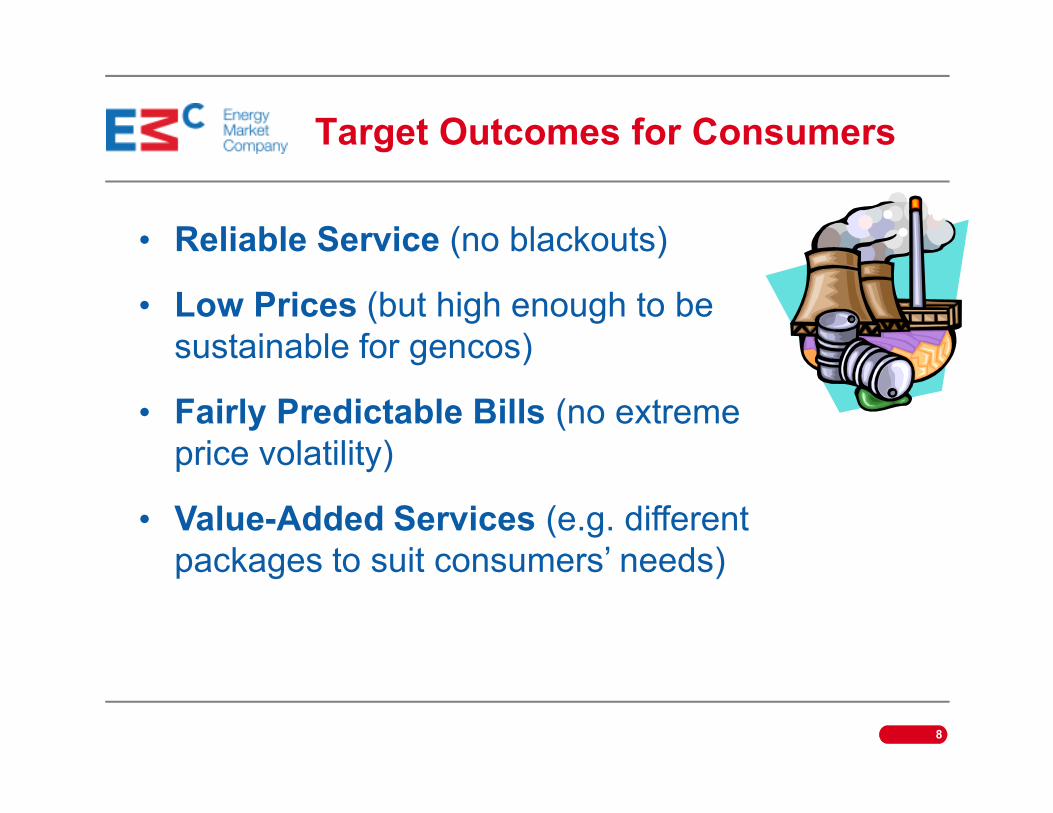
Target Outcomes for Consumers
• Reliable Service (no blackouts)
• Low Prices (but high enough to be
sustainable for gencos)
• Fairly Predictable Bills (no extreme • Fairly Predictable Bills (no extreme
price volatility)
• Value-Added Services (e.g. different
packages to suit consumers’ needs)
8
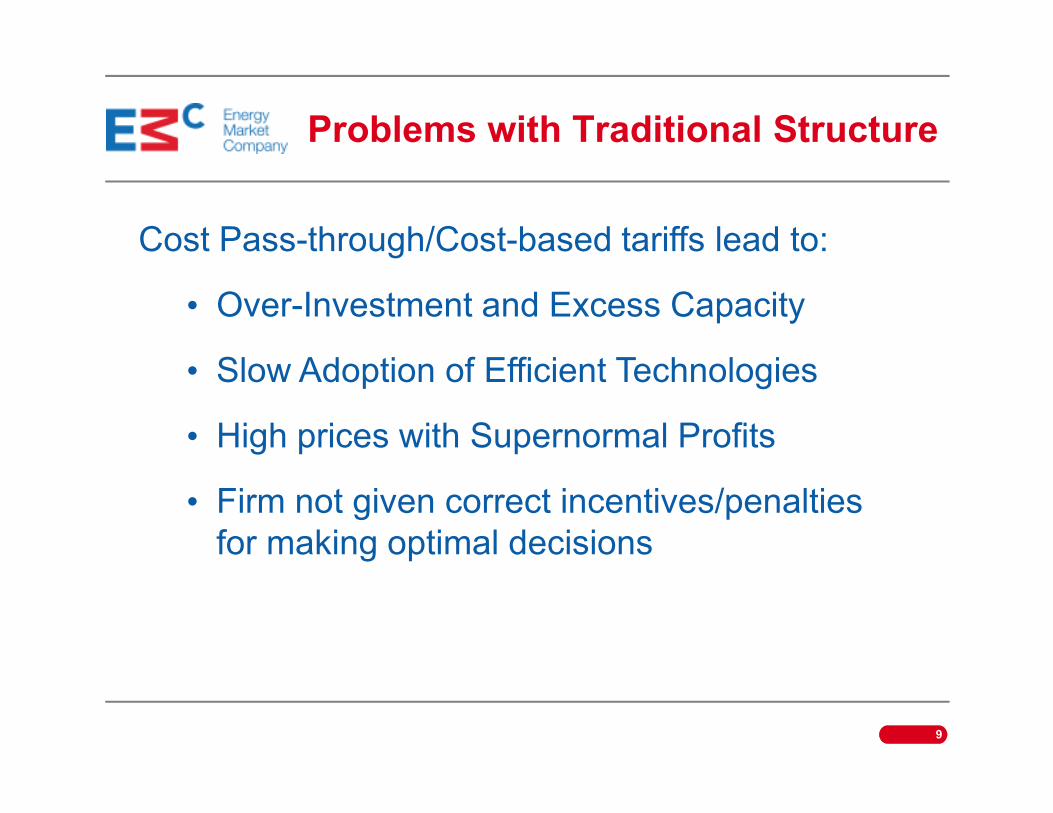
Problems with Traditional Structure
Cost Pass-through/Cost-based tariffs lead to:
• Over-Investment and Excess Capacity
• Slow Adoption of Efficient Technologies
• High prices with Supernormal Profits
• Firm not given correct incentives/penalties
for making optimal decisions
9
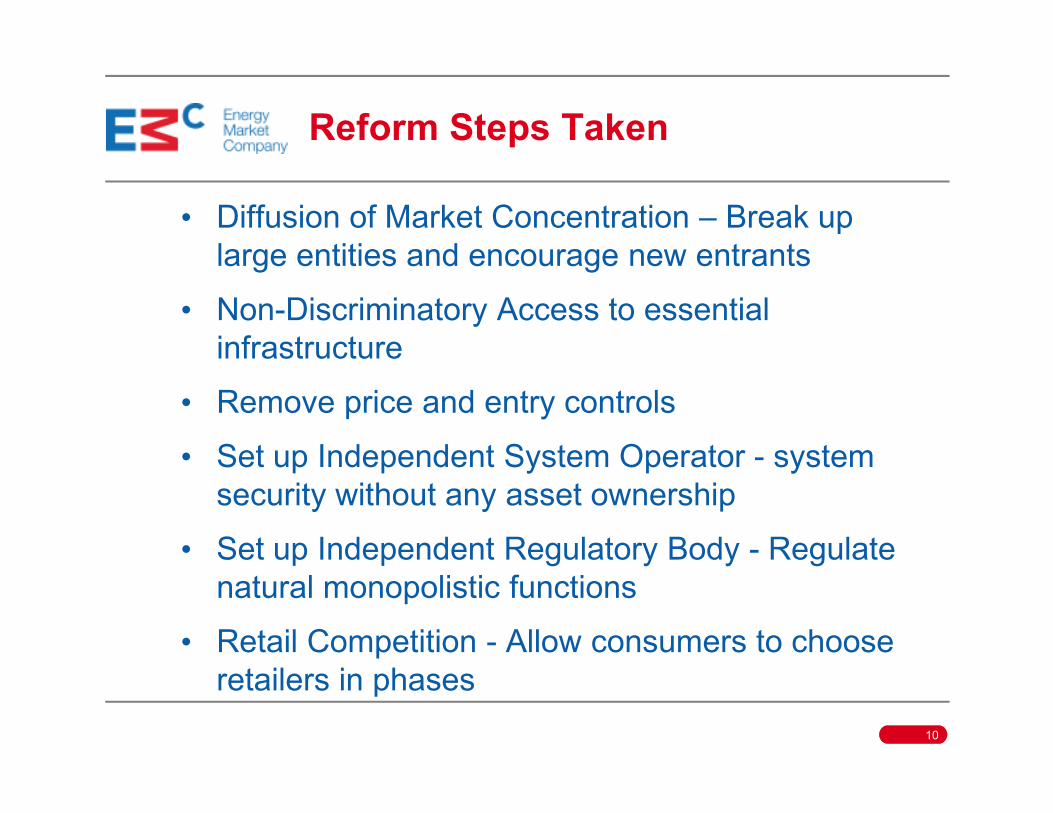
Reform Steps Taken
• Diffusion of Market Concentration – Break up
large entities and encourage new entrants
• Non-Discriminatory Access to essential
infrastructure
• Remove price and entry controls• Remove price and entry controls
• Set up Independent System Operator - system
security without any asset ownership
• Set up Independent Regulatory Body - Regulate
natural monopolistic functions
• Retail Competition - Allow consumers to choose
retailers in phases
10
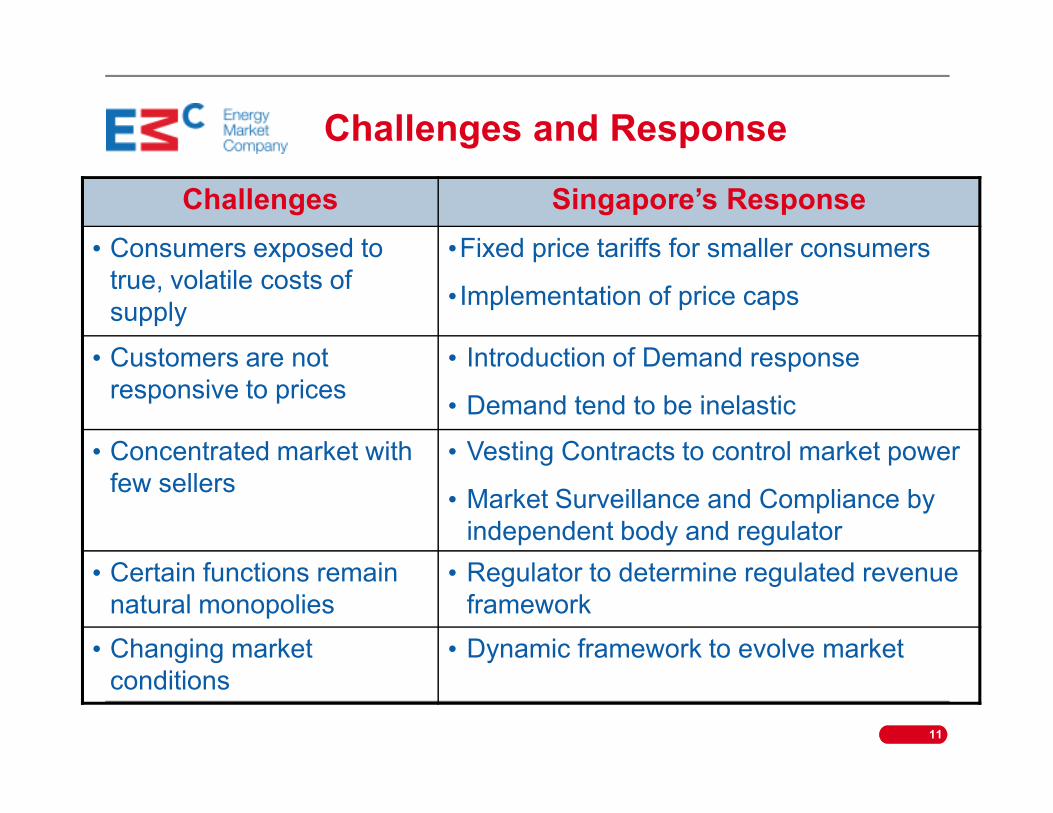
Challenges and Response
Challenges Singapore’s Response
• Consumers exposed to
true, volatile costs of
supply
•Fixed price tariffs for smaller consumers
• Implementation of price caps
• Customers are not
responsive to prices
• Introduction of Demand response
• Demand tend to be inelastic• Demand tend to be inelastic
• Concentrated market with
few sellers
• Vesting Contracts to control market power
• Market Surveillance and Compliance by
independent body and regulator
• Certain functions remain
natural monopolies
• Regulator to determine regulated revenue
framework
• Changing market
conditions
• Dynamic framework to evolve market
11
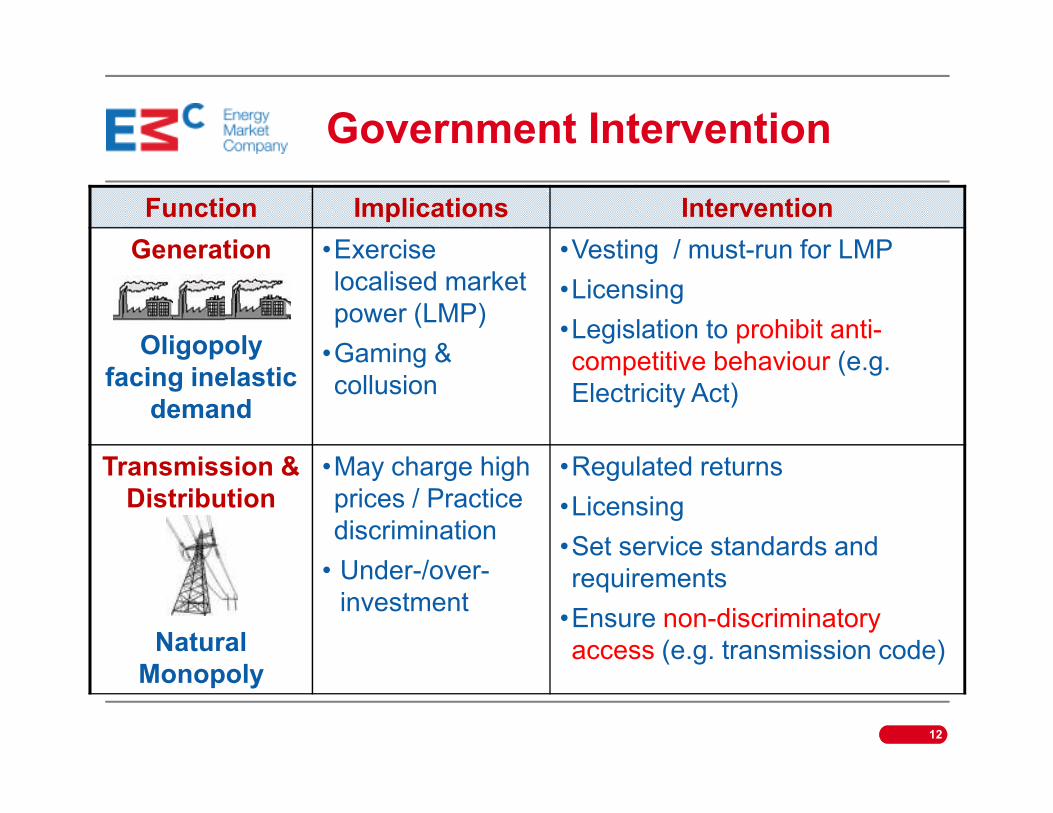
Government Intervention
Function Implications Intervention
Generation
Oligopoly
facing inelastic
demand
•Exercise
localised market
power (LMP)
•Gaming &
collusion
•Vesting / must-run for LMP
•Licensing
•Legislation to prohibit anti-
competitive behaviour (e.g.
Electricity Act) demand
Electricity Act)
Transmission &
Distribution
Natural
Monopoly
•May charge high
prices / Practice
discrimination
• Under-/over-
investment
•Regulated returns
•Licensing
•Set service standards and
requirements
•Ensure non-discriminatory
access (e.g. transmission code)
12
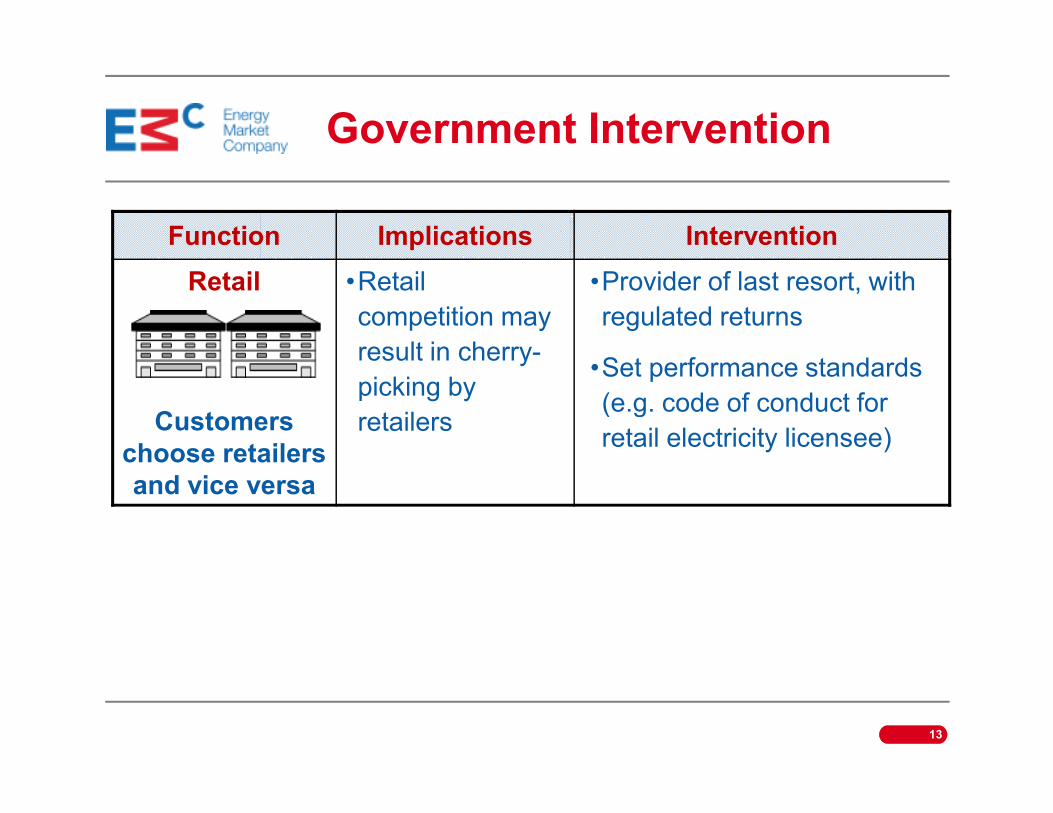
Government Intervention
Function Implications Intervention
Retail
Customers
•Retail
competition may
result in cherry-
picking by
retailers
•Provider of last resort, with
regulated returns
•Set performance standards
(e.g. code of conduct for Customers
choose retailers
and vice versa
retailers (e.g. code of conduct for
retail electricity licensee)
13
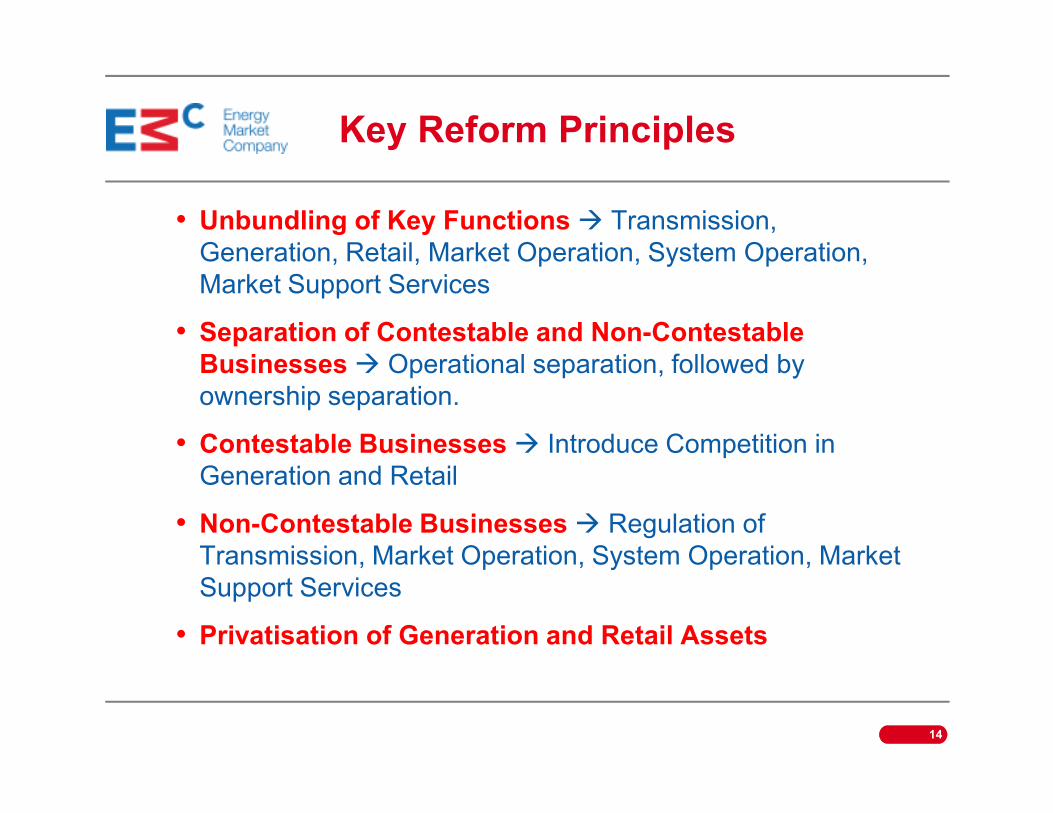
Key Reform Principles
• Unbundling of Key Functions � Transmission,
Generation, Retail, Market Operation, System Operation,
Market Support Services
• Separation of Contestable and Non-Contestable
Businesses � Operational separation, followed by
ownership separation.ownership separation.
• Contestable Businesses � Introduce Competition in
Generation and Retail
• Non-Contestable Businesses � Regulation of
Transmission, Market Operation, System Operation, Market
Support Services
• Privatisation of Generation and Retail Assets
14
NEMS: The First Few Years@
15
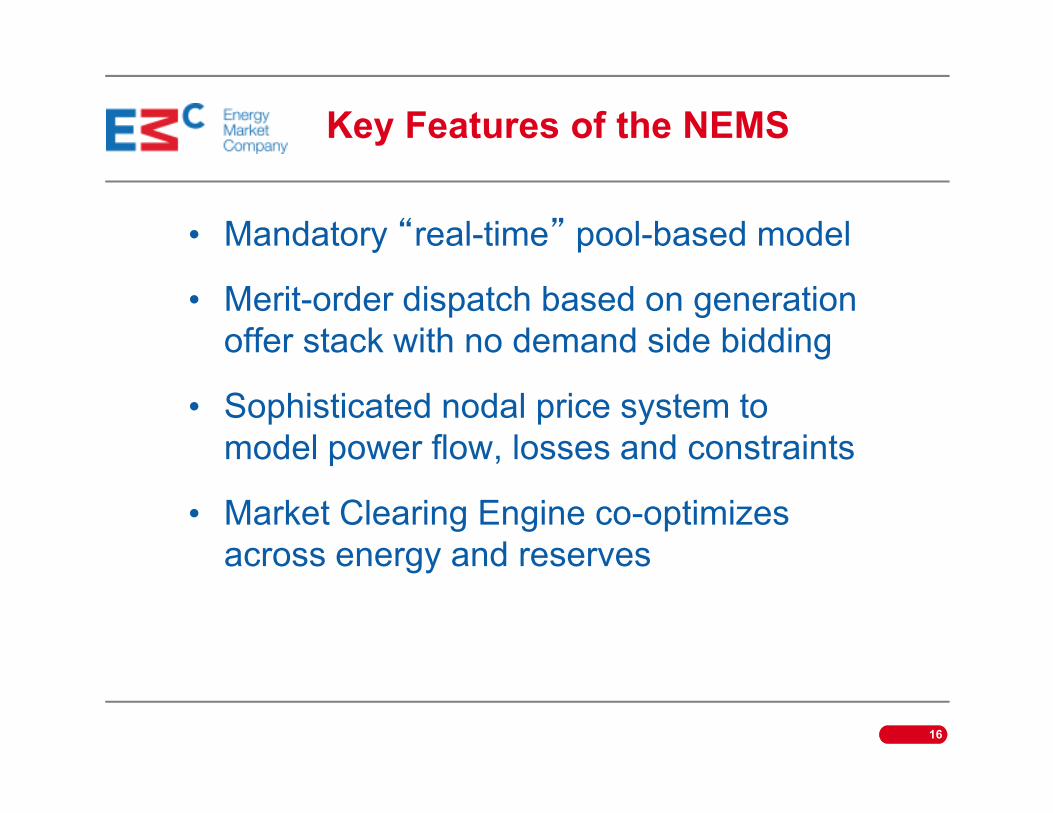
Key Features of the NEMS
• Mandatory “real-time” pool-based model
• Merit-order dispatch based on generation
offer stack with no demand side bidding
• Sophisticated nodal price system to
16
• Sophisticated nodal price system to
model power flow, losses and constraints
• Market Clearing Engine co-optimizes
across energy and reserves
Key Features of the NEMS
• Generators paid nodal prices; Retailers pay
weighted average nodal prices
• Large consumers buy from retailers at spot
or negotiated fixed tariffs
17
• Small consumers buy from Singapore
Power at regulated tariffs, supported by
vesting contracts
• Vesting contracts computed by Regulator
based on hypothetical cost of new entrant
(fuel costs, fixed costs)
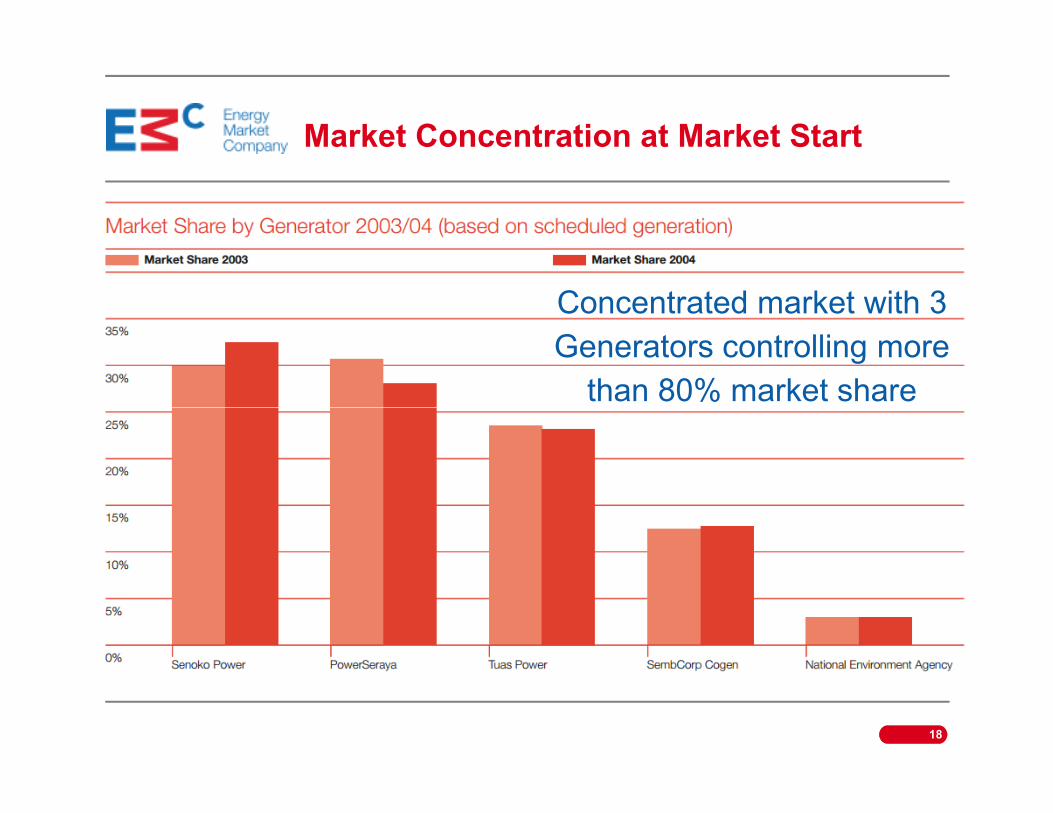
Market Concentration at Market Start
Concentrated market with 3
Generators controlling more
than 80% market share
18
than 80% market share
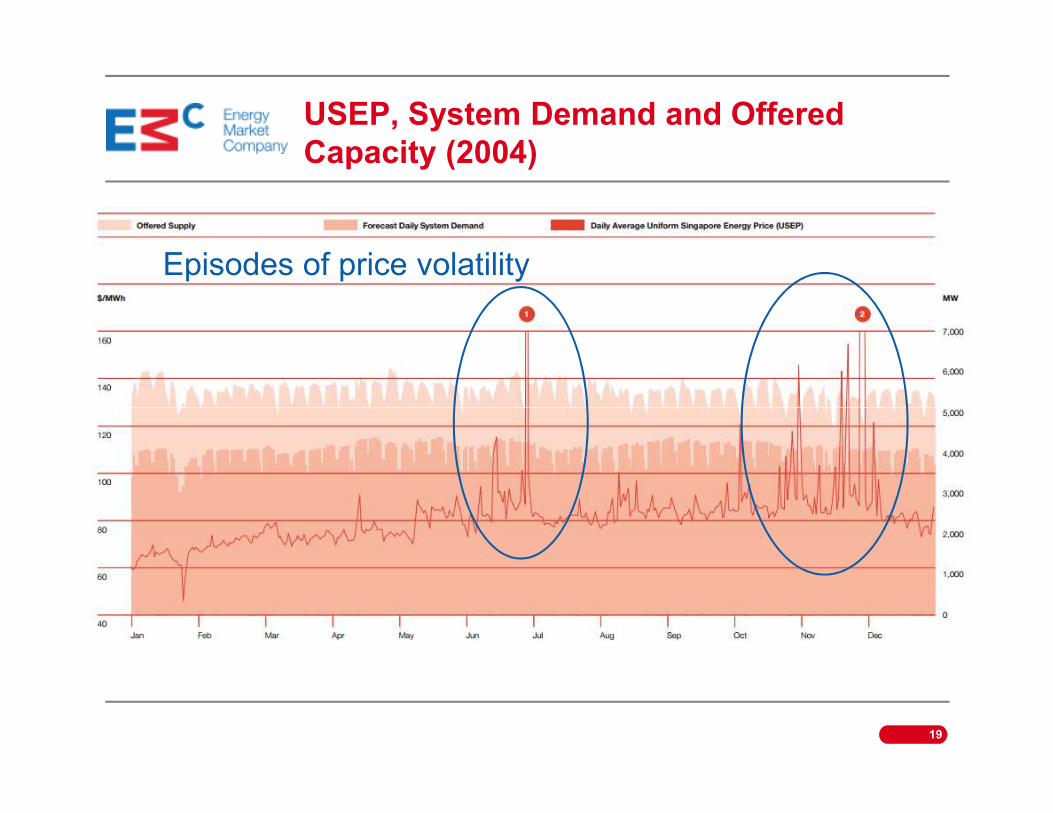
USEP, System Demand and Offered
Capacity (2004)
Episodes of price volatility
19
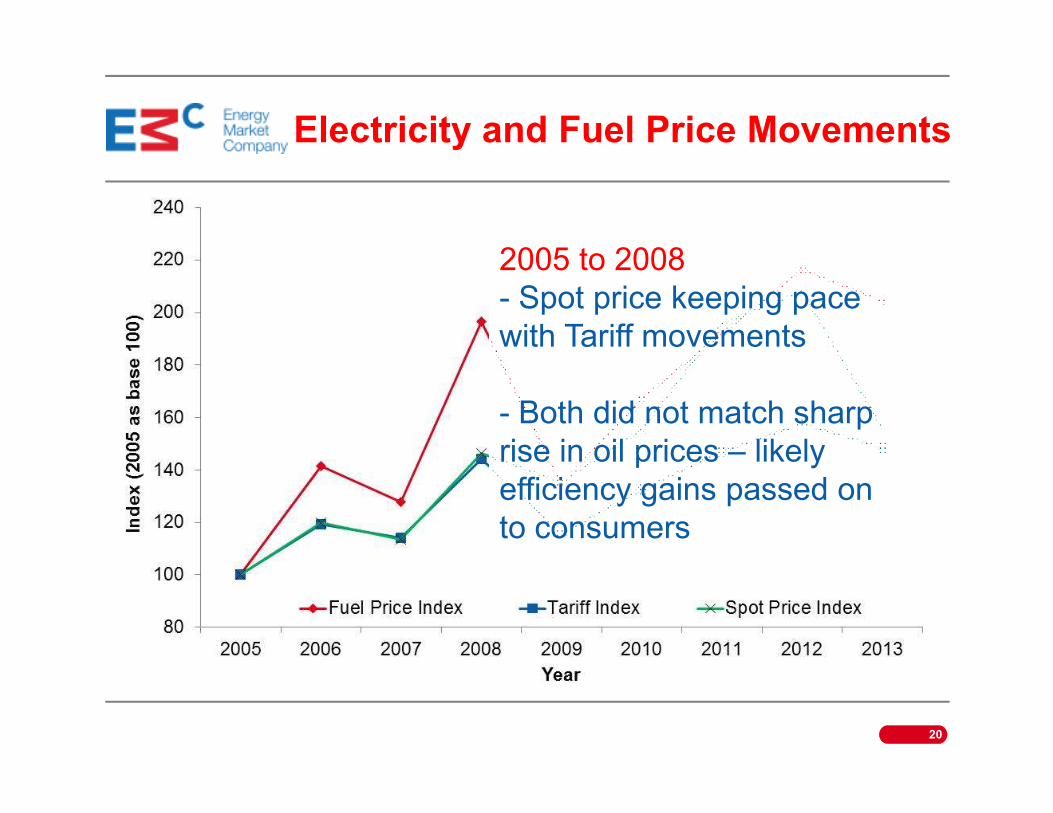
Electricity and Fuel Price Movements
2005 to 2008
- Spot price keeping pace
with Tariff movements
- Both did not match sharp
20
- Both did not match sharp
rise in oil prices – likely
efficiency gains passed on
to consumers
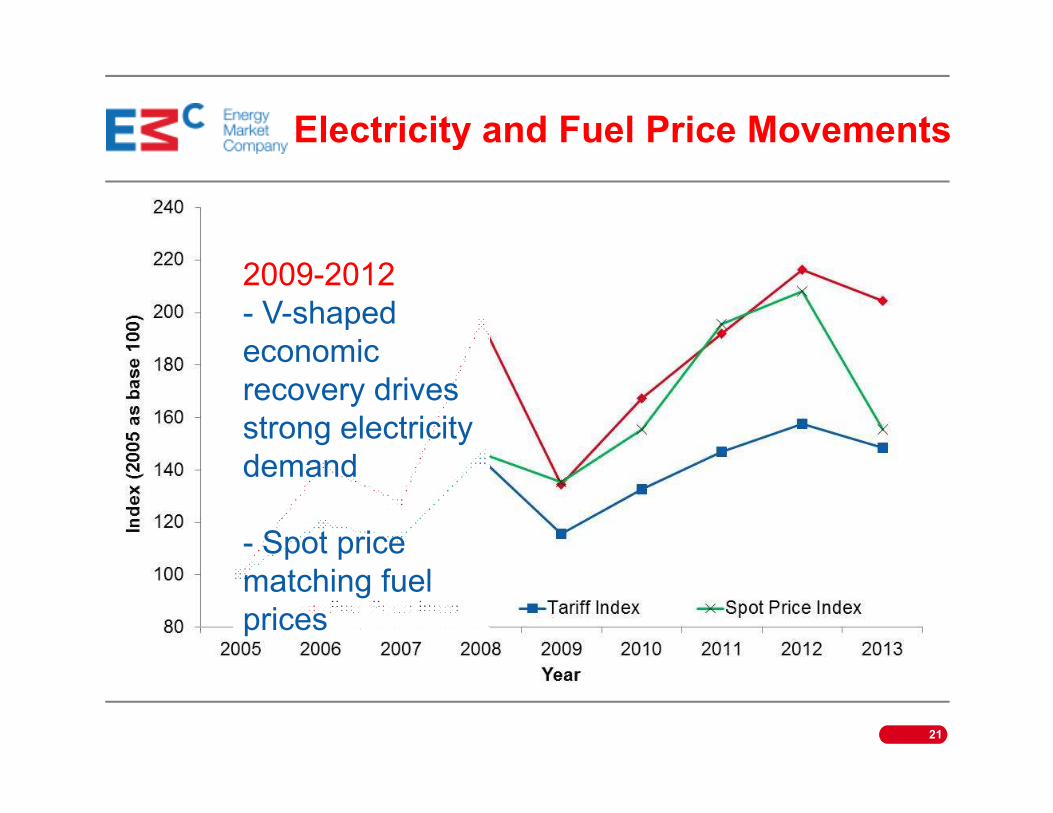
2009-2012
- V-shaped
economic
recovery drives
Electricity and Fuel Price Movements
strong electricity
demand
- Spot price
matching fuel
prices
21
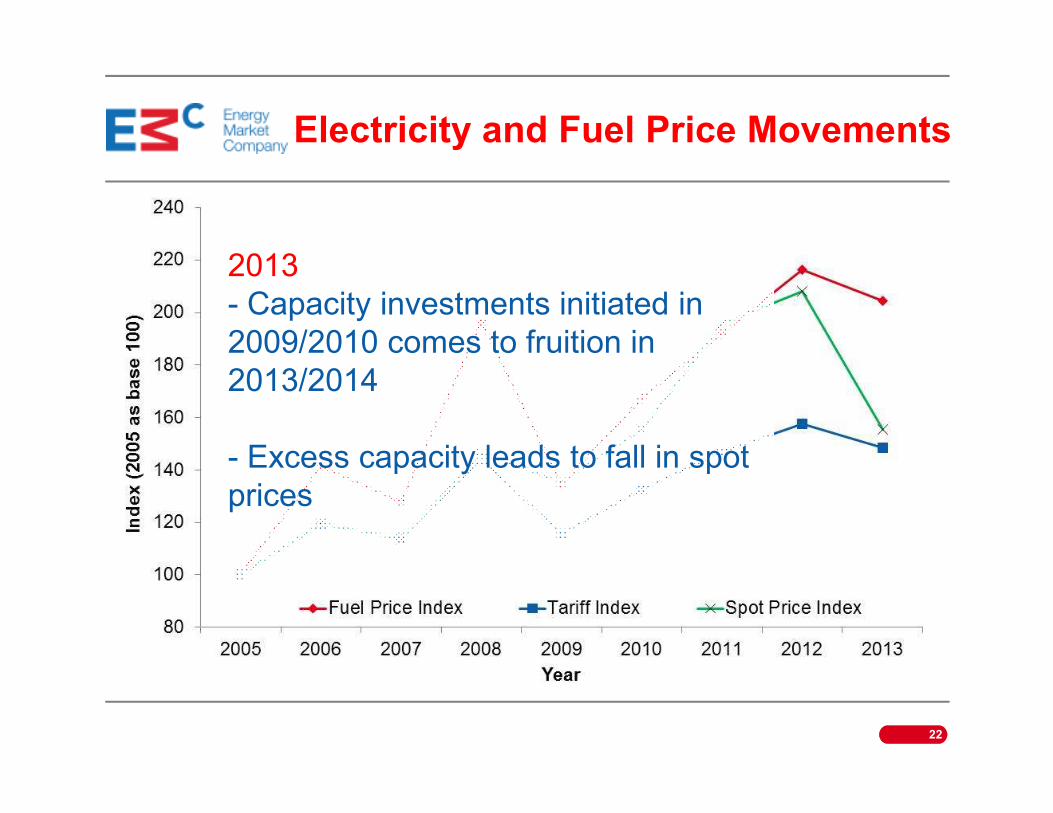
2013
- Capacity investments initiated in
2009/2010 comes to fruition in
2013/2014
Electricity and Fuel Price Movements
- Excess capacity leads to fall in spot
prices
22
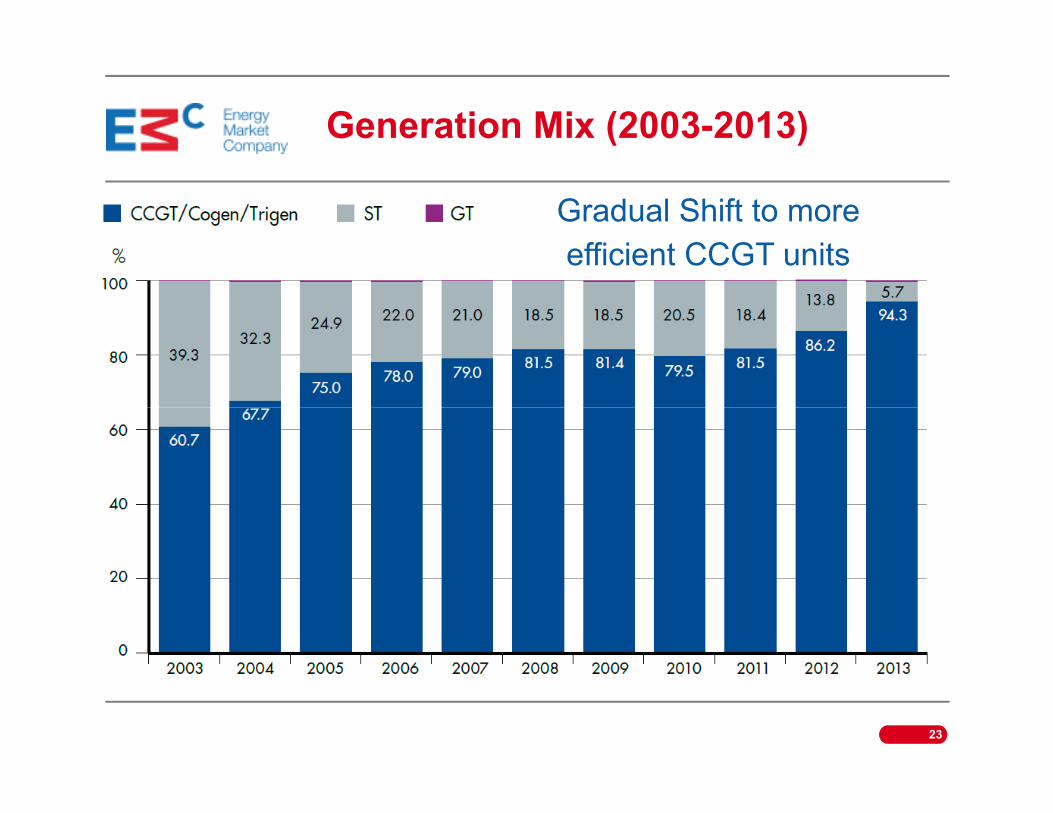
Generation Mix (2003-2013)
Gradual Shift to more
efficient CCGT units
23
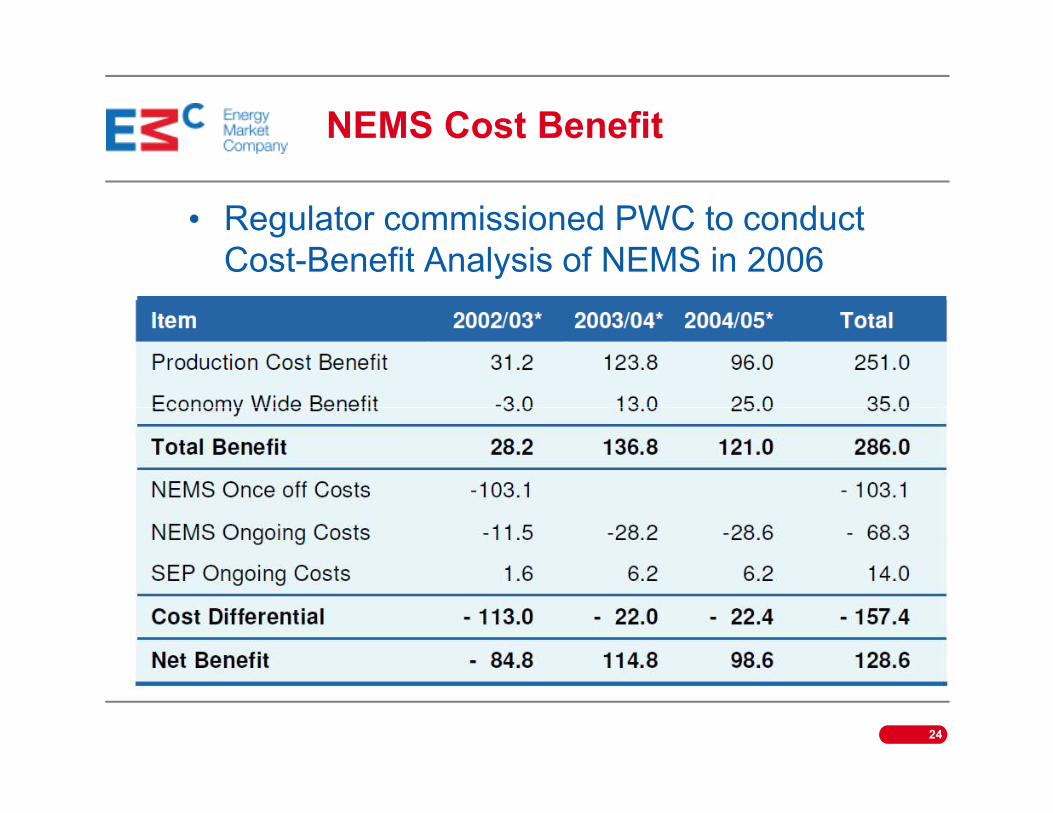
NEMS Cost Benefit
• Regulator commissioned PWC to conduct
Cost-Benefit Analysis of NEMS in 2006
24
Looking Forward@
25
Singapore’s LNG terminal
• LNG terminal with initially 3.5 million tonnes per
annum (Mtpa) commenced operations in May
2013
• BG as LNG aggregator with exclusive rights to
import 3 Mtpaimport 3 Mtpa
• LNG may provide entry point to international
gas pricing in the future
• EMC working with SGX on LNG marker and
secondary gas market
26
• April, Oct 2014 – Increased Retail
Competition, gradual rollout to consumers
with monthly consumption below 4MWh
• Oct 2014 – Rollout of Electricity Futures
Market by SGX
Future Developments
Market by SGX
• Dec 2015 – Implementation of Demand
Response Program
• Import of Electricity
27
Thank you
28