Kentucky Retirement Systems - kyret.ky.gov CAFRS/2006 CAFR.pdf · KRS staff provides detailed...
160
Transcript of Kentucky Retirement Systems - kyret.ky.gov CAFRS/2006 CAFR.pdf · KRS staff provides detailed...


Prepared by the executive staff of Kentucky Retirement Systems
Perimeter Park West1260 Louisville RoadFrankfort, KY 40601
Phone: (502) 696-8800Fax: (502) 696-8822
www.kyret.com
Kentucky Retirement Systems
Comprehensive Annual Financial Report
For the Fiscal Year Ended June 30, 2005
The cost of printing this CAFR is part of the administrative expense of the systems.
A Component Unit of the
Commonwealth of Kentucky.

Table of Contents
Letter of Transmittal 2
Organizational Chart 8
Board of Trustees 9
System Highlights 10
Certifi cate of Achievement 20
Independent Auditor’s Report 22
Management’s Discussion and Analysis 23
Financial Statements
Combining Statement of Plan Net Assets 28
Combined Statements of Changes in Plan Net Assets 30
Notes to Financial Statements 32
Required Supplementary Information
Schedule Funding Progress
Kentucky Employees Retirement System 52
County Employees Retirement System 54
State Police Retirement System 56
Schedule of Employer Contributions
Kentucky Employees Retirement System 58
County Employees Retirement System 60
State Police Retirement System 62
Notes to Required Supplementary Information 63
Additional Supporting Schedules
Schedule of Administrative Expenses 64
Schedule of Investment Expenses 65
Schedule of Professional Consultant Fees 65
Combining Schedules of Plan Net Assets 66
Combining Schedules of Changes in Plan Net Assets 68
Report On Internal Control over Financial Reporting and On
Compliance and Other Matters Based on an Audit of Financial
Statements Performed in Accordance with Government
Auditing Standards 70
Schedule of Finding and Response 71
Financial Section
Introductory Section

Actuarial Section
Statistical Section
Investment Section
Investment Summary 74
Investment Policy 74
Investment Strategy 75
Investment Consultant’s Letter 76
Investment Results 80
Schedule of Fees and Commissions 92
Certifi cation 94
Summary of Actuarial Assumptions and Methods 96
Reccommended Employer Contribution Rates 101
Summary of Actuarial and Unfunded Liabilities 104
Analysis of Financial Experience 109
Solvency Test 114
Summary of Active Member Valuation Data 119
Summary of Retired Member Valuation Data 121
Summary of Benefi t Provisions 123
Changes in Benefi t Provisions 126
Membership by System 128
Schedule of Participating Employers 130
Net Plan Assets by System 132
Changes in Net Plan Assets by System 133
Schedule of Benefi t Expenses by Type 138
Average Monthly Benefi t by Length of Service 143
Analysis of New Retirees 144
Insurance Benefi ts Paid All Retirees & Benefi ciaries 145
Payment Options by Type 146
Employer Contribution Rates 148
Retirement Window 149
Insurance Contracts by Type 150
Retired ReEmployed 152
Payments by County 153
Table of Contents


Introductory Section
Letter of TransmittalOrganizational ChartBoard of TrusteesSystem HighlightsCertifi cate of Achievement
Introductory Section
Letter of Transmittal 2Organizational Chart 8
Board of Trustees 9System Highlights 10Certifi cate of Achievement 20

The Board of TrusteesKentucky Retirement SystemsPerimeter Park West1260 Louisville RoadFrankfort, KY 40601-6124
Dear Board of Trustees and Members:
I am pleased to present the Comprehensive Annual Financial Report (CAFR) of the Kentucky Employees Retirement System (KERS), County Employees Retirement System (CERS), and State Police Retirement System (SPRS) for the fi scal year ended June 30, 2006. Responsibility for both the accuracy of the data, and the completeness and fairness of the presentation, rests with the management of the Kentucky Retirement Systems.
The CAFR is divided into fi ve sections:
• An Introductory Section, containing KRS’s administrative organization, Systems Highlights and Letter of Transmittal.
• A Financial Section, containing the report of the independent auditor, the fi nancial statements of the systems and certain required supplementary information.
• An Investment Section, containing a report on investment activity, investment policies, investment results and various investment schedules.
• An Actuarial Section, containing the Actuary’s Certifi cation Letter and the results of the annual actuarial valuation.
• A Statistical Section, containing information about plan participants and recipients.
We present this information to assist the Board and members of Kentucky Employees Retirement System (KERS), County Employees Retirement System (CERS), and State Police Retirement System (SPRS) (collectively referred to as KRS) in understanding KRS’ fi nancial and actuarial status. This CAFR was prepared to conform with the principles of governmental accounting and reporting set forth by the Governmental Accounting Standards Board. Transactions of the system are reported on the accrual basis of accounting. Additionally, suffi cient internal accounting controls exist to provide reasonable assurance regarding the safekeeping of assets and fair presentation of the fi nancial statements and supporting schedules. Please refer to Management’s Discussion and Analysis on page 27 for more information.
History
KERS was created in 1956 by the Kentucky General Assembly in order to supplement the benefi ts provided by Social Security. When the fi rst actuarial valuation was completed June 30, 1957, there were 16,000 employees participating in KERS and assets of $2.8 million. SPRS and CERS were established in 1958. The fi rst actuarial valuation of SPRS was conducted June 30, 1959. No actuarial valuation of CERS was conducted until June 30, 1960 because the statutes did not authorize retirements from the system prior to July 1, 1960. On June 30, 1960, there were 68 counties and 2,617 employees participating in CERS, and SPRS included 415 uniformed state troopers.

3
Introductory Section
As of June 30, 2006, there were more than 302,000 active, inactive and retired members in the combined systems and approximately $15.0 billion in assets. A breakdown of membership by system is provided in the Statistical Section.
KRS staff provides detailed benefi t estimates to members upon request. Counselors are available at the Frankfort offi ce for individual counseling, both in offi ce by appointment and by telephone during normal business hours. In addition, staff conducts individual counseling sessions at sites throughout the Commonwealth and holds pre-retirement seminars to help members prepare for retirement. Information including an online benefi t calculator and a service purchase calculator is available online at http://www.kyret.com.
Major Initiatives
A major goal for KRS during the fi scal year was to raise awareness of the continued reductions to the KERS and SPRS employer contribution rates by the Kentucky General Assembly. These rates have been less than the amount recommended by the KRS Board of Trustees and its consulting actuary. Through educational initiatives with our membership and with policymakers, KRS received an increase in the employer contribution rate for the 2006-2007 and the 2007-2008 fi scal years. While this was the fi rst increase in the KERS and SPRS employer rates since 2001, contributions remained far short of the actuarially recommended rates. Management believes that these eff orts must continue as actuarial funding levels continue to falter.
In 2005, KRS embarked on a project of self-insuring the Medicare eligible retirees. Through these eff orts, KRS was able to reduce retiree medical premiums by 6.34% during the 2006 plan year. KRS is continuing to examine the data to better understand the dynamics of our retiree population and has already completed the introductory steps towards implementing a health and wellness program for our retirees. If KRS is to rein in costs something must be done to improve the health of people who currently have chronic disease while in the longer term we must reduce the overall incidence of chronic disease. Developing an eff ective long term strategy is a priority for KRS and begins with identifying baseline information and formulating programs that bring disease and pharmacy management principles to bear on those with chronic disease.
KRS Administrative staff continued to move forward on other long term initiatives. KRS recently implemented two important technology projects to improve its fi nancial operations. KRS successfully replaced its legacy fi nancial system with the Great Plains integrated fi nancial and accounting system from Microsoft. The Great Plains system includes functions for human resources and payroll processing which has allowed KRS to bring these activities in-house. Additionally, KRS recently completed successful implementation of the ProLaw Case Management system to assist the KRS legal staff in managing legal matters.
KRS is about to embark on a major project initiative to implement a new, state of the art pension administration solution. The project is called Strategic Technology Advancement for the Retirement of Tomorrow (START).
The primary objective of START is to implement a stable, proven, state-of-the-industry, fully integrated and browser based solution capable of supporting the KRS mission well into the 21st century. It will enable KRS staff to perform all of their duties using the workstations (PCs) on each desk tied together through a KRS-wide network via a browser-based system.

Introductory Section
4
Additional objectives of the START initiative include:• Improved service levels to members;• Improved system workfl ow and increased work effi ciency;• Expanded and improved Web-based, self-service functions to members, retirees, and employers;• Improved accuracy of all information collected, maintained, and provided by KRS;• Improved timeliness and accuracy of responses to members' inquiries;• Inclusion of any proven new technologies that can provide cost-eff ective benefi ts to KRS members;• A secure environment for member and retiree data, and• A secure environment for the receipt and transmittal of information related to members, retirees, and
employers.
In addition to the pension application, the new solution will include best practice workfl ow management elements and business process and organizational changes, as well as the computer hardware and software necessary to support the new system.
As part of the continued commitment to protect our membership information, Kentucky Retirement Systems has identifi ed the need to improve information technology security controls and practices as part of continual improvement processes. Over the past twelve months, KRS has initiated several activities to better protect member’s information including:
• Established the position and hired an Information Security Offi cer.• Initiated security awareness activities for KRS staff and management.• Began review of business processes to determine potential security risks.• Completed a 3rd party assessment of critical information technology infrastructure to identify and remedy
weaknesses.
Certifi cate of Achievement
The Government Finance Offi cers Association of the United States and Canada (GFOA) awarded a Certifi cate of Achievement for Excellence in Financial Reporting to the Kentucky Retirement Systems for its CAFR for the fi scal year ended June 30, 2005. The Certifi cate of Achievement is a prestigious national award recognizing excellence in the preparation of state and local government fi nancial reports. This was the seventh consecutive year that KRS has achieved this award.
In order to be awarded a Certifi cate of Achievement, a government unit must publish an easily readable and effi ciently organized comprehensive annual fi nancial report. This report must satisfy both generally accepted accounting principles and applicable legal requirements.
A Certifi cate of Achievement is valid for a period of one year only. We believe that our current comprehensive annual fi nancial report continues to meet the Certifi cate of Achievement Program’s requirements, and we are submitting it to the GFOA to determine its eligibility for another certifi cate.
5
Introductory Section
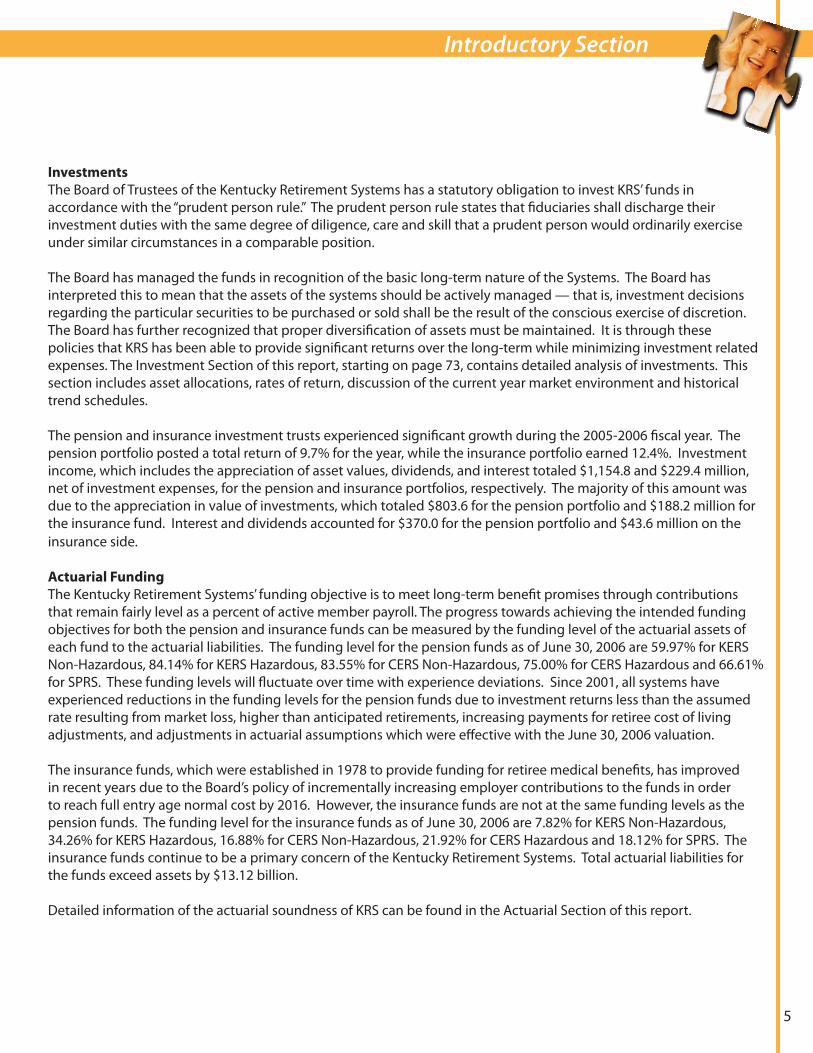
Investments
The Board of Trustees of the Kentucky Retirement Systems has a statutory obligation to invest KRS’ funds in accordance with the “prudent person rule.” The prudent person rule states that fi duciaries shall discharge their investment duties with the same degree of diligence, care and skill that a prudent person would ordinarily exercise under similar circumstances in a comparable position.
The Board has managed the funds in recognition of the basic long-term nature of the Systems. The Board has interpreted this to mean that the assets of the systems should be actively managed — that is, investment decisions regarding the particular securities to be purchased or sold shall be the result of the conscious exercise of discretion. The Board has further recognized that proper diversifi cation of assets must be maintained. It is through these policies that KRS has been able to provide signifi cant returns over the long-term while minimizing investment related expenses. The Investment Section of this report, starting on page 73, contains detailed analysis of investments. This section includes asset allocations, rates of return, discussion of the current year market environment and historical trend schedules.
The pension and insurance investment trusts experienced signifi cant growth during the 2005-2006 fi scal year. The pension portfolio posted a total return of 9.7% for the year, while the insurance portfolio earned 12.4%. Investment income, which includes the appreciation of asset values, dividends, and interest totaled $1,154.8 and $229.4 million, net of investment expenses, for the pension and insurance portfolios, respectively. The majority of this amount was due to the appreciation in value of investments, which totaled $803.6 for the pension portfolio and $188.2 million for the insurance fund. Interest and dividends accounted for $370.0 for the pension portfolio and $43.6 million on the insurance side.
Actuarial Funding
The Kentucky Retirement Systems’ funding objective is to meet long-term benefi t promises through contributions that remain fairly level as a percent of active member payroll. The progress towards achieving the intended funding objectives for both the pension and insurance funds can be measured by the funding level of the actuarial assets of each fund to the actuarial liabilities. The funding level for the pension funds as of June 30, 2006 are 59.97% for KERS Non-Hazardous, 84.14% for KERS Hazardous, 83.55% for CERS Non-Hazardous, 75.00% for CERS Hazardous and 66.61% for SPRS. These funding levels will fl uctuate over time with experience deviations. Since 2001, all systems have experienced reductions in the funding levels for the pension funds due to investment returns less than the assumed rate resulting from market loss, higher than anticipated retirements, increasing payments for retiree cost of living adjustments, and adjustments in actuarial assumptions which were eff ective with the June 30, 2006 valuation.
The insurance funds, which were established in 1978 to provide funding for retiree medical benefi ts, has improved in recent years due to the Board’s policy of incrementally increasing employer contributions to the funds in order to reach full entry age normal cost by 2016. However, the insurance funds are not at the same funding levels as the pension funds. The funding level for the insurance funds as of June 30, 2006 are 7.82% for KERS Non-Hazardous, 34.26% for KERS Hazardous, 16.88% for CERS Non-Hazardous, 21.92% for CERS Hazardous and 18.12% for SPRS. The insurance funds continue to be a primary concern of the Kentucky Retirement Systems. Total actuarial liabilities for the funds exceed assets by $13.12 billion.
Detailed information of the actuarial soundness of KRS can be found in the Actuarial Section of this report.

Introductory Section
6
Professional Services
A listing of the Board’s contract consultants can be found in the organizational chart on page 10. A listing of the external investment managers can be found on page 97 in the Investment Section.
Other Information
Kentucky Statutes require an annual audit by an independent certifi ed public accountant or the Auditor of Public Accounts. Mountjoy & Bressler PSC performed the audit for the fi scal year ended June 30, 2006, and the results of that audit are contained in the Financial Section. The fi rm gave KRS an unqualifi ed opinion and also indicated that the fi nancial statements present fairly, in all material respects, the plan net assets of Kentucky Retirement Systems.
The compilation of this report refl ects the combined eff orts of the KRS administrative staff under the leadership of the Board of Trustees. It is intended to provide complete and reliable information as a basis for making management decisions, as a means of determining compliance with statutory provisions, and as a means of determining responsible stewardship of KRS funds.
The report is available to all employers participating in the Kentucky Retirement Systems. They form the link between KRS and its membership, and their cooperation contributes signifi cantly to the success of the Kentucky Retirement Systems. We hope the employers and their employees fi nd this report informative. This and past CAFRs can be found on the KRS web site, www.kyret.com.
On behalf of the Board of Trustees, I would like to take this opportunity to express my gratitude to the staff , the advisors and the many people who have worked so diligently to assure the successful operation of the Kentucky Retirement Systems.
Respectfully submitted,
William P. Hanes, Esq. Executive Director

7
Introductory Section

Introductory Section
8
Board of TrusteesInvestment Committee
AuditCommittee
Executive Director William P. Hanes
Internal AuditorTodd E. Coleman
Chief Investment Offi cerVacant
Compliance Offi cerBo Cracraft
Alternative InvestmentsBrent Aldridge
Equity AssetsVacant
Fixed AssetsKenton Bottoms
Chief Operations Offi cerWilliam A. Thielen
Human ResourcesDirector
Marlane Robinson
General CounselJ. Eric Wampler
Research Analyst VacantChief Benefi ts Offi cer
Gerri D. Miller
Employment ServicesRebecca Stephens
DisabilitiesCharlene Haydon
Membership Support Suzanne Howe
Field ServicesSarah Webb
Retiree ServicesConnie Coleman
START Project ManagerChris Clark
Planning & Constituent ServicesShawn Sparks
Information & Technology Chris Clark (Acting)
AccountingSandra Bush
Offi ce SupportDonna Beckley
Information Security Offi cerMark McChesney
Communications DirectorVacant
ConsultantsActuarial ServicesCavanaugh Macdonald Consulting, LLC
Auditing ServicesMountjoy & Bressler, LLP
Legal ConsultantsKlausner & Kaufman, PA
Legal ServicesStoll Kennon & Park, LLP
Fiduciary Review ConsultantsIce Miller, LLP
Asset ManagementStrategic Investment Solutions
Sr. Advisor Retiree Health Rick Schultz

9
Introductory Section
2005 KRS Board of Trustees
A nine-member Board of Trustees administers the Systems: two trustees elected by KERS members; two trustees elected by CERS members; one trustee elected by SPRS members; three trustees appointed by the Governor; and the Secretary of the State Personnel Cabinet. One of the trustees appointed by the Governor must be knowledgeable about the impact of pensions on local governments. Elected trustees may serve no more than fi ve terms consecutively.
Randy J. Overstreet, ChairElizabethtown
Elected by SPRS
Term Expires March 31, 2007
Walter J. Pagan, , Vice ChairWilder
Appointed by Governor
Term Expires March 31, 2008
Vince Lang
FrankfortElected by CERS
Term Expires March 31, 2009
Lynn T. Harpring
LouisvilleAppointed by Governor
Term Expires March 31, 2008
Bobby D. Henson
FrankfortElected by KERS
Term Expires March 31, 2010
Susan Smith Horne
LexingtonElected by KERS
Term Expires March 31, 2010
Larry C. Conner
LexingtonAppointed by Governor
Term Expires March 31, 2007
Patricia Ballenger
LexingtonElected by CERS
Term Expires March 31, 2009
Brian J. Crall
FrankfortSecretary, Personnel Cabinet
Term Expires Ex-Offi cio

10
Net Plan Assets Additions Funding LevelNet Plan Asset Deductions
1,000
200
400
600
800
0
-400
-200
600
400
200
300
500
100
0
120
100
80
60
40
20
005040302010610504030201
060503 040201
Fun
ded
Leve
l (%
)
Dol
lars
in M
illio
ns
Dol
lars
in M
illio
ns
10
700
1 As of January 1, 2006 the Medical Insurance Exp. includes Self Funding Insurance expenses.

2001 2002 2003 2004 2005 2006
Net Plan Assets Additions (Dollars in Millions)
Net Investment Income 376.9 216.8 204.2 734.6 510.5 570.1
Employer Cont. (Ins.) 66.9 93.9 65.3 78.0 51.4 47.6
Employer Cont. (Pen.) 23.5 1.8 7.6 21.7 50.3 60.7
Member Contribution 106.6 112.0 137.1 129.1 127.8 107.6
Premiums from Retirees 5.8
Net Plan Assets Deductions (Dollars in Millions)
Medical Insurance Exp.1 37.6 44.1 52.0 60.5 76.0 97.5
Refunds 7.0 6.7 7.3 8.0 8.8 9.6
Administrative Exp. 3.8 4.4 5.0 5.3 5.9 7.6
Benefi t Payments 291.7 345.7 404.9 459.4 522.4 577.9
Demutualization Refunds 20.0
Funding Level (% of Actuarial Assets to Actuarial Liabilities)
Pension 125.7 110.4 97.4 85.1 73.6 60.0
Insurance 25.4 27.3 26.5 25.7 22.6 7.8
System HighlightsMembers
Active Members : 46,707Inactive Members: 29,143Retired Members and Benefi ciaries: 32,140
Active Membership Average Age: 43.0Average Years of Service: 9.0Average Annual Salary: $36,445
Retired Membership Average Age: 66.2 Average Annual Benefi t: $19,256Number Added: 2,481Number Removed: 1,111
Normal Retirement
The KERS formula for normal retirement is:
Insurance Benefi ts
The cost of insurance for the retired member may be partially, or fully paid by KRS depending upon the member’s years of service, the insurance carrier selected and the level of coverage chosen. Retirement Eligibility
AgeYears of Service Allowance Reduction
65 4 None
Any 27 None
55 55% per year for 5 years before age 65 or 27 years of service. 4% for each year thereafter.
Any 25 5% each year for fi ve years before 65 or 27 years of service.
Cost of Living Adjustment
Monthly retirement allowances are increased July 1 each year by the percentage increase in the annual average consumer price index (CPI-U) for all urban consumers for the most recent calendar year not to exceed 5%. The State Legislature may reduce, suspend or eliminate COLAs in the future.
Net Plan Assets
Pension Fund: $5,440,133,000Insurance Fund: $ 612,585,000Total: $6,052,718,000
Contributions
Employees: 5%Employers: Pension: 15.55% Insurance: 32.82% Total 48.37%
(Rate Eff ective July 1,2007)
KERS employer rates are subject to state budget approval. 11
FinalCompensation
Years of Service
Benefi tFactorx x
The Kentucky Employees Retirement System (KERS) was established July 1, 1956 by the state legislature. Employees who work in a regular full time position for a participating
agency must be enrolled in the retirement system at the beginning of their employment. A regular full-time position is defi ned by state statute as a position that averages 100 hours of work per month over a fi scal or calendar year, excluding the
classifi cations of temporary, seasonal, and interim.
Kentucky Employees
Retirement System
Non-Hazardous

System HighlightsMembers
Active Members: 4,320Inactive Members: 2,501Retired Members and Benefi ciaries: 1,980
Active Membership
Average Age: 41.6Average Years of Service: 7.0Average Annual Salary: $32,117
Retired Membership
Average Age: 61.1Average Annual Benefi t: $12,729Number Added: 256Number Removed: 28
Normal Retirement
The KERS formula for normal retirement is:
Insurance Benefi ts
The cost of insurance for the retired member and eligible dependents may be partially, or fully paid by KRS depending upon the member’s type and years of service, the insurance carrier selected and the level of coverage chosen.
Retirement Eligibility
Age Years of Service Allowance Reduction
55 5 None
Any 20 None
50 15 5.5% per year for 5 years before age 55 or 20 years of service.
Cost of Living Adjustment
Monthly retirement allowances are increased July 1 each year by the percentage increase in the annual average consumer price index (CPI-U) for all urban consumers for the most recent calendar year not to exceed 5%. The State Legislature may reduce, suspend or eliminate COLAs in the future.
Net Plan Assets
Pension Fund: $ 437,030,000Insurance Fund: $ 223,458,000Total: $ 660,488,000
Contributions
Employees: 8 %Employers: Pension: 10.20 % Insurance: 36.91 % Total: 47.11 %
(Rate Eff ective July 1,2007)
KERS employer rates are subject to state budget approval.
2001 2002 2003 2004 2005 2006
Net Plan Assets Additions (Dollars in Millions)
Net Investment Income 10.9 22.0 17.6 68.6 49.1 65.7
Employer Cont. (Ins.) 13.2 15.9 15.9 15.0 15.7 17.0
Employer Cont. (Pen.) 10.6 7.9 7.3 9.8 9.8 10.8
Member Contribution 10.6 10.8 11.6 11.5 11.6 12.1
Premiums from Retirees .09
Net Plan Assets Deductions (Dollars in Millions)
Medical Insurance Exp.* 2.0 2.5 3.0 3.6 4.9 6.6
Refunds 1.3 1.1 1.2 1.4 1.8 1.4
Administrative Exp. .3 .4 .4 .4 .5 .6
Benefi t Payments 8.0 10.2 13.4 16.9 20.5 23.7
Funding Level
Pension 126.8 116.9 108.1 98.4 92.3 84.1
Insurance 55.7 57.4 53.5 52.3 48.6 34.3
Kentucky Employees
Retirement System
HazardousThe Kentucky Employees Retirement System (KERS) was
established July 1, 1956 by the state legislature. Employees who work in a regular full time position for a participating agency must be enrolled in the retirement system at the beginning of
their employment. A regular full-time position is defi ned by state statute as a position that average 100 hours of work per month
over a fi scal or calendar year, excluding the classifi cations of temporary, seasonal, and interim.
12
FinalCompensation
Years of Service
Benefi tFactorx x
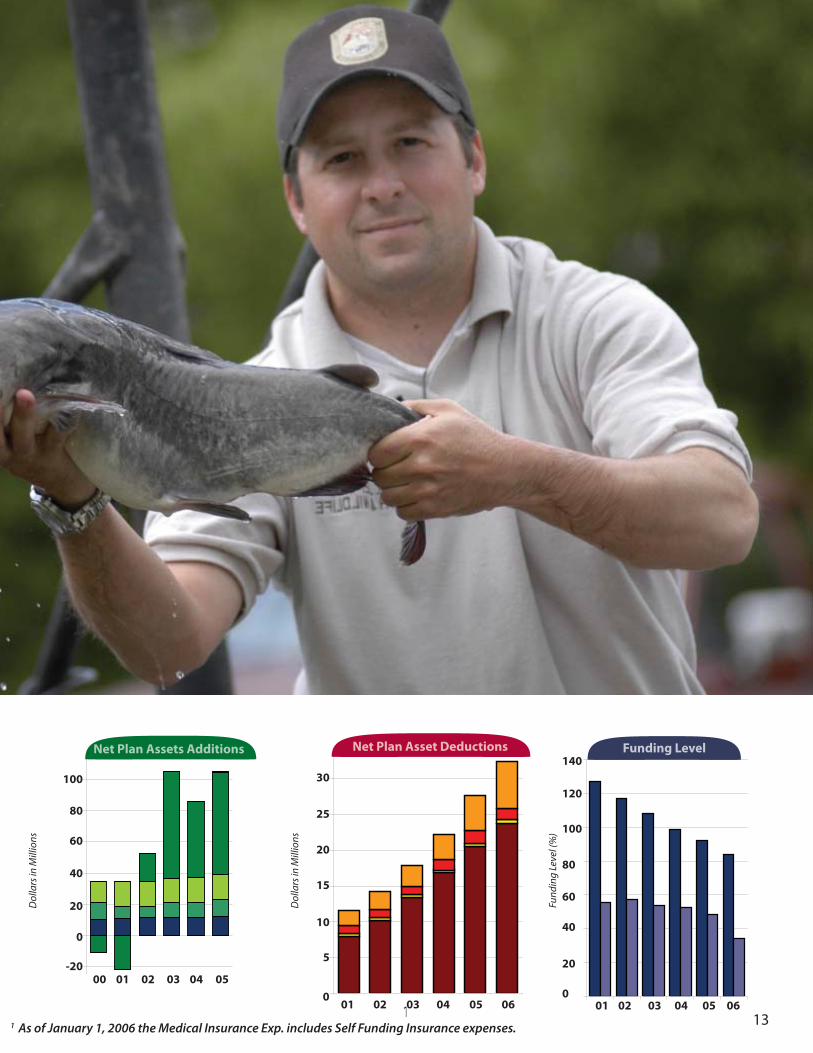
1313
Net Plan Assets Additions Net Plan Asset Deductions
100
20
40
60
80
0
-20
30
20
10
15
25
5
0
140
120
100
80
60
40
20
0060504030201060504030201
050402 030100
Fund
ing
Leve
l (%
)
Dol
lars
in M
illio
ns
Dol
lars
in M
illio
ns
Funding Level
131 As of January 1, 2006 the Medical Insurance Exp. includes Self Funding Insurance expenses.

14
State Police etirement System
Net Plan Assets Additions Funding LevelNet Plan Asset Deductions
1,000
200
400
600
800
0
-400
-200
300
200
100
150
250
50
0
140
120
100
80
60
40
20
0060504030201050403020100060503 040201
Fund
ing
Leve
l (%
)
Dol
lars
in M
illio
ns
Dol
lars
in M
illio
ns
400
350
160
14
450
1 As of January 1, 2006 the Medical Insurance Exp. includes Self Funding Insurance expenses.

2001 2002 2003 2004 2005 2006
Net Plan Assets Additions (Dollars in Millions)
Net Investment Income 252.1 151.5 170.7 637.7 469.4 527.8
Employer Cont. (Ins.) 62.3 102.2 99.2 89.3 107.6 128.9
Employer Cont. (Pen.) 48.9 5.5 11.9 44.0 54.6 90.8
Member Contribution 101.6 122.4 125.3 122.5 127.6 112.4
Premiums from Retirees 6.4
Net Plan Assets Deductions (Dollars in Millions)
Medical Insurance Exp.* 27.8 33.0 39.7 47.0 58.7 74.5
Refunds 9.0 8.3 10.2 11.3 11.0 11.6
Administrative Exp. 6.2 7.2 8.2 8.7 10.0 12.8
Benefi t Payments 170.3 196.7 230.3 260.6 294.6 325.1
Funding Level (% of Actuarial Assets to Actuarial Liabilities)
Pension 146.3 129.6 119.7 105.1 94.0 83.6
Insurance 20.7 22.8 23.9 24.0 23.8 16.9
System HighlightsMembers
Active Members 83,694Inactive Members 50,046Retired Members and Benefi ciaries 33,102
Active Membership Average Age 45.1Average Years of Service 8.1Average Annual Salary $23,687
Retired Membership Average Age 68.1Average Annual Benefi t $9,711Number Added 2,782Number Removed 1,027
Normal Retirement
The CERS formula for normal retirement is:
Insurance Benefi ts
The cost of insurance for the retired member may be partially, or fully paid by KRS depending upon the member’s years of service, the insurance carrier selected and the level of coverage chosen. Retirement Eligibility
Age Years of Service Allowance Reduction
65 4 None
Any 27 None
55 55% per year for 5 years before age 65 or 27 years of service. 4% for each year thereafter.
Any 25 5% each year for fi ve years before 65 or 27 years of service.
Cost of Living Adjustment
Monthly retirement allowances are increased July 1 each year by the percentage increase in the average consumer price index (CPI-U) for all urban consumers for the most recent calendar year not to exceed 5%. The State Legislature may reduce, suspend or eliminate COLAs in the future.
Net Plan Assets
Pension Fund: $5,191,377,000Insurance Fund: $ 813,998,000Total: $6,005,375,000
Contributions
Employees: 5%Employers: Pension: 6.98% Insurance: 20.51% Total 27.49%
(Rate Eff ective July 1,2007)
County Employees
Retirement System
Non-Hazardous The County Employees Retirement System (CERS) was
established July 1, 1958 by the state legislature. Employees who work in a regular full time position for a participating agency must be enrolled in the retirement system at the beginning of
their employment. A regular full-time position is defi ned by state statute as a position that average 100 hours of work per month
over a fi scal or calendar year, excluding the classifi cations of temporary, seasonal, and interim. For school board employees participating in the CERS non-hazardous plan, a regular full-
time position is defi ned as a position that requires the employee to average 80 hours of work per month over the actual days
worked during the school year.
15
FinalCompensation
Years of Service
Benefi tFactorx x
Please see page 106 for a full explanation of the employer
contribution rate phase-in.
Net Plan Assets Additions
-400
2000 2001 2002 2003 2004 2005
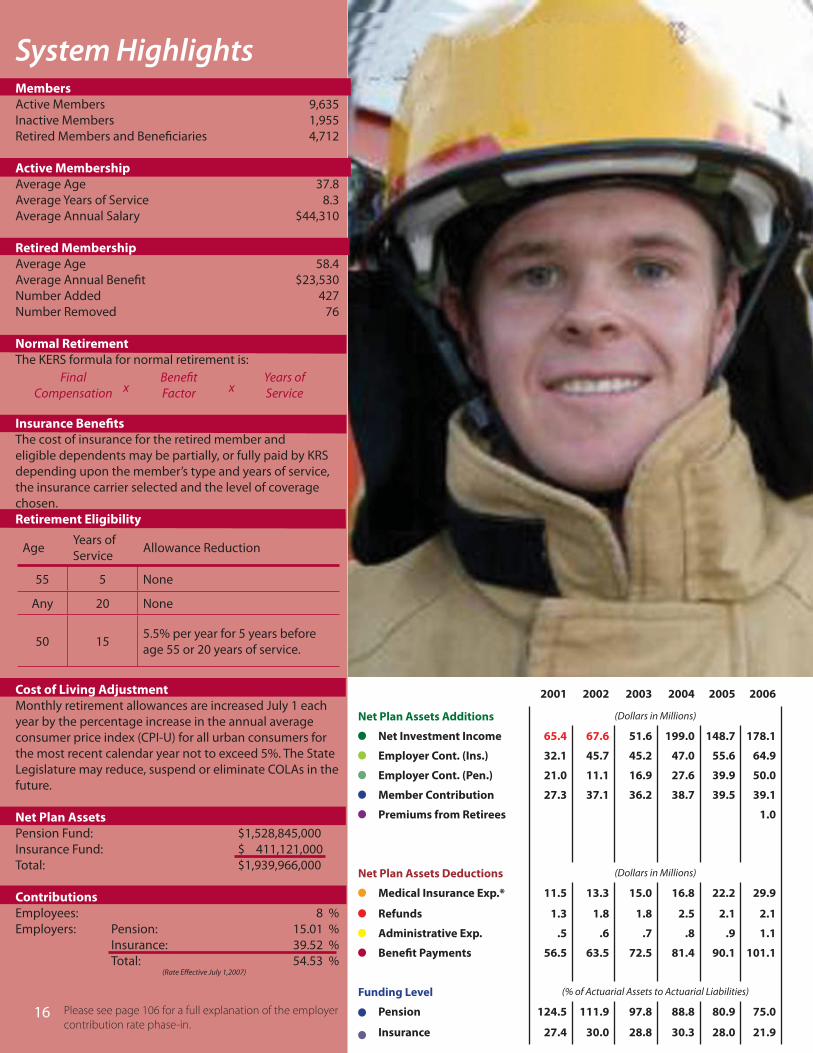
System HighlightsMembers
Active Members 9,635Inactive Members 1,955Retired Members and Benefi ciaries 4,712
Active Membership
Average Age 37.8Average Years of Service 8.3Average Annual Salary $44,310
Retired Membership
Average Age 58.4Average Annual Benefi t $23,530Number Added 427Number Removed 76
Normal Retirement
The KERS formula for normal retirement is:
Insurance Benefi ts
The cost of insurance for the retired member and eligible dependents may be partially, or fully paid by KRS depending upon the member’s type and years of service, the insurance carrier selected and the level of coverage chosen. Retirement Eligibility
Age Years of Service Allowance Reduction
55 5 None
Any 20 None
50 15 5.5% per year for 5 years before age 55 or 20 years of service.
Cost of Living Adjustment
Monthly retirement allowances are increased July 1 each year by the percentage increase in the annual average consumer price index (CPI-U) for all urban consumers for the most recent calendar year not to exceed 5%. The State Legislature may reduce, suspend or eliminate COLAs in the future.
Net Plan Assets
Pension Fund: $1,528,845,000Insurance Fund: $ 411,121,000Total: $1,939,966,000
Contributions
Employees: 8 %Employers: Pension: 15.01 % Insurance: 39.52 % Total: 54.53 %
(Rate Eff ective July 1,2007)
2001 2002 2003 2004 2005 2006
Net Plan Assets Additions (Dollars in Millions)
Net Investment Income 65.4 67.6 51.6 199.0 148.7 178.1
Employer Cont. (Ins.) 32.1 45.7 45.2 47.0 55.6 64.9
Employer Cont. (Pen.) 21.0 11.1 16.9 27.6 39.9 50.0
Member Contribution 27.3 37.1 36.2 38.7 39.5 39.1
Premiums from Retirees 1.0
Net Plan Assets Deductions (Dollars in Millions)
Medical Insurance Exp.* 11.5 13.3 15.0 16.8 22.2 29.9
Refunds 1.3 1.8 1.8 2.5 2.1 2.1
Administrative Exp. .5 .6 .7 .8 .9 1.1
Benefi t Payments 56.5 63.5 72.5 81.4 90.1 101.1
Funding Level (% of Actuarial Assets to Actuarial Liabilities)
Pension 124.5 111.9 97.8 88.8 80.9 75.0
Insurance 27.4 30.0 28.8 30.3 28.0 21.9
16
FinalCompensation
Years of Service
Benefi tFactorx x
Please see page 106 for a full explanation of the employer
contribution rate phase-in.
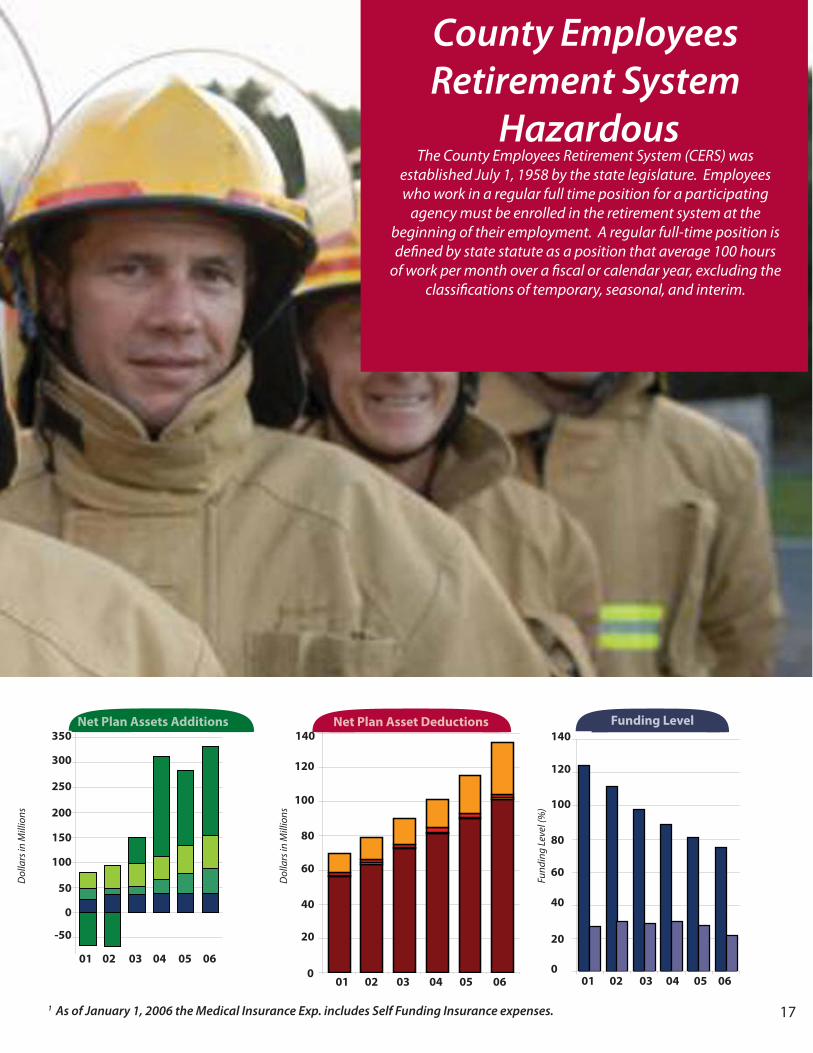
1717
Net Plan Assets Additions Funding LevelNet Plan Asset Deductions350
50
100
150
200
0
-50
120
80
40
60
100
20
0
140
120
100
80
60
40
20
0060504030201060504030201
060503 040201
Fund
ing
Leve
l (%
)
Dol
lars
in M
illio
ns
Dol
lars
in M
illio
ns
County Employees Retirement System
Hazardous The County Employees Retirement System (CERS) was
established July 1, 1958 by the state legislature. Employees who work in a regular full time position for a participating
agency must be enrolled in the retirement system at the beginning of their employment. A regular full-time position is defi ned by state statute as a position that average 100 hours
of work per month over a fi scal or calendar year, excluding the classifi cations of temporary, seasonal, and interim.
300
250
17
140
1 As of January 1, 2006 the Medical Insurance Exp. includes Self Funding Insurance expenses.
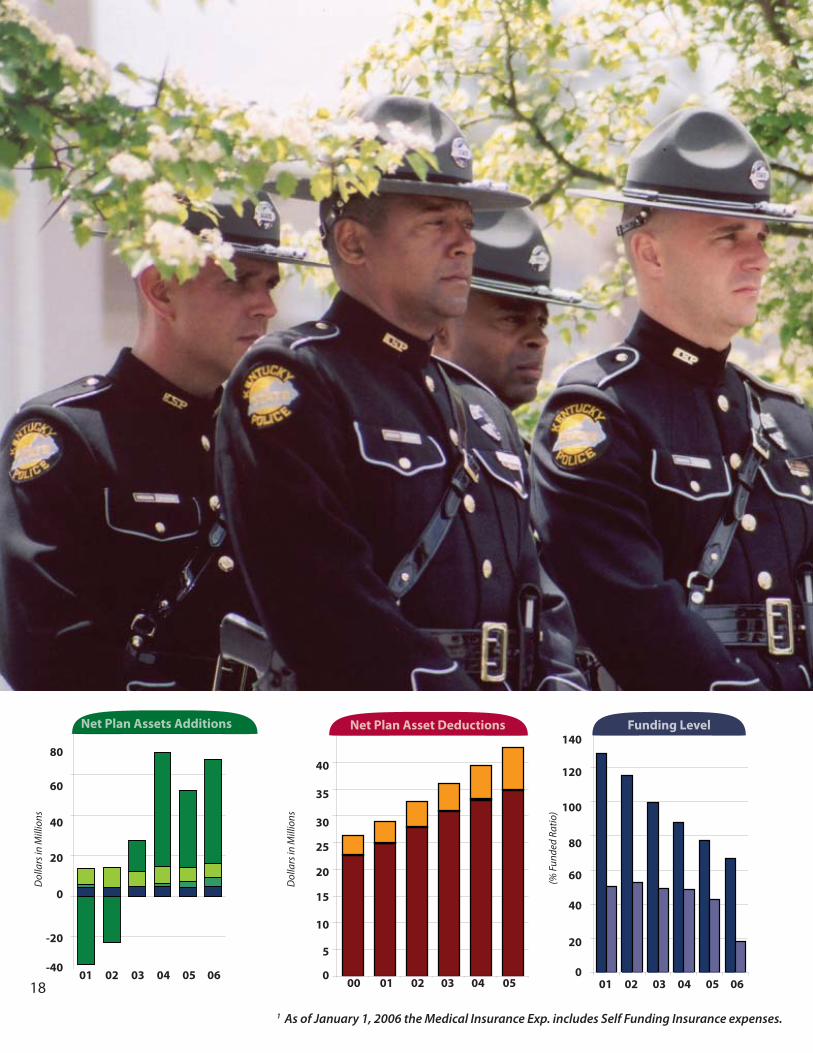
18
Net Plan Assets Additions Funding LevelNet Plan Asset Deductions
20
40
60
80
0
-40
-20
30
20
10
15
25
5
0
140
120
100
80
60
40
20
0060504030201050403020100
060503 040201
(% F
unde
d Ra
tio)
Dol
lars
in M
illio
ns
Dol
lars
in M
illio
ns
40
35
18
1 As of January 1, 2006 the Medical Insurance Exp. includes Self Funding Insurance expenses.

19
2001 2002 2003 2004 2005 2006
Net Plan Assets Additions (Dollars in Millions)
Net Investment Income 33.9 22.8 15.1 56.1 38.0 51.4
Employer Cont. (Ins.) 8.1 9.6 7.7 8.5 7.0 6.9
Employer Cont. (Pen.) 1.5 0 0 1.2 2.9 4.2
Member Contribution 4.1 4.5 4.7 4.9 4.2 4.8
Net Plan Assets Deductions (Dollars in Millions)
Medical Insurance Exp.* 3.6 4.0 4.5 5.0 6.3 7.9
Refunds .1 0 .1 .2 .1 .1
Administrative Exp. .1 .1 .1 .1 .1 .1
Benefi t Payments 22.6 24.8 27.9 30.8 32.9 34.7
Funding Level (% of Actuarial Assets to Actuarial Liabilities)
Pension 128.1 115.3 99.6 88.0 77.1 66.6
Insurance 50.5 52.5 49.2 48.9 42.8 18.1
System HighlightsMembers
Active Members 1,028Inactive Members 266Retired Members and Benefi ciaries 1,067
Active Membership
Average Age 36.5Average Years of Service 10.5Average Annual Salary $44,443
Retired Membership
Average Age 59.8Average Annual Benefi t $34,497Number Added 43Number Removed 10
Normal Retirement
The SPRS formula for normal retirement is:
Insurance Benefi ts
The cost of insurance for the retired member and eligible dependents may be partially, or fully paid by KRS depending upon the member’s type and years of service, the insurance carrier selected and the level of coverage chosen.
Retirement Eligibility
Age Years of Service Allowance Reduction
55 5 None
Any 20 None
Any 15 5.5% each year for fi ve years before 55 or 20 years of service.
Cost of Living Adjustment
Monthly retirement allowances are increased July 1 each year by the percentage increase in the average consumer price index for all urban consumers for the most recent calendar year not to exceed 5%. The General Assembly may reduce, suspend or eliminate COLAs in the future.
Net Plan Assets
Pension Fund: $ 352,841,000Insurance Fund: $ 110,460,000Total: $ 463,301,000
Contributions
Employees: 8%Employers: Pension: 28.95 % Insurance: 91.05 % Total: 120.00 %
(Rate Eff ective July 1,2007)
SPRS employer rates are subject to state budget approval.
State Police
Retirement System The State Police Retirement System (SPRS) was established July 1,
1960 by the state legislature. Employees who work in a regular full time position for a participating agency must be enrolled in the
retirement system at the beginning of their employment. A regular full-time position is defi ned by state statute as a position that
average 100 hours of work per month over a fi scal or calendar year, excluding the classifi cations of temporary, seasonal, and interim.
19
FinalCompensation
Years of Service
Benefi tFactorx x

Financial Section
Independent Auditor’s Report 22
Management’s Discussion and Analysis 23
Financial Statements
Combining Statement of Plan Net Assets 28
Combined Statements of Changes in Plan Net Assets 30
Notes to Financial Statements 32
Required Supplementary Information
Schedule Funding Progress 52
Schedule of Employer Contributions 58
Notes to Required Supplementary Information 63
Additional Supporting Schedules
Schedule of Administrative Expenses 64
Schedule of Investment Expenses 65
Schedule of Professional Consultant Fees 65
Combining Schedules of Plan Net Assets 66
Combining Schedules of Changes in Plan Net Assets 68
Report On Internal Control over Financial Reporting 70
Schedule of Finding and Response 71

Financial Section
22
INDEPENDENT AUDITOR’S REPORT
Board of TrusteesKentucky Retirement SystemsFrankfort, Kentucky
We have audited the fi nancial statement of the Kentucky Retirement Systems, a component unit of the Commonwealth of Kentucky, as of and for the year ended June 30, 2006, as listed in the table of contents. This fi nancial statement is the responsibility of the Kentucky Retirement Systems’ management. Our responsibility is to express an opinion on this fi nancial statement based on our audit.
We conducted our audit in accordance with auditing standards generally accepted in the United States of America and the standards applicable to fi nancial audits contained in Government Auditing Standards, issued by the Comptroller General of the United States. Those standards require that we plan and perform the audit to obtain reasonable assurance about whether the fi nancial statements are free of material misstatement. An audit includes examining, on a test basis, evidence supporting the amounts and disclosures in the fi nancial statements. An audit also includes assessing the accounting principles used and signifi cant estimates made by management, as well as evaluating the overall fi nancial statement presentation. We believe that our audit provides a reasonable basis for our opinion.
In our opinion, the fi nancial statement referred to above presents fairly, in all material respects, the plan net assets of the Kentucky Retirement Systems, a component unit of the Commonwealth of Kentucky, as of June 30, 2006 and the changes in plan net assets for the year then ended, in conformity with accounting principles generally accepted in the United States of America.
In accordance with Government Auditing Standards, we have also issued our report dated August 31,2006 on our consideration of the Kentucky Retirement Systems’ internal control over fi nancial reporting and our tests of its compliance with certain provisions of laws, regulations, contracts, and grant agreements and other matters. That report is an integral part of an audit performed in accordance with Government Auditing Standards and should be read in conjunction with this report in considering the results of our audit.
Management’s Discussion and Analysis (pages 25 through 29) and the supplementary information included in the schedule of funding progress and schedule of employer contributions (pages 54 through 64) are not a required part of the basic fi nancial statements, but are supplementary information required by the Governmental Accounting Standards Board. We have applied certain limited procedures, which consisted principally of inquiries of management regarding the methods of measurement and presentation of the required supplementary information. However, we did not audit the information and express no opinion on it.
Our audit was conducted for the purpose of forming an opinion on the fi nancial statements taken as a whole. The additional supporting schedules (pages 54 through 71) are presented for the purpose of additional analysis and are not a required part of the fi nancial statements. Such information has been subjected to the auditing procedures applied in the audit of the fi nancial statement and, in our opinion, is fairly stated in all material respects in relation to the fi nancial statement taken as a whole.
August 31, 2006Louisville, Kentucky

23
Financial Section
KENTUCKY RETIREMENT SYSTEMSMANAGEMENT’S DISCUSSION AND ANALYSIS
For the Fiscal Year Ended June 30, 2006
This discussion and analysis of Kentucky Retirement System’s fi nancial performance provides an overview of the pension and insurance fund fi nancial activities for the fi scal year ended June 30, 2006. Please read it in conjunction with the fi nancial statements, which begin on page 30.
FINANCIAL HIGHLIGHTS -- PENSION FUND
The following highlights are explained in more detail later in this discussion.
• The combined plan net assets of all pension funds administered by Kentucky Retirement Systems increased by $545 million during the 2005-2006 fi scal year.
• Covered payroll for 2005-2006 was $4,348 million compared to covered payroll for the 2004-2005 plan year of $4,160.4 million, increasing approximately $187.6 million. The corresponding employer contributions increased by $79.7 million for a total employer contribution amount of $469.9 million. Of the total employer contribution amount, $216.5 million was posted to the pension funds while $253.4 million was posted to the insurance funds. Contributions paid by employees were $275.9 and $310.8 million respectively for the years ended June 30, 2006 and June 30, 2005. This decrease in employee contribution is a result of a decrease in service purchased by KRS members.
• The net appreciation in the fair value of investments was $803.6 million for the year ended June 30, 2006 compared to net appreciation of $723.8 million for the prior fi scal year. Included in this net appreciation were realized gains on sales of investments of $601.6 million. In comparison, the pension funds realized gains of $474.9 million for the year ended June 30, 2005. The increase in realized gain experienced by the pension funds is due to a favorable change in market conditions.
• Interest, dividend and securities lending income net of their respective expenses was $358.8 million compared to $335.3 million net investment income in last fi scal year.
• Pension benefi ts paid to retirees and benefi ciaries increased $102.1 million bringing total benefi t payments to $1,062.6 million. Refund of contributions paid to former members upon termination of employment increased from $23.9 million to $24.9 million.
• Administrative expense increased $4.8 million totaling $22.2 million compared to $17.4 million in the prior year.
Financial Section
24
KENTUCKY RETIREMENT SYSTEMSMANAGEMENT’S DISCUSSION AND ANALYSIS
For the Fiscal Year Ended June 30, 2006
FINANCIAL HIGHLIGHTS -- INSURANCE FUND
The following highlights are explained in more detail later in this discussion.
• The combined plan net assets of the insurance fund administered by Kentucky Retirement Systems increased by $272 million during the 2005-2006 fi scal year.
• Premiums received from retirees that participated in the self funded plan totaled $12.3 million.
• Employer contributions of $253.4 million were received. This is an increase of $20.7 million over the prior fi scal year. This increase is due to the increase of covered payroll reported by participating employers.
The net appreciation in the fair value of investments was $188.2 million compared to net appreciation of 122.1 million for the prior fi scal year. Included in this net appreciation were realized gains on sales of investments of $77.9 million. In comparison, the insurance funds realized gains on investments of $35.9 million in the prior fi scal year. This increase in realized gains is due to a favorable change in market conditions.
• Interest, dividend and securities lending income net of their respective expenses was approximately $42 million compared to net investment income of approximately $36 million in last fi scal year.
• Premiums paid by the fund for hospital and medical insurance coverage totaled $177.5 million. Payments for the self-funded healthcare reimbursements totaled $35.3 million. The total of insurance premiums paid plus self-funded reimbursements was $212.8 million for the 2005-2006 plan year. Insurance premium paid for the prior plan year totaled $166.9 million.
USING THIS FINANCIAL REPORT
This fi nancial report consists of two fi nancial statements and two required schedules of historical trend information. The Combining Statement of Plan Net Assets for the Pension Fund on page 30 and for the Insurance fund on page 31 provides a snapshot of the fi nancial position of the each of the three systems at June 30, 2006. The Combining Statement of Changes in Plan Net Assets for the Pension Fund on page 32 and for the Insurance Fund on page 33 summarize the additions and deductions that occurred for each of the three systems during the period from July 1, 2005 through June 30, 2006.
The Schedule of Funding Progress on pages 54-59 includes historical trend information about the actuarially funded status of each plan from a long-term perspective and the progress made in accumulating suffi cient assets to pay benefi ts and insurance premiums when due. The Schedule of Employer Contributions on pages 60-64 presents historical trend information about the annual required contributions of employers and the contributions made by employers in relation to the requirement. These schedules provide information that contributes to understanding the changes over time in the funded status of the plans.
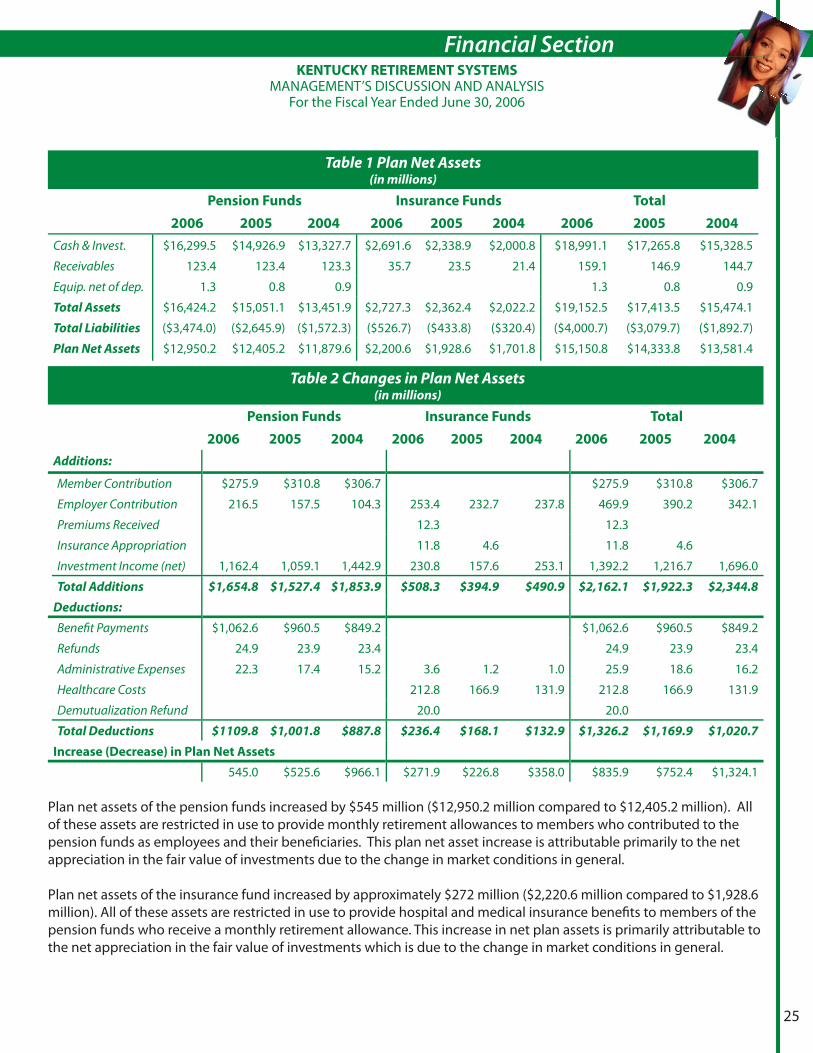
KENTUCKY RETIREMENT SYSTEMS AS A WHOLEKentucky Retirement Systems’ combined plan net assets increased during the year ended June 30, 2006 by approximately $ 837 million from $14,333.8 million to $15,171.3 million. Plan net assets for the prior fi scal year increased by $752.4 million. The increase in plan net assets for the plan year ended June 30, 2006 is primarily attributable to the gains on investment due to favorable market conditions. The analysis below focuses on plan net assets (Table 1) and changes in plan net assets (Table 2) of Kentucky Retirement Systems’ pension funds and insurance fund.
25
Financial SectionKENTUCKY RETIREMENT SYSTEMS
MANAGEMENT’S DISCUSSION AND ANALYSISFor the Fiscal Year Ended June 30, 2006
Table 1 Plan Net Assets(in millions)
Pension Funds Insurance Funds Total
2006 2005 2004 2006 2005 2004 2006 2005 2004
Cash & Invest. $16,299.5 $14,926.9 $13,327.7 $2,691.6 $2,338.9 $2,000.8 $18,991.1 $17,265.8 $15,328.5
Receivables 123.4 123.4 123.3 35.7 23.5 21.4 159.1 146.9 144.7
Equip. net of dep. 1.3 0.8 0.9 1.3 0.8 0.9
Total Assets $16,424.2 $15,051.1 $13,451.9 $2,727.3 $2,362.4 $2,022.2 $19,152.5 $17,413.5 $15,474.1
Total Liabilities ($3,474.0) ($2,645.9) ($1,572.3) ($526.7) ($433.8) ($320.4) ($4,000.7) ($3,079.7) ($1,892.7)
Plan Net Assets $12,950.2 $12,405.2 $11,879.6 $2,200.6 $1,928.6 $1,701.8 $15,150.8 $14,333.8 $13,581.4
Table 2 Changes in Plan Net Assets(in millions)
Pension Funds Insurance Funds Total
2006 2005 2004 2006 2005 2004 2006 2005 2004
Additions:
Member Contribution $275.9 $310.8 $306.7 $275.9 $310.8 $306.7
Employer Contribution 216.5 157.5 104.3 253.4 232.7 237.8 469.9 390.2 342.1
Premiums Received 12.3 12.3
Insurance Appropriation 11.8 4.6 11.8 4.6
Investment Income (net) 1,162.4 1,059.1 1,442.9 230.8 157.6 253.1 1,392.2 1,216.7 1,696.0
Total Additions $1,654.8 $1,527.4 $1,853.9 $508.3 $394.9 $490.9 $2,162.1 $1,922.3 $2,344.8
Deductions:
Benefi t Payments $1,062.6 $960.5 $849.2 $1,062.6 $960.5 $849.2
Refunds 24.9 23.9 23.4 24.9 23.9 23.4
Administrative Expenses 22.3 17.4 15.2 3.6 1.2 1.0 25.9 18.6 16.2
Healthcare Costs 212.8 166.9 131.9 212.8 166.9 131.9
Demutualization Refund 20.0 20.0
Total Deductions $1109.8 $1,001.8 $887.8 $236.4 $168.1 $132.9 $1,326.2 $1,169.9 $1,020.7
Increase (Decrease) in Plan Net Assets
545.0 $525.6 $966.1 $271.9 $226.8 $358.0 $835.9 $752.4 $1,324.1
Plan net assets of the pension funds increased by $545 million ($12,950.2 million compared to $12,405.2 million). All of these assets are restricted in use to provide monthly retirement allowances to members who contributed to the pension funds as employees and their benefi ciaries. This plan net asset increase is attributable primarily to the net appreciation in the fair value of investments due to the change in market conditions in general.
Plan net assets of the insurance fund increased by approximately $272 million ($2,220.6 million compared to $1,928.6 million). All of these assets are restricted in use to provide hospital and medical insurance benefi ts to members of the pension funds who receive a monthly retirement allowance. This increase in net plan assets is primarily attributable to the net appreciation in the fair value of investments which is due to the change in market conditions in general.

Financial Section
26
KENTUCKY RETIREMENT SYSTEMSMANAGEMENT’S DISCUSSION AND ANALYSIS
For the Fiscal Year Ended June 30, 2006
Pension Fund ActivitiesMember contributions decreased by $34.9 million. Retirement contributions are calculated by applying a percentage factor to salary and are remitted by each employer on behalf of the member. Members may also pay contributions to repurchase previously refunded service credit or to purchase various types of elective service credit. The decrease in member contributions is a result of a decrease in elective service purchases by KRS members.
Employer contributions increased by $59 million due to the increase in covered payroll reported to KRS and the increase in the contribution rates applied to the pension funds.
Net investment income increased by $103 million (net investment income of $1,162 million compared to net investment income of $1,059 million in the prior year). The pension funds experienced an increase in income primarily due to the increase in gains of sale of investments. This is illustrated in Table 3 as follows:
Table 3 In Millions
Investment Income (Pension) 2006 2005 2004
Appreciation in fair value of investments current year end $1,845 $1,644 $1,395
Appreciation in fair value of investments prior year end 1,644 1,395 478
Net appreciation in fair value of investments $201 $249 $917
Investment Income net of Investment Expense 359 335 298
Gain (loss) on sale of investments 602 475 228
Investment Income (net) $1,162 $1,059 $1,443
Pension fund deductions increased by $108 million caused principally by an increase of $102.1 million in benefi t payments. Retirees received an increase of 2.7% in benefi t payments as of July 1, 2005. Refunds of member contributions increased by $1 million.
Insurance Fund ActivitiesEmployer contributions paid into the insurance fund increased by $20.7 million over the prior year. This increase is a result of the increase in covered payroll reported to KRS.
Net investment income increased by approximately $73 million. This increase in net income is due primarily to the increase in the gains on sale of investments. This is illustrated in Table 4 as follows:
Table 4 In MillionsInvestment Income (Insurance) 2006 2005 2004
Appreciation in fair value of investments current year end $415 $304 $218
Appreciation in fair value of investments prior year end 304 218 11
Net appreciation in fair value of investments $111 $86 $207
Investment Income net of Investment Expense 42 36 24
Gain (loss) on sale of investments 78 36 22
Investment Income (net) $231 $158 $253
Insurance fund deductions increased by $68.3 million primarily due to the increase in healthcare costs.
27
Financial SectionKENTUCKY RETIREMENT SYSTEMS
MANAGEMENT’S DISCUSSION AND ANALYSISFor the Fiscal Year Ended June 30, 2006
Historical TrendsAccounting standards require that the statement of plan net assets state asset value at fair value and include only benefi ts and refunds due plan members and benefi ciaries and accrued investment and administrative expense as of the reporting date. Information regarding the actuarial funding status of the pension funds and insurance fund is provided in the Schedule of Funding Progress on pages 54-59. The asset value stated in the Schedule of Funding Progress is the actuarial value of assets determined by calculating the diff erence between the expected valuation of assets and the actual market value of assets adjusted for any unrecognized gains or losses and amortized over a fi ve-year period. The actuarial accrued liability is calculated using the entry age normal cost funding method. The diff erence in value between the actuarial accrued liability and the actuarial value of assets is known as the unfunded actuarial accrued liability. This unfunded actuarial accrued liability is the measure of the cost of benefi ts that have been earned to date by KRS members, but not yet paid for.
The unfunded actuarial accrued liability in the pension plans increased by $2,567 million for a total unfunded amount of $5,375.6 million for the year ended June 30, 2006 compared to an unfunded amount of $2,808.6 for the year end June 30, 2005. In recent years, funding levels for the pension funds have fallen dramatically in response to investment returns less than the actuarially assumed rate, higher than anticipated retirement rates, the 2006 assumption changes, and increasing expenditures for retiree Cost of Living Adjustments. Within the KERS and SPRS plans, employer contribution rate reductions enacted by the state legislature have limited the plans ability to correct the declining funding levels.
The post-employment healthcare plans continue to have a large unfunded actuarial accrued liability increasing to $13,424.7 million for the plan year ended June 30, 2006 from $5,455.3 million for the plan year ended June 30, 2005. This is an increase in the unfunded amount of $7,969.4 million. While the funding level relative to the insurance funds has improved steadily since 1990, medical infl ation rates in excess of the assumed rates as well as recent employer contribution rate reductions under KERS and SPRS have signifi cantly limited this improvement. The recent adoption of new actuarial assumptions and the application of GASB Statement 43 requirements have further reduced the measured funding level.
Annual required contributions of the employers as actuarially determined and actual contributions made by the employers in relation to the required contributions are provided in the Schedule of Employer Contributions on pages 60-64. The diff erence in the annual required contributions and actual contributions made by employers in the KERS and SPRS funds is attributable to the fact that the statutory employer contribution rate set by the Kentucky General Assembly is less than the rate computed by the actuary.

Financial Section
28
Pension Funds
As of June 30, 2006 (with comparative totals as of June 30, 2005) 2005
(Dollars in Thousands) KERS CERS SPRS TOTAL TOTAL
Assets
Cash and Short-Term Investments
Cash $1,966 $954 $90 $3,010 $1,499
Short-Term Investments 120,777 108,000 12,110 240,887 353,055
Total Cash and Short-Term Investments 122,743 108,954 12,200 243,897 354,554
Receivables
Contributions 24,891 38,715 1,290 64,896 66,599
Investment Income 25,842 31,070 1,572 58,484 56,760
Total Receivables 50,733 69,785 2,862 123,380 123,359
Investments, at Fair Value
Corporate and Government Bonds 1,685,307 2,045,088 105,004 3,835,399 3,955,223
Corporate Stocks 3,686,132 4,011,783 211,565 7,909,480 7,329,933
Mortgages 334,067 490,536 20,933 845,536 641,949
Real Estate 4,289 4,775 481 9,545 9,693
Total Investments at Fair Value 5,709,795 6,552,182 337,983 12,599,960 11,936,798
Securities Lending Collateral Invested 1,254,181 2,093,411 108,101 3,455,693 2,635,518
Equipment (net of accumulated depreciation) 473 796 8 1,277 832Total Assets 7,137,925 8,825,128 461,154 16,424,207 15,051,061
Liabilities
Accounts Payable 6,581 11,495 212 18,288 10,352
Securities Lending Collateral Obligations 1,254,181 2,093,411 108,101 3,455,693 2,635,518Total Liabilities 1,260,762 2,104,906 108,313 3,473,981 2,645,870
Plan Net Assets Held in Trust
for Pension Benefi ts
$5,877,163 $6,720,222 $352,841 $12,950,226 $12,405,191
Combining Statements of Plan Net Assets

29
Financial Section
Insurance Funds
As of June 30, 2006 (with comparative totals as of June 30, 2005) 2005
(Dollars in Thousands) KERS CERS SPRS TOTAL TOTAL
Assets
Cash and Short-Term Investments
Cash $133 $125 $7 $265 $207
Short-Term Investments 120,317 104,467 9,066 233,850 210,072
Total Cash and Short-Term
Investments120,450 104,592 9,073 234,115 210,279
Receivables
Contributions 4,751 25,164 378 30,293 18,617
Investment Income 2,131 3,042 267 5,440 4,909
Total Receivables 6,882 28,206 645 35,733 23,526
Investments, at Fair Value
Corporate and Government Bonds 82,777 127,316 10,689 220,782 199,189
Corporate Stocks 647,671 997,385 90,208 1,735,264 1,497,841
Alternative Investment 30 98 7 135
Total Investments at Fair Value 730,478 1,124,799 100,904 1,956,181 1,697,030
Securities Lending Collateral Invested 131,343 344,439 25,561 501,343 431,552Total Assets 989,153 1,602,036 136,183 2,727,372 2,362,387
Liabilities
Accounts Payable 1,767 3,478 162 5,407 2,230
Demutualization Proceeds Payable 20,000 20,000
Securities Lending Collateral Obligations 131,343 344,439 25,561 501,343 431,552Total Liabilities 153,110 347,917 25,723 526,750 433,782
Plan Net Assets Held in Trust
for Insurance Benefi ts
$836,043 $ 1,254,119 $ 110,460 $ 2,200,622 $ 1,928,605
Combining Statements of Plan Net Assets
(A schedule of funding progress for each plan is presented on pages 54-59)See accompanying independent auditor’s report and notes to fi nancial statements.
Financial Section
30
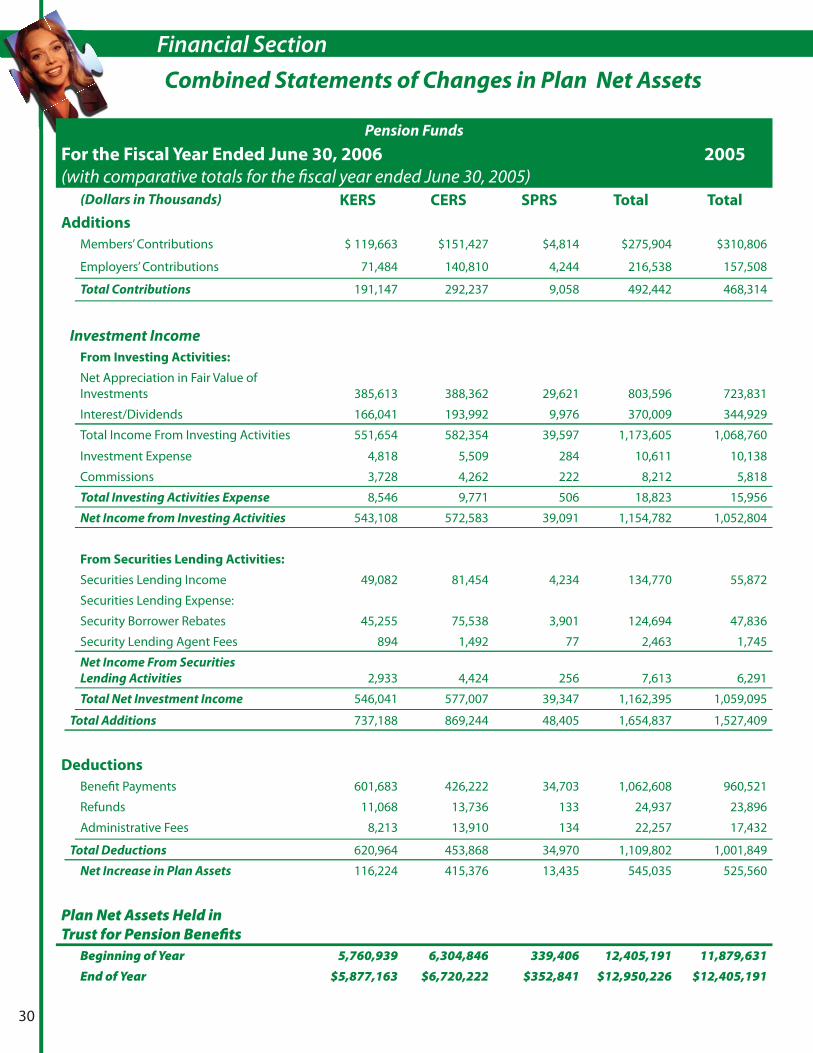
Combined Statements of Changes in Plan Net Assets
Pension Funds
For the Fiscal Year Ended June 30, 2006
(with comparative totals for the fi scal year ended June 30, 2005)2005
(Dollars in Thousands) KERS CERS SPRS Total Total
Additions
Members’ Contributions $ 119,663 $151,427 $4,814 $275,904 $310,806
Employers’ Contributions 71,484 140,810 4,244 216,538 157,508
Total Contributions 191,147 292,237 9,058 492,442 468,314
Investment Income
From Investing Activities:
Net Appreciation in Fair Value of Investments 385,613 388,362 29,621 803,596 723,831
Interest/Dividends 166,041 193,992 9,976 370,009 344,929
Total Income From Investing Activities 551,654 582,354 39,597 1,173,605 1,068,760
Investment Expense 4,818 5,509 284 10,611 10,138
Commissions 3,728 4,262 222 8,212 5,818
Total Investing Activities Expense 8,546 9,771 506 18,823 15,956
Net Income from Investing Activities 543,108 572,583 39,091 1,154,782 1,052,804
From Securities Lending Activities:
Securities Lending Income 49,082 81,454 4,234 134,770 55,872
Securities Lending Expense:
Security Borrower Rebates 45,255 75,538 3,901 124,694 47,836
Security Lending Agent Fees 894 1,492 77 2,463 1,745
Net Income From Securities
Lending Activities 2,933 4,424 256 7,613 6,291
Total Net Investment Income 546,041 577,007 39,347 1,162,395 1,059,095
Total Additions 737,188 869,244 48,405 1,654,837 1,527,409
Deductions Benefi t Payments 601,683 426,222 34,703 1,062,608 960,521
Refunds 11,068 13,736 133 24,937 23,896
Administrative Fees 8,213 13,910 134 22,257 17,432
Total Deductions 620,964 453,868 34,970 1,109,802 1,001,849
Net Increase in Plan Assets 116,224 415,376 13,435 545,035 525,560
Plan Net Assets Held in Trust for Pension Benefi ts
Beginning of Year 5,760,939 6,304,846 339,406 12,405,191 11,879,631End of Year $5,877,163 $6,720,222 $352,841 $12,950,226 $12,405,191
31
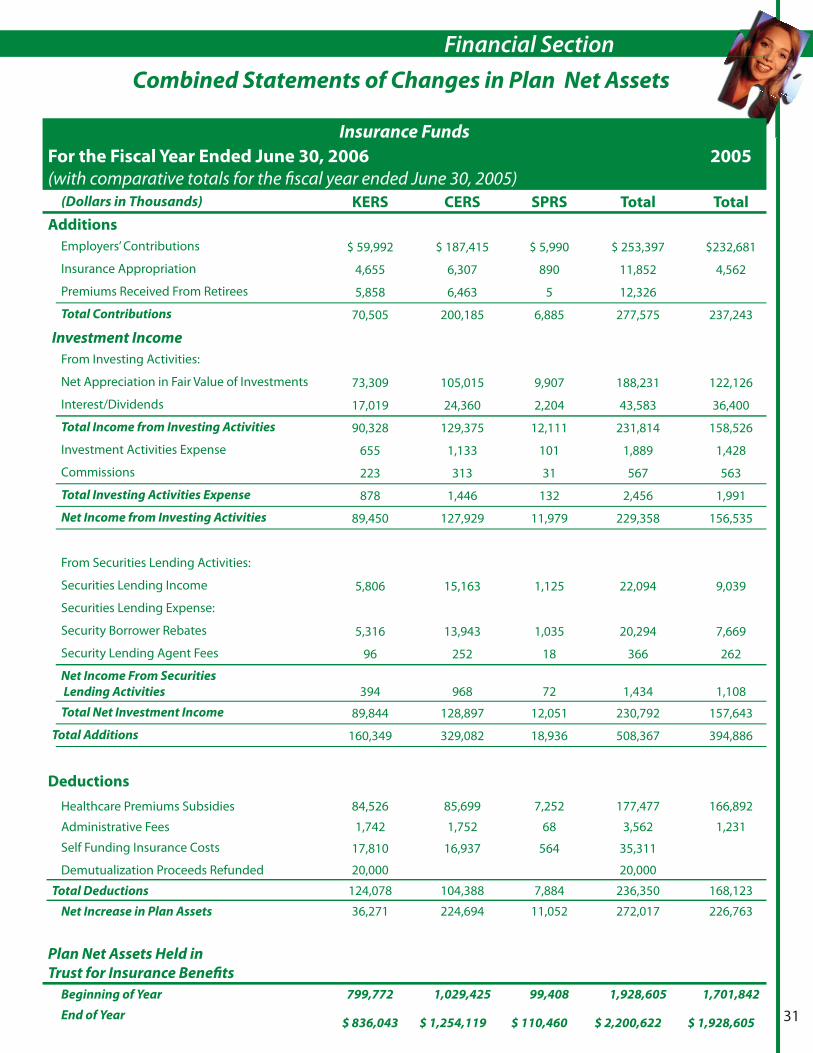
Financial Section
Insurance Funds
For the Fiscal Year Ended June 30, 2006
(with comparative totals for the fi scal year ended June 30, 2005)2005
(Dollars in Thousands) KERS CERS SPRS Total Total
Additions
Employers’ Contributions $ 59,992 $ 187,415 $ 5,990 $ 253,397 $232,681
Insurance Appropriation 4,655 6,307 890 11,852 4,562
Premiums Received From Retirees 5,858 6,463 5 12,326
Total Contributions 70,505 200,185 6,885 277,575 237,243
Investment Income
From Investing Activities:
Net Appreciation in Fair Value of Investments 73,309 105,015 9,907 188,231 122,126
Interest/Dividends 17,019 24,360 2,204 43,583 36,400
Total Income from Investing Activities 90,328 129,375 12,111 231,814 158,526
Investment Activities Expense 655 1,133 101 1,889 1,428
Commissions 223 313 31 567 563
Total Investing Activities Expense 878 1,446 132 2,456 1,991
Net Income from Investing Activities 89,450 127,929 11,979 229,358 156,535
From Securities Lending Activities:
Securities Lending Income 5,806 15,163 1,125 22,094 9,039
Securities Lending Expense:
Security Borrower Rebates 5,316 13,943 1,035 20,294 7,669
Security Lending Agent Fees 96 252 18 366 262
Net Income From Securities
Lending Activities 394 968 72 1,434 1,108
Total Net Investment Income 89,844 128,897 12,051 230,792 157,643
Total Additions 160,349 329,082 18,936 508,367 394,886
Deductions
Healthcare Premiums Subsidies 84,526 85,699 7,252 177,477 166,892
Administrative Fees 1,742 1,752 68 3,562 1,231
Self Funding Insurance Costs 17,810 16,937 564 35,311
Demutualization Proceeds Refunded 20,000 20,000
Total Deductions 124,078 104,388 7,884 236,350 168,123
Net Increase in Plan Assets 36,271 224,694 11,052 272,017 226,763
Plan Net Assets Held in
Trust for Insurance Benefi ts
Beginning of Year 799,772 1,029,425 99,408 1,928,605 1,701,842
End of Year$ 836,043 $ 1,254,119 $ 110,460 $ 2,200,622 $ 1,928,605
Combined Statements of Changes in Plan Net Assets
Financial Section
32
KENTUCKY RETIREMENT SYSTEMS
NOTES TO FINANCIAL STATEMENTSFor the Fiscal Years Ended June 30, 2006 and 2005
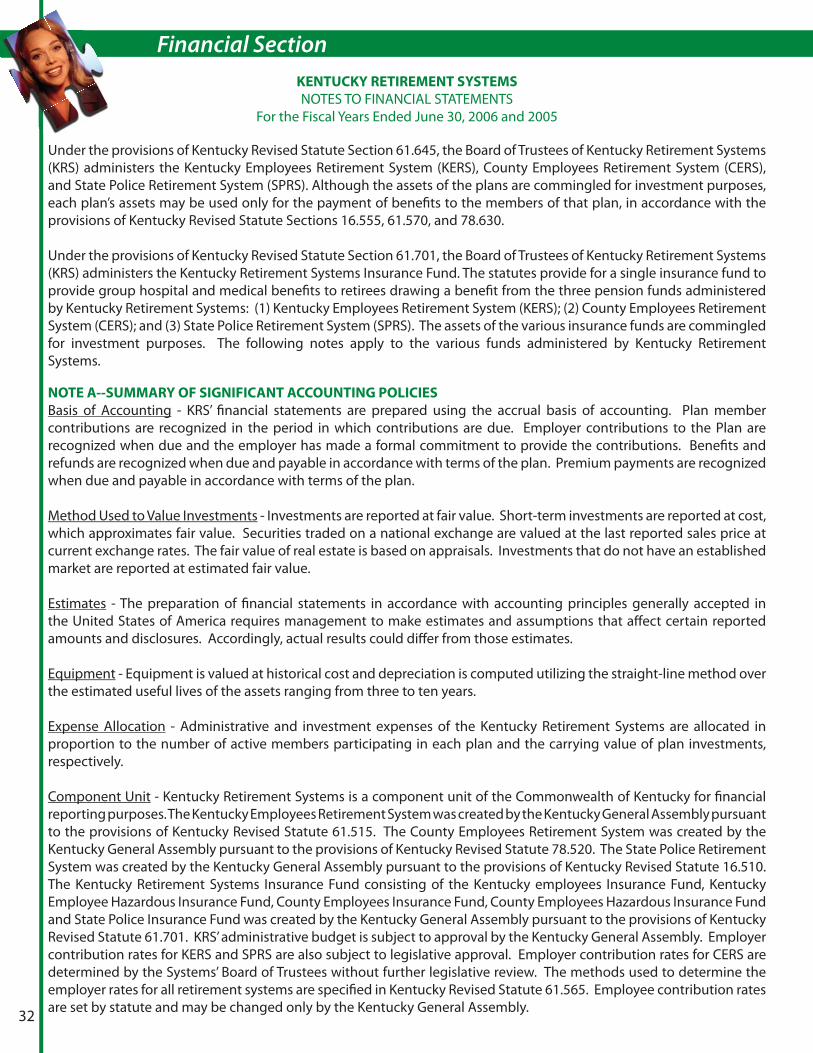
Under the provisions of Kentucky Revised Statute Section 61.645, the Board of Trustees of Kentucky Retirement Systems (KRS) administers the Kentucky Employees Retirement System (KERS), County Employees Retirement System (CERS), and State Police Retirement System (SPRS). Although the assets of the plans are commingled for investment purposes, each plan’s assets may be used only for the payment of benefi ts to the members of that plan, in accordance with the provisions of Kentucky Revised Statute Sections 16.555, 61.570, and 78.630.
Under the provisions of Kentucky Revised Statute Section 61.701, the Board of Trustees of Kentucky Retirement Systems (KRS) administers the Kentucky Retirement Systems Insurance Fund. The statutes provide for a single insurance fund to provide group hospital and medical benefi ts to retirees drawing a benefi t from the three pension funds administered by Kentucky Retirement Systems: (1) Kentucky Employees Retirement System (KERS); (2) County Employees Retirement System (CERS); and (3) State Police Retirement System (SPRS). The assets of the various insurance funds are commingled for investment purposes. The following notes apply to the various funds administered by Kentucky Retirement Systems.
NOTE A--SUMMARY OF SIGNIFICANT ACCOUNTING POLICIES
Basis of Accounting - KRS’ fi nancial statements are prepared using the accrual basis of accounting. Plan member contributions are recognized in the period in which contributions are due. Employer contributions to the Plan are recognized when due and the employer has made a formal commitment to provide the contributions. Benefi ts and refunds are recognized when due and payable in accordance with terms of the plan. Premium payments are recognized when due and payable in accordance with terms of the plan.
Method Used to Value Investments - Investments are reported at fair value. Short-term investments are reported at cost, which approximates fair value. Securities traded on a national exchange are valued at the last reported sales price at current exchange rates. The fair value of real estate is based on appraisals. Investments that do not have an established market are reported at estimated fair value.
Estimates - The preparation of fi nancial statements in accordance with accounting principles generally accepted in the United States of America requires management to make estimates and assumptions that aff ect certain reported amounts and disclosures. Accordingly, actual results could diff er from those estimates.
Equipment - Equipment is valued at historical cost and depreciation is computed utilizing the straight-line method over the estimated useful lives of the assets ranging from three to ten years.
Expense Allocation - Administrative and investment expenses of the Kentucky Retirement Systems are allocated in proportion to the number of active members participating in each plan and the carrying value of plan investments, respectively.
Component Unit - Kentucky Retirement Systems is a component unit of the Commonwealth of Kentucky for fi nancial reporting purposes. The Kentucky Employees Retirement System was created by the Kentucky General Assembly pursuant to the provisions of Kentucky Revised Statute 61.515. The County Employees Retirement System was created by the Kentucky General Assembly pursuant to the provisions of Kentucky Revised Statute 78.520. The State Police Retirement System was created by the Kentucky General Assembly pursuant to the provisions of Kentucky Revised Statute 16.510. The Kentucky Retirement Systems Insurance Fund consisting of the Kentucky employees Insurance Fund, Kentucky Employee Hazardous Insurance Fund, County Employees Insurance Fund, County Employees Hazardous Insurance Fund and State Police Insurance Fund was created by the Kentucky General Assembly pursuant to the provisions of Kentucky Revised Statute 61.701. KRS’ administrative budget is subject to approval by the Kentucky General Assembly. Employer contribution rates for KERS and SPRS are also subject to legislative approval. Employer contribution rates for CERS are determined by the Systems’ Board of Trustees without further legislative review. The methods used to determine the employer rates for all retirement systems are specifi ed in Kentucky Revised Statute 61.565. Employee contribution rates are set by statute and may be changed only by the Kentucky General Assembly.

33
Financial SectionKENTUCKY RETIREMENT SYSTEMS
NOTES TO FINANCIAL STATEMENTSFor the Fiscal Years Ended June 30, 2006 and 2005
NOTE B--PLAN DESCRIPTIONS AND CONTRIBUTION INFORMATION
Membership of each retirement system consisted of the following at June 30, 2006 and 2005:
Kentucky Employees Retirement System
2006 2005
Number of MembersNon-Hazardous
Position Employees
Hazardous Position
EmployeesTotal
Non-Hazardous Position
Employees
Hazardous Position
EmployeesTotal
Retirees and Benefi ciaries Receiving Benefi ts 32,140 1,980 34,120 30,770 1,752 32,522
Inactive Vested Retirements 4,998 265 5,263 5,240 307 5,547
Inactive Vested Memberships 24,145 2,236 26,381 23,105 1,997 25,102
Active Plan Members 46,707 4,320 51,027 47,118 4,274 51,392
Total 107,990 8,801 116,791 106,233 8,330 114,563
Number of
Participating
Employers 353 350
County Employees Retirement System
2006 2005
Number of MembersNon-Hazardous
Position Employees
Hazardous Position
EmployeesTotal
Non-Hazardous Position
Employees
Hazardous Position
EmployeesTotal
Retirees and Benefi ciaries Receiving Benefi ts 33,102 4,712 37,814 31,347 4,361 35,708
Inactive Vested Retirements 7,379 393 7,772 7,771 482 8,253Inactive Vested Memberships 42,667 1,562 44,229 41,098 1,489 42,587
Active Plan Members 83,694 9,635 93,329 81,240 9,464 90,704
Total 166,842 16,302 183,144 161,456 15,796 177,252
Number of
Participating
Employers 1,391 1,400
Financial Section
34
KENTUCKY RETIREMENT SYSTEMS
NOTES TO FINANCIAL STATEMENTSFor the Fiscal Years Ended June 30, 2006 and 2005
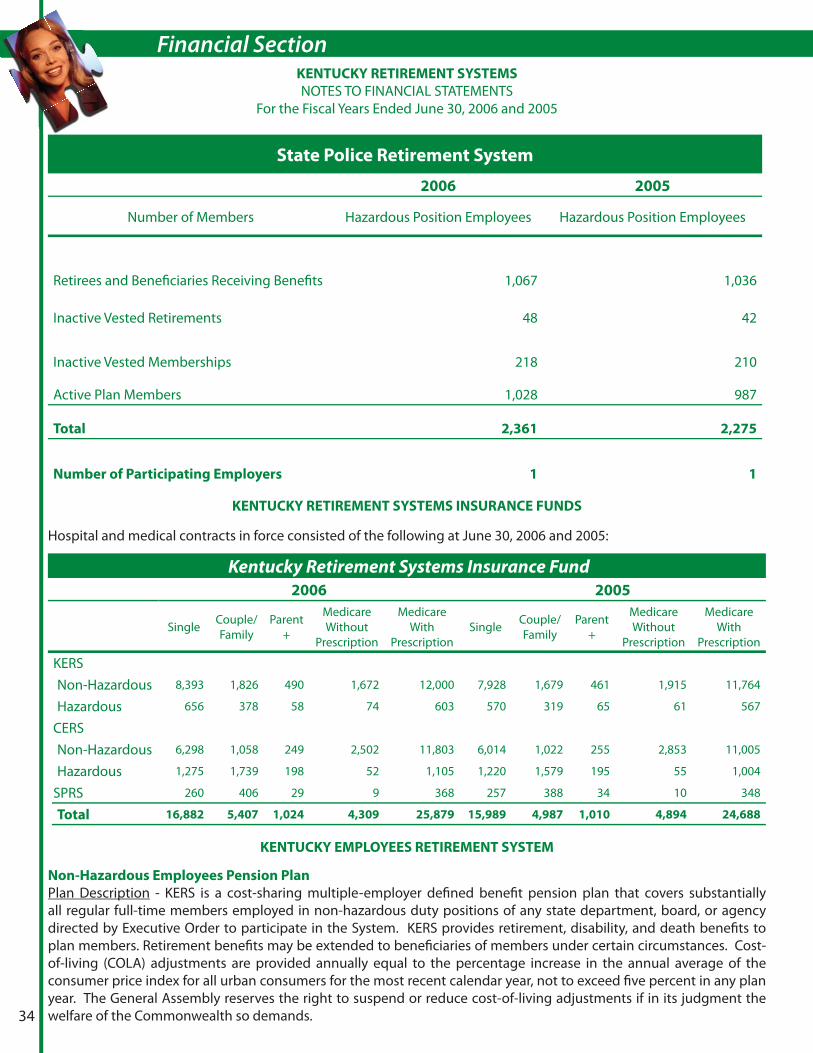
State Police Retirement System
2006 2005
Number of Members Hazardous Position Employees Hazardous Position Employees
Retirees and Benefi ciaries Receiving Benefi ts 1,067 1,036
Inactive Vested Retirements 48 42
Inactive Vested Memberships 218 210
Active Plan Members 1,028 987
Total 2,361 2,275
Number of Participating Employers 1 1
KENTUCKY RETIREMENT SYSTEMS INSURANCE FUNDS
Hospital and medical contracts in force consisted of the following at June 30, 2006 and 2005:
Kentucky Retirement Systems Insurance Fund
2006 2005
Single Couple/Family
Parent +
Medicare Without
Prescription
Medicare With
PrescriptionSingle Couple/
FamilyParent
+
Medicare Without
Prescription
Medicare With
Prescription
KERSNon-Hazardous 8,393 1,826 490 1,672 12,000 7,928 1,679 461 1,915 11,764
Hazardous 656 378 58 74 603 570 319 65 61 567
CERSNon-Hazardous 6,298 1,058 249 2,502 11,803 6,014 1,022 255 2,853 11,005
Hazardous 1,275 1,739 198 52 1,105 1,220 1,579 195 55 1,004
SPRS 260 406 29 9 368 257 388 34 10 348
Total 16,882 5,407 1,024 4,309 25,879 15,989 4,987 1,010 4,894 24,688
KENTUCKY EMPLOYEES RETIREMENT SYSTEM
Non-Hazardous Employees Pension Plan
Plan Description - KERS is a cost-sharing multiple-employer defi ned benefi t pension plan that covers substantially all regular full-time members employed in non-hazardous duty positions of any state department, board, or agency directed by Executive Order to participate in the System. KERS provides retirement, disability, and death benefi ts to plan members. Retirement benefi ts may be extended to benefi ciaries of members under certain circumstances. Cost-of-living (COLA) adjustments are provided annually equal to the percentage increase in the annual average of the consumer price index for all urban consumers for the most recent calendar year, not to exceed fi ve percent in any plan year. The General Assembly reserves the right to suspend or reduce cost-of-living adjustments if in its judgment the welfare of the Commonwealth so demands.
35
Financial SectionKENTUCKY RETIREMENT SYSTEMS
NOTES TO FINANCIAL STATEMENTSFor the Fiscal Years Ended June 30, 2006 and 2005
NOTE B--PLAN DESCRIPTIONS AND CONTRIBUTION INFORMATION--CONTINUED
Contributions - For the years ended June 30, 2006 and 2005, plan members were required to contribute 5% of their annual creditable compensation. The State was required to contribute at an actuarially determined rate. Per Kentucky Revised Statute Section 61.565(3), normal contribution and past service contribution rates shall be determined by the Board on the basis of an annual valuation last preceding the July 1 of a new biennium. The Board may amend contribution rates as of the fi rst day of July of the second year of a biennium, if it is determined on the basis of a subsequent actuarial valuation that amended contribution rates are necessary to satisfy requirements determined in accordance with actuarial bases adopted by the Board. However, formal commitment to provide the contributions by the employer is made through the biennial budget. For the years ended June 30, 2006 and 2005, participating employers contributed 5.89% of each employee’s creditable compensation. The actuarially determined rate set by the Board for the years ended June 30, 2006 and 2005 was 13.62% and 10.29%, respectively, of each employee’s creditable compensation. Administrative costs of Kentucky Retirement Systems are fi nanced through employer contributions and investment earnings.
Hazardous Employees Pension Plan
Plan Description - KERS is a cost-sharing multiple-employer defi ned benefi t pension plan that covers substantially all regular full-time members employed in hazardous duty positions of any state department, board, or agency directed by Executive Order to participate in the System. KERS provides retirement, disability, and death benefi ts to plan members. Retirement benefi ts may be extended to benefi ciaries of members under certain circumstances. Cost-of-living (COLA) adjustments are provided annually equal to the percentage increase in the annual average of the consumer price index for all urban consumers for the most recent calendar year, not to exceed fi ve percent in any plan year. The General Assembly reserves the right to suspend or reduce cost-of-living adjustments if in its judgment the welfare of the Commonwealth so demands.
Contributions - For the years ended June 30, 2006 and 2005, plan members were required to contribute 8% of their annual creditable compensation. The State was required to contribute at an actuarially determined rate. Per Kentucky Revised Statute Section 61.565(3), normal contribution and past service contribution rates shall be determined by the Board on the basis of an annual valuation last preceding the July 1 of a new biennium. The Board may amend contribution rates as of the fi rst day of July of the second year of a biennium, if it is determined on the basis of a subsequent actuarial valuation that amended contribution rates are necessary to satisfy requirements determined in accordance with actuarial bases adopted by the Board. However, formal commitment to provide the contributions by the employer is made through the biennial budget. For the years ended June 30, 2006 and 2005, participating employers contributed 18.84% of each employee’s creditable compensation. The actuarially determined rate set by the Board for the years ended June 30, 2006 and 2005 was 21.59% and 19.47%, respectively, of each employee’s creditable compensation. Administrative costs of Kentucky Retirement Systems are fi nanced through employer contributions and investment earnings.

Financial Section
36
KENTUCKY RETIREMENT SYSTEMS
NOTES TO FINANCIAL STATEMENTSFor the Fiscal Years Ended June 30, 2006 and 2005
NOTE B--PLAN DESCRIPTIONS AND CONTRIBUTION INFORMATION--CONTINUED
COUNTY EMPLOYEES RETIREMENT SYSTEM
Non-Hazardous Employees Pension Plan
Plan Description - CERS is a cost-sharing multiple-employer defi ned benefi t pension plan that covers substantially all regular full-time members employed in non-hazardous duty positions of each county and school board, and any additional eligible local agencies electing to participate in the System. CERS provides retirement, disability, and death benefi ts to plan members. Retirement benefi ts may be extended to benefi ciaries of members under certain circumstances. Cost-of-living (COLA) adjustments are provided at the discretion of the State legislature.
Contributions - For the years ended June 30, 2006 and 2005, plan members were required to contribute 5% of their annual creditable compensation. Participating employers were required to contribute at an actuarially determined rate. Per Kentucky Revised Statute Section 61.565(3), normal contribution and past service contribution rates shall be determined by the Board on the basis of an annual valuation last preceding the July 1 of a new biennium. The Board may amend contribution rates as of the fi rst day of July of the second year of a biennium, if it is determined on the basis of a subsequent actuarial valuation that amended contribution rates are necessary to satisfy requirements determined in accordance with actuarial bases adopted by the Board. For the years ended June 30, 2006 and 2005, participating employers contributed 10.98% and 8.48%, respectively, of each employee’s creditable compensation. The actuarially determined rate set by the Board for the years ended June 30, 2006 and 2005 was 10.98% and 8.48%, respectively. Administrative costs of Kentucky Retirement Systems are fi nanced through employer contributions and investment earnings.
Hazardous Employees Pension Plan
Plan Description - CERS is a cost-sharing multiple-employer defi ned benefi t pension plan that covers substantially all regular full-time members employed in hazardous duty positions of each county and school board, and any additional eligible local agencies electing to participate in the System. CERS provides retirement, disability, and death benefi ts to plan members. Retirement benefi ts may be extended to benefi ciaries of members under certain circumstances. Cost-of-living (COLA) adjustments are provided at the discretion of the State legislature.
Contributions - For the years ended June 30, 2006 and 2005, plan members were required to contribute 8% of their annual creditable compensation. The participating employers were required to contribute at an actuarially determined rate. Per Kentucky Revised Statute Section 61.565(3), normal contribution and past service contribution rates shall be determined by the Board on the basis of an annual valuation last preceding the July 1 of a new biennium. The Board may amend contribution rates as of the fi rst day of July of the second year of a biennium, if it is determined on the basis of a subsequent actuarial valuation that amended contribution rates are necessary to satisfy requirements determined in accordance with actuarial bases adopted by the Board. For the years ended June 30, 2006 and 2005, participating employers contributed 28.21% and 22.08%, respectively, of each employee’s creditable compensation. The actuarially determined rate set by the Board for the years ended June 30, 2006 and 2005 was 25.01% and 22.08%, respectively, of each employee’s creditable compensation. Administrative costs of KRS are fi nanced through employer contributions and investment earnings.

37
Financial SectionKENTUCKY RETIREMENT SYSTEMS
NOTES TO FINANCIAL STATEMENTSFor the Fiscal Years Ended June 30, 2006 and 2005
NOTE B--PLAN DESCRIPTIONS AND CONTRIBUTION INFORMATION--CONTINUED
STATE POLICE RETIREMENT SYSTEM
Plan Description - SPRS is a single-employer defi ned benefi t pension plan that covers all full-time state troopers employed in a hazardous duty position by the Kentucky State Police. SPRS provides retirement, disability, and death benefi ts to plan members. Retirement benefi ts may be extended to benefi ciaries of members under certain circumstances. Cost-of-living (COLA) adjustments are provided at the discretion of the State legislature.
Contributions - For the years ended June 30, 2006 and 2005 plan members were required to contribute 8% of their annual creditable compensation. The State was required to contribute at an actuarially determined rate. Per Kentucky Revised Statute Section 61.565(3), normal contribution and past service contribution rates shall be determined by the Board on the basis of an annual valuation last preceding the July 1 of a new biennium. The Board may amend contribution rates as of the fi rst day of July of the second year of a biennium, if it is determined on the basis of a subsequent actuarial valuation that amended contribution rates are necessary to satisfy requirements determined in accordance with actuarial bases adopted by the Board. However, formal commitment to provide the contributions by the employer is made through the biennial budget. For the years ended June 30, 2006 and 2005, the Commonwealth contributed 21.58% of each employee’s creditable compensation. The actuarially determined rate set by the Board for the years ended June 30, 2006 and 2005 was 34.83% and 28.08%, respectively, of each employee’s creditable compensation. Administrative costs of Kentucky Retirement System are fi nanced through employer contributions and investment earnings.
KENTUCKY RETIREMENT SYSTEMS INSURANCE FUNDS
Plan Description - The Kentucky Retirement Systems Insurance Fund (Fund) was established to provide hospital and medical insurance for members receiving benefi ts from the Kentucky Employees Retirement System, the County Employees Retirement System, and the State Police Retirement System. The Fund pays a prescribed contribution for whole or partial payment of required premiums to purchase hospital and medical insurance. For fi scal 2006, insurance premiums withheld from benefi t payments to members of KRS were $23,925,504 and $697,822 for KERS and KERS hazardous, respectively, $23,353,491 and $1,392,261 for CERS and CERS hazardous, respectively, and $203,189 for SPRS. For fi scal year ending 2005, insurance premiums withheld from benefi t payments to members of the KRS were $25,491,575 and $781,396 for KERS and KERS hazardous, respectively, $23,110,726 and $1,983,786 for CERS and CERS hazardous, respectively, and $494,223 for SPRS. The Fund pays the same proportion of hospital and medical insurance premiums for the spouse and dependents of retired hazardous members killed in the line of duty. As of June 30, 2006 the Fund had 73,001 retirees and benefi ciaries for whom benefi ts were available.
The amount of contribution paid by the Funds is based on years of service. For members participating prior to July 1, 2003, years of service and respective percentages of the maximum contribution are as follows:
Years of Service % Paid by Insurance Fund 20 or More 100% 15 – 19 75% 10 - 14 50% 4 - 9 25% Less Than 4 0%
Financial Section
38
KENTUCKY RETIREMENT SYSTEMS
NOTES TO FINANCIAL STATEMENTSFor the Fiscal Years Ended June 30, 2006 and 2005
NOTE B--PLAN DESCRIPTIONS AND CONTRIBUTION INFORMATION--CONTINUED
As a result of House Bill 290 (2004 General Assembly), medical insurance benefi ts are calculated diff erently for members who began participating on or after July 1, 2003. Once members reach a minimum vesting period of ten years, non-hazardous employees whose participation began on or after July 1, 2003 earn ten dollars ($10) per month for insurance benefi ts at retirement for every year of earned service without regard to a maximum dollar amount. Hazardous employees whose participation began on or after July 1, 2003 earn fi fteen dollars ($15) per month for insurance benefi ts at retirement for every year of earned service without regard to a maximum dollar amount. Upon death of a hazardous employee, the employee’s spouse receives ten dollars ($10) per month for insurance benefi ts for each year of the deceased employee’s earned hazardous service. This dollar amount is subject to adjustment annually based on the retiree cost of living adjustment (COLA), which is updated annually due to changes in the Consumer Price Index for all urban consumers. This benefi t is not protected under the inviolable contract provisions of Kentucky Revised Statute 16.652, 61.692 and 78.852. The General Assembly reserves the right to suspend or reduce this benefi t if, in its judgment, the welfare of the Commonwealth so demands.
In prior years, the employers’ required medical insurance contribution rate was being increased annually by a percentage that would result in advance-funding the medical liability on an actuarially determined basis using the entry age normal cost method within a 20-year period measured from 1987. In November 1992, the Board of Trustees adopted a fi xed percentage contribution rate and suspended future increases under the current medical premium funding policy until the next experience study could be performed. In May 1996, the Board of Trustees adopted a policy to increase the insurance contribution rate by the amount needed to achieve the target rate for full entry age normal funding within twenty years.
Kentucky Retirement Systems commenced self-funding of healthcare benefi ts for its Medicare Eligible Retirees on January 1, 2006. A self-funded plan is one in which Kentucky Retirement Systems assumes the fi nancial risk for providing healthcare benefi ts to its retirees. The self-funded plan pays for claims out-of-pocket as they are presented instead of paying a predetermined premium to an insurance carrier for a fully-insured plan. Kentucky Retirement Systems funds the risks directly from its assets. Kentucky Retirement Systems becomes directly responsible for administering benefi ts under the plan.
The Kentucky Retirement Systems’ plan is defi ned by statute. Kentucky Retirement Systems selected Walgreen’s Health Initiatives and Fiserv Health (Wausau Benefi ts, Inc.) to administer the pharmaceutical and medical benefi ts for its retirees.
Stop-loss Insurance can be arranged to limit the Kentucky Retirement Systems’ loss to a specifi ed amount to ensure that catastrophic claims do not upset the fi nancial integrity of the self-funded plan. The amount of stop-loss insurance is a function of Kentucky Retirement Systems’ size, nature of its business, fi nancials, and tolerance for risk. Kentucky Retirement Systems is in the process of evaluating the use of stop-loss insurance.

39
Financial SectionKENTUCKY RETIREMENT SYSTEMS
NOTES TO FINANCIAL STATEMENTSFor the Fiscal Years Ended June 30, 2006 and 2005
NOTE C--CASH AND SHORT-TERM INVESTMENTS AND SECURITIES LENDING COLLATERAL
The provisions of Governmental Accounting Standards Board Statement No. 28, “Accounting and Financial Reporting for Securities Lending Transactions” require that cash received as collateral on securities lending transactions and investments made with that cash be reported as assets on the fi nancial statements. In conjunction with the adoption of Governmental Accounting Standard No. 28, KRS has reclassifi ed certain other investments, not related to the securities lending program, as short-term. Cash and short-term investments consist of the following:
Kentucky Employees Retirement System
2006 2005
Cash $ 1,965,448 $ 726,023Short Term Investments 120,776,512 118,148,292Securities Lending Collateral Invested 1,254,181,656 1,225,388,483Total $ 1,376,923,616 $ 1,344,262,798
County Employees Retirement System
2006 2005
Cash $ 953,952 $ $665,927Short Term Investments 108,000,545 240,737,425Securities Lending Collateral Invested 2,093,410,581 1,337960,409Total $ 2,202,365,078 $ 1,579,363,761
State Police Retirement System
2006 2005
Cash $ 89,840 $ 106,821Short Term Investments 12,110,352 (5,830,993)Securities Lending Collateral Invested 108,100,996 72,168,911Total $ 120,301,188 $ 66,444,739
Kentucky Retirement Systems Insurance Fund
2006 2005
Cash $ 265,217 $ 207,089Short Term Investments 233,849,473 210,072,016Securities Lending Collateral Invested 501,343,495 431,551,814Total $ 735,458,185 $ 641,830,919

Financial Section
40
KENTUCKY RETIREMENT SYSTEMS
NOTES TO FINANCIAL STATEMENTSFor the Fiscal Years Ended June 30, 2006 and 2005
NOTE D--INVESTMENTS
The Board of Trustees of Kentucky Retirement Systems (KRS) and Insurance Funds recognize their duty to invest funds in accordance with the Prudent Person Rule and manage those funds consistent with the long-term nature of KRS. The Board enters into contracts with investment managers who use the following guidelines and restrictions in the selection and timing of transactions as long as the security is not prohibited by the Kentucky Revised Statutes.
Equity Investments - Investments may be made in domestic and international common stock, securities convertible into common stock and in preferred stock of publicly traded corporations.
Fixed Income Investments - Publicly traded corporate bonds are to be selected and managed to assure an appropriate balance in quality and maturities consistent with the current market and economic conditions. Investment may also be made in any debt instrument issued or guaranteed in whole or in part by the U.S. Government or any agency or instrumentality of the U.S. Government.
Mortgages - Investment may be made in real estate mortgages on a direct basis or in the form of mortgage pool instruments guaranteed by an agency of the U.S. Government or the Commonwealth of Kentucky.
Alternative Investments/Equity Real Estate - Subject to the specifi c approval of the investment committee of the Board of Trustees, investments may be made for the purpose of creating a diversifi ed portfolio of alternative investments. The Board may invest in real estate or alternative investments including, without limitation, venture capital, private equity and private placements which the investment committee believes has excellent potential to generate income and which may have a higher degree of risk.
Cash Equivalent Securities - The following short-term investment vehicles are considered acceptable:
Publicly traded investment grade corporate bonds, government and agency bonds, mortgages, and collective STIF’s, money market funds or instruments (including, but not limited to, certifi cates of deposit, bank notes, deposit notes, bankers’ acceptances and commercial paper) and repurchase agreements relating to the above instruments. Instruments may be selected from among those having a BBB or better rating by at least one recognized bond rating service. All instruments shall have a maturity at the time of purchase that does not exceed two years. Repurchase agreements shall be deemed to have a maturity equal to the period remaining until the date on which the repurchase of the underlying securities is scheduled to occur.
Derivatives - Investments may be made in derivative securities, or strategies which make use of derivative instruments, only if such investments do not cause the portfolio to be in any way leveraged beyond a 100% invested position. Investments in derivative securities which are subject to large or unanticipated changes in duration or cash fl ow, such as interest only (IO), principal only (PO), inverse fl oater, or structured note securities are expressly prohibited.
The Pension Fund and Insurance Fund invest in collateralized mortgage obligations (CMOs) and other asset-backed securities to increase return and adjust duration of the portfolio. The Pension and the Insurance Funds invest in exchange-traded funds to convert cash held in index funds to short-term equity investments. This practice is intended to make the performance of the index funds more closely track the performance of the index that the funds are intended to replicate.
41
Financial SectionKENTUCKY RETIREMENT SYSTEMS
NOTES TO FINANCIAL STATEMENTSFor the Fiscal Years Ended June 30, 2006 and 2005
NOTE D--INVESTMENTS--CONTINUED
Collateralized mortgage obligations, asset-backed securities, and exchange-traded funds pose no greater risk than other similar investment grade holdings in the Systems’ and the Fund’s portfolios. The fair value of CMOs at June 30, 2006 and 2005 was approximately $225 million and $82 million respectively; the fair value of asset-backed securities at June 30, 2006 and 2005 was approximately $195 million and $252 million respectively; and the fair value of exchange-traded funds at June 30, 2006 and 2005 was approximately $328 million and $318 million, respectively.
Custodial Credit Risk for Deposits - Custodial credit risk for deposits is the risk that in the event of a fi nancial institution failure, the System’s deposits may not be returned. All non-investment related bank balances are held locally by Farmers Bank & Capital Trust Company. All non-investment related bank balances are held in KRS’ name and each individual account is insured up to $100,000. These cash balances are invested daily by the local institution in overnight repurchase agreements which are required by Kentucky Administrative Regulation (200 KAR 14:081) to be collateralized at 102% of the principal amount.
At June 30, 2006 and 2005, deposits for KRS pension funds were $4,175,409 and $1,498,771, respectively. None of these balances were exposed to custodial credit risk as they were either insured or collateralized at required levels.
At June 30, 2006 and 2005, deposits for KRS insurance funds were $242,866 and $207,089, respectively. None of these balances were exposed to custodial credit risk as they were either insured or collateralized at required levels.
Custodial Credit Risk for Investments - Custodial credit risk for investments is the risk that in the event of the failure of the counterparty to a transaction, KRS will not be able to recover the value of investments or collateral securities that are in the possession of an outside third party. Qualifi ed Investment Managers, Custody Banks, Investment Consultants and other service providers are selected by the Investment Committee or Chief Investment Offi cer as required. The selection is based upon the demonstrated ability of the professional, or professionals, to provide the required expertise or assistance. At June 30, the following investments were uninsured and unregistered, with securities held by the counterparty or by its trust department or agent but not in the System’s name.
Pension Funds 2006 2005
Foreign Currency Investments $4,747,304 $ 3,059,869
Insurance Funds 2006 2005
Foreign Currency Investments $25,598 $124,692
Investment Policies - The Kentucky Revised Statute 61.650 grant the responsibility for the investment of plan assets to the Board of Trustees of the Kentucky Retirement Systems. The Board of Trustees has established an Investment Committee which is specifi cally charged with the oversight and investment of plan assets. The Investment Committee recognizes the duty to invest the funds in accordance with the Prudent Person Rule and manage those funds consistent with the long-term nature of the Systems. The Committee has adopted a Statement of Investment Policy that contains guidelines and restrictions for deposits and investments. By statute, all investments are to be registered and held in the name of the Kentucky Retirement Systems. The Statement of Investment Policy – Pension contains the specifi c guidelines for the investment of pension assets. The Statement of Investment Policy – Insurance contains the specifi c guidelines for the investment of insurance assets. Additionally, the Committee establishes specifi c investment guidelines in the Investment Management Agreement for each investment management fi rm.
Financial Section
42
KENTUCKY RETIREMENT SYSTEMS
NOTES TO FINANCIAL STATEMENTSFor the Fiscal Years Ended June 30, 2006 and 2005
Investment SummaryThe following tables present a summary of the investments by type as of June 30, 2006 and 2005.
Pension Funds
For the Fiscal Years Ended June 30, 2006 and 2005
Investment Summary 2006 2005
U.S. Gov’t & Agency Fixed Income Securities $ 3,251,063,919 $ 3,313,946,410
U.S. Corporate Fixed Income Securities 1,416,970,614 1,268,342,165
Municipal Debt Securities 12,901,977 14,883,806
Short Term Investments 240,887,409 353,054,725
Equity Securities 7,640,279,994 7,219,482,637
Private Equity Limited Partnerships 269,198,441 110,450,122
Real Estate 9,545,575 9,694,317
Total $ 12,840,847,929 $ 12,289,854,182
Insurance Funds
For the Fiscal Years Ended June 30, 2006 and 2005
Investment Summary 2006 2005
U.S. Gov’t & Agency Fixed Income Securities $ 220,781,808 $ 189,294,988
Short Term Investments 233,849,474 219,965,717
Equity Securities 1,705,352,668 1,485,569,035
Private Equity Limited Partnerships 29,910,939 12,272,237
Alternative Investment 135,000
Total $ 2,190,029,889 $ 1,907,101,978
Credit Risk of Debt Securities - Credit risk is the risk that an issuer or other counterparty to an investment will not fulfi ll its obligations. The debt security portfolios are managed by the Investment Division staff and by external professional investment management fi rms. All portfolio managers are required by the Statement of Investment Policy to maintain diversifi ed portfolios. Each portfolio is also required to be in compliance with risk management guidelines that are assigned to them based upon the portfolio’s specifi c mandate. In total, the pension fund debt securities portfolio is managed using the following guidelines adopted by the KRS Board of Trustees:
• Bonds, notes or other obligations issued or guaranteed by the U.S. government, its agencies or instrumentalities are permissible investments and may be held without restrictions.
• The average credit quality of the total portfolio must be A or better.• Debt obligations must have an investment grade rating at the time of purchase.• Debt obligations that have been downgraded to below investment grade may be held in the portfolio up to
a maximum of 1.5 percent of the total portfolio at market value.• Debt obligations in the lowest investment grade rating category may not exceed 15 percent of the total
portfolio at market value.
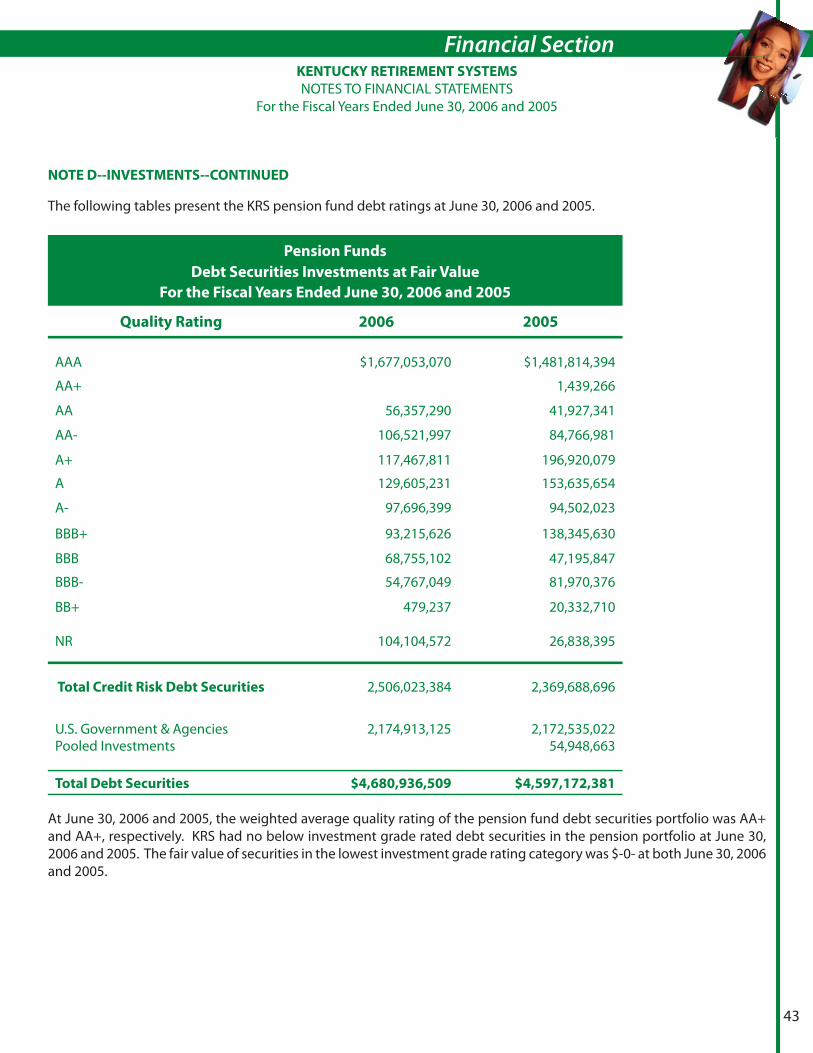
43
Financial SectionKENTUCKY RETIREMENT SYSTEMS
NOTES TO FINANCIAL STATEMENTSFor the Fiscal Years Ended June 30, 2006 and 2005
NOTE D--INVESTMENTS--CONTINUED
The following tables present the KRS pension fund debt ratings at June 30, 2006 and 2005.
Pension Funds
Debt Securities Investments at Fair Value
For the Fiscal Years Ended June 30, 2006 and 2005
Quality Rating 2006 2005
AAA $1,677,053,070 $1,481,814,394
AA+ 1,439,266
AA 56,357,290 41,927,341
AA- 106,521,997 84,766,981
A+ 117,467,811 196,920,079
A 129,605,231 153,635,654
A- 97,696,399 94,502,023
BBB+ 93,215,626 138,345,630
BBB 68,755,102 47,195,847
BBB- 54,767,049 81,970,376
BB+ 479,237 20,332,710
NR 104,104,572 26,838,395
Total Credit Risk Debt Securities 2,506,023,384 2,369,688,696
U.S. Government & Agencies 2,174,913,125 2,172,535,022Pooled Investments 54,948,663
Total Debt Securities $4,680,936,509 $4,597,172,381
At June 30, 2006 and 2005, the weighted average quality rating of the pension fund debt securities portfolio was AA+ and AA+, respectively. KRS had no below investment grade rated debt securities in the pension portfolio at June 30, 2006 and 2005. The fair value of securities in the lowest investment grade rating category was $-0- at both June 30, 2006 and 2005.
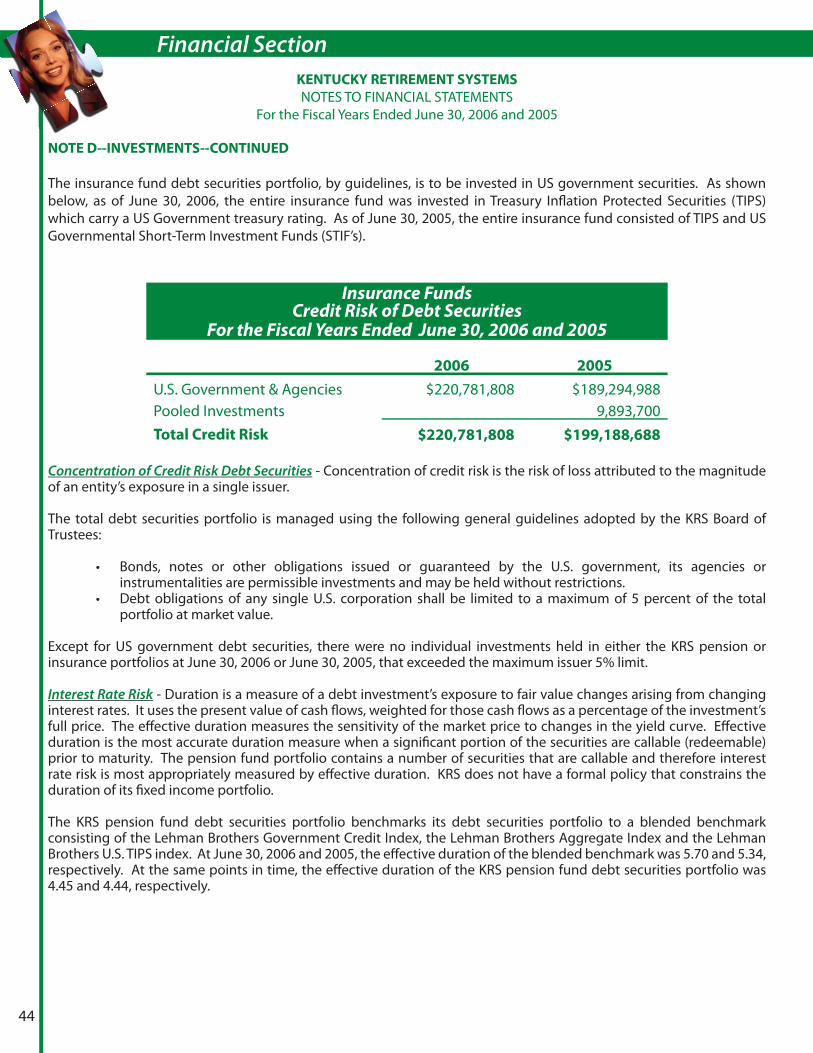
Financial Section
44
KENTUCKY RETIREMENT SYSTEMS
NOTES TO FINANCIAL STATEMENTSFor the Fiscal Years Ended June 30, 2006 and 2005
NOTE D--INVESTMENTS--CONTINUED
The insurance fund debt securities portfolio, by guidelines, is to be invested in US government securities. As shown below, as of June 30, 2006, the entire insurance fund was invested in Treasury Infl ation Protected Securities (TIPS) which carry a US Government treasury rating. As of June 30, 2005, the entire insurance fund consisted of TIPS and US Governmental Short-Term Investment Funds (STIF’s).
Insurance FundsCredit Risk of Debt Securities
For the Fiscal Years Ended June 30, 2006 and 2005
2006 2005
U.S. Government & Agencies $220,781,808 $189,294,988 Pooled Investments 9,893,700 Total Credit Risk $220,781,808 $199,188,688
Concentration of Credit Risk Debt Securities - Concentration of credit risk is the risk of loss attributed to the magnitude of an entity’s exposure in a single issuer.
The total debt securities portfolio is managed using the following general guidelines adopted by the KRS Board of Trustees:
• Bonds, notes or other obligations issued or guaranteed by the U.S. government, its agencies or instrumentalities are permissible investments and may be held without restrictions.
• Debt obligations of any single U.S. corporation shall be limited to a maximum of 5 percent of the total portfolio at market value.
Except for US government debt securities, there were no individual investments held in either the KRS pension or insurance portfolios at June 30, 2006 or June 30, 2005, that exceeded the maximum issuer 5% limit.
Interest Rate Risk - Duration is a measure of a debt investment’s exposure to fair value changes arising from changing interest rates. It uses the present value of cash fl ows, weighted for those cash fl ows as a percentage of the investment’s full price. The eff ective duration measures the sensitivity of the market price to changes in the yield curve. Eff ective duration is the most accurate duration measure when a signifi cant portion of the securities are callable (redeemable) prior to maturity. The pension fund portfolio contains a number of securities that are callable and therefore interest rate risk is most appropriately measured by eff ective duration. KRS does not have a formal policy that constrains the duration of its fi xed income portfolio.
The KRS pension fund debt securities portfolio benchmarks its debt securities portfolio to a blended benchmark consisting of the Lehman Brothers Government Credit Index, the Lehman Brothers Aggregate Index and the Lehman Brothers U.S. TIPS index. At June 30, 2006 and 2005, the eff ective duration of the blended benchmark was 5.70 and 5.34, respectively. At the same points in time, the eff ective duration of the KRS pension fund debt securities portfolio was 4.45 and 4.44, respectively.

45
Financial SectionKENTUCKY RETIREMENT SYSTEMS
NOTES TO FINANCIAL STATEMENTSFor the Fiscal Years Ended June 30, 2006 and 2005
NOTE D--INVESTMENTS--CONTINUED
KRS Pension Fund Interest Rate Risk
2006Weighted Average
Effective Duration2005
Weighted Average
Effective Duration
Asset Backed Securities $195,474,695 .80 $252,331,426 1.12Commercial Mortgage Backed Securities 270,294,818 3.50 109,238,989 3.33
Corporate Bonds 733,297,247 5.67 824,979,866 5.89
Government Agencies 457,938,065 3.58 479,638,805 3.30
Government Bonds 2,167,249,022 4.83 2,189,525,343 5.06Government Mortgage Backed Securities 625,876,832 4.59 589,833,599 2.91
Municipal Bonds 12,901,977 11.78 14,883,806 12.64
Non-Government Backed Collateralized Mortgage Obligations 217,903,854 2.00 81,791,885 1.19
Pooled Investments 54,948,663
Total $4,680,936,509 4.45 $4,597,172,381 4.44
The KRS insurance fund long-term debt securities portfolio consists entirely of US government issued bonds which are not callable (redeemable) prior to maturity. The modifi ed duration, similar to eff ective duration, measures the sensitivity of the market prices to changes in the yield curve but does not assume that securities will be called prior to maturity. Since the modifi ed duration measure most accurately refl ects the interest rate sensitivity of the insurance fund portfolio, this measure is used for comparative purposes. The KRS insurance fund debt securities portfolio benchmarks its debt securities portfolio to the Lehman Brothers U.S. TIPS Index. At June 30, 2006 and 2005, the modifi ed duration of the benchmark was 7.69 and 8.45 years, respectively. At the same points in time, the modifi ed duration of the KRS insurance fund debt securities portfolio, excluding the pooled fund, was 8.09 and 8.62 years, respectively.
Insurance Funds
Debt Securities Investments at Fair Value
For the Fiscal Years Ended June 30, 2006 and 2005
2006 2005
Investment Fair ValueWeighted
Duration Fair Value
Weighted
Duration
Index Linked Government Bonds $220,781,808 8.09 $189,294,988 8.62
Pooled Debt Securities 9,893,700 NA
Total $220,781,808 8.09 $199,188,688 8.62

Financial Section
46
KENTUCKY RETIREMENT SYSTEMS
NOTES TO FINANCIAL STATEMENTSFor the Fiscal Years Ended June 30, 2006 and 2005
NOTE D--INVESTMENTS--CONTINUED
Foreign Currency Risk - Foreign currency risk is the risk that changes in exchange rates will adversely aff ect the fair value of an investment or deposit. KRS doesnot have a formal policy to limit foreign currency risk. The following tables present KRS’ exposure at June 30, 2006 and 2005.
Pension Funds
Investments at Fair Value
As of June 30, 2006 and 2005
Foreign Equities 2006 2005
Australian Dollar $ 69,810,185 $ 52,122,988
British Pound Sterling 326,927,792 300,642,320
Danish Krone 5,555,604 6,807,087
Euro 534,096,705 492,597,015
Hong Kong Dollar 19,200,448 23,082,401
Japanese Yen 420,352,056 346,791,634
New Zealand Dollar 3,535,112
Norwegian Krone 13,999,004 8,805,025
Singapore Dollar 29,048,766 21,641,967
South African Rand 2,950,033
South Korean Won 3,366,341
Swedish Krona 46,216,722 49,787,194
Swiss Franc 121,430,006 109,308,104
International Equity Mutual Fund (various currencies) 508,273,254 484,952,191
Total Securities Subject To:
Foreign Currency Risk 2,097,860,575 1,903,439,380 USD (securities held by International Investment Managers) 45,147,664 78,764,548
Total International Investment Securities $ 2,143,008,239 $ 1,982,203,928

47
Financial Section
KENTUCKY RETIREMENT SYSTEMS
NOTES TO FINANCIAL STATEMENTSFor the Fiscal Years Ended June 30, 2006 and 2005
NOTE D--INVESTMENTS--CONTINUED
Insurance Funds
Investments at Fair Value
As of June 30, 2006 and 2005
Foreign Equities 2006 2005
Australian Dollar $ 25,007,521 $ 21,058,561
British Pound Sterling 96,076,217 81,925,423
Danish Krone 2,834,941 3,540,224
Euro 135,800,378 125,362,499
Hong Kong Dollar 6,257,704 6,984,939
Japanese Yen 111,488,690 85,596,433
New Zealand Dollar 905,291
Norwegian Krone 7,061,386 4,558,628
Singapore Dollar 5,388,276 3,851,828
Swedish Krona 21,656,351 22,215,317 Swiss Franc 35,962,006 32,258,586
Total Securities Subject To:
Foreign Currency Risk 447,533,470 388,257,729
USD (securities held by International Investment Managers) 3,676,958 3,610,171
Total International Investment Securities $ 451,210,428 $ 391,867,900
Financial Section
48
KENTUCKY RETIREMENT SYSTEMS
NOTES TO FINANCIAL STATEMENTSFor the Fiscal Years Ended June 30, 2006 and 2005
NOTE E--SECURITIES LENDING TRANSACTIONS
Kentucky Revised Statues Sections 61.650 and 386.020(2) permit the Pension and Insurance Funds to lend their securities to broker-dealers and other entities. The borrowers of the securities agree to transfer to the Funds’ custodial banks either cash collateral or other securities with a fair value of 102 percent of the value of the borrowed securities. The borrowers of the securities simultaneously agree to return the borrowed securities in exchange for the collateral at a later date. Securities lent for cash collateral are presented as unclassifi ed above in the schedule of custodial credit risk; securities lent for securities collateral are classifi ed according to the category for the securities loaned. At June 30, 2006, the Funds have no credit risk exposure to borrowers because the amounts the Funds owe to borrowers exceed the amounts the borrowers owe the Funds. The contracts with the custodial banks require them to indemnify the Funds if the borrowers fail to return the securities and one or both of the custodial banks have failed to live up to their contractual responsibilities relating to the lending of securities.
All securities loans can be terminated on demand by either party to the transaction, although the average term of the loans was 6 days, 10 days, and 24 days for the three investment portfolios subject to security lending agreements. One custodial bank invests cash collateral in securities that are permitted for investment by state statute and board policy, which at year-end has a weighted-average maturity of 3 days for the Funds. The other custodial bank invests cash collateral in the agent’s short-term investment pool as permitted by state statute and Board policy, which at year-end has a weighted-average maturity of 24 days for the Pension Fund only. Neither of the Funds can pledge or sell collateral securities received unless the borrower defaults.
NOTE F--RISKS OF LOSS
KRS is exposed to various risks of loss related to torts; thefts of, damage to, and destruction of assets; errors and omissions; injuries to employees; and natural disasters. Under the provisions of the Kentucky Revised Statutes, the Kentucky Board of Claims is vested with full power and authority to investigate, hear proof, and to compensate persons for damages sustained to either person or property as a result of negligence of the agency or any of its employees. Awards are limited to $200,000 for a single claim and $350,000 in aggregate per occurrence. Awards and a pro rata share of the operating cost of the Board of Claims are paid from the fund of the agency having a claim or claims before the Board.
Claims against the Board of Trustees of Kentucky Retirement Systems or any of its staff as a result of actual or alleged breach of fi duciary duty are insured with a commercial insurance policy. Coverage provided is limited to $5,000,000 with a deductible amount of $100,000. Defense costs incurred in defending such claims will be paid by the insurance company. However, the total defense cost and claims paid shall not exceed the total aggregate coverage of the policy.
Claims for job-related illnesses or injuries to employees are insured by the state’s self-insured workers’ compensation program. Payments approved by the program are not subject to maximum limitations. A claimant may receive reimbursement for all medical expenses related to the illness or injury and up to sixty-six and two-thirds percent (66 2/3%) of wages for temporary disability. Each agency pays premiums based on fund reserves and payroll.
Only claims pertaining to workers’ compensation have been fi led during the past three fi scal years. Settlements did not exceed insurance coverage in any of the past three fi scal years. There were no claims which were appealed to the Kentucky Workers’ Compensation Board.

49
Financial SectionKENTUCKY RETIREMENT SYSTEMS
NOTES TO FINANCIAL STATEMENTSFor the Fiscal Years Ended June 30, 2006 and 2005
NOTE G--CONTINGENCIES
In the normal course of business, KRS is involved in various litigation concerning the right of participants or their benefi ciaries to receive benefi ts. KRS does not anticipate any material losses as a result of the contingent liabilities.
NOTE H--INCOME TAX STATUS
The Internal Revenue Service has ruled that KRS qualifi es under Section 401(a) of the Internal Revenue Code and is, therefore, not subject to tax under income tax law.
NOTE I--ANTHEM DEMUTUALIZATION
In 2002, Anthem Insurance Companies, Inc., an Indiana corporation, underwent a demutualization, as authorized by the Indiana statutes. The demutualization provided, among other things, that “eligible statutory members,” as defi ned by Indiana statutory provision, would receive cash or stock in consideration for giving up their membership interest in Anthem. In some instances application of the statute led to the determination by Anthem that individual members of the retirement plans administered by Kentucky Retirement Systems were the “statutory members” and in other instances the Kentucky Retirement Systems was identifi ed by Anthem as the eligible statutory member to receive cash or stock under the Anthem demutualization plan. According to Anthem, this determination was based upon which of Anthem’s subsidiaries was the original provider. The determination was confi rmed by the Indiana Department of Insurance.
The approximate $62 million distribution which Kentucky Retirement Systems received on January 4, 2002 under the Anthem demutualization was deposited in the Kentucky Employees Retirement Systems Insurance Fund. The retirement systems included within the Kentucky Retirement Systems for purposes of the Anthem demutualization are the Kentucky Employees Retirement System, (hazardous and non-hazardous), the County Employees Retirement System (hazardous and non-hazardous), the State Police Retirement System, the Legislators’ Retirement Plan, and the Judicial Retirement Plan.
Kentucky Retirement Systems was a defendant in a case entitled Jean C. Love, David E. Wiseman, and Belvia Campbell v. Board of Trustees of the Kentucky Retirement Systems, which was in Franklin Circuit Court. At issue was how to distribute the proceeds resulting from Anthem’s demutualization. The plaintiff s sought to recover the full amount of the proceeds or, alternatively, the pro rata amount of proceeds attributable to insurance premiums that the employees and/or their benefi ciaries paid directly.
On June 30, 2006, the parties in the case entered into a Settlement Agreement that was approved on a preliminary basis by the Circuit Court. The Agreement received fi nal approval from the Circuit Court on September 28, 2006. In accordance with the Agreement, $20 million was transferred to the “Northern Trust Institutional Funds Prime Obligations Portfolio” operated by the Northern Trust Company of Chicago, Illinois (which is the investment custodian for Kentucky Retirement Systems), with such account (“Settlement Fund Savings Account”) to be held and controlled exclusively by Kentucky Retirement Systems. This account was created on July 11, 2006.
Financial Section
50
KENTUCKY RETIREMENT SYSTEMS
NOTES TO FINANCIAL STATEMENTSFor the Fiscal Years Ended June 30, 2006 and 2005
On, or about, the eff ective date of the Settlement Agreement (October 29, 2006), Kentucky Retirement Systems will cause all funds contained in the Settlement Fund Savings Account, including any interest earned, to be paid to the Plaintiff s’ Counsel in trust for the full, complete and fi nal satisfaction of all claims released pursuant to the Settlement Agreement. The Settlement Fund Savings Account shall be distributed by the Plaintiff s’ Counsel as ordered by the Court.
One percent of the remaining balance of approximately $42 million, plus earnings thereon, will, at a still to be determined date, be distributed to the Legislators Retirement Plan and the Judicial Retirement Plan. The remainder of the balance will be allocated among the following plans, in the percentages indicated, in the Insurance Fund of Kentucky Retirement Systems: Kentucky Employees Retirement System -Non Hazardous-51.24%; Kentucky Employees Retirement System - Hazardous - 1.4%; County Employees Retirement System - Non Hazardous - 44.51%; County Employees Retirement System - Hazardous - 1.89%; and, State Police Retirement System - .96%. The above percentages were calculated by The Segal Company, the former actuaries of Kentucky Retirement Systems.
NOTE J--DEFINED BENEFIT PENSION PLAN
All eligible employees of Kentucky Retirement Systems (KRS) participate in the Kentucky Employees Retirement System (non-hazardous), a cost-sharing, multiple-employer defi ned pension plan that covers substantially all regular full-time employees in non-hazardous positions of any Kentucky State Department, Board or Agency directed by Executive Order to participate in the system. The Plan provides for retirement, disability and death benefi ts to plan members. Plan benefi ts are extended to benefi ciaries of plan members under certain circumstances. Plan members contributed 5.0% of creditable compensation for the periods ending June 30, 2006, June 30, 2005, and June 30, 2004. KRS contributed 5.89% of covered payroll for the periods ending June 30, 2006, June 30, 2005, and June 30, 2004. The chart below includes the covered payroll and contribution amounts for KRS for the three periods included in this discussion.
2006 2005 2004 Covered Payroll $10,960,000 $9,891,000 $9,035,000Employer Contributions $ 641,200 $ 572,400 $532,000
NOTE K--EQUIPMENT
Equipment consists of the following:
As of June 30, 2006 As of June 30, 2005
Equipment at Cost $ 4,039,537 $ 3,408,106Less Accumulated Depreciation (2,763,017) (2,576,490)Total $ 1,276,520 $ 831,615
Depreciation expense for the fi scal years ended June 30, 2006 and 2005 amounted to $387,292 and $318,840, respectively.
51
Financial SectionKENTUCKY RETIREMENT SYSTEMS
NOTES TO FINANCIAL STATEMENTSFor the Fiscal Years Ended June 30, 2006 and 2005
NOTE L--Alternative Investment
On February 6, 2006, the Health Insurance Fund of Kentucky Retirement Systems loaned to Perimeter Park West, Inc., a related party, $700,000 for the purchase of real property at 1300 Louisville Road, Frankfort, KY. The loan is not documented by a note, mortgage contract, or security interest in the property. Subsequent to the lending and purchase, the real property was valued by appraisal from $135,000 to $290,000. The range of appraisal values is based upon considerations of zoning classifi cations, site preparations and improvements, and other matters. Kentucky Retirement Systems is refl ecting the Alternative Investment at the lowest appraisal value for the property. Because of the signifi cant diff erence in the appraised value of the property and the loan amount, and also because the loan is not documented by a note, mortgage contract, or security interest in the property, the Kentucky Retirement Systems is uncertain whether it will be able to collect any principal (or interest) in excess of the minimum appraised property value. Therefore, KRS’ management has elected to write-down the value of the Alternative Investment to an estimated collectible value of $135,000. The diff erence of $565,000 is included in the Combined Statements of Changes in Plan Net Assets-Insurance Funds as an unrealized loss in “Net Appreciation in Fair Value of Investments”. By a letter dated September 26, 2006, Kentucky Retirement Systems fi led a notice of claim with its fi duciary insurance carrier (The Federal Insurance Company) asserting monetary damages in excess of $600,000 to the Health Insurance Fund as a result of the loan.
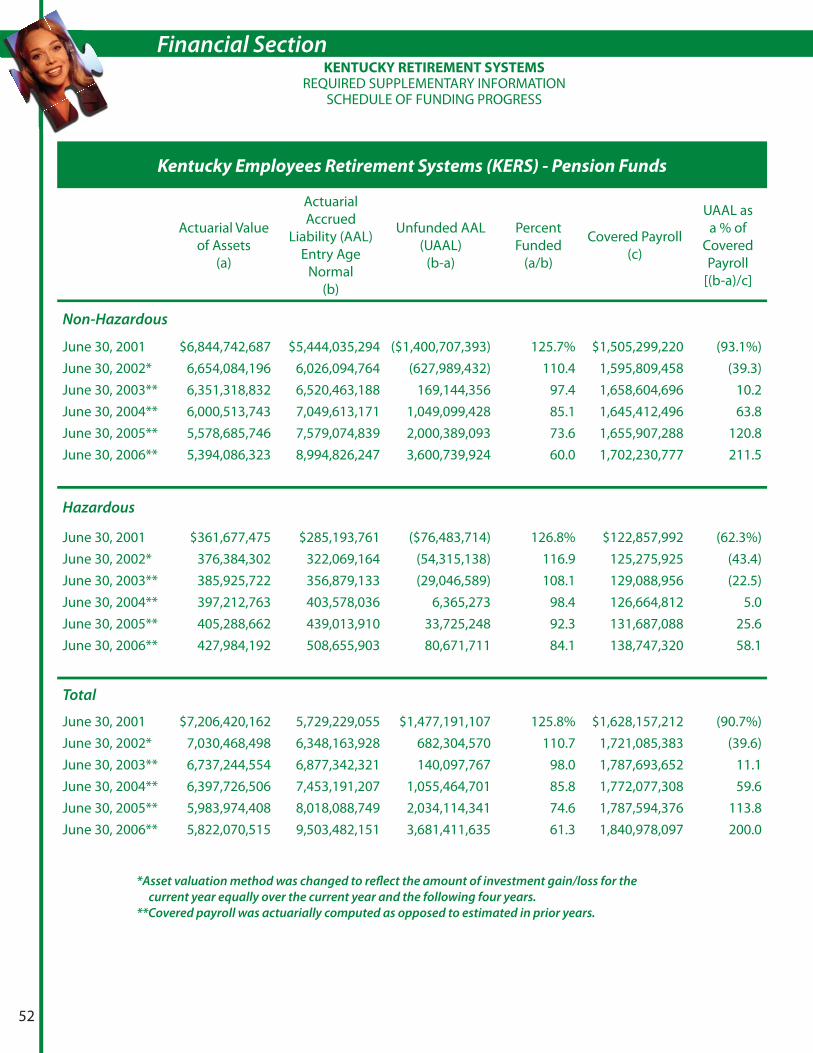
Financial Section
52
KENTUCKY RETIREMENT SYSTEMSREQUIRED SUPPLEMENTARY INFORMATION
SCHEDULE OF FUNDING PROGRESS
Kentucky Employees Retirement Systems (KERS) - Pension Funds
Actuarial Value of Assets
(a)
Actuarial Accrued
Liability (AAL) Entry Age
Normal (b)
Unfunded AAL (UAAL)
(b-a)
Percent Funded
(a/b)
Covered Payroll (c)
UAAL as a % of
Covered Payroll
[(b-a)/c]
Non-Hazardous
June 30, 2001 $6,844,742,687 $5,444,035,294 ($1,400,707,393) 125.7% $1,505,299,220 (93.1%)June 30, 2002* 6,654,084,196 6,026,094,764 (627,989,432) 110.4 1,595,809,458 (39.3)June 30, 2003** 6,351,318,832 6,520,463,188 169,144,356 97.4 1,658,604,696 10.2June 30, 2004** 6,000,513,743 7,049,613,171 1,049,099,428 85.1 1,645,412,496 63.8June 30, 2005** 5,578,685,746 7,579,074,839 2,000,389,093 73.6 1,655,907,288 120.8June 30, 2006** 5,394,086,323 8,994,826,247 3,600,739,924 60.0 1,702,230,777 211.5
Hazardous
June 30, 2001 $361,677,475 $285,193,761 ($76,483,714) 126.8% $122,857,992 (62.3%)June 30, 2002* 376,384,302 322,069,164 (54,315,138) 116.9 125,275,925 (43.4)June 30, 2003** 385,925,722 356,879,133 (29,046,589) 108.1 129,088,956 (22.5)June 30, 2004** 397,212,763 403,578,036 6,365,273 98.4 126,664,812 5.0June 30, 2005** 405,288,662 439,013,910 33,725,248 92.3 131,687,088 25.6June 30, 2006** 427,984,192 508,655,903 80,671,711 84.1 138,747,320 58.1
Total
June 30, 2001 $7,206,420,162 5,729,229,055 $1,477,191,107 125.8% $1,628,157,212 (90.7%)June 30, 2002* 7,030,468,498 6,348,163,928 682,304,570 110.7 1,721,085,383 (39.6)June 30, 2003** 6,737,244,554 6,877,342,321 140,097,767 98.0 1,787,693,652 11.1June 30, 2004** 6,397,726,506 7,453,191,207 1,055,464,701 85.8 1,772,077,308 59.6June 30, 2005** 5,983,974,408 8,018,088,749 2,034,114,341 74.6 1,787,594,376 113.8June 30, 2006** 5,822,070,515 9,503,482,151 3,681,411,635 61.3 1,840,978,097 200.0
*Asset valuation method was changed to refl ect the amount of investment gain/loss for the current year equally over the current year and the following four years.**Covered payroll was actuarially computed as opposed to estimated in prior years.
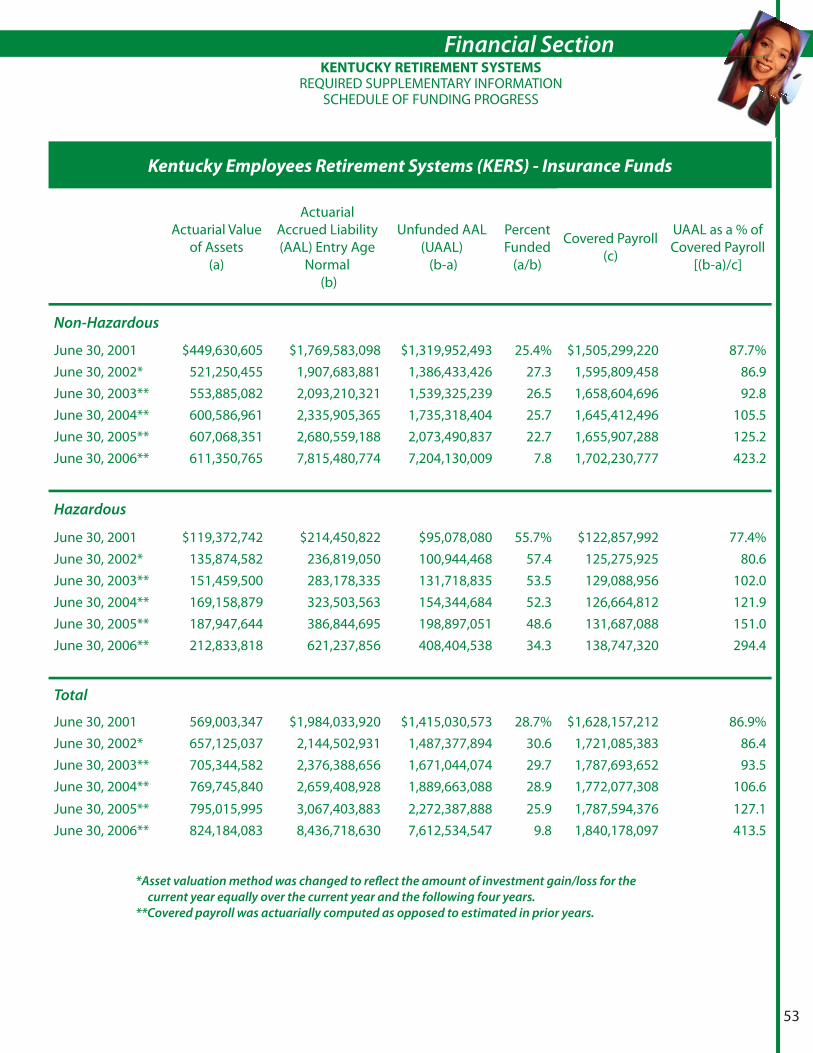
53
Financial Section
*Asset valuation method was changed to refl ect the amount of investment gain/loss for the current year equally over the current year and the following four years.**Covered payroll was actuarially computed as opposed to estimated in prior years.
KENTUCKY RETIREMENT SYSTEMSREQUIRED SUPPLEMENTARY INFORMATION
SCHEDULE OF FUNDING PROGRESS
Kentucky Employees Retirement Systems (KERS) - Insurance Funds
Actuarial Value of Assets
(a)
Actuarial Accrued Liability (AAL) Entry Age
Normal (b)
Unfunded AAL (UAAL) (b-a)
Percent Funded
(a/b)
Covered Payroll (c)
UAAL as a % of Covered Payroll
[(b-a)/c]
Non-Hazardous
June 30, 2001 $449,630,605 $1,769,583,098 $1,319,952,493 25.4% $1,505,299,220 87.7%June 30, 2002* 521,250,455 1,907,683,881 1,386,433,426 27.3 1,595,809,458 86.9June 30, 2003** 553,885,082 2,093,210,321 1,539,325,239 26.5 1,658,604,696 92.8June 30, 2004** 600,586,961 2,335,905,365 1,735,318,404 25.7 1,645,412,496 105.5June 30, 2005** 607,068,351 2,680,559,188 2,073,490,837 22.7 1,655,907,288 125.2June 30, 2006** 611,350,765 7,815,480,774 7,204,130,009 7.8 1,702,230,777 423.2
Hazardous
June 30, 2001 $119,372,742 $214,450,822 $95,078,080 55.7% $122,857,992 77.4%June 30, 2002* 135,874,582 236,819,050 100,944,468 57.4 125,275,925 80.6June 30, 2003** 151,459,500 283,178,335 131,718,835 53.5 129,088,956 102.0June 30, 2004** 169,158,879 323,503,563 154,344,684 52.3 126,664,812 121.9June 30, 2005** 187,947,644 386,844,695 198,897,051 48.6 131,687,088 151.0June 30, 2006** 212,833,818 621,237,856 408,404,538 34.3 138,747,320 294.4
Total
June 30, 2001 569,003,347 $1,984,033,920 $1,415,030,573 28.7% $1,628,157,212 86.9%June 30, 2002* 657,125,037 2,144,502,931 1,487,377,894 30.6 1,721,085,383 86.4June 30, 2003** 705,344,582 2,376,388,656 1,671,044,074 29.7 1,787,693,652 93.5June 30, 2004** 769,745,840 2,659,408,928 1,889,663,088 28.9 1,772,077,308 106.6
June 30, 2005** 795,015,995 3,067,403,883 2,272,387,888 25.9 1,787,594,376 127.1June 30, 2006** 824,184,083 8,436,718,630 7,612,534,547 9.8 1,840,178,097 413.5

Financial Section
54
*Asset valuation method was changed to refl ect the amount of investment gain/loss for the current year equally over the current year and the following four years.**Covered payroll was actuarially computed as opposed to estimated in prior years.
KENTUCKY RETIREMENT SYSTEMSREQUIRED SUPPLEMENTARY INFORMATION
SCHEDULE OF FUNDING PROGRESS
County Employees Retirement Systems (CERS) - Pension Funds
Actuarial Value of Assets
(a)
Actuarial Accrued
Liability (AAL) Entry Age
Normal (b)
Unfunded AAL (UAAL)
(b-a)
Percent Funded
(a/b)
Covered Payroll (c)
UAAL as a % of Covered
Payroll [(b-a)/c]
Non-Hazardous
June 30, 2001 $5,423,834,549 $3,706,282,212 ($1,717,552,337) 146.3% $1,544,973,296 (111.2%)
June 30, 2002* 5,397,787,158 4,165,355,149 (1,232,432,009) 129.6 1,663,183,629 (74.1)
June 30, 2003** 5,286,580,047 4,417,597,802 (868,982,245) 119.7 1,796,451,180 (48.4)
June 30, 2004** 5,187,851,530 4,936,459,488 (251,392,042) 105.1 1,826,870,880 (13.8)
June 30, 2005** 5,059,208,687 5,385,306,505 326,097,818 93.9 1,885,275,000 17.3
June 30, 2006** 5,162,894,136 6,179,569,267 1,016,675,131 83.5 1,982,437,473 51.3
Hazardous
June 30, 2001 $1,486,666,016 $1,193,860,442 ($292,805,574) 124.5% $316,700,304 (92.5%)
June 30, 2002* 1,485,511,793 1,327,291,273 (158,220,520) 111.9 345,849,277 (45.7)
June 30, 2003** 1,467,004,856 1,499,628,782 32,623,926 97.8 374,700,732 8.7
June 30, 2004** 1,457,612,042 1,640,830,120 183,218,078 88.8 392,562,624 46.7
June 30, 2005** 1,452,353,023 1,795,617,335 343,264,312 80.9 411,121,728 83.5
June 30, 2006** 1,515,075,017 2,020,142,770 505,067,753 75.0 426,927,550 118.3
Total
June 30, 2001 $6,910,500,565 $4,900,142,654 ($2,010,357,911) 141.0% $1,861,673,600 (108.0%)
June 30, 2002* 6,883,298,951 5,492,646,422 (1,390,652,529) 125.3 2,009,032,906 (69.2)
June 30, 2003** 6,753,584,903 5,917,226,584 (836,358,319) 114.1 2,171,151,912 (38.5)
June 30, 2004** 6,645,463,572 6,577,289,608 (68,173,964) 101.0 2,219,433,504 (3.1)
June 30, 2005** 6,511,561,710 7,180,923,840 669,362,130 90.7 2,296,396,728 29.2
June 30, 2006** 6,677,969,153 8,199,712,037 1,521,742,884 81.4 2,409,365,023 63.2

55
Financial Section
*Asset valuation method was changed to refl ect the amount of investment gain/loss for the current year equally over the current year and the following four years.**Covered payroll was actuarially computed as opposed to estimated in prior years.
KENTUCKY RETIREMENT SYSTEMSREQUIRED SUPPLEMENTARY INFORMATION
SCHEDULE OF FUNDING PROGRESS
County Employees Retirement Systems (CERS) - Insurance Funds
Actuarial Value of Assets
(a)
Actuarial Accrued Liability (AAL) Entry Age
Normal (b)
Unfunded AAL (UAAL)
(b-a)
Percent Funded
(a/b)
Covered Payroll (c)
UAAL as a % of Covered
Payroll [(b-a)/c]
Non-Hazardous
June 30, 2001 $371,758,628 $1,793,710,768 $1,421,952,140 20.7% $1,544.973,296 92.0%June 30, 2002* 450,497,307 1,977,577,038 1,527,079,731 22.8 1,663,183,629 91.8June 30, 2003** 520,060,105 2,176,963,259 1,656,903,154 23.9 1,796,451,180 92.2June 30, 2004** 585,399,072 2,438,734,696 1,853,335,624 24.0 1,826,870,880 101.5June 30, 2005** 663,941,949 2,788,754,654 2,124,812,705 23.8 1,885,275,000 112.7June 30, 2006** 777,726,590 4,607,223,639 3,829,497,049 16.9 1,982,437,473 193.2
Hazardous
June 30, 2001 $197,875,249 $721,605,292 $523,730,043 27.4% $316,700,304 165.4%June 30, 2002* 234,683,878 781,184,974 546,501,096 30.1 345,849,279 158.0June 30, 2003** 269,190,080 935,650,662 666,460,582 28.8 374,700,732 177.9June 30, 2004** 310,578,162 1,025,684,477 715,106,315 30.3 392,562,624 182.2June 30, 2005** 359,180,461 1,283,299,092 924,118,631 28.0 411,121,728 224.8June 30, 2006** 422,785,042 1,928,481,371 1,505,696,329 21.9 426,927,550 352.7
Total
June 30, 2001 $569,633,877 $2,515,316,060 $1,945,682,183 22.6% $1,861,673,600 104.5%June 30, 2002* 685,181,185 2,758,762,012 2,073,580,827 24.8 2,009,032,908, 103.2June 30, 2003** 789,250,185 3,112,613,921 2,323,363,736 25.4 2,171,151,912 107.0June 30, 2004** 895,977,234 3,464,419,173 2,568,441,939 25.9 2,219,433,504 115.7June 30, 2005** 1,023,122,410 4,072,053,746 3,048,931,336 25.1 2,296,396,728 132.8June 30, 2006** 1,200,511,632 6,535,705,010 5,335,193,378 18.4 2,409,365,023 221.4

Financial Section
56
KENTUCKY RETIREMENT SYSTEMSREQUIRED SUPPLEMENTARY INFORMATION
SCHEDULE OF FUNDING PROGRESS
State Police Retirement Systems (SPRS) - Pension Funds
Actuarial Value of Assets
(a)
Actuarial Accrued Liability (AAL) Entry Age
Normal (b)
Unfunded AAL (UAAL)
(b-a)
Percent Funded
(a/b)
Covered Payroll
(c)
UAAL as a % of Covered Payroll
[(b-a)/c]
June 30, 2001 $456,160,709 $356,211,860 ($99,948,849) 128.1% $44,646,678 (223.7%)
June 30, 2002* 438,955,465 380,790,346 (58,165,119) 115.3 44,314,696 (131.2)
June 30, 2003** 413,063,576 414,881,459 1,817,883 99.6 43,760,832 4.2
June 30, 2004** 385,077,195 437,482,425 52,405,230 88.0 43,835,208 119.6
June 30, 2005** 353,511,622 458,593,576 105,081,954 77.1 43,720,092 240.4
June 30, 2006** 344,016,197 516,482,298 172,466,101 66.6 47,743,865 361.2
*Asset valuation method was changed to refl ect the amount of investment gain/loss for the current year equally over the current year and the following four years.**Covered payroll was actuarially computed as opposed to estimated in prior years.
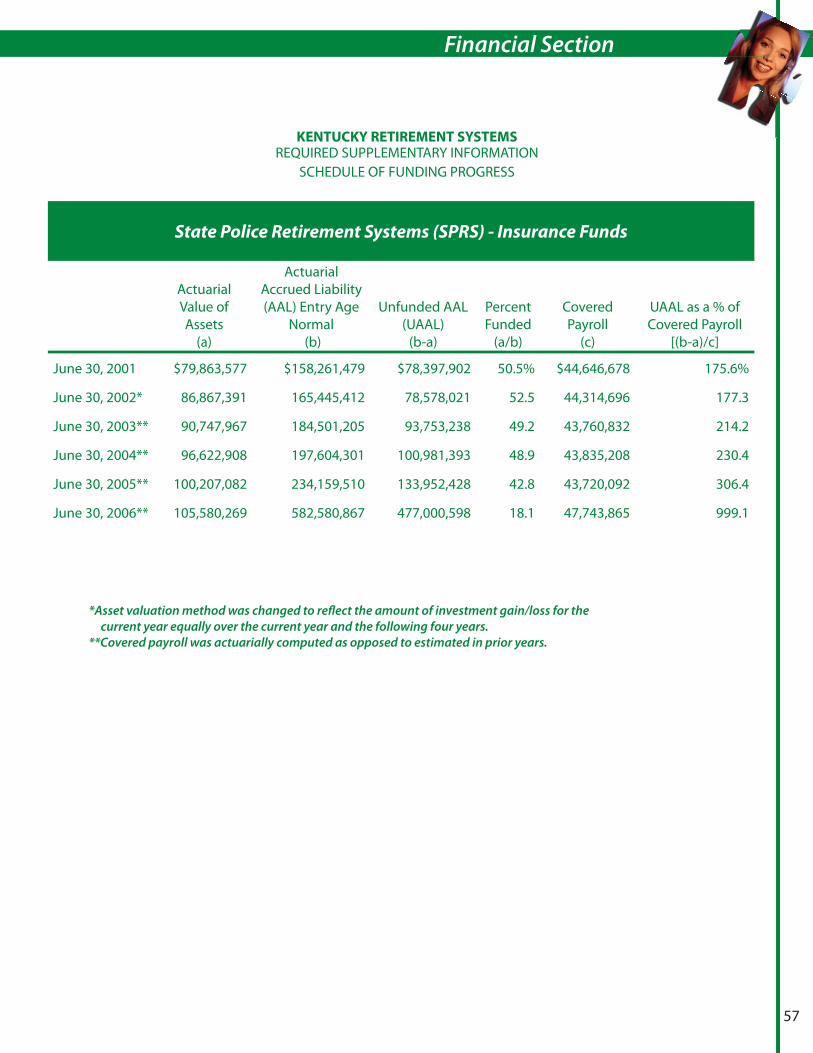
57
Financial Section
*Asset valuation method was changed to refl ect the amount of investment gain/loss for the current year equally over the current year and the following four years.**Covered payroll was actuarially computed as opposed to estimated in prior years.
KENTUCKY RETIREMENT SYSTEMSREQUIRED SUPPLEMENTARY INFORMATION
SCHEDULE OF FUNDING PROGRESS
State Police Retirement Systems (SPRS) - Insurance Funds
Actuarial Value of Assets
(a)
Actuarial Accrued Liability (AAL) Entry Age
Normal (b)
Unfunded AAL (UAAL)
(b-a)
Percent Funded
(a/b)
Covered Payroll
(c)
UAAL as a % of Covered Payroll
[(b-a)/c]
June 30, 2001 $79,863,577 $158,261,479 $78,397,902 50.5% $44,646,678 175.6%
June 30, 2002* 86,867,391 165,445,412 78,578,021 52.5 44,314,696 177.3
June 30, 2003** 90,747,967 184,501,205 93,753,238 49.2 43,760,832 214.2
June 30, 2004** 96,622,908 197,604,301 100,981,393 48.9 43,835,208 230.4
June 30, 2005** 100,207,082 234,159,510 133,952,428 42.8 43,720,092 306.4
June 30, 2006** 105,580,269 582,580,867 477,000,598 18.1 47,743,865 999.1

Financial Section
58
KENTUCKY RETIREMENT SYSTEMSREQUIRED SUPPLEMENTARY INFORMATIONSCHEDULE OF EMPLOYER CONTRIBUTIONS
Kentucky Employees Retirement System (KERS)
Non-Hazardous
Pension Insurance
Fiscal Year
Ended
Annual Required Contributions
Actual Contributions
Percentage Contributed
Annual Required Contributions
Actual Contributions
Percentage Contributed
June 30, 2001 $21,787,253 $23,482,080 107.8% $66,874,871 $66,874,871 100.0%
June 30, 2002 1,760,328 93,993,177 93,912,017 99.9
June 30, 2003 4,905,399 7,597,450 134.9 92,052,561 65,335,219 71.0
June 30, 2004 47,739,067 21,696,543 45.4 77,951,553 78,016,737 100.1
June 30, 2005 85,798,943 50,332,750 58.7 86,974,271 49,909,228 57.4
June 30, 2006 137,330,718 60,680,607 44.2 100,942,451 43,748,669 43.3
Hazardous
Pension Insurance
Annual Required Contributions
Actual Contributions
Percentage Contributed
Annual Required Contributions
Actual Contributions
Percentage Contributed
June 30, 2001 $9,920,148 $10,626,663 107.1% $13,226,298 $13,226,298 100.0%
June 30, 2002 7,742,052 17,933,817 102.5 15,859,932 15,887,399 100.2
June 30, 2003 8,511,402 7,322,607 86.0 15,839,215 15,883,263 100.3
June 30, 2004 9,600,978 9,769,580 101.8 14,942,092 14,959,617 100.1
June 30, 2005 9,449,878 9,758,547 103.3 15,892,977 15,395,977 96.9
June 30, 2006 12,128,538 10,803,206 89.1 18,605,633 16,243,103 87.3
Total
Pension Insurance
Annual Required Contributions
Actual Contributions
Percentage Contributed
Annual Required Contributions
Actual Contributions
Percentage Contributed
June 30, 2001 $31,707,401 $34,108,743 107.6% $80,101,169 $80,101,169 100.0%
June 30, 2002 7,742,052 9,694,145 125.2 109,853,109 109,799,416 100.0
June 30, 2003 13,416,801 14,920,057 111.2 107,891,776 81,218,482 75.3
June 30, 2004 57,340,045 31,466,123 54.9 92,893,645 92,976,354 100.1
June 30, 2005 95,248,821 60,091,297 63.1 102,867,248 65,305,205 63.5
June 30, 2006 149,459,256 71,483,813 47.8 119,548,084 59,991,772 50.2
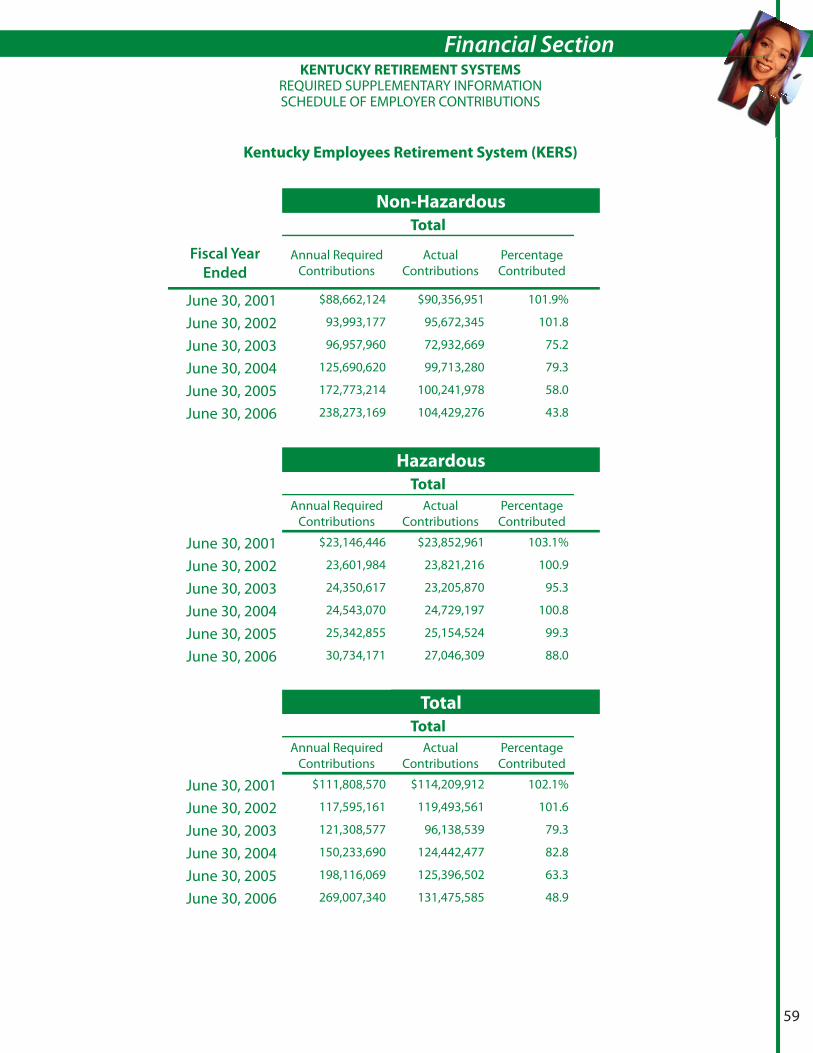
59
Financial Section
Non-Hazardous
Total
Fiscal Year
Ended
Annual Required Contributions
Actual Contributions
Percentage Contributed
June 30, 2001 $88,662,124 $90,356,951 101.9%
June 30, 2002 93,993,177 95,672,345 101.8
June 30, 2003 96,957,960 72,932,669 75.2
June 30, 2004 125,690,620 99,713,280 79.3
June 30, 2005 172,773,214 100,241,978 58.0
June 30, 2006 238,273,169 104,429,276 43.8
Hazardous
Total
Annual Required Contributions
Actual Contributions
Percentage Contributed
June 30, 2001 $23,146,446 $23,852,961 103.1%
June 30, 2002 23,601,984 23,821,216 100.9
June 30, 2003 24,350,617 23,205,870 95.3
June 30, 2004 24,543,070 24,729,197 100.8
June 30, 2005 25,342,855 25,154,524 99.3
June 30, 2006 30,734,171 27,046,309 88.0
Total
Total
Annual Required Contributions
Actual Contributions
Percentage Contributed
June 30, 2001 $111,808,570 $114,209,912 102.1%
June 30, 2002 117,595,161 119,493,561 101.6
June 30, 2003 121,308,577 96,138,539 79.3
June 30, 2004 150,233,690 124,442,477 82.8
June 30, 2005 198,116,069 125,396,502 63.3
June 30, 2006 269,007,340 131,475,585 48.9
KENTUCKY RETIREMENT SYSTEMSREQUIRED SUPPLEMENTARY INFORMATIONSCHEDULE OF EMPLOYER CONTRIBUTIONS
Kentucky Employees Retirement System (KERS)
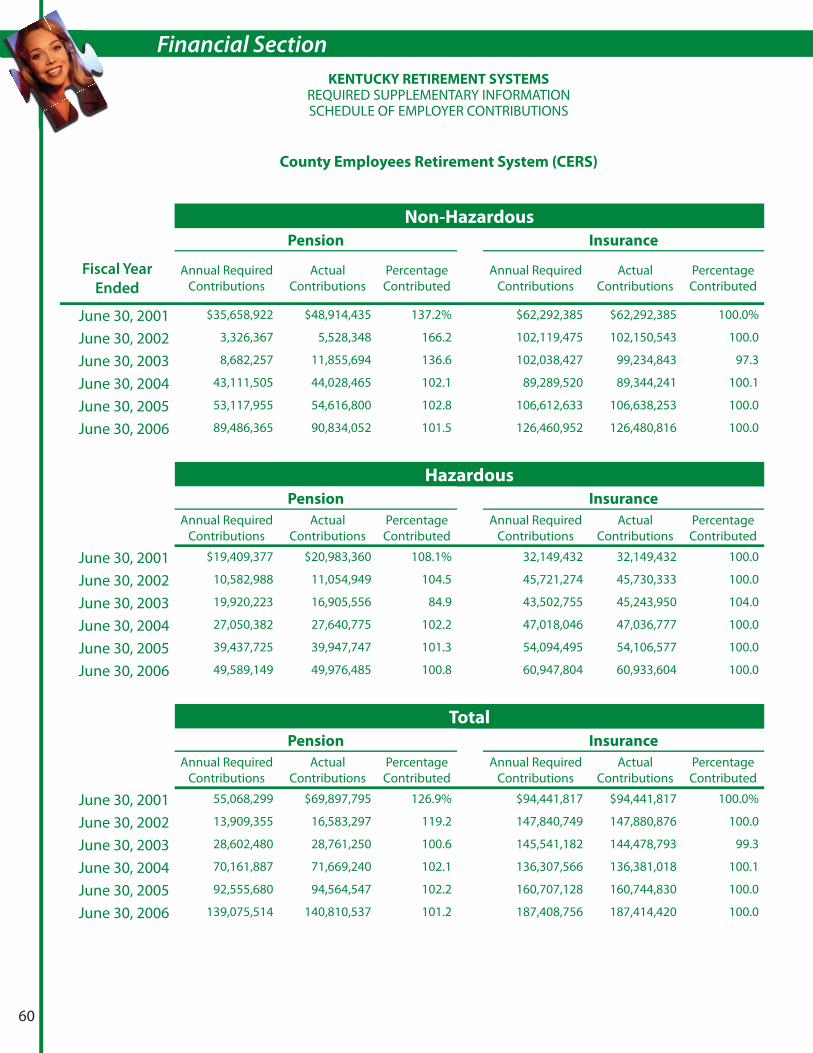
Financial Section
60
Non-Hazardous
Pension Insurance
Fiscal Year
Ended
Annual Required Contributions
Actual Contributions
Percentage Contributed
Annual Required Contributions
Actual Contributions
Percentage Contributed
June 30, 2001 $35,658,922 $48,914,435 137.2% $62,292,385 $62,292,385 100.0%
June 30, 2002 3,326,367 5,528,348 166.2 102,119,475 102,150,543 100.0
June 30, 2003 8,682,257 11,855,694 136.6 102,038,427 99,234,843 97.3
June 30, 2004 43,111,505 44,028,465 102.1 89,289,520 89,344,241 100.1
June 30, 2005 53,117,955 54,616,800 102.8 106,612,633 106,638,253 100.0
June 30, 2006 89,486,365 90,834,052 101.5 126,460,952 126,480,816 100.0
Hazardous
Pension Insurance
Annual Required Contributions
Actual Contributions
Percentage Contributed
Annual Required Contributions
Actual Contributions
Percentage Contributed
June 30, 2001 $19,409,377 $20,983,360 108.1% 32,149,432 32,149,432 100.0
June 30, 2002 10,582,988 11,054,949 104.5 45,721,274 45,730,333 100.0
June 30, 2003 19,920,223 16,905,556 84.9 43,502,755 45,243,950 104.0
June 30, 2004 27,050,382 27,640,775 102.2 47,018,046 47,036,777 100.0
June 30, 2005 39,437,725 39,947,747 101.3 54,094,495 54,106,577 100.0
June 30, 2006 49,589,149 49,976,485 100.8 60,947,804 60,933,604 100.0
Total
Pension Insurance
Annual Required Contributions
Actual Contributions
Percentage Contributed
Annual Required Contributions
Actual Contributions
Percentage Contributed
June 30, 2001 55,068,299 $69,897,795 126.9% $94,441,817 $94,441,817 100.0%
June 30, 2002 13,909,355 16,583,297 119.2 147,840,749 147,880,876 100.0
June 30, 2003 28,602,480 28,761,250 100.6 145,541,182 144,478,793 99.3
June 30, 2004 70,161,887 71,669,240 102.1 136,307,566 136,381,018 100.1
June 30, 2005 92,555,680 94,564,547 102.2 160,707,128 160,744,830 100.0
June 30, 2006 139,075,514 140,810,537 101.2 187,408,756 187,414,420 100.0
KENTUCKY RETIREMENT SYSTEMSREQUIRED SUPPLEMENTARY INFORMATIONSCHEDULE OF EMPLOYER CONTRIBUTIONS
County Employees Retirement System (CERS)

61
Financial Section
Non-Hazardous
Total
Fiscal Year
Ended
Annual Required Contributions
Actual Contributions
Percentage Contributed
June 30, 2001 $97,951,307 $111,206,820 113.5%
June 30, 2002 105,445,842 107,678,891 102.1
June 30, 2003 110,720,684 111,090,537 100.3
June 30, 2004 132,401,025 133,372,706 100.7
June 30, 2005 159,730,588 161,255,053 101.0
June 30, 2006 215,947,317 217,314,868 100.6
Hazardous
Total
Annual Required Contributions
Actual Contributions
Percentage Contributed
June 30, 2001 $51,558,809 $53,132,792 103.1%
June 30, 2002 56,304,262 56,785,282 100.9
June 30, 2003 63,422,978 62,149,506 98.0
June 30, 2004 74,068,428 74,677,552 100.8
June 30, 2005 93,532,220 94,054,324 100.6
June 30, 2006 100,536,953 110,910,089 100.3
Total
Total
Annual Required Contributions
Actual Contributions
Percentage Contributed
June 30, 2001 $149,510,116 $164,339,612 109.9%
June 30, 2002 161,750,104 164,464,173 101.7
June 30, 2003 174,143,662 173,240,043 99.5
June 30, 2004 206,469,453 208,050,258 100.8
June 30, 2005 253,262,808 255,309,377 100.8
June 30, 2006 326,484,270 328,224,956 100.5
KENTUCKY RETIREMENT SYSTEMSREQUIRED SUPPLEMENTARY INFORMATIONSCHEDULE OF EMPLOYER CONTRIBUTIONS
County Employees Retirement System (CERS)

Financial Section
62
KENTUCKY RETIREMENT SYSTEMSREQUIRED SUPPLEMENTARY INFORMATIONSCHEDULE OF EMPLOYER CONTRIBUTIONS
State Police Retirement System (SPRS)
Pension
Fiscal Year
Ended
Annual Required Contributions
Actual Contributions
Percentage Contributed
June 30, 2001 $1,535,846 $1,515,521 98.7%
June 30, 2002 (17,463)
June 30, 2003 (20,061)
June 30, 2004 1,175,711 1,152,752 98.0
June 30, 2005 3,730,805 2,851,461 76.4
June 30, 2006 6,888,805 4,244,445 61.6
InsuranceAnnual Required
ContributionsActual
ContributionsPercentage Contributed
June 30, 2001 $8,098,907 $8,113,391 100.2%
June 30, 2002 9,563,111 9,579,899 100.1
June 30, 2003 9,443,588 7,654,313 81.1
June 30, 2004 8,434,834 8,455,498 100.2
June 30, 2005 8,608,536 6,631,031 77.0
June 30, 2006 9,669,999 5,990,265 61.9
TotalAnnual Required
ContributionsActual
ContributionsPercentage Contributed
June 30, 2001 $9,634,753 $9,628,912 99.9%
June 30, 2002 9,563,111 9,562,256 100.0
June 30, 2003 9,443,588 7,634,252 80.8
June 30, 2004 9,610,545 9,608,250 100.0
June 30, 2005 12,339,341 9,482,492 76.8
June 30, 2006 16,558,804 10,234,710 61.8

63
Financial SectionKENTUCKY RETIREMENT SYSTEMS
NOTES TO REQUIRED SUPPLEMENTARY INFORMATION
The information presented in the required supplementary schedules as determined as part of the actuarial valuations at the dates indicated. Additional information as of the latest actuarial valuation follows:
Pension Funds
Non-Hazardous Hazardous
Valuation Date June 30, 2006 June 30, 2006
Actuarial Cost Method Entry Age Entry Age
Amortization Method Level Percent Closed Level Percent Closed
Remaining Amortization Period 14-30 Years 14-30 Years
Asset Valuation Method Five-Year Smoothed Market Five-Year Smoothed Market
Actuarial Assumptions:
Investment Return 7.75% 7.75%
Projected Salary Increases 4.0-13.5% 4.0-14.5%
Cost-of-Living Adjustment None None
Includes Infl ation Rate at 3.50% 3.50%
Insurance Funds
Non-Hazardous Hazardous
Valuation Date June 30, 2006 June 30, 2006
Actuarial Cost Method Entry Age Entry Age
Asset Valuation Method Five-Year Smoothed Market Five-Year Smoothed Market
Remaining Amortization Period 30 Years 30 Years
Medical Trend Assumption Year of Ultimate Trend
12.00-5.50%2027
12.00-5.50%2027
Actuarial Assumptions:
Investment Return* 4.50%/7.75% 4.50%/7.75%
Includes Infl ation Rate at * 3.5% 3.5%
*Note: Relative to the insurance funds, the investment return assumption for the KERS non-hazardous fund and the SPRS fund is 4.5% as required under GASB Statements No. 43 and 45 due to the lack of pre-funding in these respective funds. The remaining funds utilize a 7.75 % investment return assumption.

Financial Section
64
KENTUCKY RETIREMENT SYSTEMS
Schedule of Administrative ExpensesFor the Fiscal Years Ended June 30, 2006 and 2005
2006 2005
(Dollars in Thousands)
Personal Services
Salaries and Per Diem $ 13,041 $ 10,139Fringe Benefi ts 2,964 2,500Tuition Assistance 91 66Total Personal Services 16,096 12,705Contractual Services
Actuarial 161 157Audit 23 41Legal 522 397Medical 288 224Contractual 1,354 735Total Contractual Services 2,348 1,554Communication
Printing 254 219Telephone 172 136Postage 637 549Travel 218 157Total Communication 1,281 1,061Rentals
Offi ce Space 980 981Equipment 57 58Total Rentals 1,037 1,039Miscellaneous
Utilities 221 147Supplies 165 137Insurance 61 56Maintenance 300 330Other 361 84Total Miscellaneous 1,108 754
Depreciation 387 319Healthcare Administrative Expenses 3,562 1,231Total Administrative Expenses $ 25,819 $ 18,663
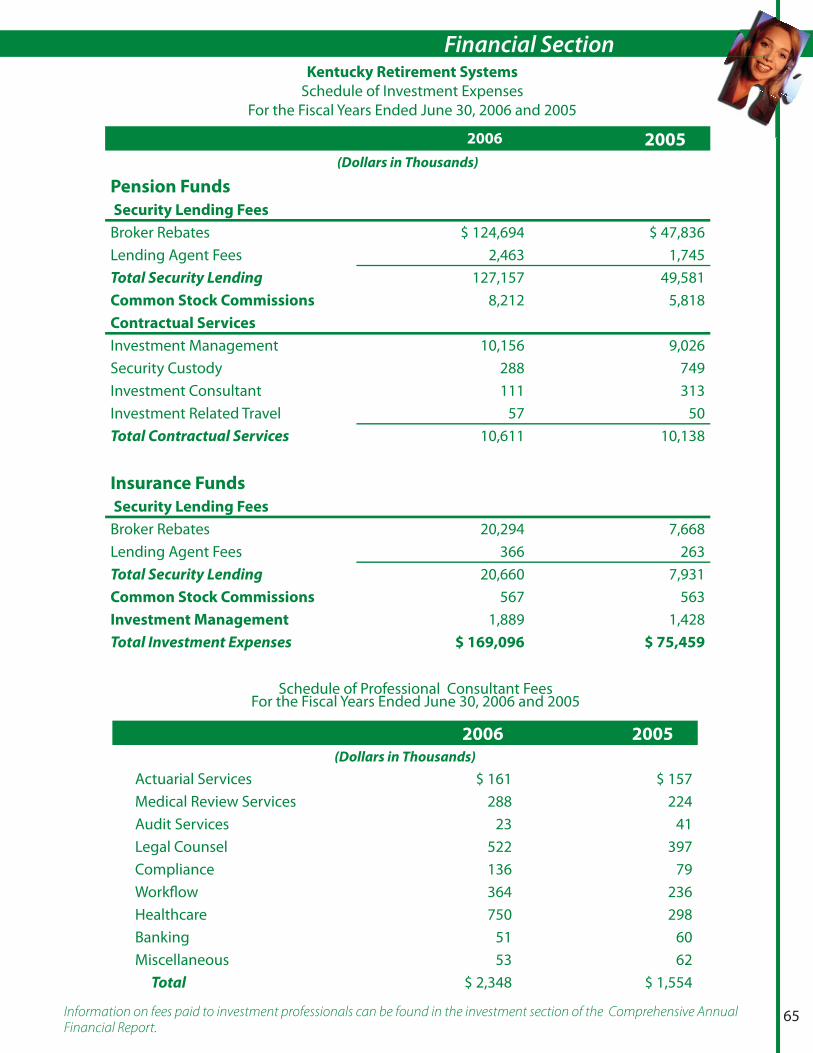
65
Financial SectionKentucky Retirement Systems
Schedule of Investment ExpensesFor the Fiscal Years Ended June 30, 2006 and 2005
2006 2005
(Dollars in Thousands)
Pension Funds
Security Lending Fees
Broker Rebates $ 124,694 $ 47,836Lending Agent Fees 2,463 1,745Total Security Lending 127,157 49,581Common Stock Commissions 8,212 5,818Contractual Services
Investment Management 10,156 9,026Security Custody 288 749Investment Consultant 111 313Investment Related Travel 57 50Total Contractual Services 10,611 10,138
Insurance Funds
Security Lending Fees
Broker Rebates 20,294 7,668Lending Agent Fees 366 263Total Security Lending 20,660 7,931Common Stock Commissions 567 563Investment Management 1,889 1,428Total Investment Expenses $ 169,096 $ 75,459
2006 2005
(Dollars in Thousands)
Actuarial Services $ 161 $ 157Medical Review Services 288 224Audit Services 23 41Legal Counsel 522 397Compliance 136 79Workfl ow 364 236Healthcare 750 298Banking 51 60Miscellaneous 53 62
Total $ 2,348 $ 1,554
Schedule of Professional Consultant Fees For the Fiscal Years Ended June 30, 2006 and 2005
Information on fees paid to investment professionals can be found in the investment section of the Comprehensive Annual Financial Report.
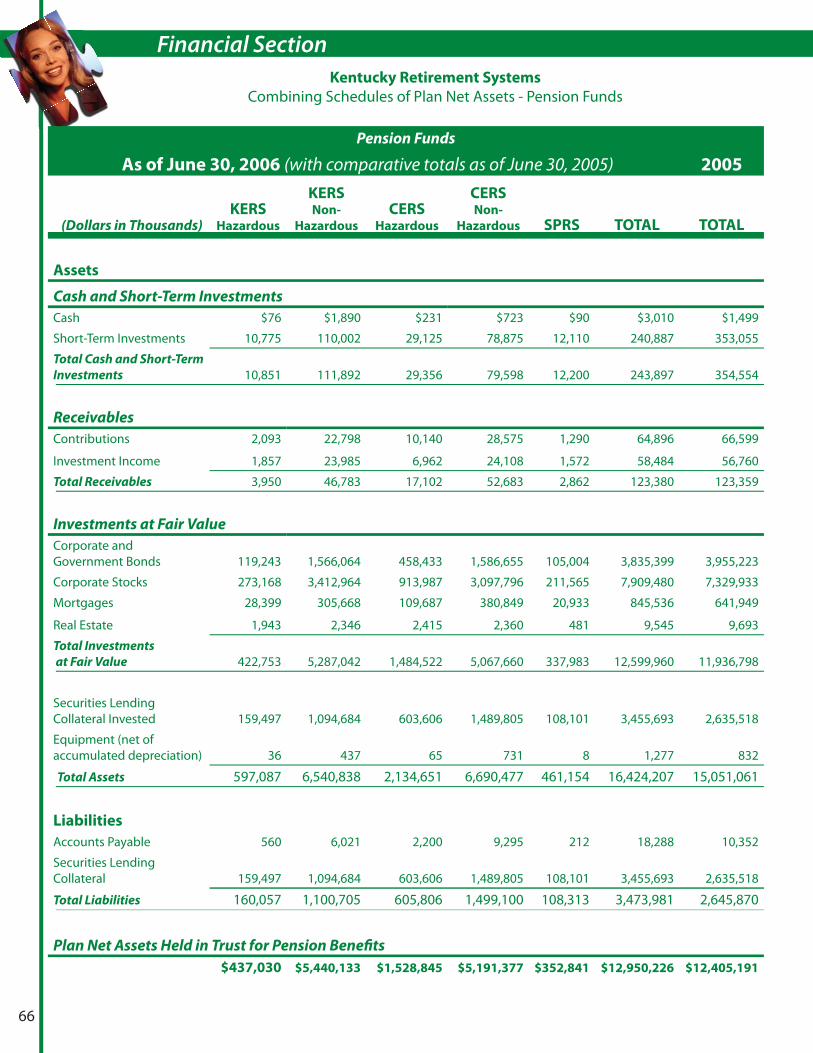
Financial Section
66
Kentucky Retirement Systems
Combining Schedules of Plan Net Assets - Pension Funds
Pension Funds
As of June 30, 2006 (with comparative totals as of June 30, 2005) 2005
(Dollars in Thousands)KERS
Hazardous
KERSNon-
Hazardous
CERSHazardous
CERSNon-
Hazardous SPRS TOTAL TOTAL
Assets
Cash and Short-Term Investments
Cash $76 $1,890 $231 $723 $90 $3,010 $1,499
Short-Term Investments 10,775 110,002 29,125 78,875 12,110 240,887 353,055
Total Cash and Short-Term
Investments 10,851 111,892 29,356 79,598 12,200 243,897 354,554
Receivables
Contributions 2,093 22,798 10,140 28,575 1,290 64,896 66,599
Investment Income 1,857 23,985 6,962 24,108 1,572 58,484 56,760
Total Receivables 3,950 46,783 17,102 52,683 2,862 123,380 123,359
Investments at Fair Value
Corporate and Government Bonds 119,243 1,566,064 458,433 1,586,655 105,004 3,835,399 3,955,223
Corporate Stocks 273,168 3,412,964 913,987 3,097,796 211,565 7,909,480 7,329,933
Mortgages 28,399 305,668 109,687 380,849 20,933 845,536 641,949
Real Estate 1,943 2,346 2,415 2,360 481 9,545 9,693
Total Investments
at Fair Value 422,753 5,287,042 1,484,522 5,067,660 337,983 12,599,960 11,936,798
Securities Lending Collateral Invested 159,497 1,094,684 603,606 1,489,805 108,101 3,455,693 2,635,518
Equipment (net of accumulated depreciation) 36 437 65 731 8 1,277 832
Total Assets 597,087 6,540,838 2,134,651 6,690,477 461,154 16,424,207 15,051,061
Liabilities
Accounts Payable 560 6,021 2,200 9,295 212 18,288 10,352
Securities Lending Collateral 159,497 1,094,684 603,606 1,489,805 108,101 3,455,693 2,635,518
Total Liabilities 160,057 1,100,705 605,806 1,499,100 108,313 3,473,981 2,645,870
Plan Net Assets Held in Trust for Pension Benefi ts
$437,030 $5,440,133 $1,528,845 $5,191,377 $352,841 $12,950,226 $12,405,191

67
Financial SectionKentucky Retirement Systems
Combining Schedules of Plan Net Assets - Insurance Funds
Insurance Funds
As of June 30, 2006 (with comparative totals as of June 30, 2005) 2005
( Dollars in
Thousands)KERS
Hazardous
KERSNon-
Hazardous
CERSHazardous
CERSNon-
Hazardous SPRS TOTAL TOTAL
Assets
Cash and Short-Term Investments
Cash $35 $98 $51 $74 $7 $265 $207
Short-Term Investments 20,824 99,493 36,092 68,375 9,066 233,850 210,072
Total Cash and Short-Term
Investments 20,859 99,591 36,143 68,449 9,073 234,115 210,279
Receivables
Contributions 902 3,849 6,855 18,309 378 30,293 18,617
Investment Income 529 1,602 1,085 1,957 267 5,440 4,909
Total Receivables 1,431 5,451 7,940 20,266 645 35,733 23,526
Investments, at Fair Value
Corporate and Government Bonds 20,994 61,783 46,358 80,958 10,689 220,782 199,189
Corporate Stocks 180,360 467,311 351,926 645,459 90,208 1,735,264 1,497,841
Alternative Investment 15 15 37 61 7 135
Total Investments 201,369 529,109 398,321 726,478 100,904 1,956,181 1,697,030
Securities Lending Collateral Invested 58,213 73,130 128,623 215,816 25,561 501,343 431,552
Total Assets 281,872 707,281 571,027 1,031,009 136,183 2,727,372 2,362,387
Liabilities
Accounts Payable 201 1,566 1,283 2,195 162 5,407 2,230
Demutualization Proceeds Ppayable 20,000 20,000
Securities Lending Collateral 58,213 73,130 128,623 215,816 25,561 501,343 431,552
Total Liabilities 58,414 94,696 129,906 218,011 25,723 526,750 433,782
Plan Net Assets Held in Trust for Pension Benefi ts
$223,458 $612,585 $441,121 $812,998 $110,460 $2,200,622 $1,928,605
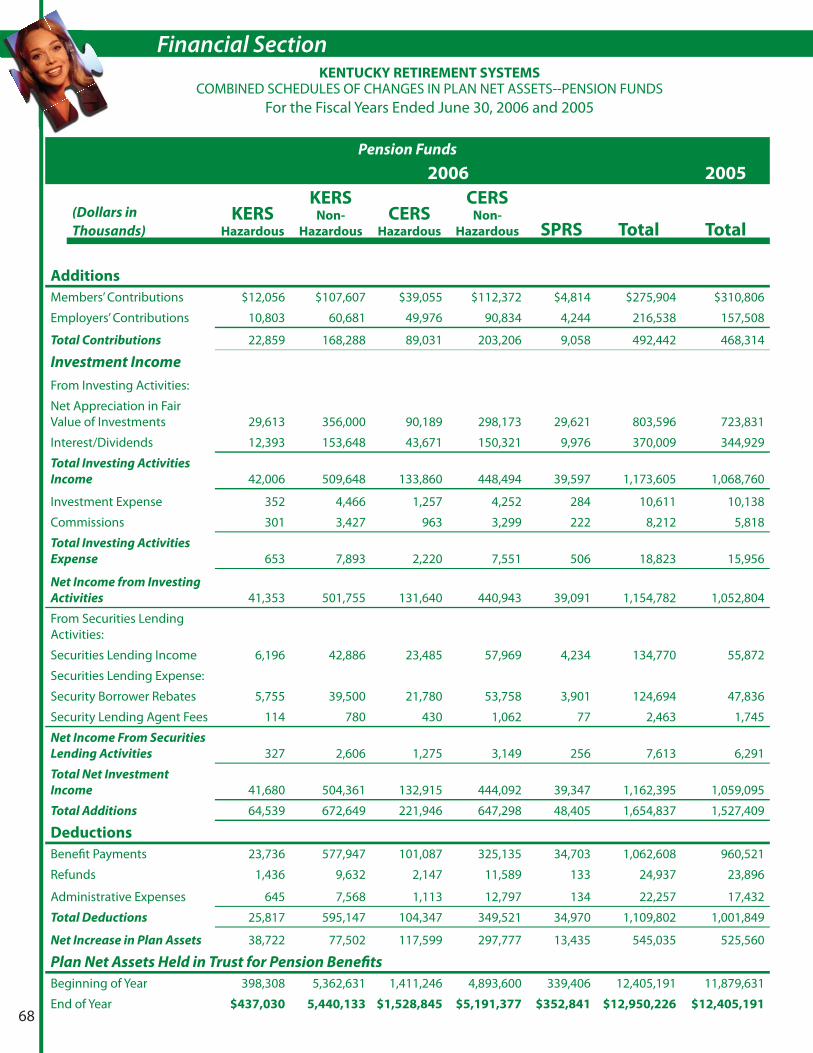
Financial Section
68
KENTUCKY RETIREMENT SYSTEMSCOMBINED SCHEDULES OF CHANGES IN PLAN NET ASSETS--PENSION FUNDS
For the Fiscal Years Ended June 30, 2006 and 2005
Pension Funds
2006 2005
(Dollars in
Thousands)KERS
Hazardous
KERS Non-
Hazardous
CERS Hazardous
CERS Non-
Hazardous SPRS Total Total
Additions
Members’ Contributions $12,056 $107,607 $39,055 $112,372 $4,814 $275,904 $310,806
Employers’ Contributions 10,803 60,681 49,976 90,834 4,244 216,538 157,508
Total Contributions 22,859 168,288 89,031 203,206 9,058 492,442 468,314
Investment Income
From Investing Activities:
Net Appreciation in Fair Value of Investments 29,613 356,000 90,189 298,173 29,621 803,596 723,831
Interest/Dividends 12,393 153,648 43,671 150,321 9,976 370,009 344,929
Total Investing Activities
Income 42,006 509,648 133,860 448,494 39,597 1,173,605 1,068,760
Investment Expense 352 4,466 1,257 4,252 284 10,611 10,138
Commissions 301 3,427 963 3,299 222 8,212 5,818
Total Investing Activities
Expense 653 7,893 2,220 7,551 506 18,823 15,956
Net Income from Investing
Activities 41,353 501,755 131,640 440,943 39,091 1,154,782 1,052,804
From Securities Lending Activities:
Securities Lending Income 6,196 42,886 23,485 57,969 4,234 134,770 55,872
Securities Lending Expense:
Security Borrower Rebates 5,755 39,500 21,780 53,758 3,901 124,694 47,836
Security Lending Agent Fees 114 780 430 1,062 77 2,463 1,745
Net Income From Securities
Lending Activities 327 2,606 1,275 3,149 256 7,613 6,291
Total Net Investment
Income 41,680 504,361 132,915 444,092 39,347 1,162,395 1,059,095
Total Additions 64,539 672,649 221,946 647,298 48,405 1,654,837 1,527,409
Deductions
Benefi t Payments 23,736 577,947 101,087 325,135 34,703 1,062,608 960,521
Refunds 1,436 9,632 2,147 11,589 133 24,937 23,896
Administrative Expenses 645 7,568 1,113 12,797 134 22,257 17,432
Total Deductions 25,817 595,147 104,347 349,521 34,970 1,109,802 1,001,849
Net Increase in Plan Assets 38,722 77,502 117,599 297,777 13,435 545,035 525,560
Plan Net Assets Held in Trust for Pension Benefi ts
Beginning of Year 398,308 5,362,631 1,411,246 4,893,600 339,406 12,405,191 11,879,631
End of Year $437,030 5,440,133 $1,528,845 $5,191,377 $352,841 $12,950,226 $12,405,191
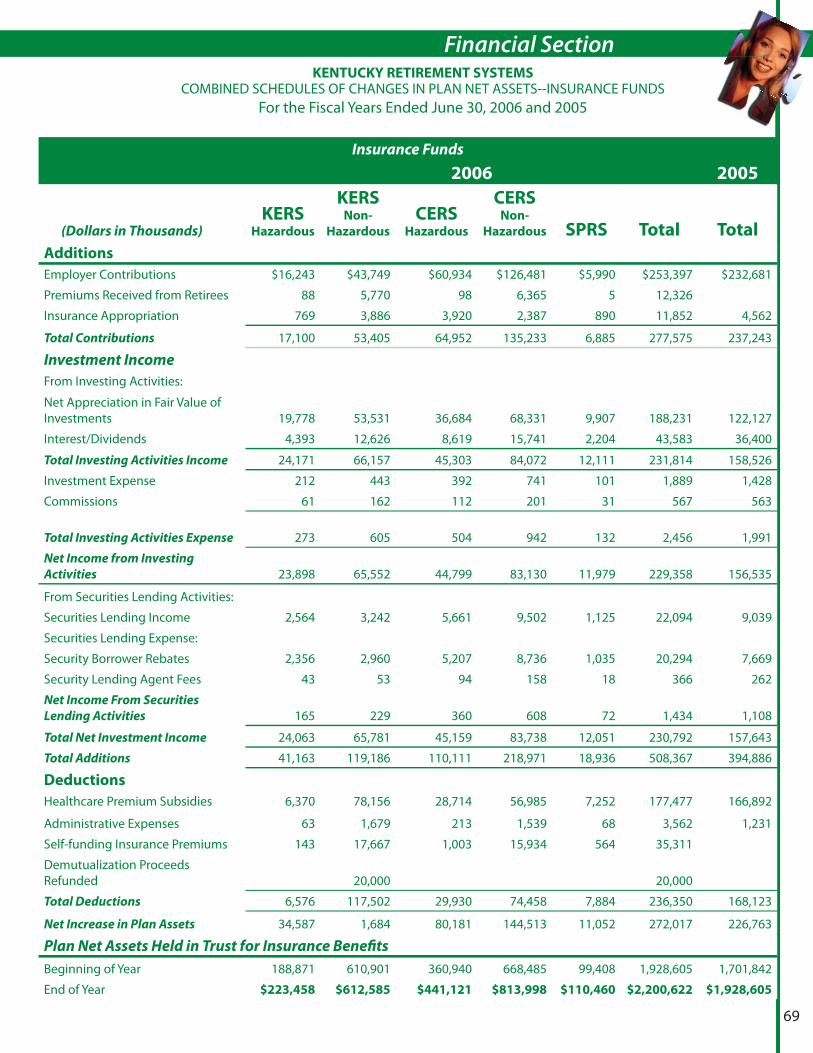
69
Financial SectionKENTUCKY RETIREMENT SYSTEMS
COMBINED SCHEDULES OF CHANGES IN PLAN NET ASSETS--INSURANCE FUNDSFor the Fiscal Years Ended June 30, 2006 and 2005
Insurance Funds
2006 2005
(Dollars in Thousands)KERS
Hazardous
KERS Non-
Hazardous
CERS Hazardous
CERS Non-
Hazardous SPRS Total Total
Additions
Employer Contributions $16,243 $43,749 $60,934 $126,481 $5,990 $253,397 $232,681
Premiums Received from Retirees 88 5,770 98 6,365 5 12,326
Insurance Appropriation 769 3,886 3,920 2,387 890 11,852 4,562
Total Contributions 17,100 53,405 64,952 135,233 6,885 277,575 237,243
Investment Income
From Investing Activities:
Net Appreciation in Fair Value of Investments 19,778 53,531 36,684 68,331 9,907 188,231 122,127
Interest/Dividends 4,393 12,626 8,619 15,741 2,204 43,583 36,400
Total Investing Activities Income 24,171 66,157 45,303 84,072 12,111 231,814 158,526
Investment Expense 212 443 392 741 101 1,889 1,428
Commissions 61 162 112 201 31 567 563
Total Investing Activities Expense 273 605 504 942 132 2,456 1,991
Net Income from Investing
Activities 23,898 65,552 44,799 83,130 11,979 229,358 156,535
From Securities Lending Activities:
Securities Lending Income 2,564 3,242 5,661 9,502 1,125 22,094 9,039
Securities Lending Expense:
Security Borrower Rebates 2,356 2,960 5,207 8,736 1,035 20,294 7,669
Security Lending Agent Fees 43 53 94 158 18 366 262
Net Income From Securities
Lending Activities 165 229 360 608 72 1,434 1,108
Total Net Investment Income 24,063 65,781 45,159 83,738 12,051 230,792 157,643
Total Additions 41,163 119,186 110,111 218,971 18,936 508,367 394,886
Deductions
Healthcare Premium Subsidies 6,370 78,156 28,714 56,985 7,252 177,477 166,892
Administrative Expenses 63 1,679 213 1,539 68 3,562 1,231
Self-funding Insurance Premiums 143 17,667 1,003 15,934 564 35,311
Demutualization Proceeds Refunded 20,000 20,000
Total Deductions 6,576 117,502 29,930 74,458 7,884 236,350 168,123
Net Increase in Plan Assets 34,587 1,684 80,181 144,513 11,052 272,017 226,763
Plan Net Assets Held in Trust for Insurance Benefi ts
Beginning of Year 188,871 610,901 360,940 668,485 99,408 1,928,605 1,701,842
End of Year $223,458 $612,585 $441,121 $813,998 $110,460 $2,200,622 $1,928,605
Financial Section
70
REPORT ON INTERNAL CONTROL OVER FINANCIAL REPORTING AND ON COMPLIANCEAND OTHER MATTERS BASED ON AN AUDIT OF FINANCIAL STATEMENTS PERFORMED
IN ACCORDANCE WITH GOVERNMENT AUDITING STANDARDS
Board of TrusteesKentucky Retirement SystemsFrankfort, Kentucky
We have audited the fi nancial statements of Kentucky Retirement Systems, a component unit of the Commonwealth of Kentucky, as of and for the year ended June 30, 2006, and have issued our report thereon dated August 31, 2006. We conducted our audit in accordance with auditing standards generally accepted in the United States of America and the standards applicable to fi nancial audits contained in Government Auditing Standards, issued by the Comptroller General of the United States.
Internal Control Over Financial ReportingIn planning and performing our audit, we considered Kentucky Retirement Systems’ internal control over fi nancial reporting in order to determine our auditing procedures for the purpose of expressing our opinion on the fi nancial statements and not to provide an opinion on the internal control over fi nancial reporting. However, we noted one matter involving the internal control over fi nancial reporting and its operation that we consider to be a reportable condition. Reportable conditions involve matters coming to our attention relating to signifi cant defi ciencies in the design or operation of the internal control over fi nancial reporting that, in our judgement, could adversely aff ect Kentucky Retirement Systems’ ability to initiate, record, process, and report fi nancial data consistent with the assertions of management in the fi nancial statements. The reportable condition is described in the accompanying Schedule of Finding and Responses as Item 2006-1.
A material weakness is a reportable condition in which the design or operation of one or more of the internal control components does not reduce to a relatively low level of risk that misstatements caused by error or fraud in amounts that would be material in relation to the fi nancial statements being audited may occur and not be detected within a timely period by employees in the normal course of performing their assigned functions. Our consideration of the internal control over fi nancial reporting would not necessarily disclose all matters in the internal control that might be reportable conditions and, accordingly, would not necessarily disclose all reportable conditions that are considered to be material weaknesses. However, we do not believe that the reportable condition described above is a material weakness.
Compliance And Other MattersAs part of obtaining reasonable assurance about whether Kentucky Retirement Systems’ fi nancial statements are free of material mistatement, we performed tests of its compliance with certain provisions of laws, regulations, contracts and grant agreements, noncompliance with which could have a direct and material eff ect on the determination of fi nancial statement amounts. However, providing an opinion on compliance with those provisions was not an objective of our audit, and accordingly, we do not express such an opinion. The results of our tests disclosed no instances of noncompliance and other matters that are required to be reported under Government Auditing Standards.
This report is intended solely for the information of the audit committee, management, and the Commonwealth of Kentucky and is not intended to be and should not be used by anyone other than these specifi ed parties. However, this report is a matter of public record and its distribution is not limited.
August 31, 2006Louisville, Kentucky
71
Financial SectionKentucky Retirement Systems
Schedule of Finding and Response
Finding
ITEM 2006-1, Management Override of Internal Controls
During the fi scal year ended June 30, 2006, two offi cers of Kentucky Retirement Systems’ (KRS) Executive Management, the Chief Investment Offi cer and Chief Operations Offi cer, circumvented internal control policies and procedures related to an Alternative Investment made by the KRS Insurance Fund.
The Chief Investment Offi cer and Chief Operations Offi cer also failed to perform adequate due diligence in violation of agency practice and industry best practice related to an Alternative Investment by the KRS Insurance Fund. In addition, the Chief Investment Offi cer and the Chief Operations Offi cer, acted outside the authority granted to them by the Investment Committee when completing the acquisition of the Alternative Investment.
In addition, there was a commingling of funds between the Pension and Insurance Funds to fi nance the acquisition of the Alternative Investment. This is in violation of the Plan Document and the Internal Revenue Code.
Response
ITEM 2006-1, Management Override of Internal Controls
The Chief Investment Offi cer and the Chief Operations Offi cer have resigned.
KRS has retained fi duciary counsel, Ice Miller, LLP, to review the internal controls in place and will issue an opinion regarding the internal controls at KRS and make recommendations, if necessary. Also, the Audit Committee of the Board of Trustees of KRS has directed Internal Audit to review internal controls and make recommendations, if necessary. In the interim it is the opinion of the Executive Management of KRS and Internal Audit that the internal controls are adequate.
Furthermore, Ice Miller, LLP, is in the process of preparing a memorandum with respect to the Alternative Investment and the commingling of funds to detail the self-correcting action taken by KRS.


Investment Section
Investment Summary 74
Investment Policy 74
Investment Strategy 75
Investment Consultant’s Letter 76
Investment Results 80
Schedule of Fees and Commissions 92

Investment Section
74
U.S. Equity60%
International Equity20%
TIPS10%
Alternatives5%
Cash5%
U.S. Equity40%
International Equity15%
TIPS10%
Alternatives5%
Core Fixed27%
Investment Summary
The Board of Trustees is charged with the responsibility of investing Kentucky Retirement Systems’ assets to help provide for the benefi ts paid to KRS members. To achieve that goal the Board follows a policy of preserving capital, while seeking means of enhancing revenues and protecting against undue losses in any particular investment area. The Board recognizes its fi duciary duty not only to invest the funds in formal compliance with the Prudent Person Rule, but also to manage the funds in continued recognition of the basic long term nature of KRS. In carrying out their fi duciary duties, the Trustees have set forth clearly defi ned investment policies, objectives and strategies for both the pension and insurance portfolios.
Investment PolicyDuring the fi scal year, the KRS Board of Trustees did not alter its investment policy. As of June 30, 2006, the KRS pension fund’s policy is to invest 40% of the assets in U.S. equities, 15% in international equities, 27% in fi xed income, 10% in Treasury Infl ation Protected Securities (TIPS), 5% in alternative assets, and 3% in cash or short-term securities. As of June 30, 2006, the KRS insurance fund’s policy is to invest 60% of the assets in U.S. equities, 20% in international equities, 10% in TIPS, 5% in alternative assets, and 5% in cash or short-term securities.
The following charts graphically depict the Board’s investment policy.
Pension Fund Target Allocation(June 30, 2006)
Insurance Fund Target Allocation(June 30, 2006)
Investment Objectives The investment objectives of the portfolios are to produce results that exceed the stated goals over both short-term and long-term periods.
Short-Term: The returns of the particular asset classes of the managed funds of the Systems, measured on a year-to-year basis, should exceed the returns achieved by a policy portfolio composed of comparable unmanaged market indices.
Long-Term: The total assets of the Systems should achieve a return measured over two market cycles (estimated to be six to ten years) which exceeds the rate of infl ation for the period, as measured by the Consumer Price Index for All Urban Consumers, by at least 4%.
In keeping with its responsibility as trustee and wherever consistent with its fi duciary responsibility, the Board encourages the investment of KRS’ assets in securities of corporations that provide a positive contribution to the economy of the Commonwealth of Kentucky.
U.S. Equity60.0%
Core Fixed 27.0%
TIPS10.0%
Alternatives5.0%
Alternatives5.0%
Cash3.0 %
U.S. Equity40.0%
International Equity20.0%
Cash5.0 %
TIPS10.0% International Equity
15.0%

75
Investment SectionInvestment Strategies
Diversifi cationThe KRS portfolio is diversifi ed on several levels. Portfolios are diversifi ed through the use of multiple asset classes. Asset allocations are revisited on a periodic basis and represent an effi cient allocation to achieve overall return and risk characteristics. The individual asset classes are diversifi ed through the use of multiple portfolios that are managed both by the Investment Division staff and by external professional managers. Finally, portfolios within each of the asset classes are diversifi ed through the selection of individual securities. Each portfolio manager is aff orded discretion to diversify its portfolio(s) within the parameters established by the Board of Trustees.
RebalancingProper implementation of the investment policy requires that a periodic adjustment, or rebalancing, of assets be made to ensure conformance with investment policy target levels. Such rebalancing is necessary to refl ect sizeable cash fl ows and performance imbalances among asset classes and investment managers. KRS’ rebalancing policies call for an immediate rebalancing if an asset class exceeds or falls below its target allocation by 10%. As the following charts depict, the Pension and Insurance portfolios were operating within the ranges established by the investment policies.
Pension Fund
Target Allocation
U.
S.
Eq
uit
y
U.
S.
Eq
uit
y
Inte
rna
tio
na
l E
qu
ity
Inte
rna
tio
na
l E
qu
ity
TIP
S
TIP
S
Alt
ern
ati
ve
s
Alt
ern
ati
ve
s
Co
re F
ixe
d
Ca
sh
Ca
sh
Insurance Fund
Target Allocation
30%
40%60%
40%
10%
0%
20%
0%
20%
%
%
%
%
%
%
%
30%
10%
50%
Investments Performance Review ProceduresAt least once each quarter, the Investment Committee, on behalf of the Board of Trustees, reviews the performance of the portfolio for determination of compliance with the Statement of Investment Policy. Each month the Investment Division performs tests to assure compliance with the restrictions imposed by the Investment Policy.
Investment ConsultingThe Board employs Strategic Investment Solutions, Inc. to review the asset allocation guidelines and the performance of both the internally managed and externally managed assets. A letter from that fi rm follows this introduction and discusses current allocations, performance and signifi cant changes during the fi scal year.
Policy Actual

Investment Section
76
October 25, 2006
The Board of Trustees of the Kentucky Retirement SystemsPerimeter Park West1260 Louisville RoadFrankfort, KY 40601
Subject: Annual Fund Review
Dear Trustees:
Strategic Investment Solutions is charged with the duty to advise the Board in its asset management activities. This is our annual review of the asset management of the Kentucky Retirement Systems. Although we recognize that the Board of Trustees is charged with the responsibility of managing the Funds in a manner consistent with the basic long term nature of the participating systems, our comments focus on the fi scal year ended June 30, 2006. In managing the Funds, the Board must maintain formal compliance with the Prudent Person Rule. Therefore, it seeks to maintain proper and appropriate diversifi cation for the Fund.
Market Highlights
Global equity markets continued their strong recent returns during FY 2006, though it was a tale of two very diff erent six month periods. During the fi rst six months, while concerns about the eff ects on infl ation of high energy prices loomed, strong corporate earnings growth helped boost equity returns. Riskier equity segments such as US small cap and International emerging markets performed well as investors were accepting of market risk. This changed substantially during the second half of the fi scal year. Equities posted weak results due to tighter liquidity, concerns about uncertainty in Iraq and Afghanistan, high energy prices, and infl ation fears from strong economic growth. In essence, the price of market risk increased dramatically. On the fi xed income side, the Federal Reserve raised short-term interest rates throughout this period; June 29 saw the 17th straight short-term rate hike. As a result, most bond market sectors had fl at to negative returns. Alternatives (private markets) did quite well during the fi scal year, particularly buyout opportunities.
The US dollar weakened during this period, boosting International Equity and Fixed Income returns. The S&P 500 Index gained 8.63% over the past year while the MSCI EAFE (International Equity) Index (Net) rose 26.56%. The fi xed income markets, as represented by the Lehman Aggregate Bond Index, fell 0.81%.
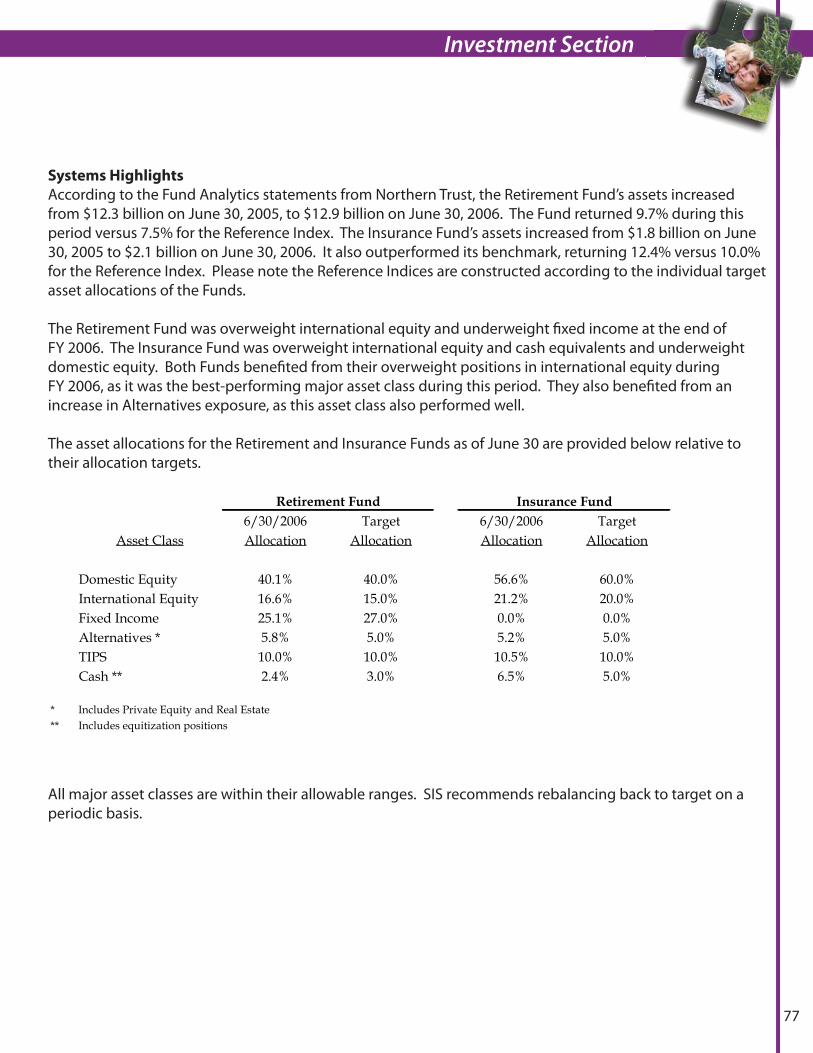
77
Investment Section
Systems Highlights
According to the Fund Analytics statements from Northern Trust, the Retirement Fund’s assets increased from $12.3 billion on June 30, 2005, to $12.9 billion on June 30, 2006. The Fund returned 9.7% during this period versus 7.5% for the Reference Index. The Insurance Fund’s assets increased from $1.8 billion on June 30, 2005 to $2.1 billion on June 30, 2006. It also outperformed its benchmark, returning 12.4% versus 10.0% for the Reference Index. Please note the Reference Indices are constructed according to the individual target asset allocations of the Funds.
The Retirement Fund was overweight international equity and underweight fi xed income at the end of FY 2006. The Insurance Fund was overweight international equity and cash equivalents and underweight domestic equity. Both Funds benefi ted from their overweight positions in international equity during FY 2006, as it was the best-performing major asset class during this period. They also benefi ted from an increase in Alternatives exposure, as this asset class also performed well.
The asset allocations for the Retirement and Insurance Funds as of June 30 are provided below relative to their allocation targets.
6/30/2006 Target 6/30/2006 TargetAsset Class Allocation Allocation Allocation Allocation
Domestic Equity 40.1% 40.0% 56.6% 60.0%International Equity 16.6% 15.0% 21.2% 20.0%Fixed Income 25.1% 27.0% 0.0% 0.0%Alternatives * 5.8% 5.0% 5.2% 5.0%TIPS 10.0% 10.0% 10.5% 10.0%Cash ** 2.4% 3.0% 6.5% 5.0%
* Includes Private Equity and Real Estate** Includes equitization positions
Retirement Fund Insurance Fund
All major asset classes are within their allowable ranges. SIS recommends rebalancing back to target on a periodic basis.

Investment Section
78
Investment Manager Highlights
Retirement FundAmong domestic equity managers, the INVESCO structured core equity portfolio (return of 15.8% vs. 8.6% for the S&P 500 Index) and the S&P 1500 Index portfolio (9.8% vs. 7.3% for the S&P 1500 Price Only Index) strongly outperformed their respective benchmarks. The NTQA small cap portfolio performed in line with its benchmark, while the Weaver MVT portfolio was liquidated during the year due to poor performance.
On the international side, the Fidelity growth portfolio (27.6% return) and BGI International Alpha Tilts core portfolio (27.5%) both modestly outperformed the MSCI EAFE (Gross) Index (27.1%), while the Boston Company value portfolio trailed the benchmark (24.8%). The Boston Company’s performance was disappointing as growth and value strategies were favored more or less equally during the period and their emerging markets exposure would have been expected to aid returns, as this asset class posted strong gains during the year.
Among the fi ve fi xed income portfolios, three modestly outperformed their benchmarks: Lincoln Capital (-0.7% vs. -0.8% for the Lehman Aggregate Index); and both TIPS portfolios (the Internal portfolio lost 1.4% vs. -1.6% for the benchmark, while the Barksdale portfolio lost 1.3%). The other two, INVESCO (-1.5%) and Weaver Barksdale Core (-1.4%), essentially matched the return of the Lehman Government/Credit Index. Over longer time periods, Lincoln Capital has exceeded its benchmark net of management fees while the other portfolios have trailed their benchmarks on a net basis.
The Alternatives portfolio continued its strong performance record since inception, with a 17.3% return vs. 6.3% for the Blended Index during the year.
Insurance FundThe S&P 1500 Index portfolio (9.8% vs. 7.3% for the S&P 1500 Price Only Index) and Fidelity (27.5% vs. 27.1% for the MSCI EAFE Index) both outperformed their respective benchmarks.
Both TIPS portfolios did modestly well against the Lehman TIPS Index (-1.5% each vs. -1.6%).

79
Investment Section
Summary
During 2006 fi scal year the Retirement and Insurance Funds experienced strong returns and asset growth. Both Funds benefi ted from generally strong relative and absolute results by their domestic and international equity managers, and their overweight to international equity. Alternatives also helped to boost returns substantially. The fi xed income portfolios generally performed in line with their benchmarks, though absolute returns were poor due to a weak fi xed income investment environment.
Sincerely,
Peter A. Keliuotis, CFA(630) 705-3099
cc: B. Cracraft, KRS B. Aldridge, KRS
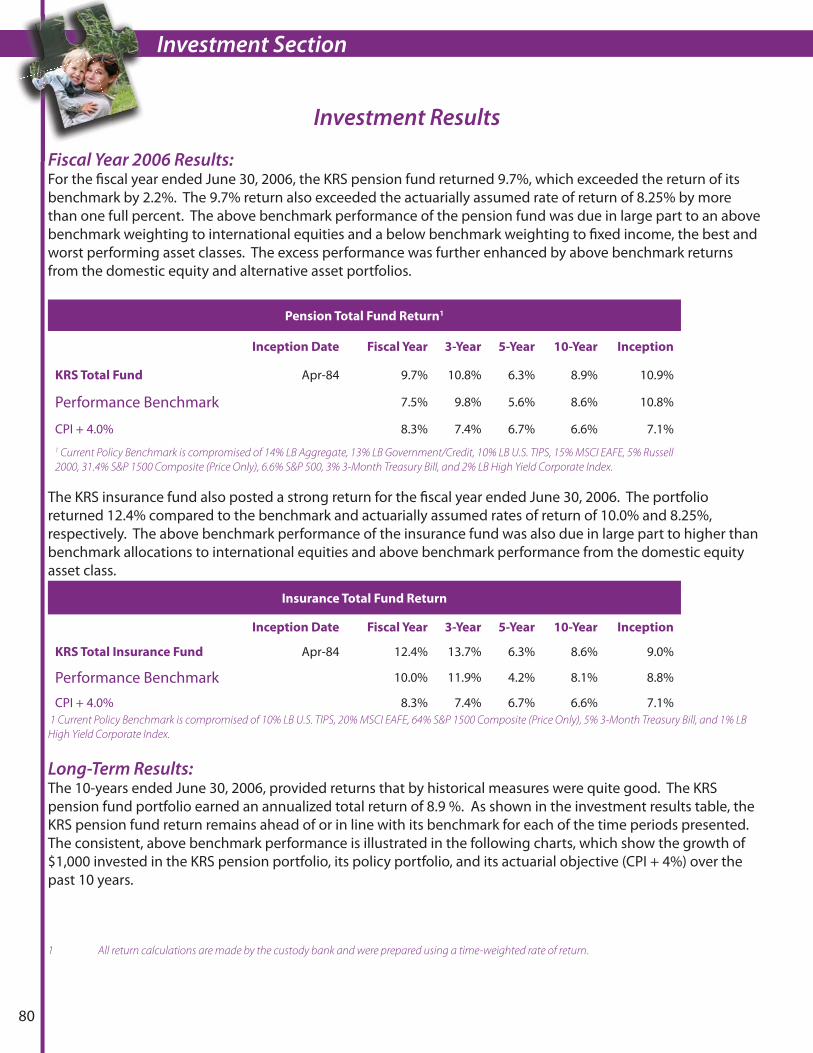
Investment Section
80
Investment Results
Fiscal Year 2006 Results:For the fi scal year ended June 30, 2006, the KRS pension fund returned 9.7%, which exceeded the return of its benchmark by 2.2%. The 9.7% return also exceeded the actuarially assumed rate of return of 8.25% by more than one full percent. The above benchmark performance of the pension fund was due in large part to an above benchmark weighting to international equities and a below benchmark weighting to fi xed income, the best and worst performing asset classes. The excess performance was further enhanced by above benchmark returns from the domestic equity and alternative asset portfolios.
Pension Total Fund Return1
Inception Date Fiscal Year 3-Year 5-Year 10-Year Inception
KRS Total Fund Apr-84 9.7% 10.8% 6.3% 8.9% 10.9%
Performance Benchmark 7.5% 9.8% 5.6% 8.6% 10.8%
CPI + 4.0% 8.3% 7.4% 6.7% 6.6% 7.1%1 Current Policy Benchmark is compromised of 14% LB Aggregate, 13% LB Government/Credit, 10% LB U.S. TIPS, 15% MSCI EAFE, 5% Russell
2000, 31.4% S&P 1500 Composite (Price Only), 6.6% S&P 500, 3% 3-Month Treasury Bill, and 2% LB High Yield Corporate Index.
The KRS insurance fund also posted a strong return for the fi scal year ended June 30, 2006. The portfolio returned 12.4% compared to the benchmark and actuarially assumed rates of return of 10.0% and 8.25%, respectively. The above benchmark performance of the insurance fund was also due in large part to higher than benchmark allocations to international equities and above benchmark performance from the domestic equity asset class.
Insurance Total Fund Return
Inception Date Fiscal Year 3-Year 5-Year 10-Year Inception
KRS Total Insurance Fund Apr-84 12.4% 13.7% 6.3% 8.6% 9.0%
Performance Benchmark 10.0% 11.9% 4.2% 8.1% 8.8%
CPI + 4.0% 8.3% 7.4% 6.7% 6.6% 7.1% 1 Current Policy Benchmark is compromised of 10% LB U.S. TIPS, 20% MSCI EAFE, 64% S&P 1500 Composite (Price Only), 5% 3-Month Treasury Bill, and 1% LB
High Yield Corporate Index.
Long-Term Results:The 10-years ended June 30, 2006, provided returns that by historical measures were quite good. The KRS pension fund portfolio earned an annualized total return of 8.9 %. As shown in the investment results table, the KRS pension fund return remains ahead of or in line with its benchmark for each of the time periods presented. The consistent, above benchmark performance is illustrated in the following charts, which show the growth of $1,000 invested in the KRS pension portfolio, its policy portfolio, and its actuarial objective (CPI + 4%) over the past 10 years.
1 All return calculations are made by the custody bank and were prepared using a time-weighted rate of return.

81
Investment Section
The ending points at June 30, 2006, indicate that the $1,000 would have grown to $2,389, while the same $1,000 invested in the policy portfolio and actuarial objective would have grown to $2,324 and $1,893, respectively. The KRS insurance fund also enjoyed a strong period of growth over the past 10 years, earning an 8.6% return for the 10-year period ending June 30, 2006. As shown in the accompanying insurance investment results table, the KRS insurance fund returns is above benchmark for each of the time periods presented. The consistent, above benchmark performance is best illustrated by the growth of $1,000 invested in the KRS insurance portfolio, its policy portfolio, and its actuarial objective (CPI + 4%) over the past 10 years.
The ending points at June 30, 2006, indicate that the $1,000 would have grown to $2,291, while the same $1,000 invested in the policy portfolio and its actuarial objective would have grown to $2,180 and $1,893, respectively.
Investment Results
1996 20062005200420032002200120001999199819971,000
2,200
2,000
1,800
1,600
1,400
1,200
Total Pension Fund Growth of $1,000
2,400$2,389
$2,324
$1,893
1996 1997 1998 1999 2000 2001 2002 2003 2004 2005 20061996 20062005200420032002200120001999199819971,000
2,200
2,000
1,800
1,600
1,400
1,200
Total Insurance Fund Growth of $1,0002,400
$2,291
$2,180
$1,893
KRS Pension Fund
CPI + 4.0%Performance Benchmark
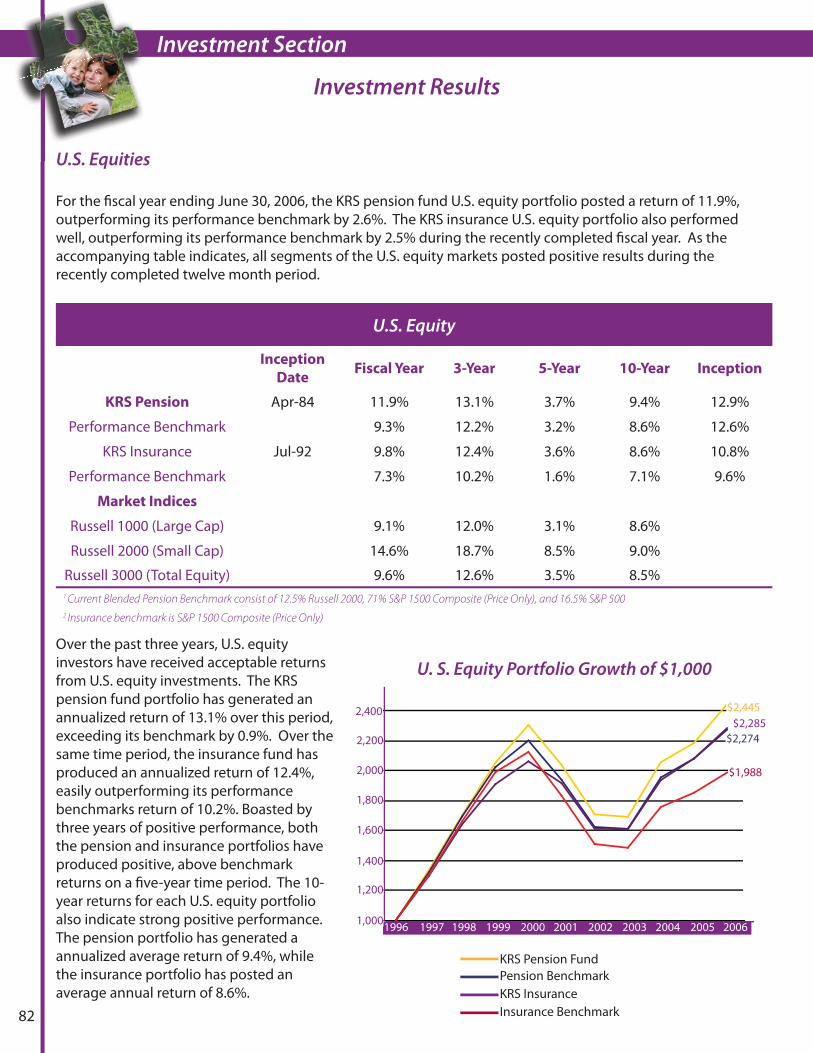
Investment Section
82
U.S. Equities
For the fi scal year ending June 30, 2006, the KRS pension fund U.S. equity portfolio posted a return of 11.9%, outperforming its performance benchmark by 2.6%. The KRS insurance U.S. equity portfolio also performed well, outperforming its performance benchmark by 2.5% during the recently completed fi scal year. As the accompanying table indicates, all segments of the U.S. equity markets posted positive results during the recently completed twelve month period.
U.S. Equity
Inception
DateFiscal Year 3-Year 5-Year 10-Year Inception
KRS Pension Apr-84 11.9% 13.1% 3.7% 9.4% 12.9%
Performance Benchmark 9.3% 12.2% 3.2% 8.6% 12.6%
KRS Insurance Jul-92 9.8% 12.4% 3.6% 8.6% 10.8%
Performance Benchmark 7.3% 10.2% 1.6% 7.1% 9.6%
Market Indices
Russell 1000 (Large Cap) 9.1% 12.0% 3.1% 8.6%
Russell 2000 (Small Cap) 14.6% 18.7% 8.5% 9.0%
Russell 3000 (Total Equity) 9.6% 12.6% 3.5% 8.5% 1 Current Blended Pension Benchmark consist of 12.5% Russell 2000, 71% S&P 1500 Composite (Price Only), and 16.5% S&P 500
2 Insurance benchmark is S&P 1500 Composite (Price Only)
Over the past three years, U.S. equity investors have received acceptable returns from U.S. equity investments. The KRS pension fund portfolio has generated an annualized return of 13.1% over this period, exceeding its benchmark by 0.9%. Over the same time period, the insurance fund has produced an annualized return of 12.4%, easily outperforming its performance benchmarks return of 10.2%. Boasted by three years of positive performance, both the pension and insurance portfolios have produced positive, above benchmark returns on a fi ve-year time period. The 10-year returns for each U.S. equity portfolio also indicate strong positive performance. The pension portfolio has generated a annualized average return of 9.4%, while the insurance portfolio has posted an average annual return of 8.6%.
Investment Results
1996 20062005200420032002200120001999199819971,000
2,200
2,000
1,800
1,600
1,400
1,200
U. S. Equity Portfolio Growth of $1,000
2,400 $2,445
$2,274$2,285
$1,988
KRS Pension Fund
KRS InsurancePension Benchmark
Insurance Benchmark
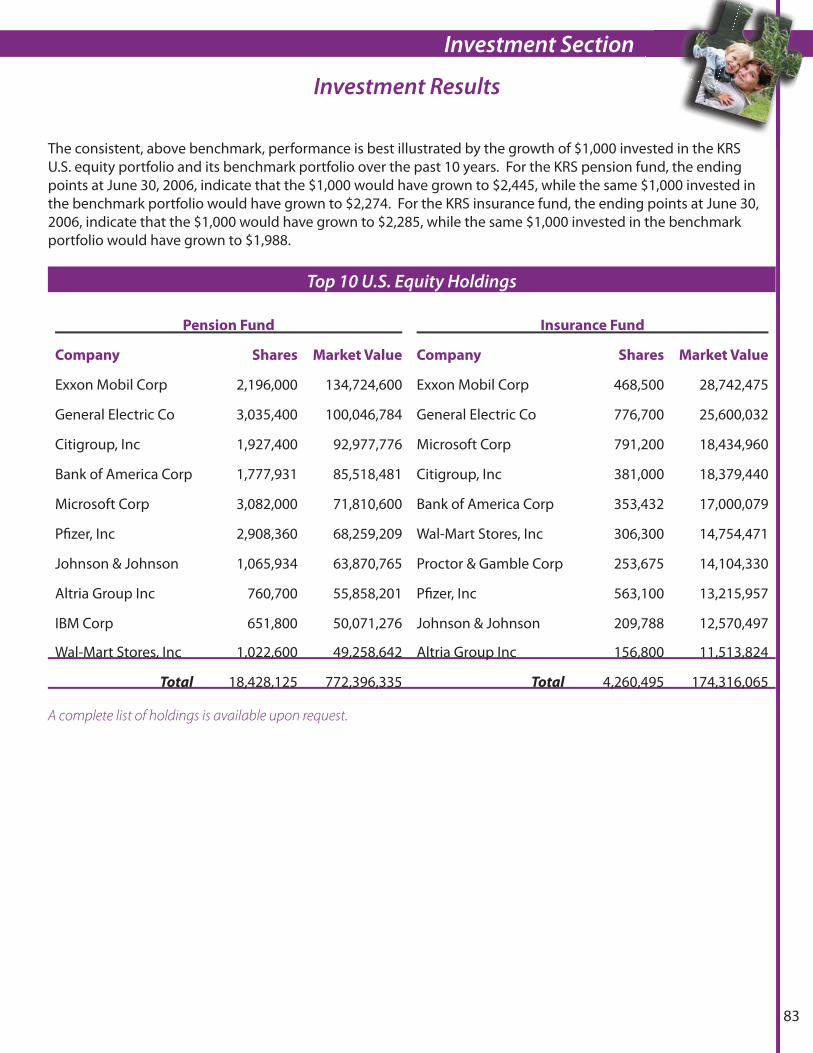
83
Investment Section
Investment Results
The consistent, above benchmark, performance is best illustrated by the growth of $1,000 invested in the KRS U.S. equity portfolio and its benchmark portfolio over the past 10 years. For the KRS pension fund, the ending points at June 30, 2006, indicate that the $1,000 would have grown to $2,445, while the same $1,000 invested in the benchmark portfolio would have grown to $2,274. For the KRS insurance fund, the ending points at June 30, 2006, indicate that the $1,000 would have grown to $2,285, while the same $1,000 invested in the benchmark portfolio would have grown to $1,988.
Top 10 U.S. Equity Holdings
Pension Fund Insurance Fund
Company Shares Market Value Company Shares Market Value
Exxon Mobil Corp 2,196,000 134,724,600 Exxon Mobil Corp 468,500 28,742,475
General Electric Co 3,035,400 100,046,784 General Electric Co 776,700 25,600,032
Citigroup, Inc 1,927,400 92,977,776 Microsoft Corp 791,200 18,434,960
Bank of America Corp 1,777,931 85,518,481 Citigroup, Inc 381,000 18,379,440
Microsoft Corp 3,082,000 71,810,600 Bank of America Corp 353,432 17,000,079
Pfi zer, Inc 2,908,360 68,259,209 Wal-Mart Stores, Inc 306,300 14,754,471
Johnson & Johnson 1,065,934 63,870,765 Proctor & Gamble Corp 253,675 14,104,330
Altria Group Inc 760,700 55,858,201 Pfi zer, Inc 563,100 13,215,957
IBM Corp 651,800 50,071,276 Johnson & Johnson 209,788 12,570,497
Wal-Mart Stores, Inc 1,022,600 49,258,642 Altria Group Inc 156,800 11,513,824
Total 18,428,125 772,396,335 Total 4,260,495 174,316,065
A complete list of holdings is available upon request.

Investment Section
84
Investment Results
International Equities
For the fi scal year ending June 30, 2006, the KRS pension fund international equity portfolio returned 26.5%, trailing its performance benchmark, the MSCI EAFE Index, by 0.6%. The KRS insurance international equity portfolio, however, outperformed the MSCI EAFE Index by 0.4% during the same twelve month period, posting a return of 27.5%. As the accompanying table indicates, both developed and emerging international equity markets posted strong positive results during the recently completed twelve month period.
International Equity Inception Date Fiscal Year 3-Year 5-Year Inception
KRS Pension Jul-00 26.5% 22.5% 8.9% 1.7%
Performance Benchmark 27.1% 24.1% 11.1% 2.9%
KRS Insurance Jul-00 27.5% 23.8% 10.8% 3.4%
Performance Benchmark 27.1% 24.4% 10.4% 3.9%
Market Indices
MSCI EAFE 27.1% 24.4% 10.4% 1.0%
MSCI Emerging Markets 35.9% 34.8% 21.5% 9.7%
MSCI ACWI Ex US 28.4% 25.8% 11.9% 2.0%
2 Pension and Insurance benchmark is the MSCI EAFE Index
Over the past three years, international equity investors have received very good returns from the asset class. The KRS pension fund portfolio has generated an annualized average return of 22.5% over this three-year period, which has fallen short of the MSCI EAFE Index return of 24.1%, by 1.6%. The insurance fund has also trailed the annualized return of the index, generating an average return of 23.8%. The Systems began its international equity program fi ve years ago in July 2000. Since inception, both portfolios have underperformed their benchmark.
$400
$500
$600
$700
$800
$900
$1,000
$1,100
$1,200
$1,300
$1,400
2006200520042003200220012000$400
$1,200
$1,000
$800
$700
$600
$500
Non U. S. Equity Portfolio Growth of $1,000$1,400
$1,104
$1,185$1,225$1,260
KRS Pension Fund
KRS InsurancePension Benchmark
Insurance Benchmark
$900
$1,100
$1,300
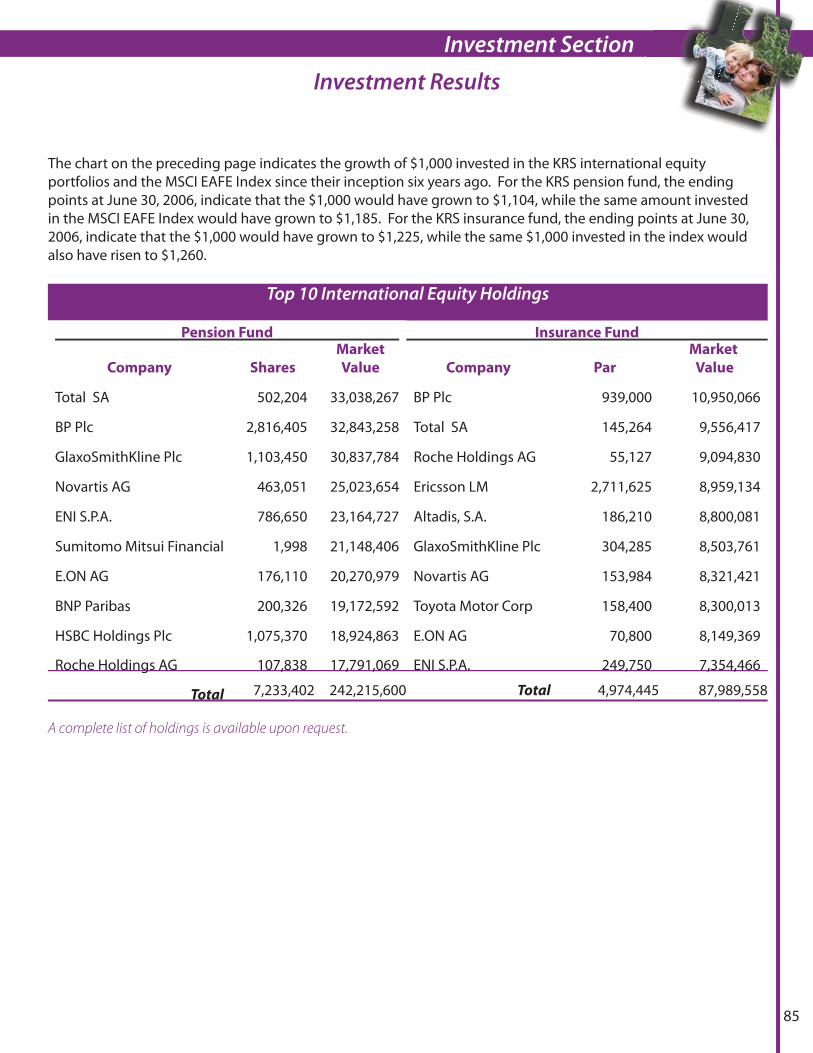
85
Investment Section
The chart on the preceding page indicates the growth of $1,000 invested in the KRS international equity portfolios and the MSCI EAFE Index since their inception six years ago. For the KRS pension fund, the ending points at June 30, 2006, indicate that the $1,000 would have grown to $1,104, while the same amount invested in the MSCI EAFE Index would have grown to $1,185. For the KRS insurance fund, the ending points at June 30, 2006, indicate that the $1,000 would have grown to $1,225, while the same $1,000 invested in the index would also have risen to $1,260.
Top 10 International Equity Holdings
Pension Fund Insurance Fund
Company Shares
Market
Value Company Par
Market
Value
Total SA 502,204 33,038,267 BP Plc 939,000 10,950,066
BP Plc 2,816,405 32,843,258 Total SA 145,264 9,556,417
GlaxoSmithKline Plc 1,103,450 30,837,784 Roche Holdings AG 55,127 9,094,830
Novartis AG 463,051 25,023,654 Ericsson LM 2,711,625 8,959,134
ENI S.P.A. 786,650 23,164,727 Altadis, S.A. 186,210 8,800,081
Sumitomo Mitsui Financial 1,998 21,148,406 GlaxoSmithKline Plc 304,285 8,503,761
E.ON AG 176,110 20,270,979 Novartis AG 153,984 8,321,421
BNP Paribas 200,326 19,172,592 Toyota Motor Corp 158,400 8,300,013
HSBC Holdings Plc 1,075,370 18,924,863 E.ON AG 70,800 8,149,369
Roche Holdings AG 107,838 17,791,069 ENI S.P.A. 249,750 7,354,466
Total 7,233,402 242,215,600 Total 4,974,445 87,989,558
A complete list of holdings is available upon request.
Investment Results
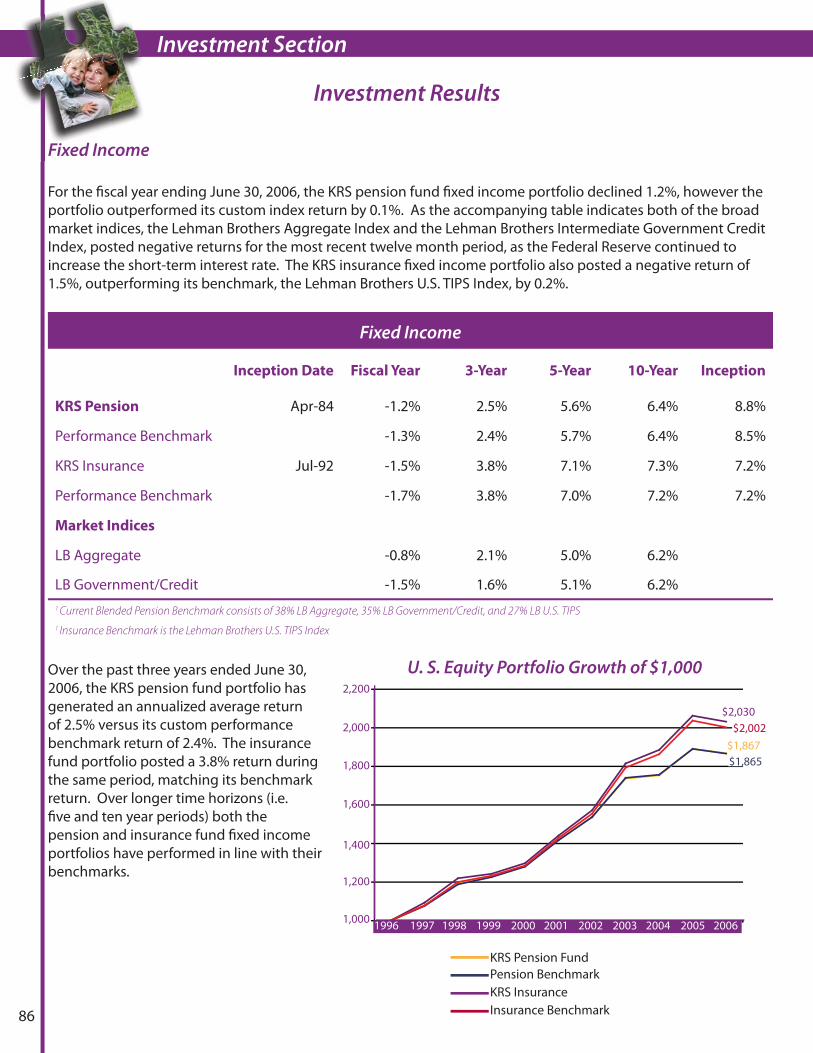
Investment Section
86
Fixed Income
For the fi scal year ending June 30, 2006, the KRS pension fund fi xed income portfolio declined 1.2%, however the portfolio outperformed its custom index return by 0.1%. As the accompanying table indicates both of the broad market indices, the Lehman Brothers Aggregate Index and the Lehman Brothers Intermediate Government Credit Index, posted negative returns for the most recent twelve month period, as the Federal Reserve continued to increase the short-term interest rate. The KRS insurance fi xed income portfolio also posted a negative return of 1.5%, outperforming its benchmark, the Lehman Brothers U.S. TIPS Index, by 0.2%.
Fixed Income
Inception Date Fiscal Year 3-Year 5-Year 10-Year Inception
KRS Pension Apr-84 -1.2% 2.5% 5.6% 6.4% 8.8%
Performance Benchmark -1.3% 2.4% 5.7% 6.4% 8.5%
KRS Insurance Jul-92 -1.5% 3.8% 7.1% 7.3% 7.2%
Performance Benchmark -1.7% 3.8% 7.0% 7.2% 7.2%
Market Indices
LB Aggregate -0.8% 2.1% 5.0% 6.2%
LB Government/Credit -1.5% 1.6% 5.1% 6.2% 1 Current Blended Pension Benchmark consists of 38% LB Aggregate, 35% LB Government/Credit, and 27% LB U.S. TIPS
1 Insurance Benchmark is the Lehman Brothers U.S. TIPS Index
Over the past three years ended June 30, 2006, the KRS pension fund portfolio has generated an annualized average return of 2.5% versus its custom performance benchmark return of 2.4%. The insurance fund portfolio posted a 3.8% return during the same period, matching its benchmark return. Over longer time horizons (i.e. fi ve and ten year periods) both the pension and insurance fund fi xed income portfolios have performed in line with their benchmarks.
Investment Results
$1,000
$1,200
$1,400
$1,600
$1,800
$2,000
$2,200
1996 1997 1998 1999 2000 2001 2002 2003 2004 2005 20061996 20062005200420032002200120001999199819971,000
2,200
2,000
1,800
1,600
1,400
1,200
U. S. Equity Portfolio Growth of $1,000
$1,867$1,865
$2,030$2,002
KRS Pension Fund
KRS InsurancePension Benchmark
Insurance Benchmark

87
Investment Section
Investment Results
The chart on the preceding page shows the growth of $1,000 invested in the KRS fi xed income portfolios and their benchmarks over the past ten years. For the KRS pension fund, the ending points at June 30, 2006, indicate that the $1,000 would have grown to $1,867, while the same $1,000 invested in the benchmark portfolio would have grown to $1,865. For the KRS insurance fund, the ending points at June 30, 2006, indicate that the $1,000 would have grown to $2,030 while the same $1,000 invested in the benchmark portfolio would have grown to $2,002.
Top 10 Fixed Income Holdings
Pension Fund Insurance Fund
Company Par Value
Market
Value Company Par Value
Market
Value
US TSY BD INFL Index 3.625 Due 4/15/28 65,500,000 96,801,733
US TSY NT INFL Index 0.875 Due 4/15/10 18,550,000
18,606,771
US TSY BD INFL Index 3.875 Due 4/15/29 63,367,000 96,077,312
US TSY BD INFL Index 3.875 Due 4/15/29 11,700,000
17,739,589
US TSY NT INFL Index 2.000 Due 1/15/14 85,750,000 90,235,390
US TSY BD INFL Index 2.375 Due 1/15/25 16,850,000
17,526,122
US TSY NT INFL Index 3.000 Due 7/15/12 76,850,000 88,663,300
US TSY NT INFL Index 3.000 Due 7/15/12 13,450,000
15,517,520
US TSY NT INFL Index 1.875 Due 7/15/13 83,600,000 88,085,664
US TSY NT INFL Index 2.000 Due 1/15/14 13,500,000
14,206,155
US TSY NT INFL Index 0.875 Due 4/15/10 84,700,000 84,959,220
US TSY NT INFL Index 1.875 Due 7/15/13 13,300,000
14,013,628
US TSY NT INFL Index 2.149 Due 7/15/14 81,000,000 83,360,938
US TSY BD INFL Index 3.625 Due 4/15/28 9,315,000
13,766,537
US TSY NT INFL Index 1.625 Due 1/15/15 80,000,000 78,678,467
US TSY NT INFL Index 2.149 Due 7/15/14 12,625,000
12,992,986
US TSY NT INFL Index 3.625 Due 1/15/08 59,400,000 75,338,904
US TSY NT INFL Index 3.625 Due 1/15/08 9,950,000
12,619,901
US TSY BD INFL Index 2.375 Due 1/15/25 70,485,000 73,313,276
US TSY NT INFL Index 1.625 Due 1/15/15 12,500,000
12,293,510
Total 750,652,000 855,514,203 Total 131,740,000 149,282,718
A complete list of holdings is available upon request.
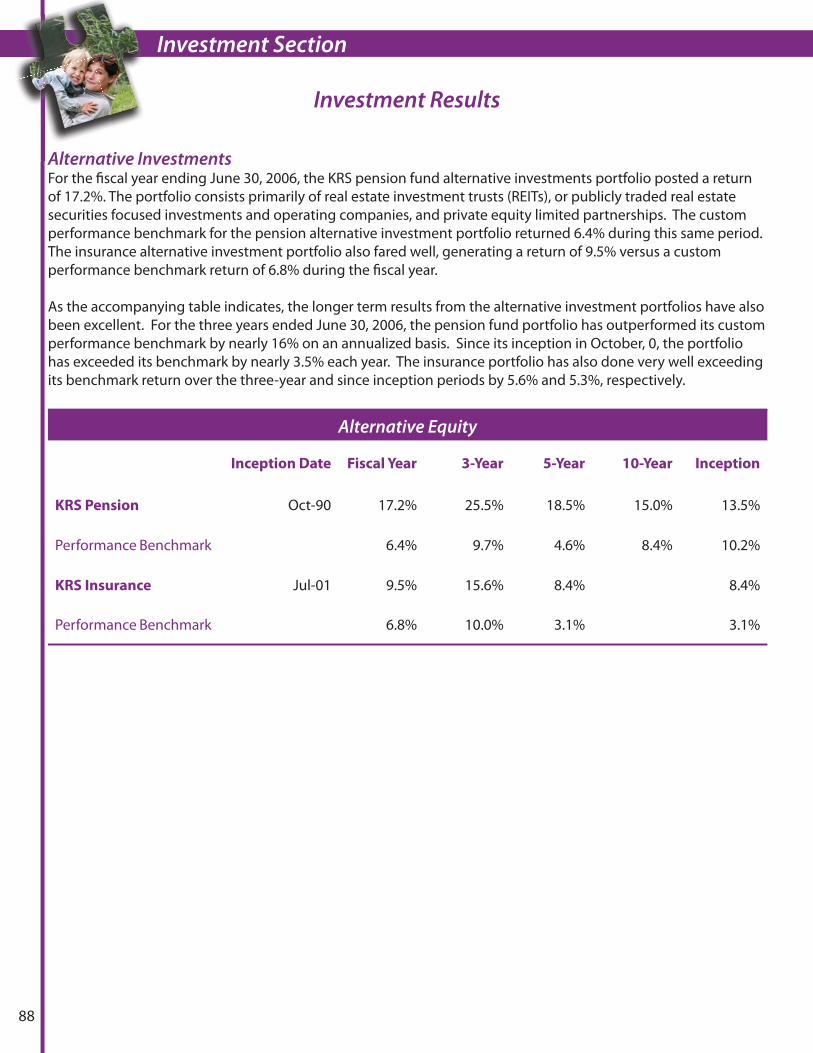
Investment Section
88
Alternative InvestmentsFor the fi scal year ending June 30, 2006, the KRS pension fund alternative investments portfolio posted a return of 17.2%. The portfolio consists primarily of real estate investment trusts (REITs), or publicly traded real estate securities focused investments and operating companies, and private equity limited partnerships. The custom performance benchmark for the pension alternative investment portfolio returned 6.4% during this same period. The insurance alternative investment portfolio also fared well, generating a return of 9.5% versus a custom performance benchmark return of 6.8% during the fi scal year.
As the accompanying table indicates, the longer term results from the alternative investment portfolios have also been excellent. For the three years ended June 30, 2006, the pension fund portfolio has outperformed its custom performance benchmark by nearly 16% on an annualized basis. Since its inception in October, 0, the portfolio has exceeded its benchmark by nearly 3.5% each year. The insurance portfolio has also done very well exceeding its benchmark return over the three-year and since inception periods by 5.6% and 5.3%, respectively.
Alternative Equity
Inception Date Fiscal Year 3-Year 5-Year 10-Year Inception
KRS Pension Oct-90 17.2% 25.5% 18.5% 15.0% 13.5%
Performance Benchmark 6.4% 9.7% 4.6% 8.4% 10.2%
KRS Insurance Jul-01 9.5% 15.6% 8.4% 8.4%
Performance Benchmark 6.8% 10.0% 3.1% 3.1%
Investment Results
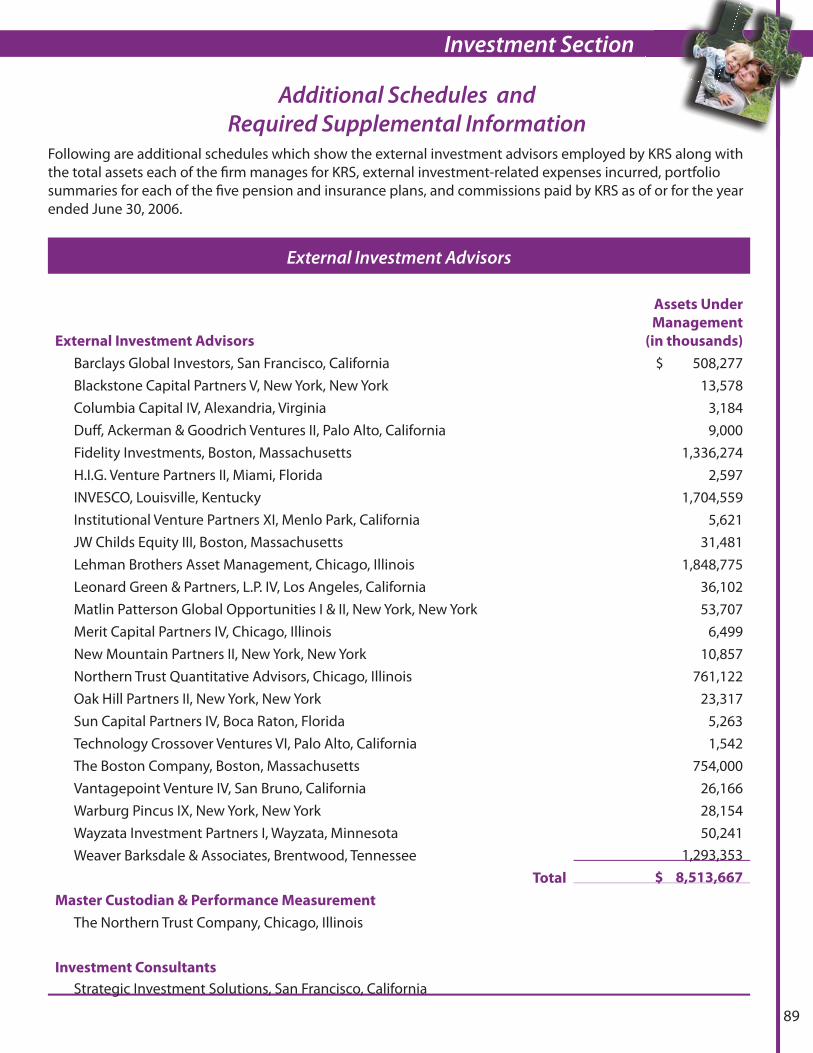
89
Investment Section
Following are additional schedules which show the external investment advisors employed by KRS along with the total assets each of the fi rm manages for KRS, external investment-related expenses incurred, portfolio summaries for each of the fi ve pension and insurance plans, and commissions paid by KRS as of or for the year ended June 30, 2006.
External Investment Advisors
External Investment Advisors
Assets Under
Management
(in thousands)
Barclays Global Investors, San Francisco, California $ 508,277 Blackstone Capital Partners V, New York, New York 13,578 Columbia Capital IV, Alexandria, Virginia 3,184 Duff , Ackerman & Goodrich Ventures II, Palo Alto, California 9,000 Fidelity Investments, Boston, Massachusetts 1,336,274 H.I.G. Venture Partners II, Miami, Florida 2,597 INVESCO, Louisville, Kentucky 1,704,559 Institutional Venture Partners XI, Menlo Park, California 5,621 JW Childs Equity III, Boston, Massachusetts 31,481 Lehman Brothers Asset Management, Chicago, Illinois 1,848,775 Leonard Green & Partners, L.P. IV, Los Angeles, California 36,102 Matlin Patterson Global Opportunities I & II, New York, New York 53,707 Merit Capital Partners IV, Chicago, Illinois 6,499 New Mountain Partners II, New York, New York 10,857 Northern Trust Quantitative Advisors, Chicago, Illinois 761,122 Oak Hill Partners II, New York, New York 23,317 Sun Capital Partners IV, Boca Raton, Florida 5,263 Technology Crossover Ventures VI, Palo Alto, California 1,542 The Boston Company, Boston, Massachusetts 754,000 Vantagepoint Venture IV, San Bruno, California 26,166 Warburg Pincus IX, New York, New York 28,154 Wayzata Investment Partners I, Wayzata, Minnesota 50,241 Weaver Barksdale & Associates, Brentwood, Tennessee 1,293,353
Total $ 8,513,667
Master Custodian & Performance Measurement
The Northern Trust Company, Chicago, Illinois
Investment Consultants
Strategic Investment Solutions, San Francisco, California
Additional Schedules and Required Supplemental Information
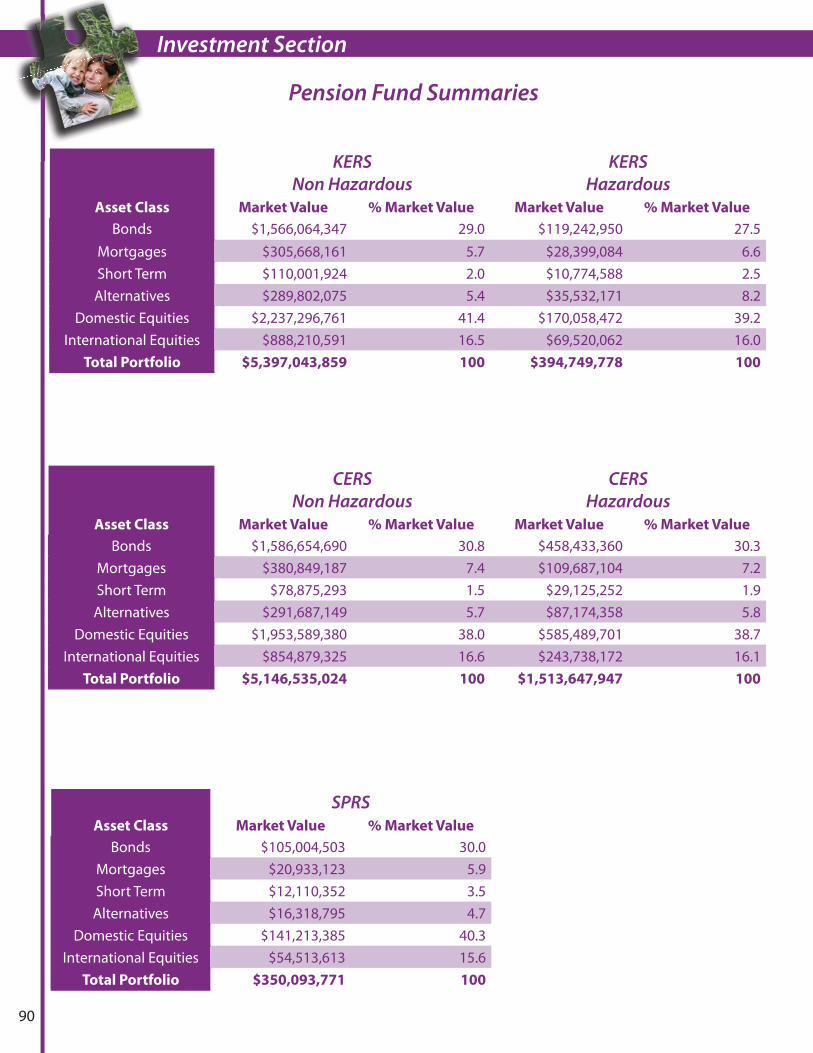
Investment Section
90
KERS Non Hazardous
KERS Hazardous
Asset Class Market Value % Market Value Market Value % Market Value
Bonds $1,566,064,347 29.0 $119,242,950 27.5Mortgages $305,668,161 5.7 $28,399,084 6.6Short Term $110,001,924 2.0 $10,774,588 2.5
Alternatives $289,802,075 5.4 $35,532,171 8.2Domestic Equities $2,237,296,761 41.4 $170,058,472 39.2
International Equities $888,210,591 16.5 $69,520,062 16.0Total Portfolio $5,397,043,859 100 $394,749,778 100
CERS Non Hazardous
CERS Hazardous
Asset Class Market Value % Market Value Market Value % Market Value
Bonds $1,586,654,690 30.8 $458,433,360 30.3Mortgages $380,849,187 7.4 $109,687,104 7.2Short Term $78,875,293 1.5 $29,125,252 1.9
Alternatives $291,687,149 5.7 $87,174,358 5.8Domestic Equities $1,953,589,380 38.0 $585,489,701 38.7
International Equities $854,879,325 16.6 $243,738,172 16.1Total Portfolio $5,146,535,024 100 $1,513,647,947 100
SPRSAsset Class Market Value % Market Value
Bonds $105,004,503 30.0Mortgages $20,933,123 5.9Short Term $12,110,352 3.5
Alternatives $16,318,795 4.7Domestic Equities $141,213,385 40.3
International Equities $54,513,613 15.6Total Portfolio $350,093,771 100
Pension Fund Summaries

91
Investment Section
CERS Non Hazardous
CERS Hazardous
Asset Class Market Value % Market Value Market Value % Market Value
Bonds $80,958,005 10.2 $46,358,538 10.7Short Term $68,375,249 8.6 $35,090,880 9.9
Alternatives $39,254,576 4.9 $16,505,552 4.6Domestic Equities $439,904,632 55.3 $191,608,685 53.8
International Equities $166,613,247 21.0 $75,503,675 21.2Total Portfolio $795,105,709 100 $356,129,443 100
SPRSAsset Class Market Value % Market Value
Bonds $11,297,649 11.4Short Term $8,388,693 8.5
Alternatives $5,296,789 5.4Domestic Equities $52,686,088 53.3
International Equities $21,265,630 21.4Total Portfolio $98,934,849 100
KERS Non Hazardous
KERS Hazardous
Asset Class Market Value % Market Value Market Value % Market Value
Bonds $61,782,964 9.8 $20,993,841 9.4Short Term $99,492,865 15.8 $20,823,474 9.4
Alternatives $32,336,211 5.2 $11,131,443 5.0Domestic Equities $322,559,454 51.3 $118,626,312 53.4
International Equities $112,488,354 17.9 $50,682,057 22.8Total Portfolio $628,659,848 100 $222,257,127 100
Insuance Fund Summaries
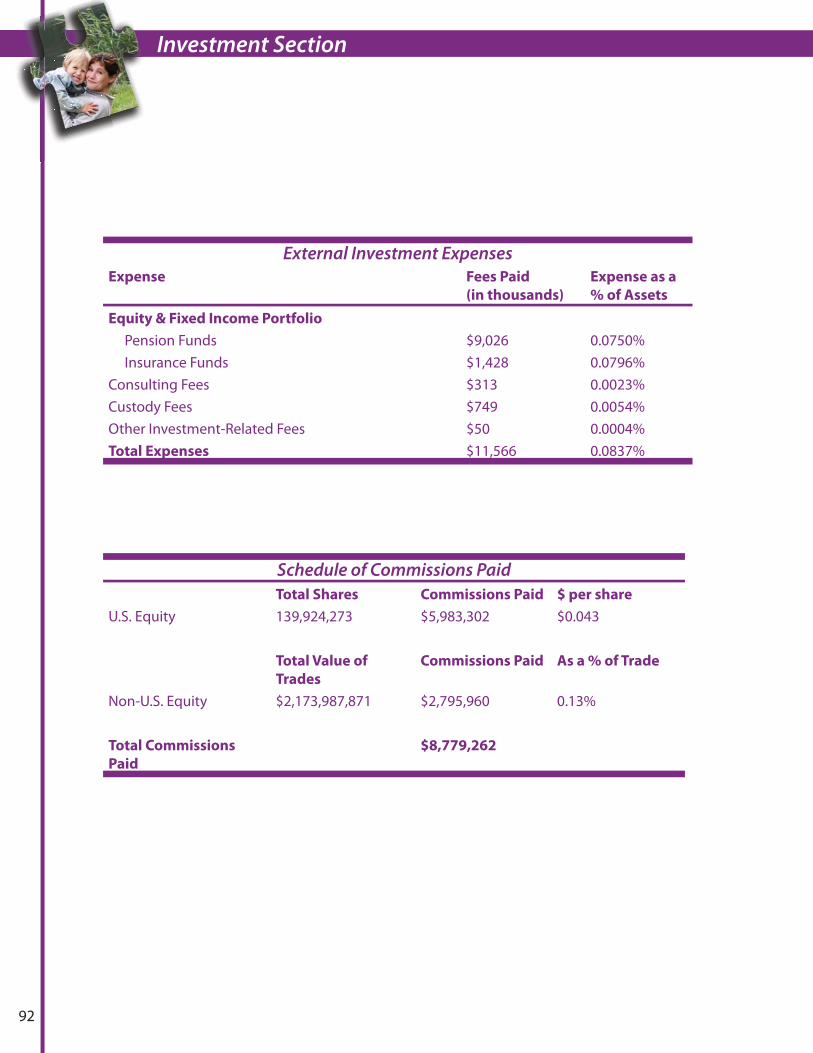
Investment Section
92
External Investment ExpensesExpense Fees Paid
(in thousands)
Expense as a
% of Assets
Equity & Fixed Income Portfolio
Pension Funds $9,026 0.0750% Insurance Funds $1,428 0.0796%Consulting Fees $313 0.0023%Custody Fees $749 0.0054%Other Investment-Related Fees $50 0.0004%Total Expenses $11,566 0.0837%
Schedule of Commissions PaidTotal Shares Commissions Paid $ per share
U.S. Equity 139,924,273 $5,983,302 $0.043
Total Value of
Trades
Commissions Paid As a % of Trade
Non-U.S. Equity $2,173,987,871 $2,795,960 0.13%
Total Commissions
Paid
$8,779,262
Actuarial Section
Certifi cation 94
Summary of Actuarial Assumptions and Methods 96
Reccommended Employer Contribution Rates 101
Summary of Actuarial and Unfunded Liabilities 104
Analysis of Financial Experience 109
Solvency Test 114
Summary of Active Member Valuation Data 119
Summary of Retired Member Valuation Data 121
Summary of Benefi t Provisions 123
Changes in Benefi t Provisions 126

Actuarial Section
94
October 31, 2006
Board of TrusteesKentucky Retirement SystemsPerimeter Park West1260 Louisville RoadFrankfort, Kentucky 40601
Subject: Certifi cation of Actuarial Results
Dear Members of the Board:
The fi ftieth annual actuarial valuation of the Kentucky Employees Retirement System, the forty-seventh annual actuarial valuation of the County Employees Retirement System, and the forty-eighth annual actuarial valuation of the State Police Retirement System have been completed and the reports prepared. These reports describe the current actuarial condition of the Kentucky Retirement Systems (KRS), determine the calculated employer contribution rates, and analyze fl uctuations in these contribution rates.
Under state statute, the Board of Trustees must approve the employer contribution rate for the upcoming fi scal year based upon the results of the most recent annual valuation. These rates are determined actuarially based upon current membership data, plan provisions, and the assumptions and funding policies adopted by the KRS Board. Employer contribution rates become eff ective one year after the valuation date. The recently completed June 30, 2006 actuarial valuation will be used by the Board of Trustees to certify the employer contribution rates for the fi scal year beginning July 1, 2007 and ending June 30, 2008.
Funding Objectives & Policies
For each retirement system, KRS administers both a pension and insurance fund to provide monthly retirement allowances and retiree insurance benefi ts respectively. The total employer contribution rate is comprised of a contribution to each fund.
Relative to the pension fund, a contribution rate has been established which consists of the normal cost and an amortization payment on the unfunded accrued liability (UAL). The normal cost is expected to remain level as a percent of payroll in future years. The amortization of any UAL is made over 30 years from the establishment of the amortization base using a level percent of payroll amortization method. Each year any actuarial gains or losses, along with any other changes in the actuarial liability (such as the retiree COLA or other benefi t improvements) are established as a new amortization base to be amortized over the following 30 years.
Overall, the total contribution for the pension fund is expected to remain stable as a percentage of payroll over future years in the absence of benefi t improvements and material experience gains or losses. However, the current valuation contribution rate does not anticipate any future cost of living increases to benefi t recipients as required by statute. Should these cost of living increases occur in the future, the contribution rate for the pension fund will be expected to increase as a percentage of payroll in the absence of material aggregate experience gains.
Relative to the insurance fund, the Board’s funding objective is to establish a contribution rate which consists of the normal cost and an amortization payment on the UAL over a 30 year period. Beginning with the June 30, 2006 valuation, the assumptions and methods used are to meet the requirements of GASB Statement No. 43. Going forward, new UAL bases will be established at each valuation date and will be amortized over the following 30 years.
Administrative expenses of the plans are also included as part of the total pension fund contribution. This portion of the funding is expected to remain stable as a percentage of payroll over future years.
Progress towards Realization of Funding Objectives
The progress towards achieving the intended funding objectives, both relative to the pension and insurance funds, can be measured by the relationship of actuarial assets of each fund to the actuarial accrued liabilities. This relationship is known as the funding level and in the absence of benefi t improvements, should increase over time until it reaches 100%.3In recent years, funding levels for the pension funds have fallen dramatically in response to investment returns less than the actuarially assumed rate, higher than anticipated retirement rates, the 2006 assumption changes, and
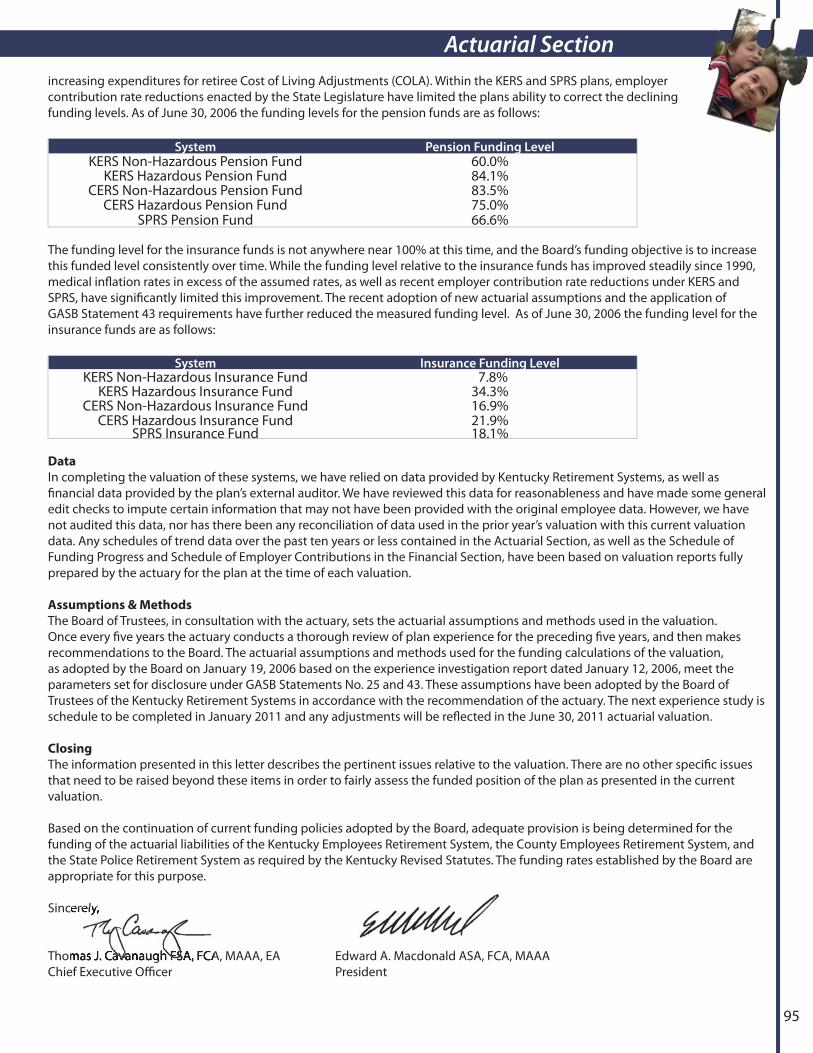
95
Actuarial Sectionincreasing expenditures for retiree Cost of Living Adjustments (COLA). Within the KERS and SPRS plans, employer contribution rate reductions enacted by the State Legislature have limited the plans ability to correct the declining funding levels. As of June 30, 2006 the funding levels for the pension funds are as follows:
System Pension Funding LevelKERS Non-Hazardous Pension Fund 60.0%
KERS Hazardous Pension Fund 84.1%CERS Non-Hazardous Pension Fund 83.5%
CERS Hazardous Pension Fund 75.0%SPRS Pension Fund 66.6%
System Pension Funding Level
The funding level for the insurance funds is not anywhere near 100% at this time, and the Board’s funding objective is to increase this funded level consistently over time. While the funding level relative to the insurance funds has improved steadily since 1990, medical infl ation rates in excess of the assumed rates, as well as recent employer contribution rate reductions under KERS and SPRS, have signifi cantly limited this improvement. The recent adoption of new actuarial assumptions and the application of GASB Statement 43 requirements have further reduced the measured funding level. As of June 30, 2006 the funding level for the insurance funds are as follows:
System Insurance Funding LevelKERS Non-Hazardous Insurance Fund 7.8%
KERS Hazardous Insurance Fund 34.3%CERS Non-Hazardous Insurance Fund 16.9%
CERS Hazardous Insurance Fund 21.9%SPRS Insurance Fund 18.1%
Data
In completing the valuation of these systems, we have relied on data provided by Kentucky Retirement Systems, as well as fi nancial data provided by the plan’s external auditor. We have reviewed this data for reasonableness and have made some general edit checks to impute certain information that may not have been provided with the original employee data. However, we have not audited this data, nor has there been any reconciliation of data used in the prior year’s valuation with this current valuation data. Any schedules of trend data over the past ten years or less contained in the Actuarial Section, as well as the Schedule of Funding Progress and Schedule of Employer Contributions in the Financial Section, have been based on valuation reports fully prepared by the actuary for the plan at the time of each valuation.
Assumptions & Methods
The Board of Trustees, in consultation with the actuary, sets the actuarial assumptions and methods used in the valuation. Once every fi ve years the actuary conducts a thorough review of plan experience for the preceding fi ve years, and then makes recommendations to the Board. The actuarial assumptions and methods used for the funding calculations of the valuation, as adopted by the Board on January 19, 2006 based on the experience investigation report dated January 12, 2006, meet the parameters set for disclosure under GASB Statements No. 25 and 43. These assumptions have been adopted by the Board of Trustees of the Kentucky Retirement Systems in accordance with the recommendation of the actuary. The next experience study is schedule to be completed in January 2011 and any adjustments will be refl ected in the June 30, 2011 actuarial valuation.
Closing
The information presented in this letter describes the pertinent issues relative to the valuation. There are no other specifi c issues that need to be raised beyond these items in order to fairly assess the funded position of the plan as presented in the current valuation.
Based on the continuation of current funding policies adopted by the Board, adequate provision is being determined for the funding of the actuarial liabilities of the Kentucky Employees Retirement System, the County Employees Retirement System, and the State Police Retirement System as required by the Kentucky Revised Statutes. The funding rates established by the Board are appropriate for this purpose.
Sincerely,
Thomas J. Cavanaugh FSA, FCA, MAAA, EA Edward A. Macdonald ASA, FCA, MAAAChief Executive Offi cer President
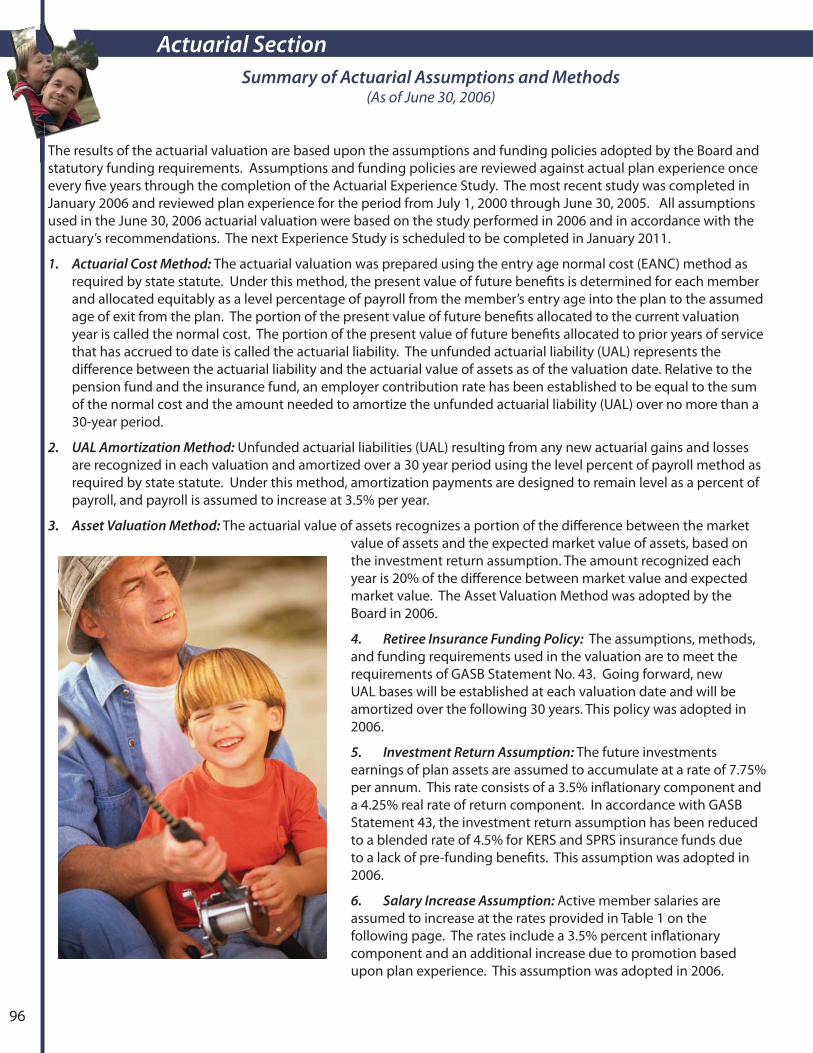
Actuarial Section
96
Summary of Actuarial Assumptions and Methods(As of June 30, 2006)
The results of the actuarial valuation are based upon the assumptions and funding policies adopted by the Board and statutory funding requirements. Assumptions and funding policies are reviewed against actual plan experience once every fi ve years through the completion of the Actuarial Experience Study. The most recent study was completed in January 2006 and reviewed plan experience for the period from July 1, 2000 through June 30, 2005. All assumptions used in the June 30, 2006 actuarial valuation were based on the study performed in 2006 and in accordance with the actuary’s recommendations. The next Experience Study is scheduled to be completed in January 2011.
1. Actuarial Cost Method: The actuarial valuation was prepared using the entry age normal cost (EANC) method as required by state statute. Under this method, the present value of future benefi ts is determined for each member and allocated equitably as a level percentage of payroll from the member’s entry age into the plan to the assumed age of exit from the plan. The portion of the present value of future benefi ts allocated to the current valuation year is called the normal cost. The portion of the present value of future benefi ts allocated to prior years of service that has accrued to date is called the actuarial liability. The unfunded actuarial liability (UAL) represents the diff erence between the actuarial liability and the actuarial value of assets as of the valuation date. Relative to the pension fund and the insurance fund, an employer contribution rate has been established to be equal to the sum of the normal cost and the amount needed to amortize the unfunded actuarial liability (UAL) over no more than a 30-year period.
2. UAL Amortization Method: Unfunded actuarial liabilities (UAL) resulting from any new actuarial gains and losses are recognized in each valuation and amortized over a 30 year period using the level percent of payroll method as required by state statute. Under this method, amortization payments are designed to remain level as a percent of payroll, and payroll is assumed to increase at 3.5% per year.
3. Asset Valuation Method: The actuarial value of assets recognizes a portion of the diff erence between the market value of assets and the expected market value of assets, based on the investment return assumption. The amount recognized each year is 20% of the diff erence between market value and expected market value. The Asset Valuation Method was adopted by the Board in 2006.
4. Retiree Insurance Funding Policy: The assumptions, methods, and funding requirements used in the valuation are to meet the requirements of GASB Statement No. 43. Going forward, new UAL bases will be established at each valuation date and will be amortized over the following 30 years. This policy was adopted in 2006.
5. Investment Return Assumption: The future investments earnings of plan assets are assumed to accumulate at a rate of 7.75% per annum. This rate consists of a 3.5% infl ationary component and a 4.25% real rate of return component. In accordance with GASB Statement 43, the investment return assumption has been reduced to a blended rate of 4.5% for KERS and SPRS insurance funds due to a lack of pre-funding benefi ts. This assumption was adopted in 2006.
6. Salary Increase Assumption: Active member salaries are assumed to increase at the rates provided in Table 1 on the following page. The rates include a 3.5% percent infl ationary component and an additional increase due to promotion based upon plan experience. This assumption was adopted in 2006.

97
Actuarial Section
Table 1: Salary Increase AssumptionsService KERS & CERS Non-Hazardous KERS & CERS Hazardous, SPRS
0-1 13.5% 14.5%
1-2 7.0% 7.5%
2-3 5.5% 7.0%
3-4 5.0% 6.5%
4-5 5.0% 6.0%
5-6 4.5% 5.5%
6-7 4.5% 5.0%
7-8 4.5% 5.0%
8-9 4.0% 4.5%
9-10 4.0% 4.5%
10+ 4.0% 4.0%
7. Payroll Growth Assumption: Active member payroll is assumed to increase at a rate of 3.5% per annum. This assumption was adopted in 2006.
8. Retiree Cost of Living Adjustments (COLA): State statute requires retirement allowances to be increased by the percentage increase in the annual average of the consumer price index for all urban consumers (CPI-U) for the most recent calendar year, not to exceed fi ve percent. Statute only allows the Cost of Living Adjustments (COLAs) awarded as of the valuation date to be recognized for funding purposes and for determining employer contribution rates. The State Legislature has the authority to suspend or reduce cost of living adjustments.
9. Medical Infl ation Rate Assumption: The costs for retiree medical premiums are assumed to increase each year by 12% from 2006-2008, by 11% from 2009-2011, by 10% from 2012-2014, by 9% from 2015-2017, by 8% from 2018-2020, by 7% from 2021-2023, by 6% from 2024-2026, and by 5.5% thereafter. This assumption was adopted in 2006.
10. Retirement Rate Assumption: The probability, or the likelihood, that a member will retire at a specifi ed age or level of service is provided in Table 2. This assumption was adopted in 2006.
Summary of Actuarial Assumptions and Methods(As of June 30, 2006)

Actuarial Section
98
TABLE 2: RETIREMENT RATE ASSUMPTIONS
Non-Hazardous Hazardous
Age Probability Service KERS Probability
CERSProbability
SPRSProbability
55565758596061626364656667686970
8.00%8.00%8.00%8.00%8.00%
10.00%20.00%25.00%25.00%25.00%25.00%25.00%25.00%25.00%25.00%25.00%
202122232425262728293031323334
35+
20%15%15%15%15%20%35%35%35%35%35%35%35%35%35%60%
30%25%20%20%25%25%30%30%30%30%40%40%35%35%30%30%
20%9%9%9%
20%20%20%20%30%45%45%45%45%45%70%70%
If service credit is at least 27 years, the rate is 25%. Rates are doubled for KERS Non-hazardous members during the window period (set to expire January 1, 2009). 100% are anticipated to retire at age 75.
For KERS, 100% are anticipated to retire at age 65. For CERS, 100% are anticipated to retire at age 62. For SPRS, 100% are anticipated to retire at age 55.
11. Mortality Assumptions: The mortality table used for active members is the 1994 Group Annuity Mortality (GAM) Table. For members retiring on or after July 1, 2006, the mortality table was changed from the 1983 GAM table to the 1994 GAM table. Mortality assumptions for disabled lives are set using the 1994 GAM table set forward fi ve years. These assumptions were adopted in 2006.
TABLE 3: SAMPLE ANNUAL RATES OF MORTALITY
Active & Retired Member Mortality* Disabled Member MortalityAge Males Females Males Females
Under 20 0.04% 0.03% ---- ----
22 0.06% 0.03% ---- ----
32 0.08% 0.04% ---- ----
42 0.13% 0.08% 0.19% 0.11%
52 0.32% 0.17% 0.56% 0.29%
62 1.01% 0.58% 1.80% 1.08%
72 2.85% 1.65% 4.52% 2.84%
*For members retiring on or after July 1, 2006.
12. Withdrawal Rates: The probability, or likelihood, of active members terminating employment prior to retirement is provided in Table 4 on the following page. The withdrawal rate is a function of both age and service. This type of structure is known as “select and ultimate rates”. This structure refl ects the fact that both service and age aff ect the likelihood of a member staying in active employment. The ultimate period for these systems covers a member’s withdrawal rate after the fi rst fi ve years of service. These assumptions were adopted in 2006.
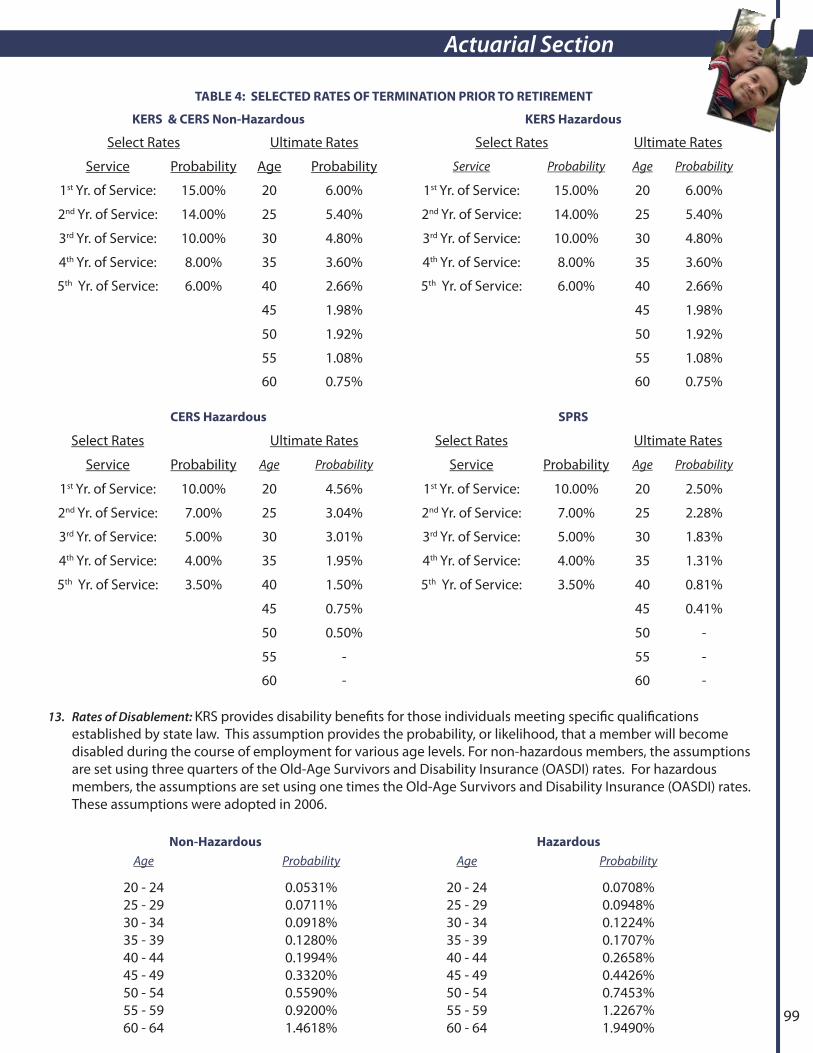
99
Actuarial Section
TABLE 4: SELECTED RATES OF TERMINATION PRIOR TO RETIREMENT
KERS & CERS Non-Hazardous KERS Hazardous
Select Rates Ultimate Rates Select Rates Ultimate Rates
Service Probability Age Probability Service Probability Age Probability
1st Yr. of Service: 15.00% 20 6.00% 1st Yr. of Service: 15.00% 20 6.00%
2nd Yr. of Service: 14.00% 25 5.40% 2nd Yr. of Service: 14.00% 25 5.40%
3rd Yr. of Service: 10.00% 30 4.80% 3rd Yr. of Service: 10.00% 30 4.80%
4th Yr. of Service: 8.00% 35 3.60% 4th Yr. of Service: 8.00% 35 3.60%
5th Yr. of Service: 6.00% 40 2.66% 5th Yr. of Service: 6.00% 40 2.66%
45 1.98% 45 1.98%
50 1.92% 50 1.92%
55 1.08% 55 1.08%
60 0.75% 60 0.75%
CERS Hazardous SPRS
Select Rates Ultimate Rates Select Rates Ultimate Rates
Service Probability Age Probability Service Probability Age Probability
1st Yr. of Service: 10.00% 20 4.56% 1st Yr. of Service: 10.00% 20 2.50%
2nd Yr. of Service: 7.00% 25 3.04% 2nd Yr. of Service: 7.00% 25 2.28%
3rd Yr. of Service: 5.00% 30 3.01% 3rd Yr. of Service: 5.00% 30 1.83%
4th Yr. of Service: 4.00% 35 1.95% 4th Yr. of Service: 4.00% 35 1.31%
5th Yr. of Service: 3.50% 40 1.50% 5th Yr. of Service: 3.50% 40 0.81%
45 0.75% 45 0.41%
50 0.50% 50 -
55 - 55 -
60 - 60 -
13. Rates of Disablement: KRS provides disability benefi ts for those individuals meeting specifi c qualifi cations established by state law. This assumption provides the probability, or likelihood, that a member will become disabled during the course of employment for various age levels. For non-hazardous members, the assumptions are set using three quarters of the Old-Age Survivors and Disability Insurance (OASDI) rates. For hazardous members, the assumptions are set using one times the Old-Age Survivors and Disability Insurance (OASDI) rates. These assumptions were adopted in 2006.
Non-Hazardous Hazardous
Age Probability Age Probability
20 - 2425 - 2930 - 3435 - 3940 - 4445 - 4950 - 5455 - 5960 - 64
0.0531%0.0711%0.0918%0.1280%0.1994%0.3320%0.5590%0.9200%1.4618%
20 - 2425 - 2930 - 3435 - 3940 - 4445 - 4950 - 5455 - 5960 - 64
0.0708%0.0948%0.1224%0.1707%0.2658%0.4426%0.7453%1.2267%1.9490%
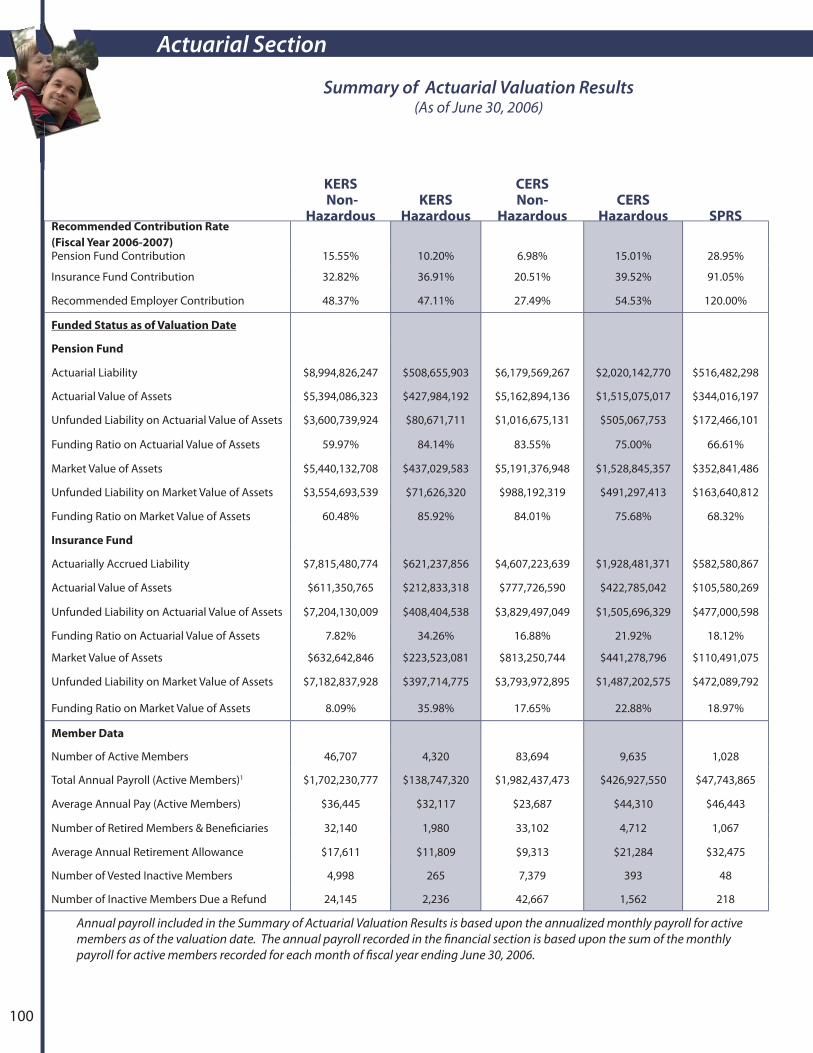
Actuarial Section
100
KERS Non-
HazardousKERS
Hazardous
CERS Non-
HazardousCERS
Hazardous SPRSRecommended Contribution Rate
(Fiscal Year 2006-2007)
Pension Fund Contribution 15.55% 10.20% 6.98% 15.01% 28.95%
Insurance Fund Contribution 32.82% 36.91% 20.51% 39.52% 91.05%
Recommended Employer Contribution 48.37% 47.11% 27.49% 54.53% 120.00%
Funded Status as of Valuation Date
Pension Fund
Actuarial Liability $8,994,826,247 $508,655,903 $6,179,569,267 $2,020,142,770 $516,482,298
Actuarial Value of Assets $5,394,086,323 $427,984,192 $5,162,894,136 $1,515,075,017 $344,016,197
Unfunded Liability on Actuarial Value of Assets $3,600,739,924 $80,671,711 $1,016,675,131 $505,067,753 $172,466,101
Funding Ratio on Actuarial Value of Assets 59.97% 84.14% 83.55% 75.00% 66.61%
Market Value of Assets $5,440,132,708 $437,029,583 $5,191,376,948 $1,528,845,357 $352,841,486
Unfunded Liability on Market Value of Assets $3,554,693,539 $71,626,320 $988,192,319 $491,297,413 $163,640,812
Funding Ratio on Market Value of Assets 60.48% 85.92% 84.01% 75.68% 68.32%
Insurance Fund
Actuarially Accrued Liability $7,815,480,774 $621,237,856 $4,607,223,639 $1,928,481,371 $582,580,867
Actuarial Value of Assets $611,350,765 $212,833,318 $777,726,590 $422,785,042 $105,580,269
Unfunded Liability on Actuarial Value of Assets $7,204,130,009 $408,404,538 $3,829,497,049 $1,505,696,329 $477,000,598
Funding Ratio on Actuarial Value of Assets 7.82% 34.26% 16.88% 21.92% 18.12%
Market Value of Assets $632,642,846 $223,523,081 $813,250,744 $441,278,796 $110,491,075
Unfunded Liability on Market Value of Assets $7,182,837,928 $397,714,775 $3,793,972,895 $1,487,202,575 $472,089,792
Funding Ratio on Market Value of Assets 8.09% 35.98% 17.65% 22.88% 18.97%
Member Data
Number of Active Members 46,707 4,320 83,694 9,635 1,028
Total Annual Payroll (Active Members)1 $1,702,230,777 $138,747,320 $1,982,437,473 $426,927,550 $47,743,865
Average Annual Pay (Active Members) $36,445 $32,117 $23,687 $44,310 $46,443
Number of Retired Members & Benefi ciaries 32,140 1,980 33,102 4,712 1,067
Average Annual Retirement Allowance $17,611 $11,809 $9,313 $21,284 $32,475
Number of Vested Inactive Members 4,998 265 7,379 393 48
Number of Inactive Members Due a Refund 24,145 2,236 42,667 1,562 218
Annual payroll included in the Summary of Actuarial Valuation Results is based upon the annualized monthly payroll for active members as of the valuation date. The annual payroll recorded in the fi nancial section is based upon the sum of the monthly payroll for active members recorded for each month of fi scal year ending June 30, 2006.
Summary of Actuarial Valuation Results(As of June 30, 2006)
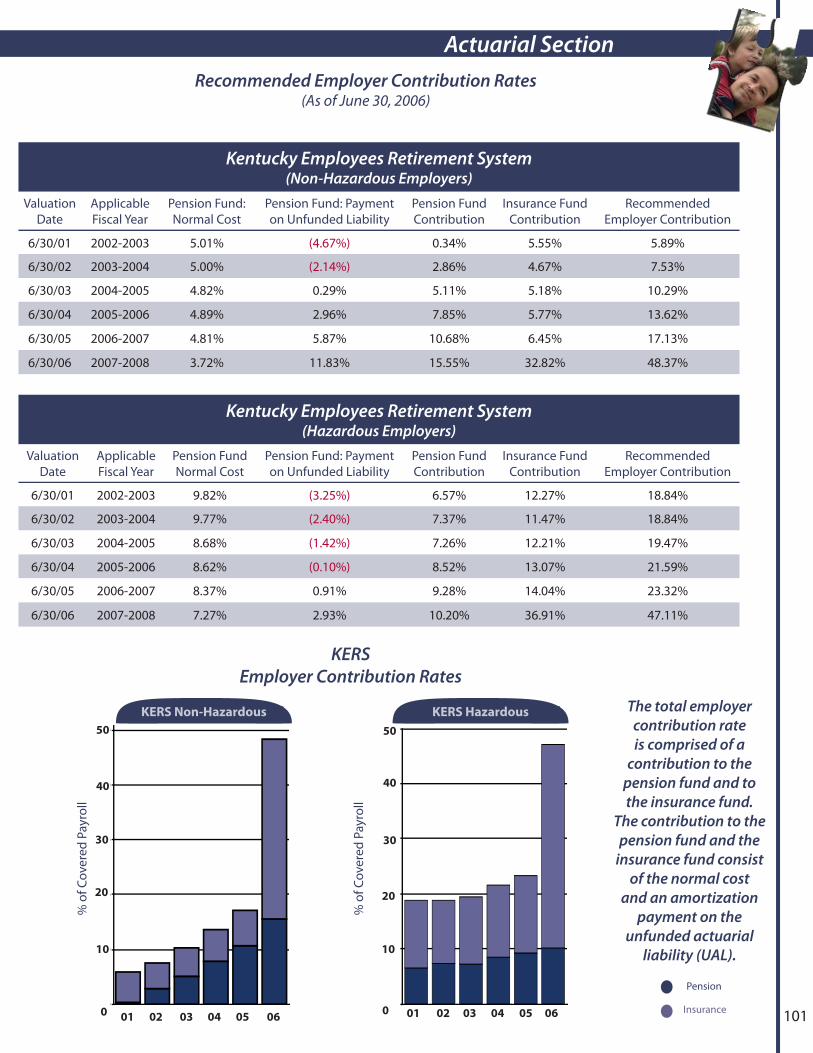
101
Actuarial Section
Kentucky Employees Retirement System (Non-Hazardous Employers)
Valuation Date
Applicable Fiscal Year
Pension Fund: Normal Cost
Pension Fund: Payment on Unfunded Liability
Pension Fund Contribution
Insurance Fund Contribution
Recommended Employer Contribution
6/30/01 2002-2003 5.01% (4.67%) 0.34% 5.55% 5.89%
6/30/02 2003-2004 5.00% (2.14%) 2.86% 4.67% 7.53%
6/30/03 2004-2005 4.82% 0.29% 5.11% 5.18% 10.29%
6/30/04 2005-2006 4.89% 2.96% 7.85% 5.77% 13.62%
6/30/05 2006-2007 4.81% 5.87% 10.68% 6.45% 17.13%
6/30/06 2007-2008 3.72% 11.83% 15.55% 32.82% 48.37%
Kentucky Employees Retirement System (Hazardous Employers)
Valuation Date
Applicable Fiscal Year
Pension Fund Normal Cost
Pension Fund: Payment on Unfunded Liability
Pension Fund Contribution
Insurance Fund Contribution
Recommended Employer Contribution
6/30/01 2002-2003 9.82% (3.25%) 6.57% 12.27% 18.84%
6/30/02 2003-2004 9.77% (2.40%) 7.37% 11.47% 18.84%
6/30/03 2004-2005 8.68% (1.42%) 7.26% 12.21% 19.47%
6/30/04 2005-2006 8.62% (0.10%) 8.52% 13.07% 21.59%
6/30/05 2006-2007 8.37% 0.91% 9.28% 14.04% 23.32%
6/30/06 2007-2008 7.27% 2.93% 10.20% 36.91% 47.11%
Recommended Employer Contribution Rates(As of June 30, 2006)
KERS Employer Contribution Rates
Pension
Insurance
The total employer contribution rate is comprised of a
contribution to the pension fund and to the insurance fund.
The contribution to the pension fund and the
insurance fund consist of the normal cost
and an amortization payment on the
unfunded actuarial liability (UAL).
% o
f Cov
ered
Pay
roll
KERS Non-Hazardous
40
30
20
10
0 0504030201 06
50
%
%
%
%
%
%
% o
f Cov
ered
Pay
roll
KERS Hazardous
30
20
10
0 0504030201 06
50
40

Actuarial Section
102
County Employees Retirement System (Hazardous Employers)
Valuation Date
Applicable Fiscal Year
Pension Fund Normal Cost
Pension Fund: Payment on Unfunded Liability
Pension Fund Contribution
Insurance Fund Contribution
Recommended Employer Contribution
6/30/2001 2002-2003 9.01% (4.34%) 4.67% 11.61% 16.28%
6/30/2002 2003-2004 8.93% (2.17%) 6.76% 11.75% 18.51%
6/30/2003 2004-2005 8.80% 0.51% 9.31% 12.77% 22.08%
6/30/2004 2005-2006 8.80% 2.42% 11.22% 13.79% 25.01%
6/3 0/2005 2006-2007 8.79% 4.32% 13.11% 15.10% 28.21%
6/30/2006 2007-2008 8.12% 6.89% 15.01% 39.52% 54.53%
Recommended Employer Contribution Rates(As of June 30, 2006)
CERSEmployer Contribution Rates
Pension
Insurance
The total employer contribution rate is comprised of a
contribution to the pension fund and to the insurance fund. The contribution to
the pension fund and the insurance fund consist of the
normal cost and an amortization payment on the
unfunded actuarial liability (UAL).
County Employees Retirement System (Non-Hazardous Employers)
Valuation Date
Applicable Fiscal Year
Pension Fund Normal Cost
Pension Fund: Payment on Unfunded Liability
Pension Fund Contribution
Insurance Fund Contribution
Recommended Employer Contribution
6/30/2001 2002-2003 6.30% (5.64%) 0.66% 5.68% 6.34%
6/30/2002 2003-2004 6.42% (4.03%) 2.39% 4.95% 7.34%
6/30/2003 2004-2005 5.71% (2.89%) 2.82% 5.66% 8.48%
6/30/2004 2005-2006 5.80% (1.25%) 4.55% 6.43% 10.98%
6/30/2005 2006-2007 5.72% 0.25% 5.97% 7.22% 13.19%
6/30/2006 2007-2008 4.69% 2.29% 6.98% 20.51% 27.49%
% o
f Cov
ered
Pay
roll
CERS Non-Hazardous30
25
20
15
10
5
0060504030201
Valuation Date
%
%
%
%
%
%
% o
f Cov
ered
Pay
roll
CERS Hazardous
50
10
0060504030201
40
20
30
Valuation Date
%
%
%
%
%
%
60
The insurance fund contribution rates and t he employer contribution rates for CERS Non-Hazardous and CERS Hazardous shown in the above tables are
the full funding rates presented by the actuary in the 2006 annual valuation. However, in the case of CERS Non-Hazardous and CERS Hazardous, the actuary
recommended a fi ve-year phase-in of the rate which requires the payment of the insurance benefi t normal cost with a fi ve-year phase-in of the unfunded
accrued liability (UAL) associated with the insurance funds. As a result, the CERS Non-Hazardous insurance fund contribution rate actually recommended
by the actuary and adopted by the Board for 2007-2008 is 9.19% and the employer contribution rate is 16.17%. The CERS Hazardous insurance fund
contribution rate actually recommended by the actuary and adopted by the Board for 2007-2008 is 18.86% and the employer contribution rate is 33.87%.
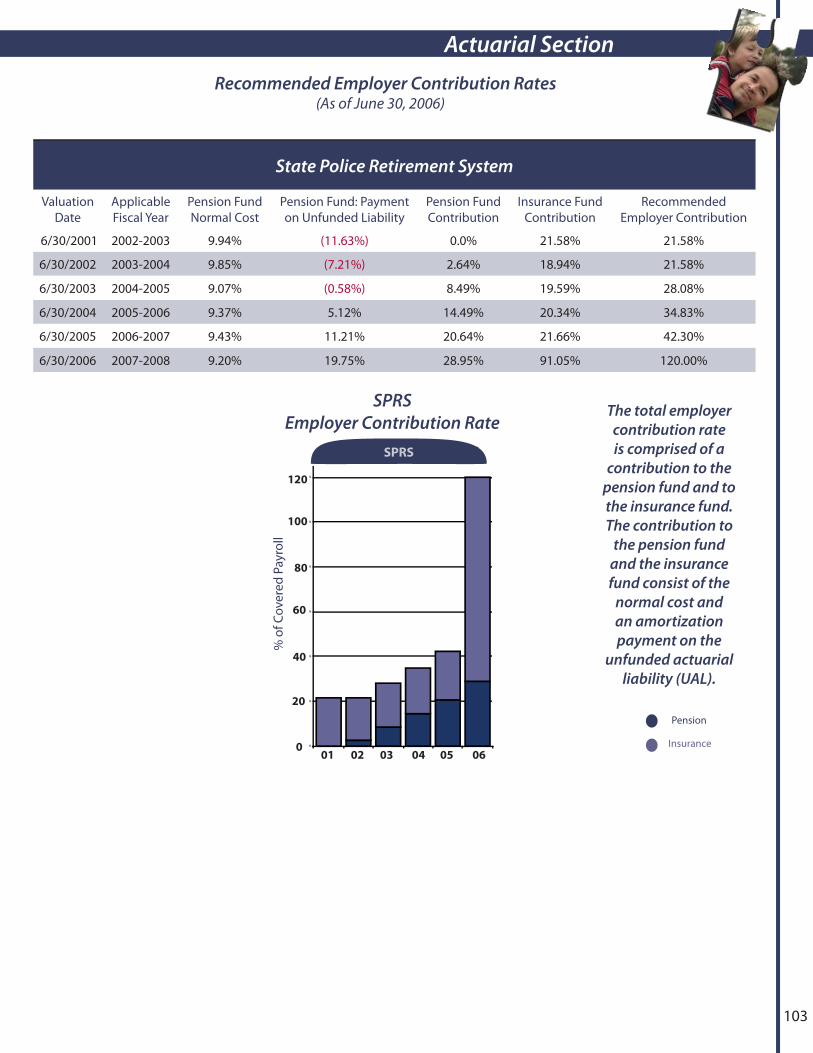
103
Actuarial Section
State Police Retirement System
Valuation Date
Applicable Fiscal Year
Pension Fund Normal Cost
Pension Fund: Payment on Unfunded Liability
Pension Fund Contribution
Insurance Fund Contribution
Recommended Employer Contribution
6/30/2001 2002-2003 9.94% (11.63%) 0.0% 21.58% 21.58%
6/30/2002 2003-2004 9.85% (7.21%) 2.64% 18.94% 21.58%
6/30/2003 2004-2005 9.07% (0.58%) 8.49% 19.59% 28.08%
6/30/2004 2005-2006 9.37% 5.12% 14.49% 20.34% 34.83%
6/30/2005 2006-2007 9.43% 11.21% 20.64% 21.66% 42.30%
6/30/2006 2007-2008 9.20% 19.75% 28.95% 91.05% 120.00%
Recommended Employer Contribution Rates(As of June 30, 2006)
Pension
Insurance
The total employer contribution rate is comprised of a
contribution to the pension fund and to the insurance fund. The contribution to
the pension fund and the insurance fund consist of the
normal cost and an amortization payment on the
unfunded actuarial liability (UAL).
% o
f Cov
ered
Pay
roll
SPRS
40
20
00504030201 06
60
80
120
100
SPRSEmployer Contribution Rate
%
%
%
%
%
%
%

Actuarial Section
104
Kentucky Employees Retirement System (Non-Hazardous Pension Fund)
Valuation Date Actuarial Liability
Value of Assets Unfunded Actuarial Liabilities Funding Level
Actuarial Market Actuarial Market Actuarial Market6/30/01 $5,444,035,294 $6,844,742,687 $5,484,563,749 ($1,400,707,393) ($40,528,455) 125.7% 100.7%
6/30/02 $6,026,094,764 $6,654,084,196 $5,005,190,948 ($627,989,432) $1,020,903,816 110.4% 83.1%
6/30/03 $6,520,463,188 $6,351,318,832 $4,929,443,185 $169,144,356 $1,591,020,003 97.4% 75.6%
6/30/04 $7,049,613,171 $6,000,513,743 $5,258,994,145 $1,049,099,428 $1,790,619,026 85.1% 74.6%
6/30/05 $7,579,074,839 $5,578,685,746 $5,362,630,697 $2,000,389,093 $2,216,444,142 73.6% 70.8%
6/30/06 $8,994,826,247 $5,394,086,323 $5,440,132,708 $3,600,739,924 $3,554,693,539 60.0% 60.5%
Summary of Actuarially Unfunded Liabilities (As of June 30, 2006)
Kentucky Employees Retirement System (Non-Hazardous Insurance Fund)
Valuation Date Actuarial Liability
Value of Assets Unfunded Actuarial Liabilities Funding Level
Actuarial Market Actuarial Market Actuarial Market6/30/01 $1,769,583,098 $449,630,605 $396,254,063 $1,319,952,493 $1,373,329,035 25.4% 22.4%
6/30/02 $1,907,683,881 $521,250,455 $465,664,515 $1,386,433,426 $1,442,019,366 27.3% 24.4%
6/30/03 $2,093,210,321 $553,885,082 $487,274,973 $1,539,325,239 $1,605,935,348 26.5% 23.3%
6/30/04 $2,335,905,365 $600,586,961 $587,680,647 $1,735,318,404 $1,748,224,718 25.7% 25.2%
6/30/05 $2,680,559,188 $607,068,351 $610,901,623 $2,073,490,837 $2,069,657,565 22.7% 22.8%
6/30/06 $7,815,480,774 $611,350,765 $632,642,846 $7,204,130,009 $ 7,182,837,928 7.8% 8.1%
Actuarial
Market
The funding level is the %
of actuarial liabilities, or
benefi ts earned to date,
covered by current assets.
The value provides a
measure of the plan’s
fi nancial soundness. An
increasing (decreasing)
trend in the funding level
indicates the system is
becoming fi nancially
stronger (weaker).060504030201
KERS Non Hazardous
Pension
120%
0
20%
80%
60%
40%
140%
100%
160%
Fund
ing
Leve
l (%
)
060504030201
KERS Non-Hazardous
Insurance
10%
0
20%
80%
70%
60%
50%
40%
30%
100%
90%
Fund
ing
Leve
l (%
)
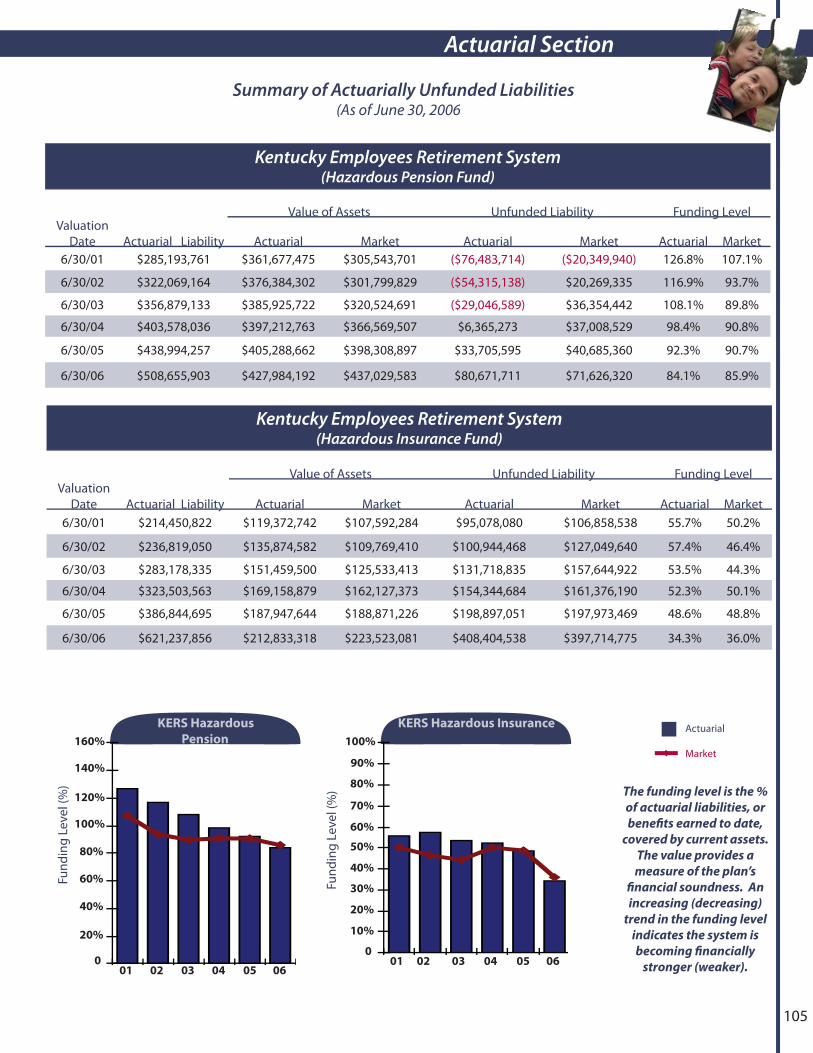
105
Actuarial Section
Kentucky Employees Retirement System (Hazardous Pension Fund)
Valuation Date Actuarial Liability
Value of Assets Unfunded Liability Funding Level
Actuarial Market Actuarial Market Actuarial Market6/30/01 $285,193,761 $361,677,475 $305,543,701 ($76,483,714) ($20,349,940) 126.8% 107.1%
6/30/02 $322,069,164 $376,384,302 $301,799,829 ($54,315,138) $20,269,335 116.9% 93.7%
6/30/03 $356,879,133 $385,925,722 $320,524,691 ($29,046,589) $36,354,442 108.1% 89.8%
6/30/04 $403,578,036 $397,212,763 $366,569,507 $6,365,273 $37,008,529 98.4% 90.8%
6/30/05 $438,994,257 $405,288,662 $398,308,897 $33,705,595 $40,685,360 92.3% 90.7%
6/30/06 $508,655,903 $427,984,192 $437,029,583 $80,671,711 $71,626,320 84.1% 85.9%
Kentucky Employees Retirement System (Hazardous Insurance Fund)
Valuation Date Actuarial Liability
Value of Assets Unfunded Liability Funding Level
Actuarial Market Actuarial Market Actuarial Market6/30/01 $214,450,822 $119,372,742 $107,592,284 $95,078,080 $106,858,538 55.7% 50.2%
6/30/02 $236,819,050 $135,874,582 $109,769,410 $100,944,468 $127,049,640 57.4% 46.4%
6/30/03 $283,178,335 $151,459,500 $125,533,413 $131,718,835 $157,644,922 53.5% 44.3%
6/30/04 $323,503,563 $169,158,879 $162,127,373 $154,344,684 $161,376,190 52.3% 50.1%
6/30/05 $386,844,695 $187,947,644 $188,871,226 $198,897,051 $197,973,469 48.6% 48.8%
6/30/06 $621,237,856 $212,833,318 $223,523,081 $408,404,538 $397,714,775 34.3% 36.0%
Summary of Actuarially Unfunded Liabilities(As of June 30, 2006
Actuarial
Market
060504030201
KERS Hazardous Insurance
10%
0
20%
80%
70%
60%
50%
40%
30%
100%
90%
Fund
ing
Leve
l (%
) The funding level is the %
of actuarial liabilities, or
benefi ts earned to date,
covered by current assets.
The value provides a
measure of the plan’s
fi nancial soundness. An
increasing (decreasing)
trend in the funding level
indicates the system is
becoming fi nancially
stronger (weaker).060504030201
KERS Hazardous
Pension
120%
0
20%
80%
60%
40%
140%
100%
160%
Fund
ing
Leve
l (%
)

Actuarial Section
106
Summary of Actuarially Unfunded Liabilities (As of June 30, 2006)
County Employees Retirement System (Non-Hazardous Insurance Fund)
Valuation Date
Actuarial Liability
Value of Assets Unfunded Liability Funding Level
Actuarial Market Actuarial Market Actuarial Market6/30/01 $1,793,710,768 $371,758,628 $331,066,746 $1,421,952,140 $1,462,644,022 20.7% 18.5%
6/30/02 $1,977,577,038 $450,497,307 $365,332,585 $1,527,079,731 $1,612,244,453 22.8% 18.5%
6/30/03 $2,176,963,259 $520,060,105 $435,667,125 $1,656,903,154 $1,741,296,134 23.9% 20.0%
6/30/04 $2,438,734,696 $585,399,072 $563,877,594 $1,853,335,624 $1,874,857,102 24.0% 23.1%
6/30/05 $2,788,754,654 $663,941,949 $668,485,367 $2,124,812,705 $2,120,269,287 23.8% 24.0%
6/30/06 $4,607,223,639 $777,726,590 $813,250,744 $3,829,497,049 $3,793,972,895 16.9% 17.7%
Actuarial
Market
060504030201
CERS Non Hazardous
Insurance
10%
0
20%
80%
70%
60%
50%
40%
30%
100%
90%
Fund
ing
Leve
l (%
)
060504030201
CERS Non Hazardous
Pension
120%
0
20%
80%
60%
40%
140%
100%
160%
Fund
ing
Leve
l (%
)
The funding level is the %
of actuarial liabilities, or
benefi ts earned to date,
covered by current assets.
The value provides a
measure of the plan’s
fi nancial soundness. An
increasing (decreasing)
trend in the funding level
indicates the system is
becoming fi nancially
stronger (weaker).Valuation Date Valuation Date
County Employees Retirement System (Non-Hazardous Pension Fund)
Valuation Date Actuarial Liability
Value of Assets Unfunded Liability Funding Level
Actuarial Market Actuarial Market Actuarial Market6/30/01 $3,706,282,212 $5,423,834,549 $4,397,346,547 ($1,717,552,337) ($691,064,335) 146.3% 118.6%
6/30/02 $4,165,355,149 $5,397,787,158 $4,126,756,301 ($1,232,432,009) $38,598,848 129.6% 99.1%
6/30/03 $4,417,597,802 $5,286,580,047 $4,174,881,117 ($868,982,245) $242,716,685 119.7% 94.5%
6/30/04 $4,936,459,488 $5,187,851,530 $4,613,335,957 ($251,392,042) $323,123,531 105.1% 93.5%
6/30/05 $5,385,156,690 $5,059,208,687 $4,893,599,997 $325,948,003 $491,556,693 94.0% 90.9%
6/30/06 $6,179,569,267 $5,162,894,136 $5,191,376,948 $1,016,675,131 $988,192,319 83.6% 84.0%

107
Actuarial Section Summary of Actuarially Unfunded Liabilities
(As of June 30, 2006)
County Employees Retirement System (Hazardous Pension Fund)
Valuation Date Actuarial Liability
Value of Assets Unfunded Liability Funding Level
Actuarial Market Actuarial Market Actuarial Market6/30001 $1,193,860,442 $1,486,666,016 $1,211,154,618 ($292,805,574) ($17,294,176) 124.5% 101.4%
6/30/02 $1,327,291,273 $1,485,511,793 $1,144,349,093 ($158,220,520) $182,942,180 111.9% 86.2%
6/30/03 $1,499,628,782 $1,467,004,856 $1,168,794,472 $32,623,926 $330,834,310 97.8% 77.9%
6/30/04 $1,640,830,120 $1,457,612,042 $1,305,011,472 $183,218,078 $335,818,648 88.8% 79.5%
6/30/05 $1,795,617,335 $1,452,353,023 $1,411,245,719 $343,264,312 $384,371,616 80.9% 78.6%
6/30/06 $2,020,142,770 $1,515,075,017 $1,528,845,357 $505,067,753 $491,297,413 75.0% 75.7%
County Employees Retirement System (Hazardous Insurance Fund)
Valuation Date Actuarial Liability
Value of Assets Unfunded Liability Funding Level
Actuarial Market Actuarial Market Actuarial Market6/30/01 $721,605,292 $197,875,249 $173,636,191 $523,730,043 $547,969,101 27.4% 24.1%
6/30/02 $781,184,974 $234,683,878 $187,533,847 $546,501,096 $593,651,127 30.0% 24.0%
6/30/03 $935,650,662 $269,190,080 $223,212,339 $666,460,582 $712,438,323 28.8% 23.9%
6/30/04 $1,025,684,477 $310,578,162 $297,734,286 $715,106,315 $727,950,191 30.3% 29.0%
6/30/05 $1,283,299,092 $359,180,461 $360,938,669 $924,118,631 $922,360,423 28.0% 28.1%
6/30/06 $1,928,481,371 $422,785,042 $441,278,796 $1,505,696,329 $1,487,202,575 21.9% 22.9%
Actuarial
Market
060504030201
CERS Hazardous
Insurance
10%
0
20%
80%
70%
60%
50%
40%
30%
100%
90%
Fund
ing
Leve
l (%
)
060504030201
CERS Hazardous
Pension
120%
0
20%
80%
60%
40%
140%
100%
160%
Fund
ing
Leve
l (%
)
The funding level is the %
of actuarial liabilities, or
benefi ts earned to date,
covered by current assets.
The value provides a
measure of the plan’s
fi nancial soundness. An
increasing (decreasing)
trend in the funding level
indicates the system is
becoming fi nancially
stronger (weaker).Valuation Date Valuation Date
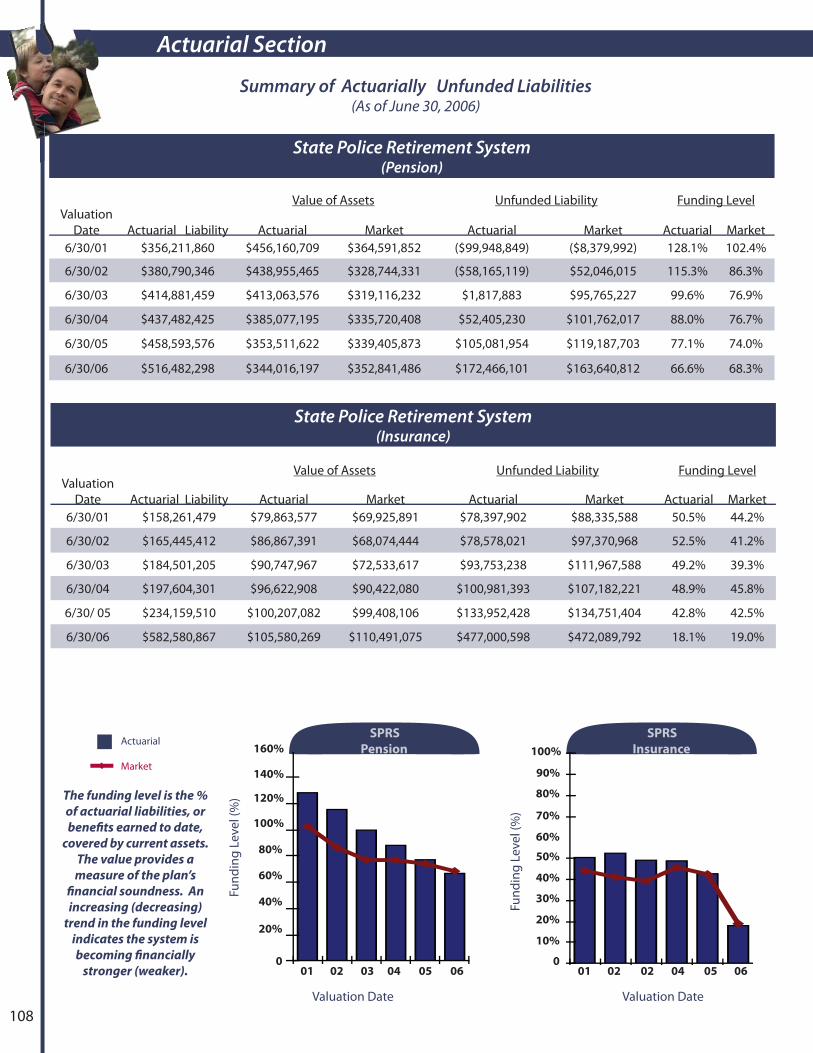
Actuarial Section
108
Summary of Actuarially Unfunded Liabilities (As of June 30, 2006)
State Police Retirement System (Pension)
Valuation Date Actuarial Liability
Value of Assets Unfunded Liability Funding Level
Actuarial Market Actuarial Market Actuarial Market6/30/01 $356,211,860 $456,160,709 $364,591,852 ($99,948,849) ($8,379,992) 128.1% 102.4%
6/30/02 $380,790,346 $438,955,465 $328,744,331 ($58,165,119) $52,046,015 115.3% 86.3%
6/30/03 $414,881,459 $413,063,576 $319,116,232 $1,817,883 $95,765,227 99.6% 76.9%
6/30/04 $437,482,425 $385,077,195 $335,720,408 $52,405,230 $101,762,017 88.0% 76.7%
6/30/05 $458,593,576 $353,511,622 $339,405,873 $105,081,954 $119,187,703 77.1% 74.0%
6/30/06 $516,482,298 $344,016,197 $352,841,486 $172,466,101 $163,640,812 66.6% 68.3%
State Police Retirement System (Insurance)
Valuation Date Actuarial Liability
Value of Assets Unfunded Liability Funding Level
Actuarial Market Actuarial Market Actuarial Market6/30/01 $158,261,479 $79,863,577 $69,925,891 $78,397,902 $88,335,588 50.5% 44.2%
6/30/02 $165,445,412 $86,867,391 $68,074,444 $78,578,021 $97,370,968 52.5% 41.2%
6/30/03 $184,501,205 $90,747,967 $72,533,617 $93,753,238 $111,967,588 49.2% 39.3%
6/30/04 $197,604,301 $96,622,908 $90,422,080 $100,981,393 $107,182,221 48.9% 45.8%
6/30/ 05 $234,159,510 $100,207,082 $99,408,106 $133,952,428 $134,751,404 42.8% 42.5%
6/30/06 $582,580,867 $105,580,269 $110,491,075 $477,000,598 $472,089,792 18.1% 19.0%
Actuarial
Market
The funding level is the %
of actuarial liabilities, or
benefi ts earned to date,
covered by current assets.
The value provides a
measure of the plan’s
fi nancial soundness. An
increasing (decreasing)
trend in the funding level
indicates the system is
becoming fi nancially
stronger (weaker).
Valuation Date
060504030201
SPRS
Pension
120%
0
20%
80%
60%
40%
140%
100%
160%
Fund
ing
Leve
l (%
)
060504020201
SPRS
Insurance
10%
0
20%
80%
70%
60%
50%
40%
30%
100%
90%
Fund
ing
Leve
l (%
)
Valuation Date
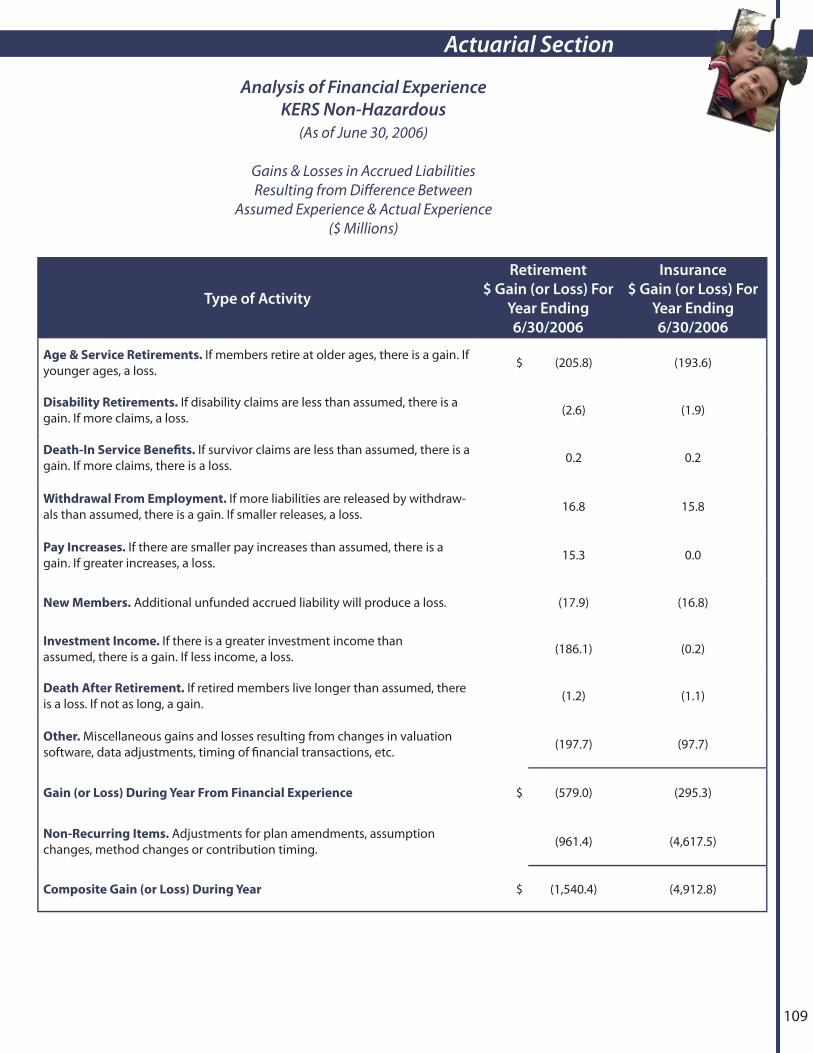
109
Actuarial Section
Type of Activity
Retirement
$ Gain (or Loss) For
Year Ending
6/30/2006
Insurance
$ Gain (or Loss) For
Year Ending
6/30/2006
Age & Service Retirements. If members retire at older ages, there is a gain. If younger ages, a loss. $ (205.8) (193.6)
Disability Retirements. If disability claims are less than assumed, there is a gain. If more claims, a loss. (2.6) (1.9)
Death-In Service Benefi ts. If survivor claims are less than assumed, there is a gain. If more claims, there is a loss. 0.2 0.2
Withdrawal From Employment. If more liabilities are released by withdraw-als than assumed, there is a gain. If smaller releases, a loss. 16.8 15.8
Pay Increases. If there are smaller pay increases than assumed, there is a gain. If greater increases, a loss. 15.3 0.0
New Members. Additional unfunded accrued liability will produce a loss. (17.9) (16.8)
Investment Income. If there is a greater investment income than assumed, there is a gain. If less income, a loss. (186.1) (0.2)
Death After Retirement. If retired members live longer than assumed, there is a loss. If not as long, a gain. (1.2) (1.1)
Other. Miscellaneous gains and losses resulting from changes in valuation software, data adjustments, timing of fi nancial transactions, etc. (197.7) (97.7)
Gain (or Loss) During Year From Financial Experience $ (579.0) (295.3)
Non-Recurring Items. Adjustments for plan amendments, assumption changes, method changes or contribution timing. (961.4) (4,617.5)
Composite Gain (or Loss) During Year $ (1,540.4) (4,912.8)
Analysis of Financial ExperienceKERS Non-Hazardous
(As of June 30, 2006)
Gains & Losses in Accrued LiabilitiesResulting from Diff erence Between
Assumed Experience & Actual Experience($ Millions)
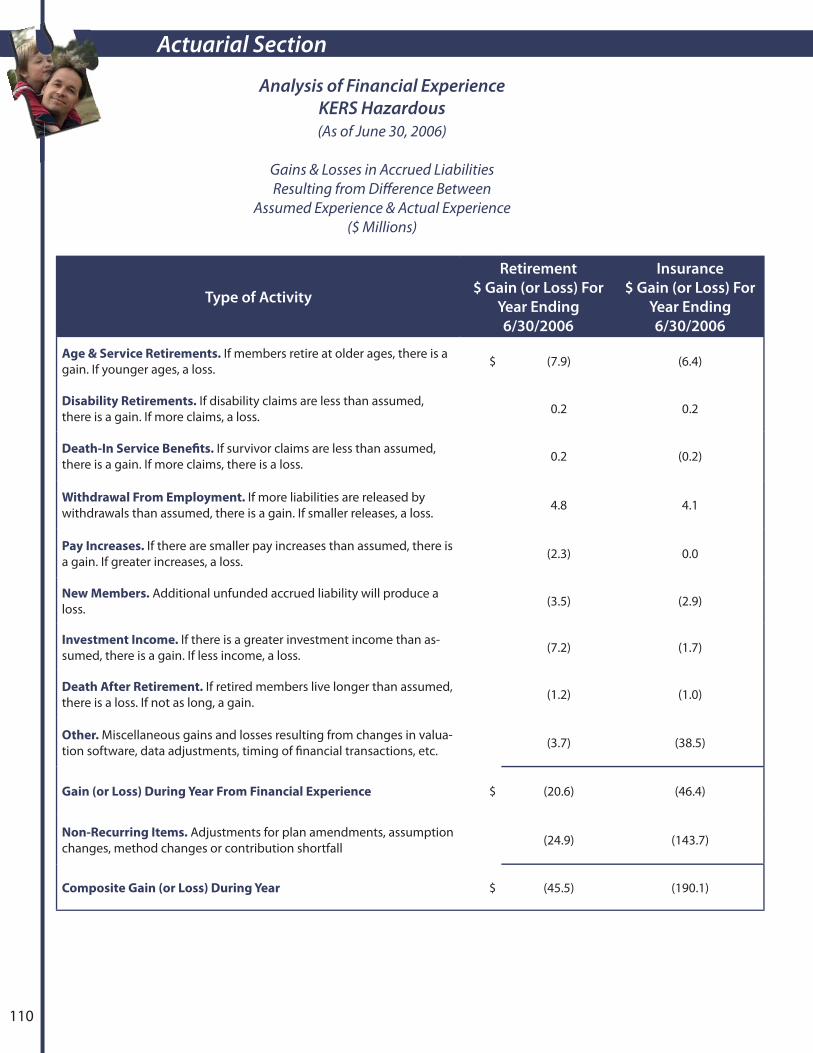
Actuarial Section
110
Type of Activity
Retirement
$ Gain (or Loss) For
Year Ending
6/30/2006
Insurance
$ Gain (or Loss) For
Year Ending
6/30/2006
Age & Service Retirements. If members retire at older ages, there is a gain. If younger ages, a loss. $ (7.9) (6.4)
Disability Retirements. If disability claims are less than assumed, there is a gain. If more claims, a loss. 0.2 0.2
Death-In Service Benefi ts. If survivor claims are less than assumed, there is a gain. If more claims, there is a loss. 0.2 (0.2)
Withdrawal From Employment. If more liabilities are released by withdrawals than assumed, there is a gain. If smaller releases, a loss. 4.8 4.1
Pay Increases. If there are smaller pay increases than assumed, there is a gain. If greater increases, a loss. (2.3) 0.0
New Members. Additional unfunded accrued liability will produce a loss. (3.5) (2.9)
Investment Income. If there is a greater investment income than as-sumed, there is a gain. If less income, a loss. (7.2) (1.7)
Death After Retirement. If retired members live longer than assumed, there is a loss. If not as long, a gain. (1.2) (1.0)
Other. Miscellaneous gains and losses resulting from changes in valua-tion software, data adjustments, timing of fi nancial transactions, etc. (3.7) (38.5)
Gain (or Loss) During Year From Financial Experience $ (20.6) (46.4)
Non-Recurring Items. Adjustments for plan amendments, assumption changes, method changes or contribution shortfall (24.9) (143.7)
Composite Gain (or Loss) During Year $ (45.5) (190.1)
Analysis of Financial ExperienceKERS Hazardous(As of June 30, 2006)
Gains & Losses in Accrued LiabilitiesResulting from Diff erence Between
Assumed Experience & Actual Experience($ Millions)
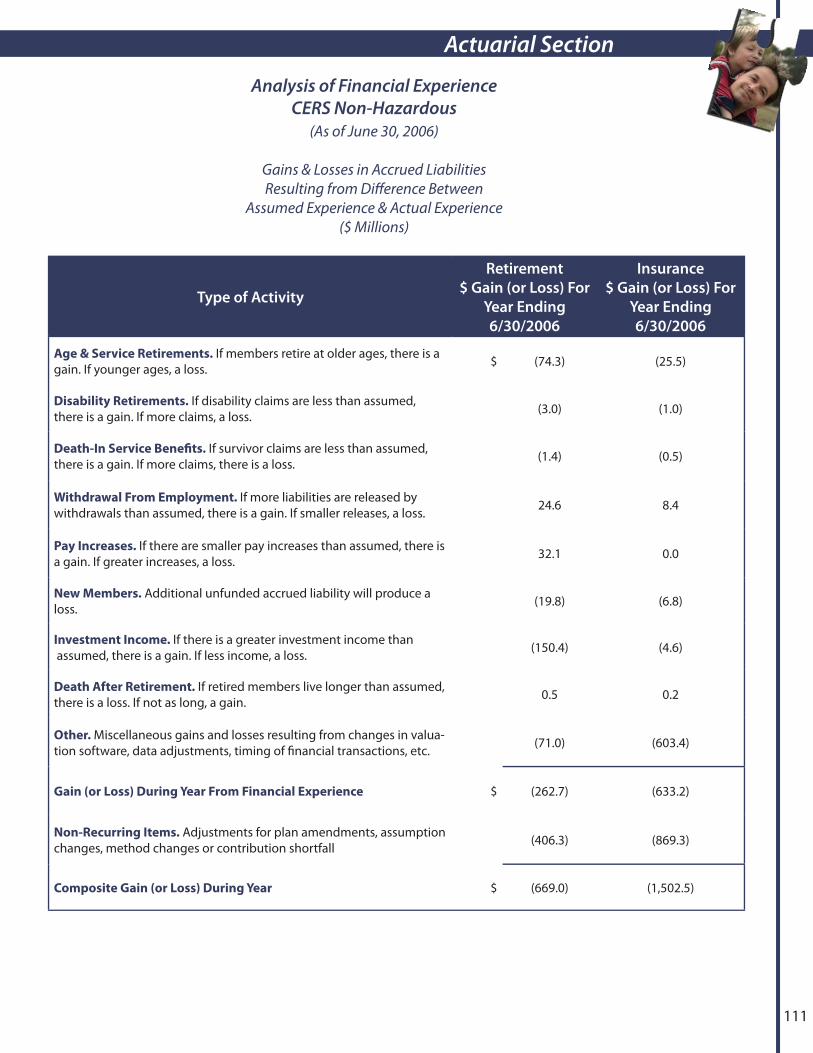
111
Actuarial Section
Type of Activity
Retirement
$ Gain (or Loss) For
Year Ending
6/30/2006
Insurance
$ Gain (or Loss) For
Year Ending
6/30/2006
Age & Service Retirements. If members retire at older ages, there is a gain. If younger ages, a loss. $ (74.3) (25.5)
Disability Retirements. If disability claims are less than assumed, there is a gain. If more claims, a loss. (3.0) (1.0)
Death-In Service Benefi ts. If survivor claims are less than assumed, there is a gain. If more claims, there is a loss. (1.4) (0.5)
Withdrawal From Employment. If more liabilities are released by withdrawals than assumed, there is a gain. If smaller releases, a loss. 24.6 8.4
Pay Increases. If there are smaller pay increases than assumed, there is a gain. If greater increases, a loss. 32.1 0.0
New Members. Additional unfunded accrued liability will produce a loss. (19.8) (6.8)
Investment Income. If there is a greater investment income than assumed, there is a gain. If less income, a loss. (150.4) (4.6)
Death After Retirement. If retired members live longer than assumed, there is a loss. If not as long, a gain. 0.5 0.2
Other. Miscellaneous gains and losses resulting from changes in valua-tion software, data adjustments, timing of fi nancial transactions, etc. (71.0) (603.4)
Gain (or Loss) During Year From Financial Experience $ (262.7) (633.2)
Non-Recurring Items. Adjustments for plan amendments, assumption changes, method changes or contribution shortfall (406.3) (869.3)
Composite Gain (or Loss) During Year $ (669.0) (1,502.5)
Analysis of Financial ExperienceCERS Non-Hazardous
(As of June 30, 2006)
Gains & Losses in Accrued LiabilitiesResulting from Diff erence Between
Assumed Experience & Actual Experience($ Millions)

Actuarial Section
112
Type of Activity
Retirement
$ Gain (or Loss) For
Year Ending
6/30/2006
Insurance
$ Gain (or Loss) For
Year Ending
6/30/2006
Age & Service Retirements. If members retire at older ages, there is a gain. If younger ages, a loss. $ (21.6) (12.9)
Disability Retirements. If disability claims are less than assumed, there is a gain. If more claims, a loss. (1.1) (0.7)
Death-In Service Benefi ts. If survivor claims are less than assumed, there is a gain. If more claims, there is a loss. 0.0 0.0
Withdrawal From Employment. If more liabilities are released by withdrawals than assumed, there is a gain. If smaller releases, a loss. 0.5 0.3
Pay Increases. If there are smaller pay increases than assumed, there is a gain. If greater increases, a loss. 18.9 0.0
New Members. Additional unfunded accrued liability will produce a loss. (5.3) (3.2)
Investment Income. If there is a greater investment income than as-sumed, there is a gain. If less income, a loss. (38.4) (2.6)
Death After Retirement. If retired members live longer than assumed, there is a loss. If not as long, a gain. (3.9) (2.3)
Other. Miscellaneous gains and losses resulting from changes in valua-tion software, data adjustments, timing of fi nancial transactions, etc. 9.5 (127.6)
Gain (or Loss) During Year From Financial Experience $ (41.4) (149.0)
Non-Recurring Items. Adjustments for plan amendments, assumption changes, method changes or contribution shortfall (111.3) (358.7)
Composite Gain (or Loss) During Year $ (152.7) (507.7)
Analysis of Financial ExperienceCERS Hazardous(As of June 30, 2006)
Gains & Losses in Accrued LiabilitiesResulting from Diff erence Between
Assumed Experience & Actual Experience($ Millions)

113
Actuarial Section
Type of Activity
Retirement
$ Gain (or Loss) For
Year Ending
6/30/2006
Insurance
$ Gain (or Loss) For
Year Ending
6/30/2006
Age & Service Retirements. If members retire at older ages, there is a gain. If younger ages, a loss. $ (3.9) (1.8)
Disability Retirements. If disability claims are less than assumed, there is a gain. If more claims, a loss. (0.2) (0.1)
Death-In Service Benefi ts. If survivor claims are less than assumed, there is a gain. If more claims, there is a loss. 0.0 (0.0)
Withdrawal From Employment. If more liabilities are released by withdrawals than assumed, there is a gain. If smaller releases, a loss. 0.6 0.3
Pay Increases. If there are smaller pay increases than assumed, there is a gain. If greater increases, a loss. (1.7) 0.0
New Members. Additional unfunded accrued liability will produce a loss. (0.5) (0.2)
Investment Income. If there is a greater investment income than as-sumed, there is a gain. If less income, a loss. (10.7) (1.8)
Death After Retirement. If retired members live longer than assumed, there is a loss. If not as long, a gain. 0.4 0.2
Other. Miscellaneous gains and losses resulting from changes in valua-tion software, data adjustments, timing of fi nancial transactions, etc. 0.9 14.9
Gain (or Loss) During Year From Financial Experience $ (15.1) 11.5
Non-Recurring Items. Adjustments for plan amendments, assumption changes, method changes or contribution shortfall (48.9) (343.0)
Composite Gain (or Loss) During Year $ (64.0) (331.5)
Analysis of Financial ExperienceSPRS
(As of June 30, 2006)
Gains & Losses in Accrued LiabilitiesResulting from Diff erence Between
Assumed Experience & Actual Experience($ Millions)
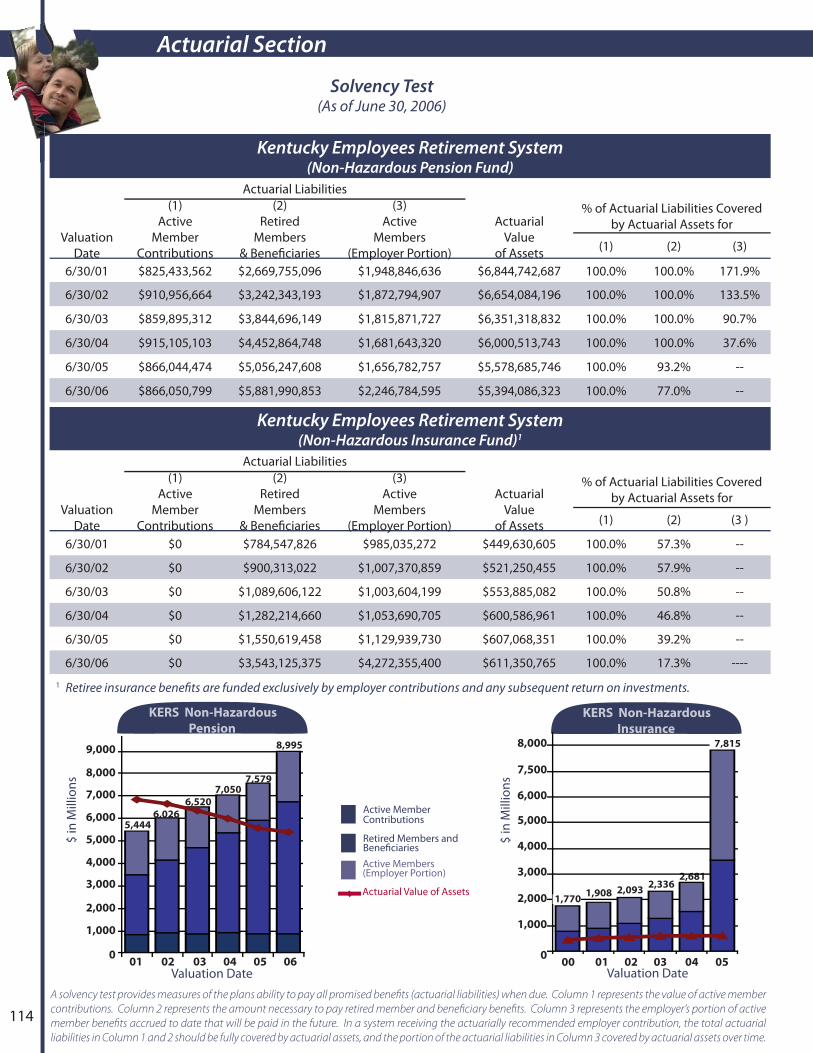
Actuarial Section
114
Solvency Test (As of June 30, 2006)
Kentucky Employees Retirement System (Non-Hazardous Insurance Fund)1
Actuarial Liabilities
Valuation Date
(1)Active
Member Contributions
(2)Retired
Members& Benefi ciaries
(3)Active
Members(Employer Portion)
ActuarialValue
of Assets
% of Actuarial Liabilities Covered by Actuarial Assets for
(1) (2) (3 )
6/30/01 $0 $784,547,826 $985,035,272 $449,630,605 100.0% 57.3% --
6/30/02 $0 $900,313,022 $1,007,370,859 $521,250,455 100.0% 57.9% --
6/30/03 $0 $1,089,606,122 $1,003,604,199 $553,885,082 100.0% 50.8% --
6/30/04 $0 $1,282,214,660 $1,053,690,705 $600,586,961 100.0% 46.8% --
6/30/05 $0 $1,550,619,458 $1,129,939,730 $607,068,351 100.0% 39.2% --
6/30/06 $0 $3,543,125,375 $4,272,355,400 $611,350,765 100.0% 17.3% ----
1 Retiree insurance benefi ts are funded exclusively by employer contributions and any subsequent return on investments.
Kentucky Employees Retirement System (Non-Hazardous Pension Fund)
Actuarial Liabilities
Valuation Date
(1)Active
Member Contributions
(2)Retired
Members& Benefi ciaries
(3)Active
Members(Employer Portion)
ActuarialValue
of Assets
% of Actuarial Liabilities Covered by Actuarial Assets for
(1) (2) (3)
6/30/01 $825,433,562 $2,669,755,096 $1,948,846,636 $6,844,742,687 100.0% 100.0% 171.9%
6/30/02 $910,956,664 $3,242,343,193 $1,872,794,907 $6,654,084,196 100.0% 100.0% 133.5%
6/30/03 $859,895,312 $3,844,696,149 $1,815,871,727 $6,351,318,832 100.0% 100.0% 90.7%
6/30/04 $915,105,103 $4,452,864,748 $1,681,643,320 $6,000,513,743 100.0% 100.0% 37.6%
6/30/05 $866,044,474 $5,056,247,608 $1,656,782,757 $5,578,685,746 100.0% 93.2% --
6/30/06 $866,050,799 $5,881,990,853 $2,246,784,595 $5,394,086,323 100.0% 77.0% --
Active Member Contributions
Retired Members and Benefi ciariesActive Members(Employer Portion)
Actuarial Value of Assets
A solvency test provides measures of the plans ability to pay all promised benefi ts (actuarial liabilities) when due. Column 1 represents the value of active member
contributions. Column 2 represents the amount necessary to pay retired member and benefi ciary benefi ts. Column 3 represents the employer’s portion of active
member benefi ts accrued to date that will be paid in the future. In a system receiving the actuarially recommended employer contribution, the total actuarial
liabilities in Column 1 and 2 should be fully covered by actuarial assets, and the portion of the actuarial liabilities in Column 3 covered by actuarial assets over time.
$ in
Mill
ions
KERS Non-Hazardous
Pension
1,000
00504030201 06
2,000
8,000
7,000
6,000
5,000
4,000
3,000
8,995
7,5797,050
6,520
6,0265,444
9,000
0
8,000
7,500
3,000
2,000
1,000
$ in
Mill
ions
KERS Non-Hazardous
Insurance
050403020100
2,6812,336
2,0931,908
7,815
1,770
6,000
5,000
4,000
Valuation Date Valuation Date

115
Actuarial SectionSolvency Test
(As of June 30, 2006 )
Kentucky Employees Retirement System (Hazardous Pension Fund)
Actuarial Liabilities
Valuation Date
(1)Active
Member Contributions
(2)Retired
Members& Benefi ciaries
(3)Active
Members(Employer Portion)
ActuarialValue
of Assets
% of Actuarial Liabilities Covered by Actuarial Assets for
(1) (2) (3)
6/30/01 $70,405,915 $86,372,269 $128,415,577 $361,677,475 100.0% 100.0% 159.6%
6/30/02 $77,700,666 $110,048,474 $134,320,024 $376,384,302 100.0% 100.0% 140.4%
6/30/03 $71,414,721 $135,622,333 $149,842,079 $385,925,722 100.0% 100.0% 119.4%
6/30/04 $78,817,575 $175,102,848 $149,657,613 $397,212,763 100.0% 100.0% 95.7%
6/30/05 $75,098,321 $213,310,550 $150,585,386 $405,288,662 100.0% 100.0% 77.6%
6/30/06 $87,092,538 $262,446,606 $159,116,759 $427,984,172 100.0% 100.0% 49.3%
Kentucky Employees Retirement System (Hazardous Insurance Fund)1
Actuarial Liabilities
Valuation Date
(1)Active
Member Contributions
(2)Retired
Members& Benefi ciaries
(3)Active
Members(Employer Portion)
ActuarialValue
of Assets
% of Actuarial Liabilities Covered by Actuarial Assets for
(1) (2) (3)
6/30/01 $0 $77,157,196 $137,293,626 $119,372,742 100.0% 100.0% 30.7%
6/30/02 $0 $90,978,506 $145,840,544 $135,874,582 100.0% 100.0% 30.8%
6/30/03 $0 $113,979,451 $169,198,884 $151,459,500 100.0% 100.0% 22.2%
6/30/04 $0 $142,872,557 $180,631,006 $169,158,879 100.0% 100.0% 14.6%
6/30/05 $0 $187,883,650 $198,961,045 $187,947,644 100.0% 100.0% --
6/30/06 $0 $234,058,715 $387,179,141 $212,833,318 100.0% 90.9% --
$ in
Mill
ions
KERS Hazardous
Pension
00504030201 06
100
500
400
300
200
509
439
404
357
322
285
$ in
Mill
ions
KERS Hazardous
Insurance
00504030201 06
100
700
600
500
400
300
200
621
214
387
324283
237
Active Member Contributions
Retired Members and Benefi ciariesActive Members (Employer Portion)
Actuarial Value of Assets
A solvency test provides measures of the plans ability to pay all promised benefi ts (actuarial liabilities) when due. Column 1 represents the value of active member
contributions. Column 2 represents the amount necessary to pay retired member and benefi ciary benefi ts. Column 3 represents the employer’s portion of active
member benefi ts accrued to date that will be paid in the future. In a system receiving the actuarially recommended employer contribution, the total actuarial
liabilities in Column 1 and 2 should be fully covered by actuarial assets, and the portion of the actuarial liabilities in Column 3 covered by actuarial assets over time.
Retiree insurance benefi ts are funded exclusively by employer contributions and any subsequent return on investments.
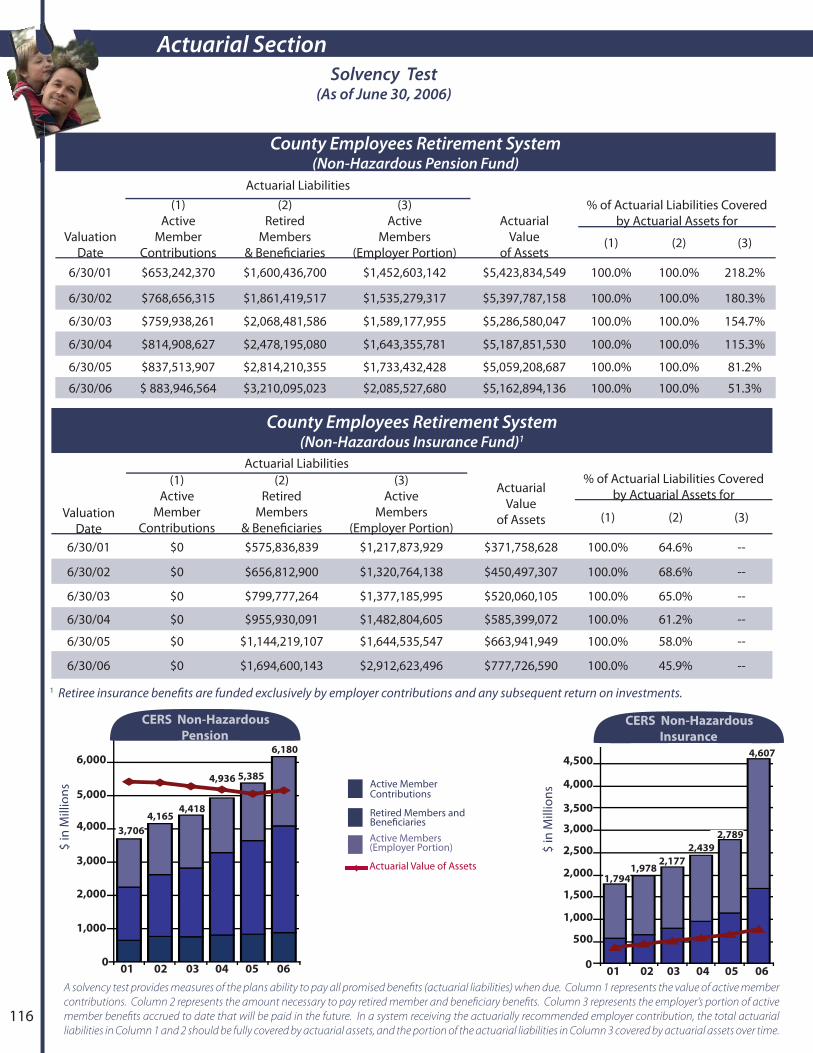
Actuarial Section
116
Solvency Test (As of June 30, 2006)
County Employees Retirement System (Non-Hazardous Pension Fund)
Actuarial Liabilities
Valuation Date
(1)Active
Member Contributions
(2)Retired
Members& Benefi ciaries
(3)Active
Members(Employer Portion)
ActuarialValue
of Assets
% of Actuarial Liabilities Covered by Actuarial Assets for
(1) (2) (3)
6/30/01 $653,242,370 $1,600,436,700 $1,452,603,142 $5,423,834,549 100.0% 100.0% 218.2%
6/30/02 $768,656,315 $1,861,419,517 $1,535,279,317 $5,397,787,158 100.0% 100.0% 180.3%
6/30/03 $759,938,261 $2,068,481,586 $1,589,177,955 $5,286,580,047 100.0% 100.0% 154.7%
6/30/04 $814,908,627 $2,478,195,080 $1,643,355,781 $5,187,851,530 100.0% 100.0% 115.3%
6/30/05 $837,513,907 $2,814,210,355 $1,733,432,428 $5,059,208,687 100.0% 100.0% 81.2%
6/30/06 $ 883,946,564 $3,210,095,023 $2,085,527,680 $5,162,894,136 100.0% 100.0% 51.3%
County Employees Retirement System (Non-Hazardous Insurance Fund)1
Actuarial Liabilities
Valuation Date
(1)Active
Member Contributions
(2)Retired
Members& Benefi ciaries
(3)Active
Members(Employer Portion)
ActuarialValue
of Assets
% of Actuarial Liabilities Covered by Actuarial Assets for
(1) (2) (3)
6/30/01 $0 $575,836,839 $1,217,873,929 $371,758,628 100.0% 64.6% --
6/30/02 $0 $656,812,900 $1,320,764,138 $450,497,307 100.0% 68.6% --
6/30/03 $0 $799,777,264 $1,377,185,995 $520,060,105 100.0% 65.0% --
6/30/04 $0 $955,930,091 $1,482,804,605 $585,399,072 100.0% 61.2% --
6/30/05 $0 $1,144,219,107 $1,644,535,547 $663,941,949 100.0% 58.0% --
6/30/06 $0 $1,694,600,143 $2,912,623,496 $777,726,590 100.0% 45.9% --
1 Retiree insurance benefi ts are funded exclusively by employer contributions and any subsequent return on investments.
$ in
Mill
ions
CERS Non-Hazardous
Pension
0060504030201
1,000
4,000
5,000
3,000
2,000
5,3854,936
4,4184,165
3,706
Active Member Contributions
Retired Members and Benefi ciariesActive Members (Employer Portion)
Actuarial Value of Assets
$ in
Mill
ions
CERS Non-Hazardous
Insurance
4,000
0060504030201
1,000
3,500
3,000
1,500
4,500
1,7941,978
2,177
2,439
2,789
A solvency test provides measures of the plans ability to pay all promised benefi ts (actuarial liabilities) when due. Column 1 represents the value of active member
contributions. Column 2 represents the amount necessary to pay retired member and benefi ciary benefi ts. Column 3 represents the employer’s portion of active
member benefi ts accrued to date that will be paid in the future. In a system receiving the actuarially recommended employer contribution, the total actuarial
liabilities in Column 1 and 2 should be fully covered by actuarial assets, and the portion of the actuarial liabilities in Column 3 covered by actuarial assets over time.
500
2,000
2,500
4,6076,000
6,180

117
Actuarial Section
County Employees Retirement System (Hazardous Pension Fund)
Actuarial Liabilities
Valuation Date
(1)Active
Member Contributions
(2)Retired
Members& Benefi ciaries
(3)Active
Members(Employer Portion)
ActuarialValue
of Assets
% of Actuarial Liabilities Covered by Actuarial Assets for
(1) (2) (3)
6/30/01 $202,572,754 $584,940,978 $406,346,710 $1,486,666,016 100.0% 100.0% 172.1%
6/30/02 $238,363,024 $664,188,862 $424,739,387 $1,485,511,793 100.0% 100.0% 137.3%
6/30/03 $227,629,402 $769,804,746 $502,194,634 $1,467,004,856 100.0% 100.0% 93.5%
6/30/04 $256,366,204 $851,354,443 $533,109,473 $1,457,612,042 100.0% 100.0% 65.6%
6/30/05 $264,913,465 $960,052,305 $570,651,565 $1,452,353,023 100.0% 100.0% 39.8%
6/30/06 $300,200,800 $1,128,164,618 $591,777,352 $1,515,075,017 100.0% 100.0% 14.7%
County Employees Retirement System (Hazardous Insurance Fund)1
Actuarial Liabilities
Valuation Date
(1)Active
Member Contributions
(2)Retired
Members& Benefi ciaries
(3)Active
Members(Employer Portion)
ActuarialValue
of Assets
% of Actuarial Liabilities Covered by Actuarial Assets for
(1) (2) (3)
6/30/01 $0 $316,638,166 $404,967,126 $197,875,249 100.0% 62.5% --
6/30/02 $0 $343,821,677 $437,363,297 $234,683,878 100.0% 68.3% --
6/30/03 $0 $401,276,347 $534,374,315 $269,190,080 100.0% 67.1% --
6/30/04 $0 $450,288,687 $575,395,790 $310,578,162 100.0% 69.0% --
6/30/05 $0 $586,104,126 $697,194,966 $359,180,461 100.0% 61.3% --
6/30/06 $0 $787,671,273 $1,140,810,098 $422,785,042 100.0% 53.7% --
$ in
Mill
ions
CERS Hazardous
Insurance
0060504030201
2,500
2,000
1,500
1,000
500
1,283
1,026936
781722
$ in
Mill
ions
CERS Hazardous
Pension
0060504030201
2,000
1,500
1,000
500
1,796
1,641
1,500
1,3271,194
Solvency Test (As of June 30, 2006 )
A solvency test provides measures of the plans ability to pay all promised benefi ts (actuarial liabilities) when due. Column 1 represents the value of active member
contributions. Column 2 represents the amount necessary to pay retired member and benefi ciary benefi ts. Column 3 represents the employer’s portion of active
member benefi ts accrued to date that will be paid in the future. In a system receiving the actuarially recommended employer contribution, the total actuarial
liabilities in Column 1 and 2 should be fully covered by actuarial assets, and the portion of the actuarial liabilities in Column 3 covered by actuarial assets over time.
1 Retiree insurance benefi ts are funded exclusively by employer contributions and any subsequent return on investments.
Active Member Contributions
Retired Members and Benefi ciariesActive Members (Employer Portion)
Actuarial Value of Assets
1,9282,020

Actuarial Section
118
State Police Retirement System (Pension Fund)
Actuarial Liabilities
Valuation Date
(1)Active
Member Contributions
(2)Retired
Members& Benefi ciaries
(3)Active
Members(Employer Portion)
ActuarialValue
of Assets
% of Actuarial Liabilities Covered by Actuarial Assets for
(1) (2) (3)
6/30/01 $34,338,478 $224,432,772 $97,440,610 $456,160,709 100.0% 100.0% 202.6%
6/30/02 $36,886,477 $252,498,613 $91,405,256 $438,955,613 100.0% 100.0% 163.6%
6/30/03 $35,832,095 $290,012,792 $89,036,572 $413,063,576 100.0% 100.0% 98.0%
6/30/04 $37,658,106 $318,664,694 $81,159,625 $385,077,195 100.0% 100.0% 35.4%
6/30/05 $35,670,717 $341,398,363 $81,524,496 $353,511,622 100.0% 93.1% --
6/30/06 $37,866,774 $373,588,145 $105,027,379 $344,016,197 100.0% 81.9% --
State Police Retirement System (Insurance Fund)
Actuarial Liabilities
Valuation Date
(1)Active
Member Contributions
(2)Retired
Members& Benefi ciaries
(3)Active
Members(Employer Portion)
ActuarialValue
of Assets
% of Actuarial Liabilities Covered by Actuarial Assets for
(1) (2) (3)
6/30/01 $0 $86,469,110 $71,792,369 $79,863,577 100.0% 92.4% --
6/30/02 $0 $94,205,237 $71,240,175 $86,867,391 100.0% 92.2% --
6/30/03 $0 $106,317,750 $78,183,455 $90,747,967 100.0% 85.4% --
6/30/04 $0 $119,104,851 $78,499,450 $96,622,908 100.0% 81.1% --
6/30/05 $0 $141,585,694 $92,573,816 $100,207,082 100.0% 70.8% --
6/30/06 $0 $240,913,868 $341,666,999 $105,580,269 100.0% 43.8% --
$ in
Mill
ions
SPRS
Pension
0 0504030201 06
100
500
400
300
200
516
459437
415
381356
Solvency Test (As of June 30, 2006)
A solvency test provides measures of the plans ability to pay all promised benefi ts (actuarial liabilities) when due. Column 1 represents the value of active member
contributions. Column 2 represents the amount necessary to pay retired member and benefi ciary benefi ts. Column 3 represents the employer’s portion of active
member benefi ts accrued to date that will be paid in the future. In a system receiving the actuarially recommended employer contribution, the total actuarial
liabilities in Column 1 and 2 should be fully covered by actuarial assets, and the portion of the actuarial liabilities in Column 3 covered by actuarial assets over time.
1 Retiree insurance benefi ts are funded exclusively by employer contributions and any subsequent return on investments.
Active Member Contributions
Retired Members and Benefi ciariesActive Members (Employer Portion)
Actuarial Value of Assets
$ in
Mill
ions
SPRS
Insurance
100
00504030201 06
200
500
400
300
583
234198
185165158
600

119
Actuarial Section
Kentucky Employees Retirement System (Non-Hazardous)
Schedule of Active Member Valuation Data
Valuation Date
Number of Employers
Total Active Members
Annual Payroll1 Annual Average Pay
% Increase In Average Pay
Average Age
Average Years of Service Credit
6/30/01 N/A 47,780 $1,525,188,532 $31,921 4.5% 42.5 10.4
6/30/02 N/A 48,555 $1,597,447,963 $32,900 3.1% 41.5 10.1
6/30/03 N/A 49,158 $1,658,604,696 $33,740 2.6% 42.5 10.0
6/30/04 N/A 47,599 $1,645,412,496 $34,568 2.5% 42.9 10.0
6/30/05 324 47,118 $1,655,907,288 $35,144 1.7% 42.9 9.8
6/30/06 338 46,707 $1,702,230,777 $36,445 3.7% 43.0 9.7
Kentucky Employees Retirement System (Hazardous)
Schedule of Active Member Valuation Data
Valuation Date
Number of Employers
Total Active Members
Annual Payroll1 Annual Average Pay
% Increase In Average Pay
Average Age
Average Years of Service Credit
6/30/01 N/A 4,228 $123,647,407 $29,245 1.8% 41.6 6.6
6/30/22 N/A 4,211 $125,371,604 $29,772 1.8% 41.8 6.9
6/30/03 N/A 4,189 $129,088,956 $30,816 3.5% 41.6 7.2
6/30/04 N/A 4,014 $126,664,812 $31,556 2.4% 42.7 7.6
6/30/05 26 4,274 $131,687,088 $30,811 (2.4%) 41.9 7.1
6/30/06 15 4,320 $138,747,320 $32,117 4.2% 41.6 7.0
County Employees Retirement System (Non-Hazardous)
Schedule of Active Member Valuation Data
Valuation Date
Number of Employers
Total Active Members
Annual Payroll2 Annual Average Pay
% Increase In Average Pay
Average Age
Average Years of Service Credit
6/30/01 N/A 78,773 $1,597,653,320 $20,282 (0.3%) 43.4 7.3
6/30/02 N/A 79,850 $1,688,460,789 $21,145 4.3% 43.0 7.6
6/30/03 N/A 82,288 $1,796,451,180 $21,831 3.2% 43.8 7.6
6/30/24 N/A 80,922 $1,826,870,880 $22,576 3.4% 44.8 7.9
6/30/05 1,116 81,240 $1,885,275,000 $23,206 2.8% 45.0 8.1
6/30/06 1,099 83,694 $1,982,437,473 $23,687 2.1% 45.1 8.1
Summary of Active Member Valuation Data (As of June 30, 2006)
1Annual payroll included in the Schedule of Active Member Valuation Data is based upon the annualized monthly payroll for active members as of the valuate date. The annual payroll recorded in the fi nancial section is based upon the sum of the monthly payroll for active members recorded for each month of fi scal year ending June 30, 2006.
N/A Not Available

Actuarial Section
120
1Annual payroll included in the Schedule of Active Member Valuation Data is based upon the annualized monthly payroll for active members as of the valuate date. The annual payroll recorded in the fi nancial section is based upon the sum of the monthly payroll for active members recorded for each month of fi scal year ending June 30, 2006.
N/A Not Available
County Employees Retirement System (Hazardous)
Schedule of Active Member Valuation Data
Valuation Date
Number of Employers
Total Active Members
Annual Payroll1Annual
Average Pay% Increase In Average Pay
Average Age
Average Years of Service Credit
6/30/01 N/A 8,586 $322,819,064 $37,598 2.7% 37.2 7.6
6/30/02 N/A 8,949 $346,319,146 $38,699 2.9% 36.3 7.8
6/30/03 N/A 9,286 $374,700,732 $40,351 4.3% 37.3 7.8
6/30/04 N/A 9,349 $392,562,624 $41,990 4.1% 38.1 8.1
6/30/05 284 9,464 $411,121,728 $43,441 3.5% 38.0 8.2
6/30/06 292 9,635 $426,927,550 $44,310 2.0% 37.8 8.3
State Police Retirement System
Schedule of Active Member Valuation Data
Valuation Date
Number of Employers
Total Active Members
Annual Payroll1Annual
Average Pay% Increase In Average Pay
Average Age
Average Years of Service Credit
6/30/01 1 1,016 $44,209,944 $43,514 2.1% 36.9 11.8
6/30/02 1 1,002 $43,961,844 $43,874 0.8% 35.7 11.4
6/30/03 1 1,019 $43,760,832 $42,945 (2.1%) 35.9 10.9
6/30/04 1 999 $43,835,208 $43,879 2.2% 36.4 10.7
6/30/05 1 987 $43,720,092 $44,296 1.0% 36.5 10.6
6/30/06 1 1,028 $47,743,865 $46,443 4.8% 36.5 10.5
Summary of Active Member Valuation Data (As of June 30, 2006)
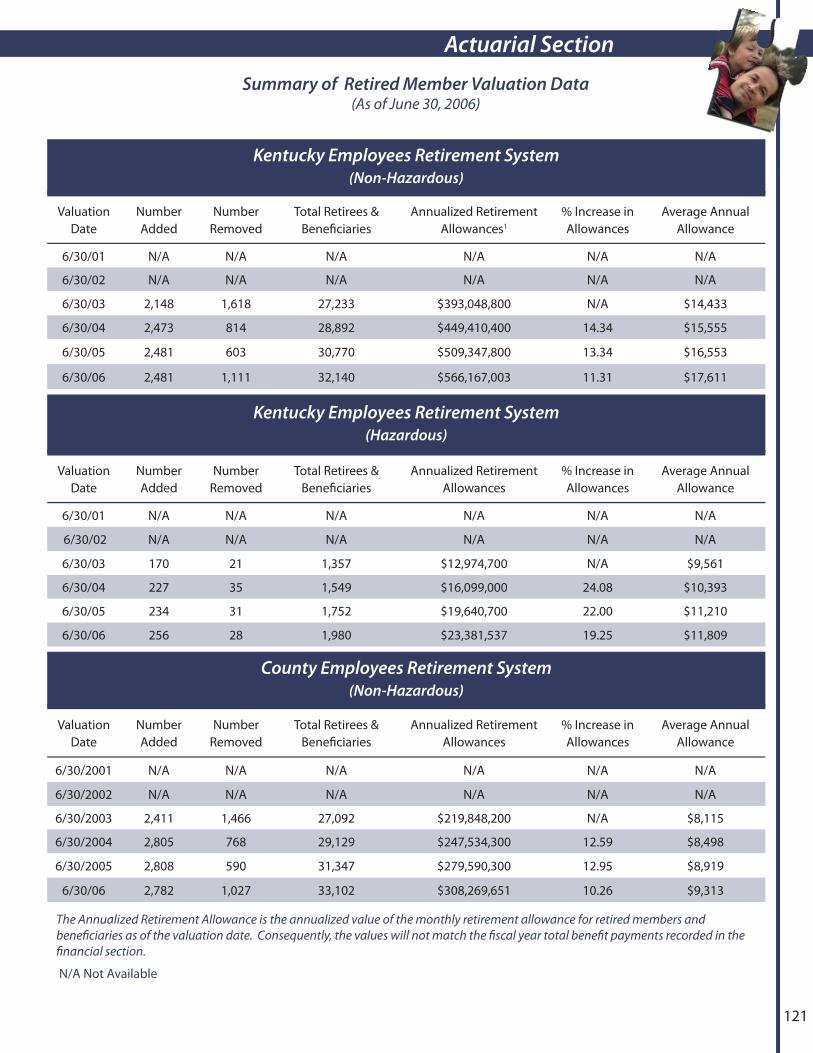
121
Actuarial Section
Summary of Retired Member Valuation Data (As of June 30, 2006)
Kentucky Employees Retirement System (Non-Hazardous)
Valuation Date
Number Added
Number Removed
Total Retirees & Benefi ciaries
Annualized Retirement Allowances1
% Increase in Allowances
Average Annual Allowance
6/30/01 N/A N/A N/A N/A N/A N/A
6/30/02 N/A N/A N/A N/A N/A N/A
6/30/03 2,148 1,618 27,233 $393,048,800 N/A $14,433
6/30/04 2,473 814 28,892 $449,410,400 14.34 $15,555
6/30/05 2,481 603 30,770 $509,347,800 13.34 $16,553
6/30/06 2,481 1,111 32,140 $566,167,003 11.31 $17,611
Kentucky Employees Retirement System (Hazardous)
Valuation Date
Number Added
Number Removed
Total Retirees & Benefi ciaries
Annualized Retirement Allowances
% Increase in Allowances
Average Annual Allowance
6/30/01 N/A N/A N/A N/A N/A N/A
6/30/02 N/A N/A N/A N/A N/A N/A
6/30/03 170 21 1,357 $12,974,700 N/A $9,561
6/30/04 227 35 1,549 $16,099,000 24.08 $10,393
6/30/05 234 31 1,752 $19,640,700 22.00 $11,210
6/30/06 256 28 1,980 $23,381,537 19.25 $11,809
County Employees Retirement System (Non-Hazardous)
Valuation Date
Number Added
Number Removed
Total Retirees & Benefi ciaries
Annualized Retirement Allowances
% Increase in Allowances
Average Annual Allowance
6/30/2001 N/A N/A N/A N/A N/A N/A
6/30/2002 N/A N/A N/A N/A N/A N/A
6/30/2003 2,411 1,466 27,092 $219,848,200 N/A $8,115
6/30/2004 2,805 768 29,129 $247,534,300 12.59 $8,498
6/30/2005 2,808 590 31,347 $279,590,300 12.95 $8,919
6/30/06 2,782 1,027 33,102 $308,269,651 10.26 $9,313
The Annualized Retirement Allowance is the annualized value of the monthly retirement allowance for retired members and benefi ciaries as of the valuation date. Consequently, the values will not match the fi scal year total benefi t payments recorded in the fi nancial section.
N/A Not Available
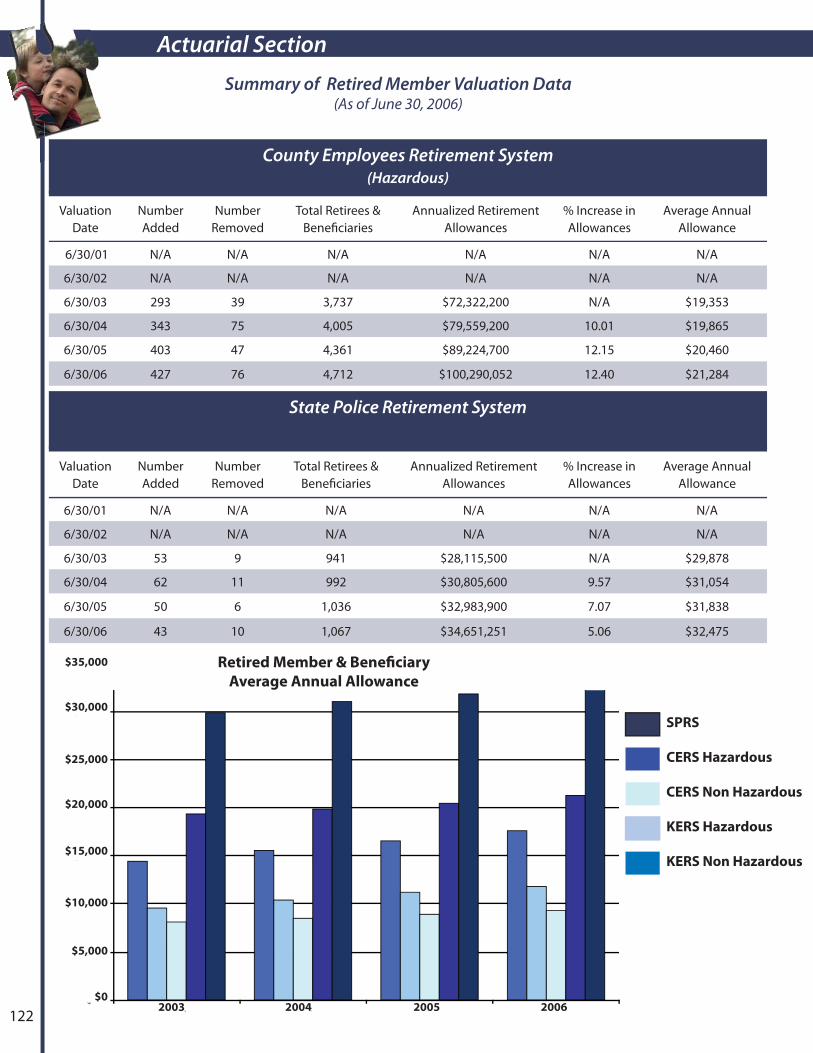
Actuarial Section
122
County Employees Retirement System (Hazardous)
Valuation Date
Number Added
Number Removed
Total Retirees & Benefi ciaries
Annualized Retirement Allowances
% Increase in Allowances
Average Annual Allowance
6/30/01 N/A N/A N/A N/A N/A N/A
6/30/02 N/A N/A N/A N/A N/A N/A
6/30/03 293 39 3,737 $72,322,200 N/A $19,353
6/30/04 343 75 4,005 $79,559,200 10.01 $19,865
6/30/05 403 47 4,361 $89,224,700 12.15 $20,460
6/30/06 427 76 4,712 $100,290,052 12.40 $21,284
State Police Retirement System
Valuation Date
Number Added
Number Removed
Total Retirees & Benefi ciaries
Annualized Retirement Allowances
% Increase in Allowances
Average Annual Allowance
6/30/01 N/A N/A N/A N/A N/A N/A
6/30/02 N/A N/A N/A N/A N/A N/A
6/30/03 53 9 941 $28,115,500 N/A $29,878
6/30/04 62 11 992 $30,805,600 9.57 $31,054
6/30/05 50 6 1,036 $32,983,900 7.07 $31,838
6/30/06 43 10 1,067 $34,651,251 5.06 $32,475
Summary of Retired Member Valuation Data (As of June 30, 2006)
Retired Member & Benefi ciary
Average Annual Allowance
$-
$5,000.00
$10,000.00
$15,000.00
$20,000.00
$25,000.00
$30,000.00
2003 2004 2005 2006
$0200520042003 2006
$5,000
$25,000
$20,000
$15,000
$10,000
$35,000
$30,000
SPRS
CERS Hazardous
CERS Non Hazardous
KERS Hazardous
KERS Non Hazardous

123
Actuarial Section
Summary of Benefi t ProvisionsKERS & CERS Non Hazardous Plans
Plan Funding
State statute requires active members to contribute 5% of creditable compensation. Employers contribute at the rate determined by the Board to be necessary for the actuarial soundness of the systems, as required by KRS 61.565 and KRS 61.752. KERS rates are subject to state budget approval.
Membership Eligibility
For non-school board employers, all regular full-time positions that average 100 or more hours of work per month over a fi scal or calendar year. For school board employers, all regular full-time positions that average 80 hours of work per month over the actual days worked during the school year.
Retirement Eligibility
Age Years of Service Allowance Reduction
65 4 None
Any 27 None
55 5 5% per year for fi ve years before age 65 or 27 years of service. 4% for each year thereafter.
Any 25 5% each year for fi ve years before age 65 or 27 years of service.
Benefi t Formula
Final Compensation
XBenefi t Factor
XYears of Service
Average of the fi ve highest, or if eligible, three highest fi scal year earnings. To
be eligible for three-high fi nal compensation,
member must have 27 years of service,
age and service of 75 years, and retire prior
to 1/09.
KERS 1.97% if:Member does not have 13 months credit from 1/98- 1/99.
Includes earned service,
purchased service, prior
service, and sick leave service (if the member’s
employer participates in
an approved sick leave program).
KERS 2.00% if: Member has 13 months credit from 1/98- 1/99.
KERS 2.20% if:20 or more years of service, and retires by 1/09.
CERS 2.20% if:Member begins participating prior to 8/1/04.
CERS 2.00% if:Member begins participating on or after 8/1/04.

Actuarial Section
124
Summary of Benefi t ProvisionsKERS & CERS Non Hazardous Plans
Post-Retirement Death Benefi ts
If the member is receiving a monthly benefi t based on at least four (4) years of creditable service, the retirement system will pay a $5,000 death benefi t payment to the benefi ciary named by the member specifi cally for this benefi t.
Disability Benefi ts
Members participating before 8/1/04 may retire on account of disability provided the member has at least 60 months of service credit and is not eligible for an unreduced benefi t. Additional service credit may be added for computation of benefi ts under the benefi t formula.
Members participating on or after 8/1/04 may retire on account of disability provided the member has at least 60 months of service credit. Benefi ts are computed as the higher of 20% Final Rate of Pay or the amount calculated under the Benefi t Formula based upon actual service.
Members disabled as a result of a single duty-related injury or act of violence related to their job may be eligible for special benefi ts.
Pre-Retirement Death Benefi ts
The benefi ciary of a deceased active member will be eligible for a monthly benefi t if the member was: (1) eligible for retirement at the time of death or, (2) under the age of 55 with at least 60 months of service credit and currently working for a participating agency at the time of death or (3) no longer working for a participating agency but at the time of death had at least 144 months of service credit. If the benefi ciary of a deceased active member is not eligible for a monthly benefi t, the benefi ciary will receive a lump sum payment of the member’s contributions and any accumulated interest.
Cost of Living Adjustment
Monthly retirement allowances are increased July 1 each year by the percentage increase in the annual average of the CPI-U for the most recent calendar year, not to exceed fi ve percent (5%). The Kentucky General Assembly has the authority to suspend or reduce Cost of Living Adjustments.
Insurance Benefi ts
For members participating prior to July 1, 2003, KRS pays a percentage of the monthly premium for single coverage based upon the service credit accrued at retirement. Members participating on or after July 1, 2003 or after are required to earn at least 10 years of service credit in order to be eligible for insurance benefi ts at retirement. The monthly health insurance contribution will be $10 for each year of earned service increased annually by the CPI-U.
Refunds
Upon termination of employment, a refund of member contributions and accumulated interest is available to the member.
Interest on Accounts
Active member accounts have been credited with interest on July 1 of each year at 3% compounded annually through June 30, 1980; 6% thereafter through June 30, 1986; 4% thereafter through June 30, 2003, and 2.5% thereafter.

125
Actuarial Section
Summary of Benefi t ProvisionsKERS & CERS Hazardous Plans & SPRS
Plan Funding
State statute requires active members to contribute 8% of creditable compensation. Employers contribute at the rate determined by the Board to be necessary for the actuarial soundness of the systems, as required by KRS 61.565 and KRS 61.752. KERS & SPRS rates are subject to state budget approval.
Membership Eligibility
All regular full-time hazardous duty positions approved by the Board that average 100 or more hours of work per month over a fi scal or calendar year.
Retirement Eligibility Age Years of
ServiceAllowance Reduction
55 5 None
Any 20 None
50 15 5.5% per year for fi ve years before age 55 or 20 years of service.
Benefi t Formula
Final Compensation X
Benefi t Factor X
Years of Service
Average of the three highest fi scal
year earnings.
KERS 2.49%CERS 2.50% SPRS 2.50%
Includes earned service, purchased service, prior service,
and sick leave service (if the member’s employer participates
in an approved sick leave program).
Disability Benefi ts
Members hired before 8/1/04 may retire on account of disability provided the member has at least 60 months of service credit and is not eligible for an unreduced benefi t. Additional service credit may be added for computation of benefi ts under the formula noted above.
Members hired on or after 8/1/04 may retire on account of disability provided the member has at least 60 months of service credit. Benefi ts are computed as the higher of 25% Final Rate of Pay or the amount calculated under the Benefi t Formula noted above based upon actual service.
Members disabled as a result of a single duty-related injury or act of violence related to their job may be eligible for special benefi ts.

Actuarial Section
126
Summary of Benefi t ProvisionsKERS & CERS Hazardous Plans & SPRS
Pre-Retirement Death Benefi ts
The benefi ciary of a deceased active member will be eligible for a monthly benefi t if the member was: (1) eligible for retirement at the time of death or, (2) under the age of 55 with at least 60 months of service credit and currently working for a participating agency at the time of death or (3) no longer working for a participating agency but at the time of death had at least 144 months of service credit. If the benefi ciary of a deceased active member is not eligible for a monthly benefi t, the benefi ciary will receive a lump sum payment of the member’s contributions and any accumulated interest.
Post-Retirement Death Benefi ts
If the member is receiving a monthly benefi t based on at least four (4) years of creditable service, the retirement system will pay a $5,000 death benefi t payment to the benefi ciary named by the member specifi cally for this benefi t.
Cost of Living Adjustment
Monthly retirement allowances are increased July 1 each year by the percentage increase in the annual average of the consumer price index for all urban consumers for the most recent calendar year, not to exceed fi ve percent (5%). The Kentucky General Assembly has the authority to suspend or reduce Cost of Living Adjustments.
Insurance Benefi ts
For members participating prior to July 1, 2003, KRS pays a percentage of the monthly premium for single coverage based upon the service credit accrued at retirement. Hazardous duty members are also eligible for an additional contribution for dependents based upon hazardous service only. Members participating on or after July 1, 2003 or after are required to earn at least 10 years of service credit in order to be eligible for insurance benefi ts at retirement. The monthly health insurance contribution will be $15 for each year of earned service increased annually by the CPI-U.
Refunds
Upon termination of employment, a refund of member contributions and accumulated interest is available to the member.
Interest on Accounts
Active member accounts have been credited with interest on July 1 of each year at 3% compounded annually through June 30, 1980; 6% thereafter through June 30, 1986; 4% thereafter through June 30, 2003, and 2.5% thereafter.
Changes in Benefi t Provisions
HB 380: 2006 Regular Session
KERS & SPRS Employer Rate Reductions Employer Contribution Rates: HB 380, the Executive Branch Budget Bill, eff ectively reduced the employer contribution rate recommended by the actuary and adopted by the Board for KERS and SPRS for fi scal year 2006-2007 and 2007-2008. The recommended rate and the rate budgeted by HB 380 are provided in the statistical section.

Statistical Section
Membership by System 128
Schedule of Participating Employers 130
Net Plan Assets by System 132
Changes in Net Plan Assets by System 133
Schedule of Benefi t Expenses by Type 138
Average Monthly Benefi t by Length of Service 143
Analysis of New Retirees 144
Insurance Benefi ts Paid All Retirees & Benefi ciaries 145
Payment Options by Type 146
Employer Contribution Rates 148
Retirement Window 149
Insurance Contracts by Type 150
Retired ReEmployed 152
Payments by County 153
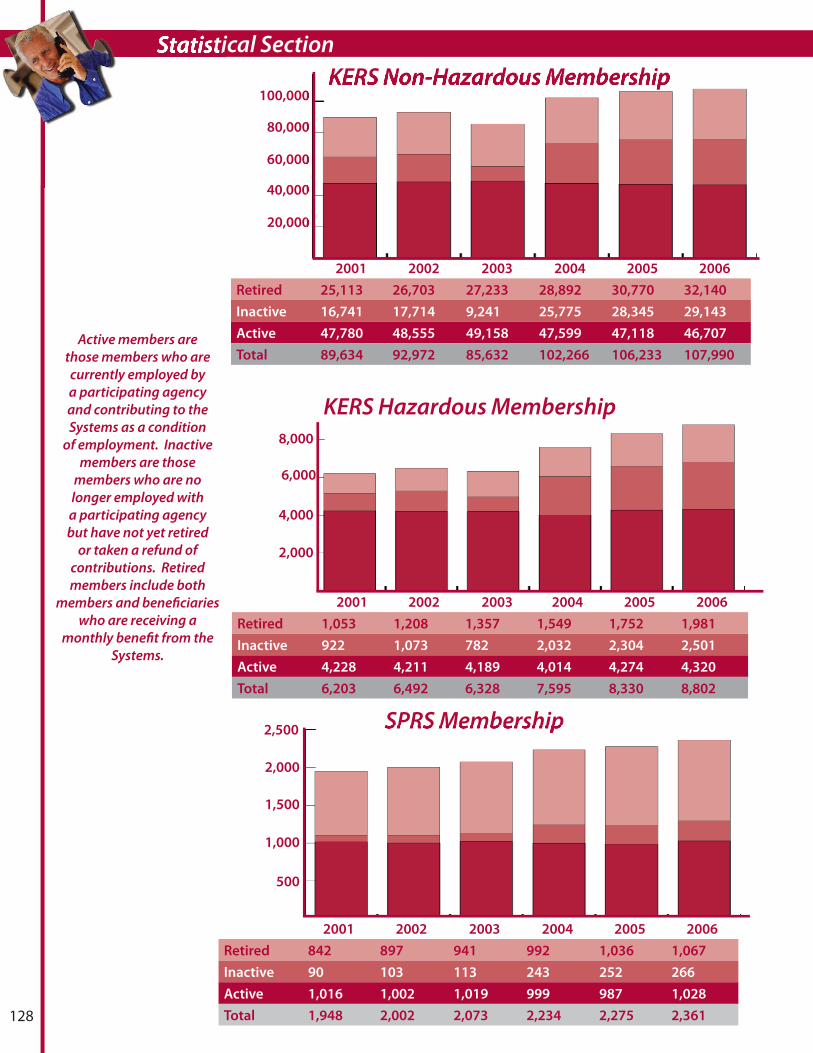
Statistical Section
128
KERS Non-Hazardous Membership
2001 2002 2003 2004 2005 2006
Retired 25,113 26,703 27,233 28,892 30,770 32,140
Inactive 16,741 17,714 9,241 25,775 28,345 29,143
Active 47,780 48,555 49,158 47,599 47,118 46,707
Total 89,634 92,972 85,632 102,266 106,233 107,990
100,000
80,000
20,000
40,000
60,000
2,000
1,500
1,000
500
2001 2002 2003 2004 2005 2006
Retired 842 897 941 992 1,036 1,067
Inactive 90 103 113 243 252 266
Active 1,016 1,002 1,019 999 987 1,028
Total 1,948 2,002 2,073 2,234 2,275 2,361
SPRS Membership
2001 2002 2003 2004 2005 2006
Retired 1,053 1,208 1,357 1,549 1,752 1,981
Inactive 922 1,073 782 2,032 2,304 2,501
Active 4,228 4,211 4,189 4,014 4,274 4,320
Total 6,203 6,492 6,328 7,595 8,330 8,802
8,000
2,000
4,000
6,000
KERS Hazardous Membership
Active members are those members who are currently employed by a participating agency and contributing to the Systems as a condition
of employment. Inactive members are those
members who are no longer employed with a participating agency but have not yet retired
or taken a refund of contributions. Retired members include both
members and benefi ciaries who are receiving a
monthly benefi t from the Systems.
2,500

129
Statistical Section
CERS Hazardous Membership
SPRS Membership
2001 2002 2003 2004 2005 2006
Retired 3,221 3,483 3,737 4,005 4,361 4,712
Inactive 610 700 781 1,648 1,971 1,955
Active 8,586 8,949 9,286 9,349 9,464 9,635
Total 12,417 13,132 13,804 15,002 15,796 16,302
5,000
15,000
10,000
100,000
50,000
150,000
CERS Non-Hazardous Membership
2001 2002 2003 2004 2005 2006
Retired 24,415 32,326 27,092 29,129 31,347 33,102
Inactive 28,356 30,978 32,326 44,419 48,869 50,046
Active 78,773 79,850 82,288 80,922 81,240 83,694
Total 131,544 143,154 141,706 154,470 161,456 165,786
2001 2002 2003 2004 2005 2006
Retired 54,644 64,617 60,360 64,567 69,266 73,002
Inactive 46,719 50,568 43,243 74,117 81,741 83,911
Active 140,383 142,567 145,940 142,883 143,083 145,384
Total 241,746 257,752 249,543 281,567 294,090 302,297
200,000
150,000
100,000
50,000
300,000
250,000
KRS Membership
Active members are those members who are currently employed by a participating agency and contributing to the Systems as a condition
of employment. Inactive members are those
members who are no longer employed with a participating agency but have not yet retired
or taken a refund of contributions. Retired members include both
members and benefi ciaries who are receiving a
monthly benefi t from the Systems.
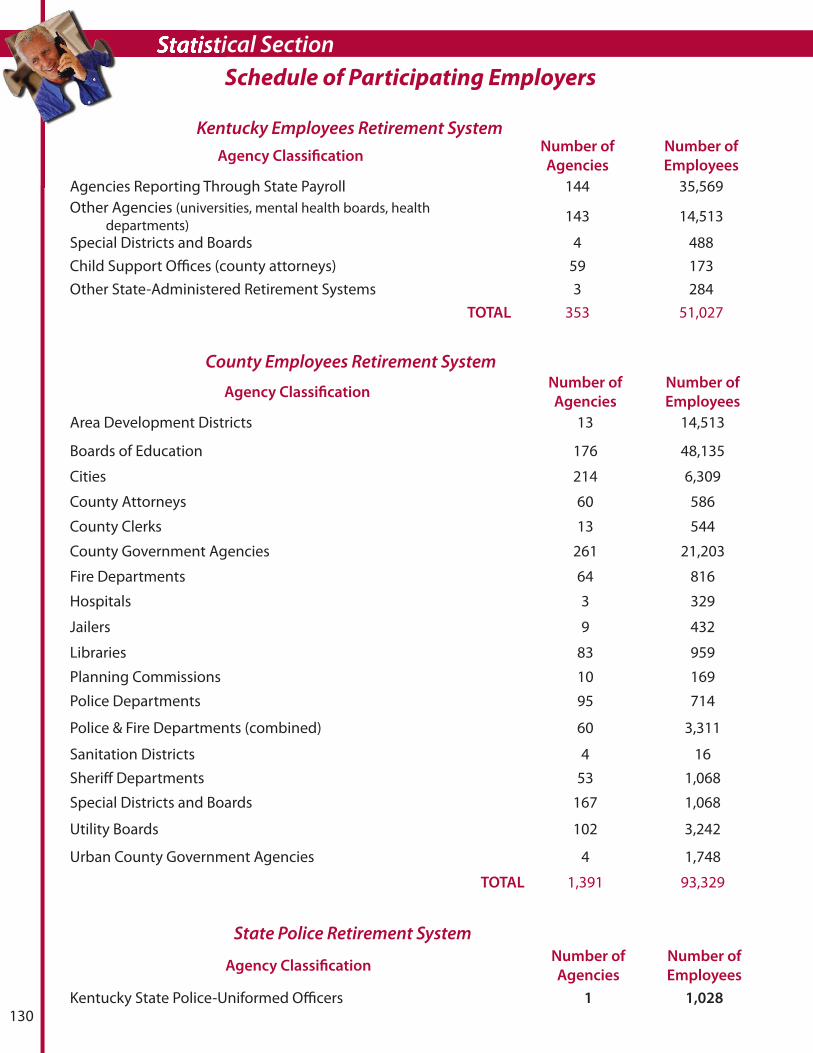
Statistical Section
130
Kentucky Employees Retirement SystemAgency Classifi cation
Number of
Agencies
Number of
Employees
Agencies Reporting Through State Payroll 144 35,569Other Agencies (universities, mental health boards, health
departments) 143 14,513
Special Districts and Boards 4 488Child Support Offi ces (county attorneys) 59 173Other State-Administered Retirement Systems 3 284
TOTAL 353 51,027
County Employees Retirement System
Agency Classifi cationNumber of
Agencies
Number of
Employees
Area Development Districts 13 14,513
Boards of Education 176 48,135
Cities 214 6,309
County Attorneys 60 586
County Clerks 13 544
County Government Agencies 261 21,203
Fire Departments 64 816
Hospitals 3 329
Jailers 9 432
Libraries 83 959
Planning Commissions 10 169
Police Departments 95 714
Police & Fire Departments (combined) 60 3,311
Sanitation Districts 4 16Sheriff Departments 53 1,068
Special Districts and Boards 167 1,068
Utility Boards 102 3,242
Urban County Government Agencies 4 1,748
TOTAL 1,391 93,329
State Police Retirement System
Agency Classifi cationNumber of
Agencies
Number of
Employees
Kentucky State Police-Uniformed Offi cers 1 1,028
Schedule of Participating Employers
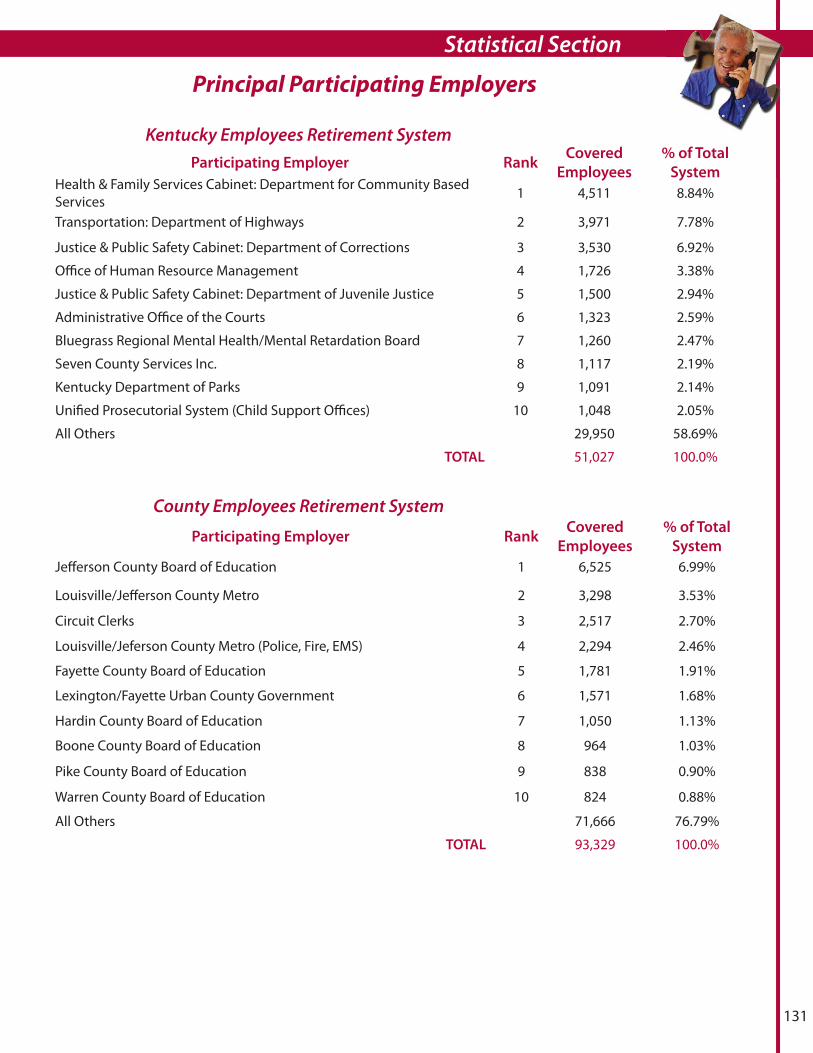
131
Statistical Section
Kentucky Employees Retirement SystemParticipating Employer Rank
Covered
Employees
% of Total
SystemHealth & Family Services Cabinet: Department for Community Based Services 1 4,511 8.84%
Transportation: Department of Highways 2 3,971 7.78%
Justice & Public Safety Cabinet: Department of Corrections 3 3,530 6.92%
Offi ce of Human Resource Management 4 1,726 3.38%
Justice & Public Safety Cabinet: Department of Juvenile Justice 5 1,500 2.94%
Administrative Offi ce of the Courts 6 1,323 2.59%
Bluegrass Regional Mental Health/Mental Retardation Board 7 1,260 2.47%
Seven County Services Inc. 8 1,117 2.19%
Kentucky Department of Parks 9 1,091 2.14%
Unifi ed Prosecutorial System (Child Support Offi ces) 10 1,048 2.05%
All Others 29,950 58.69%
TOTAL 51,027 100.0%
County Employees Retirement System
Participating Employer RankCovered
Employees
% of Total
System
Jeff erson County Board of Education 1 6,525 6.99%
Louisville/Jeff erson County Metro 2 3,298 3.53%
Circuit Clerks 3 2,517 2.70%
Louisville/Jeferson County Metro (Police, Fire, EMS) 4 2,294 2.46%
Fayette County Board of Education 5 1,781 1.91%
Lexington/Fayette Urban County Government 6 1,571 1.68%
Hardin County Board of Education 7 1,050 1.13%
Boone County Board of Education 8 964 1.03%
Pike County Board of Education 9 838 0.90%
Warren County Board of Education 10 824 0.88%
All Others 71,666 76.79%
TOTAL 93,329 100.0%
Principal Participating Employers

Statistical Section
132
Net Plan Assets by System
Kentucky Employees Retirement System(Dollars in Thousands)
Non-Hazardous HazardousPension Insurance Total Pension Insurance Total
June 30 2001 $5,484,564 $396,254 $5,880,818 $305,544 $107,592 $413,136June 30 2002 5,005,191 465,665 5,470,856 301,800 109,769 411,569June 30 2003 4,929,319 487,071 5,416,390 320,513 125,522 446,035June 30 2004 5,258,995 587,681 5,846,676 366,568 162,127 528,695June 30 2005 5,362,631 610,901 5,973,532 398,308 188,871 587,179
June 30 2006 5,440,133 612,643 6,052,776 437,030 223,523 660,553
County Employees Retirement System(Dollars in Thousands)
Non-Hazardous Hazardous
Pension Insurance Total Pension Insurance TotalJune 30 2001 $4,397,347 $331,067 $4,728,414 $1,211,155 $173,636 $1,384,791June 30 2002 4,126,756 365,333 4,492,089 1,144,349 187,534 1,331,883June 30 2003 4,175,825 435,500 4,611,325 1,168,776 223,168 1,391,944June 30 2004 4,613,335 563,877 5,177,212 1,305,012 297,737 1,602,749June 30 2005 4,893,600 668,485 5,562,085 1,411,246 360,940 1,772,186June 30 2006 5,191,377 813,251 6,004,628 1,528,845 441,279 1,970,124
State Police Retirement System
Kentucky Retirement SystemsTotal
(Dollars in Thousands) (Dollars in Thousands)
Pension Insurance Total Pension Insurance TotalJune 30 2001 $364,592 $69,926 $434,518 $11,763,200 $1,078,475 $12,841,675
June 30 2002 328,744 68,074 396,818 10,906,841 1,196,375 12,103,216
June 30 2003 319,115 72,538 391,653 10,913,548 1,343,799 12,257,347
June 30 2004 335,721 90,420 426,141 11,879,631 1,701,842 13,581,473
June 30 2005 339,406 99,408 438,814 12,405,191 1,928,605 14,333,796
June 30 2006 352,841 110,491 463,332 12,950,226 2,201,187 15,151,413

133
Statistical Section
Changes in Net Plan Assets by System
Kentucky Employees Retirement System Non-Hazardous Pension Fund
Fiscal Year 2001 2002 2003 2004 2005 2006
Additions
Member Contributions $106,648 $111,992 $137,124 $129,077 $127,801 $107,607
Employer Contributions $23,482 $1,760 $7,597 $21,697 $50,333 $60,681
Net Investment Income -$360,648 -$236,405 $196,106 $651,532 $462,638 $504,361
Total Additions -$230,518 -$122,653 $340,827 $802,306 $640,772 $672,649
Deductions
Benefi t Payments $291,704 $345,666 $404,896 $459,367 $522,396 $577,947
Refunds $6,968 $6,657 $7,258 $8,001 $8,824 $9,632
Administrative Expenses $3,826 $4,399 $4,959 $5,262 $5,916 $7,568
Other Expenses -$125 -$2 $0 $0 $0 $0
Total Deductions $302,373 $356,720 $417,113 $472,630 $537,136 $595,147
Change in Net Assets -$532,892 -$479,373 -$76,286 $329,676 $103,636 $77,502
Kentucky Employees Retirement System Non-Hazardous Insurance Fund
Fiscal Year
2001 2002 2003 2004 2005 2006Additions
Employer Contributions $66,875 $65,335 $65,335 $78,017 $51,432 $47,635
Net Investment Income -$16,293 $19,582 $8,050 $83,064 $47,823 $65,839
Other Income $0 $0 $0 $0 $0 $5,770
Total Additions $50,582 $84,917 $73,385 $161,081 $99,255 $119,244
Deductions
Benefi t Payments $37,301 $43,738 $51,586 $59,987 $75,571 $95,823
Administrative Expenses $308 $345 $393 $484 $464 $1,679
Other Expenses $0 $0 $0 $0 $0 $20,000
Total Deductions $37,609 $44,083 $51,979 $60,471 $76,035 $117,502
Change in Net Assets $12,973 $69,410 $21,406 $100,610 $23,220 $1,742
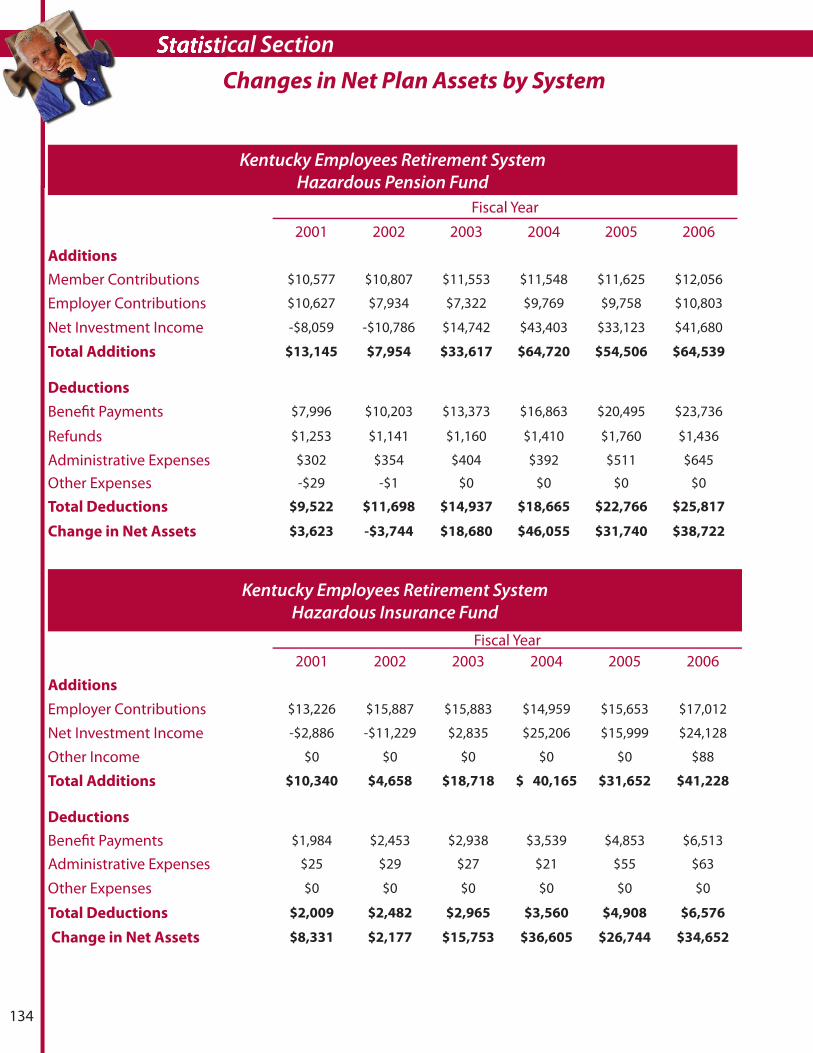
Statistical Section
134
Kentucky Employees Retirement SystemHazardous Pension Fund
Fiscal Year
2001 2002 2003 2004 2005 2006
Additions
Member Contributions $10,577 $10,807 $11,553 $11,548 $11,625 $12,056
Employer Contributions $10,627 $7,934 $7,322 $9,769 $9,758 $10,803
Net Investment Income -$8,059 -$10,786 $14,742 $43,403 $33,123 $41,680
Total Additions $13,145 $7,954 $33,617 $64,720 $54,506 $64,539
Deductions
Benefi t Payments $7,996 $10,203 $13,373 $16,863 $20,495 $23,736
Refunds $1,253 $1,141 $1,160 $1,410 $1,760 $1,436
Administrative Expenses $302 $354 $404 $392 $511 $645
Other Expenses -$29 -$1 $0 $0 $0 $0
Total Deductions $9,522 $11,698 $14,937 $18,665 $22,766 $25,817
Change in Net Assets $3,623 -$3,744 $18,680 $46,055 $31,740 $38,722
Changes in Net Plan Assets by System
Kentucky Employees Retirement SystemHazardous Insurance Fund
Fiscal Year2001 2002 2003 2004 2005 2006
Additions
Employer Contributions $13,226 $15,887 $15,883 $14,959 $15,653 $17,012
Net Investment Income -$2,886 -$11,229 $2,835 $25,206 $15,999 $24,128
Other Income $0 $0 $0 $0 $0 $88
Total Additions $10,340 $4,658 $18,718 $ 40,165 $31,652 $41,228
Deductions
Benefi t Payments $1,984 $2,453 $2,938 $3,539 $4,853 $6,513
Administrative Expenses $25 $29 $27 $21 $55 $63
Other Expenses $0 $0 $0 $0 $0 $0
Total Deductions $2,009 $2,482 $2,965 $3,560 $4,908 $6,576
Change in Net Assets $8,331 $2,177 $15,753 $36,605 $26,744 $34,652

135
Statistical Section
County Employees Retirement SystemNon-Hazardous Insurance Fund
Fiscal Year
2001 2002 2003 2004 2005 2006Additions
Employer Contributions $62,292 $102,151 $99,235 $89,344 $107,632 $128,868
Net Investment Income -$10,988 -$34,899 $10,625 $86,080 $55,723 $83,991
Other Income $0 $0 $0 $0 $0 $6,365
Total Additions $51,304 $67,252 $109,860 $175,424 $163,355 $219,224
Deductions
Benefi t Payments $27,539 $32,726 $39,387 $46,654 $58,262 $72,919
Administrative Expenses $244 $260 $306 $393 $485 $1,539
Other Expenses $0 $0 $0 $0 $0 $0
Total Deductions $27,783 $32,986 $39,693 $47,047 $58,747 $74,458
Change in Net Assets $23,521 $34,265 $70,167 $128,377 $104,608 $144,766
Changes in Net Plan Assets by System
County Employees Retirement SystemNon-Hazardous Pension Fund
Fiscal Year
2001 2002 2003 2004 2005 2006Additions
Member Contributions $101,597 $122,428 $125,301 $122,484 $127,637 $112,372
Employer Contributions $48,914 $5,528 $11,856 $44,028 $54,617 $90,834
Net Investment Income -$241,107 -$186,375 $160,110 $551,669 $413,672 $444,092
Total Additions -$90,596 -$58,419 $297,267 $718,181 $595,926 $647,298
Deductions
Benefi t Payments $170,256 $196,659 $230,317 $260,643 $294,590 $325,135
Refunds $8,994 $8,325 $10,213 $11,334 $11,042 $11,589
Administrative Expenses $6,174 $7,187 $8,244 $8,694 $10,029 $12,797Other Expenses -$213 $0 $0 $0 $0 $0
Total Deductions $185,211 $212,171 $248,774 $280,671 $315,661 $349,521
Change in Net Assets -$275,808 -$270,590 $48,493 $437,510 $280,265 $297,777
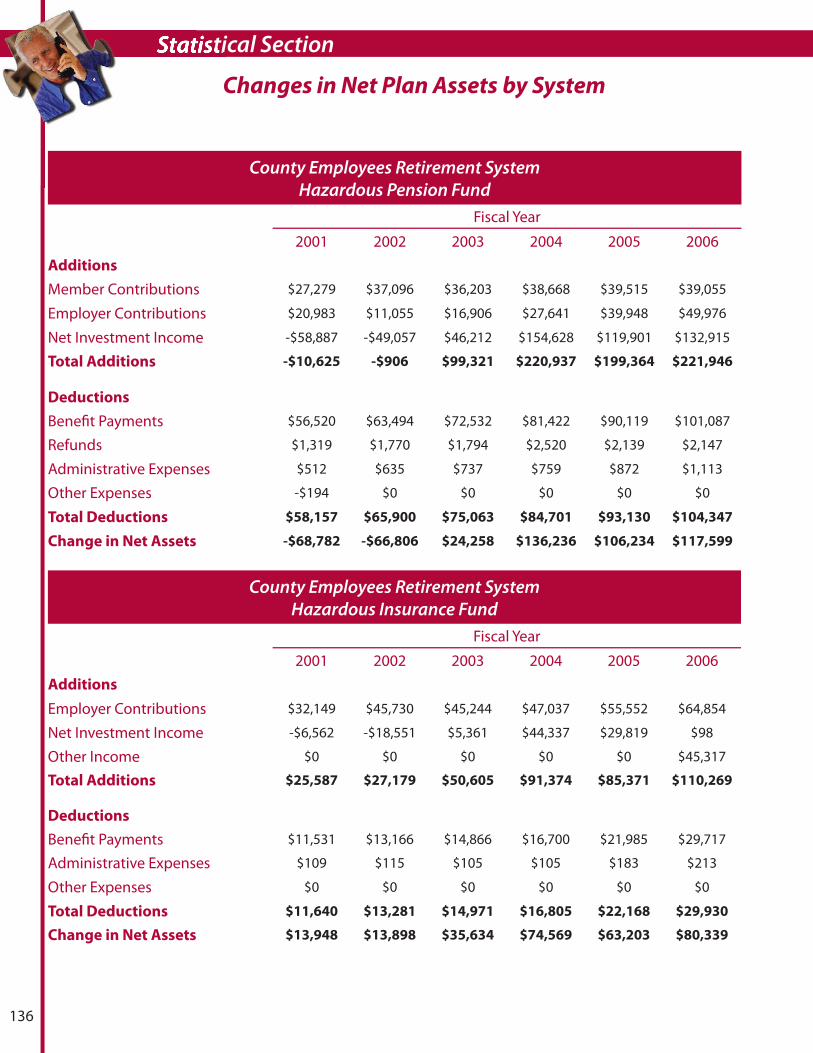
Statistical Section
136
Changes in Net Plan Assets by System
County Employees Retirement SystemHazardous Pension Fund
Fiscal Year
2001 2002 2003 2004 2005 2006Additions
Member Contributions $27,279 $37,096 $36,203 $38,668 $39,515 $39,055
Employer Contributions $20,983 $11,055 $16,906 $27,641 $39,948 $49,976
Net Investment Income -$58,887 -$49,057 $46,212 $154,628 $119,901 $132,915
Total Additions -$10,625 -$906 $99,321 $220,937 $199,364 $221,946
Deductions
Benefi t Payments $56,520 $63,494 $72,532 $81,422 $90,119 $101,087
Refunds $1,319 $1,770 $1,794 $2,520 $2,139 $2,147
Administrative Expenses $512 $635 $737 $759 $872 $1,113
Other Expenses -$194 $0 $0 $0 $0 $0
Total Deductions $58,157 $65,900 $75,063 $84,701 $93,130 $104,347
Change in Net Assets -$68,782 -$66,806 $24,258 $136,236 $106,234 $117,599
County Employees Retirement SystemHazardous Insurance Fund
Fiscal Year
2001 2002 2003 2004 2005 2006Additions
Employer Contributions $32,149 $45,730 $45,244 $47,037 $55,552 $64,854
Net Investment Income -$6,562 -$18,551 $5,361 $44,337 $29,819 $98
Other Income $0 $0 $0 $0 $0 $45,317
Total Additions $25,587 $27,179 $50,605 $91,374 $85,371 $110,269
Deductions
Benefi t Payments $11,531 $13,166 $14,866 $16,700 $21,985 $29,717
Administrative Expenses $109 $115 $105 $105 $183 $213
Other Expenses $0 $0 $0 $0 $0 $0
Total Deductions $11,640 $13,281 $14,971 $16,805 $22,168 $29,930
Change in Net Assets $13,948 $13,898 $35,634 $74,569 $63,203 $80,339

137
Statistical Section
Changes in Net Plan Assets by System
State Police Retirement SystemPension Fund
Fiscal Year
2001 2002 2003 2004 2005 2006Additions
Member Contributions $4,138 $4,499 $4,674 $4,875 $4,228 $4,814
Employer Contributions $1,516 -$18 -$20 $1,153 $2,852 $4,244
Net Investment Income -$29,856 -$15,388 $13,755 $41,642 $29,761 $39,347
Total Additions -$24,202 -$10,906 $18,409 $47,670 $36,841 $48,405
Deductions
Benefi t Payments $22,644 $24,839 $27,862 $30,877 $32,921 $34,703
Refunds $80 $25 $97 $96 $131 $133
Administrative Expenses $64 $76 $86 $91 $104 $134
Other Expenses -$52 $1 $0 $0 $0 $0
Total Deductions $22,737 $24,941 $28,045 $31,064 $33,156 $34,970
Change in Net Assets -$46,939 -$35,848 -$9,636 $16,606 $3,685 $13,435
State Police Retirement SystemInsurance Fund
Fiscal Year2001 2002 2003 2004 2005 2006
Additions
Employer Contributions $8,113 $9,580 $7,654 $8,456 $6,974 $6,880
Net Investment Income -$4,029 -$7,382 $1,360 $14,449 $8,279 $12,082
Other Income $0 $0 $0 $0 $0 $5
Total Additions $4,084 $2,198 $9,014 $22,905 $15,253 $18,967
Deductions
Benefi t Payments $3,547 $4,020 $4,519 $4,992 $6,221 $7,816
Administrative Expenses $28 $29 $31 $31 $44 $68
Other Expenses $0 $0 $0 $0 $0 $0
Total Deductions $3,575 $4,049 $4,550 $5,023 $6,265 $7,884
Change in Net Assets $509 -$1,851 $4,464 $17,882 $8,988 $11,083

Statistical Section
138
Normal
Retirement
Early
Retirement
Disability
Retirement
Benefi ciary
Payments Total
FY 2000-01
Average Benefi t $727 $1,163 $750 $601 $980
Number 3,779 15,101 1,902 3,595 24,377
Total Monthly Benefi ts $2,746,184 $17,561,789 $1,426,821 $2,162,372 $23,897,166
% of Total Monthly Benefi ts 11.5% 73.5% 6.0% 9.0% 100.0%
FY 2001-02
Average Benefi t $784 $1,314 $783 $650 $1,104
Number 3,714 16,561 1,913 3,659 25,847
Total Monthly Benefi ts $2,912,068 $21,755,957 $1,498,690 $2,377,149 $28,543,863
% of Total Monthly Benefi ts 10.2% 76.2% 5.3% 8.3% 100.0%
FY 2002-03
Average Benefi t $822 $1,430 $809 $688 $1,203
Number 3,706 17,917 1,922 3,708 27,253
Total Monthly Benefi ts $3,045,409 $25,626,447 $1,555,628 $2,551,366 $32,778,849
% of Total Monthly Benefi ts 9.3% 78.2% 4.7% 7.8% 100.0%
FY 2003-04
Average Benefi t $859 $1,537 $825 $721 $1,296
Number 3,768 19,477 1,925 3,740 28,910
Total Monthly Benefi ts 3,237,300 29,941,376 1,587,565 2,697,409 37,463,650
% of Total Monthly Benefi ts 8.6% 79.9% 4.2% 7.2% 100.0%
FY 2004-05
Average Benefi t $910 $1,632 $850 $739 $1,379
Number 3,866 21,092 1,910 3,902 30,770
Total Monthly Benefi ts $3,516,148 $34,423,089 1,623,500 2,882,916 42,445,653
% of Total Monthly Benefi ts 8.3% 81.1% 3.8% 6.8% 100.0%
FY 2005-06
Average Benefi t $888 $1,670 $834 $868 $1,469
Number 4,616 24,056 2,628 849 32,149
Total Monthly Benefi ts $4,099,896 $40,184,892 $2,190,812 $737,173 $47,212,773
% of Total Monthly Benefi ts 8.7% 85.1% 4.6% 1.6% 100.0%
Schedule of Benefi t Expenses by Type
KERS Non-Hazardous
The information in the above table includes only individuals receiving a monthly benefi t as of June 30 in the indicated fi scal year. Retired reemployed members and
individuals deceased prior to June are not included. As a result, the information for the current year will diff er from the benefi t payment totals listed in the Deductions
by Source.

139
Statistical Section
Normal
Retirement
Early
Retirement
Disability
Retirement
Benefi ciary
Payments Total
FY 2000-01
Average Benefi t $517 $1,016 $374 $473 $647
Number 502 318 112 124 1,056
Total Monthly Benefi ts $259,552 $323,101 $41,933 $58,596 $683,182
% of Total Monthly Benefi ts 38.0% 47.3% 6.1% 8.6% 100.0%
FY 2001-02
Average Benefi t $574 $1,110 $407 $520 $726
Number 559 394 116 143 1,212
Total Monthly Benefi ts $321,056 $437,318 $47,180 $74,411 $879,965
% of Total Monthly Benefi ts 36.5% 49.7% 5.4% 8.5% 100.0%
FY 2002-03
Average Benefi t $645 $1,173 $435 $576 $799
Number 626 464 115 157 1,362
Total Monthly Benefi ts $403,467 $544,066 $50,058 $90,368 $1,087,959
% of Total Monthly Benefi ts 37.1% 50.0% 4.6% 8.3% 100.0%
FY 2003-04
Average Benefi t $711 $1,221 $481 $613 $864
Number 718 554 129 157 1,558
Total Monthly Benefi ts $510,827 $676,463 $62,112 $96,194 $1,345,596
% of Total Monthly Benefi ts 38.0% 50.3% 4.6% 7.1% 100.0%
FY 2004-05
Average Benefi t $775 $1,292 $568 $600 $934
Number 808 647 117 180 1,752
Total Monthly Benefi ts $626,082 $836,193 $66,456 $107,998 $1,636,729
% of Total Monthly Benefi ts 38.3% 51.1% 4.1% 6.6% 100.0%
FY 2005-06
Average Benefi t $802 $1,333 $521 $749 $980
Number 1,002 760 163 67 1,992
Total Monthly Benefi ts $803,581 $1,013,373 $84,975 $50,201 $1,952,130
% of Total Monthly Benefi ts 41.1% 51.9% 4.4% 2.6% 100.0%
KERS Hazardous
The information in the above table includes only individuals receiving a monthly benefi t as of June 30 in the indicated fi scal year. . Retired reemployed members
and individuals deceased prior to June are not included. As a result, the information for the current year will diff er from the benefi t payment totals listed in the
Deductions by Source.
Schedule of Benefi t Expenses by Type
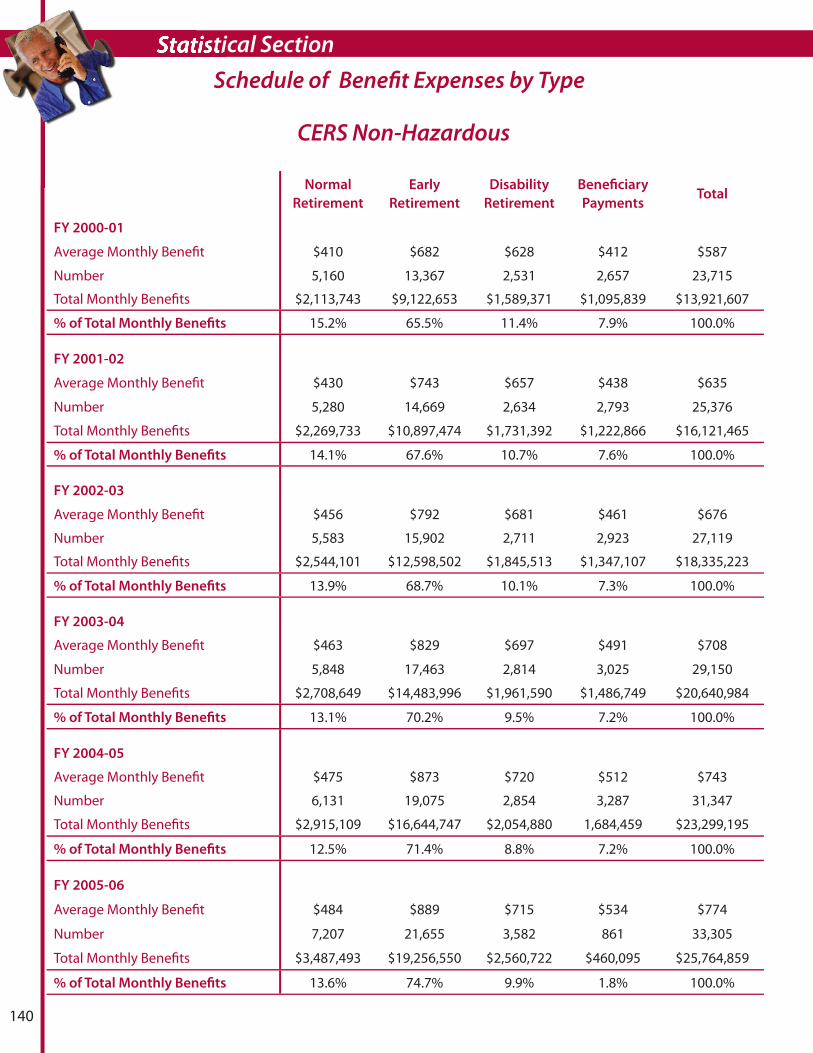
Statistical Section
140
Normal
Retirement
Early
Retirement
Disability
Retirement
Benefi ciary
PaymentsTotal
FY 2000-01
Average Monthly Benefi t $410 $682 $628 $412 $587
Number 5,160 13,367 2,531 2,657 23,715
Total Monthly Benefi ts $2,113,743 $9,122,653 $1,589,371 $1,095,839 $13,921,607
% of Total Monthly Benefi ts 15.2% 65.5% 11.4% 7.9% 100.0%
FY 2001-02
Average Monthly Benefi t $430 $743 $657 $438 $635
Number 5,280 14,669 2,634 2,793 25,376
Total Monthly Benefi ts $2,269,733 $10,897,474 $1,731,392 $1,222,866 $16,121,465
% of Total Monthly Benefi ts 14.1% 67.6% 10.7% 7.6% 100.0%
FY 2002-03
Average Monthly Benefi t $456 $792 $681 $461 $676
Number 5,583 15,902 2,711 2,923 27,119
Total Monthly Benefi ts $2,544,101 $12,598,502 $1,845,513 $1,347,107 $18,335,223
% of Total Monthly Benefi ts 13.9% 68.7% 10.1% 7.3% 100.0%
FY 2003-04
Average Monthly Benefi t $463 $829 $697 $491 $708
Number 5,848 17,463 2,814 3,025 29,150
Total Monthly Benefi ts $2,708,649 $14,483,996 $1,961,590 $1,486,749 $20,640,984
% of Total Monthly Benefi ts 13.1% 70.2% 9.5% 7.2% 100.0%
FY 2004-05
Average Monthly Benefi t $475 $873 $720 $512 $743
Number 6,131 19,075 2,854 3,287 31,347
Total Monthly Benefi ts $2,915,109 $16,644,747 $2,054,880 1,684,459 $23,299,195
% of Total Monthly Benefi ts 12.5% 71.4% 8.8% 7.2% 100.0%
FY 2005-06
Average Monthly Benefi t $484 $889 $715 $534 $774
Number 7,207 21,655 3,582 861 33,305
Total Monthly Benefi ts $3,487,493 $19,256,550 $2,560,722 $460,095 $25,764,859
% of Total Monthly Benefi ts 13.6% 74.7% 9.9% 1.8% 100.0%
Schedule of Benefi t Expenses by Type
CERS Non-Hazardous

141
Statistical Section
Normal
Retirement
Early
Retirement
Disability
Retirement
Benefi ciary
PaymentsTotal
FY 2000-01
Average Monthly Benefi t $1,314 $1,728 $746 $1,100 $1,479
Number 574 1,994 433 224 3,225
Total Monthly Benefi ts $753,998 $3,446,219 $323,149 $246,459 $4,769,825
% of Total Monthly Benefi ts 15.8% 72.3% 6.8% 5.2% 100.0%
FY 2001-02
Average Monthly Benefi t $1,360 $1,817 $782 $1,126 $1,552
Number 642 2,154 447 245 3,488
Total Monthly Benefi ts $873,325 $3,913,768 $349,511 $275,876 $5,412,480
% of Total Monthly Benefi ts 16.1% 72.3% 6.5% 5.1% 100.0%
FY 2002-03
Average Monthly Benefi t $1,371 $1,905 $814 $1,142 $1,615
Number 705 2,307 457 273 3,742
Total Monthly Benefi ts $966,828 $4,394,088 $371,773 $311,827 $6,044,517
% of Total Monthly Benefi ts 16.0% 72.7% 6.2% 5.2% 100.0%
FY 2003-04
Average Monthly Benefi t $1,371 $1,942 $824 $1,177 $1,643
Number 785 2,489 481 299 4,054
Total Monthly Benefi ts $1,076,329 $4,834,845 $396,302 $351,804 $6,659,280
% of Total Monthly Benefi ts 16.2% 72.6% 6.0% 5.3% 100.0%
FY 2004-05
Average Monthly Benefi t $1,399 $2,031 $1,159 $910 $1,705
Number 865 2,642 332 522 4,361
Total Monthly Benefi ts $1,209,803 $5,365,822 $384,788 $474,975 $7,435,388
% of Total Monthly Benefi ts 16.3% 72.2% 5.2% 6.4% 100.0%
FY 2005-06
Average Monthly Benefi t $1,369 $2,059 $899 $974 $1,743
Number 1,079 3,062 580 96 4,817
Total Monthly Benefi ts $1,477,504 $6,304,523 $521,285 $93,535 $8,396,847
% of Total Monthly Benefi ts 17.6% 75.1% 6.2% 1.1% 100.0%
CERS Hazardous
Schedule of Benefi t Expenses by Type

Statistical Section
142
Schedule of Benefi t Expenses by Type
SPRS
Normal
Retirement
Early
Retirement
Disability
Retirement
Benefi ciary
PaymentsTotal
FY 2000-01
Average Monthly Benefi t $2,796 $2,306 $1,013 $1,932 $2,256
Number 98 620 48 76 842
Total Monthly Benefi ts $274,013 $1,429,852 $48,647 $146,867 $1,899,379
% of Total Monthly Benefi ts 14.4% 75.3% 2.6% 7.7% 100.0%
FY 2001-02
Average Monthly Benefi t $3,008 $2,430 $984 $2,006 $2,383
Number 103 668 47 79 897
Total Monthly Benefi ts $309,836 $1,623,011 $46,243 $158,466 $2,137,556
% of Total Monthly Benefi ts 14.5% 75.9% 2.2% 7.4% 100.0%
FY 2002-03
Average Monthly Benefi t $3,117 $2,543 $1,056 $2,064 $2,492
Number 110 699 48 84 941
Total Monthly Benefi ts $342,894 $1,777,880 $50,705 $173,412 $2,344,891
% of Total Monthly Benefi ts 14.6% 75.8% 2.2% 7.4% 100.0%
FY 2003-04
Average Monthly Benefi t $3,199 $2,637 $1,067 $2,108 $2,576
Number 112 748 49 88 997
Total Monthly Benefi ts $358,290 $1,972,675 $52,259 $185,517 $2,568,741
% of Total Monthly Benefi ts 13.9% 76.8% 2.0% 7.2% 100.0%
FY 2004-05
Average Monthly Benefi t $3,321 $2,741 $1,364 $1,862 $2,653
Number 107 775 35 119 1,036
Total Monthly Benefi ts $355,361 $2,123,941 $47,740 $221,615 $2,748,657
% of Total Monthly Benefi ts 12.9% 77.3% 1.7% 8.1% 100.0%
FY 2004-05
Average Monthly Benefi t $3,109 $2,698 $1,213 $1,643 $2,650
Number 145 864 56 28 1,093
Total Monthly Benefi ts $450,794 $2,331,404 $67,950 $45,997 $2,896,146
% of Total Monthly Benefi ts 15.5% 80.4% 2.2% 1.9% 100.0%
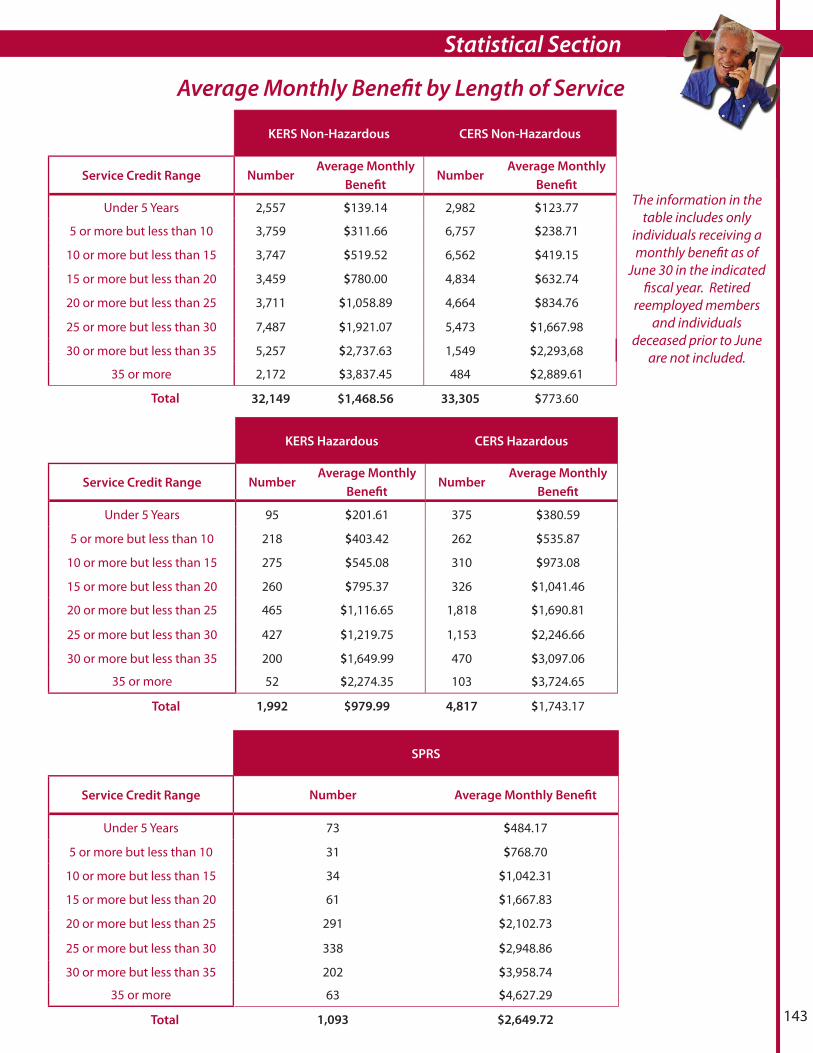
143
Statistical Section
KERS Non-Hazardous CERS Non-Hazardous
Service Credit Range NumberAverage Monthly
Benefi tNumber
Average Monthly
Benefi t
Under 5 Years 2,557 $139.14 2,982 $123.77
5 or more but less than 10 3,759 $311.66 6,757 $238.71
10 or more but less than 15 3,747 $519.52 6,562 $419.15
15 or more but less than 20 3,459 $780.00 4,834 $632.74
20 or more but less than 25 3,711 $1,058.89 4,664 $834.76
25 or more but less than 30 7,487 $1,921.07 5,473 $1,667.98
30 or more but less than 35 5,257 $2,737.63 1,549 $2,293,68
35 or more 2,172 $3,837.45 484 $2,889.61
Total 32,149 $1,468.56 33,305 $773.60
KERS Hazardous CERS Hazardous
Service Credit Range NumberAverage Monthly
Benefi tNumber
Average Monthly
Benefi t
Under 5 Years 95 $201.61 375 $380.59
5 or more but less than 10 218 $403.42 262 $535.87
10 or more but less than 15 275 $545.08 310 $973.08
15 or more but less than 20 260 $795.37 326 $1,041.46
20 or more but less than 25 465 $1,116.65 1,818 $1,690.81
25 or more but less than 30 427 $1,219.75 1,153 $2,246.66
30 or more but less than 35 200 $1,649.99 470 $3,097.06
35 or more 52 $2,274.35 103 $3,724.65
Total 1,992 $979.99 4,817 $1,743.17
Average Monthly Benefi t by Length of Service
The information in the table includes only
individuals receiving a monthly benefi t as of
June 30 in the indicated fi scal year. Retired
reemployed members and individuals
deceased prior to June are not included.
SPRS
Service Credit Range Number Average Monthly Benefi t
Under 5 Years 73 $484.17
5 or more but less than 10 31 $768.70
10 or more but less than 15 34 $1,042.31
15 or more but less than 20 61 $1,667.83
20 or more but less than 25 291 $2,102.73
25 or more but less than 30 338 $2,948.86
30 or more but less than 35 202 $3,958.74
35 or more 63 $4,627.29
Total 1,093 $2,649.72
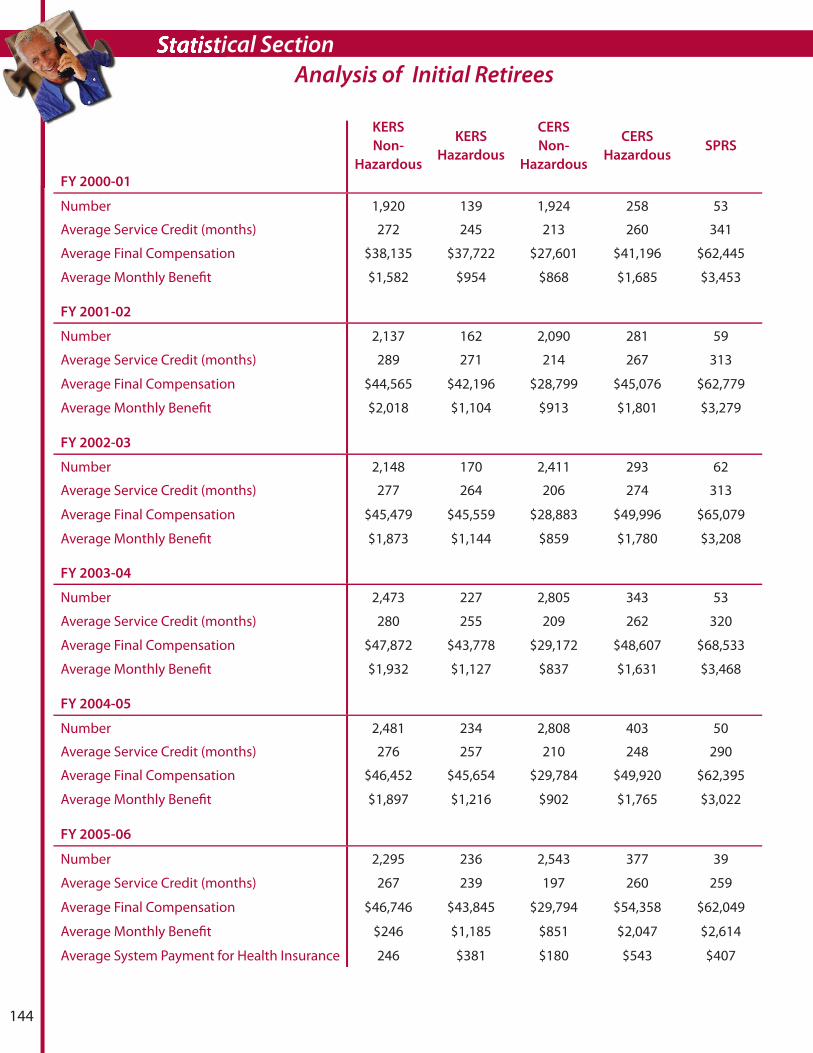
Statistical Section
144
KERS
Non-
Hazardous
KERS
Hazardous
CERS
Non-
Hazardous
CERS
HazardousSPRS
FY 2000-01
Number 1,920 139 1,924 258 53
Average Service Credit (months) 272 245 213 260 341
Average Final Compensation $38,135 $37,722 $27,601 $41,196 $62,445
Average Monthly Benefi t $1,582 $954 $868 $1,685 $3,453
FY 2001-02
Number 2,137 162 2,090 281 59
Average Service Credit (months) 289 271 214 267 313
Average Final Compensation $44,565 $42,196 $28,799 $45,076 $62,779
Average Monthly Benefi t $2,018 $1,104 $913 $1,801 $3,279
FY 2002-03
Number 2,148 170 2,411 293 62
Average Service Credit (months) 277 264 206 274 313
Average Final Compensation $45,479 $45,559 $28,883 $49,996 $65,079
Average Monthly Benefi t $1,873 $1,144 $859 $1,780 $3,208
FY 2003-04
Number 2,473 227 2,805 343 53
Average Service Credit (months) 280 255 209 262 320
Average Final Compensation $47,872 $43,778 $29,172 $48,607 $68,533
Average Monthly Benefi t $1,932 $1,127 $837 $1,631 $3,468
FY 2004-05
Number 2,481 234 2,808 403 50
Average Service Credit (months) 276 257 210 248 290
Average Final Compensation $46,452 $45,654 $29,784 $49,920 $62,395
Average Monthly Benefi t $1,897 $1,216 $902 $1,765 $3,022
FY 2005-06
Number 2,295 236 2,543 377 39
Average Service Credit (months) 267 239 197 260 259
Average Final Compensation $46,746 $43,845 $29,794 $54,358 $62,049
Average Monthly Benefi t $246 $1,185 $851 $2,047 $2,614
Average System Payment for Health Insurance 246 $381 $180 $543 $407
Analysis of Initial Retirees

145
Statistical Section
KERS Non-Hazardous CERS Non-Hazardous
Service Credit Range NumberAverage Monthly
Benefi tNumber
Average Monthly
Benefi t
Under 5 Years 177 $162.23 259 $124.53
5 or more but less than 10 1,208 $291.60 2,054 $237.76
10 or more but less than 15 2,064 $505.81 3,5564 $412.90
15 or more but less than 20 2,458 $784.37 3,438 $640.76
20 or more but less than 25 16,534 $2,243.28 10,685 $1,488.89
Total 22,441 $1,802.21 20,000 $1,005.20
KERS Hazardous CERS Hazardous
Service Credit Range NumberAverage Monthly
Benefi tNumber
Average Monthly
Benefi t
Under 5 Years 19 $374.25 35 $421.48
5 or more but less than 10 63 $534.49 99 $724.76
10 or more but less than 15 184 $747.74 191 $1,074.35
15 or more but less than 20 177 $1,108.72 261 $1,308.36
20 or more but less than 25 1,066 $2,234.81 3,282 $2,338.50
Total 1,509 $1,826.98 3,868 $2,147.92
Insurance Benefi ts Paid to All Retirees and Benefi ciaries
SPRS
Service Credit Range Number Average Monthly Benefi t
Under 5 Years 3 $266.16
5 or more but less than 10 11 $910.61
10 or more but less than 15 20 $1,086.76
15 or more but less than 20 49 $1,637.36
20 or more but less than 25 833 $3,039.57
Total 916 $2,887.27
KERS Non-Hazardous
KERS Hazardous
CERS Non-Hazardous
CERSHazardous SPRS
Number 22,441 1,509 20,000 3,868 916
Average Service Credit 298 269 238 282 317
Average Monthly System Payment for Health Insurance $341.32 $493.96 $291.57 $641.91 $651.79
Total Monthly Payments for Health Insurance $9,689,929.31 $839,474.59 $7,945,855.23 $2,635,157.46 $614,182.80
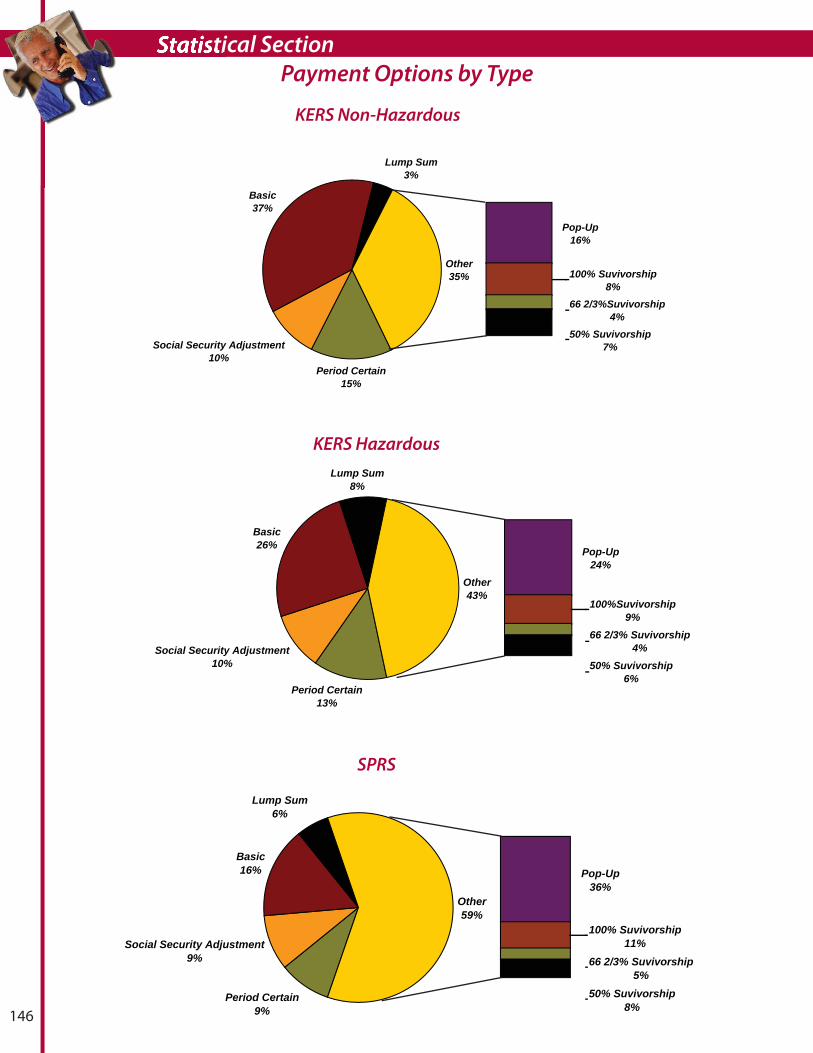
Statistical Section
146
Payment Options by Type
KERS Non-Hazardous
SPRS
KERS Hazardous
Period Certain15%
Social Security Adjustment10%
Basic37%
Lump Sum3%
Pop-Up16%
100% Suvivorship8%
66 2/3%Suvivorship4%
50% Suvivorship7%
Other35%
Period Certain13%
Social Security Adjustment10%
Basic26%
Lump Sum8%
Pop-Up24%
100%Suvivorship9%
66 2/3% Suvivorship4%
50% Suvivorship6%
Other43%
Period Certain9%
Social Security Adjustment9%
Basic16%
Lump Sum6%
Pop-Up36%
100% Suvivorship11%
66 2/3% Suvivorship5%
50% Suvivorship8%
Other59%

147
Statistical Section
CERS Non-Hazardous
CERS Hazardous
Total
Payment Options by Type
Period Certain17%
Social Security Adjustment5%
Basic42%
Lump Sum6%
Pop-Up13%
100% Suvivorship9%
66 2/3% Suvivorship3%
50% Suvivorship5%
Other30%
Period Certain9%
Social Security Adjustment9%
Basic16%
Lump Sum6%
Pop-Up36%
100% Suvivorship11%
66 2/3% Suvivorship5%
50% Suvivorship8%
Other59%
Period Certain15%
Social Security Adjustment8%
Basic37%
Lump Sum5%
Pop-Up17%
100% Suvivorship9%
66 2/3% Suvivorship3%
50% Suvivorship6%
Other35%

Statistical Section
148
KERS Non-Hazardous KERS Hazardous
Fiscal Year Budgeted Rate Recommended Rate Budgeted Rate Recommended Rate
2001-2002 5.89% 5.89% 18.84% 18.84%
2002-2003 3.76% 5.89% 17.60% 18.84%
2003-2004 5.89% 7.53% 18.84% 18.84%
2004-2005 5.89% 10.29% 18.84% 19.47%
2005-2006 5.89% 13.62% 18.84% 21.59%2006-2007 7.75% 17.13% 22.00% 23.32%
Employer Contribution Rates by System
In KERS, CERS, and SPRS both the employee and the employer contribute a percent of creditable compensation to the Systems. The employee contribution rate is set by state statute. Non-hazardous employees contribute 5% while hazardous duty members contribute 8%. Employers contribute at the rate determined by the Board of Trustees to be necessary for the actuarial soundness of the systems, as required by Kentucky Revised Statute 61.565 and 61.752. KERS and SPRS employer rates are subject to approval by the State Legislature through the adoption of the biennial Executive Branch Budget. In recent years, the State Legislature has routinely suspended KRS 61.565 in the budget in order to provide an employer contribution rate that is less than the amount recommended by the KRS Board of Trustees and its’ consulting actuary. The following tables provide the employer contribution rate recommended by the Board and its’ consulting actuary and the rate specifi ed by the Executive Branch budget if applicable.
CERS
Non-Hazardous
CERS
HazardousSPRS
Fiscal Year Recommended Rate Recommended Rate Budgeted Rate Recommended Rate
2001-2002 6.41% 16.28% 21.58% 21.58%
2002-2003 6.34% 16.28% 17.37% 21.58%
2003-2004 7.34% 18.51% 21.58% 21.58%
2004-2005 8.48% 22.08% 21.58% 28.08%2005-2006 10.98% 25.01% 21.58% 34.83%2006-2007 13.19% 28.21% 25.50% 42.30%
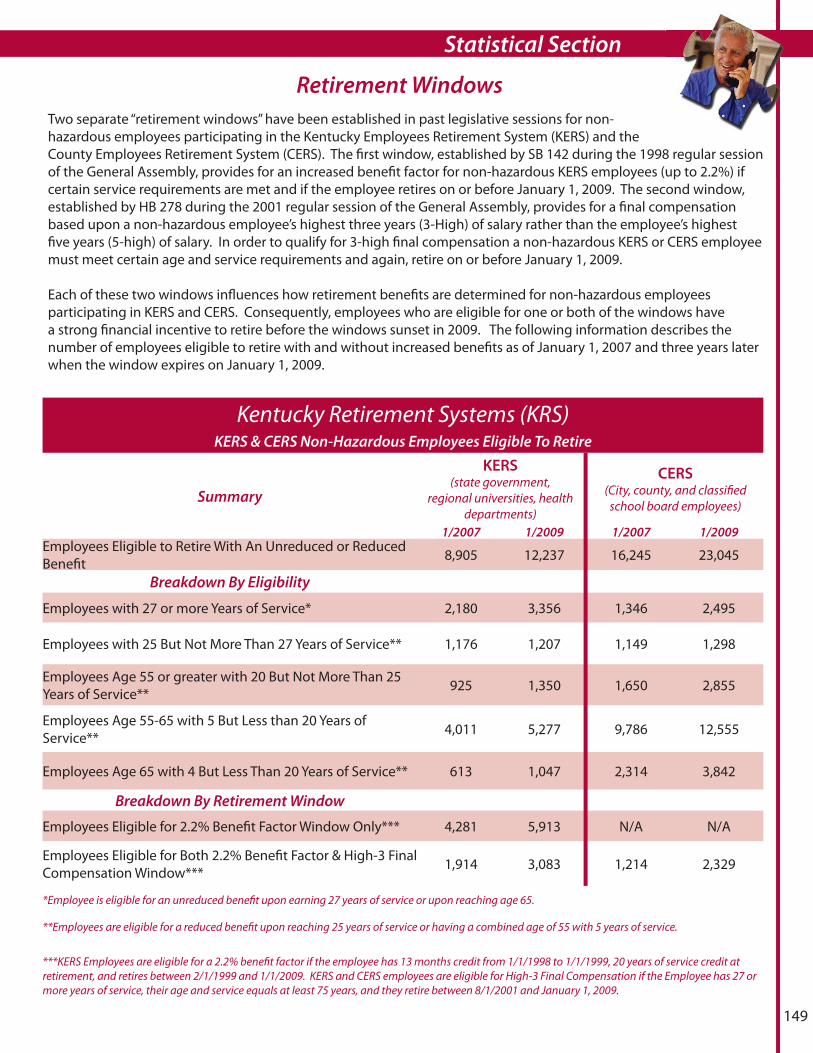
149
Statistical Section
Kentucky Retirement Systems (KRS)KERS & CERS Non-Hazardous Employees Eligible To Retire
Summary
KERS(state government,
regional universities, health departments)
CERS(City, county, and classifi ed
school board employees)
1/2007 1/2009 1/2007 1/2009Employees Eligible to Retire With An Unreduced or Reduced Benefi t 8,905 12,237 16,245 23,045
Breakdown By Eligibility
Employees with 27 or more Years of Service* 2,180 3,356 1,346 2,495
Employees with 25 But Not More Than 27 Years of Service** 1,176 1,207 1,149 1,298
Employees Age 55 or greater with 20 But Not More Than 25 Years of Service** 925 1,350 1,650 2,855
Employees Age 55-65 with 5 But Less than 20 Years of Service** 4,011 5,277 9,786 12,555
Employees Age 65 with 4 But Less Than 20 Years of Service** 613 1,047 2,314 3,842
Breakdown By Retirement Window
Employees Eligible for 2.2% Benefi t Factor Window Only*** 4,281 5,913 N/A N/A
Employees Eligible for Both 2.2% Benefi t Factor & High-3 Final Compensation Window*** 1,914 3,083 1,214 2,329
*Employee is eligible for an unreduced benefi t upon earning 27 years of service or upon reaching age 65.
**Employees are eligible for a reduced benefi t upon reaching 25 years of service or having a combined age of 55 with 5 years of service.
***KERS Employees are eligible for a 2.2% benefi t factor if the employee has 13 months credit from 1/1/1998 to 1/1/1999, 20 years of service credit at retirement, and retires between 2/1/1999 and 1/1/2009. KERS and CERS employees are eligible for High-3 Final Compensation if the Employee has 27 or more years of service, their age and service equals at least 75 years, and they retire between 8/1/2001 and January 1, 2009.
Two separate “retirement windows” have been established in past legislative sessions for non-hazardous employees participating in the Kentucky Employees Retirement System (KERS) and the County Employees Retirement System (CERS). The fi rst window, established by SB 142 during the 1998 regular session of the General Assembly, provides for an increased benefi t factor for non-hazardous KERS employees (up to 2.2%) if certain service requirements are met and if the employee retires on or before January 1, 2009. The second window, established by HB 278 during the 2001 regular session of the General Assembly, provides for a fi nal compensation based upon a non-hazardous employee’s highest three years (3-High) of salary rather than the employee’s highest fi ve years (5-high) of salary. In order to qualify for 3-high fi nal compensation a non-hazardous KERS or CERS employee must meet certain age and service requirements and again, retire on or before January 1, 2009.
Each of these two windows infl uences how retirement benefi ts are determined for non-hazardous employees participating in KERS and CERS. Consequently, employees who are eligible for one or both of the windows have a strong fi nancial incentive to retire before the windows sunset in 2009. The following information describes the number of employees eligible to retire with and without increased benefi ts as of January 1, 2007 and three years later when the window expires on January 1, 2009.
Retirement Windows

Statistical Section
150
The Systems provides group rates on medical insurance and other managed care coverage for retired members. Participation in the insurance program is optional and requires the completion of the proper forms at the time of retirement in order to obtain the insurance coverage. The Systems provides access to health insurance coverage through the Kentucky Employees Group Health Plan (KEHP) for recipients until they reach age 65 and/or become Medicare eligible. After a retired member becomes eligible for Medicare, coverage is available through a Medicare eligible plan off ered by the Systems. A retired member’s spouse and/or dependents may also be covered on health insurance through the Systems. Provided below are the contracts for the KEHP plan and the KRS Medicare Plans.
Insurance Contracts by Type
2001 2002 2003 2004 2005 2006
Medicare With Prescription 420 451 494 531 567 603
Medicare Without Prescription 52 66 62 65 61 74
KEHP Single 302 359 417 502 570 656
KEHP Couple/Family 185 205 234 276 319 378
KEHP Parent Plus 51 57 53 65 65 58
KERS Hazardous
2001 2002 2003 2004 2005 2006
Medicare With Prescription 278 303 312 326 348 368
Medicare Without Prescription 8 11 13 13 10 9
KEHP Single 194 199 218 226 257 260
KEHP Couple/Family 350 364 384 400 388 406
KEHP Parent Plus 47 50 44 45 34 29
SPRS
0
600
400
200
1,000
800
2001 2002 2003 2004 2005 2006
Medicare With Prescription 11,107 11,229 11,311 11,437 11,764 12,000
Medicare Without Prescription 1,818 1,838 1,855 1,932 1,915 1,672
KEHP Single 5,199 5,822 6,602 7,313 7,928 8,393
KEHP Couple/Family 1,070 1,182 1,298 1,462 1,679 1,826
KEHP Parent Plus 346 396 428 443 461 490
KERS Non-Hazardous
0
15,000
10,000
5,000
20,000
0
1,500
1,000
500

151
Statistical SectionInsurance Contracts by Type
2001 2002 2003 2004 2005 2006
Medicare With Prescription 8,974 9,517 9,958 10,424 11,005 11,803
Medicare Without Prescription 2,212 2,446 2,630 2,756 2,853 2,502
KEHP Single 4,215 4,530 5,054 5,598 6,014 249
KEHP Couple/Family 791 800 855 946 1,022 1,058
KEHP Parent Plus 204 224 244 246 255 6,298
CERS Non-Hazardous
2001 2002 2003 2004 2005 2006
Medicare With Prescription 694 734 808 913 1,004 1,105
Medicare Without Prescription 32 38 40 45 55 52
KEHP Single 869 956 1,010 1,087 1,220 1,275
KEHP Couple/Family 1,267 1,321 1,379 1,463 1,579 1,739
KEHP Parent Plus 202 210 223 223 195 198
CERS Hazardous
2001 2002 2003 2004 2005 2005
Medicare With Prescription 21,473 22,234 22,883 23,631 24,688 25,879
Medicare Without Prescription 4,122 4,399 4,600 4,811 4,894 4,309
KEHP Single 10,779 11,866 13,301 14,726 15,989 16,882
KEHP Couple/Family 3,663 3,872 4,150 4,547 4,987 5,407
KEHP Parent Plus 850 937 992 1,022 1,010 1,024
Total
0
10,000
40,000
20,000
50,000
30,000
0
3,000
2,000
1,000
5,000
4,000
0
15,000
10,000
5,000
20,000
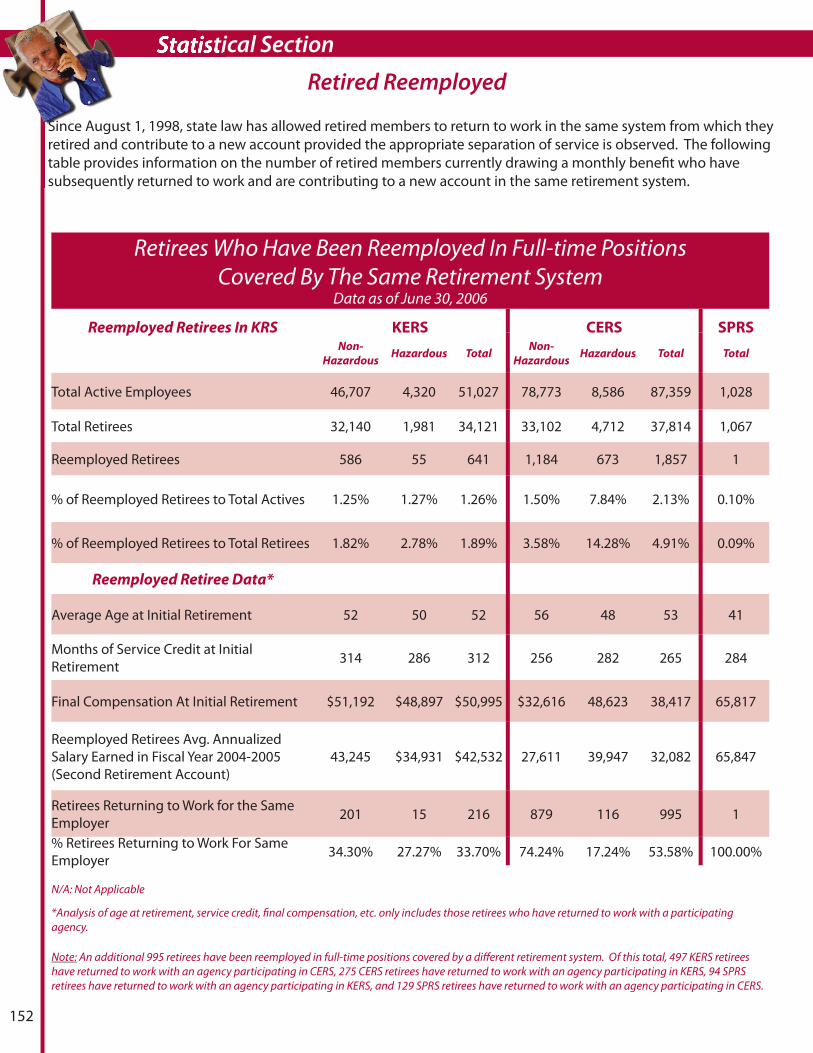
Statistical Section
152
Retirees Who Have Been Reemployed In Full-time PositionsCovered By The Same Retirement System
Data as of June 30, 2006
Reemployed Retirees In KRS KERS CERS SPRS Non-
HazardousHazardous Total
Non-
HazardousHazardous Total Total
Total Active Employees 46,707 4,320 51,027 78,773 8,586 87,359 1,028
Total Retirees 32,140 1,981 34,121 33,102 4,712 37,814 1,067
Reemployed Retirees 586 55 641 1,184 673 1,857 1
% of Reemployed Retirees to Total Actives 1.25% 1.27% 1.26% 1.50% 7.84% 2.13% 0.10%
% of Reemployed Retirees to Total Retirees 1.82% 2.78% 1.89% 3.58% 14.28% 4.91% 0.09%
Reemployed Retiree Data*
Average Age at Initial Retirement 52 50 52 56 48 53 41
Months of Service Credit at Initial Retirement 314 286 312 256 282 265 284
Final Compensation At Initial Retirement $51,192 $48,897 $50,995 $32,616 48,623 38,417 65,817
Reemployed Retirees Avg. Annualized Salary Earned in Fiscal Year 2004-2005 (Second Retirement Account)
43,245 $34,931 $42,532 27,611 39,947 32,082 65,847
Retirees Returning to Work for the Same Employer 201 15 216 879 116 995 1
% Retirees Returning to Work For Same Employer 34.30% 27.27% 33.70% 74.24% 17.24% 53.58% 100.00%
N/A: Not Applicable
*Analysis of age at retirement, service credit, fi nal compensation, etc. only includes those retirees who have returned to work with a participating agency.
Note: An additional 995 retirees have been reemployed in full-time positions covered by a diff erent retirement system. Of this total, 497 KERS retirees have returned to work with an agency participating in CERS, 275 CERS retirees have returned to work with an agency participating in KERS, 94 SPRS retirees have returned to work with an agency participating in KERS, and 129 SPRS retirees have returned to work with an agency participating in CERS.
Since August 1, 1998, state law has allowed retired members to return to work in the same system from which they retired and contribute to a new account provided the appropriate separation of service is observed. The following table provides information on the number of retired members currently drawing a monthly benefi t who have subsequently returned to work and are contributing to a new account in the same retirement system.
Retired Reemployed
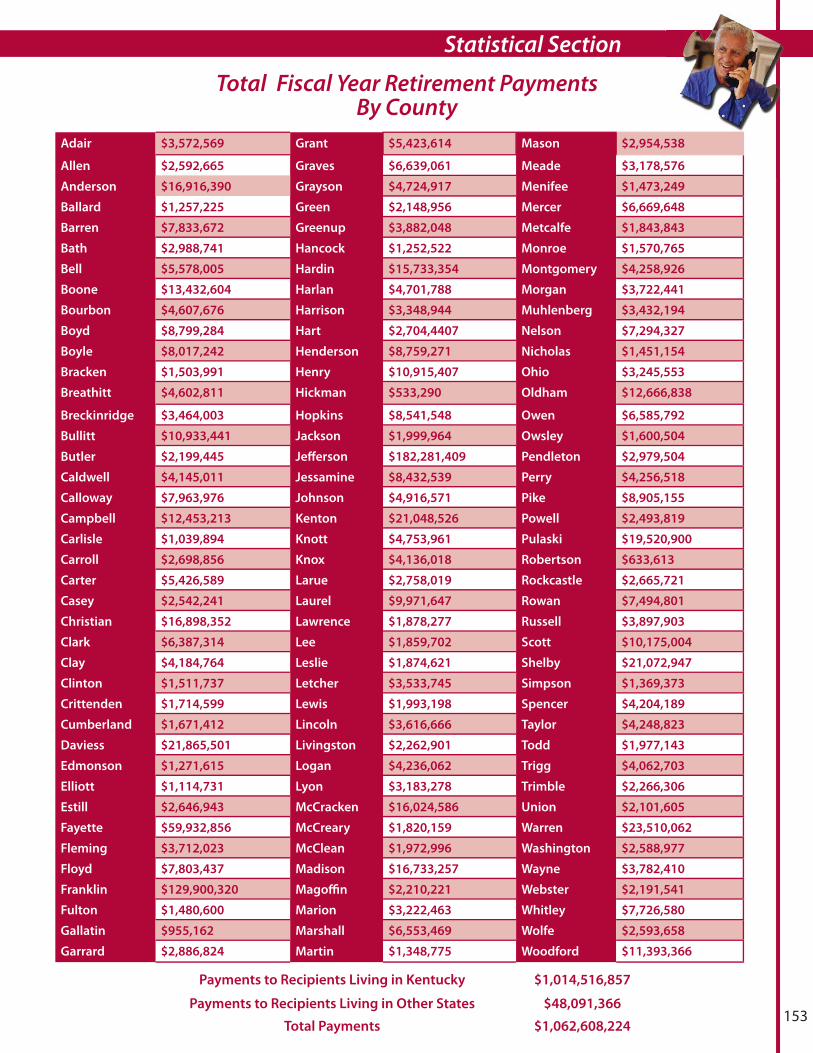
153
Statistical Section
Adair $3,572,569 Grant $5,423,614 Mason $2,954,538
Allen $2,592,665 Graves $6,639,061 Meade $3,178,576
Anderson $16,916,390 Grayson $4,724,917 Menifee $1,473,249
Ballard $1,257,225 Green $2,148,956 Mercer $6,669,648
Barren $7,833,672 Greenup $3,882,048 Metcalfe $1,843,843
Bath $2,988,741 Hancock $1,252,522 Monroe $1,570,765
Bell $5,578,005 Hardin $15,733,354 Montgomery $4,258,926
Boone $13,432,604 Harlan $4,701,788 Morgan $3,722,441
Bourbon $4,607,676 Harrison $3,348,944 Muhlenberg $3,432,194
Boyd $8,799,284 Hart $2,704,4407 Nelson $7,294,327
Boyle $8,017,242 Henderson $8,759,271 Nicholas $1,451,154
Bracken $1,503,991 Henry $10,915,407 Ohio $3,245,553
Breathitt $4,602,811 Hickman $533,290 Oldham $12,666,838
Breckinridge $3,464,003 Hopkins $8,541,548 Owen $6,585,792
Bullitt $10,933,441 Jackson $1,999,964 Owsley $1,600,504
Butler $2,199,445 Jeff erson $182,281,409 Pendleton $2,979,504
Caldwell $4,145,011 Jessamine $8,432,539 Perry $4,256,518
Calloway $7,963,976 Johnson $4,916,571 Pike $8,905,155
Campbell $12,453,213 Kenton $21,048,526 Powell $2,493,819
Carlisle $1,039,894 Knott $4,753,961 Pulaski $19,520,900
Carroll $2,698,856 Knox $4,136,018 Robertson $633,613
Carter $5,426,589 Larue $2,758,019 Rockcastle $2,665,721
Casey $2,542,241 Laurel $9,971,647 Rowan $7,494,801
Christian $16,898,352 Lawrence $1,878,277 Russell $3,897,903
Clark $6,387,314 Lee $1,859,702 Scott $10,175,004
Clay $4,184,764 Leslie $1,874,621 Shelby $21,072,947
Clinton $1,511,737 Letcher $3,533,745 Simpson $1,369,373
Crittenden $1,714,599 Lewis $1,993,198 Spencer $4,204,189
Cumberland $1,671,412 Lincoln $3,616,666 Taylor $4,248,823
Daviess $21,865,501 Livingston $2,262,901 Todd $1,977,143
Edmonson $1,271,615 Logan $4,236,062 Trigg $4,062,703
Elliott $1,114,731 Lyon $3,183,278 Trimble $2,266,306
Estill $2,646,943 McCracken $16,024,586 Union $2,101,605
Fayette $59,932,856 McCreary $1,820,159 Warren $23,510,062
Fleming $3,712,023 McClean $1,972,996 Washington $2,588,977
Floyd $7,803,437 Madison $16,733,257 Wayne $3,782,410
Franklin $129,900,320 Magoffi n $2,210,221 Webster $2,191,541
Fulton $1,480,600 Marion $3,222,463 Whitley $7,726,580
Gallatin $955,162 Marshall $6,553,469 Wolfe $2,593,658
Garrard $2,886,824 Martin $1,348,775 Woodford $11,393,366
Total Fiscal Year Retirement Payments By County
Payments to Recipients Living in Kentucky $1,014,516,857
Payments to Recipients Living in Other States $48,091,366
Total Payments $1,062,608,224