2014 Comprehensive Annual Financial Report - Wisconsinetf.wi.gov/about/2014-cafr.pdf · State of...
176
State of Wisconsin Department of Employee Trust Funds 2014 COMPREHENSIVE ANNUAL FINANCIAL REPORT For e Year Ended December 31, 2014
Transcript of 2014 Comprehensive Annual Financial Report - Wisconsinetf.wi.gov/about/2014-cafr.pdf · State of...

State of WisconsinDepartment of Employee Trust Funds
2014 COMPREHENSIVE ANNUAL FINANCIAL REPORTFor The Year Ended December 31, 2014


State of WisconsinDepartment of Employee Trust Funds
2014 COMPREHENSIVE ANNUAL FINANCIAL REPORTFor The Year Ended December 31, 2014
State of Wisconsin Department of Employee Trust FundsRobert Willett, Chief Trust Financial Officer and Controller
Wisconsin Department of Employee Trust FundsP.O. Box 7931Madison, Wis. 53707-79311-877-533-5020http://etf.wi.gov
Follow us on Twitter!
ET-8501
The Department of Employee Trust Funds does not discriminate on the basis of disability in the provision of programs, services or employment. If you are speech, hearing or visually impaired and need assistance, call toll free 1-877-533-5020 or 608-266-3285. You may also call Wisconsin Relay Service at 1-800-947-3529.


Public Pension Coordinating Council
Public Pension Standards Award For Funding and Administration
2014
Presented to
Wisconsin Department of Employee Trust Funds
In recognition of meeting professional standards for plan funding and administration as
set forth in the Public Pension Standards.
Presented by the Public Pension Coordinating Council, a confederation of
National Association of State Retirement Administrators (NASRA) National Conference on Public Employee Retirement Systems (NCPERS)
National Council on Teacher Retirement (NCTR)
Alan H. Winkle
Program Administrator

Table of Contents
IntroductionProgram Highlights. . . . . . . . . . . . . . . . . . . . . . . . . . . . . . . . . . . . . . . . . . . . . . . . . . . . . . . . . . . . . . . . . . . . . . . . . . . . . . . . . . . . . . . . . . . . . 2
ETF Boards and Department Organization. . . . . . . . . . . . . . . . . . . . . . . . . . . . . . . . . . . . . . . . . . . . . . . . . . . . . . . . . . . . . . . . . . . . . . 24
Legislation, Vision and Annual Accomplishments . . . . . . . . . . . . . . . . . . . . . . . . . . . . . . . . . . . . . . . . . . . . . . . . . . . . . . . . . . . . . . . 30
FinancesIndependent Auditor Report. . . . . . . . . . . . . . . . . . . . . . . . . . . . . . . . . . . . . . . . . . . . . . . . . . . . . . . . . . . . . . . . . . . . . . . . . . . . . . . . . . . 34
Financial Statements . . . . . . . . . . . . . . . . . . . . . . . . . . . . . . . . . . . . . . . . . . . . . . . . . . . . . . . . . . . . . . . . . . . . . . . . . . . . . . . . . . . . . . . . . . 38
Notes to Financial Statements. . . . . . . . . . . . . . . . . . . . . . . . . . . . . . . . . . . . . . . . . . . . . . . . . . . . . . . . . . . . . . . . . . . . . . . . . . . . . . . . . . 47
Required Supplementary Information . . . . . . . . . . . . . . . . . . . . . . . . . . . . . . . . . . . . . . . . . . . . . . . . . . . . . . . . . . . . . . . . . . . . . . . . . . 85
StatisticsWisconsin Retirement System. . . . . . . . . . . . . . . . . . . . . . . . . . . . . . . . . . . . . . . . . . . . . . . . . . . . . . . . . . . . . . . . . . . . . . . . . . . . . . . . . . 96
Group Health Insurance . . . . . . . . . . . . . . . . . . . . . . . . . . . . . . . . . . . . . . . . . . . . . . . . . . . . . . . . . . . . . . . . . . . . . . . . . . . . . . . . . . . . . . 109
Group Life Insurance . . . . . . . . . . . . . . . . . . . . . . . . . . . . . . . . . . . . . . . . . . . . . . . . . . . . . . . . . . . . . . . . . . . . . . . . . . . . . . . . . . . . . . . . . 111
Duty Disability Insurance . . . . . . . . . . . . . . . . . . . . . . . . . . . . . . . . . . . . . . . . . . . . . . . . . . . . . . . . . . . . . . . . . . . . . . . . . . . . . . . . . . . . . 114
Long-Term Disability Insurance . . . . . . . . . . . . . . . . . . . . . . . . . . . . . . . . . . . . . . . . . . . . . . . . . . . . . . . . . . . . . . . . . . . . . . . . . . . . . . . 116
Income Continuation Insurance . . . . . . . . . . . . . . . . . . . . . . . . . . . . . . . . . . . . . . . . . . . . . . . . . . . . . . . . . . . . . . . . . . . . . . . . . . . . . . . 117
Employee Reimbursement Accounts Program . . . . . . . . . . . . . . . . . . . . . . . . . . . . . . . . . . . . . . . . . . . . . . . . . . . . . . . . . . . . . . . . . 118
Department of Employee Trust Funds Administrative Expenses . . . . . . . . . . . . . . . . . . . . . . . . . . . . . . . . . . . . . . . . . . . . . . . . 119
ActuarialActuarial Statement of Assets and Liabilities . . . . . . . . . . . . . . . . . . . . . . . . . . . . . . . . . . . . . . . . . . . . . . . . . . . . . . . . . . . . . . . . . . . 124
Summary of Benefit Provisions . . . . . . . . . . . . . . . . . . . . . . . . . . . . . . . . . . . . . . . . . . . . . . . . . . . . . . . . . . . . . . . . . . . . . . . . . . . . . . . . 125
Actuarial Method and Assumptions Used in Valuations . . . . . . . . . . . . . . . . . . . . . . . . . . . . . . . . . . . . . . . . . . . . . . . . . . . . . . . . 127
InvestmentsState of Wisconsin Investment Board . . . . . . . . . . . . . . . . . . . . . . . . . . . . . . . . . . . . . . . . . . . . . . . . . . . . . . . . . . . . . . . . . . . . . . . . . . 142
Contributions Paid and Employer Unfunded Liability BalancesState Agencies . . . . . . . . . . . . . . . . . . . . . . . . . . . . . . . . . . . . . . . . . . . . . . . . . . . . . . . . . . . . . . . . . . . . . . . . . . . . . . . . . . . . . . . . . . . . . . . 144
Public Authorities . . . . . . . . . . . . . . . . . . . . . . . . . . . . . . . . . . . . . . . . . . . . . . . . . . . . . . . . . . . . . . . . . . . . . . . . . . . . . . . . . . . . . . . . . . . . 144
Cities. . . . . . . . . . . . . . . . . . . . . . . . . . . . . . . . . . . . . . . . . . . . . . . . . . . . . . . . . . . . . . . . . . . . . . . . . . . . . . . . . . . . . . . . . . . . . . . . . . . . . . . . 145
Villages . . . . . . . . . . . . . . . . . . . . . . . . . . . . . . . . . . . . . . . . . . . . . . . . . . . . . . . . . . . . . . . . . . . . . . . . . . . . . . . . . . . . . . . . . . . . . . . . . . . . . . 147
Special Districts . . . . . . . . . . . . . . . . . . . . . . . . . . . . . . . . . . . . . . . . . . . . . . . . . . . . . . . . . . . . . . . . . . . . . . . . . . . . . . . . . . . . . . . . . . . . . . 151
Towns. . . . . . . . . . . . . . . . . . . . . . . . . . . . . . . . . . . . . . . . . . . . . . . . . . . . . . . . . . . . . . . . . . . . . . . . . . . . . . . . . . . . . . . . . . . . . . . . . . . . . . . . 154
Counties . . . . . . . . . . . . . . . . . . . . . . . . . . . . . . . . . . . . . . . . . . . . . . . . . . . . . . . . . . . . . . . . . . . . . . . . . . . . . . . . . . . . . . . . . . . . . . . . . . . . . 158
School Districts. . . . . . . . . . . . . . . . . . . . . . . . . . . . . . . . . . . . . . . . . . . . . . . . . . . . . . . . . . . . . . . . . . . . . . . . . . . . . . . . . . . . . . . . . . . . . . . 159
Technical Colleges . . . . . . . . . . . . . . . . . . . . . . . . . . . . . . . . . . . . . . . . . . . . . . . . . . . . . . . . . . . . . . . . . . . . . . . . . . . . . . . . . . . . . . . . . . . . 166
Cooperative Educational Service Agencies (CESA) . . . . . . . . . . . . . . . . . . . . . . . . . . . . . . . . . . . . . . . . . . . . . . . . . . . . . . . . . . . . . 166

State of WisconsinDepartment of Employee Trust Funds
INTRODUC TION

2 COMPREHENSIVE ANNUAL FINANCIAL REPORT 2014
INTRODUCTION
Program Description
The Wisconsin Retirement System (WRS) collects and invests employee and employer contributions, and pays retirement, disability, and death benefits to former employees, and their beneficiaries, of the state and participating local governments in Wisconsin.
Financial Highlights
• For presentation purposes, the administrative fund, general fund, and fixed assets have been blended into the WRS financial statements. This blending resulted in an increase of $17.7 million in 2014 and an increase of $10.0 million in 2013 in the Net Position Held in Trust.
Program HighlightsThe following section presents condensed financial statements, statistical information, and analysis of the programs administered by the Department of Employee Trust Funds (ETF). All values in the Summary Financial Statements, including totals and percentages, have been rounded for presentation. As a result, totals and percentages may not appear to be calculated correctly.
Wisconsin Retirement System

2014 COMPREHENSIVE ANNUAL FINANCIAL REPORT 3
INTRODUCTION
Variable annuities increased by 15.7%, from $318 million to $368 million. Lump Sum Payments (separations, death benefits, and minimum annuities) decreased by 1.8%, from $123.5 million to $121.5 million. See “Annuity Payments” section below for details.
Funded Status
The funded status of the WRS is a measure of the extent to which the system has accumulated enough assets to pay the benefits earned by participants. The funded ratio is the ratio of plan assets to estimated future liabilities. The assets can be measured using either the current fair value of assets or the smoothed funding value of assets. The fair value measurement gives a more timely measurement, but can be extremely volatile. The funding value measurement is less representative of current fair value, but better presents the funding trends without the year-to-year volatility.
The funding value-based funded ratio increased slightly at 100.0% funded.
The fair value-based funded ratio for the WRS decreased to 102.7% funded.
• The Annuity Reserve increased by 5.5% in 2014, from $48.5 billion to $51.1 billion. This included a 6.52% increase in the Core Annuity Reserve of $2.86 billion and a 4.54% decrease in the Variable Annuity Reserve of $190 million.
• The Reserve for Changes in the Market Value of Investments is the portion of the deferred investment gains and losses in the Market Recognition Account (MRA) attributable to the WRS. The MRA decreased by $2.1 billion in 2014, the result of $971 million in investment losses from 2014 being deferred for future recognition, and $1.2 billion of previously-deferred investment gains from 2010 through 2013 being recognized in 2014. 97.5% or $2,476.0 million of the deferred gains in the MRA are attributable to the WRS.
• Contributions increased 8.05% in 2014, from $1.79 billion to $1.93 billion. This included an 11.86% increase in employer contributions, from $915 million to $1.02 billion, and a 4.04% increase in employee contributions, from $871 million to $906 million. The increased contributions resulted from a 2.6% increase in covered payrolls and a 5.3% increase to contribution rates in 2014.
• Net investment income decreased by approximately $6.4 billion in 2014, from an $11.3 billion gain to a $4.9 billion gain. This included a decrease in Core Trust Fund income of $5.3 billion, from a $9.7 billion gain to a $4.4 billion gain, and a decrease in Variable Trust Fund income of $1.1 billion, from a $1.6 billion gain to a $497 million gain.
• The balanced Core Trust Fund realized a 5.7% investment return, while the equity-based Variable Trust Fund experienced a 7.3% return. The Core Trust Fund gain, after being smoothed through the MRA, resulted in a Core effective rate of 8.7% being credited to the Core Fund accounts and reserves. The Variable Trust Fund gain was passed through to Variable Fund accounts and reserves with a 7.0% Variable effective rate.
• Benefit payments increased by 7.4%, from $4.26 billion to $4.58 billion. Core annuities (including Section 62.13 Police & Firefighters) increased by 6.0%, from $3.82 billion to $4.04 billion, while
WRS Funded Ratio
Annuity Payments
In 2014 ETF paid a total of $4.6 billion in benefits to retired persons, disabled retirees and beneficiaries of retirees. This was an increase of 7.4%, or $316.7 million, over 2013. Core annuities increased by 6.0%, from $3.82 billion to $4.04 billion, while Variable

4 COMPREHENSIVE ANNUAL FINANCIAL REPORT 2014
INTRODUCTION
Participation
There were 603,983 WRS participants as of December 31, 2014, an increase of 1.6% over the previous year. Participants include 257,255 active government employees, an increase of 0.18% from the previous year; 185,605 retirees and others receiving annuities, an increase of 3.1% over the previous year; and 161,123 “inactives,” or former public employees who had not yet taken a benefit from their retirement accounts, an increase of 2.13% over the previous year. To put the WRS growth in perspective, the total participation level has risen by 83,217 persons since 2004, a 15.98% increase.
In 2014, the total number of employers participating in the WRS increased from 1,479 to 1,482. The increase included the addition of four towns and the elimination of one special district.
annuities increased by 15.7%, from $318 million to $368 million. Annuities paid to the closed group Section 62.13 Police and Firefighters decreased by 13.0%, from $3.9 million to $3.4 million.
Annuitants with Core annuities experienced a 2.9% increase in their benefits in 2014, while Variable annuities received a 2.0% increase in their benefits, effective April 1, 2015.
Approximately 9,274 additional persons began receiving annuities during 2014, while 3,725 annuities were ended due to death or expiration of a guarantee period. At year-end, 185,605 people were receiving retirement, disability, or beneficiary annuities, an increase of 3.1% over 2013.
The average annual annuity received by all retirees (Core and Variable combined) increased to $24,185 in 2014, up 5.56% from the previous year. The average annual amount of new annuities begun during 2014 was $29,479 up 1.21% from $29,128 in 2013.
While the initial amount of new annuities has increased over time, post-retirement increases have generally helped maintain the purchasing power of existing annuities. The exception to this is in the years since the market losses in 2008, when there have been post-retirement decreases due to the losses being smoothed over five years. The accompanying chart shows how new annuities have increased over time, based on investment performance, as well as how post-retirement increases added to the value of the annuity over time.
Annuity Payments
Average Annual Annuity By Year Began
WRS Participants
Participants by Employer Type
Towns, Villages & Special Districts
9,999
School Districts108,565 Cities
22,211
Counties32,836
WI Technical College Sys Districts9,751
StateAgencies
73,893

2014 COMPREHENSIVE ANNUAL FINANCIAL REPORT 5
INTRODUCTION
Program Description
The State of Wisconsin Public Employees Deferred Compensation Plan and Trust (the Plan) was established in 1981 pursuant to Wisconsin State Statute Section 40.80. Under the Plan provisions, employees of the State of Wisconsin and public employers in Wisconsin that elect to participate are eligible to contribute to the Plan through payroll deductions. The Plan is governed by the Wisconsin Deferred Compensation Board. The plan is administered by a third party and the Wisconsin Deferred Compensation Board is trustee of the Plan.
Participation
There were 47,063 active members participating in the Plan as of December 31, 2014, and 8,675 participants who received a distribution from the Plan in 2014. As of December 31, 2014, approximately 61% of the Plan assets were applicable to state employees and the remaining 39% represent assets of other Wisconsin public employers participating in the Plan.
Financial Statements
The annual financial statements audit report for the WDC can be found in the Board’s Governance Manual on the Department’s website.
Plan Participants
Deferred Compensation Plan and Trust

6 COMPREHENSIVE ANNUAL FINANCIAL REPORT 2014
INTRODUCTION
Program Description
The ASLCC Program allows retirees of the State of Wisconsin, the University of Wisconsin (UW) System, the UW Hospital & Clinics Authority and other state Authorities, at the time of their retirement, to convert the value of their unused sick leave accumulation into an account to be used to pay for post-retirement health insurance.
Financial Highlights
• At the end of 2014, the unfunded liability is attributable to the UW Hospital & Clinics Authority, the Wisconsin Health and Education Facility Authority, and Wiscraft. No liability exists for state agencies or the University of Wisconsin System.
• The Reserve for Changes in the Market Value of Investments is the portion of the deferred investment gains and losses in the Market Recognition Account (MRA) attributable to ASLCC. 2.3% or $59.6 million of the deferred investment gains in the MRA are attributable to the ASLCC Program.
Accumulated Sick Leave Conversion Credit (ASLCC) Program

2014 COMPREHENSIVE ANNUAL FINANCIAL REPORT 7
INTRODUCTION
Participation
There were 94,510 ASLCC participants as of December 31, 2014, an increase of 7.3% over the previous year. Participants include 71,314 active employees, an increase of 4.1% from the previous year; 17,715 retirees and others using ASLCC credits; and 5,481 “escrowed annuitants”— former employees who had not yet started using credits from their ASLCC accounts.
Funded Status
The funded status of the ASLCC Program is a measure of the extent to which the program has accumulated enough assets to pay the benefits earned by participants. The funded ratio is the ratio of plan assets to estimated future liabilities. The assets can be measured using the current fair value of assets or the smoothed funding value of assets. The fair value measurement gives a more timely measurement, but can be extremely volatile. The funding value measurement is less representative of current fair value, but better presents the funding trends without the year-to-year volatility.
The funding value-based funded ratio increased from 98.9% funded to 99.2% funded.
The fair value-based funded ratio decreased from 104.2% funded to 101.7% funded. The decrease in the fair value funded ratio resulted from the decrease in investment income for the year.
Accumulated Sick Leave Conversion Credits Funded Ratio
ASLCC Participants

8 COMPREHENSIVE ANNUAL FINANCIAL REPORT 2014
INTRODUCTION
Program Description
The State Retiree Life Insurance Plan provides fully paid up life insurance benefits for post-age 64 retired employees of the State of Wisconsin.
Participation
6,969 pre-age 65 retirees and 21,168 age 65 and over retirees participated in the State Retiree Life Insurance Plan in 2014.
Funded Status
Actuarial valuations of the State Retiree Life Insurance Plan are conducted biennially. The most recent valuation was performed January 1, 2014. As of that date, plan assets represented 69.1% of plan actuarial liabilities.
State Retiree Life Insurance Plan
State Retiree Participants

2014 COMPREHENSIVE ANNUAL FINANCIAL REPORT 9
INTRODUCTION
Program Description
The Local Government Retiree Life Insurance Plan provides fully paid up life insurance benefits for post-age 64 retired employees of participating local governments in Wisconsin.
Participation
11,008 pre-age 65 retirees and 28,634 age 65 and over retirees participated in the Local Government Retiree Life Insurance Plan in 2014.
Funded Status
Actuarial valuations of the Local Retiree Government Life Insurance Plan are conducted biennially. The most recent valuation was performed January 1, 2014. As of that date, plan assets represented 67.8% of plan liabilities.
Local Government Retiree Life Insurance Plan
Local Retiree Participants

10 COMPREHENSIVE ANNUAL FINANCIAL REPORT 2014
INTRODUCTION
Program Description
The Active Member Life Insurance Plan provides life insurance coverage for current employees of the State of Wisconsin and participating local governments in Wisconsin.
Financial Highlights
Active Member Life Insurance is reported as an “Insurance Purchasing Pool” under GASB Statement 10, which focuses on claims-servicing revenue and administrative costs. Amounts collected or due from pool participants and paid or to be paid to the carrier to settle claims are reported as an asset or liability.
Participation
49,683 active state employees and 72,879 active local government employees participated in the life insurance plan in 2014. Many of these employees participated in additional and supplemental coverage in addition to basic coverage.
Active Member Life Insurance Plan
Active Employee Participants

2014 COMPREHENSIVE ANNUAL FINANCIAL REPORT 11
INTRODUCTION
Program Description
The ERA Program reimburses qualifying medical and dependent care expenses for employees of the State of Wisconsin who sign up for pre-tax payroll deductions.
Financial Highlights
• The net decrease in the ERA Program this year of $81,700 resulted from the expenses related to the transition of a new third party administrator. Reductions in FICA tax from this program saved the state an estimated $2 million in 2014, with combined FICA and income tax savings of an estimated $7.6 million realized by participants.
Employee Reimbursement Accounts (ERA) Program
Salary Reductions

12 COMPREHENSIVE ANNUAL FINANCIAL REPORT 2014
INTRODUCTION
Program Description
The Commuter Benefits Program reimburses qualifying transportation expenses for employees of the State of Wisconsin who sign up for pre-tax payroll deductions.
Financial Highlights
• The Commuter Benefits Program began in August 2002. Startup costs were funded through an advance from the state’s general fund. As of December 31, 2014, $27,700 remained payable to the general fund.
• The net decrease in the Commuter Benefits Program of $98.8 thousand was attributable to recognizing a liability related to the transition of a new third party administrator for all participant account balances as of year-end for the first time.
Participation
Participation in the Commuter Benefits Program changes from month to month. As of December 31, 2014, the program had 1,481 participants, a 4% decrease from 1,543 as of December 31, 2013.
Commuter Benefits Program
Participants

2014 COMPREHENSIVE ANNUAL FINANCIAL REPORT 13
INTRODUCTION
Program Description
The Milwaukee Retirement Fund allows other retirement systems to have their funds invested with the WRS to maximize investment returns.
Financial Highlights
During 2014 and 2013, the Milwaukee Retirement Fund included only investments from the Milwaukee Public Schools Supplemental Retirement Program.
Milwaukee Retirement Fund

14 COMPREHENSIVE ANNUAL FINANCIAL REPORT 2014
INTRODUCTION
Program Description
The Duty Disability Program pays special disability benefits to protective occupation participants in the WRS.
Financial Highlights
• The Reserve for Changes in the Market Value of Investments is the portion of the deferred investment gains and losses in the Market Recognition Account (MRA) attributable to Duty Disability. 0.6% or $15.3 million of the deferred investment gains in the MRA are attributable to the Duty Disability Insurance Program.
• Contributions decreased 83% in 2014, from $53.9 million to $9.3 million. The decrease resulted from the ETF Board’s new contribution policy reducing the contribution rates for employers as the program reaches full funding.
Funded Status
The funded status of the Duty Disability Insurance Program is a measure of the extent to which the system has accumulated enough assets to pay the benefits earned by participants. The funded ratio is the ratio of plan assets to estimated future liabilities. The assets can be measured using either the current fair value of assets or the smoothed funding value of assets. The fair value measurement gives a more timely measurement but can be extremely volatile, while the funding value
measurement is less representative of current fair value but better presents the funding trends without the year-to-year volatility.
The funding and fair value based ratios were calculated using the actuarial accrued liability total from the Other Post-Employment Benefits (OPEB) Actuarial Valuation as of January 1, 2014.
The funding value-based funded ratio increased from 112.2% funded to 115.4%. Since 2010, the funded ratio has improved from 84.3% to 118.4% funded. The steady increase in the funding value funded ratio shows the suc-cess of the long-term strategy to fully fund the program.
The fair value-based funded ratio increased slightly from 118.1% funded to 118.4% funded. The increase in the fair value funded ratio resulted from the investment income for the year.
Duty Disability Insurance Program
Duty Disability Insurance Funded Ratio

2014 COMPREHENSIVE ANNUAL FINANCIAL REPORT 15
INTRODUCTION
Program Description
The ICI Program pays disability benefits for employees of the State of Wisconsin and participating local governments in Wisconsin, who enroll in the program. Employee premiums are based on sick leave accumulation and the waiting period selected.
Financial Highlights
• The Benefit and Distributions expense is the actuarially-determined change in liabilities during the year. Changes in actuarial procedures and assumptions, including the recognition of a liability for loss adjustment expenses, were reflected in the December 31, 2014, valuation resulting in a significant decrease in liabilities from years previous.
• The Reserve for Changes in the Market Value of Investments is the portion of the deferred investment gains and losses in the Market Recognition Account (MRA) attributable to ICI. 0.5% or $12.1 million of the deferred investment gains in the MRA are attributable to the ICI program.
Funded Status
The funded status of the ICI Program is a measure of the extent to which the system has accumulated enough assets to pay the benefits earned by participants. The funded ratio is the ratio of plan assets to estimated future liabilities. The assets can be measured using either the current fair value of assets or the smoothed funding value of assets. The fair value measurement gives a more timely measurement, but can be extremely volatile. The funding value measurement is less representative of current fair value, but better presents the funding trends without the year-to-year volatility.
Income Continuation Insurance (ICI) Program

16 COMPREHENSIVE ANNUAL FINANCIAL REPORT 2014
INTRODUCTION
Local Plan
The funding value-based funded ratio increased from 644% funded to 840% funded. This increase is the result of investment income earned in 2014. Starting in March 2012 local governments are on a premium holiday. The target for this program is to maintain a funded ratio of 100% to 200% of liabilities as a hedge against adverse claims performance. Because of the small size of this plan, significant year-to-year volatility in claims experience is expected.
The fair value-based funded ratio increased from 691% funded to 876% funded.
State Plan
The funding value-based funded ratio increased from 60% funded to 64% funded. The target for this program is to maintain a funded ratio of 115% to 125% of liabilities as a hedge against adverse claims performance. Annual premium increases are anticipated for the next six years to reach the target funding level. The fair value-based funded ratio increased from 74% funded to 77% funded.
State Income Continuation Insurance Funded Ratio
Local Income Continuation InsuranceFunded Ratio

2014 COMPREHENSIVE ANNUAL FINANCIAL REPORT 17
INTRODUCTION
Program Description
The LTDI Program provides disability coverage to some participants in the WRS. WRS participants prior to October 16, 1992 may choose between LTDI and traditional WRS Disability benefits. Participants beginning after that date are eligible only for LTDI benefits.
Financial Highlights
• Based on plan funding, a premium holiday was in effect through 2013. Effective January 2014, LTDI premiums are collected from the WRS as a percentage of covered payroll. The rate for 2014 and 2015 is .32% of payroll, based on recent experience.
• The Benefit and Distributions expense is the actuarially-determined increase in liabilities during the year. Changes in actuarial procedures and assumptions, including the recognition of a liability for loss adjustment expenses, were reflected in
the December 31, 2014, valuation resulting in a significant increase in Liabilities from years previous.
• The Reserve for Changes in the Market Value of Investments is the portion of the deferred investment gains and losses in the Market Recognition Account (MRA) attributable to LTDI. -0.8% or -$21.2 million of the deferred investment gains in the MRA are attributable to the LTDI program.
Long-Term Disability Insurance (LTDI) Program

18 COMPREHENSIVE ANNUAL FINANCIAL REPORT 2014
INTRODUCTION
Funded Status
The funded status of the LTDI Program is a measure of the extent to which the system has accumulated enough assets to pay the benefits earned by participants. The funded ratio is the ratio of plan assets to estimated future liabilities. The assets can be measured using the current fair value of assets or the smoothed funding value of assets. The fair value measurement gives a more timely measurement, but can be extremely volatile. The funding value measurement is less representative of current fair value, but better presents the funding trends without the year-to-year volatility.
The funding value-based funded ratio decreased from 90% funded to 77%. The decrease in the actuarial value funded ratio was due to the increase in actuarially-determined liabilities.
The fair value-based funded ratio declined from 84% funded to 70%. The decrease in the fair value funded ratio was the result of lower than assumed investment earnings in 2014.
Long Term Disability Insurance Funded Ratio

2014 COMPREHENSIVE ANNUAL FINANCIAL REPORT 19
INTRODUCTION
Statements for the state and local government retiree health plans follow.
• The Reserve for Changes in the Market Value of Investments is the portion of the deferred investment gains and losses in the Market Recognition Account (MRA) attributable to Active Member Group Health Insurance. 0% or -$1.2 million of the deferred investment gains in the MRA are attributable to Active Member Group Health Insurance.
Program Description
Active Member Group Health Insurance pays for the purchase of health insurance coverage and health insurance claims for current employees of the State of Wisconsin and participating local government employers.
Financial Highlights
• These statements include activity related to health insurance coverage for the current employees of the state and participating local government employers.
Group Health Insurance Program
The Group Health Insurance Program is a comprehensive benefit plan providing coverage for active and retired employees of both state and local governments. It is made up of the State Health Plan, including current and retired employees of the State of Wisconsin, and the Wisconsin Public Employers Health Plan (Local Health Plan), which includes current and retired employees of participating local governments. The state and local health plans each include separately managed risk pools for medical and pharmacy benefits. For financial reporting, the program is divided into three funds: Active Member Group Health Insurance (state and local governments combined), State Retiree Health Insurance, and Local Retiree Health Insurance.

20 COMPREHENSIVE ANNUAL FINANCIAL REPORT 2014
INTRODUCTION
Program Description
The State Retiree Health Insurance Plan pays for the purchase of health insurance coverage and health insurance claims for retired employees of the State of Wisconsin.
Financial Highlights
• The State Retiree Health Insurance Plan is reported as Other Post-Employment Benefits (OPEB) in an agency fund. Financial reporting for an agency fund is limited to reporting on the stewardship of assets, and does not include an operating statement.
• Due to Employers reflects the accumulated deficit incurred by the plan. Pre-Medicare retirees included in this plan are subsidized by paying active member premiums. A surplus in the Active Member Group Health Fund offsets the shortfall in the Retiree Health Insurance fund.
• The Reserve for Changes in the Market Value of Investments is the portion of the deferred investment gains and losses in the Market Recognition Account (MRA) attributable to the State Retiree Health Insurance plan. 0.0% or $0.04 million of the deferred investment losses in the MRA are attributable to the State Retiree Health Insurance Plan.
State Retiree Health Insurance

2014 COMPREHENSIVE ANNUAL FINANCIAL REPORT 21
INTRODUCTION
Program Description
The Local Retiree Health Insurance Plan pays for the purchase of health insurance coverage and health insurance claims for retired employees of participating local government employers in Wisconsin.
Financial Highlights
• The Local Government Retiree Health Insurance Plan is reported as Other Post-Employment Benefits (OPEB) in an agency fund. Financial reporting for an agency fund is limited to reporting on the stewardship of assets, and does not include an operating statement.
• Due to Employers reflects the accumulated deficit incurred by the plan. Pre-Medicare retirees included in this plan are subsidized by paying active member premiums. A Surplus in the Active Member Group Health Fund offsets the shortfall in the Retiree Health Insurance fund.
• The Reserve for Changes in the Market Value of Investments is the portion of the deferred investment gains and losses in the Market Recognition Account (MRA) attributable to the Local Retiree Health Insurance Plan. 0.4% or $1.0 million of the deferred investment losses in the MRA are attributable to the Local Retiree Health Insurance Plan.
Local Retiree Health Insurance

22 COMPREHENSIVE ANNUAL FINANCIAL REPORT 2014
INTRODUCTION
Funded Status: Group Health Insurance ProgramThe funded status of the Group Health Insurance Program is a measure of the extent to which the system has accumulated enough assets to pay the benefits earned by participants, meet the liquidity needs of the plan, and smooth year-to-year volatility in claims. Funded status is measured as the ratio of reserves to annual expenses (claims plus administration).
Both plans in the Group Health Insurance Program, the State Health Plan and Local Health Plan, include fully-insured Health Maintenance Organization Plans, a self-insured fee-for-service “Standard Plan,” and a self-insured Pharmacy Benefit Plan. The funding status of each of the self-insured options is broken down by plan and described below:
State Standard PlanThe ratio of reserves to annual expenses increased from 143% to 147%. This increase is the result of a lower than anticipated loss ratio in 2014.
State Standard Health Plan Funded Ratio
State Pharmacy Benefit Funded Ratio
State Pharmacy Benefit PlanThe ratio of reserves to annual expenses decreased from 24% to 15%. This decrease is the result of an intentional drawdown of plan reserves.
Local Standard PlanThe ratio of reserves to annual expenses decreased from 98% to 82%. This decrease is the result of a higher than anticipated loss ratio in 2014.
Local Standard Health Plan Funded Ratio
Local Pharmacy Benefit Plan The ratio of reserves to annual expenses decreased from 54% to 42%. This decrease is the result of a higher than anticipated loss ratio in 2014.
Local Pharmacy Benefit Plan

2014 COMPREHENSIVE ANNUAL FINANCIAL REPORT 23
INTRODUCTION
Participation
The State Health Plan covered 70,219 active employees, 178 continuants (former employees or their beneficiaries who have the right to continue health insurance coverage under federal COBRA requirements), and 25,810 retired State of Wisconsin employees at the end of 2014--about 210,000 persons when all covered dependents are included. The total amount of annual health insurance premiums for all participants was $1,300 million.
The Wisconsin Public Employers Health Insurance Plan (Local Heath Plan) covered 12,890 active employees; 43 continuants and 2,535 retired participants. With their dependents, the total number of people covered was approximately 42,000. Annual premiums paid totaled $225 million.
Health Insurance Participants

24 COMPREHENSIVE ANNUAL FINANCIAL REPORT 2014
INTRODUCTION
technology systems, and the Department’s accounting and financial reporting systems. The Budget and Operations Committee reviews the biennial budget process and the Department’s operating budget, as well as the Department’s strategic business and information technology planning activities.
BOARD MEMBERS
Chair: Wayne E. KoesslAppointed by the WR Board. WR Board member appointed under § 15.16 (3)(b) 1,2,4,5 or 8 (chief executive, finance officer or member of a governing body of a participating city or village, county clerk, deputy county clerk, chairperson, or member of the governing body of a participating county or town, or public member who is not a participant).
Vice Chair: John DavidAppointed by Wisconsin Retirement Board. Any WR Board member appointed under § 15.161(1)(b).
Secretary: Robert M. NiendorfAppointed by the TR Board. TR Board member appointed under § 15.16 (3)(a)4 (UW teacher participant).
William FordElected by WRS annuitants. WRS annuitant as defined for purposes other than life insurance under § 40.02 (4). § 15.16 (1)(d)
Kimberly HallElected by educational support personnel. WRS participant who is either a public school district educational support employee or a technical college district educational support employee. § 15.16 (1)(f )
Michael LangyelAppointed by the TR Board. TR Board member elected under § 15.165 (3)(a)7 (City of Milwaukee teacher participant). § 15.165 (1)(a)3 Jon LitscherGovernor or the Governor’s designee on the Group Insurance Board. § 15.16 (1) (intro.)
The individuals who serve on the boards that provide oversight for the Department of Employee Trust Funds (ETF) play important roles. Board decisions affect hundreds of thousands of individuals who participate in the retirement programs funded by the trust funds as well as other fringe benefit programs ETF operates for Wisconsin.
This section explains how board membership is determined and how membership overlaps. Under state law, members of the boards are chosen in a variety of ways. Some members are ex-officio, some are direct appointees of the governor, others are appointed to fixed terms from lists submitted to the governor by specified organizations, and still others are directly elected by active participants or retirees.
The members and officers of each board are listed below, along with a short explanation of board responsibilities. Membership on the boards as of May 1, 2014 is as follows:
________________________________________Employee Trust Funds Board (13 Members)
This board has general oversight of ETF; appoints the ETF Secretary; approves tables used for computing benefits, contribution rates and actuarial assumptions; authorizes all annuities except for disability; approves or rejects ETF administrative rules; and generally oversees administration of the benefit programs, except group insurance and deferred compensation. State law sets ETF Board membership criteria, with some members appointed by the Teachers Retirement Board (TR Board) and the Wisconsin Retirement Board (WR Board).The ETF Board has established three committees to assist the Board in fulfilling its fiduciary and oversight responsibilities: an Executive Committee, an Audit Committee and a Budget and Operations Committee. The Executive Committee oversees the effective operation of Board and other Committee meetings and reviews personnel matters relating to the Department and the Secretary. The Audit Committee reviews the adequacy and effectiveness of the Department’s system of internal controls, including those relating to information
ETF Boards and Department Organization

2014 COMPREHENSIVE ANNUAL FINANCIAL REPORT 25
INTRODUCTION
BOARD MEMBERS
Chair: Wayne E. KoesslAppointed by the Governor from a list of five names submitted by the executive committee of the Wisconsin Counties Association. Chairperson or member of the governing body of a participating county or town, and from a different county than subds. 5 & 6. § 15.165 (3)(b)4 Vice Chair: John DavidAppointed by the Governor from a list of five names submitted by the Board of Directors of the League of Wisconsin Municipalities. Chief executive or member of the governing body of a participating city or village and from a different county than subds. 2 & 3. § 15.165 (3)(b)1
Secretary: Mary Von RudenAppointed by the Governor. Participating employee from a participating local employer other than a city or village and from a different county than subds. 4 & 5. § 15.165 (3)(b)6 Jamie AulikAppointed by the Governor. County clerk or deputy county clerk from a participating county different than subds. 4 & 6. § 15.165 (3)(b)5 Ted NickelEx officio; Commissioner of Insurance or an experienced actuary in the Office of the Commissioner designated by the Commissioner. § 15.165 (3)(b)9
Herbert StinskiAppointed by the Governor. Participating employee and principal finance officer of a participating city or village and from a different county than subds. 1 & 3. § 15.165 (3)(b)2
Steven WildingAppointed by the Governor. Participating employee of a participating city or village and from a different county than subds. 1 & 2. § 15.165 (3)(b)3
VacantAppointed by the Governor. Public member who is not a participant or beneficiary of the WRS. § 15.165 (3)(b)8
Jessica O’DonnellDirector of the Office of State Employment Relations or the Director’s designee. § 15.16 (1) (intro.)
Roberta RasmusAppointed by the TR Board. TR Board member appointed under § 15.16 (3)(a)3 or 5 (public school administrator or school board member). § 15.16 (3)(a)5
Victor ShierAppointed by Governor, with Senate confirmation. Public member who is not a participant in or beneficiary of the WRS, with at least five years of experience in actuarial analysis, administration of an employee benefit plan, or significant administrative responsibility in a major insurer. § 15.16 (1)(c)
Mary Von RudenAppointed by the WR Board. WR Board member appointed under §15.16 (3)(b)3,6, or 7 (participating employee of a city or village, participating employee of a local employer other than a city or village or participating state employee).§ 15.16 (1)(b)2
David WiltgenAppointed by TR Board. TR Board member appointed or elected under § 15.165 (3)(a) 1 or 2 (public or vocational school teacher).
VacantAppointed by Wisconsin Retirement Board. Wisconsin Retirement Board member appointed under § 15.165 (3)(b) 7 or 8 (participating state employee or public member who is not a participant). § 15.16 (1)(b) 3
________________________________________Wisconsin Retirement Board (9 Members)
The WR Board advises the ETF Board on matters relating to retirement; approves or rejects administrative rules; authorizes or terminates disability benefits for non-teachers; and hears appeals of disability rulings. This board appoints four members to the ETF Board and one non-teaching member to the State of Wisconsin Investment Board.

26 COMPREHENSIVE ANNUAL FINANCIAL REPORT 2014
INTRODUCTION
Jon JoslinElected by public school teachers. Public school teacher. § 15.165 (3)(a)1
Dennis MurphyElected by annuitants who were teacher participants. Annuitant who was a teacher participant in the WRS. § 15.165 (3)(a)6
R. Thomas PedersenElected by participating Wisconsin Technical College teachers. Public school teacher from a participating Wisconsin Technical College district and a participating employee in the WRS. § 15.165 (3)(a)2
Patrick PhairElected by public school teachers. Public school teacher. § 15.165 (3)(a)1
David WiltgenElected by public school teachers. Public school teacher. § 15.165 (3)(a)1
Jeffrey ZoreElected by public school teachers. Public school teacher. § 15.165 (3)(a)1
________________________________________Group Insurance Board (11 Members)
This board sets policy for the group health, life, and income continuation insurance plans for state employees and the group health, life, and income continuation insurance plans for local employers who choose to offer them. The board also can provide other insurance plans, if employees pay the entire premium.
BOARD MEMBERS
Chair: Jon LitscherEx officio; Governor or Governor’s designee. § 15.165 (2)(intro)
Vice Chair: Bonnie CyganekEx officio; Attorney General or Attorney General’s designee. § 15.165 (2)
Secretary: Jessica O’DonnellEx officio; Director of the Office of State Employment Relations or Director’s designee. § 15.165 (2)
VacantAppointed by the Governor. Participating state employee. § 15.165 (3)(b)7
________________________________________Teachers Retirement Board (13 Members)
The TR Board advises the ETF Board on retirement and other benefit matters involving public school, technical college, state and university teachers; acts on administrative rules and authorizes or terminates teacher disability benefits and hears disability benefit appeals. Nine of the 13 members are elected. This board appoints four members to the ETF Board and one teacher participant to the State of Wisconsin Investment Board.
BOARD MEMBERS
Chair: Michael LangyelElected by Milwaukee Public School District teachers who are participants. City of Milwaukee teacher who is a participant in the WRS. § 15.165 (3)(a)7
Vice Chair: Robin StarckElected by public school teachers. Public school teacher. § 15.165 (3)(a)1
Secretary: Susan HarrisonAppointed by the Governor. UW teacher participant in the WRS (not from same campus as other UW teacher representative). § 15.165 (3)(a)4
Sandra Claflin-ChaltonAppointed by the Governor. UW teacher participant in the WRS (not from same campus as other UW teacher representative). § 15.165 (3)(a)4
Gary Epping Appointed by the Governor. Member of a school board. § 15.165 (3)(a)5
Brent GrochowskiElected by public school teachers. Public school teacher. § 15.165 (3)(a)1
Craig HubbellAppointed by the Governor. Public school administrator who is not a classroom teacher. § 15.165 (3)(a)3

2014 COMPREHENSIVE ANNUAL FINANCIAL REPORT 27
INTRODUCTION
BOARD MEMBERS
Chair: Edward D. MainAppointed by the Governor, with Senate confirmation.§15.165 (4) Vice Chair: John F. NelsonAppointed by the Governor, with Senate confirmation.§ 15.165 (4) Secretary: Gail HansonAppointed by the Governor, with Senate confirmation.§ 15.165 (4) Michael GraczAppointed by the Governor, with Senate confirmation. § 15.165 (4) VacantAppointed by the Governor, with Senate confirmation.§ 15.165 (4)
Terri CarlsonAppointed by the Governor. Insured participant in the WRS who is not a teacher. § 15.165 (2)
Herschel DayAppointed by the Governor. Insured participant in the WRS who is a teacher. § 15.165 (2)
Michael FarrellAppointed by the Governor. No membership requirement. § 15.165 (2)
Charles GrapentineAppointed by the Governor. Insured participant in the WRS who is a retired employee. § 15.165 (2) Andrew HittEx officio; Secretary of Department of Administration or Secretary’s designee. § 15.165 (2)
Theodore NeitzkeAppointed by the Governor. Insured participant in the WRS who is an employee of a local unit of government. § 15.165 (2)
Daniel SchwartzerEx officio; Commissioner of Insurance or Commissioner’s designee. § 15.165 (2)
Nancy Thompson Appointed by the Governor. Chief executive or member of the governing body of a local unit of government that is a participating employer. § 15.165 (2)
________________________________________Deferred Compensation Board (5 Members)
This board sets policy, contracts with investment and administrative service providers, and oversees administration of the Deferred Compensation Program. The board is responsible for establishing criteria and procedures for selecting and evaluating investment options offered by the Program. The governor, with senate confirmation, appoints all board members; there are no statutory requirements for appointments.

28 COMPREHENSIVE ANNUAL FINANCIAL REPORT 2014
INTRODUCTION
Department Organization
The Department of Employee Trust Funds had 263.2 permanent positions at the end of 2014.
Employee
Trust Funds Board
Office of the Secretary
Secretary
Deputy Secretary Executive Assistant
Legal Services
Wisconsin Retirement Board
Teachers Retirement Board
Deferred Compensation Board
Group Insurance Board
Office of Trust Finance
Office of Internal Audit
Division of Insurance Services
Division of Management Services
Office of Communications
Office of Policy, Privacy and Compliance
Division of Retirement Services
Office of Enterprise Initiatives

2014 COMPREHENSIVE ANNUAL FINANCIAL REPORT 29
INTRODUCTION
Principal Consultants and Administrators
Consulting ActuariesGabriel Roeder Smith & CompanySouthfield, Michigan
Segal ConsultingAtlanta, Georgia
Milliman, Inc.Portland, Maine
AuditorsLegislative Audit BureauMadison, Wisconsin
Third Party Administrators
Health InsuranceWPS Health InsuranceMadison, Wisconsin
Pharmacy Benefits ManagerNavitus Health SolutionsAppleton, Wisconsin Income Continuation Insurance and Long-Term Disability InsuranceAetna Life Insurance CompanyAetna Disability and Leave ManagementLexington, Kentucky Deferred CompensationGreat-West FinancialGreenwood Village, Colorado
Employee Reimbursement Accounts and Commuter BenefitsWageWorksTallahassee, Florida Life InsuranceMinnesota Life Insurance CompanySt. Paul, Minnesota
2014 ETF Management Staff
Secretary: Robert J. ConlinDeputy Secretary: John VoelkerAssistant Deputy Secretary: Pam HenningChief Legal Counsel: David Nispel
Division of Retirement ServicesAdministrator: Matt Stohr
Division of Insurance ServicesAdministrator: Lisa Ellinger
Division of Management ServicesAdministrator: Vacant
Office of Trust FinanceDirector: Robert Willett
Office of Internal AuditDirector: Yikchau Sze
Office of Communications Director: Mark Lamkins
Office of Policy, Privacy & ComplianceDirector: Steve Hurley
Office of Enterprise InitiativesDirector: Bob Martin

30 COMPREHENSIVE ANNUAL FINANCIAL REPORT 2014
INTRODUCTION
2014 Accomplishments
This section highlights ETF’s accomplishments from January through December 2014. These accomplishments are linked to the following strategic business plan objectives:
1. Offer self-service tools for members and employers
2. Expand outreach to members and employers3. Strengthen internal workforce training program
Many of the following accomplishments are associated with projects that are prerequisites/building blocks to long-term efforts to fulfill strategic plan objectives.
1. Offer Self-Service Tools for Members and Employers
Completed critical phases in preparation for launching the Benefits Administration System (BAS) project. These included: – Negotiating a long-term contract with a vendor,
establishing ETF and vendor project teams and hosting a technical summit to examine project milestones in detail.
– Confirming more than 3,350 business and technical requirements of the project.
– Establishing the governance documents and finalizing the Statement of Work for the first two rollouts.
– Completing the computer environments that project teams will use to develop, train and test; installing secure servers; installing new scanning equipment.
– Completing a data conversion plan and moving more than one million member and employer data fields from ETF legacy systems to the new system.
– Completing several project cycles, including those that cover imaging, enrollments and demographics and employer wage and contributions processing.
Legislation
There were no bills that became law in 2014 that affected the Wisconsin Retirement System or other employee benefit programs administered by the Department of Employee Trust Funds.
ETF Vision Statement
The Department’s strategic plan provides the framework for achieving ETF’s vision to become a leader among large public employee benefit systems by offering best practice customer services to members and employers.
To achieve this goal:
• ETF will offer self-service tools to WRS members and employers. These tools will empower members to become better educated about their benefits, provide secure online access to their accounts, and allow them to securely update information online.
• ETF will expand outreach to more members and employers in more parts of the state. Efforts will include more timely and efficient electronic communications, a greater number of retirement planning and other information sessions that result in more user-friendly, accessible benefit program materials.
• ETF will strengthen its internal workforce training programs to maintain and grow its highly-skilled and knowledgeable workforce. Efforts will include sophisticated training programs for new as well as existing employees.
The Department is committed to incorporating modern best practices, continually evaluating processes for effectiveness in meeting the needs of members, safeguarding member data, and delivering the best value in benefits and services provided.
Legislation, Vision Statement, 2014 Accomplishments

2014 COMPREHENSIVE ANNUAL FINANCIAL REPORT 31
INTRODUCTION
• Created multiple testing, training and innovation spaces that enhance and support collaboration across work units.
• Launched the first of several “e-learning modules” for enhanced staff training and education.
• Extensively redesigned website pages to streamline member and employer access to information for health insurance open enrollment and benefits, member education learning opportunities and other online resources.
2. Expand Outreach to Members and Employers
• Significantly increased the number of webinars for employers. Topics include annual reconciliation, WRS employer orientation, WRS eligibility, rehired annuitants and late reported earnings.
• Offered two new webinars in conjunction with the Wisconsin Deferred Compensation Program. One targeted members nearing retirement and the other targeted current and participating WDC employers and covered fiduciary responsibilities.
• Provided Outreach and Education services to a total of 20,124 members in 2014. This includes covering 46 cities statewide in the course of:
– Conducting 266 group appointment sessions, connecting with 2,380 members;
– Staffing 44 benefit fair booths, reaching 4,741 members;
– Conducting 87 public and private presentations, reaching 6,327 members;
– Conducting 156 live webinar sessions on 17 different topics, reaching 6,676 members.
3. Strengthen Internal Workforce Training
• Implemented a learning management system that integrates training resources and tracks internal and external training programs for employees.
• Implemented a cross-training plan in several key areas in preparation for the BAS implementation.
• Offered numerous employee training sessions throughout the year. Topics included BAS status updates; project management; notable health insurance program changes; enterprise software upgrades; presentation development skills; and career advancement strategies. Ten staff received business analyst certifications.

This page intentionally left blank

State of WisconsinDepartment of Employee Trust Funds
FINANCES


This page intentionally left blank
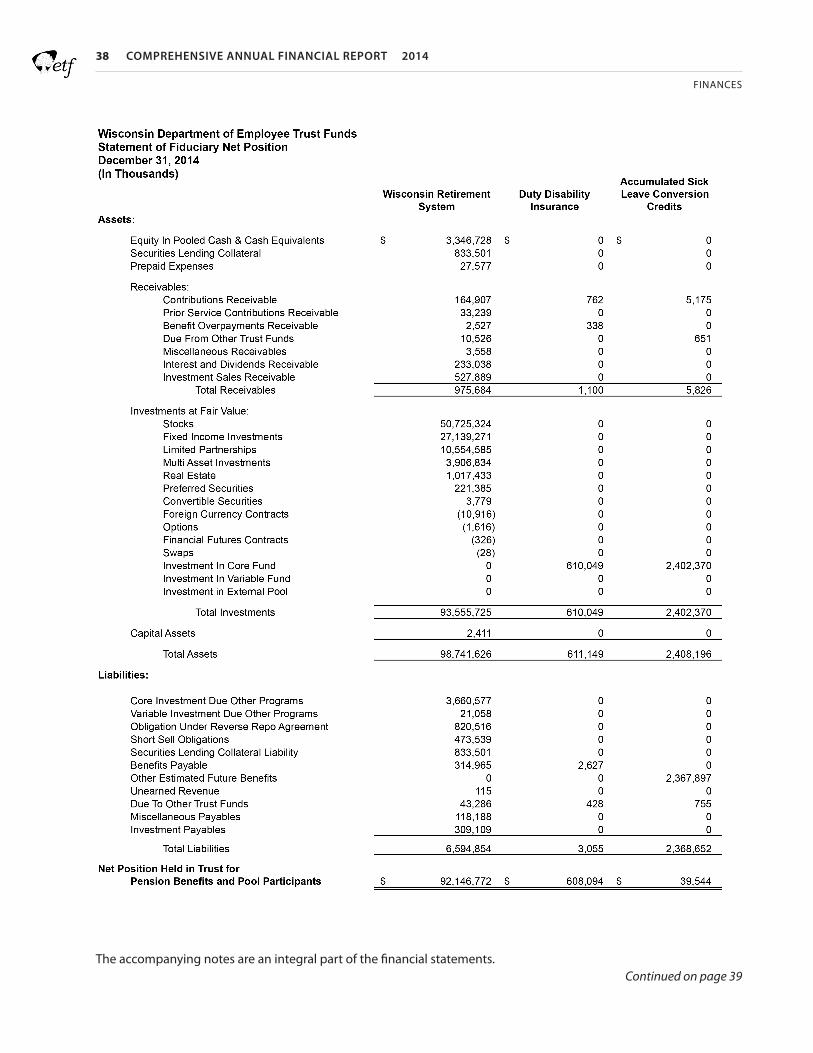
38 COMPREHENSIVE ANNUAL FINANCIAL REPORT 2014
FINANCES
The accompanying notes are an integral part of the financial statements.Continued on page 39

2014 COMPREHENSIVE ANNUAL FINANCIAL REPORT 39
FINANCES
Continued from page 38

40 COMPREHENSIVE ANNUAL FINANCIAL REPORT 2014
FINANCES
The accompanying notes are an integral part of the financial statements. Continued on page 41

2014 COMPREHENSIVE ANNUAL FINANCIAL REPORT 41
FINANCES
Continued from page 40

42 COMPREHENSIVE ANNUAL FINANCIAL REPORT 2014
FINANCES
The
acco
mpa
nyin
g no
tes
are
an in
tegr
al p
art o
f the
fina
ncia
l sta
tem
ents
.

2014 COMPREHENSIVE ANNUAL FINANCIAL REPORT 43
FINANCES
The
acco
mpa
nyin
g no
tes
are
an in
tegr
al p
art o
f the
fina
ncia
l sta
tem
ents
.

44 COMPREHENSIVE ANNUAL FINANCIAL REPORT 2014
FINANCES
The
acco
mpa
nyin
g no
tes
are
an in
tegr
al p
art o
f the
fina
ncia
l sta
tem
ents
.

2014 COMPREHENSIVE ANNUAL FINANCIAL REPORT 45
FINANCES
The accompanying notes are an integral part of the financial statements.

46 COMPREHENSIVE ANNUAL FINANCIAL REPORT 2014
FINANCES
The accompanying notes are an integral part of the financial statements.

2014 COMPREHENSIVE ANNUAL FINANCIAL REPORT 47
FINANCES
Presentation Basis
The financial statements of the Wisconsin Department of Employee Trust Funds (Department) have been prepared in conformity with Generally Accepted Accounting Principles (GAAP) for government units as prescribed by the Governmental Accounting Standards Boards (GASB). The Department is not a general-purpose government and does not present government-wide statements. The Department is included in the State of Wisconsin financial reporting entity and is presented in the State’s Comprehensive Annual Financial Report in a “Pension and Other Employee Benefit Trust Fund” and is reported as a separate fund in ETF’s separately issued Comprehensive Annual Financial Report. The Legislative Audit Bureau also issues a standalone financial statement report of the Wisconsin Retirement System.
The assets and operations of the Department are accounted for in the following funds:
Fiduciary Funds
Pension and Other Employee Benefit Trust Funds
Wisconsin Retirement System (WRS): This fund is used to account for the collection of employee and employer contributions; investment of assets; and payment of retirement, disability, and death benefits to former employees, and their beneficiaries of the State of Wisconsin and participating local governments in Wisconsin.
Accumulated Sick Leave Conversion Credits (ASLCC): This fund is used to account for the collection of employer contributions, investment of assets, and purchase of post-retirement health insurance for retired employees of the State of Wisconsin and their beneficiaries. This benefit allows employees, at the time of their retirement, to convert
the value of their unused sick leave accumulation into an account to be used to pay for post-retirement health insurance. The value of their account may also be increased by an employer match of part or all of their unused sick leave accumulation.
State Retiree Life Insurance: This fund is used to account for the accumulation of assets and the payment of life insurance benefits for retired employees of the State of Wisconsin.
Local Retiree Life Insurance: This fund is used to account for the accumulation of assets and the payment of life insurance benefits for retired employees of participating local governments in Wisconsin.
Employee Reimbursement Accounts: This fund is used to account for the collection of voluntary payroll deferrals, investment of assets, and reimbursement of qualifying medical and dependent care expenses for employees of the State of Wisconsin, in compliance with Internal Revenue Code (IRC) Section 125.
Commuter Benefits: This fund is used to account for the collection of voluntary payroll deferrals, investment of assets, and reimbursement of qualifying transportation expenses for employees of the State of Wisconsin, in compliance with IRC Section 132.
Duty Disability Insurance: This fund is used to account for the collection of employer contributions, investment of assets, and payment of special disability benefits to protective occupation participants in the WRS.
Investment Trust Fund
Milwaukee Retirement Systems: These funds are used to account for the receipt, investment, and disbursement of funds from other public pension funds in Wisconsin.
Agency Funds
State Retiree Health Insurance: This fund is used to account for the collection of employee and employer
Notes to Financial Statements
1 SUMMARY OF SIGNIFICANT ACCOUNTING POLICIES

48 COMPREHENSIVE ANNUAL FINANCIAL REPORT 2014
FINANCES
expenses not directly related to the principal ongoing operations are classified as non-operating.
Department-wide administrative expenses, capital assets, and general fund activities are most closely associated with the WRS fund and have been blended with that fund for presentation. All material intrafund transactions have been eliminated from fund financial statements. Interfund transactions have not been eliminated.
Measurement Focus and Basis of Accounting
The financial statements of the Department have been prepared in accordance with GAAP. The WRS, Duty Disability Insurance, Accumulated Sick Leave Conversion Credits, Employee Reimbursement Accounts, Commuter Benefits, and Retiree Life Insurance Funds are accounted for using the flow of economic resources measurement focus and the accrual basis of accounting. Under the accrual basis of accounting, contributions are recognized in the accounting period in which the underlying earnings on which the contributions are based are paid and the employer has made a formal commitment to provide the contributions. Benefits and refunds are recognized when due and payable in accordance with the terms of each plan. Security transactions and the related gains and losses are recorded on a trade date basis. Dividend income is recorded on the ex-dividend date, and interest income is accrued as earned.
The State Retiree and Local Retiree Health Insurance Funds are accounted for using the accrual basis of accounting, but have no measurement focus by virtue of their custodial nature. All other funds are accounted for using the flow of economic resources measurement focus and the accrual basis of accounting. Revenues are recorded when earned and expenses are recorded at the time liabilities are incurred.
Investments
The assets of the WRS and the Milwaukee Retirement System are valued at fair value and are invested in the Core Retirement Investment Trust (Core Fund) and the Variable Retirement Investment Trust (Variable Fund), which are collectively the Retirement Funds. The assets of the Income Continuation Insurance, Duty Disability Insurance, Long-Term Disability Insurance,
contributions, the investment of assets, the purchase of health insurance coverage, and the payment of health insurance claims for retired employees of the State of Wisconsin.
Local Retiree Health Insurance: This fund is used to account for the collection of employee and employer contributions, the investment of assets, the purchase of health insurance coverage, and the payment of health insurance claims for retired employees of participating local governments in Wisconsin.
Proprietary Funds
Enterprise Funds
Long-Term Disability Insurance: This fund is used to account for the collection of employer contributions, investment of assets, and payment of disability benefits to participants in the WRS.
Health Insurance: This fund is used to account for the collection of employee and employer contributions, the investment of assets, the purchase of health insurance coverage, and the payment of health insurance claims for current employees of both the State of Wisconsin and participating local governments in Wisconsin.
Income Continuation Insurance: This fund is used to account for the collection of employee and employer contributions, the investment of assets, and the payment of disability benefits for employees of both the State of Wisconsin and participating local governments in Wisconsin.
Life Insurance: This fund is used to account for the collection of employee and employer contributions and the purchase of life insurance coverage for current employees of both the State of Wisconsin and participating local governments in Wisconsin.
Proprietary funds distinguish operating revenues and expenses from non-operating items. Operating revenues and expenses generally result from providing services in connection with a proprietary fund’s principal ongoing operations. The principal ongoing operations for these proprietary funds are: collecting premiums and using the accumulated premiums and investment income to pay benefits. Revenues and

2014 COMPREHENSIVE ANNUAL FINANCIAL REPORT 49
FINANCES
All other benefit plan assets are invested in the State Investment Fund (SIF). Investments in the SIF are classified as Equity in Pooled Cash and Cash Equivalents on the Statement of Fiduciary Net Position and Cash and Cash Equivalents on the Statement of Net Position – Proprietary Funds. The SIF is a pool of cash balances of various state and local government units with the investment objectives to provide safety, liquidity, and competitive rates of return.
The State of Wisconsin Investment Board (SWIB) manages the Core Fund, Variable Fund, and SIF with oversight by the SWIB Board of Trustees, as authorized in Wis. Stat. § 25.17. SWIB is not registered with the Securities and Exchange Commission as an investment company.
Health Insurance, State Retiree Health Insurance, Local Retiree Health Insurance, and Accumulated Sick Leave Conversion Credit Programs are invested in the Core Fund. Earnings are allocated between the WRS and other benefit programs based on the average balance invested for each program. Earnings allocated to other benefit programs are classified as Investment Income Distributed to Other Benefit Programs on the Statement of Changes in Fiduciary Net Position. The total amount invested by the other benefit programs included in the Retirement Funds is presented as Core Investment Due to Other Programs and Variable Investment Due to Other Programs on the Statement of Fiduciary Net Position and the Statement of Net Position – Proprietary Funds. Investments for the Retiree Life Insurance Funds are held by the plan administrator and classified as Investment in External Pool on the Statement of Fiduciary Net Position.
Funding Value of Assets
While investments are valued at fair value for financial statement presentation, a funding value of assets is used in evaluating the funded status of the benefit plans and in determining future contribution requirements. Funding value does not include deferred market gains and losses that have not yet been distributed from the Market Recognition Account (MRA) to the program reserves. See Note 7 for further explanation of the MRA. As of December 31, 2014, the funding value of reserves ($ in millions) was as follows:
Benefit Plan Reserves at Deferred Market Reserves at Funding Value Gains (Losses) Fair ValueWisconsin Retirement System $89,670.7 $2,476.1 $92,146.8Income Continuation Insurance(1) 2.6 12.1 14.7Duty Disability Insurance 592.8 15.3 608.1Long-Term Disability Insurance(1) (68.0) (21.2) (89.2)Accumulated Sick Leave Conversion Credit(1) (20.1) 59.6 39.5Health Insurance (1) 199.2 (1.2) 198.0State Retiree Health Insurance(1) (65.4) 0.0 (65.4)Local Retiree Health Insurance(1) (15.2) (1.0) (16.2)(1) The Reserves at Funding Value and the Reserves at Fair Value for Income Continuation Insurance, Long-Term Disability Insurance, Accumulated Sick Leave Conversion Credits, Health Insurance, and State and Local Retiree Health Insurances have been reduced by the estimated future claims for the benefit plan.
Administrative Expenses
The administrative costs of all Department programs are financed by a separate appropriation and are allocated to each benefit plan administered by ETF in accordance with Wis. Stat. § 40.04. The sources of funds for this appropriation are investment earnings and third-party reimbursements received from the various programs administered by the Department. Total administrative expenses for the year were $34.5 million.
SWIB incurs expenses related to investing the trust funds. As authorized by Wis. Stat. § 25.187 (2), these costs are charged directly to the investment income of each trust fund.

50 COMPREHENSIVE ANNUAL FINANCIAL REPORT 2014
FINANCES
Long-Term Liabilities Accumulated Sick Leave Conversion Credit Fund: The Accumulated Sick Leave Conversion Credit Fund reports an actuarially-determined liability for future benefits. The liability is determined using the Frozen Initial Liability actuarial cost method and actuarial assumptions that include a 7.2% long-term rate of investment return and a 3.2% annual base salary increase.
During 2014, the liability changed as follows ($ in millions):
Beginning balance $ 2,268Plus: New Liabilities Recognized 242Less: Benefits Paid (142)Ending Balance $ 2,368
The portion estimated to be due within one year is $151 million.
Capital Assets
Capital assets consist of office furniture and equipment and computer software (purchased or externally acquired and internally generated software). The Department capitalizes all furniture and equipment, and purchased computer software with a purchase price in excess of $5,000 and internally-generated software and other intangible assets in excess of $1 million . Assets are depreciated on a composite basis over an estimated life, ranging from 5 to 20 years, using the straight-line method of depreciation.
As of December 31, 2014, the total value of capital assets was $4,939,077, less accumulated depreciation of $2,528,026, for a net capital asset value of $2,411,051. The net capital asset value includes $2,199,723 in internally-generated software (i.e., the Lump Sum Payment System and Accumulated Sick Leave System – Phase 1) and $67,895 in purchased software.
Interfund transfers are primarily the result of administrative expense reimbursement to the WRS. The outstanding balances between funds result from the time lag between the dates that interfund services are provided or reimbursable expenditures occur and when payments between funds are made. The amount due from Long-Term Disability Insurance (LTDI) is for additional contributions made by LTDI to the WRS. The amount due to LTDI is insurance premiums for LTDI coverage for WRS participants. The amounts due to Health Insurance are cash loans to State Retiree Health Insurance and Local Retiree Health Insurance. All liabilities are expected to be paid within one year of the balance sheet date.
Interfund Assets / LiabilitiesInterfund assets and liabilities at December 31, 2014, consist of the following ($ in thousands):

2014 COMPREHENSIVE ANNUAL FINANCIAL REPORT 51
FINANCES
25.17(14). Unrealized gains and losses are reflected in the Statement of Changes in Fiduciary Net Position as Net Appreciation (Depreciation) in Fair Value of Investments.
The fair value of the Retirement Fund assets are obtained or estimated in accordance with a pricing hierarchy established with SWIB’s custodian Bank of New York Mellon (BNY Mellon). As prescribed by the hierarchy, a variety of independent pricing sources are used to price assets based on type, class or issue. When a portfolio includes securities or instruments for which the custodial bank does not receive fair value information from its vendor pricing sources, a variety of third party pricing methods are used, including appraisals, pricing models and other methods deemed acceptable by industry standards.
The Cash & Cash Equivalents account reported on the Statement of Fiduciary Net Position consists of short-term investments that are used to meet the liquidity requirements of the Retirement Funds. Cash & Cash Equivalents held by the Retirement Funds can include cash on deposit, foreign currencies, cash posted as collateral to counterparties, repurchase agreements, certificates of deposit, U.S. Treasury Bills, short-term investment funds, and other liquid financial instruments with maturities that are generally less than three months. Cash & Cash Equivalents are reported at fair value or cost, which approximates fair value.
Privately-held debt, which is included in Fixed Income Investments on the Statement of Fiduciary Net Position, is priced using a multi-tiered approach that prices each holding based on the best available information using the following hierarchy of pricing sources:
1. Custodian-supplied prices for assets that are in the Barclays Capital U.S. Aggregate Bond Index;
2. Prices provided by a third party with expertise in the bond market;
3. Modeled prices where interest rate spreads are supplied by a third party.
In a few instances, privately-held debt cannot be priced by one of the above three sources. In these circumstances, the investment is priced using an
Use of Estimates
The preparation of financial statements in accordance with GAAP requires management to make estimates that affect amounts reported herein. Due to the inherent uncertainty involved, actual results could differ from those estimates.
Management’s Discussion and Analysis (MD&A)
GASB Statement No. 34, Basic Financial Statements – and Management’s Discussion and Analysis – for State and Local Governments, requires that government-wide financial statements include an MD&A to provide an overview of the government’s financial activities. This requirement does not extend to Department financial statements. It was management’s determination that this type of information could be better presented in other areas of the Department’s Comprehensive Annual Financial Report. Therefore, management has not included an MD&A with the financial statements.
The WRS adopted GASB Statement No. 67, Financial Reporting for Pension Plans—an amendment of GASB No. 25, during the year ended December 31, 2014. GASB Statement No. 67 addresses accounting and financial reporting requirements for pension plans. Significant requirements include an actuarial calculation of total pension liability and net pension liability (asset). It also includes comprehensive footnote disclosure regarding the pension liability (asset), the sensitivity of the net pension liability (asset) to the discount rate, and increased investment activity disclosures.
Valuation of Securities
The investments of the Retirement Funds are reported in the Statement of Fiduciary Net Position at fair value as prescribed by GASB and per Wisconsin Statutes s.
2 ACCOUNTING CHANGES
3 DEPOSITS, INVESTMENTS AND SECURITIES LENDING
TRANSACTIONS

52 COMPREHENSIVE ANNUAL FINANCIAL REPORT 2014
FINANCES
held with the insurance carrier (the Company) in the Company’s investment pool. The methods used to value that pool’s investments are described in Note 9.
Credit Risk
Credit risk is the risk that an issuer or other counterparty to an investment will not fulfill its obligations to SWIB. Fixed income credit risk investment guidelines outline the minimum ratings required at the time of purchase by individual portfolios, or groups of portfolios, based on the portfolios’ investment objectives. In addition, some fixed income portfolios are required to carry a minimum weighted average rating at all times. Information regarding SWIB’s credit risk related to derivatives is discussed later in these notes.
The table, Retirement Funds Credit Quality Distribution, displays the lowest credit rating assigned by nationally-recognized statistical rating organizations on debt securities held by the Retirement Funds as of December 31, 2014. Included in this table are fixed income securities, including certain short term securities, classified as Cash & Cash Equivalents on the Statement of Fiduciary Net Position. Also included are interest rate sensitive investments held in the Retirement Funds’ securities lending collateral reinvestment pools, which are managed by SWIB’s securities custodian (additional information relating to the securities lending program is discussed later in these notes). The table also includes SWIB’s investment in commingled fixed income funds, which are not assigned ratings. Although the funds themselves are not assigned ratings, external management investment guidelines govern minimum credit quality standards for the investments within each portfolio. These standards are determined based on the investment objectives and risk parameters of each fund. The table, Retirement Funds Credit Quality Breakdown of Commingled Fixed Income Funds, presents the aggregated credit ratings for the underlying investments held by commingled fixed income investments within the Retirement Funds.
Credit risk for the Retiree Life Insurance Funds is minimized by the Company monitoring portfolio diversification by asset class, creditor, and industry and by complying with investment limitations
alternative bond index price or, if no independent quotation exists, the investment may be valued at cost.
For alternative investments where no readily-ascertainable market value exists, including limited partnerships and real estate pooled funds, fair value is estimated based on the net asset value as reported by the general partner. The capital account balance as stated in the most recently available quarterly reporting period is adjusted for subsequent cash flows to derive the fair value. Annually, the financial statements of the limited partnerships and real estate pooled funds are audited by independent auditors.
Real estate properties wholly owned by SWIB are valued by independent appraisers every three years. In years when appraisals are not performed, properties are informally appraised by the asset advisor. Each year, audited financial statements are prepared for each property.
Monthly, SWIB values hedge funds based on statements received from each of the hedge fund’s administrators. Essentially, a hedge fund administrator serves as an independent third party that protects the interests of investors. The main function of a third-party administrator is to independently calculate the net asset value of the fund. Generally, hedge fund administrators price financial instruments traded in active markets based on quoted market prices or binding dealer quotations. For certain over-the-counter instruments, fair value is determined based on valuation models used by the administrator. Annually, the financial statements prepared by the administrator are audited by independent auditors.
Derivative financial instruments are marked to fair value daily, with valuation changes recognized in income during the period the instruments are held and when the instrument is sold or expires. The nature and use of derivative instruments is discussed later in these notes.
A limited number of securities are carried at cost. Certain non-public or closely held stocks are not reported at fair value, but are carried at cost since no independent quotation is available to estimate fair value for these securities. Investments for the Retiree Life Insurance Funds are

2014 COMPREHENSIVE ANNUAL FINANCIAL REPORT 53
FINANCES
governed by insurance laws and regulations. However, the pool itself is not rated.
Rating Fair Value % of TotalP-1/A-1 $ 523,018 2% P-2/A-2 341,452 1 AAA/Aaa 522,299 2 AA/Aa 12,487,930 41 A 2,551,816 8 BBB/Baa 2,768,461 9 BB/Ba 579,923 2 B 559,934 2 CCC/Caa 171,795 1 CC/Ca 88 - C - - D - - Commingled Fixed Income Funds 8,816,196 29 Not Rated 865,207 3 Total $ 30,188,119 100%
Retirement FundsCredit Quality DistributionAs of December 31, 2014
($ in thousands)
Rating* Fair Value % of TotalP-1/A-1 $ 1,122,451 13% AAA/Aaa 2,478,416 28 AA/Aa 831,060 9 A 1,804,313 20 BBB/Baa 2,107,882 24 BB/Ba 151,766 2 B 173,721 2 CCC/Caa 59,667 1 CC/Ca 2,455 -C - -D 4,459 - Not Rated 80,006 1 Total Commingled Fixed Income Funds $ 8,816,196 100 % *Reflects aggregated ratings of underlying investments as reported by commingled fixed income fund managers.
Retirement FundsCredit Quality Breakdown of Commingled Fixed
Income FundsAs of December 31, 2014
($ in thousands)
Reverse Repurchase Agreements
SWIB held $820.5 million in reverse repurchase agreements at December 31, 2014. Investment guidelines permit certain portfolios to enter into reverse repurchase agreements, which are a sale of securities with a simultaneous agreement to repurchase the securities in the future at the same price plus a stated rate of interest. The market value of the securities underlying reverse repurchase agreements exceeds the cash received, providing the counterparty a margin against a decline in market value of the securities. If the counterparty defaults on their obligations to sell these securities back to SWIB or provide cash of equal value, SWIB could suffer an economic loss equal to the difference between the market value of the underlying securities plus accrued interest and the agreement obligation, including accrued interest.
During calendar year 2014 SWIB began entering into reverse repurchase agreements under a new Master Repurchase Agreement, with an agent who retains full control of the underlying securities, effectively eliminating the possibility of re-hypothecation of the securities. Under this new arrangement, credit risk exposure is limited to $200 million per reverse repurchase agreement counterparty. The counterparty credit exposure is monitored daily and managed through the transfer of margin, in the form of cash or securities between SWIB and the counterparty. At December 31, 2014, approximately half of the reverse repurchase agreements were entered into under this arrangement. The Retirement Funds counterparty credit exposure for reverse repurchase agreements at December 31, 2014, is summarized in the table, Retirement Funds Reverse Repurchase Agreements, Counterparty Credit Exposure.

54 COMPREHENSIVE ANNUAL FINANCIAL REPORT 2014
FINANCES
The cash proceeds from reverse repurchase agreements are reinvested by the Retirement Funds. The maturities of the purchases made with the proceeds of reverse repurchase agreements are not necessarily matched to the maturities of the agreements. The agreed-upon yields earned by the counterparty for the reverse repurchase agreements held were between .15% and .30% at December 31, 2014. The reverse repurchase agreements had open maturities, whereby a maturity date is not established upon entering into the agreement; however, interest rates on the agreements are negotiated daily. The agreements can be terminated at the will of either SWIB or the counterparty.
The cash due to counterparties resulting from reverse repurchase agreements is reported as Obligation Under Reverse Repo Agreement and the interest due to counterparties is included in Investment Payables on the Statement of Fiduciary Net Position. The underlying assets, as well as the reinvested proceeds, are reported in the Investments at Fair Value section on the Statement of Fiduciary Net Position.
Custodial Credit Risk
Deposits: Custodial credit risk related to deposits is the risk that, in the event of the failure of a depository financial institution, SWIB will not be able to recover deposits that are in possession of an outside party. Bank deposits as of December 31, 2014, were $1.0 billion. Of the total deposits, $732.5 million were collateralized by securities
Retirement FundsReverse Repurchase Agreements
Counterparty Credit ExposureAs of December 31, 2014
($ in thousands)
Fair Value of Collateral and Margin Held by Counterparty/Agent $ 838,237 Less: Cash due to Counterparty $ 820,516 Collateral and Interest due to Counterparty 728 Total due to Counterparty 821,244 Net Counterparty Credit Exposure $ 16,993
borrowed. Additionally, a portion of the total deposits were uninsured and uncollateralized representing balances held in foreign currencies in SWIB’s custodian’s nominee name and cash posted as collateral for derivatives transactions as well as cash collateral posted exceeding the fair value of securities held by SWIB related to SWIB’s shorting program. The sum of uninsured and uncollateralized deposits amounted to $247.9 million as of December 31, 2014. The remaining deposits were covered by depository insurance at year end. The Retirement Funds also held time deposits with foreign financial institutions with a fair value of $17.9 million as of December 31, 2014, which were uncollateralized and uninsured. In addition, as of December 31, 2014, the Retirement Funds held certificates of deposit which were covered by depository insurance with a fair value of $56.7 million.
Investments: Custodial credit risk for investments is the risk that, in the event of the failure of the counterparty to a transaction, SWIB will not be able to recover the value of investments that are in the possession of an outside party. The repurchase agreements held by the Retirement Funds were 13 agreements totaling $151.5 million as of December 31, 2014. All of these repurchase agreements were tri-party agreements held in short-term cash management portfolios managed by SWIB’s custodian. The underlying securities for these repurchase agreements were held by the tri-party’s agent, not in SWIB’s name.

2014 COMPREHENSIVE ANNUAL FINANCIAL REPORT 55
FINANCES
adjusted duration calculation which is similar to the modified duration method. Option adjusted duration incorporates the duration shortening effect of any embedded call provisions in the securities.
Short-term portfolios interest rate risk is analyzed using the weighted average maturity (to next reset).Weighted average maturity is the maturity of each position in a portfolio weighted by the dollar value of the position to compute an average maturity for the portfolio as a whole. This measure indicates a portfolio’s sensitivity to interest rate changes: a longer weighted average maturity implies greater volatility in response to interest rate changes.
SWIB’s investment guidelines related to interest rate risk vary by portfolio. Some fixed income portfolios are required to be managed within a range of a targeted duration, while others are required to maintain a weighted average maturity at or below a specified number of days or years.
The table, Retirement Funds Interest Rate Sensitivity by Investment Type, presents the aggregated interest rate exposure for the Retirement Funds’ assets. Weighted average maturity, where reset dates are assumed to be the effective maturity date for the security, is presented for repurchase agreements and short term pooled investments. Longer term instruments held by the Retirement Funds are presented using modified duration, as this measure more accurately states the interest rate sensitivity of these investments. The duration statistic is calculated utilizing reset dates for some floating rate instruments, such as term loans.
Interest rate risk for the Retiree Life Insurance Funds is minimized by the Company maintaining a diversified portfolio of investments and monitoring cash flow patterns, in order to approximately match the expected maturity of liabilities. The pool’s investment objective is to maintain levels in this general account sufficient to guarantee principal amounts of reserves. The interest rate exposure of this pool, expressed in terms of duration and average remaining life, is 6.3 and 8.9 years, respectively.
Although SWIB has not adopted a formal deposit or investment policy specifically related to custodial credit risk, SWIB investment staff monitor the creditworthiness of SWIB’s custodian as a counterparty, depository financial institution and as agent for certain reverse repurchase agreements and securities lending activity. Concerns and issues are discussed with SWIB’s credit task force for further action. Additionally, SWIB’s custodian reviews each sub-custodian’s operations, local market activity, financial strength, regulatory compliance and overall service performance throughout the year.
Concentration of Credit Risk
Concentration of credit risk is the risk of loss attributed to the magnitude of an organization’s investment in a single issuer. SWIB limits concentrations of credit risk by establishing investment guidelines for individual portfolios or groups of portfolios that generally restrict issuer concentrations in any one company or Rule 144A securities to less than 5% of the portfolio’s market value. The Retirement Funds did not hold any investments with a single issuer, exclusive of investments issued or explicitly guaranteed by the U.S. government, representing 5% or more of the WRS’s fiduciary net position at December 31, 2014.
Interest Rate Risk
Fixed income instruments held by the Retirement Funds include investments with variable rate securities, stepped rate securities, securities with no coupon, such as discount notes and coupons that range between .01% and 15.95% at December 31, 2014. Interest rate risk is the risk that changes in interest rates will adversely affect the fair value of an investment. SWIB uses a number of different methods to manage interest rate risk.
Generally, SWIB analyzes long or intermediate term portfolios’ interest rate risk using various duration calculations. Modified duration, which is stated in years, is the measure of price sensitivity of a fixed income security to an interest rate change of 100 basis points. The calculation is based on the weighted average of the present values for all cash flows. Some pooled investments are analyzed using an option

56 COMPREHENSIVE ANNUAL FINANCIAL REPORT 2014
FINANCES
Foreign Currency Risk
Foreign currency risk is the risk that changes in exchange rates will adversely impact the fair value of an investment. It includes the risk that currencies in which a portfolio’s investments are denominated, or currencies in which a portfolio has taken on an active position, will decline in value relative to the U.S. dollar.
Foreign currency exchange rates may fluctuate significantly for a number of reasons, including the forces of supply and demand in the foreign exchange markets, actual or perceived changes in interest rates, intervention by U.S. or foreign governments or central banks, currency controls, or political developments in the U.S. or abroad.
SWIB’s policies include foreign currency risk management objectives relating to each individual portfolio. These guidelines address the foreign currency management activities permitted for
each portfolio based on the portfolios mandates, risk tolerances and objectives. SWIB also employs discretionary currency overlay strategies at the total fund level when currency market conditions suggest such strategies are warranted. Additional information related to the management of foreign currencies through the use of derivatives is discussed later in these notes.
The table, Retirement Funds Currency Exposures by Investment Type, presents the funds’ investments which were exposed to foreign currency risk at December 31, 2014.
Foreign currency risk for the Retiree Life Insurance Funds is minimized by the Company, utilizing short-duration spot forward contracts to reduce the adverse impact of foreign currency exchange rate risks inherent in the elapsed time between trade processing and trade settlement.
Investment Type Fair Value Duration (years) Weighted Average Maturity (days)
Asset Backed Securities $ 49,368 1.61 -Commercial Paper 870,435 0.17 -Corporate Bonds & Private Placements 4,992,052 5.74 -Foreign Government/Agency Bonds 3,752,326 7.73 -Futures Contracts* 3,690,696 4.94 -Municipal Bonds 117,639 10.73 -Repurchase Agreements 151,526 - 3U.S. Government Agencies 633,802 1.78 -U.S. Treasury Inflation Protected Securities 6,878,808 7.87 -U.S. Treasury Securities 3,925,967 4.78 -Commingled Funds: Short Term Cash Management 1,462,719 - 117 Emerging Market Fixed Income 526,942 7.15 - Global Fixed Income 500,984 4.66 - Domestic Fixed Income 6,325,551 6.23 - Total $33,878,815 * Notional amount presented for fair value.
Retirement FundsInterest Rate Sensitivity by Investment Type
As of December 31, 2014($ in thousands)

2014 COMPREHENSIVE ANNUAL FINANCIAL REPORT 57
FINANCES
1) C
omm
ingl
ed fu
nds
(incl
udin
g lim
ited
part
ners
hips
and
oth
er p
oole
d ve
hicl
es) r
epre
sent
inve
stm
ents
whe
re th
e Re
tirem
ent F
unds
ow
n on
ly a
por
tion
of th
e ov
eral
l fun
d. W
hile
the
over
all f
und
may
be
deno
min
ated
in U
.S. d
olla
rs, t
he u
nder
lyin
g in
vest
men
ts m
ay b
e ex
pose
d to
fore
ign
curr
ency
risk
in v
ario
us c
urre
ncie
s. C
omm
ingl
ed fu
nds
are
show
n in
the
deno
min
atio
n us
ed b
y th
e fu
nd fo
r fina
ncia
l re
port
ing.
2) S
hort
Sel
l Obl
igat
ions
are
repo
rted
as
liabi
litie
s on
the
Stat
emen
t of N
et In
vest
men
t Pos
ition
. The
y ar
e in
clud
ed in
the
abov
e ta
ble
beca
use
they
hav
e ex
posu
re to
fore
ign
curr
ency
risk
.3)
Val
ues
may
not
add
due
to ro
undi
ng.
Retir
emen
t Fun
dsCu
rren
cy E
xpos
ure
by In
vest
men
t Typ
eD
ecem
ber 3
1, 2
014
(Sta
ted
in U
.S. D
olla
rs)
Macintosh HD:Users:Z:Desktop
:Workshe
et in
H anu
alrpt 2
014 CA
FR Finan
ces 20
14 Full E
TF CAFR
Notes FIN....xlsxFN 3E Sch 1
Curren
cy Cash & Cash
Equivalents
Stocks
Fixed
Inco
me
Lim
ited Pa
rtne
rships
Mul� Asset
Rea
l Estate
Preferred
Securi�es
Con
ver�ble
Secu
ri�e
s Op�
ons
Futures
Contracts
Swap
s Sho
rt Sell
Obliga�
ons
Total
Australian Dollar
9,81
7,56
4$
978,26
5,72
7$
55,218
,308
$
-‐$
-‐$
-‐$
-‐$
-‐$
-‐$
987,50
4$
-‐$
-‐$
1,04
4,28
9,10
3$
Brazilian
Rea
l2,86
6,30
8
91,190
,340
21,715
,188
-‐
-‐
-‐
71,963
,752
-‐
-‐
-‐
-‐
-‐
187,73
5,58
8
Cana
dian
Dollar
14,415
,688
1,37
2,51
8,04
5
54,009
,564
-‐
-‐
-‐
-‐
-‐
-‐
1,29
6,77
4
-‐
(3,000
,147
)
1,43
9,23
9,92
5
Colombian
Peso
-‐
-‐
1,85
7,84
5
-‐
-‐
-‐
-‐
-‐
-‐
-‐
-‐
-‐
1,85
7,84
5
Czech Ko
runa
-‐
731,73
1
-‐
-‐
-‐
-‐
-‐
-‐
-‐
-‐
-‐
-‐
731,73
1
Dan
ish Kron
e-‐
224,41
8,52
8
26,054
,463
-‐
-‐
-‐
-‐
-‐
-‐
-‐
-‐
-‐
250,47
2,99
1
Egyp
�an Po
und
3,38
3
-‐
-‐
-‐
-‐
-‐
-‐
-‐
-‐
-‐
-‐
-‐
3,38
3
Euro Currenc
y Unit
23,738
,165
4,86
6,07
7,41
6
1,64
0,00
2,26
0
703,35
7,77
6
-‐
-‐
94,220
,799
-‐
(567
,281
)
1,40
1,23
5
-‐
(88,19
7,27
4)
7,24
0,03
3,09
5
Hon
g Ko
ng Dollar
3,25
6,20
9
702,50
9,43
3
-‐
-‐
-‐
-‐
-‐
-‐
-‐
-‐
-‐
-‐
705,76
5,64
2
Hun
garian
Forint
2
-‐
7,27
4,46
4
-‐
-‐
-‐
-‐
-‐
-‐
-‐
-‐
-‐
7,27
4,46
6
Indian
Rup
ee1,60
2,24
0
154,34
7,86
8
-‐
-‐
-‐
-‐
-‐
-‐
-‐
-‐
-‐
-‐
155,95
0,10
8
Indo
nesian
Rup
iah
148,13
7
8,51
7,00
6
15,413
,194
-‐
-‐
-‐
-‐
-‐
-‐
-‐
-‐
-‐
24,078
,337
Israeli N
ew She
kel
1,20
6,79
9
46,912
,359
-‐
-‐
-‐
-‐
-‐
-‐
-‐
-‐
-‐
(53,89
5)
48,065
,263
Japa
nese Yen
14,976
,595
3,23
8,08
8,06
8
969,33
0,52
5
-‐
-‐
-‐
-‐
-‐
-‐
(2,589
,841
)
-‐
(78,15
9,32
9)
4,14
1,64
6,01
7
Malaysian
Ringg
it1,70
3,41
1
47,849
,624
37,461
,420
-‐
-‐
-‐
-‐
-‐
-‐
-‐
-‐
-‐
87,014
,455
Mexican
New
Peso
38,115
,609
34,206
,552
82,795
,107
-‐
-‐
-‐
-‐
-‐
-‐
-‐
-‐
-‐
155,11
7,26
7
Moroc
can Dirha
m13
,314
-‐
-‐
-‐
-‐
-‐
-‐
-‐
-‐
-‐
-‐
-‐
13,314
New
Taiwan
Dollar
14,138
197,70
8,83
0
-‐
-‐
-‐
-‐
-‐
-‐
-‐
-‐
-‐
-‐
197,72
2,96
8
New
Turkish Lira
5,44
5
69,893
,922
-‐
-‐
-‐
-‐
-‐
-‐
-‐
-‐
-‐
-‐
69,899
,367
New
Zea
land
Dollar
598,08
8
31,898
,379
7,40
8,14
8
-‐
-‐
-‐
-‐
-‐
-‐
-‐
-‐
-‐
39,904
,615
Norweg
ian Kron
e1,10
5,39
5
113,96
1,41
1
7,80
6,29
8
-‐
-‐
-‐
-‐
-‐
-‐
-‐
-‐
-‐
122,87
3,10
4
Peruvian
Nue
vo Sol
(4)
-‐
697,78
9
-‐
-‐
-‐
-‐
-‐
-‐
-‐
-‐
-‐
697,78
5
Philipp
ine Pe
so13
,141
4,39
7,50
9
-‐
-‐
-‐
-‐
-‐
-‐
-‐
-‐
-‐
-‐
4,41
0,64
9
Polish Zloty
1,16
0,90
6
26,358
,218
33,005
,727
-‐
-‐
-‐
-‐
-‐
-‐
-‐
-‐
-‐
60,524
,851
Poun
d Sterlin
g19
,554
,989
3,61
0,55
7,74
9
366,38
6,96
2
77,406
,506
-‐
-‐
-‐
-‐
-‐
1,85
4,81
4
-‐
-‐
4,07
5,76
1,02
0
Russian Ru
ble
-‐
-‐
4,26
9,61
5
-‐
-‐
-‐
-‐
-‐
-‐
-‐
-‐
-‐
4,26
9,61
5
South African
Ran
d2,49
8,08
7
72,628
,040
32,835
,482
-‐
-‐
-‐
-‐
-‐
-‐
-‐
-‐
-‐
107,96
1,60
8
Sing
apore Dollar
2,27
8,31
0
187,00
8,07
4
502,73
9
-‐
-‐
-‐
-‐
-‐
-‐
-‐
-‐
(4,635
,161
)
185,15
3,96
2
South Ko
rean
Won
404,69
3
280,38
0,64
9
8,76
9,70
2
-‐
-‐
-‐
-‐
-‐
-‐
-‐
-‐
-‐
289,55
5,04
4
Swed
ish Kron
a3,12
5,76
1
436,06
4,90
8
11,508
,925
20,885
,593
-‐
-‐
-‐
-‐
-‐
-‐
-‐
(15,52
6,50
2)
456,05
8,68
4
Swiss Fran
c32
1,49
2,80
7,09
7
-‐
-‐
-‐
-‐
-‐
-‐
-‐
-‐
-‐
(15,90
3,18
5)
1,47
6,90
3,94
5
Thailand
Bah
t2,52
5
77,266
,246
-‐
-‐
-‐
-‐
-‐
-‐
-‐
-‐
-‐
-‐
77,268
,771
United States Dollar
3,17
8,51
3,01
5
32,358
,760
,426
23,749
,739
,531
9,75
2,93
4,91
9
3,90
6,83
4,49
2
1,01
7,43
2,55
8
55,200
,212
3,77
9,26
6
(1,049
,114
)
(3,276
,110
)
(27,82
9)
(268
,063
,479
)
73,750
,777
,887
Urugu
ayan
Peso
-‐
-‐
5,20
8,09
4
-‐
-‐
-‐
-‐
-‐
-‐
-‐
-‐
-‐
5,20
8,09
4
Total
3,32
1,13
7,94
5$
50,725
,324
,156
$
27,139
,271
,349
$
10,554
,584
,793
$
3,90
6,83
4,49
2$
1,01
7,43
2,55
8$
221,38
4,76
3$
3,77
9,26
6$
(1,616
,395
)$
(325
,625
)$
(27,82
9)$
(473
,538
,971
)$
96,414
,240
,502
$
Re�remen
t Fun
dsCu
rren
cy Exposures by Investmen
t Type
Decem
ber 31, 2014
(Stated in U.S. D
ollars)
1) C
ommingled
fund
s (in
clud
ing lim
ited pa
rtne
rships and
other poo
led ve
hicles) rep
resent in
vestmen
ts whe
re th
e Re
�rem
ent F
unds own on
ly a por�o
n of th
e ov
erall fun
d. W
hile th
e ov
erall fun
d may be de
nominated
in U.S.
dollars, the
und
erlying inve
stmen
ts m
ay be expo
sed to fo
reign cu
rren
cy risk in various currenc
ies. C
ommingled
fund
s are show
n in th
e de
nomina�
on used by
the fund
for fin
ancial rep
or�n
g.
2) Sho
rt Sell O
bliga�
ons are repo
rted
as liabili�
es on the Statem
ent o
f Net In
vestmen
t Posi�on
. Th
ey are in
clud
ed in
the ab
ove table be
cause they
have expo
sure to
foreign cu
rren
cy risk.
3) V
alue
s may not add
due
to rou
nding.

58 COMPREHENSIVE ANNUAL FINANCIAL REPORT 2014
FINANCES
posted as collateral relating to short sale transactions and earns a comparable overnight repurchase agreement market rate of return for the duration of the posting. Additional information relating to short sales is discussed later in the notes.
At December 31, 2014, the Retirement Funds had minimal credit risk exposure to borrowers because the amounts owed to the borrowers exceeded the amounts the borrowers owed the Retirement Funds. In addition to the cash collateral reinvestment indemnification, the contract with the lending agent requires it to indemnify the Retirement Funds if the borrowers fail to return the loaned securities and the collateral is inadequate to replace the securities lent. The Retirement Funds are also indemnified against losses resulting from violations of investment guidelines.
The majority of security loans are open-ended and can be terminated on demand by the Retirement Funds or the borrower. Maturities of investments made with cash collateral are not necessarily matched to the maturities of the securities loaned because most loans do not have a fixed maturity date. The risk that SWIB would be unable to return collateral to securities borrowers upon termination of the loan is low because the majority of investments made with cash collateral mature in one to two business days. The average maturities of the loans and the average maturities of the assets held in the collateral reinvestment pools did not materially differ at December 31, 2014.
Securities lending is allowed in certain commingled fund investments. As an investor in such funds, SWIB does not own the underlying securities and does not separately report on securities lending activity. All earnings of these funds are reported in the Statement of Changes in Fiduciary Net Position as Net Appreciation (Depreciation) in Fair Value of Investments.
Derivatives
A derivative instrument, as defined by GASB Statement No. 53, is a financial instrument or other contract that has all of the following characteristics:
Securities Lending Transactions
State statutes and SWIB Board of Trustees policies permit SWIB to use investments of the Retirement Funds to enter into securities lending transactions. These transactions involve the lending of securities to broker-dealers and other entities in exchange for collateral, in the form of cash or securities, with the simultaneous agreement to return the collateral for identical securities in the future. SWIB’s custodian is an agent in lending the Retirement Funds’ directly held domestic and international securities. When the Retirement Funds’ securities are delivered to a borrower as part of a securities lending agreement, the borrower is required to place collateral equal to at least 102 percent of the loaned securities’ fair value, including interest accrued, as of the delivery date with the lending agent, so long as the securities and the collateral are denominated in the same currency. In the event that securities are loaned against collateral denominated in a different currency, the borrower is required to place collateral totaling at least 105 percent of the loaned securities’ fair value, including interest accrued, as of the delivery date with the lending agent. Collateral is marked to market daily and adjusted as needed to maintain the required minimum level. Pledging or selling non-cash collateral securities cannot be done without a borrower default.
Cash collateral is reinvested by the lending agent in two separate pools: a U.S. dollar cash collateral pool and a pool denominated in Euros. These pools are administered in accordance with contractual investment guidelines which are designed to minimize the risk of principal loss and provide a modest rate of return. Investment guidelines limit credit and liquidity risk by restricting new investments to overnight repurchase agreements collateralized with high quality U.S. government, U.S. government agencies, and sovereign debt securities. To further reduce credit risk, SWIB’s custodian provides indemnification to SWIB against counterparty default. The earnings generated from the collateral investments, plus or minus the rebates received from or paid to the dealers and less fees paid to agents, results in the net earnings from lending activities, which are then split on a percentage basis with the lending agent. Cash from the U.S. dollar pool may be

2014 COMPREHENSIVE ANNUAL FINANCIAL REPORT 59
FINANCES
contract. Alternatively, standardized derivative instruments, such as futures contracts, may be traded on an organized exchange and are referred to as “exchange-traded.”
Inherent in the use of OTC derivatives, the Retirement Funds may be exposed to counterparty credit risk on OTC positions. Counterparty credit risk is the risk that a derivative counterparty may fail to meet its payment obligations under the terms of the derivative contract. SWIB seeks to mitigate this risk through counterparty credit evaluations and approvals, counterparty credit limits, and exposure monitoring procedures. Additionally, policies have been established which seek to implement master netting arrangements with counterparties that permit the closeout and netting of transactions with the same counterparty upon the occurrence of certain events, such as payment default, rating downgrade, bankruptcy, illegality or force majeure. Agreements may also require daily collateral postings to further mitigate credit risk. Cash collateral on deposit with OTC counterparties was $18.7 million at December 31, 2014. No securities were pledged relating to OTC positions.
The Retirement Funds’ OTC positions included foreign currency contracts, OTC options and a total return swap. The table titled Retirement Funds OTC Derivative Investments Subject to Counterparty Credit Risk, summarizes, by credit rating, the Retirement Funds’ exposure to OTC derivative instruments’ counterparty credit risk as of December 31, 2014, without respect to any collateral or netting arrangement.
• Settlement factors. It has (1) one or more reference rates and (2) one or more notional amounts or payment provisions or both. Those terms determine the amount of the settlement or settlements and, in some cases, whether or not a settlement is required.
• Leverage. It requires no initial net investment or an initial net investment that is smaller than would be required for other types of contracts that would be expected to have a similar response to changes in market factors.
• Net settlement. Its terms require or permit net settlement, it can readily be settled net by a means outside the contract, or it provides for delivery of an asset that puts the recipient in a position not substantially different from net settlement.
Derivatives may be used to implement investment strategies for the Retirement Funds. All derivative instruments are subjected to risk analysis and monitoring processes at the portfolio, asset class, and fund levels. Investment guidelines define allowable derivative activity for each portfolio and are based on the investment objectives that have been approved by the Board. Where derivatives are permitted, guidelines stipulate allowable instruments and the manner and degree to which they are to be used.
A derivative can take the form of a contract negotiated between the Retirement Funds and a specific counterparty. This is referred to as an over-the-counter (OTC) contract, such as a forward
Retirement FundsOTC Derivative Investments Subject to Counterparty Credit Risk
As of December 31, 2014($ in thousands)
Counterparty Credit Rating Payable Receivable Fair Value
AA $ (227,113) $ 228,808 $ 1,695A (2,063,478) 2,051,559 (11,919)BBB (1,716,512) 1,715,793 (720)Total $ (4,007,103) $ 3,996,160 $ (10,944)

60 COMPREHENSIVE ANNUAL FINANCIAL REPORT 2014
FINANCES
Currency exposure management is permitted through the use of currency derivative instruments. Direct hedging of currency exposure back to the U.S. dollar is permitted when consistent with the strategy of the portfolio. Cross-currency exposure management to transfer out of an exposed currency and into a benchmark currency is permitted. In some portfolios, currencies of non-benchmark countries may be held through the use of forward contracts, provided that the notional value of any single non-benchmark currency does not exceed 5% of the market value of the portfolio. SWIB may employ discretionary currency overlay strategies at the total fund and asset class level when currency market conditions suggest such strategies are warranted.
Losses may arise from future changes in the value of the underlying currency, or if the counterparties do not perform under the terms of the contract. Spot and forward contracts are valued daily with the changes in fair value included in Net Appreciation (Depreciation) in Fair Value of Investments on the Statement of Changes in Fiduciary Net Position. The net receivable or payable for spot and forward contracts is reflected as Foreign Currency Contracts on the Statement of Fiduciary Net Position. The table titled Retirement Funds Foreign Currency Spot and Forward Contracts presents the fair value of foreign currency spot and forward contract assets and liabilities held by the Retirement Funds as of December 31, 2014.
The aggregate fair value of receivables relating to OTC derivative contracts was $4.0 billion at December 31, 2014. This represents the maximum loss that would be recognized at the reporting date if all counterparties failed to perform as contracted. The number of OTC counterparties with credit exposure was 16. This maximum exposure is reduced to $196.4 million at December 31, 2014, when counterparty collateral and master netting arrangements are taken into account.
Conversely, counterparty credit risk is mitigated by an intermediary for exchange-traded derivatives. For this type of derivative investment, the clearinghouse interposes itself as counterparty to all trades and extends a guarantee that trades will be settled as originally intended. To ensure performance, the exchange establishes, and the clearinghouse monitors, margin requirements to cover nearly all expected price changes for a given product within a specified time period based on market risk. Margin payments are settled daily based upon the price movements of the contracts, thereby significantly reducing counterparty credit risk. The Retirement Funds posted $98.0 million in cash and $68.7 million in securities as collateral with exchange clearing brokers as of December 31, 2014.
Gains and losses for all derivative instruments are reported in the Statement of Changes in Fiduciary Net Position as Net Appreciation (Depreciation) in the Fair Value of Investments.
SWIB invests in derivative investments directly, as well as indirectly through commingled or pooled investments. Information relating to investments held in commingled funds has not been separately disclosed in the financial statements or the accompanying footnotes.
Foreign Currency Spot and Forward Contracts
Foreign Currency Spot and Forward contracts are OTC agreements between two counterparties to exchange designated currencies at a specific time in the future. No cash is exchanged when a foreign exchange spot or forward contract is initiated. Amounts due are paid or received on the contracted settle date.

2014 COMPREHENSIVE ANNUAL FINANCIAL REPORT 61
FINANCES
Currency Notional (local currency) Fair Value ($US) Unrealized Gain/(Loss) ($US) Foreign Currency Contract Receivables Australian Dollar 294,008 $ 240,248 $ (3,611) Brazilian Real 54,475 20,291 (53) British Pound Sterling 138,317 215,643 (4,601) Canadian Dollar 431,270 372,181 (2,108) Chilean Peso 5,563,000 9,109 21 Colombian Peso 2,630,645 1,107 4 Danish Krone 98,967 16,086 (331) Euro Currency Unit 364,423 441,036 (11,087) Hong Kong Dollar 552,944 71,302 (2) Indian Rupee 3,004,637 47,169 (151) Israeli New Shekel 39,279 10,094 188 Japanese Yen 51,562,580 430,130 (15,807) Malaysian Ringgit 2,000 570 (40) Mexican New Peso 795,472 53,873 (1,174) New Zealand Dollar 6,473 5,059 33 Norwegian Krone 177,273 23,632 (1,167) Singapore Dollar 82,506 62,241 (963) Swedish Krona 832,355 106,329 (4,009) Swiss Franc 93,010 93,616 (1,947) United States Dollar 1,766,466 1,766,466 - 3,986,182 (46,805) Foreign Currency Contract Payables Australian Dollar (81,808) (66,917) 1,989 Brazilian Real (29,504) (10,988) 164 British Pound Sterling (357,699) (557,642) 3,888 Canadian Dollar (267,778) (231,065) 5,438 Colombian Peso (5,261,289) (2,213) 34 Danish Krone (274,879) (44,670) 869 Euro Currency Unit (442,646) (535,736) 12,885 Hong Kong Dollar (531,020) (68,476) 3 Indonesian Rupiah (7,175,223) (573) 8 Israeli New Shekel (16,869) (4,335) (92) Japanese Yen (17,912,001) (149,432) 1,707 Malaysian Ringgit (48,000) (13,678) 611 Mexican New Peso (553,570) (37,425) 1,589 New Zealand Dollar (9,010) (7,034) 185 Norwegian Krone (199,958) (26,668) 1,710 Peruvian Nuevo Sol (1,978) (658) 11 Polish Zloty (32,155) (9,040) 519 Singapore Dollar (23,392) (17,652) 140 South African Rand (100,882) (8,691) 141 South Korean Won (9,160,000) (8,372) 88 Swedish Krona (559,285) (71,446) 2,277 Swiss Franc (111,660) (112,410) 1,725 United States Dollar (2,011,977) (2,011,977) - (3,997,098) 35,889 Net Unrealized Gain (Loss) on Foreign Currency Spot and Forward Contracts $ (10,916) $ (10,916)
Retirement FundsForeign Currency Spot and Forward Contracts
As of December 31, 2014($ in thousands)

62 COMPREHENSIVE ANNUAL FINANCIAL REPORT 2014
FINANCES
Futures contracts involve, to varying degrees, risk of loss in excess of the margin deposited with the broker. Losses may arise from future changes in the value of the underlying instrument.
Futures contracts may be entered into to efficiently gain or adjust market exposures for purposes that include trust fund rebalancing, sector, interest rate, or duration types of exposure adjustments; the securitization of cash or as a substitute for cash market transactions.
The table, Retirement Funds Futures Contracts, presents the Retirement Funds’ investments in futures contracts as of December 31, 2014.
Futures Contracts
A futures contract is an exchange-traded agreement to buy or sell a financial instrument, index or commodity at an agreed-upon price and time in the future.
The fair value of futures contracts represents the unrealized gain/ (loss) on the contract, since inception, and is included in Financial Futures Contracts on the Statement of Fiduciary Net Position. Futures contracts are marked to market daily, based upon the closing market price of the contract at the board of trade or exchange on which they are traded. Gains and losses resulting from investments in futures contracts are included in the Net Appreciation (Depreciation) in Fair Value of Investments on the Statement of Changes in Fiduciary Net Position.
Retirement FundsFutures Contracts
As of December 31, 2014( $ in thousands)
Unrealized Appreciation Description Expiration Notional Amount (Depreciation)*Long Fixed Income Futures Mar 15 $ 4,197,590 $ 30,167Short Fixed Income Futures Mar 15 (506,895) (4,417)Long Equity Index Futures Mar 15 897,669 19,319Short Equity Index Futures Mar 15-May 15 (15,481) (358)Long Commodity Futures Jan 15-Mar 15 792,416 (45,037)Short Commodity Futures - - -Total $ 5,365,299 $ (326)
* Unrealized appreciation/(depreciation) includes foreign currency gains/(losses).
Trust fund rebalancing policies and portfolio investment guidelines permit the use of exchange-traded and OTC options. Investment Guidelines allow options to be used to improve market exposure efficiency, enhance expected returns, or provide market exposure hedges. Exchange rules require that the seller of exchange-traded call option contracts cover these positions either by collateral deposits in the form of cash or securities or by pledging, in escrow, the actual securities that would be transferred
Options
An option contract gives the purchaser of the contract the right, but not the obligation, to buy (call) or sell (put) the security or index underlying the contract at an agreed-upon price on or before the expiration of the option contract. The seller of the contract is subject to market risk, while the purchaser is subject to credit risk and market risk, to the extent of the premium paid to enter into the contract.

2014 COMPREHENSIVE ANNUAL FINANCIAL REPORT 63
FINANCES
contracts are included in the Net Appreciation (Depreciation) in Fair Value of Investments on the Statement of Changes in Fiduciary Net Position. The table, Retirement Funds Option Contracts, presents the fair value of option contracts as of December 31, 2014.
to the option purchaser in the event the option contract were exercised.
The fair value of option contracts is based upon the closing market price of the contract and is reflected as Options on the Statement of Fiduciary Net Position. Gains and losses as a result of investments in option
Retirement FundsOption Contracts
As of December 31, 2014($ in thousands)
Unrealized GainDescription Expiration Notional (Loss) Fair ValueOptions Sold Exchange-Traded Equity-Call Jan 15 - Jul 15 $ (34,029) $ (10) $ (875) Equity-Put Jan 15 - Apr 15 (250,029) 1,140 (1,140) Commodity-Put Jan 15 - Mar 15 (4,673) (489) (601)
Over-the-Counter Equity-Call Jan 15 - Jul 15 (660) 5 (10) Equity-Put Jan 15 - Feb 15 (163,176) (67) (557) (452,567) 579 (3,183)Options Purchased Exchange-Traded Equity-Call Jan 15 - Jul 15 31,746 124 1,543 Equity-Put Jan 15 - Jul 15 3,482 (169) 24 35,228 (45) 1,567 Total $ (417,339) $ 534 $ (1,616)
equity index less the accrued interest owed to the counterparty. Gains and losses resulting from investments in swap contracts are included in the Net Appreciation (Depreciation) in Fair Value of Investments on the Statement of Changes in Fiduciary Net Position. The fair value of swaps is reported as Swaps on the Statement of Fiduciary Net Position in a loss position of $27,829 at December 31, 2014.
As is specified in SWIB’s investment guidelines, OTC derivatives, including swaps, may be used as an alternative to physical securities when it is deemed advantageous for portfolio construction. In addition, swaps may be used to adjust asset class exposures
Swaps
Swaps are negotiated contractual agreements between two counterparties. The Retirement Funds entered into a total return swap in 2013 with a termination date of December 1, 2014 and entered into a similar agreement in 2014 with a termination date of November 18, 2015. Under the terms of the swap, the Funds receive the total return of an equity index while paying the counterparty a variable rate of return based on the 3-month London Interbank Offering Rate (LIBOR). Each of these swaps has a notional value of $10 million. Fair value is determined based on quoted market prices of the underlying

64 COMPREHENSIVE ANNUAL FINANCIAL REPORT 2014
FINANCES
borrow the security and deliver it to the buyer. If the shorted security is owned by another Retirement Fund portfolio, investment policies allow the borrowing of securities from other Retirement Fund portfolios, including inter-fund borrowings. Except in the case of borrowing within the same trust fund, the Retirement Funds are required to post collateral to the lender, at the required rate of 102% for in-currency loans and 105% for cross-currency loans. The Retirement Funds posted $765.2 million in collateral to security lenders representing $32.8 million in excess of the fair market value of the securities borrowed as of December 31, 2014. If the security lender recalled the security and SWIB was not able to supply the lender with the security, the lender would be permitted to use SWIB’s collateral to fund the purchase of the security.
Multi Asset
SWIB employs portfolio strategies which involve investment across multiple asset classes. The Multi Asset Investments account on the Statement of Fiduciary Net Position consists of risk parity and hedge funds multi asset strategies. Risk parity and hedge fund investments are either in the form of a commingled fund, with ownership through fund shares, or a limited partnership.
The risk parity portfolios seek to equally weight asset allocation risk across multiple assets and geographies. Exposures are expected to deliver improved risk and return tradeoffs, versus conventional portfolios comprised of stocks and bonds. The risk parity portfolios also intend to provide more diversified exposure over various economic environments.
The Retirement Funds invest in a diversified set of hedge fund strategies, invested across multiple asset classes. In general, a hedge fund is a private investment fund that seeks to produce absolute returns using a broad range of strategies with low to moderate levels of volatility, typically employing both long and short positions. An allocation to a diversified hedge fund portfolio is intended to have low correlation to traditional publicly traded equities.
Hedge funds can be illiquid, either by virtue of the illiquidity of underlying assets, or due to lock-up
for the Retirement Funds. Guideline limits and soft risk parameters for each portfolio are applied to the aggregate exposures which includes both physical and synthetic securities.
Short Sell Obligations
The Retirement Funds may sell a security it does not own in anticipation of purchasing the security later at a lower price. This is known as a short sale transaction. For the duration of the short sale transaction, a liability is recorded under Short Sell Obligations on the Statement of Fiduciary Net Position. The liability presented on the Statement of Fiduciary Net Position represents the fair value of the shorted securities necessary for delivery to the purchaser and is marked-to-market daily. Realized and unrealized gains and losses associated with short sales are recorded on the Statement of Changes in Fiduciary Net Position within the Net Appreciation (Depreciation) in Fair Value of Investments account. While the transaction is open, the Retirement Funds incur expenses for securities borrowing costs. In addition, as a security borrower, the Retirement Funds may incur dividend and interest expense as such payments must be remitted to the security lender during the course of the loan. Such expenses are included in Investment Expenses on the Statement of Changes in Fiduciary Net Position.
Risks arise from short sales due to the possible illiquidity of the securities markets and from potential adverse movements in security values. The cost to acquire the securities sold short may exceed the amount of proceeds initially received, as well as the amount of the liability recorded as Short Sell Obligations in the Statement of Fiduciary Net Position. Short sales expose the short seller to potentially unlimited liability because there is no upward limit on the price a shorted security could attain. Certain portfolio guidelines permit short sales and, to mitigate risks, the total value of short sales in any portfolio may not exceed 50% of a portfolio’s value. In addition, portfolios which engage in short sales have long only benchmarks established by the SWIB Board of Trustees. Investment performance and risk associated with each portfolio is measured against benchmarks and monitored by management.
When a short sale occurs, the shorting portfolio must

2014 COMPREHENSIVE ANNUAL FINANCIAL REPORT 65
FINANCES
• Educator participant in the WRS appointed by the Teachers Retirement Board
• Non-educator participant in the WRS appointed by the Wisconsin Retirement Board
• Secretary of the Department of Administration or designee
Board-approved guidelines are intended to assist in development of a diversified portfolio of investments, tailored to accomplish the purpose of each fund within acceptable risk parameters. They represent a delegation of standing authority to the Executive Director and investment managers within the organization to make prudent investments within the investment guidelines, pursuant to sections 15.02(4) and 25.16(1) of the Wisconsin Statutes and section IB 2.02 of the Wisconsin Administrative Code.
Additionally, the Investment Committee (IC) was created to provide oversight of SWIB investments within the parameters established by the SWIB Board of Trustees. Oversight includes analysis of risk and return of the portfolio, asset class, and Retirement Funds. The IC is responsible for proposing to the SWIB Board of Trustees changes to investment guidelines for internally-managed portfolios, for approving investment guidelines for externally managed portfolios, and for approving individual strategies within the Multi-Asset portfolios.
The WRS asset allocation policy is recommended by the IC and adopted by the SWIB Board of Trustees. SWIB undertakes a review of its strategic asset allocation plan every other year, including asset/liability modeling, to determine a suitable target allocation for each asset class included in the Retirement Funds. The strategic nature of these reviews contemplates a long-term time horizon over which potential results are evaluated. This exercise is not an attempt to predict short-term market movements, but an effort to understand the long-term impacts of poor, normal and above average market results. In the “off year” of the two-year cycle, structural asset allocation adjustments and other funding initiatives are considered.
In addition to potential future market impact, SWIB
terms. However, SWIB has taken steps to minimize this risk by investing in hedge funds with more liquid asset classes and by structuring its investments to stagger lock-up periods. Hedge funds also use leverage to varying degrees, and while it is possible that a hedge fund can lose a significant portion of its capital, SWIB has limited the amount it invests in hedge funds in total and with any individual hedge fund manager.
As of December 31, 2014, the majority of SWIB’s risk parity and hedge fund investments are reflected within the Multi Asset Investments account on the Statement of Fiduciary Net Position. Hedge fund portfolios with a long only equity strategy are included within the Stocks classification on the Statement of Fiduciary Net Position.
Long-Term Receivables
Included in the Core Fund’s Investment Sales Receivable account on the Statement of Fiduciary Net Position is $73.0 million in receivables as of December 31, 2014, which are due on or before January 2017. These receivables represent amounts due from third parties related to the sale of private equity limited partnership interests.
Investment Policy and Asset Allocation
SWIB’s Board of Trustees has established investment guidelines pursuant to a comprehensive and ongoing evaluation of the appropriate risk and return standards for each fund under management. Trustees have a fiduciary responsibility, with respect to the Retirement Funds, to act solely in the interest of the WRS. The SWIB Board of Trustees consists of nine members meeting specific requirements as follows:
• Six Governor appointed and State Senate approved members including:
- Four with at least ten years investment experience
- One with at least ten years financial experience and who works for a local government participant in the Local Government Investment Pool
- One additional member

66 COMPREHENSIVE ANNUAL FINANCIAL REPORT 2014
FINANCES
SWIB Board of Trustees will be informed of the nature and method used for each incremental step. Before implementing leverage beyond 10%, the SWIB Board of Trustees, asset allocation consultants and staff will engage in additional focused asset allocation discussion. The table, Retirement Funds Asset Allocation Targets, presents the policy targets as well as the destination targets for the Retirement Funds.
For purposes of determining asset allocation targets, investments may be categorized differently than they are within the financial statements. For example, SWIB’s management considers inflation sensitive assets separately from other “fixed income” investments for asset allocation purposes.
also contemplates the objectives of the funds, the impact of actuarial analysis and the soundness of investment return and risk expectations. SWIB’s asset allocation policies reflect the SWIB Board of Trustee’s program of risk allocation that involves reduced equity exposure coupled with leveraged low-volatility assets, such as “fixed income” securities. This investment strategy results in Core Fund strategic targets that exceed 100% of invested assets. Currently the Core Fund has adopted an asset allocation target of 6% leverage, however over time it is anticipated that SWIB will move toward an asset allocation that includes 20% leveraging of low volatility assets. As SWIB increases the degree of leverage as it moves toward the destination target asset allocation, the
Retirement FundsAsset Allocation Targets
December 31, 2014 Destination Target Target Asset Allocation Asset Allocation Core Fund Asset Class U.S. Equities 26% 21% International Equities 24% 23% Fixed Income 27% 36% Inflation Sensitive Assets 9% 20% Real Estate 7% 7% Private Equity/Debt 7% 7% Multi-Asset 6% 6% Total 106% 120%
Variable Fund Asset Class U.S. Equities 70% 70% International Equities 30% 30% Total 100% 100%
Annual Money-Weighted Rate of Return
Money-weighted rate of return expresses investment performance, net of pension plan investment expense, adjusted for the changing amounts actually invested. For the year ended December 31, 2014, the money-weighted rate of return for the Core Trust Fund was 5.44% and 7.24% for the Variable Trust Fund.
Unfunded Capital Commitments
SWIB entered into a number of agreements that commit the Core Trust Fund to make investment purchases up to predetermined amounts over certain investment time periods. The unfunded capital commitments for private equity, real estate and multi asset investments not reported on the Statement of Fiduciary Net Position totaled $6.2 billion as of December 31, 2014.

2014 COMPREHENSIVE ANNUAL FINANCIAL REPORT 67
FINANCES
County. As of December 31, 2014, the number of participating employers was:
State Agencies, UW & Public Authorities 57Cities 152Counties 714th Class Cities 36Villages 261Towns 246School Districts 424Cooperative Educational Service Agencies 12Wisconsin Technical College System Districts 16Special Districts 207Total Employers 1,482
WRS Membership
Any employee of a participating employer who is expected to work at least 1,200 hours per year (880 hours per year for teachers and school district educational support employees) must be covered by the WRS. As of December 31, 2014, the WRS membership consisted of:
Current Employees: General 133,882Teachers 99,618Elected / Executive / Judges 1,409Protective with Social Security 19,603Protective without Social Security 2,743Total Current Employees 257,255 Inactive Participants: Terminated Participants 157,072Alternate Payees 4,051Total Inactive Participants 161,123
Retirees and Beneficiaries Currently Receiving Benefits: Retirement Annuities 177,959Disability Annuities 6,363Death Beneficiary Annuities 1,283Total Annuitants 185,605 Total Participants 603,983
The Wisconsin Retirement System (WRS) is a cost-sharing, multiple-employer public employee retirement system established and administered by the State of Wisconsin to provide pension benefits for state and local government employees. WRS benefits and other plan provisions are established by Chapter 40 of the Wisconsin Statutes. Benefit terms may only be modified by the legislature. ETF, under the direction of the ETF Board, is responsible for the administration of the WRS.
Employee Trust Funds Board
The ETF Board has general oversight of ETF, appoints the ETF Secretary and oversees administration of the benefit programs, other than group insurance and deferred compensation. The Board is comprised of 13 members, including:
• the Governor or the Governor’s designee on the Group Insurance Board,
• the director of the Office of State Employment Relations or the director’s designee,
• 4 members appointed by the Teachers Retirement Board (an advisory board to the ETF Board),
• 4 members appointed by the Wisconsin Retirement Board (an advisory board to the ETF Board),
• a public member who is not a participant in or beneficiary of the WRS, with at least 5 years of experience in actuarial analysis, administration of an employee benefit plan or significant administrative responsibility in a major insurer,
• a WRS annuitant, and • a participant in the WRS who is a technical college
or public school district educational support personnel employee.
WRS Employers
The WRS is open to all public employers in Wisconsin. Participation is optional, except that participation is mandatory for school districts with respect to teachers, some municipalities with respect to police and firefighters, and all counties except Milwaukee
4 DESCRIPTION OF WISCONSIN RETIREMENT SYSTEM

68 COMPREHENSIVE ANNUAL FINANCIAL REPORT 2014
FINANCES
• All active participants in the system at any time from April 24, 1998 to June 30, 2011 are fully vested;
• 2011 Wisconsin Act 32 generally required participants hired on or after July 1, 2011 to have five years of creditable service to be vested.
Employees who retire at or after age 65 (54 for protective occupations and 62 for elected officials and executive service retirement plan participants) are entitled to a retirement benefit based on a formula factor, their final average earnings, and creditable service. Formula factors are shown in the table below.
WRS Benefits
The WRS provides retirement benefits as well as death and disability benefits. Vesting requirements have changed over time, as follows:
• Participants in the system prior to January 1, 1990, were fully vested at the time they met participation requirements;
• For participants entering the system from January 1, 1990, to April 23, 1998, creditable service in each of five years was required for vesting;
Employment Category Service Before Service Between Service After 1/1/2000 2000 and 2011 2011General and Teachers 1.765% 1.6% 1.6%Executive and Elected 2.165 2.0* 1.6*Protective with Social Security 2.165 2.0 2.0Protective without Social Security 2.665 2.5 2.5
*2011 Wisconsin Act 10 changed the Executive and Elected formula factor from 2.0% to 1.6%. The effective date of the change varies among different employee categories, and generally applies to the services earned after Act 10 effective date (i.e., June 29, 2011).
in accordance with s. 40.27, Wis. Stat. An increase (or decrease) in annuity payments may result when investment gains (losses), together with other actuarial experience factors, create a surplus (shortfall) in the reserves, as determined by the system’s consulting actuary. Annuity increases are not based on cost of living or other similar factors. For Core annuities, decreases may be applied only to previously granted increases. By law, Core annuities cannot be reduced to an amount below the original, guaranteed amount (the “floor”) set at retirement. The Core and Variable Fund annuity adjustments granted during recent years are as follows:
Year Core Adjustment Variable Adjustment2005 2.6% 7.0%2006 0.8 3.02007 3.0 10.02008 6.6 0.02009 (2.1) (42.0)2010 (1.3) 22.02011 (1.2) 11.02012 (7.0) (7.0)2013 (9.6) 9.02014 4.7 25.0
Final average earnings is the average of the participant’s three highest annual earnings periods. Creditable service includes current service and prior service for which a participant received earnings and made contributions as required. Creditable service also includes creditable military service. The retirement benefit will be calculated as a money purchase benefit based on the employee’s contributions plus matching employer’s contributions, with interest, if that benefit is higher than the formula benefit.
Vested participants may retire at or after age 55 (50 for protective occupations) and receive an actuarially-reduced benefit. Participants terminating covered employment prior to eligibility for an annuity may either receive employee-required contributions plus interest as a separation benefit or leave contributions on deposit and defer application until eligible to receive a retirement benefit.
Post-Retirement Adjustments
The Employee Trust Funds Board may periodically adjust annuity payments from the retirement system based on annual investment performance

2014 COMPREHENSIVE ANNUAL FINANCIAL REPORT 69
FINANCES
effective January 1, 2001. As of December 31, 2014, there were 61,476 active and inactive members and 40,402 annuitants participating in the Variable Fund.
Municipal Police and Firefighters Pension Group
As of March 31, 1978, administration of certain local funds for police officers and firefighters was assumed by the Wisconsin Retirement Fund. This included approximately 2,000 members. As of December 31, 2014, approximately 125 annuitants or their beneficiaries remained in the system. This group was closed to new members after January 1, 1948.
The liability for retirement benefits for these annuitants is funded by the employers, as benefit payments are made. Annuity reserves for these police and firefighter annuities are established by a transfer from the employer accumulation reserve at the time the annuity is approved. Earnings on these reserves are used to fund annuity adjustments on the same basis as for WRS annuitants. The unfunded liability for these annuitants as of December 31, 2014, was $3.5 million.
Annuity Supplement - General Fund
As authorized under 1985 Wis. Stats. § 40.27 (1), the State’s General Fund provides certain supplemental annuity benefits to annuitants receiving a continuing annuity on or before September 1974. The benefit is subject to continuation of the appropriation by the Legislature. The Department serves as a clearing agent for its payment. Total supplemental annuity benefits paid were $0.3 million in 2014.
The negative Core annuity adjustments from 2009 to 2013 were primarily due to the Fund’s $21.0 billion investment decline in 2008, caused by the global economic crisis. Core Fund gains and losses are recognized over a five-year period. Therefore, 2013 was the fifth and final year that 2008 investment experience would result in a negative Core annuity adjustment.
Long-term Receivables
The Prior Service Contributions Receivable on the Statement of Fiduciary Net Position represents the WRS unfunded actuarial accrued liability (UAAL), determined under the plan’s Frozen Initial Liability funding methodology. This liability is being amortized as a level percentage of payroll over a 40-year period beginning January 1, 1990, for employers in the WRS prior to 2009. The remaining balance is expected to be fully amortized by December 31, 2029. Liabilities for employers joining the WRS beginning in 2009 are amortized over 30 years. Interest is assessed on the outstanding liability at year-end at the assumed earnings rate. The level-percentage-of-payroll amortization method results in a relatively lower dollar contribution in earlier years than in later years, when payrolls have increased. During the early years of the amortization period, payments made are less than annual interest assessments, resulting in an increase in the liability. As payrolls increase annually, prior service payments increase proportionally until they exceed annual interest and ultimately fully liquidate the liability at the end of the amortization period. State law requires the accrued retirement cost to be funded. As of December 31, 2014, the receivable balance was $33.2 million
Variable Retirement Option
Prior to 1980 WRS participants could opt to have one-half of their required contributions and matching employer contributions invested in the Variable Fund. Retirement benefits were adjusted for the difference between the investment experience of the Core Fund and the Variable Fund. Provisions for allowing members to withdraw from the Variable Fund were added with the passage of Chapter 221, Laws of 1979. The Variable Fund was closed to new membership after April 30, 1980. 1999 Wisconsin Act 11 reopened the Variable Fund for existing and future participants,
5 CONTRIBUTIONS REQUIRED AND MADE
Required Contributions
Contribution rates are determined by the “entry age normal with a frozen initial liability” actuarial method. This is a “level contribution” actuarial method intended to keep employer and employee contribution rates at a level percentage of payroll

70 COMPREHENSIVE ANNUAL FINANCIAL REPORT 2014
FINANCES
Employee contributions are deducted from the employee’s salary and remitted to the Department by the participating employer. Employers generally may not pay the employee required contribution. The employee required contribution is one-half of the actuarially-determined contribution rate for General category employees (which includes teachers) and employees in the Elected Official/Executive/Judge category. Required contributions for Protective occupation category employees are the same rate as General category employees. Employers are required to contribute the remainder of the actuarially-determined contribution rate.
over the years. This method determines the amount of contributions necessary to fund: 1) the current service cost, which represents the estimated amount necessary to pay for benefits earned by the employees during the current service year plus actuarial gains or losses arising from the difference between actual and assumed experience; and 2) the prior service cost, which represents the estimated amount necessary to pay for unfunded benefits earned prior to the employer becoming a participating employer in WRS and the past service cost of benefit improvements.
The 2014 contribution requirements were determined by the December 31, 2012, actuarial valuation.
Contribution rates in effect during 2014 by employment category were:
Employer Employer Current Prior * Employee Total General and Teachers 7.0% 0.0% 7.0% 14.0%Elected Official/Executive/Judge 7.75 0.0 7.75 15.5Protective with Social Security 10.1 0.0 7.0 17.1Protective without Social Security 13.7 0.3 7.0 21.0
*The employer prior service contribution rate is a weighted average of individual employer rates.
Contributions required and made during 2014 were:
Contributions ($ in millions) Percentage of PayrollEmployer Current Service $977.1 7.39%Employer Prior Service* 5.9 0.04Employee Required 927.3 7.01
*Employer Prior Service contributions are recorded on the Statement of Fiduciary Net Position as a reduction in the Prior Service Contribution Receivable. Contributions Made includes both mandatory and voluntary payments received from participating employers. Some Prior Service contributions received after year end are included in Contributions Made, but are not in the determination of Prior Service Contributions Receivable. This is due to a difference in how these payments are treated for actuarial and financial reporting purposes.
Employers also contributed $1 million in reimbursement for benefits paid under the s. 62.13, Wis. Stat, Police and Firefighters Pension Program.
Employee and Employer Additional Contributions
Contributions in addition to those required contributions by employees and/or employers may be made to the retirement system. These contributions
are held in separate reserve accounts and are subject to certain restrictions as to amount, form of benefit payments, tax status, etc.

2014 COMPREHENSIVE ANNUAL FINANCIAL REPORT 71
Actuarial assumptions are based upon an experience study conducted in 2012 using experience from 2009–2011. The total pension liability for December 31, 2014 is based upon a roll-forward of the liability calculated from the December 31, 2013 actuarial valuation. The projection of cash flows used to determine the single discount rate assumed that plan member contributions will be made at the current contribution rate and that employer contributions will be made at rates equal to the difference between actuarially determined contribution rates and the member rate. Based on these assumptions, the pension plan’s fiduciary net position was projected to be available to make all projected future benefit payments (including expected dividends) of current plan members. Therefore, the long-term expected rate of return on pension plan investments was applied to all periods of projected benefit payments to determine the total pension liability.
The components of the net pension liability (asset) of the participating employers at December 31, 2014, were as follows ($ in millions):
Total Pension Liability $89,691.1Plan Fiduciary Net Position 92,147.4*Participating Employers’ Net Pension Liability (Asset) ($2,456.3)Plan Fiduciary Net Position as a Percentage of the Total Pension Liability 102.74%
* Immaterial differences may exist between the Plan Fiduciary Net Position used in the actuarial valuation and that reported in the Statement of Fiduciary Net Position due to the timing of the actuarial valuation.
Additional information as of the latest actuarial valuations follows:
Actuarial Valuation Date: December 31, 2013Measurement Date of Net Pension Liability December 31, 2014Actuarial Cost Method: Entry AgeAsset Valuation Method: Fair ValueLong-Term Expected Rate of Return: 7.2%Discount Rate: 7.2%Salary Increases: Inflation 3.2% Seniority/Merit 0.2% - 5.8%Mortality: Wisconsin 2012 Mortality TablePost-retirement Adjustments* 2.1% * No post-retirement adjustment is guaranteed. Actual adjustments are based on recognized investment return, actuarial experience and other factors. 2.1% is the assumed annual adjustment based on the investment return assumption and the post-retirement discount rate.
FINANCES
6 NET PENSION LIABILITY (ASSET) OF PARTICIPATING EMPLOYERS
WRS

72 COMPREHENSIVE ANNUAL FINANCIAL REPORT 2014
FINANCES
Sensitivity of the Net Pension Liability (Asset) to Changes in the Discount Rate
The following presents the plan’s net pension liability (asset), calculated using a single discount rate of 7.20%, as well as what the plan’s net pension liability (asset) would be if it were calculated using a single discount rate that is 1 percentage point lower or 1 percentage point higher ($ in millions):
1% Decrease Current Discount Rate 1% Increase (6.2%) (7.2%) (8.2%)Total Pension Liability $99,077.0 $89,691.1 $82,278.6Plan Fiduciary Net Position 92,147.4 92,147.4 92,147.4Net Pension Liability/(Asset) $6,929.6 ($2,456.3) ($9,868.8)
For the WRS the determination of liabilities also depends on the assumed dividend, which is linked to the interest rate used in the liability calculation. Therefore, we have shown an alternative set of Sensitivity Analysis, which varies the assumed dividend in conjunction with the change in the discount rate. For the liabilities shown below, the assumed dividend was 1.1% for the 6.2% discount rate, 2.1% for the 7.2% discount rate, and 3.0% for the 8.2% discount rate. The liabilities are as follows ($ in millions):
1% Decrease Current Discount Rate 1% Increase (6.2%) (7.2%) (8.2%)Total Pension Liability $90,957.9 $89,691.1 $88,560.5Plan Fiduciary Net Position 92,147.4 92,147.4 92,147.4Net Pension Liability/(Asset) ($1,189.5) ($2,456.3) ($3,586.9)
Long-term Expected Real Rate of Return
The long-term expected rate of return on pension plan investments was determined using a building block method, in which best-estimate ranges of expected future real rates of return (Expected returns, net of pension plan investment expense and inflation) are developed for each major asset class. These ranges are combined to produce the long-term expected rate of return by weighting the expected future real rates of return by the target asset allocation percentage and by adding expected inflation. Best estimates of geometric real rates of return for each major asset class included in the pension plan’s target asset allocation as of December 31, 2014, are summarized in the following table:
Asset Class Long-Term Real Target Allocation Long-Term Real Target Allocation Rate of Return Rate of Return
US Equities 5.3% 21% 5.3% 70%International Equities 5.7 23 5.7 30Fixed Income 1.7 36 N/A Inflation Sensitive Assets 2.3 20 N/A Real Estate 4.2 7 N/A Private Equity/Debt 6.9 7 N/A Multi-Asset 3.9 6 N/A Cash 0.9 -20 N/A
Core Retirement Investment Trust Variable Retirement Investment Trust

2014 COMPREHENSIVE ANNUAL FINANCIAL REPORT 73
The following reserves have been established to reflect legal restrictions on the use of pension trust funds.
Employee Accumulation Reserve
As authorized by Wis. Stats. § 40.04 (4), this reserve includes all required and voluntary employee contributions, including contributions made by the employer on behalf of the employee. This reserve may only be used to pay lump sum benefits or transfers to the Annuity Reserve to fund annuities. All legal restrictions on use of this reserve were met during the year. The Employee Accumulation Reserve is fully funded.
Employee Accumulation Reserve balances ($ in millions) as of December 31, 2014, were: Core Variable TotalEmployee Required $14,750.4 $1,492.4 $16,242.8Employee Additional 144.6 14.7 159.3Total $14,895.0 $1,507.1 $16,402.1
Employer Accumulation Reserve
As authorized by Wis. Stat. § 40.04 (5), this reserve includes all required employer contributions, including contributions for amortization of the unfunded accrued actuarial liability. This reserve may only be used to pay lump sum benefits or transfers to the Annuity Reserve to fund annuities. All legal restrictions on use of this reserve were met during the year. The Employer Accumulation Reserve is 99.9% funded.
Employer Accumulation Reserve balances ($ in millions) as of December 31, 2014, were:
Core Variable Police Total & FirefightersEmployer Accumulation $20,541.2 $1,492.5 $0.0 $22,033.7Less: Unfunded Actuarial Accrued Liability 0.0 0.0 (3.5) (3.5)Net Employer Accumulation $20,541.2 $1,492.5 ($3.5) $22,030.2
Annuity Reserve
As authorized by Wis. Stat. § 40.04 (6), this reserve includes the present value of all annuities. The present value of new annuities is transferred from the Employee Accumulation Reserve and the Employer Accumulation Reserve to the Annuity Reserve. This reserve may only be used for the payment of annuities and death benefits to annuitants. All legal restrictions on use of this reserve were met during the year. The Annuity Reserve is fully funded.
Annuity Reserve balances ($ in millions) as of December 31, 2014, were: Core Variable Police Total & FirefightersAnnuity Reserve $47,125.9 $3,998.1 $9.2 $51,133.2
FINANCES
7 STATUTORY RESERVES

74 COMPREHENSIVE ANNUAL FINANCIAL REPORT 2014
FINANCES
The Health Insurance Fund includes three separate risk pools. The first pool includes those members who have chosen health insurance coverage from an HMO. All liabilities for medical claims for these participants are the responsibility of the HMO and are not included in the unpaid claims analysis or in the Required Supplementary Information.
The second pool includes medical coverage for those members selecting the self-insured indemnity plan offered by the Department. Liabilities for this pool are presented in the unpaid claims analysis and in the Required Supplementary Information.
The third pool includes self-insured pharmacy benefits for all members, regardless of whether they receive medical coverage from an HMO or through the indemnity plan. Liabilities for this pool are presented in the unpaid claims analysis and in the Required Supplementary Information.
Income Continuation Insurance Fund
The Income Continuation Insurance (ICI) Fund offers both long-term and short-term disability benefits (up to 75% of gross salary) for current employees of the State of Wisconsin and participating local public employers. All public employers in Wisconsin are eligible to participate. The State of Wisconsin and 207 local employers currently participate in the plan, and it is self-insured. Since March 2012, premiums have been suspended for the local employers as a result of the increase in funded status of the program.
Long-Term Disability Insurance Fund
Effective October 15, 1992, the Group Insurance Board (GIB) established the Long-Term Disability Insurance (LTDI) program as an alternative to the long-term disability coverage provided through the WRS. The ETF Board purchases disability insurance coverage from the GIB for WRS participants.
Participants who were covered by the WRS prior to October 15, 1992, have the option to select either disability benefits from LTDI or WRS at the time of disability. New WRS participants on or after October 15, 1992, are eligible only for LTDI disability benefits.
Market Recognition Account
As authorized by Wis. Stat. § 40.04 (3), this reserve is used to smooth the flow of investment income into the Employee, Employer, and Annuity Reserves and other benefit plans invested in the Core Fund. Under the Market Recognition Account (MRA), all investment income, including realized and unrealized market gains and losses, is deposited into the MRA. At year-end, income equal to the assumed earnings rate is recognized. Any surplus or shortfall in earnings is recognized equally over five years.
Year-end balances in the MRA ($ in millions) for the last five years after annual distributions were as follows:
As of: MRADecember 31, 2010 $(5,067)December 31, 2011 (5,340)December 31, 2012 2,451December 31, 2013 4,721December 31, 2014 2,540
8 PUBLIC ENTIT Y RISK POOLS
The Department operates four public entity risk pools: Health Insurance, Income Continuation Insurance (ICI), Long-Term Disability Insurance (LTDI), and Life Insurance. In accordance with GASB Statement No. 10, Accounting and Financial Reporting for Risk Financing and Related Insurance Issues, these funds are accounted for as enterprise funds.
Health Insurance Fund
The Health Insurance Fund offers group health insurance for current employees of the State of Wisconsin and of participating local public employers. All public employers in the state are eligible to participate. The State of Wisconsin and 419 local employers participated during the year. The fund includes both a self-insured fee-for-service plan as well as various prepaid plans, primarily Health Maintenance Organizations (HMOs).

2014 COMPREHENSIVE ANNUAL FINANCIAL REPORT 75
FINANCES
inflation and other societal and economic factors. Adjustments to claims liabilities are charged or credited to expense in the periods in which they are made. Unpaid claims liability is presented at face value and is not discounted for Health Insurance. These liabilities are discounted using an interest rate of 7.2% for the ICI and LTDI programs. The liabilities of the ICI, Health Insurance, and LTDI programs were determined by actuarial methods. Face value of the liability for these programs is not available.
Administrative Expenses: All maintenance expenses are expensed in the period they are incurred. Acquisition costs are immaterial and are treated as maintenance expenses.
Reinsurance: Health insurance plans provided by Health Maintenance Organizations are fully insured by outside insurers. All remaining risk is self-insured with no reinsurance coverage.
Risk Transfer: Participating employers are not subject to supplemental assessments in the event of deficiencies. If the assets of a fund were exhausted, participating employers would not be responsible for the fund’s liabilities.
Premium Setting: Premiums are established by the GIB (Health Insurance, ICI, and LTDI), in consultation with actuaries.
Statutory Authority: All programs are operated under the authority of Chapter 40, Wisconsin Statutes.
An LTDI benefit replaces 40% of the disabled participant’s final average earnings until normal retirement age or for a minimum of five years. It also provides for additional annual contributions to the participant’s WRS account equal to 7% of the participant’s final average earnings. At normal retirement age or after a minimum of five years of LTDI benefits, the LTDI benefit terminates and the participant is eligible for a WRS retirement benefit.
Since January 2014, WRS collects actuarially-determined premiums paid by employers participating in the LTDI program and remits them to the GIB for LTDI coverage.
Life Insurance Fund
The Life Insurance Fund offers group life insurance coverage for current State of Wisconsin employees and employees of participating local public employers. All public employers in the state are eligible to participate. The State of Wisconsin and 729 local employers currently participate in the program. Employers and active employees make premium contributions, which ETF passes on to the insurance carrier (the Company). Participants have the option to select multiple coverage levels, each of which requires different premium contributions. Assets and liabilities are recorded in this program for contributions not yet received and payments not yet remitted to the Company, respectively.
Public Entity Risk Pool Accounting Policies
Basis of Accounting: All public entity risk pools are accounted for in enterprise funds using the full accrual basis of accounting and the flow of economic resources measurement focus.
Valuation of Investments: Assets of the Health Insurance, ICI, and LTDI funds are invested in the Core Retirement Investment Trust and are valued at fair value.
Unpaid Claims Liabilities: The fund establishes claims liabilities based on estimates of the ultimate cost of claims that have been reported but not settled and of claims that have been incurred but not reported. The estimate includes the effects of

76 COMPREHENSIVE ANNUAL FINANCIAL REPORT 2014
FINANCES
Unpaid Claims Liabilities
Each fund establishes a liability for both reported and unreported insured events, which is an estimate of future payments of losses. The following represents changes in those aggregate liabilities ($ in millions) for each fund during the past year. The amounts for Health Insurance Programs include only the portion of the program that is self-insured.
Income Long-Term Health Pharmacy Continuation Disability Insurance Benefits Insurance Insurance
2014 2013 2014 2013 2014 2013 2014 2013
Unpaid claims and claim adjustment expensesat beginning of the calendar year $90.7 $82.2 $233.6 $213.1 $2.3 $2.6 ($7.6) $7.1
Incurred claims and claim adjustment expenses:Provision for insured events of the current calendar year 20.5 36.0 47.5 50.6 17.7 16.9 163.5 149.0
Changes in provision for insured events of prior calendar years (8.7) (8.4) 54.0 7.2 (0.9) (0.5) (0.7) (0.1)
Total incurred claims and claim adjustment expenses 11.8 27.6 101.5 57.8 16.8 16.4 162.8 148.9
Payments:
Claims and claim adjustment expenses attributable to insured events of the current calendar year 5.9 6.4 2.1 2.2 15.4 14.6 173.4 156.6
Claims and claim adjustment expenses attributable to insured events of prior calendar years 13.7 12.7 40.5 35.1 1.4 2.1 (8.3) 7.0
Total payments 19.6 19.1 42.6 37.3 16.8 16.7 165.1 163.6 Total unpaid claims and claimadjustment expenses at endof the calendar year $82.9 $90.7 $292.5 $233.6 $2.3 $2.3 ($9.9)* ($7.6)*
*Total unpaid claims at the end of 2014 is the net of $4.5 million in unpaid claims and $14.4 million in rebates due from pharmaceutical companies; unpaid claims at the end of 2013 is the net of $4.2 million in unpaid claims and $11.8 million in rebates due from pharmaceutical companies.

2014 COMPREHENSIVE ANNUAL FINANCIAL REPORT 77
covered payroll based on employer experience.
Description of BenefitsEligibility: Duty-related injury or disease that is likely to be permanent, which causes a protective occupation participant to retire, accept reduced pay or light duty assignment, or in some cases, that impairs promotional opportunities.
Amount: 80% of salary (75% if not a State of Wisconsin employee), less the following offsets:• Social Security• Unemployment Compensation• Worker’s Compensation• Any other WRS benefit• All earnings from the employer under which the
disability occurred• A percent of other earnings as follows:
1/3 of earnings less than 40% of monthly salary – 1/2 of earnings between 40% and 80% of monthly
salary– 2/3 of earnings over 80% of monthly salary
Survivor Benefit: All survivor benefits are offset by any Worker’s Compensation death benefits. • For applications filed prior to May 3, 1988, benefits
are based on the following: – 1/3 of the participant’s monthly salary at time of
death to surviving spouse, plus – $15/month to each unmarried child under the age
of 18 – Not to exceed 65% of participant’s monthly salary
at time of death• For applications filed on or after May 3, 1988
benefits are based on the following:• Local employees: – 1/2 of the participant’s monthly salary at time of
death to surviving spouse or domestic partner, less other income sources that are based on the participant’s earnings record
– 1/10 of the participant’s monthly salary at time of death to each unmarried child under the age of 18
– Not to exceed 70% of participant’s monthly salary at time of death• State employees: – 1/3 of the participant’s monthly salary at time of
death to surviving spouse or domestic partner, plus
– $15/month to each unmarried child under the
The Department administers five OPEB plans: the Duty Disability Insurance Fund, the State Retiree Life Insurance Fund, the Local Government Retiree Life Insurance Fund, the State Retiree Health Insurance Fund and the Local Government Retiree Health Insurance Fund. The Retiree Health Insurance Funds contain certain non-OPEB components relating to post-Medicare pharmacy and health insurance benefits.
Plan Descriptions
Duty Disability Insurance FundThe Duty Disability Insurance Fund is a cost-sharing multiple-employer defined benefit OPEB plan. The plan offers special disability insurance for State of Wisconsin and local WRS participants in protective occupations. The plan is self-insured, and risk is shared between the State of Wisconsin and local government employers in the plan. The plan is administered under Wis. Stat. § 40.65. The plan is reported as an “other employee benefit trust fund”.
MembershipParticipation in the program is mandatory for all WRS employers with protective occupation employees. The State of Wisconsin and 506 local government employers participate. Membership as of December 31, 2014 consisted of:
Disabled members and beneficiaries receiving benefits 990Active plan members 22,346Total plan members 23,336
ContributionsContributions are actuarially determined in accordance with Wis. Stats. § 40.05 (2) (ar). All contributions are employer-paid based on a graduated, experience-rated formula. During 2014 contribution rates ranged from .21% to 6.56% of
FINANCES
9 OTHER POST-EMPLOYMENT BENEFIT (OPEB) PL ANS
ADMINISTERED BY THE DEPARTMENT OF EMPLOYEE TRUST FUNDS

78 COMPREHENSIVE ANNUAL FINANCIAL REPORT 2014
FINANCES
Membership as of December 31, 2014, included: State Local TotalActive* 49,683 72,879 122,562Pre-Age 65 Annuitants 6,969 11,008 17,977Post-Age 64 Annuitants 21,168 28,634 49,802Totals 77,820 112,521 190,341
*Active members include disabled.
ContributionsEmployers are required to pay the following contributions for active members to provide them with Basic Coverage after age 65. There are no employer contributions for pre-65 annuitant coverage. All contributions are actuarially determined.
State Local50% Post Retirement Coverage 28% of employee 40% of employee premium premium25% Post Retirement Coverage n/a 20% of employee premium
ReservesActive member and retiree plan reserves are commingled for investment and administrative purposes. Effective January 1, 2008, assets were permanently split between the active member and OPEB plans.
Description of Benefits
Eligibility: At retirement, the member must have active group life insurance coverage and satisfy one of the following:• WRS coverage prior to January 1, 1989, or• At least one month of group life insurance coverage
in each of five calendar years after 1989 and one of the following:
– Eligible for an immediate WRS benefit, or – At least 20 years from their WRS creditable service
as of January 1, 1990, plus their years of group life insurance coverage after 1989, or
– At least 20 years on the payroll of their last employer.
In addition, terminating members and retirees must continue to pay the employee premiums until age 65 (age 70 if active).
age of 18 – Not to exceed 65% of participant’s monthly salary
at time of death
• For applications received on or after May 12, 1998 in which the protective occupation participant dies as a result of a disease covered under the Cancer Presumptive Law, benefits are based on the following:
– 70% of the participant’s monthly salary at time of death to surviving spouse or domestic partner, less other income sources that are based on the participant’s earnings record
– 1/10 of the participant’s monthly salary at time of death to the guardian of any minor child, as long as there is no surviving spouse
– There is no maximum
Annual Increases:• To age 60: In accordance with WRS salary index.• After age 60: In accordance with WRS dividend
increases (so long as the claimant is not also receiving a disability retirement benefit).
Retiree Life Insurance FundsThe State Retiree Life Insurance Fund and the Local Government Retiree Life Insurance Fund are cost-sharing multiple-employer defined benefit OPEB plans. The State of Wisconsin and 729 local government employers currently participate. The plans provide post-employment life insurance coverage to all eligible employees of participating employers. The plans are administered under Wis. Stats. § 40.70. The plans are reported as other employee benefit trust funds.
MembershipEligibility: Generally, members may enroll during a 30-day enrollment period once they satisfy a six-month waiting period. They may enroll after the initial 30-day enrollment period with evidence of insurability. Members under evidence of insurability enrollment must enroll in group life insurance coverage before age 55 to be eligible for Basic or Supplemental coverage.
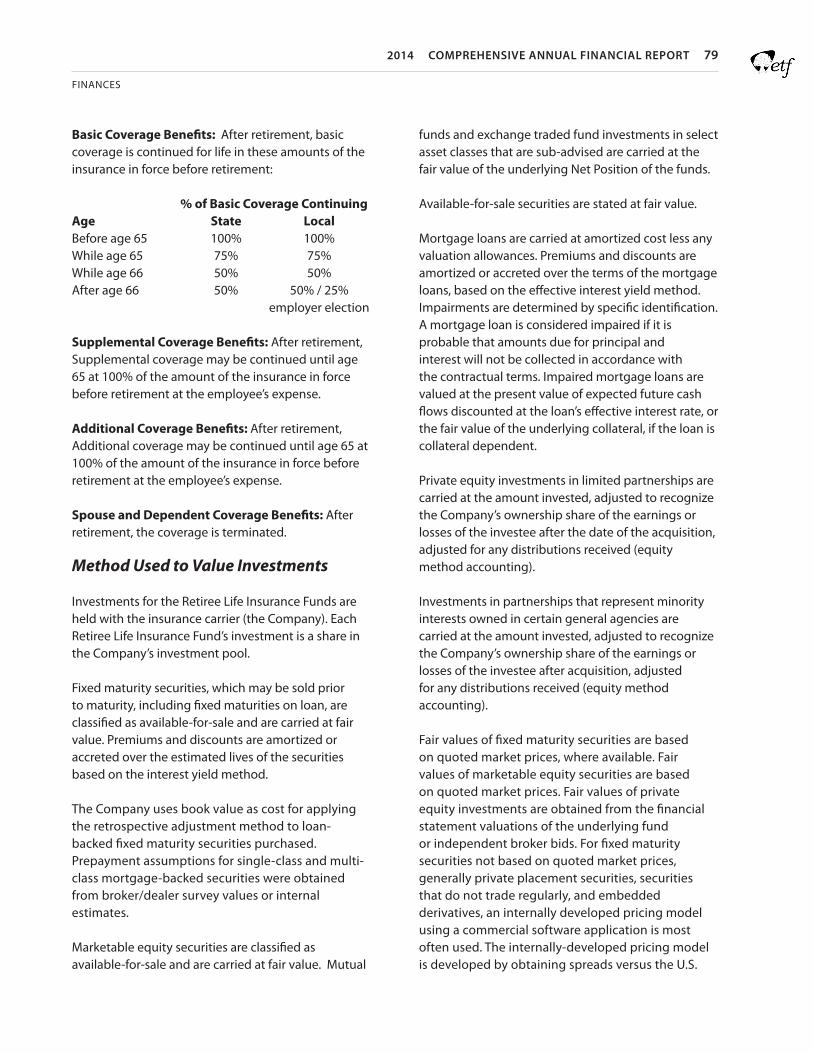
2014 COMPREHENSIVE ANNUAL FINANCIAL REPORT 79
FINANCES
funds and exchange traded fund investments in select asset classes that are sub-advised are carried at the fair value of the underlying Net Position of the funds.
Available-for-sale securities are stated at fair value.
Mortgage loans are carried at amortized cost less any valuation allowances. Premiums and discounts are amortized or accreted over the terms of the mortgage loans, based on the effective interest yield method. Impairments are determined by specific identification. A mortgage loan is considered impaired if it is probable that amounts due for principal and interest will not be collected in accordance with the contractual terms. Impaired mortgage loans are valued at the present value of expected future cash flows discounted at the loan’s effective interest rate, or the fair value of the underlying collateral, if the loan is collateral dependent.
Private equity investments in limited partnerships are carried at the amount invested, adjusted to recognize the Company’s ownership share of the earnings or losses of the investee after the date of the acquisition, adjusted for any distributions received (equity method accounting).
Investments in partnerships that represent minority interests owned in certain general agencies are carried at the amount invested, adjusted to recognize the Company’s ownership share of the earnings or losses of the investee after acquisition, adjusted for any distributions received (equity method accounting).
Fair values of fixed maturity securities are based on quoted market prices, where available. Fair values of marketable equity securities are based on quoted market prices. Fair values of private equity investments are obtained from the financial statement valuations of the underlying fund or independent broker bids. For fixed maturity securities not based on quoted market prices, generally private placement securities, securities that do not trade regularly, and embedded derivatives, an internally developed pricing model using a commercial software application is most often used. The internally-developed pricing model is developed by obtaining spreads versus the U.S.
Basic Coverage Benefits: After retirement, basic coverage is continued for life in these amounts of the insurance in force before retirement:
% of Basic Coverage ContinuingAge State LocalBefore age 65 100% 100%While age 65 75% 75%While age 66 50% 50%After age 66 50% 50% / 25% employer election
Supplemental Coverage Benefits: After retirement, Supplemental coverage may be continued until age 65 at 100% of the amount of the insurance in force before retirement at the employee’s expense.
Additional Coverage Benefits: After retirement, Additional coverage may be continued until age 65 at 100% of the amount of the insurance in force before retirement at the employee’s expense.
Spouse and Dependent Coverage Benefits: After retirement, the coverage is terminated.
Method Used to Value Investments
Investments for the Retiree Life Insurance Funds are held with the insurance carrier (the Company). Each Retiree Life Insurance Fund’s investment is a share in the Company’s investment pool.
Fixed maturity securities, which may be sold prior to maturity, including fixed maturities on loan, are classified as available-for-sale and are carried at fair value. Premiums and discounts are amortized or accreted over the estimated lives of the securities based on the interest yield method.
The Company uses book value as cost for applying the retrospective adjustment method to loan-backed fixed maturity securities purchased. Prepayment assumptions for single-class and multi-class mortgage-backed securities were obtained from broker/dealer survey values or internal estimates.
Marketable equity securities are classified as available-for-sale and are carried at fair value. Mutual

80 COMPREHENSIVE ANNUAL FINANCIAL REPORT 2014
FINANCES
The Company holds “To-Be-Announced” (TBA) Government National Mortgage Association forward contracts that require the Company to take delivery of a mortgage-backed security at a settlement date in the future. Most of the TBAs are settled at the first available period allowed under the contract. However, the deliveries of some of the Company’s TBA securities happen at a later date, thus extending the forward contract date. These securities are reported at fair value as derivative instruments with the changes in fair value reported in net realized investment gains and losses on the consolidated statements of operations.
Retiree Health Insurance Funds
The State Retiree Health Insurance Fund and the Local Government Retiree Health Insurance Fund are agent multiple-employer defined benefit OPEB plans offering group health insurance to retired State of Wisconsin and local government employees. The Department and the Group Insurance Board (GIB) have statutory authority for program administration and oversight [Wis. Stats. §§ 15.165 (2) and 40.03 (6)]. The State of Wisconsin and 419 local government employers currently participate in the plans. The plans are reported as agency funds.
Beginning in 2007, some employers must make additional disclosures related to their Retiree Health Insurance Plans, including the funding policy, the employer’s annual OPEB cost and contributions made, the funded status and funding progress of the plan, and the actuarial methods and assumptions used. This information is available from the employer.
Membership: State of Wisconsin and local government employees participating in the State Health Insurance Plan or the Wisconsin Public Employers Insurance Plan (local government plans) are eligible to continue their health insurance coverage after leaving covered employment. Membership as of December 31, 2014, included 24,082 former state employees or their beneficiaries and 2,285 former local government employees and beneficiaries.
Description of Benefits: Employees may choose between self-insured health plans and alternate
Treasury yield for corporate securities with varying weighted average lives and bond ratings.
Real estate is carried at cost, less accumulated depreciation and an allowance for estimated losses.
The Company’s derivative instrument holdings are carried at fair value. All derivatives are recorded as non-hedge transactions. Derivative instrument fair values are based on quoted market prices or dealer quotes. If a quoted market price is not available, fair value is estimated using current market assumptions and modeling techniques, which are then compared with quotes from counterparties.
For mortgage-backed securities of high credit quality, excluding interest-only securities, the Company recognizes income using a constant effective yield method based on prepayment assumptions obtained from an outside service provider or upon analyst review of the underlying collateral and the estimated economic life of the securities.
For interest-only securities and mortgage-backed securities not of high credit quality, the Company recognizes the excess of all cash flows, including estimated prepayments, attributable to the security estimated at the acquisition date over the initial investment using the effective yield method with adjustments made as a result of subsequent cash flow information recorded prospectively. If the fair value of the security has declined below its carrying amount, the Company will write the security down to fair value if the decline is deemed other-than-temporary.
Policy loans are carried at the unpaid principal balance.
Cash and cash equivalents are carried at cost, which approximates fair value. The Company considers all money market funds and commercial paper with original maturity dates of less than three months to be cash equivalents.
Finance receivables that management has the intent and ability to hold for the foreseeable future or until maturity or payoffs are reported at their outstanding unpaid principal balances reduced by any charge-offs.

2014 COMPREHENSIVE ANNUAL FINANCIAL REPORT 81
FINANCES
Effective January 1, 2012, prescription drug coverage for Medicare eligible retirees enrolled in the State group health insurance program is provided by a self-funded Medicare Part D Employer Group Waiver Plan (EGWP). A Medicare “Wrap” product is also included to provide full coverage to members, as required by uniform benefits, when they reach the Medicare coverage gap, also known as the “donut hole”.
Contributions: Health Insurance premiums are actuarially determined or set by contract with the insurer.
health plans with specific provider networks (i.e., HMOs). The HMOs follow GIB guidelines for eligibility and program requirements. All HMOs offer a prescribed benefit package called Uniform Benefits and participate in a yearly competitive premium rates bid process. The Standard Plan and State Maintenance Plan are self-insured by the GIB and administered by WPS Health Insurance. The Standard Plan is a preferred provider plan.
The pharmacy benefit is self-insured by the GIB and administered by Navitus Health Solutions.
Funded Status and Funding Progress—OPEB Plans
The funded status of each plan as of the most recent actuarial valuation date is as follows ($ in thousands):
(a) (b) (c) (d) (e) (f)Actuarial Valuation Date Actuarial Actuarial Unfunded Funded Covered UAAL as Value Accrued Actuarial Ratio Payroll Percentage of Assets Liability Accrued (a) / (b) of Covered (AAL) Liability Payroll (UAAL) (c) / (e) (b) – (a)
Duty Disability Insurance $567,239 $513,165 ($54,164) 110.6% $1,302,765 (4.2%)January 1, 2014 State Life Insurance 366,652 530,376 163,724 69.1% 2,931,935 5.6%January 1, 2014 Local Life Insurance 239,919 353,840 113,921 67.8% 3,814,869 3.0%January 1, 2014
The accompanying schedules of employer contributions, included in the required supplementary information at the end of the notes, present trend information about the amounts contributed to the plan by employers in comparison to the Annual Required Contribution (ARC), an amount that is actuarially-determined in accordance with the parameters of GASB Statement 43. The ARC represents a level of funding that, if paid on an ongoing basis, is projected to cover normal cost for each year and amortize any unfunded actuarial liabilities (or funding excess) over a period not to exceed thirty years.
Projections of benefits for financial reporting purposes are based on the substantive plan (the plan
Actuarial valuations of an ongoing plan involve estimates of the value of reported amounts and assumptions about the probability of occurrence of events far into the future. Examples include assumptions about future employment, mortality, and the healthcare cost trend. Actuarially- determined amounts are subject to continual revision, as actual results are compared with past expectations and new estimates are made about the future. The schedules of funding progress, presented as required supplementary information following the notes to the financial statements, present multiyear trend information about whether the actuarial values of plan assets are increasing or decreasing over time relative to the actuarial accrued liabilities for benefits.

82 COMPREHENSIVE ANNUAL FINANCIAL REPORT 2014
FINANCES
designed to reduce the effects of short-term volatility in actuarial accrued liabilities and the actuarial value of assets, consistent with the long-term perspective of the calculations. Additional information as of the latest actuarial valuations follows:
as understood by the employer and plan members) and include the types of benefits provided at the time of each valuation and the historical pattern of sharing of benefit costs between the employer and plan members to that point. The actuarial methods and assumptions used include techniques that are
Duty Disability Insurance State Life Insurance Local Life InsuranceValuation Date 1/1/2014 1/1/2014 1/1/2014Actuarial Cost Method Projected Unit Credit Entry Age Normal Entry Age NormalAmortization Method Closed level percentage of Closed level Closed level percentage pay if underfunded, open level percentage of pay percentage of pay percentage of pay if overfunded Remaining Amortization UAAL – 30 years UAAL – 30 years UAAL – 30 years Period Future gains & losses Future gains & losses Future gains & losses – 15 years – 15 years – 15 years Asset valuation method 5 year smoothed market Market value Market valueActuarial Assumptions: Investment Return 7.2% 4.65% through 2027 4.65% through 2027 5.75% for 2028 5.75% for 2028 and beyond and beyond Payroll Growth 3.2% 3.2% 3.2%
The Milwaukee Retirement System (MRS), consisting of two funds within the Milwaukee Public Schools Retirement System, is reported as an Investment Trust Fund. MRS provides assets to the Department for investing in the Core and Variable Funds, described in the Investments section of Note 1. The Core and Variable Funds are managed by the State of Wisconsin Investment Board (SWIB) with oversight by a board of trustees as authorized in Wis. Stat. § 25.17. SWIB is not registered with the Securities and Exchange Commission as an investment company. Participation of the MRS in the Core and Variable Funds is described in the Wisconsin Administrative Code, § ETF 10.12. Monthly, the Department distributes pro-rata shares of total Core Fund and total Variable Fund earnings, less administrative expenses to the MRS accounts. The MRS accounts are adjusted to fair value and gains/losses are recorded directly in the accounts per Wisconsin Administrative Code, § ETF 10.12 (2).
No state statute, legal provision, or legally-binding guarantee exists to support the value of shares. At December 31, 2014, the Core and Variable Funds held $96.1 billion in investment related accounts, of which $3.3 billion is classified as cash equivalents. In addition, the Core and Variable Funds held $834 million of securities lending collateral.
Summary information by investment classification in accordance with GASB Statement No. 31, Accounting and Financial Reporting for Certain Investments and for External Investment Pools, for the Core and Variable Funds at December 31, 2014, is presented in Note 3. Condensed financial data for the Core and Variable Funds for the year ended December 31, 2014, is presented below ($ in thousands):
10 MILWAUKEE RE TIREMENT SYSTEM

2014 COMPREHENSIVE ANNUAL FINANCIAL REPORT 83
FINANCES
Short SalesAssets: Core Variable Adjustment* Combined Cash & Cash Equivalents $3,242,707 $78,431 $3,321,138 Securities Lending Collateral 739,162 94,339 833,501 Prepaid Items 26,088 1,488 27,576 Investment Receivables 732,694 31,551 764,245Investments, at fair value 86,346,589 7,229,016 (19,880) 93,555,725 Total Assets 91,087,240 7,434,825 (19,880) 98,502,185 Liabilities: Securities Lending Collateral Liability 739,162 94,339 - 833,501 Due to Other Funds - - - - Obligations Under Reverse Repurchase Agreement 820,516 - - 820,516 Short Sell Obligations 465,586 27,833 (19,880) 473,539 Collateral Due to Counterparty - - - Investment Payables 287,934 21,175 - 309,109 Total Liabilities 2,313,198 143,347 (19,880) 2,436,665
Net Assets Held in Trust for: Internal Investment Pool Participants 88,608,255 7,270,420 - 95,878,675 Milwaukee Retirement Systems 165,787 21,058 - 186,845 Total $88,774,042 $7,291,478 $ - $96,065,520 *This adjustment removes the impact of inter-fund short sales where the shorted position is held in the other Retirement Investment Trust Fund (i.e. SWIB is short a security in the Core Fund but long the same position in the Variable Fund, or vice-versa).
Core and Variable Retirement Investment TrustsCondensed Statements of Net Position
As of December 31, 2014

84 COMPREHENSIVE ANNUAL FINANCIAL REPORT 2014
FINANCES
Core Variable CombinedAdditions: Net Appreciation (Depreciation) in Fair Value of Investments $2,824,142 $343,907 $3,168,049 Interest 665,804 74 665,878 Dividends 1,193,523 161,242 1,354,765 Securities Lending Income 25,206 3,245 28,451 Other 221,681 - 221,681 Total Additions 4,930,356 508,468 5,438,824
Deductions: Investment Expense 346,598 10,213 356,811 Securities Lending Rebates and Fees 2,136 271 2,407 Net Withdrawals by Pool Participants 2,310,920 386,558 2,697,478 Total Deductions 2,659,654 397,042 3,056,696 Net Increase (Decrease) 2,270,702 111,426 2,382,128
Net Assets Held in Trust for Pool Participants Beginning of Year 86,503,340 7,180,052 93,683,392 End of Year $88,774,042 $7,291,478 $96,065,520
Core and Variable Retirement Investment TrustsCondensed Statements of Changes in Net Position
As of December 31, 2014
Loss Contingency
On September 5, 2008, the Internal Revenue Service (IRS) provided SWIB with a Notice of Transferee Liability. This claim seeks taxes, penalties and interest relating to the sale of Shockley Communications Corporation (SCC) stock in 2001.
SWIB is classified as a tax exempt entity by the IRS. However, the IRS asserts that the shareholders’ sale of SCC stock in 2001 should have been characterized as a sale of assets by SCC, on which SCC should have paid income taxes. Based on the theory of
transferee liability, the IRS asserts that the former SCC shareholders, including SWIB, would be liable for those taxes, plus penalties and interest. Transferee liability is limited to the amount actually received by the putative transferee, plus interest. As a result, SWIB’s potential liability, as a putative transferee of SCC assets, is estimated to be $48.3 million as of December 31, 2014. These estimates include taxes, interest and potential penalties.SWIB is aggressively contesting the IRS’ assertions of SWIB’s tax liability. Furthermore, SWIB believes that the loss, if any, resulting from the claim is not probable and therefore will not have a material impact on SWIB’s net investment position or net investment income in future years. As such, SWIB has not been recognized a loss relating to this matter in the current year, nor does it appear as a contingent liability in the Statement of Fiduciary Net Position.
11CONTINGENCIES, UNUSUAL EVENTS, AND SUBSEQUENT
EVENTS

2014 COMPREHENSIVE ANNUAL FINANCIAL REPORT 85
As data for individual policy years mature, the correlation between original estimates and re-estimated amounts is commonly used to evaluate the accuracy of incurred claims currently recognized in less mature policy years. The columns of the tables show data for successive policy years.
Required Supplementary Information
PUBLIC ENTITY RISK POOLSClaims Development Information
The tables on the following pages illustrate how the funds’ earned revenues and investment income compare to related costs of loss and other expenses assumed by the funds as of the end of each of the last ten years. The rows of the tables are defined as follows:
1. Net Earned Required Contribution and Investment Revenues. Shows the total of each calendar year’s earned contribution revenues and investment revenues.
2. Unallocated Expenses. Shows each calendar year’s other operating costs of the fund, including overhead and claims expenses not allocable to individual claims.
3. Estimated Incurred Claims as of the End of the Policy Year. Shows the fund’s incurred claims and allocated claim adjustment expense (both paid and accrued) as originally reported as the end of the first year in which the event that triggered coverage under the contract occurred (called policy year).
4. Paid Cumulative as of Year-End. Shows the cumulative amounts paid as of the end of successive years for each policy year.
5. Re-estimated Incurred Claims. Shows how each policy year incurred claims increased or decreased as of the end of successive policy years. This annual re-estimation results from new information received on known claims, reevaluation of existing information on known claims, as well as emergence of new claims not previously known.
6. Increase (Decrease) in Estimated Incurred Claims from End of Policy Year. Compares the latest re-estimated incurred claims amount to the amount originally established (line 3) and shows whether this latest estimate of claims cost is greater or less than originally thought.
FINANCES

86 COMPREHENSIVE ANNUAL FINANCIAL REPORT 2014
FINANCES
2005 2006** 2007 2008 2009 2010 2011 2012 2013 2014
1. Net earned required contribution and
investment revenues 191.6 164.7 170.0 138.8 155.5 178.9 169.9 153.7 159.6 157.7
2. Unallocated expenses 9.5 7.4 8.4 8.8 6.4 8.7 6.4 8.0 4.4 6.0
3. Estimated incurred claims as
of the end policy year 160.6 110.1 116.9 124.0 134.8 148.4 144.6 141.3 149.0 163.5
4. Paid (cumulative) as of: *
End of Policy Year 168.8 116.8 118.0 126.3 139.1 155.8 150.7 148.3 156.6 173.4
One Year Later 159.6 111.0 119.4 123.9 134.1 147.3 145.1 141.2 148.3
Two Years Later 159.6 111.0 119.4 123.9 134.1 147.3 145.1 141.2
Three Years Later 159.6 111.0 119.4 123.9 134.1 147.3 145.1
Four Years Later 159.6 111.0 119.4 123.9 134.1 147.3
Five Years Later 159.6 111.0 119.4 123.9 134.1
Six Years Later 159.6 111.0 119.4 123.9
Seven Years Later 159.6 111.0 119.4
Eight Years Later 159.6 111.0
Nine Years Later 159.6
5. Reestimated incurred claims:
End of Policy Year 160.6 110.1 116.9 124.0 134.8 148.4 144.6 141.3 149.0 163.5
One Year Later 159.6 111.0 119.4 123.9 134.1 147.3 145.1 141.2 148.3
Two Years Later 159.6 111.0 119.4 123.9 134.1 147.3 145.1 141.2
Three Years Later 159.6 111.0 119.4 123.9 134.1 147.3 145.1
Four Years Later 159.6 111.0 119.4 123.9 134.1 147.3
Five Years Later 159.6 111.0 119.4 123.9 134.1
Six Years Later 159.6 111.0 119.4 123.9
Seven Years Later 159.6 111.0 119.4
Eight Years Later 159.6 111.0
Nine Years Later 159.6
6. Increase (decrease) in
estimated incurred claims
from end of policy year (1.0) 0.9 2.5 (0.1) (0.7) (1.1) 0.5 (0.1) (0.7) 0.0
* Paid claims include payments expected to be reimbursed as rebate payments from participating pharmaceutical companies. Incurred claims are presented net of anticipated rebates.
** Starting in 2006, in accordance with GASB Statement #43, retiree health is reported separately in an agency fund and is not included with the active health information in this table.
Public Entity Risk PoolsRequired Supplementary Information
Pharmacy Benefit Claims Development Information($ Millions)

2014 COMPREHENSIVE ANNUAL FINANCIAL REPORT 87
FINANCES
2005 2006* 2007 2008 2009 2010 2011 2012 2013 2014 1 Net earned required contribution and investment revenues 90.9 82.9 42.1 22.5 41.5 36.6 27.9 33.1 29.9 26.0 2 Unallocated expenses 7.7 4.9 3.4 5.3 5.0 5.4 6.2 5.5 5.2 7.0
3 Estimated incurred claims as of the end of the policy year 73.6 60.1 23.7 30.5 25.9 24.0 21.4 17.7 16.9 17.7 4 Paid (cumulative) as of: End of Policy Year 65.8 51.8 20.3 25.7 21.6 20.5 18.7 15.1 14.6 15.4 One Year Later 73.6 58.3 23.5 28.3 23.4 22.6 20.7 17.2 16.0 Two Years Later 73.7 58.2 23.5 28.2 23.5 22.6 20.7 17.1 Three Years Later 73.7 58.2 23.5 28.2 23.5 22.6 20.7 Four Years Later 73.7 58.2 23.5 28.2 23.5 22.6 Five Years Later 73.7 58.2 23.5 28.2 23.5 Six Years Later 73.7 58.2 23.5 28.2 Seven Years Later 73.7 58.2 23.5 Eight Years Later 73.7 58.2 Nine Years Later 73.7 5 Reestimated incurred claims: End of Policy Year 73.6 60.1 23.7 30.5 25.9 24.0 21.4 17.7 16.9 17.7 One Year Later 73.7 58.4 23.6 28.3 23.5 22.6 20.7 17.2 16.0 Two Years Later 73.7 58.2 23.5 28.2 23.5 22.6 20.7 17.1 Three Years Later 73.7 58.2 23.5 28.2 23.5 22.6 20.7 Four Years Later 73.7 58.2 23.5 28.2 23.5 22.6 Five Years Later 73.7 58.2 23.5 28.2 23.5 Six Years Later 73.7 58.2 23.5 28.2 Seven Years Later 73.7 58.2 23.5 Eight Years Later 73.7 58.2 Nine Years Later 73.7
6 Increase (decrease) in estimated
incurred claims from end
of policy year 0.1 (1.9) (0.2) (2.3) (2.4) (1.4) (0.7) (0.6) (0.9) 0.0
* Starting in 2006, in accordance with GASB Statement #43, retiree health is reported separately in an agency fund and is not included with the active health information in this table.
Public Entity Risk PoolsRequired Supplementary Information
Health Insurance Claims Development Information($ Millions)
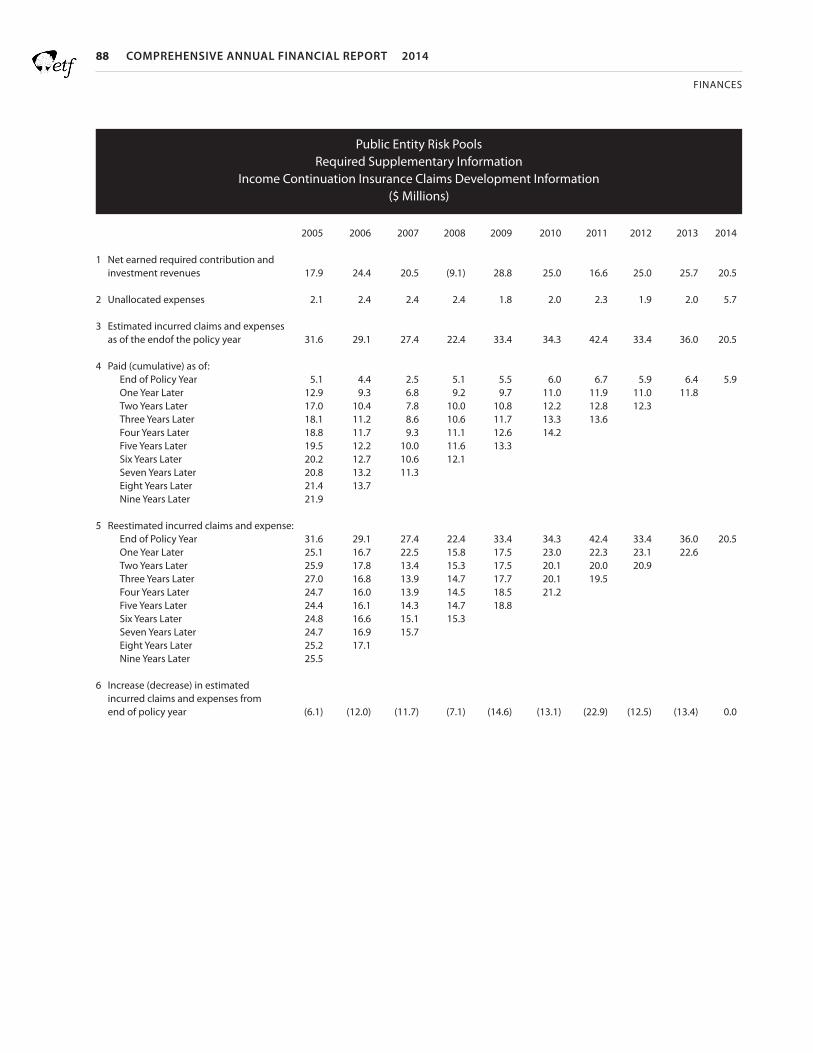
88 COMPREHENSIVE ANNUAL FINANCIAL REPORT 2014
FINANCES
2005 2006 2007 2008 2009 2010 2011 2012 2013 2014 1 Net earned required contribution and investment revenues 17.9 24.4 20.5 (9.1) 28.8 25.0 16.6 25.0 25.7 20.5 2 Unallocated expenses 2.1 2.4 2.4 2.4 1.8 2.0 2.3 1.9 2.0 5.7 3 Estimated incurred claims and expenses as of the endof the policy year 31.6 29.1 27.4 22.4 33.4 34.3 42.4 33.4 36.0 20.5 4 Paid (cumulative) as of: End of Policy Year 5.1 4.4 2.5 5.1 5.5 6.0 6.7 5.9 6.4 5.9 One Year Later 12.9 9.3 6.8 9.2 9.7 11.0 11.9 11.0 11.8 Two Years Later 17.0 10.4 7.8 10.0 10.8 12.2 12.8 12.3 Three Years Later 18.1 11.2 8.6 10.6 11.7 13.3 13.6 Four Years Later 18.8 11.7 9.3 11.1 12.6 14.2 Five Years Later 19.5 12.2 10.0 11.6 13.3 Six Years Later 20.2 12.7 10.6 12.1 Seven Years Later 20.8 13.2 11.3 Eight Years Later 21.4 13.7 Nine Years Later 21.9 5 Reestimated incurred claims and expense: End of Policy Year 31.6 29.1 27.4 22.4 33.4 34.3 42.4 33.4 36.0 20.5 One Year Later 25.1 16.7 22.5 15.8 17.5 23.0 22.3 23.1 22.6 Two Years Later 25.9 17.8 13.4 15.3 17.5 20.1 20.0 20.9 Three Years Later 27.0 16.8 13.9 14.7 17.7 20.1 19.5 Four Years Later 24.7 16.0 13.9 14.5 18.5 21.2 Five Years Later 24.4 16.1 14.3 14.7 18.8 Six Years Later 24.8 16.6 15.1 15.3 Seven Years Later 24.7 16.9 15.7 Eight Years Later 25.2 17.1 Nine Years Later 25.5 6 Increase (decrease) in estimated incurred claims and expenses from end of policy year (6.1) (12.0) (11.7) (7.1) (14.6) (13.1) (22.9) (12.5) (13.4) 0.0
Public Entity Risk PoolsRequired Supplementary Information
Income Continuation Insurance Claims Development Information($ Millions)

2014 COMPREHENSIVE ANNUAL FINANCIAL REPORT 89
FINANCES
2005 2006 2007 2008 2009 2010 2011 2012 2013 2014 1 Net earned required contribution and investment revenues 24.1 47.3 27.8 (88.3) 49.3 29.8 3.0 29.9 28.2 54.2 2 Unallocated expenses 1.0 1.1 1.4 1.3 2.2 2.0 2.1 2.4 2.3 13.8 3 Estimated incurred claims and expense, as of the end of the policy year 30.6 34.6 48.3 31.1 50.2 54.2 43.5 52.0 50.6 47.6 4 Paid (cumulative) as of: End of Policy Year 0.7 1.1 1.4 1.1 1.7 1.9 1.9 2.5 2.2 2.1 One Year Later 2.8 3.5 5.8 5.7 7.0 7.6 8.6 10.3 10.1 Two Years Later 5.4 6.8 9.4 9.4 11.3 12.5 14.2 17.3 Three Years Later 8.0 9.9 12.6 12.7 15.2 16.9 19.4 Four Years Later 10.3 12.7 15.5 15.7 18.7 21.0 Five Years Later 12.5 15.2 18.2 18.5 22.0 Six Years Later 14.6 17.4 20.8 21.2 Seven Years Later 16.5 19.5 23.2 Eight Years Later 18.2 21.6 Nine Years Later 19.8 5 Reestimated incurred claims and expense: End of Policy Year 30.6 34.6 48.3 31.1 50.2 54.2 43.5 52.0 50.6 47.6 One Year Later 22.2 26.2 25.6 26.9 32.3 35.8 41.4 48.3 52.7 Two Years Later 22.1 29.5 29.9 29.5 35.0 39.6 44.5 57.5 Three Years Later 24.7 27.1 31.0 31.8 36.6 41.3 50.4 Four Years Later 23.4 28.3 33.7 32.7 38.0 46.3 Five Years Later 24.5 30.5 34.9 33.4 41.9 Six Years Later 26.6 30.9 36.3 36.7 Seven Years Later 26.4 31.9 39.0 Eight Years Later 27.1 34.7 Nine Years Later 29.4 6 Increase (decrease) in estimated incurred claims from end of policy year (1.2) 0.1 (9.3) 5.6 (8.3) (7.9) 6.9 5.5 2.1 0.0
Public Entity Risk PoolsRequired Supplementary Information
Long Term Disability Claims Development Information($ Millions)

90 COMPREHENSIVE ANNUAL FINANCIAL REPORT 2014
FINANCES
Calendar Year Ended, December 31 2014 2013 Total Pension Liability Service Cost $ 1,757.0 $ 1,745.0 Interest on the Total Pension Liability 6,089.3 $5,680.7 Benefit Changes - - Difference between Expected and Actual Experience 437.2 $2,659.9 Assumption Changes - - Benefit Payments (4,540.2) (4,224.7) Refunds (34.4) (33.3) Net Change in Total Pension Liability 3,708.9 5,827.7 Total Pension Liability - Beginning 85,982.2 80,154.6 Total Pension Liability - Ending (a) 89,691.1 85,982.2 Plan Fiduciary Net Position Employer Contributions 1,023.2 914.7 Employee Contributions 906.5 871.3 Pension Plan Net Investment Income 4,891.7 11,347.3 Benefit Payments (4,540.2) (4,224.7) Refunds (34.4) (33.3) Pension Plan Administrative Expense (24.0) (22.9) Other - - Net Change in Plan Fiduciary Net Position 2,222.7 8,852.4 Plan Fiduciary Net Position - Beginning 89,924.7 81,072.3 Plan Fiduciary Net Position - Ending (b) $ 92,147.4 $ 89,924.7 Net Pension Liability/(Asset) - Ending (a) - (b) (2,456.3) (3,942.5) Plan Fiduciary Net Position as a Percentage of Total Pension Liability 102.74% 104.59% Covered Employee Payroll2 $ 13,219.5 $ 12,884.8 Net Pension Liability/(Asset) as a Percentage of Covered Employee Payroll (18.58%) (30.60%) 1Immaterial differences may exist between the amounts in this schedules and those reported in the Statement of Fiduciary Net Position and the Statement of Changes in Fiduciary Net position due to the timing of the actuarial valuation.2Covered Employee Payroll is not available so Pensionable Payroll is presented in its place. The difference is believed to be immaterial.
Wisconsin Retirement System Schedules of Changes in Net Pension Liability and Related Ratios ($ in millions)

2014 COMPREHENSIVE ANNUAL FINANCIAL REPORT 91
FINANCES
Calendar Actuarially Contribution Actual Contribution Year Ending Determined Actual Deficiency Covered as a % of December 31, Contributions Contribution (Excess) Payroll Covered Payroll
Wisconsin Retirement SystemSchedule of Employer Contributions
($ in millions)
2013 905.1 905.1 - 12,884.8 7.02% 2014 977.1 977.1 - 13,219.5 7.39%
Wisconsin Retirement SystemSchedule of Investment Returns
Last Ten Calendar YearsAnnual Money-weighted Rate of Return (IRR), Net of Investment Expenses
2014 2013 2012 2011 2010 2009 2008 2007 2006 2005
Core Trust Fund 5.44% 13.18% 13.40% 1.25% 11.92% 21.76% (26.31%) 8.52% 15.48% 8.31%
Variable Trust Fund 7.24% 28.78% 16.94% (3.02%) 15.23% 33.06% (38.96%) 5.57% 17.51% 8.01%
Schedule of Employer Contributions
Schedule of Investment Returns

92 COMPREHENSIVE ANNUAL FINANCIAL REPORT 2014
FINANCES
Notes to Required Supplementary InformationSignificant methods and assumptions used in calculating the Actuarially Determined Contribution:
Valuation Date: December 31, 2012Actuarial Cost Method: Frozen Entry AgeAmortization Method: Level Percent – Closed Amortization PeriodAmortization Period: 30 Year closed from date of participation in WRSAsset Valuation Method: Five Year Smoothed Market (Closed)Actuarial Assumptions Net Investment Rate of Return 7.2%Discount Rate: Pre-retirement 7.2% Post-retirement 5.0%Salary Increases: Inflation 3.2% Seniority/merit 0.1% - 5.6%Post-retirement Benefit Adjustments 2.1%*
*No post-retirement adjustment is guaranteed. Actual adjustments are based on recognized investment return, actuarial experience and other factors. 2.1% is the assumed annual adjustment based on the investment return assumption and the post-retirement discount rate.

2014 COMPREHENSIVE ANNUAL FINANCIAL REPORT 93
FINANCES
January 1, 2006 222,692 427,089 204,397 52.1% 1,144,529 17.9% January 1, 2008 311,778 471,668 159,890 66.1% 1,257,666 12.7%January 1, 2010 373,048 512,785 139,737 72.7% 1,370,978 10.2%January 1, 2011 412,988 499,034 86,046 82.8% 1,326,345 6.5%January 1, 2012 449,177 476,979 27,802 94.2% 1,285,854 2.2%January 1, 2013 490,137 507,081 16,944 96.7% 1,279,908 1.3% January 1, 2014 567,329 513,165 (54,164) 110.6% 1,302,765 -4.2%
January 1, 2006 314,116 337,341 23,225 93.1% 2,506,437 0.9%January 1, 2008 329,822 382,392 52,570 86.3% 2,699,508 1.9%January 1, 2010 349,425 408,781 59,356 85.5% 3,029,651 2.0%January 1, 2012 363,778 509,315 145,537 71.4% 2,869,087 5.1%January 1, 2014 366,652 530,376 163,724 69.1% 2,931,935 5.6%
January 1, 2006 195,632 206,097 10,465 94.9% 3,310,064 0.3%January 1, 2008 211,950 233,444 21,494 90.8% 3,556,913 0.6%January 1, 2010 223,650 255,591 31,941 87.5% 3,864,159 0.8%January 1, 2012 231,695 326,280 94,585 71.0% 3,813,576 2.5%January 1, 2014 239,919 353,840 113,921 67.8% 3,814,869 3.0%
Other Post Employment BenefitsSchedule of Funding Progress
($ in thousands)
Other Post Employment Benefits Required Supplementary Information
The information presented in the required supplementary schedules was determined as part of the actuarial valuation at the date indicated. Additional information as of the latest actuarial valuation follows:
Actuarial Actuarial Accrued Unfunded UAAL as a Actuarial Value of Liability (AAL) AAL Funded Covered Percentage of Valuation Assets Frozen Entry Age (UAAL) Ratio Payroll Covered Payroll Date (a) (b) (b-a) (a/b) (c) ((b-a)/c)
Duty Disability Insurance
Actuarial Actuarial Accrued Unfunded UAAL as a Actuarial Value of Liability (AAL) AAL Funded Covered Percentage of Valuation Assets Frozen Entry Age (UAAL) Ratio Payroll Covered Payroll Date (a) (b) (b-a) (a/b) (c) ((b-a)/c)
State Retiree Life Insurance
Actuarial Actuarial Accrued Unfunded UAAL as a Actuarial Value of Liability (AAL) AAL Funded Covered Percentage of Valuation Assets Frozen Entry Age (UAAL) Ratio Payroll Covered Payroll Date (a) (b) (b-a) (a/b) (c) ((b-a)/c)
Local Retiree Life Insurance

94 COMPREHENSIVE ANNUAL FINANCIAL REPORT 2014
FINANCES
Duty Disability Insurance (a) (b) (c) Year Ended Annual Required Employer Percentage Contribution Contribution Contributed December 31, 2006 44,397 44,566 100.4% December 31, 2007 46,174 47,765 103.4% December 31, 2008 47,684 50,574 106.1% December 31, 2009 50,193 51,556 102.7% December 31, 2010 53,181 51,861 97.5% December 31, 2011 50,364 52,335 103.9% December 31, 2012 48,377 52,978 109.5% December 31, 2013 49,755 53,902 108.3% December 31, 2014 8,173 9,335 114.2%
State Retiree Life Insurance (a) (b) (c) Year Ended Annual Required Employer Percentage Contribution Contribution Contributed December 31, 2006 12,222 1,235 10.1% December 31, 2007 13,602 1,314 9.7% December 31, 2008 14,786 1,405 9.5% December 31, 2009 16,470 1,514 9.2% December 31, 2010 16,949 1,569 9.3% December 31, 2011 18,878 1,505 8.0% December 31, 2012 24,866 1,205 4.8% December 31, 2013 27,456 1,277 4.6% December 31, 2014 28,272 1,302 4.6%
Local Retiree Life Insurance (a) (b) (c) Year Ended Annual Required Employer Percentage Contribution Contribution Contributed
December 31, 2006 10,020 2,096 20.9% December 31, 2007 11,065 1,733 15.7% December 31, 2008 11,396 1,806 15.8% December 31, 2009 12,636 1,906 15.1% December 31, 2010 12,797 1,932 15.1% December 31, 2011 14,192 1,893 13.3% December 31, 2012 19,679 1,817 9.2% December 31, 2013 21,674 1,753 8.1% December 31, 2014 22,038 2,080 9.4%
Other Post Employment BenefitsSchedule of Employer Contributions
($ in thousands)

State of WisconsinDepartment of Employee Trust Funds
STATISTICS

96 COMPREHENSIVE ANNUAL FINANCIAL REPORT 2014
STATISTICS
Wisconsin Retirement System (WRS) StatisticsActive Participants by Employment Category
Protective Protective Occupations Executives & Occupations Without Elected With Social SocialYear General Teachers Officials Security Security Totals
State Participants 2005 41,911 19,044 695 8,356 0 70,006 2006 42,069 19,110 694 8,493 0 70,366 2007 42,379 19,331 694 8,758 0 71,162 2008 42,920 19,712 709 8,824 0 72,165 2009 42,814 20,002 709 8,890 0 72,415 2010 42,785 20,502 697 8,756 0 72,740 2011 41,136 20,184 717 8,354 0 70,391 2012 42,433 20,776 733 8,327 0 72,269 2013 42,898 21,065 730 8,398 0 73,091 2014 42,982 21,279 732 8,900 0 73,893
Local Participants 2005 96,048 82,801 772 10,799 2,696 193,116 2006 95,716 82,392 760 10,922 2,700 192,490 2007 95,504 82,168 755 11,089 2,703 192,219 2008 96,273 82,520 744 11,292 2,727 193,556 2009 97,489 82,516 744 11,389 2,740 194,878 2010 97,175 81,866 733 11,354 2,761 193,889 2011 93,797 78,348 720 11,280 2,718 186,863 2012 92,122 77,938 687 11,083 2,734 184,564 2013 91,422 77,995 679 10,856 2,745 183,697 2014 90,900 78,339 677 10,703 2,743 183,362
Total Participants 2005 137,959 101,845 1,467 19,155 2,696 263,122 2006 137,785 101,502 1,454 19,415 2,700 262,856 2007 137,883 101,499 1,449 19,847 2,703 263,381 2008 139,193 102,232 1,453 20,116 2,727 265,721 2009 140,303 102,518 1,453 20,279 2,740 267,293 2010 139,960 102,368 1,430 20,110 2,761 266,629 2011 134,933 98,532 1,437 19,634 2,718 257,254 2012 134,555 98,714 1,420 19,410 2,734 256,833 2013 134,320 99,060 1,409 19,254 2,745 256,788 2014 133,882 99,618 1,409 19,603 2,743 257,255

2014 COMPREHENSIVE ANNUAL FINANCIAL REPORT 97
Total WRS Participants
Year Active Inactive Alternate Payees Annuitants Total Participants2005 263,122 132,145 3,599 131,674 530,540 2006 262,856 138,879 3,706 137,117 542,558 2007 263,381 141,002 3,769 142,906 551,058 2008 265,721 143,471 3,837 144,033 557,062 2009 267,293 144,424 3,929 150,671 566,317 2010 266,629 145,803 4,012 155,775 572,219 2011 257,254 153,123 4,063 167,453 581,893 2012 256,833 155,887 4,086 173,655 590,461 2013 256,788 153,721 4,040 180,056 594,605 2014 257,255 157,072 4,051 185,605 603,983
STATISTICS
WRS Participants with Variable Election
Year Active Inactive Annuitants Totals2005 65,644 9,468 31,499 106,611 2006 64,927 11,115 32,683 108,725 2007 64,674 11,563 33,880 110,117 2008 64,420 12,025 34,927 111,372 2009 62,032 12,169 34,836 109,037 2010 58,781 12,519 35,866 107,166 2011 54,273 13,889 38,949 107,111 2012 51,771 13,858 39,873 105,502 2013 49,299 13,376 40,317 102,992 2014 47,671 13,805 40,402 101,878
WRS Participants with Variable Election
Total WRS Participants

98 COMPREHENSIVE ANNUAL FINANCIAL REPORT 2014
Active WRS Participants by Gender TEACHERS PROTECTIVE ALL OTHER OCCUPATIONS PARTICIPANTS TOTALSYear Male Female Male Female Male Female Male Female 2005 33,085 68,793 17,936 3,915 49,301 90,092 100,322 162,800 2006 32,650 68,887 18,146 3,969 49,157 90,047 99,953 162,903 2007 32,348 69,183 18,497 4,053 49,199 90,101 100,044 163,337 2008 32,256 69,976 18,715 4,128 49,535 91,111 100,506 165,215 2009 32,228 70,290 18,862 4,157 49,542 92,214 100,632 166,661 2010 32,155 70,213 18,744 4,127 49,563 91,827 100,462 166,167 2011 30,784 67,748 18,374 3,978 47,829 88,541 96,987 160,267 2012 30,983 67,761 18,278 3,866 47,836 88,109 97,097 159,736 2013 30,979 68,115 18,354 3,840 47,908 87,592 97,241 159,547 2014 30,949 68,669 18,337 4,009 48,155 87,136 97,442 159,813
STATISTICS
Active WRS Participants by Gender
WRS Active Participants by Age

2014 COMPREHENSIVE ANNUAL FINANCIAL REPORT 99
WRS Covered Payroll by Employer Type ($ in Millions) Local Employers School Technical SpecialYear Districts Counties Cities Colleges Villages Towns Districts Totals 2005 4,405 1,398 1,078 483 182 51 112 7,709 2006 4,517 1,424 1,106 498 190 53 116 7,904 2007 4,625 1,462 1,148 520 202 56 119 8,131 2008 4,802 1,511 1,194 547 215 58 134 8,461 2009 4,959 1,553 1,241 579 223 60 156 8,771 2010 5,037 1,530 1,229 596 225 60 165 8,842 2011 5,006 1,537 1,236 607 227 63 171 8,847 2012 4,906 1,526 1,227 611 228 66 177 8,740 2013 4,956 1,551 1,244 616 233 66 187 8,853 2014 5,042 1,591 1,287 603 238 69 188 9,018 State Government Totals Year State University Totals All Employers 2005 1,807 1,457 3,264 10,973 2006 1,903 1,501 3,404 11,308 2007 2,019 1,570 3,589 11,720 2008 2,178 1,651 3,829 12,290 2009 2,161 1,690 3,851 12,622 2010 2,169 1,732 3,902 12,744 2011 2,126 1,746 3,872 12,719 2012 2,137 1,751 3,888 12,628 2013 2,211 1,820 4,032 12,885 2014 2,306 1,895 4,202 13,220
STATISTICS
Active Participants by Creditable Service

100 COMPREHENSIVE ANNUAL FINANCIAL REPORT 2014
STATISTICS
WRS Covered Payroll by Employment Category($ in Millions) Protective Executives Protective Occupations & Elected Occupations with without SocialYear General Employees Teachers Officials Social Security Security Totals
2005 4,728 5,061 92 928 164 10,973 2006 4,879 5,181 94 985 169 11,3082007 5,080 5,326 97 1,042 176 11,720 2008 5,367 5,534 102 1,105 182 12,2902009 5,492 5,704 104 1,132 190 12,6222010 5,504 5,809 105 1,136 190 12,7442011 5,485 5,797 105 1,139 193 12,7192012 5,496 5,707 107 1,122 196 12,6282013 5,638 5,809 109 1,128 200 12,8852014 5,815 5,923 111 1,163 207 13,220

2014 COMPREHENSIVE ANNUAL FINANCIAL REPORT 101
STATISTICS
Average Annual Earnings Protective Executives Protective Occupations & Elected Occupations with without SocialYear General Employees Teachers Officials Social Security Security Average 2005 33,222 48,009 60,874 47,518 59,865 40,413 2006 34,335 49,312 62,945 47,519 59,866 41,513 2007 35,721 50,631 64,686 51,520 63,975 43,107 2008 37,465 52,498 68,917 54,051 65,987 44,969 2009 38,145 54,143 69,572 55,045 68,671 46,047 2010 38,216 55,135 70,191 55,564 68,087 46,501 2011 38,874 55,546 69,699 56,451 69,590 47,098 2012 39,379 55,902 72,824 56,448 70,402 47,535 2013 40,422 56,480 74,996 57,294 71,460 48,403 2014 41,750 57,569 74,312 57,999 74,051 49,634
Average Annual Earrnings

102 COMPREHENSIVE ANNUAL FINANCIAL REPORT 2014
STATISTICS
Average Creditable Service Protective Executives Protective Occupations & Elected Occupations with without SocialYear General Employees Teachers Officials Social Security Security Average2005 10.4 12.1 12.1 11.0 13.4 11.1 2006 10.5 12.1 12.5 11.2 13.5 11.2 2007 10.6 12.0 12.5 11.3 13.6 11.3 2008 10.6 12.1 12.9 11.5 13.6 11.3 2009 10.7 12.2 12.9 11.9 13.9 11.3 2010 10.8 12.3 13.1 12.3 14.0 11.5 2011 11.1 12.4 13.2 12.7 14.6 11.8 2012 11.1 12.4 13.7 12.8 14.5 11.8 2013 11.0 12.3 13.4 12.9 14.3 11.7 2014 10.9 12.4 13.8 12.8 14.4 11.7
Average Creditable Service

2014 COMPREHENSIVE ANNUAL FINANCIAL REPORT 103
STATISTICS
Average Age Protective Executives Protective Occupations General & Elected Occupations with without SocialYear Employees Teachers Officials Social Security Security Average2005 46.1 43.6 53.3 38.9 40.2 44.62006 46.4 43.7 53.9 39.2 40.3 44.8 2007 46.6 43.7 53.8 39.3 40.5 44.92008 46.8 43.7 54.1 39.5 40.4 45.02009 47.0 43.9 54.3 39.8 40.8 44.92010 47.2 44.0 54.8 40.2 41.0 45.42011 47.1 43.5 54.4 40.1 41.0 45.2 2012 47.1 43.5 54.5 40.2 41.0 45.2 2013 47.0 43.3 54.4 40.2 40.8 45.1 2014 46.9 43.3 54.8 40.2 40.8 45.0
Average Age

104 COMPREHENSIVE ANNUAL FINANCIAL REPORT 2014
STATISTICS
Active Participants by Employer Type ($ in Millions) Local Employers School Technical SpecialYear Districts Counties Cities Colleges Villages Towns Districts Totals 2005 113,915 37,015 23,621 9,626 4,618 1,437 2,884 193,1162006 113,679 36,470 23,528 9,676 4,740 1,487 2,910 192,4902007 113,584 36,043 23,646 9,750 4,831 1,482 2,883 192,219 2008 114,264 35,798 23,812 10,035 4,910 1,491 3,246 193,556 2009 115,380 35,437 23,744 10,268 5,021 1,510 3,518 194,878 2010 114,882 34,652 23,661 10,431 5,031 1,507 3,725 193,889 2011 110,008 33,549 22,993 10,129 4,952 1,552 3,680 186,863 2012 108,758 33,045 22,506 10,036 4,838 1,566 3,815 184,564 2013 108,504 33,044 22,251 9,873 4,746 1,550 3,729 183,697 2014 108,565 32,836 22,211 9,751 4,717 1,519 3,763 183,362
State Government Totals Year State University Totals All Employers 2005 40,213 29,793 70,006 263,122 2006 40,562 29,804 70,366 262,856 2007 41,136 30,026 71,162 263,381 2008 41,611 30,554 72,165 265,721 2009 41,497 30,918 72,415 267,293 2010 41,215 31,525 72,740 266,629 2011 39,642 30,749 70,391 257,254 2012 40,745 31,524 72,269 256,833 2013 41,333 31,758 73,091 256,788 2014 42,063 31,830 73,893 257,255
Number of Lump Sum Benefits Paid
Year Separation Death Retirement2005 3,427 453 1,745 2006 3,462 491 1,922 2007 3,020 536 2,160 2008 2,738 512 2,089 2009 2,817 534 2,571 2010 3,093 584 2,896 2011 2,979 670 2,929 2012 2,725 556 2,403 2013 3,998 740 3,281 2014 4,061 662 2,987
Number of Lump Sum Benefits Paid

2014 COMPREHENSIVE ANNUAL FINANCIAL REPORT 105
STATISTICS
Number of Annuities in Force
Year Retirement Disability Beneficiary Totals2005 123,945 6,415 1,314 131,674 2006 129,289 6,505 1,323 137,117 2007 135,026 6,558 1,322 142,906 2008 136,502 6,397 1,134 144,033 2009 143,261 6,224 1,186 150,671 2010 148,380 6,194 1,201 155,775 2011 160,044 6,201 1,208 167,453 2012 165,966 6,473 1,216 173,655 2013 172,430 6,393 1,233 180,056 2014 177,959 6,363 1,283 185,605
Annuities in Force
Number of New Annuities Approved
Year Retirement Disability Beneficiary Totals2005 7,844 150 58 8,0522006 7,859 163 43 8,0652007 8,186 157 47 8,3902008 8,165 174 61 8,4002009 7,779 156 73 8,0082010 8,330 159 69 8,5582011 15,096 196 60 15,3522012 9,322 183 67 9,5722013 9,889 146 70 10,1052014 9,010 125 69 9,204
Number of New Annuities Approved

106 COMPREHENSIVE ANNUAL FINANCIAL REPORT 2014
STATISTICS
Wisconsin Retirement SystemAverage Monthly Annuities by Years of Service
0 - 5 5 - 10 10 - 15 15 - 20 20 - 25 25 - 30 30 - 35 35 - 40 40 - 45 Over 45
Average Monthly
Annuity $428 $549 $795 $1,179 $1,715 $2,391 $3,026 $3,785 $4,920 $7,565
Average Final
Average Salary $22,703 $30,924 $36,302 $43,475 $49,709 $54,395 $57,335 $58,425 $60,554 $62,190
Number of Annuitants 6,278 15,650 19,102 20,978 23,372 26,661 37,383 14,241 2,224 199
Annuities by Payment Option
Type of Annuity Annuity Payment Option
Monthly Total Number Life with Joint TimeAnnunity of Annuities Retirement Disability Beneficiary Life Annuity Guarantee Survivor CertainAmount$ 0 - 500 27,523 26,320 693 510 4,687 11,612 11,194 30$ 500 - 1,000 29,698 28,044 1,074 580 5,216 11,277 13,163 42$ 1,000 - 1,500 26,283 24,776 1,183 324 3,742 9,090 13,424 27$ 1,500 - 2,000 24,404 23,180 1,070 154 3,087 7,557 13,750 10$ 2,000 - 2,500 23,298 22,224 936 138 2,737 6,671 13,881 9$ 2,500 - 3,000 18,880 18,183 612 85 2,195 5,150 11,530 5$ 3,000 - 3,500 13,856 13,360 425 71 1,645 3,459 8,747 5$ 3,500 - 4,000 9,570 9,312 218 40 1,154 2,430 5,986 0$ 4,000 - 4,500 6,162 6,034 105 23 750 1,545 3,864 3$ 4,500 - 5,000 3,890 3,829 47 14 437 908 2,544 1Over $ 5,000 6,134 6,064 33 37 752 1,373 3,998 11
Total 189,698 181,326 6,396 1,976 26,402 61,072 102,081 143
Wisconsin Retirement SystemAnnuities by Type of Benefit

2014 COMPREHENSIVE ANNUAL FINANCIAL REPORT 107
STATISTICS
Revenues by Source (1)
($ in thousands)
Employee Contributions (2) Employer Contributions (3)
% of Annual % of Annual Investment Other TotalYear Dollars Payroll Income Payroll Income Income Revenues2005 640,229 5.8% 605,163 5.5% 5,492,548 2,338 6,740,2782006 670,254 5.9% 617,263 5.5% 10,962,280 1,905 12,251,702 2007 705,804 6.0% 655,128 5.6% 6,495,914 1,823 7,858,669 2008 736,149 6.0% 683,520 5.6% (22,744,110) 1,618 (21,322,822)2009 736,689 5.8% 705,997 5.6% 13,024,986 1,117 14,468,790 2010 787,460 6.2% 750,702 5.9% 8,317,435 990 9,856,588 2011 797,856 6.3% 789,244 6.2% 664,151 849 2,252,100 2012 757,151 6.0% 799,350 6.3% 9,858,710 678 11,415,889 2013 871,260 6.8% 914,698 7.1% 11,343,231 532 13,129,721 2014 906,499 6.9% 1,023,197 7.7% 4,888,240 642 6,818,578
Revenues by Source
1 Employee required contributions made in accordance with statutory requirements. Employer required contributions were made in accordance with actuarially-determined contribution requirements.2 Employee contributions include all employee required, employee additional and benefit adjustment contributions, including those paid by the employer on behalf of the employee.3 Employer contributions include all employer required contributions, including contributions for unfunded actuarial accrued liability.

108 COMPREHENSIVE ANNUAL FINANCIAL REPORT 2014
STATISTICS
Expenses by Type($ in millions)
Age and Service Benefits Disability Death Separation Administrative Other TotalYear Retirants Beneficiaries Benefits Benefits Benefits Expense Benefit Expense Expense
2005 2,892.6 13.9 134.5 26.6 25.2 17.9 3,110.72006 3,075.4 14.4 136.9 37.5 25.1 17.1 3,306.42007 3,323.6 15.6 142.3 36.9 24.2 17.7 3,560.3 2008 3,627.5 17.2 149.1 28.8 27.4 19.1 3,869.02009 3,609.6 17.4 146.3 24.4 24.8 20.9 3,843.32010 3,683.2 17.2 145.2 29.1 26.4 17.6 3,918.72011 3,941.6 17.8 144.4 33.1 28.0 18.6 4,183.52012 4,023.8 18.2 141.5 24.8 26.6 21.5 4,256.4 2013 4,035.5 18.2 132.9 38.0 33.3 22.9 4,280.82014 4,309.0 19.5 135.9 33.5 34.4 24.0 42.3 4,598.6
Wisconsin Retirement SystemPrincipal Participating EmployersCurrent Year and Nine Years Ago
2014 2005
Participating Government Covered Percentage Covered Rank Percentage Employees Rank of Total Employees of Total System System
State of Wisconsin 73,852 1 28.7% 70,676 1 26.9%Milwaukee Teachers Retirement System 6,000 2 2.3% 7,265 2 2.8%Madison Metro School District 4,666 3 1.8% 4,734 3 1.8%Green Bay Area School District 2,990 4 1.2% 2,975 4 1.1%City of Madison 2,880 5 1.1% 2,888 5 1.1%Kenosha Unified School District 2,738 6 1.1% 2,824 6 1.1%Racine Unified School District 2,673 7 1.0% 2,817 7 1.1%Dane County 2,433 8 0.9% 2,296 8 0.9%Appleton Area School District 1,798 9 0.7% 1,805 10 0.7%Milwaukee Area Technical College 1,754 10 0.7% 2,115 9 0.8%
All Other 155,471 60.4% 162,727 61.8%
Total (1,440 employers) 257,255 100.0% 263,122 100.0%

2014 COMPREHENSIVE ANNUAL FINANCIAL REPORT 109
STATISTICS
Group Health Insurance Program StatisticsHealth Insurance Contracts Annuitants
Active Sick LeaveYear Employees Continuants* Deduction Conversion Direct Pay* Total Retired Totals
State
2005 68,093 0 9,531 9,646 0 19,177 87,2702006 68,688 0 9,468 10,105 0 19,573 88,2612007 70,119 0 9,427 10,417 0 19,844 89,9632008 71,925 0 9,433 10,825 0 20,258 92,1832009 71,924 590 11,112 11,288 0 22,400 94,9142010 72,313 478 9,179 11,788 1,732 22,699 95,4902011 70,656 378 9,126 14,157 1,727 25,010 96,0442012 69,650 430 9,146 14,398 1,827 25,371 95,4512013 69,772 367 9,187 14,701 1,777 25,665 95,8042014 70,219 178 8,913 15,074 1,823 25,810 96,207
Local
2005 11,902 0 1,812 0 0 1,812 13,7142006 11,973 0 1,927 0 0 1,927 13,9002007 11,777 0 1,871 0 0 1,871 13,6482008 12,159 0 1,873 0 0 1,873 14,0322009 12,398 88 2,557 0 0 2,557 15,0432010 12,700 89 2,258 0 225 2,483 15,2722011 12,826 86 2,284 0 236 2,520 15,4322012 12,679 80 2,366 0 229 2,595 15,3542013 12,749 80 2,295 0 253 2,548 15,3772014 12,890 43 2,283 0 252 2,535 15,468
*This data unavailable prior to 2009
Health Insurance Contracts*
* For display purposes, state and local continuants were statistically insignificant and therefore not included in this chart

110 COMPREHENSIVE ANNUAL FINANCIAL REPORT 2014
STATISTICS
Group Health Insurance Program Premiums by Source($ in thousands)
Life Sick Leave InsuranceYear Employer Employee (1) Annuitant Conversion Medicare Stabilization Conversion Totals
State
2005 665,498 31,635 60,997 74,639 0 0 177 832,9472006 711,946 40,064 58,091 79,763 10,442 28 6 900,3392007 763,681 49,268 58,003 85,958 10,464 28 2 967,4042008 834,363 51,160 60,171 92,434 10,713 26 0 1,048,8672009 965,386 n/a 63,453 100,390 11,909 25 95 1,141,2582010 1,067,164 n/a 72,861 111,676 11,864 0 390 1,263,954 2011 1,112,382 n/a 73,166 130,840 11,733 0 464 1,328,585 2012 1,034,066 n/a 61,495 130,154 17,865 0 412 1,243,9932013 1,082,211 n/a 64,201 133,809 19,438 0 485 1,300,1442014 1,128,667 n/a 67,624 141,449 18,633 0 640 1,357,013 Local
2005 116,667 5,903 9,757 0 0 1,632 0 133,9592006 124,771 7,484 10,403 0 380 0 0 143,0382007 124,802 7,775 11,534 0 407 1 0 144,5192008 137,141 7,398 12,021 0 467 1 0 157,0282009 167,907 n/a 13,324 0 461 1 0 181,6932010 189,480 n/a 15,362 0 574 0 3 205,4192011 205,211 n/a 14,700 0 427 0 0 220,3382012 198,476 n/a 13,926 0 1,846 0 0 214,2482013 206,812 n/a 14,746 0 2,047 0 0 223,605 2014 219,413 n/a 14,969 0 1,808 0 3 236,193
Local Annuitants
2005 0 0 879 0 0 0 6 8852006 0 0 847 0 0 0 3 8502007 0 0 823 0 0 0 3 8262008 0 0 856 0 0 0 3 8592009 0 0 958 0 0 0 4 9622010 0 0 1,045 0 0 0 4 1,0492011 0 0 985 0 0 0 2 9872012 0 0 1,085 0 0 0 3 1,0882013 0 0 1,097 0 0 0 3 1,100 2014 0 0 969 0 0 0 3 972
(1) Beginning in 2009 the employee paid portion of active participant health insurance premiums is no longer identifiable.

2014 COMPREHENSIVE ANNUAL FINANCIAL REPORT 111
Group Life Insurance Program StatisticsLife Insurance Premiums Collected($ in thousands)
Employee Employer Totals State Spouse & Year Basic Supp Additional Dependent Total Basic Suppl Total
2005 5,470 4,079 4,546 1,033 15,127 2,676 1,127 3,803 18,930 2006 5,765 4,275 4,934 1,019 15,994 2,779 1,163 3,943 19,936 2007 6,157 4,552 5,448 1,027 17,184 2,956 1,232 4,188 21,372 2008 6,600 4,861 6,585 1,039 19,085 3,161 1,312 4,473 23,558 2009 7,074 5,198 7,409 1,053 20,734 3,408 1,408 4,816 25,550 2010 7,363 5,404 7,834 1,253 21,855 3,519 1,453 4,971 26,826 2011 7,302 4,577 7,248 1,275 20,402 3,488 1,180 4,668 25,070 2012 6,285 4,557 6,758 1,233 18,833 2,873 1,204 4,078 22,911 2013 6,235 4,513 7,008 1,222 18,978 2,926 1,222 4,148 23,126 2014 6,323 4,573 7,351 1,217 19,465 3,028 1,262 4,290 23,755
Local
2005 8,752 1,776 5,248 1,483 17,260 2,387 17 2,404 19,664 2006 9,256 1,966 5,733 1,492 18,447 2,534 27 2,561 21,008 2007 9,969 2,189 6,356 1,428 19,943 2,764 73 2,837 22,780 2008 10,352 2,337 6,747 1,337 20,773 2,868 71 2,939 23,712 2009 10,573 2,540 7,224 1,342 21,679 3,185 17 3,201 24,881 2010 10,950 2,642 7,636 1,329 22,558 3,247 53 3,300 25,858 2011 10,933 2,702 7,761 1,298 22,694 3,250 54 3,304 25,997 2012 10,612 2,692 7,666 1,248 22,218 3,319 51 3,370 25,588 2013 10,497 2,736 7,575 1,216 22,024 3,264 17 3,281 25,305 2014 10,561 2,789 7,737 1,209 22,296 3,317 16 3,334 25,629
STATISTICS
Group Life Insurance In Force($ in thousands)
Pre-Retirement Post- Spouse & State Basic Supplemental Additional Retirement Dependent Totals
Year
2005 2,719,404 2,003,210 2,276,487 277,560 582,575 7,859,2362006 2,812,389 2,065,965 2,450,801 295,682 584,735 8,209,5722007 2,953,085 2,163,847 2,686,412 320,233 592,020 8,715,5972008 3,101,958 2,267,825 2,897,834 348,802 594,715 9,211,1342009 3,288,721 2,401,767 3,175,970 371,715 605,205 9,843,3782010 3,302,757 2,410,238 3,247,085 396,600 601,900 9,958,5802011 3,296,564 2,385,886 3,250,843 449,897 567,755 9,950,9452012 3,231,871 2,321,576 3,258,782 493,214 561,610 9,867,0532013 3,327,163 2,387,599 3,424,431 536,246 562,840 10,238,2792014 3,392,305 2,431,610 3,563,096 581,765 570,825 10,539,601
Local
2005 3,540,667 910,482 2,746,798 173,746 868,055 8,239,7482006 3,665,026 985,403 2,954,710 190,202 877,340 8,672,6812007 3,849,827 1,085,500 3,171,093 209,310 893,160 9,208,8902008 3,998,963 1,157,300 3,369,883 230,296 895,485 9,651,9272009 4,173,626 1,237,027 3,614,168 247,986 897,225 10,170,0322010 4,280,427 1,296,473 3,809,183 263,635 882,590 10,532,3082011 4,303,919 1,364,577 3,903,476 296,558 852,035 10,720,5652012 4,182,413 1,346,900 3,801,144 339,426 819,980 10,489,8632013 4,340,129 1,412,278 4,146,681 369,512 810,265 11,078,8652014 4,440,538 1,458,009 4,263,886 401,639 805,950 11,370,022

112 COMPREHENSIVE ANNUAL FINANCIAL REPORT 2014
Life Insurance Program Contracts and Participants
Pre-Retirement Post- Spouse & Total TotalYear Basic Supplemental Additional Retirement Dependent Contracts Participants
State
2005 56,594 41,049 24,474 13,720 24,583 160,420 70,3142006 57,137 41,358 25,120 14,148 24,575 162,338 71,2852007 57,907 41,813 25,851 14,729 24,762 165,062 72,6362008 58,668 42,246 26,444 15,431 24,796 167,585 74,0992009 59,045 42,467 26,959 16,034 25,145 169,650 75,0792010 58,070 41,840 26,805 16,584 25,008 168,307 74,6542011 57,673 41,247 26,503 17,847 23,446 166,716 75,520 2012 56,773 40,243 26,288 18,921 23,153 165,378 75,694 2013 56,516 39,940 26,297 20,025 23,203 165,981 76,541 2014 56,652 39,958 26,237 21,168 23,478 167,493 77,820
Local
2005 84,180 20,882 31,986 18,421 36,075 191,544 102,601 2006 84,928 21,753 32,904 19,187 36,395 195,167 104,115 2007 86,623 23,712 33,994 19,926 36,861 201,116 106,549 2008 87,150 24,444 34,430 20,912 36,905 203,841 108,062 2009 87,616 25,128 35,114 21,787 36,940 206,585 109,403 2010 86,828 25,336 35,257 22,671 36,340 206,432 109,499 2011 85,714 26,155 34,768 23,956 35,036 205,629 109,670 2012 83,863 26,053 33,833 25,573 33,704 203,026 109,4362013 83,519 26,111 35,166 27,049 33,297 205,142 110,5682014 83,887 26,288 35,241 28,634 33,117 207,167 112,521
STATISTICS
Life Insurance Program Contracts

2014 COMPREHENSIVE ANNUAL FINANCIAL REPORT 113
STATISTICS
Group Life Insurance Program Paid Claims($ in thousands)
Pre-Retirement Post- Spouse & Living Year Life AD&D Disability Retirement Dependent Benefits(1) Totals
State
2005 13,479 1,788 2,284 7,521 1,076 341 26,4892006 14,953 1,120 2,315 8,480 1,003 576 28,4472007 15,424 578 1,048 8,774 1,095 512 27,4312008 12,438 948 1,834 8,688 1,182 365 25,4542009 13,567 1,152 1,697 9,300 1,116 314 27,1452010 14,356 893 1,496 10,473 959 162 28,3402011 16,749 1,285 1,184 9,881 1,241 1,211 31,5512012 17,137 1,260 1,343 12,040 1,027 1,185 33,991 2013 17,179 284 323 12,894 1,309 252 32,241 2014 13,243 1,314 1,512 14,772 1,091 792 32,724 Local
2005 10,389 880 805 4,146 1,426 125 17,770 2006 12,343 1,580 1,430 4,521 1,311 936 22,121 2007 13,662 1,192 1,327 5,305 1,690 531 23,708 2008 15,929 1,286 578 4,439 1,617 296 24,146 2009 12,408 444 1,070 5,552 1,540 240 21,253 2010 16,512 1,513 943 5,954 1,458 1,332 27,712 2011 14,646 1,188 1,215 6,141 1,633 81 24,904 2012 13,704 788 1,175 6,588 1,180 655 24,0902013 14,456 1,305 6 7,415 1,331 37 24,550 2014 13,195 1,468 1,484 7,337 1,246 928 25,659
1 Living Benefits may originate as Pre-Retirement, Post-Retirement or Spouse & Dependent benefits.
Group Life Insurance ProgramPaid Claims

114 COMPREHENSIVE ANNUAL FINANCIAL REPORT 2014
Duty Disability Insurance StatisticsFunded Status($ in Millions)
Unfunded UAAL as % (Overfunded) Percent Covered of CoveredYear Assets Liabilities Liability Funded Payroll Payroll
2005 224.9 362.3 137.4 62.1% 1,092.5 12.6%2006 266.3 427.1 160.8 62.3% 1,154.0 13.9%2007 321.9 427.1 105.2 75.4% 1,217.3 8.6%2008 355.5 471.7 116.1 75.4% 1,286.7 9.0%2009 392.4 471.7 79.2 83.2% 1,322.5 6.0%2010 432.1 512.8 80.7 84.3% 1,326.3 6.1%2011 461.6 499.0 37.4 92.5% 1,332.7 2.8%2012 494.1 477.0 (17.1) 103.6% 1,318.3 -1.3%2013 568.9 507.1 (61.8) 112.2% 1,328.2 -4.7%2014 567.2 513.2 (54.1) 110.5% 1,370.7 -3.9%
STATISTICS
Duty Disability Insurance Statistics($ in Millions)
Average Active Benefit ContributionYear Employers Participants Disabilitants Payments Contributions Rate
2005 486 21,851 n/a 24 42 3.85%2006 494 22,115 n/a 26 45 3.86%2007 499 22,550 n/a 26 48 3.92%2008 500 22,843 836 27 51 3.93%2009 502 23,019 839 29 52 3.89%2010 504 22,871 938 30 52 3.91%2011 503 22,352 957 30 53 3.98%2012 501 22,144 964 30 53 3.98%2013 512 21,976 973 31 54 4.06%2014 506 22,346 990 32 9 0.68%
Duty Disability Funding

2014 COMPREHENSIVE ANNUAL FINANCIAL REPORT 115
STATISTICS
Duty Disability InsurancePrincipal Participating EmployersCurrent Year and Nine Years Ago 2014 2005
Participating Covered Percentage of Covered Percentage ofGovernment Employees Rank Total System Employees Rank Total System
State of Wisconsin 8,900 1 39.8% 8,356 1 38.2%City of Madison 838 2 3.8% 695 2 3.2%Dane County 437 3 2.0% 436 3 2.0%City of Green Bay 369 4 1.7% 378 4 1.7%City of Kenosha 341 5 1.5% 325 6 1.5%City of Racine 334 6 1.5% 336 5 1.5%City of West Allis 231 7 1.0% 245 8 1.1%City of Waukesha 214 8 1.0% 203 9 0.9%City of Oshkosh 202 9 0.9% 202 10 0.9%City of Appleton 198 10 0.9% 196 11 0.9%
All Other 10,282 46.0% 10,479 48.0%
Total (493 employers) 22,346 100.0% 21,851 100.0%
Duty Disability Annuities by Type of Benefit Type of Annuity Monthly Number ofBenefit Amount Annuitants Disability Beneficiary
$ 0 - 500 33 32 1 $ 500 - 1,000 71 54 17$ 1,000 - 1,500 84 79 5$ 1,500 - 2,000 100 96 4$ 2,000 - 2,500 107 101 6$ 2,500 - 3,000 116 110 6$ 3,000 - 3,500 118 112 6$ 3,500 - 4,000 96 94 2$ 4,000 - 4,500 100 99 1$ 4,500 - 5,000 65 63 2Over $ 5,000 46 44 2
Total 936 884 52 * This table excludes annuitants whose benefit is totally offset by other income sources.
Duty Disability InsuranceAverage Monthly Benefit by Years of Service Years of Service 0 - 5 5 - 10 10 - 15 15 - 20 20 - 25 25 - 30 30 - 35Average Monthly Annuity $3,229 $3,530 $3,278 $2,846 $2,044 $1,614 $1,671Average Final Average Salary $2,453 $3,301 $3,475 $3,657 $3,771 $3,962 $3,261Number of Annuitants 50 165 203 243 196 71 8 * This table excludes annuitants for whom years of service data is not available

116 COMPREHENSIVE ANNUAL FINANCIAL REPORT 2014
STATISTICS
Long-Term Disability Insurance Statistics($ in millions)
Unfunded UAAL as % (Overfunded) Percent Covered Payroll of CoveredYear Assets Liabilities Liability Funded ($ in millions) Payroll
2005 294.67 90.30 (204.4) 326.3% 10,973 -1.9%2006 307.69 108.29 (199.4) 284.1% 11,308 -1.8%2007 328.32 138.63 (189.7) 236.8% 11,720 -1.6%2008 316.72 141.63 (175.1) 223.6% 12,290 -1.4%2009 303.87 159.73 (144.1) 190.2% 12,622 -1.1%2010 289.26 179.50 (109.8) 161.1% 12,744 -0.9%2011 262.48 193.30 (69.2) 135.8% 12,719 -0.5%2012 232.61 218.15 (14.5) 106.6% 12,628 -0.1%2013 200.07 239.30 39.2 83.6% 12,885 0.3%2014 224.41 292.42 68.0 76.7% 13,220 0.5%
Long-Term Disability Insurance Funding

2014 COMPREHENSIVE ANNUAL FINANCIAL REPORT 117
Income Continuation Insurance Statistics—Local ($ in millions) Unfunded (Overfunded) FundedYear Contracts Claims Assets Liabilities Liability Ratio
2005 6,985 115 18.5 3.7 (14.8) 503.6%2006 7,053 137 20.9 4.3 (16.6) 485.8%2007 7,270 70 24.1 3.8 (20.3) 631.1%2008 7,837 67 25.9 3.9 (22.1) 667.4%2009 8,229 87 28.2 4.0 (24.2) 705.8%2010 7,964 75 30.6 4.2 (26.4) 735.8%2011 7,878 93 31.9 5.1 (26.9) 627.6%2012 7,593 90 31.6 5.7 (25.9) 555.6%2013 8,344 130 33.4 5.2 (28.2) 644.1%2014 8,463 118 35.1 4.1 (30.9) 845.0%
STATISTICS
Income Continuation Insurance Statistics—State($ in millions) Unfunded (Overfunded) FundedYear Contracts Claims Assets Liabilities Liability Ratio
2005 54,844 1,865 62.6 63.4 0.8 98.7%2006 54,646 2,054 60.8 67.0 6.2 90.7%2007 55,048 1,388 62.7 64.8 2.1 96.8%2008 55,908 1,419 60.5 72.8 12.3 83.1%2009 56,596 1,399 59.4 69.0 9.6 86.1%2010 56,068 1,415 59.3 70.3 11.0 84.4%2011 52,573 1,545 54.6 83.7 29.1 65.2%2012 53,488 1,663 50.7 76.6 26.0 66.1%2013 51,692 1,648 51.4 85.9 34.5 59.8%2014 51,379 1,645 50.8 78.8 28.1 64.4%
Income Continuation Insurance Funding—Local
Income Continuation Insurance Funding—State

118 COMPREHENSIVE ANNUAL FINANCIAL REPORT 2014
STATISTICS
Employee Reimbursement Accounts Program StatisticsSalary Reductions and Claims
Medical Dependent Care Salary SalaryYear Accounts Reductions Claims Forfeitures Accounts Reductions Claims Forfeitures
2005 11,246 12,869,605 12,680,770 188,835 2,285 8,152,493 8,099,308 53,185 2006 11,617 13,795,854 13,723,055 72,799 2,325 8,499,544 8,349,343 150,2012007 11,587 13,953,387 13,749,822 203,565 2,389 8,832,561 8,774,586 57,975 2008 10,922 14,372,252 14,178,505 193,747 2,186 8,934,444 8,854,653 79,791 2009 10,975 14,455,388 14,243,697 211,691 2,211 8,948,891 8,860,082 88,810 2010 11,428 14,690,079 14,496,161 193,918 2,166 8,737,997 8,668,217 69,780 2011 10,723 13,498,149 13,373,269 124,880 2,133 8,476,558 8,420,493 56,065 2012 12,373 15,948,452 15,828,849 119,603 2,245 8,911,658 8,847,562 64,096 2013 12,956 15,149,278 14,922,337 226,941 2,469 9,750,422 9,675,871 74,551 2014 13,370 16,163,180 15,911,661 251,519 2,672 10,496,707 10,398,333 98,374
Employee Reimbursement Accounts Program StatisticsAdministrative Funding Receipts Expenses
Surplus/Year Fees Interest Forfeitures Totals Administrator State Total (Deficit)
2005 456,715 161,038 242,020 859,773 599,868 101,780 701,648 158,125 2006 452,759 276,600 223,000 952,359 710,633 90,519 801,152 151,207 2007 457,303 284,850 261,540 1,003,693 699,699 118,552 818,251 185,442 2008 396,608 144,012 273,538 814,158 601,120 118,127 719,247 94,911 2009 409,931 28,172 300,500 738,603 603,121 123,055 726,176 12,427 2010 430,071 9,449 263,698 703,218 709,032 117,967 826,999 (123,781)2011 427,725 10,435 180,945 619,105 681,803 111,024 792,827 (173,722)2012 418,251 7,260 183,699 609,210 753,307 226,690 979,997 (370,787)2013 500,554 3,910 301,492 805,956 786,888 230,327 1,017,215 (211,259)2014 671,414 3,685 349,893 1,024,992 847,955 388,875 1,236,830 (211,838)
Salary Reductions

2014 COMPREHENSIVE ANNUAL FINANCIAL REPORT 119
STATISTICS
Administrative Expense StatisticsAdministrative Expenses($ in thousands)
Third Party Administrator Contracts ETF Investment Badger Deferred Commuter TotalYear Expenses Expenses ERA Health Pharmacy ICI LTDI Rx Comp Benefits Administration 2005 23,059 165,940 600 4,294 9,461 1,701 838 1 2,448 121 208,4632006 22,367 210,660 710 2,807 8,820 1,859 894 0 1,771 87 249,975 2007 21,958 212,143 700 2,140 10,081 1,910 908 0 2,317 96 252,2532008 25,779 226,364 601 2,183 10,427 1,859 912 0 2,440 94 270,659 2009 28,565 230,129 603 2,244 9,717 1,348 1,764 0 2,548 94 277,0122010 27,709 245,806 709 2,461 13,379 1,525 1,616 0 2,659 79 295,9432011 28,664 241,413 682 2,264 9,056 1,449 1,692 0 2,639 77 287,9352012 32,154 290,608 753 2,235 12,413 1,455 1,777 0 2,714 73 344,1842013 33,817 362,011 787 2,286 8,756 1,419 1,881 0 2,775 87 413,8172014 34,484 356,811 848 2,874 10,700 5,026 13,189 0 2,775 94 426,801
Administrative Expenses per Participant
Employee Trust Funds Investment Expenses Third Party Administrators Total Administration
Amount Per Amount Per Amount Per Amount PerYear Participants ($000’s) Participant ($000’s) Participant ($000’s) Participant ($000’s) Participant
2005 530,540 23,059 43.5 165,940 312.8 19,464 36.7 208,463 392.9 2006 542,558 22,367 41.2 210,660 388.3 16,948 31.2 249,975 460.7 2007 551,058 21,958 39.8 212,143 385.0 18,152 32.9 252,253 457.8 2008 557,062 25,779 46.3 226,364 406.4 18,516 33.2 270,659 485.9 2009 566,317 28,565 50.4 230,129 406.4 18,318 32.3 277,012 489.1 2010 572,219 27,709 48.4 245,806 429.6 22,428 39.2 295,943 517.2 2011 581,893 28,664 49.3 241,413 414.9 17,859 30.7 287,935 494.8 2012 590,461 32,154 54.5 290,608 492.2 21,421 36.3 344,184 582.9 2013 594,605 33,817 56.9 362,011 608.8 17,990 30.3 413,817 696.0 2014 603,983 34,484 57.1 356,811 590.8 35,506 58.8 426,801 706.6
Administrative Expenses per Participant

This page intentionally left blank

State of WisconsinDepartment of Employee Trust Funds
AC TUARIAL


124 COMPREHENSIVE ANNUAL FINANCIAL REPORT 2014
Wisconsin Retirement SystemActuarial Statement of Assets and Liabilities(Millions $) Increase December 31, 2014 December 31, 2013 (Decrease)Assets and Employer Obligations Net Assets Cash, Investments & Receivables Less: Payables & Suspense Items Core Division 82,385.4 78,170.1 4,215.3 Variable Division 6,975.0 7,053.4 (78.4) Totals 89,360.4 85,223.5 4,136.9 Obligations of Employers Unfunded Accrued Liability 31.7 52.6 (20.9) Total Assets 89,392.1 85,276.1 4,116.0 Reserves and Surplus Reserves Actuarial Present Value of Projected Benefits Payable to Terminated Vested Participants and Active Members: Member Normal Contributions 16,243.3 15,407.7 835.6 Member Additional Contributions 16.0 151.5 (135.5) Employer Contributions 22,001.7 21,256.4 745.3 Total Contributions 38,261.0 36,815.6 1,445.4 Actuarial Present Value of Projected Benefits Payable to Current Retirees and Beneficiaries: Core Annuities 45,790.7 42,300.5 3,490.2 Variable Annuities 3,917.1 3,347.0 570.1 Total Annuities 49,707.8 45,647.5 4,060.3 Total Reserves 87,968.8 82,463.1 5,505.7 Surplus Core Annuity Reserve Surplus 1,345.0 1,972.7 (627.7) Variable Annuity Reserve Surplus 78.3 840.3 (762.0) Total Surplus 1,423.3 2,813.0 (1,389.7) Total Reserves and Surplus 89,392.1 85,276.1 4,116.0
ACTUARIAL

2014 COMPREHENSIVE ANNUAL FINANCIAL REPORT 125
Maximum formula annuity is 85% of FAE for protective occupation participants not covered by Social Security, 65% of FAE for protectives covered by Social Security, and 70% for all other participants. If greater than the formula amount, an annuity equal to the actuarial equivalent of two times the required accumulated contributions is paid in lieu of the formula amount.
Early Retirement: Any participant who has attained age 55 and any protective occupation participant who has attained age 50 may apply for an early retirement annuity. The benefit is reduced 0.4% for each month that the annuity effective date precedes the Normal Retirement Age. For non-protective participants terminating after June 30, 1990, the 0.4% is reduced for months after the attainment of age 57 and before the annuity effective date by .001111% for each month of creditable service.
Voluntary Termination Before Immediate Benefit Eligibility: A participant who terminates service before being eligible for a retirement annuity may either (1) receive a refund of accumulated contributions, or (2) leave contributions on deposit and apply for a retirement annuity on or after the minimum retirement age based upon age and accrued service at time of termination.
Post-Retirement Adjustments: Annuities are increased annually if the investment income credited to retired life funds is in excess of the assumed rate (presently 5%), other plan experiences are within projected ranges, and the resulting adjustment would be at least 0.5%. Previously granted adjustments can be revoked if the investment income is insufficient to support these previously granted increases. However, a Core Fund annuity cannot be reduced below the amount granted upon inception. Slightly different provisions apply to variable annuities.
Disability Annuity: Eligibility for disability under the Wisconsin Retirement System means, generally, total and permanent incapacity to engage in gainful employment. The participant must have completed at least six months of creditable service in each of at least five out of the last seven calendar years preceding application for disability. The service requirement is waived if the disability is from service-related causes.
ACTUARIAL
Normal Retirement EligibilityThe age a participant becomes eligible for an unreduced age and service annuity is:
General Protective Executive Occupation & ElectedAge Service Age Service Age Service65 Any * 54 Any* 62 Any*57 30 53 25 57 30
*Participants first employed after 1989 and terminated before April 24, 1998, must have creditable service in five calendar years. Participants first employed after June 30, 2011 must have five years of creditable service.
Normal Retirement Annuity
The age and service annuity payable at Normal Retirement Age is based on Final Average Earnings (FAE) and creditable service as follows:
Multiplier for Service Rendered Group
Before Between After 2000 2000 and 2011 2011
2.165% 2.0% 1.6% Executive group and elected officials
2.165% 2.0% 2.0% Protective occupation participants covered by Social Security
2.665% 2.5% 2.5% Protective occupation participants not covered by Social Security
1.765% 1.6% 1.6% All other participants
FAE is generally the average of the three highest years of earnings preceding retirement (July 1 - June 30 for teachers, educational support staff, and judges; calendar year for others). These years do not have to be consecutive. For legislators and state constitutional officers who are ineligible to receive pay increases during their term, FAE is the statutory rate of earnings at termination.
Summary of Benefit Provisions

126 COMPREHENSIVE ANNUAL FINANCIAL REPORT 2014
ACTUARIAL
Disability Amounts: Amounts payable in case of disability depend upon the plan from which payment is made. Plans are described below.
Post-10/15/92 Long-Term Disability Pre-10/16/92 WRS Plan Insurance (LTDI) PlanParticipants Covered Participants hired before 10/16/92 Participants entering after 10/15/92 and who do not elect LTDI coverage. participants on 10/15/92 who elect LTDI coverage.Benefit to age 65* WRS formula benefit based on service 40% of FAE for participants covered by Social projected to normal retirement age. Security; 50% of FAE for non-covered participants who cannot qualify for Social Security disability benefits.Benefit at age 65* Continuation of pre-65 amount. WRS benefit accrued to date of disability plus 7%
of FAE money purchase benefit during disability period, both of which are adjusted in accordance with the dividend rate.
*Conversion age is later for participants becoming disabled after age 61.
Death In Service: Prior to age 50 for protective participants and age 55 for others, the benefit is the equivalent of twice the accumulated employee required and all additional contributions and employer amounts contributed prior to 1974 for teachers or 1966 for others. After age 50 for protective occupation participants, and age 55 for others, the benefit is the amount that would have been paid if participant had retired and elected the 100% survivor option. The benefit is payable to a spouse, child, or other dependent.
Interest credits: Interest is credited on member Core Fund accounts based on the prior year ending account balance and the interest rates shown below.
Rate Credited For Purpose of
Date of Participation Money Purchase Minimum RefundsPrior to 1982 Core Effective Rate Core Effective RateJanuary 1, 1982 and later and terminated prior to January 1, 2000 5% 3%January 1, 1982 and later and not terminated prior to January 1, 2000 Core Effective Rate Core Effective Rate
Interest is credited on member Variable Fund accounts based on the prior year ending account balance and the Variable effective rate.
Interest on both Core and Variable member additional deposit accounts is based on the prior year ending account balance and the appropriate effective rate.
Contribution Rates: The financial objective of the WRS is to establish and receive contributions that will remain level from year to year and decade to decade.
Effective June 28, 2011, the employee contribution for general category employees, teachers and executives and elected officials is equal to one-half the actuarially required contribution. The employee contribution for protective occupations is the same percentage as general employees. The employer is responsible for the remainder of the actuarially determined contribution. The employer may not pay any portion of the employee contribution unless provided for by a pre-existing collective bargaining agreement.

2014 COMPREHENSIVE ANNUAL FINANCIAL REPORT 127
ACTUARIAL
Economic AssumptionsThe Investment Return Assumption for plan assets is 7.2%.
For determining plan liabilities, the Discount Rate is 5.0% for retired participants, 5.0% for active and inactive participants following retirement, and 7.2% for active participants prior to their retirement. A valuation performed assuming 5.5% discount rate for all participants at all stages of life, reproduces the results of an actuarial valuation using the 5% post-retirement and 7.2% pre-retirement assumptions. Thus, it can be said that the net discount rate assumed in the valuations was 5.5% per year, compounded annually (net after administrative expenses).
The Wage Inflation Rate assumed in this valuation was 3.20% per year. The wage inflation rate is defined to be the portion of total pay increases for an individual that are due to macroeconomic forces, including productivity, price inflation, and labor market conditions. The wage inflation rate does not include pay changes related to individual merit and seniority effects.
No specific Price Inflation assumption is required to perform this valuation because there are no benefits that are linked to price increases. However, a price inflation assumption on the order of 2.0% to 2.7% would be consistent with the other economic assumptions.
The assumed Real Rate of Return over wage inflation is defined to be the portion of total investment return that is more than the assumed total wage growth rate. Considering other economic assumptions, the 7.2% pre-retirement investment return rate translates to an assumed real rate of return over wage inflation of 4.0%. The assumed real rate of return over price inflation would be higher – on the order of 4.5% to 5.2%, considering both an inflation assumption and an average expense provision.
Pay increase assumptions for individual active participants are shown for sample services below. Part of the assumption for each age is for merit and/or seniority increase, and the other 3.2% recognizes wage inflation, including price inflation, productivity increases, and other macroeconomic forces.
The principal areas of risk assumption are:1. Long-term rates of investment income likely to
be generated by the assets of the retirement fund. This includes both realized and unrealized appreciation and depreciation.
2. Rates of mortality among participants, retirees and beneficiaries.
3. Rates of withdrawal of active participants.4. Rates of disability among participants.5. Patterns of salary increases to be experienced
by participants.6. The age and service distribution of actual
retirements.
In making a valuation, the actuary must project the monetary value of each risk assumption for each distinct experience group for the next year and for each year over the next half-century or longer.
Once actual risk experience has occurred and been observed, it will not coincide exactly with assumed risk experience regardless of the skill of the actuary, the completeness of the data, and the precision of the calculations. Each valuation provides a completed recalculation of assumed future risk experience and takes into account all past differences between assumed and actual risk experience. The result is a continual series of small adjustments to the computed contribution rate. From time to time it becomes necessary to adjust the package of risk measurements to reflect basic experience trends but not random year-to-year fluctuations.
The actuarial valuation method used in the valuation was the Frozen Initial Liability Actuarial Valuation Method. Under this method, the amount of remaining unfunded accrued actuarial liabilities at any valuation date are affected only by the monthly amortization payments, compound interest, the added liability created by new employer units, and any added liabilities caused by changes in benefit provisions.
Actuarial Method and Assumptions Used in Valuations

128 COMPREHENSIVE ANNUAL FINANCIAL REPORT 2014
ACTUARIAL
Single Life Retirement Values (Retired Participants)
Wisconsin Projected Experience Table With 5% Interest
Sample Present Value of $1 Future LifeAttained Monthly for Life Expectancy (Years)
Age Male Female Male Female
40 $209.20 $214.70 42.9 46.145 200.43 207.06 38.1 41.350 189.60 197.69 33.3 36.555 176.75 186.37 28.7 31.8 60 162.35 172.92 24.4 27.265 145.13 156.75 20.1 22.770 125.71 137.76 16.1 18.475 104.34 116.43 12.4 14.3 80 82.05 93.57 9.0 10.785 61.28 70.89 6.3 7.6
The values shown above are for non-disabled participants. For disabled participants, the following table is used:
% Increases in Salaries Next Year (Merit and Longevity)
% Merit and Longevity Increase Next Year Protective Protective Service General University Public Occupation With Occupation Without Executive Teachers School Teachers SS SS /Elected 1 3.5% 3.2% 5.8% 4.8% 5.5% 2.0% 2 3.5% 3.2% 5.8% 4.8% 5.5% 2.0% 3 3.1% 3.1% 5.4% 4.1% 4.7% 2.0% 4 2.8% 3.0% 5.1% 3.5% 3.8% 1.9% 5 2.5% 2.9% 4.7% 2.8% 3.0% 1.9%10 1.5% 2.4% 3.2% 1.1% 0.9% 1.6%15 1.1% 1.7% 1.8% 0.8% 0.5% 1.2%20 0.9% 1.1% 0.8% 0.7% 0.4% 0.7%25 0.6% 0.8% 0.4% 0.6% 0.3% 0.4%30 0.4% 0.6% 0.2% 0.5% 0.2% 0.3% In addition to the merit and longevity increase, each person is assumed to get an economic increase of 3.2% each year.
The active population is assumed to remain constant. The active payroll is assumed to grow 3.2% per year. This increasing payroll was recognized in amortizing unfunded actuarial accrued liabilities.
Decrement Probabilities
The mortality table used to measure mortality for participants was the Wisconsin Projected Experience Table for men and women. Sample retirement values from this table are shown below. This assumption is used to measure the probabilities of participants dying before retirement and the probabilities of each benefit payment being made after retirement.

2014 COMPREHENSIVE ANNUAL FINANCIAL REPORT 129
ACTUARIAL
Single Life Retirement Values (Disabled Participants)Wisconsin Projected Experience Table With 5% Interest
Sample Present Value of $1 Future LifeAttained Monthly for Life Expectancy (Years)
Age Male Female Male Female40 $195.27 $204.53 35.7 39.945 183.23 194.56 30.9 35.150 169.52 182.61 26.4 30.455 153.66 168.39 22.1 25.8 60 135.14 151.44 18.0 21.465 114.76 131.73 14.1 17.270 92.83 109.91 10.6 13.275 71.03 86.92 7.6 9.7 80 52.06 64.92 5.2 6.885 36.73 47.23 3.5 4.7
The active participant mortality assumption is used to measure the probability of participants becoming deceased while in service.
Active Participant Mortality Rates
Sample Attained Mortality Rates Age Male Female 20 0.000155 0.000089 25 0.000184 0.000097 30 0.000229 0.000129 35 0.000398 0.000230 40 0.000540 0.000329 45 0.000717 0.000519 50 0.000966 0.000765 55 0.002228 0.001345 60 0.003147 0.001935 65 0.004814 0.002974 70 0.007979 0.005057 75 0.013576 0.009155 80 0.024949 0.017103

130 COMPREHENSIVE ANNUAL FINANCIAL REPORT 2014
Rates of Retirement for Those Eligible to Retire—Normal Retirement PatternNormal Retirement Pattern
% Retiring Next Year
General Public School University Protective ExecAge Male Female Male Female Male Female With SS W/OSS & Elected
50 % % % % % % 6% 4% %51 7 4 52 8 5 53 23 17 54 18 25 55 17 21 56 16 27 57 20 17 40 27 13 14 16 30 1558 20 17 35 27 13 14 16 30 1559 20 17 25 27 13 13 16 30 1560 20 20 28 27 13 13 18 26 1061 20 20 25 27 13 19 18 15 1362 27 27 36 34 15 19 22 20 1363 32 28 32 27 15 19 29 40 1264 24 25 24 23 15 18 16 40 1265 24 25 24 28 15 22 30 40 1266 30 29 25 30 20 23 20 40 2067 24 20 24 28 18 17 15 40 1768 17 18 24 26 18 17 25 40 1569 17 18 24 20 18 17 20 40 1570 17 18 20 20 20 20 100 100 1371 17 18 20 20 20 20 100 100 1372 17 15 20 20 15 20 100 100 2573 17 15 20 20 15 20 100 100 1074 17 15 20 20 15 20 100 100 1075 100 100 100 100 100 100 100 100 100
ACTUARIAL

2014 COMPREHENSIVE ANNUAL FINANCIAL REPORT 131
Rates of Retirement for Those Eligible to Retire—Early Retirement Pattern
% Retiring Next Year
General Public School University ExecAge Male Female Male Female Male Female & Elected
55 8.0% 6.1% 12.0% 11.0% 4.8% 5.5% 4.5%56 8.0 6.4 12.0 11.0 3.0 5.5 4.557 4.3 4.2 12.0 11.0 2.0 4.0 4.558 5.3 5.5 12.0 11.0 2.5 4.0 4.559 5.5 5.3 12.0 11.0 4.0 6.5 4.560 7.5 8.1 12.0 15.0 4.0 6.5 4.561 8.0 7.0 12.0 15.0 7.5 7.5 4.562 14.0 15.0 20.0 20.0 7.0 10.0 63 16.0 15.0 20.0 20.0 7.5 10.0 64 17.0 15.0 20.0 20.0 8.0 13.0
The assumed rates of separation from employment prior to service retirement due to disability and other causes are shown below for sample ages. For other terminations it was assumed that a percentage depending on age of participants terminating after age 35 with five or more years of service will leave their contributions on deposit and be paid a benefit at normal retirement age and that the remaining participants would take a separation benefit. The percentage taking a separation benefit is 25% at age 35, grading downward to 0% at retirement eligibility. All participants terminating prior to normal retirement age with less than five years of service were assumed to take a separation benefit.
ACTUARIAL

132 COMPREHENSIVE ANNUAL FINANCIAL REPORT 2014
Assumed Termination Rates % of Active Participants Terminating
Protective Public Schools University Other Age & With W/O ExecService SS SS Male Female Male Female Elected Male Female
0 15.0% 4.0% 17.7% 15.0% 18.3% 22.0% 20.0% 17.5% 19.5% 1 7.0 3.5 11.4 10.5 15.0 15.0 14.0 13.0 13.5 2 4.3 2.1 7.3 7.1 11.3 12.5 14.0 8.5 10.0 3 3.8 1.3 5.2 5.5 9.6 10.0 10.0 6.8 8.0 4 3.4 1.2 3.9 4.6 8.5 9.5 10.0 6.0 7.4 5 2.6 1.1 3.0 4.0 7.5 8.0 9.0 4.5 6.0 6 2.5 1.0 2.8 3.5 7.0 7.0 8.5 4.0 5.0 7 2.3 0.9 2.5 3.0 5.5 6.0 8.0 3.5 4.5 8 2.0 .08 2.0 2.5 4.3 5.0 7.5 3.0 4.0 9 1.7 0.7 1.8 2.3 3.2 4.0 7.0 2.5 3.825 10 & Over 1.7 0.7 1.8 2.2 3.2 5.0 6.0 2.5 3.830 1.6 0.7 1.4 1.9 3.2 4.5 5.1 2.5 3.335 1.4 0.7 1.2 1.4 3.1 4.0 4.2 2.1 2.840 1.2 0.6 1.1 1.1 2.7 3.4 3.7 1.6 2.245 1.1 0.6 1.0 0.9 2.1 2.6 3.3 1.3 1.850 1.0 0.5 1.0 0.9 1.6 1.8 3.1 1.1 1.655 1.0 0.5 1.0 0.9 1.4 1.5 3.0 1.1 1.560 1.0 0.5 1.0 0.9 1.4 1.5 3.0 1.1 1.5
ACTUARIAL
Disability Rates% of Active Participants Becoming Disabled
Protective Public Schools University Exec. & Elected General
With W/O Age SS SS Male Female Male Female Male Female Male Female20 0.01% 0.04% 0.01% 0.01% 0.01% 0.01% 0.00% 0.00% 0.01% 0.01%25 0.01 0.04 0.01 0.01 0.01 0.01 0.00 0.00 0.01 0.0130 0.01 0.04 0.01 0.01 0.01 0.01 0.00 0.00 0.01 0.0335 0.02 0.04 0.01 0.01 0.01 0.03 0.01 0.01 0.01 0.0440 0.03 0.07 0.02 0.02 0.01 0.04 0.01 0.01 0.04 0.0545 0.05 0.13 0.04 0.06 0.02 0.04 0.01 0.01 0.07 0.0750 0.08 0.74 0.11 0.12 0.04 0.07 0.02 0.02 0.15 0.1155 1.21 0.54 0.21 0.17 0.11 0.10 0.09 0.09 0.29 0.2060 2.04 0.16 0.34 0.25 0.14 0.15 0.11 0.11 0.51 0.29

2014 COMPREHENSIVE ANNUAL FINANCIAL REPORT 133
Summary of Member Valuation Data
General Participants & Teachers
Valuation Participating Active Annual Payroll Annual % IncreaseDate Employers Participants (in millions $) Average Pay In Average Pay 12/31/05 1,376 237,501 9,661.1 40,678.00 2.3%12/31/06 1,392 236,877 9,933.5 41,935.00 3.1%12/31/07 1,404 237,124 10,277.9 43,344.00 3.4%12/31/08 1,431 238,994 10,806.3 45,216.00 4.3%12/31/09 1,438 240,401 11,098.1 46,165.00 2.1%12/31/10 1,444 239,959 11,195.4 46,655.00 1.1%12/31/11 1,450 232,518 10,947.0 47,080.00 0.9%12/31/12 1,450 231,765 11,041.0 47,639.00 1.2%12/31/13 1,450 231,973 11,270.0 48,584.00 2.0%12/31/14 1,454 232,433 11,574.0 49,794.00 2.5%
Executive Group & Elected Officials
Valuation Participating Active Annual Payroll Annual % IncreaseDate Employers Participants (in millions $) Average Pay In Average Pay 12/31/05 275 1,452 89.7 61,788 2.3%12/31/06 272 1,436 92.6 64,480 4.4%12/31/07 270 1,427 94.6 66,320 2.9%12/31/08 259 1,430 100.6 70,316 6.0%12/31/09 258 1,427 101.0 70,786 0.7%12/31/10 254 1,418 101.2 71,394 0.9%12/31/11 257 1,393 98.6 70,802 -0.8%12/31/12 249 1,408 104.1 73,968 4.5%12/31/13 249 1,397 106.0 76,125 2.9%12/31/14 251 1,401 109.0 77,998 2.5%
Protective with Social Security
Valuation Participating Active Annual Payroll Annual % IncreaseDate Employers Participants (in millions $) Average Pay In Average Pay 12/31/05 495 19,036 920.0 48,330 2.3%12/31/06 502 19,297 976.9 50,622 4.7%12/31/07 508 19,757 1,035.6 52,419 3.5%12/31/08 509 20,038 1,099.3 54,859 4.7%12/31/09 509 20,205 1,124.1 55,636 1.4%12/31/10 510 20,019 1,124.7 56,184 1.0%12/31/11 510 19,610 1,119.0 57,065 1.6%12/31/12 508 19,353 1,105.1 57,104 0.1%12/31/13 506 19,290 1,121.0 58,127 1.8%12/31/14 502 19,533 1,151.0 58,916 1.4%
ACTUARIAL
Disability Rates% of Active Participants Becoming Disabled
Protective Public Schools University Exec. & Elected General
With W/O Age SS SS Male Female Male Female Male Female Male Female20 0.01% 0.04% 0.01% 0.01% 0.01% 0.01% 0.00% 0.00% 0.01% 0.01%25 0.01 0.04 0.01 0.01 0.01 0.01 0.00 0.00 0.01 0.0130 0.01 0.04 0.01 0.01 0.01 0.01 0.00 0.00 0.01 0.0335 0.02 0.04 0.01 0.01 0.01 0.03 0.01 0.01 0.01 0.0440 0.03 0.07 0.02 0.02 0.01 0.04 0.01 0.01 0.04 0.0545 0.05 0.13 0.04 0.06 0.02 0.04 0.01 0.01 0.07 0.0750 0.08 0.74 0.11 0.12 0.04 0.07 0.02 0.02 0.15 0.1155 1.21 0.54 0.21 0.17 0.11 0.10 0.09 0.09 0.29 0.2060 2.04 0.16 0.34 0.25 0.14 0.15 0.11 0.11 0.51 0.29
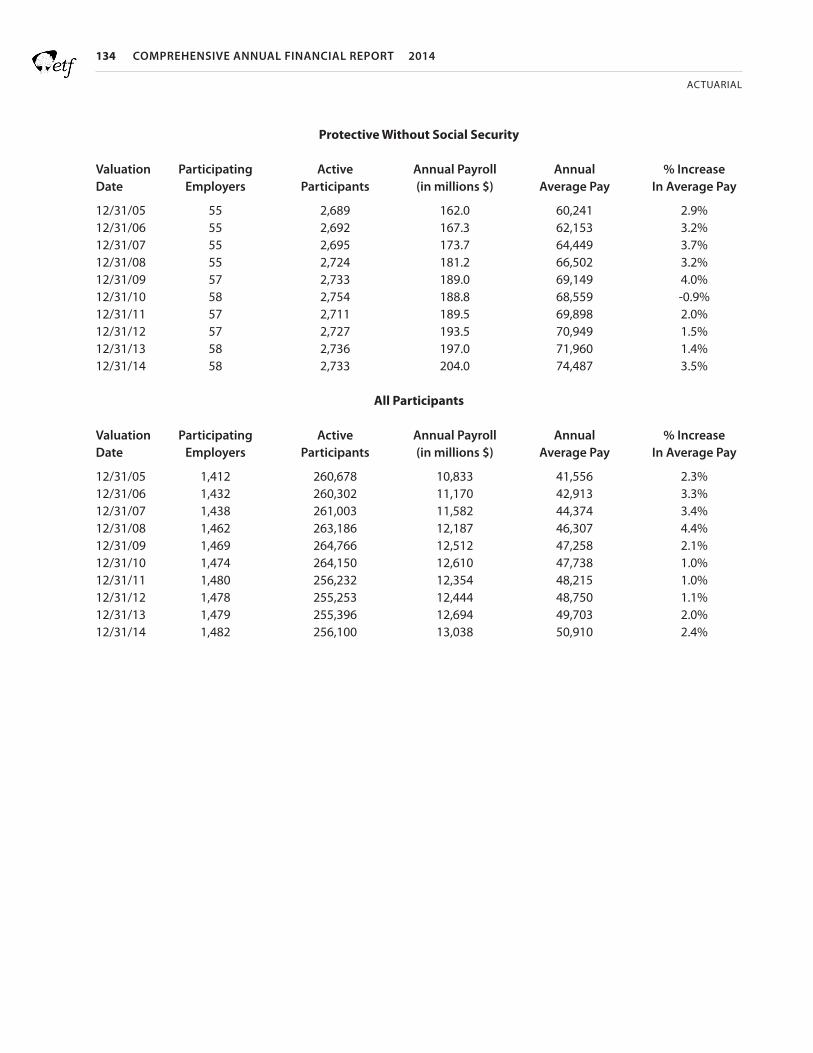
134 COMPREHENSIVE ANNUAL FINANCIAL REPORT 2014
ACTUARIAL
Protective Without Social Security Valuation Participating Active Annual Payroll Annual % IncreaseDate Employers Participants (in millions $) Average Pay In Average Pay 12/31/05 55 2,689 162.0 60,241 2.9%12/31/06 55 2,692 167.3 62,153 3.2%12/31/07 55 2,695 173.7 64,449 3.7%12/31/08 55 2,724 181.2 66,502 3.2%12/31/09 57 2,733 189.0 69,149 4.0%12/31/10 58 2,754 188.8 68,559 -0.9%12/31/11 57 2,711 189.5 69,898 2.0%12/31/12 57 2,727 193.5 70,949 1.5%12/31/13 58 2,736 197.0 71,960 1.4%12/31/14 58 2,733 204.0 74,487 3.5%
All Participants Valuation Participating Active Annual Payroll Annual % IncreaseDate Employers Participants (in millions $) Average Pay In Average Pay 12/31/05 1,412 260,678 10,833 41,556 2.3%12/31/06 1,432 260,302 11,170 42,913 3.3%12/31/07 1,438 261,003 11,582 44,374 3.4%12/31/08 1,462 263,186 12,187 46,307 4.4%12/31/09 1,469 264,766 12,512 47,258 2.1%12/31/10 1,474 264,150 12,610 47,738 1.0%12/31/11 1,480 256,232 12,354 48,215 1.0%12/31/12 1,478 255,253 12,444 48,750 1.1%12/31/13 1,479 255,396 12,694 49,703 2.0%12/31/14 1,482 256,100 13,038 50,910 2.4%

2014 COMPREHENSIVE ANNUAL FINANCIAL REPORT 135
ACTUARIAL
Summary of Accrued and Unfunded Accrued Liabilities($ In Millions)
Assets as Annual UAL as a Aggregate a % of Unfunded Active % of AnnualValuation Accrued Valuation Accrued Accrued Member ActiveYear Liabilities Assets Liabilities Liabilities Payroll Member Payroll 2005 68,987.5 68,615.1 99.5% 372.4 10,973.4 3.4%2006 73,735.8 73,415.3 99.6% 320.5 11,308.2 2.8%2007 80,079.7 79,791.9 99.6% 287.8 11,720.2 2.5%2008 77,412.0 77,159.4 99.7% 252.6 12,289.6 2.1%2009 79,104.6 78,911.3 99.8% 193.3 12,622.2 1.5%2010 80,758.8 80,626.9 99.8% 131.9 12,744.0 1.0%2011 76,565.2 76,465.9 99.9% 99.3 12,855.6 0.8%2012 78,682.7 78,613.0 99.9% 69.7 12,627.6 0.6%2013 85,328.7 85,276.1 99.9% 52.6 12,884.8 0.4%2014 89,392.1 89,360.4 100.0% 31.7 13,219.5 0.2%
Solvency Test($ In Millions)
Accrued Liability For Percent Funded Annuitants Active Annuitants ActiveValuation Valuation and Member Employer’s and Member Employer’sYear Assets Beneficiaries Contrib. Contrib. Total Beneficiaries Contrib. Contrib. Total
2005 68,615.1 32,668.0 15,155.3 21,164.2 68,987.5 100.0% 100.0% 98.2% 99.5%2006 73,415.3 35,774.7 15,902.4 22,058.7 73,735.8 100.0% 100.0% 98.5% 99.6%2007 79,791.9 39,675.1 16,795.4 23,609.2 80,079.7 100.0% 100.0% 98.8% 99.6%2008 77,159.4 38,372.6 16,045.3 22,994.1 77,412.0 100.0% 100.0% 98.9% 99.7%2009 78,911.3 39,734.2 16,156.6 23,213.8 79,104.6 100.0% 100.0% 99.2% 99.8%2010 80,626.9 41,139.0 16,253.6 23,366.2 80,758.8 100.0% 100.0% 99.4% 99.8%2011 76,465.9 41,135.3 14,434.4 20,995.5 76,565.2 100.0% 100.0% 99.5% 99.9%2012 78,613.0 44,055.5 14,401.1 20,226.1 78,682.7 100.0% 100.0% 99.7% 99.9%2013 85,276.1 48,460.5 15,559.2 21,309.0 85,328.7 100.0% 100.0% 99.8% 99.9%2014 89,360.4 51,131.1 16,259.3 22,001.7 89,392.1 100.0% 100.0% 99.9% 100.0%

136 COMPREHENSIVE ANNUAL FINANCIAL REPORT 2014
ACTUARIAL
Wisconsin Retirement System Contribution RatesNotes to Contribution Rate Schedule
1. Prior to June 28, 2011 the employee contribution rate was set by Wis. Stats. § 40.05 (1) and part or all of the required employee contributions could be paid by the employer on behalf of the employee. Effective June 28, 2011 the employee contribution rate for general and executive/elected category employees is equal to one half the total required contributions, and the protective category employee contribution rate is equal to the general category rate. Employers may not pay the employee contribution on their behalf unless provided for by an existing collective bargaining agreement.
2. The unfunded liability was recalculated in 1990 to reflect benefit improvements and is being amortized on a level percentage of salary basis over a period of 40 years beginning January 1, 1990, for the employers in the WRS prior to 2009, or on the effective date of the employer’s participation, whichever is later. Liabilities for employers joining the WRS beginning in 2009 are amortized over 30 years. Prior service rates vary by employers. The percentage reported represents a weighted average.
General Participants & Teachers
Current Prior Employer Cost Cost Total Employee BAC Total
2005 4.4% 0.3% 4.7% 5.0% 0.8% 10.5%2006 4.5% 0.2% 4.7% 5.0% 0.9% 10.6%2007 4.6% 0.2% 4.8% 5.0% 1.0% 10.8%2008 4.6% 0.2% 4.8% 5.0% 1.0% 10.8%2009 4.5% 0.2% 4.7% 5.0% 0.9% 10.6%2010 4.8% 0.2% 5.0% 5.0% 1.2% 11.2%2011 5.1% 0.1% 5.2% 5.0% 1.5% 11.7%2011* 5.8% 0.1% 5.9% 5.8% 0.0% 11.7%2012 5.9% 0.1% 6.0% 5.9% 0.0% 11.9%2013 6.65% 0.1% 6.75% 6.65% 0.0% 13.4%2014 7.0% 0.0% 7.0% 7.0% 0.0% 14.0%
Executive Group and Elected Officials
Current Prior Employer Cost Cost Total Employee BAC Total
2005 8.3% 0.1% 8.4% 2.8% 0.0% 11.2%2006 8.4% 0.1% 8.5% 2.9% 0.0% 11.4%2007 8.5% 0.1% 8.6% 3.0% 0.0% 11.6%2008 8.5% 0.1% 8.6% 3.0% 0.0% 11.6%2009 8.5% 0.0% 8.5% 3.0% 0.0% 11.5%2010 8.7% 0.0% 8.7% 3.2% 0.0% 11.9%2011 9.4% 0.0% 9.4% 3.9% 0.0% 13.3%2011* 6.65% 0.0% 6.65% 6.65% 0.0% 13.3%2012 7.05% 0.0% 7.05% 7.05% 0.0% 14.1%2013 7.00% 0.0% 7.00% 7.00% 0.0% 14.0%2014 7.75% 0.0% 7.75% 7.75% 0.0% 15.5%
*2011 WI Act 10 adjusted employee and employer contribution rates effective June 28, 2011 .

2014 COMPREHENSIVE ANNUAL FINANCIAL REPORT 137
ACTUARIAL
Protective with Social Security
Current Prior Duty Employer Cost Cost Disability Total Employee BAC Total
2005 8.0% 0.1% 3.8% 11.9% 4.9% 0.0% 16.8%2006 8.1% 0.1% 3.8% 12.0% 5.0% 0.0% 17.0%2007 8.2% 0.1% 3.9% 12.2% 5.1% 0.0% 17.3%2008 8.2% 0.1% 3.9% 12.2% 5.1% 0.0% 17.3%2009 8.1% 0.1% 3.9% 12.1% 5.0% 0.0% 17.1%2010 8.6% 0.0% 3.9% 12.5% 5.5% 0.0% 18.0%2011 8.9% 0.0% 4.0% 12.9% 5.8% 0.0% 18.7%2011* 8.9% 0.0% 4.0% 12.9% 5.8% 0.0% 18.7%2012 9.0% 0.0% 4.0% 13.0% 5.9% 0.0% 18.9%2013 9.75% 0.0% 4.1% 13.9% 6.65% 0.0% 20.5%2014 10.1% 0.0% 0.7% 10.8% 7.0% 0.0% 17.8%
Protective without Social Security
Current Prior Duty Employer Cost Cost Disability Total Employee BAC Total
2005 10.7% 0.6% 3.8% 15.1% 3.3% 0.0% 18.4%2006 10.7% 0.4% 3.8% 14.9% 3.3% 0.0% 18.2%2007 10.8% 0.4% 3.9% 15.1% 3.4% 0.0% 18.5%2008 10.8% 0.4% 3.9% 15.1% 3.4% 0.0% 18.5%2009 10.6% 0.3% 3.9% 14.8% 3.2% 0.0% 18.0%2010 11.3% 0.3% 3.9% 15.5% 3.9% 0.0% 19.4%2011 12.2% 0.3% 4.0% 16.5% 4.8% 0.0% 21.3%2011* 11.2% 0.3% 4.0% 15.5% 5.8% 0.0% 21.3%2012 11.3% 0.3% 4.0% 15.6% 5.9% 0.0% 21.5%2013 12.35% 0.3% 4.1% 16.75% 6.65% 0.0% 23.4%2014 13.7% 0.3% 0.7% 14.7% 7.00% 0.0% 21.7%
*2011 WI Act 10 adjusted employee and employer contribution rates effective June 28, 2011 .
Wisconsin Retirement System Contribution Rates

138 COMPREHENSIVE ANNUAL FINANCIAL REPORT 2014
ACTUARIAL
Analysis of Actuarial ExperienceGains and Losses in Accrued Liabilities during 2014 Resulting from Differences between Assumed Experience & Actual Experience($ in millions) Protective Protective Occupation Occupation Executive With Social WithoutType of Activity General & Elected Security Social Security Total
Normal RetirementIf members retire at older ages or with lower final average pay assumed, there is a gain. If younger ages or higher pay, there is a loss. $ (4.7) $ 1.2 $ (6.5) $ (0.4) $ (10.4)
Early RetirementIf fewer members choose early retirement than assumed, there is a loss. If more early retirements, there is a gain. (20.8) 0.6 0.4 0.1 (19.7)
Death with Benefit If survivor claims are less than assumed, there is a gain. If moreclaims, there is a loss. (0.1) 0.0 0.4 (0.1) 0.2
Disability Retirement If disability claims are less than assumed, there is a gain. If more claims, a loss. 18.1 0.1 1.5 0.6 20.3
Other SeparationsIf more liabilities are released byseparations than assumed, there is a gain. If smaller releases, a loss. 24.6 (0.7) (0.1) (0.6) 23.2
Salary IncreasesIf there are smaller pay increasesthan assumed, there is a gain. If greater increases, a loss. 14.5 (0.7) 13.0 (3.3) 23.5
Investment ReturnIf there is greater investmentincome than assumed, there is a gain. If less income, a loss. 269.0 2.1 42.6 11.8 325.5
Other (111.0) (6.4) (14.9) (7.4) (139.7)
Total Gain (Loss) $ 189.6 $ (3.8) $ 36.4 $ 0.7 $ 222.9
% of accrued liability 0.6% (1.6)% 0.9% 0.1% 0.6%

2014 COMPREHENSIVE ANNUAL FINANCIAL REPORT 139
Year Annuity Type Beginning Additions Deletions Ending
2014 Retirement 172,430 9,080 3,551 177,959 Disability 6,393 125 155 6,363 Beneficiary 1,233 69 19 1,283 Total 180,056 9,274 3,725 185,605
2013 Retirement 165,966 9,889 3,425 172,430 Disability 6,473 146 226 6,393 Beneficiary 1,216 70 53 1,233 Total 173,655 10,105 3,704 180,056
2012 Retirement 160,044 9,322 3,400 165,966 Disability 6,201 183 (89) 6,473 Beneficiary 1,208 67 59 1,216 Total 167,453 9,572 3,370 173,655
2011 Retirement 148,380 15,096 3,432 160,044 Disability 6,194 196 189 6,201 Beneficiary 1,201 60 53 1,208 Total 155,775 15,352 3,674 167,453
2010 Retirement 143,261 8,330 3,211 148,380 Disability 6,224 159 189 6,194 Beneficiary 1,186 69 54 1,201 Total 150,671 8,558 3,454 155,775
2009 Retirement 136,502 7,779 1,020 143,261 Disability 6,397 156 329 6,224 Beneficiary 1,134 73 21 1,186 Total 144,033 8,008 1,370 150,671
2008 Retirement 135,026 8,165 6,689 136,502 Disability 6,558 174 335 6,397 Beneficiary 1,322 61 249 1,134 Total 142,906 8,400 7,273 144,033
2007 Retirement 129,289 8,186 2,449 135,026 Disability 6,505 157 104 6,558 Beneficiary 1,323 47 48 1,322 Total 137,117 8,390 2,601 142,906
2006 Retirement 123,945 7,859 2,515 129,289 Disability 6,415 163 73 6,505 Beneficiary 1,314 43 34 1,323 Total 131,674 8,065 2,622 137,117
2005 Retirement 118,572 7,844 2,471 123,945 Disability 6,346 150 81 6,415 Beneficiary 1,293 58 37 1,314 Total 126,211 8,052 2,589 131,674
ACTUARIAL
Wisconsin Retirement SystemChanges in Number of Annuities

This page intentionally left blank

State of WisconsinDepartment of Employee Trust Funds
INVESTMENTS

142 COMPREHENSIVE ANNUAL FINANCIAL REPORT 2014
INVESTMENTS
Vice Chair: Thomas Boldt (Public Member)President, The Boldt Group, Inc. /CEO, The Boldt Co., Appleton
Norman Cummings (Local Government Member) Waukesha County Director of Administration, Waukesha
William Levit, Jr. (Public Member) Attorney, Godfrey & Kahn S.C., Milwaukee
Bruce Colburn (Public Member) Director, Central States Property Services Division, Services Employees International Union, Milwaukee County
David Stein (Public Member) Executive Vice President and Head of Retail Banking, Associated Banc-Corp, Madison
2. Two participants in the WRS, one must be a teacher member appointed by the Teachers Retirement Board; the other must be a non-teacher participant appointed by the Wisconsin Retirement Board.
Sandra Claflin-Chalton (WRS participant, Teachers Retirement Board appointee) Senior Lecturer-Economics, University of Wisconsin-Stout, Department of Social Science
Robert J. Conlin (WRS participant, Wisconsin Retirement Board appointee)Secretary, Department of Employee Trust Funds
3. The Secretary of the Wisconsin Department of Administration (DOA) or designee.
Michael HuebschSecretary, DOA
The State of Wisconsin Investment Board (SWIB) is the state agency that invests the assets of the Wisconsin Retirement System (WRS) and other trust funds established by the State of Wisconsin. The WRS Trust Funds make up about 93% of the assets managed by SWIB. The effect of investment returns on WRS participants, determined by the Department of Employee Trust Funds, is based on the rate of return as of December 31, 2014.
SWIB publishes an annual report and a schedule of investments that includes all investment holdings as of the end of the calendaryear. To view these publications online, go to http://www.swib.state.wi.us or call (608) 266-3281 to request paper copies.
Board of Trustees
SWIB is directed by an independent Board of Trustees and staffed with professional money managers and support personnel. The SWIB Board of Trustees consists of nine members meeting specific membership requirements, as directed by Wis. Stat. § 15.76. The Board of Trustees appoints the SWIB executive director. The executive director oversees the staff, develops and recommends agency and investment policies for board adoption, and ensures adherence to state and federal law and policies. Trustee responsibilities include establishing asset allocation, investment guidelines, and performance benchmarks.
Membership on the Board of Trustees as of December 31, 2014 is as follows:
1. Six public members appointed by the governor, four of whom must have at least 10 years investment experience and one of whom must have at least 10 years of financial experience and be employed by a local government active in the Local Government Investment Pool, a fund managed by SWIB.
Chair: Lon Roberts (Public Member)Attorney, Ruder Ware, Wausau
Investments

State of WisconsinDepartment of Employee Trust Funds
CONTRIBUTIONS PAID AND EMPLOYER UNFUNDED LIABILIT Y BALANCES

144 COMPREHENSIVE ANNUAL FINANCIAL REPORT 2014
CONTRIBUTIONS PAID AND UAAL
State Agencies Administration, Dept Of 57,883,272 4,988,067 4,066,793 9,054,861 0 Agric Trade Cons Prot, Dept Of 30,563,378 2,575,444 2,147,555 4,722,999 0 Bd For People With Develop Dis 394,489 33,137 27,614 60,751 0 Board Aging & Long Term Care 1,589,091 133,484 111,236 244,720 0 Brd Of Commsrs Of Public Lands 706,845 59,375 49,479 108,854 0 Children & Families, Dept Of 39,271,654 3,305,498 2,755,688 6,061,185 0 Corrections, Dept. Of 490,002,751 51,373,838 34,315,294 85,689,132 0 Courts - State 69,052,287 6,066,502 5,099,487 11,165,989 0 District Attorneys 32,435,442 2,779,889 2,325,502 5,105,391 0 Educational Communications Bd 3,063,769 261,275 218,384 479,659 0 Employee Trust Funds, Dept Of 14,932,362 1,257,117 1,048,016 2,305,133 0 Employment Relations Comm 788,233 68,070 57,035 125,104 0 Employment Relations,Office Of 2,926,393 250,085 209,117 459,202 0 Executive Office 2,036,692 172,161 143,648 315,809 0 Financial Institutions, Dept 8,452,526 716,161 597,824 1,313,985 0 Government Accountability Bd 1,881,888 160,707 134,360 295,068 0 Health Services, Dept Of 299,302,321 26,506,102 20,960,115 47,466,217 0 Higher Educational Aids Board 502,018 42,700 35,672 78,372 0 Historical Society - State 8,883,663 752,513 626,947 1,379,460 0 Insurance Commissionr’S Office 9,723,693 820,154 684,025 1,504,179 0 Investment Board 26,236,772 2,243,557 1,876,240 4,119,798 0 Judicial Commission 126,499 11,240 9,469 20,709 0 Judicial Council 59,214 4,974 4,145 9,119 0 Justice, Dept Of 38,962,797 3,545,455 2,735,460 6,280,915 0 Legis Assembly - Chief Clerk 13,849,533 1,200,212 1,006,322 2,206,534 0 Legis Assembly-Sgt At Arms 404,423 34,517 28,855 63,372 0 Legislative Audit Bureau 4,628,303 389,643 324,848 714,491 0 Legislative Council Staff 2,045,404 167,449 149,462 316,911 0 Legislative Fiscal Bureau 2,440,217 206,027 171,864 377,891 0 Legislative Reference Bureau 3,474,288 292,786 244,146 536,933 0 Legislative Tech Serv Bureau 2,485,114 209,596 174,804 384,400 0 Legislature - Senate 9,267,884 791,681 661,931 1,453,612 0 Lieutenant Governor’S Office 193,004 17,269 14,567 31,837 0 Lower Wis. State Riverway Bd. 113,561 9,539 7,949 17,488 0 Military Affairs, Dept Of 20,412,573 1,929,018 1,432,677 3,361,695 0 Natural Resources, Dept Of 147,893,249 13,558,687 10,361,431 23,920,118 0 Public Defender’S Office 35,508,397 2,985,076 2,487,975 5,473,051 0 Public Instruction, Dept Of 35,007,514 2,947,803 2,457,163 5,404,966 0 Public Service Commission 9,421,746 801,996 670,092 1,472,088 0 Revenue, Dept Of 56,155,128 4,743,771 3,937,121 8,680,892 0 Safety & Profess Svces, Dept 12,534,810 1,059,940 884,448 1,944,389 0 Secretary Of State’S Office 199,620 17,576 14,782 32,358 0 State Fair Park Board 3,709,460 316,445 260,543 576,987 0 Tourism, Department Of 1,764,763 150,902 126,194 277,096 0 Transportation, Dept Of 195,387,374 18,804,621 12,445,267 31,249,888 0 Treasurer’S Office - State 237,655 21,063 17,736 38,799 0 Veterans Affairs, Dept Of 56,189,117 4,737,779 3,937,481 8,675,260 0 Wis Tech College Sys Board 3,872,635 329,260 275,042 604,302 0 Workforce Development, Dept Of 82,531,758 6,943,856 5,788,321 12,732,177 0 Total State Agencies (49) 1,839,505,581 170,794,017 128,120,129 298,914,145 0 University Of Wisconsin System 1,896,092,723 159,591,227 132,990,050 292,581,278 0 Public Authorities 0 0 0 0 0 Fox River Navigation Sys Auth 155,972 13,105 10,914 24,020 0 Health & Educ Facilities Auth 286,280 49,526 0 49,526 0 Hlth Ins Risk-Sharng Plan Auth 84,731 5,931 5,931 11,862 0 Housing & Econ Develop Auth 9,908,979 832,353 693,629 1,525,983 0 UW Hospital Authority 448,397,207 59,122,062 16,657,066 75,779,128 1,741,362 Wisconsin Econ Develop Corp 6,574,065 460,184 460,185 920,369 0 Wiscraft Inc - Ent For Blind 1,710,585 196,717 119,741 316,458 544,426 Total State Of Wisconsin (57) 4,202,716,123 391,065,124 279,057,646 670,122,769 2,285,788
Contributions UnfundedName Covered Payroll Employer Paid* Employee Paid Total Liability Balance

2014 COMPREHENSIVE ANNUAL FINANCIAL REPORT 145
CONTRIBUTIONS PAID AND UAAL
Cities Abbotsford City Of 454,874 31,841 31,841 63,682 0 Adams, City Of 690,969 75,984 34,292 110,276 77,602 Algoma, City Of 3,511,694 261,602 237,769 499,371 0 Alma, City Of 279,538 21,866 19,568 41,434 36,542 Altoona, City Of 1,986,523 165,424 138,901 304,325 0 Amery, City Of 1,182,104 116,795 63,365 180,160 4,835 Antigo, City Of 4,095,553 486,889 191,535 678,424 0 Appleton, City Of 39,160,783 4,184,492 2,113,248 6,297,740 0 Arcadia, City Of 229,624 34,271 7,313 41,585 0 Ashland, City Of 5,094,425 583,700 260,288 843,988 0 Augusta, City Of 554,842 58,418 26,606 85,023 0 Baraboo, City Of 5,317,046 539,162 264,896 804,058 0 Barron, City Of 1,550,278 139,303 89,376 228,680 0 Bayfield, City Of 593,121 46,012 41,510 87,523 0 Beaver Dam, City Of 6,775,600 776,249 432,869 1,209,118 2,234,528 Beloit, City Of 23,641,399 2,338,470 1,654,148 3,992,619 0 Berlin, City Of 2,136,477 226,801 97,106 323,907 0 Black River Falls, City Of 2,333,340 195,926 149,964 345,890 0 Blair, City Of 381,212 29,915 26,647 56,562 0 Bloomer, City Of 317,295 50,687 4,236 54,924 0 Boscobel, City Of 1,316,413 102,675 92,149 194,824 0 Brillion, City Of 971,275 83,067 67,971 151,038 0 Brodhead, City Of 1,475,391 138,995 82,258 221,254 0 Brookfield, City Of 22,116,948 2,421,637 1,265,947 3,687,584 0 Buffalo City, City Of 51,069 3,576 3,574 7,150 0 Burlington, City Of 4,351,295 532,780 144,979 677,759 0 Cedarburg, City Of 5,899,895 481,142 398,715 879,857 0 Chetek, City Of 295,384 51,131 0 51,131 0 Chilton, City Of 1,131,992 143,652 26,717 170,370 0 Chippewa Falls, City Of 6,345,276 783,578 271,349 1,054,927 0 Clintonville, City Of 2,505,340 246,921 175,368 422,289 1,129,125 Colby, City Of 368,205 25,774 25,774 51,549 0 Columbus, City Of 2,409,212 211,489 145,582 357,071 0 Cornell, City Of 573,852 43,495 40,170 83,665 0 Crandon, City Of 664,217 58,747 40,167 98,914 0 Cuba City, City Of 616,301 47,525 43,141 90,667 0 Cudahy, City Of 8,367,637 954,099 462,450 1,416,549 0 Cumberland, City Of 850,860 76,003 50,442 126,444 0 Darlington, City Of 894,986 78,900 54,757 133,657 0 De Pere, City Of 9,073,681 987,890 507,911 1,495,801 0 Delafield, City Of 2,583,288 221,830 177,278 399,108 0 Delavan, City Of 3,499,089 362,971 174,626 537,596 0 Dodgeville, City Of 1,515,979 138,462 88,935 227,397 0 Durand, City Of 549,681 43,377 38,397 81,775 0 Eagle River, City Of 1,457,560 113,592 101,912 215,505 0 Eau Claire, City Of 31,639,758 2,953,460 2,217,961 5,171,421 0 Edgerton, City Of 1,628,436 148,007 99,310 247,317 0 Elkhorn, City Of 3,523,912 322,051 210,421 532,472 0 Elroy, City Of 714,930 54,570 50,045 104,615 0 Evansville, City Of 2,109,101 188,209 128,086 316,294 0 Fennimore, City Of 1,138,369 88,277 79,544 167,821 0 Fitchburg, City Of 10,010,948 975,960 583,385 1,559,345 0 Fond Du Lac, City Of 20,528,426 2,558,826 959,658 3,518,485 0 Fort Atkinson, City Of 4,396,943 461,934 266,789 728,724 1,353,251 Fountain City, City Of 180,430 14,027 12,520 26,547 0 Fox Lake, City Of 461,994 44,288 28,879 73,167 79,854 Franklin, City Of 8,071,472 904,351 553,357 1,457,708 0 Galesville, City Of 372,386 29,574 26,067 55,641 0 Gillett, City Of 579,462 49,732 40,562 90,295 8,424 Glendale, City Of 4,892,989 585,679 282,908 868,587 0 Glenwood, City Of 101,493 17,568 0 17,568 0 Green Bay, City Of 56,402,361 5,525,732 3,949,658 9,475,390 0 Green Lake, City Of 539,160 54,336 26,662 80,997 0 Greenfield, City Of 14,960,517 1,400,352 1,048,126 2,448,478 0 Greenwood, City Of 473,293 48,006 23,031 71,037 0 Hartford, City Of 6,743,792 645,385 360,752 1,006,137 0
Contributions UnfundedName Covered Payroll Employer Paid* Employee Paid Total Liability Balance

146 COMPREHENSIVE ANNUAL FINANCIAL REPORT 2014
CONTRIBUTIONS PAID AND UAAL
Hayward, City Of 841,257 72,380 58,889 131,269 0 Hillsboro, City Of 553,332 43,013 38,733 81,746 0 Horicon, City Of 1,195,012 100,263 80,733 180,996 0 Hudson, City Of 4,775,480 486,206 233,223 719,429 0 Hurley, City Of 953,327 90,706 54,845 145,551 0 Independence, City Of 350,360 30,332 24,525 54,857 16,260 Janesville, City Of 29,934,378 2,954,108 2,041,587 4,995,695 0 Jefferson, City Of 3,763,866 292,552 263,470 556,021 0 Juneau, City Of 1,027,258 89,035 61,288 150,323 0 Kaukauna, City Of 10,905,307 918,045 765,087 1,683,132 0 Kenosha, City Of 50,741,034 6,110,928 2,508,977 8,619,905 0 Kewaunee, City Of 954,174 116,263 44,443 160,705 469,165 Kiel, City Of 1,788,636 152,865 114,787 267,652 0 La Crosse, City Of 29,513,033 3,176,327 1,638,798 4,815,125 0 Ladysmith, City Of 1,786,575 160,913 106,407 267,321 0 Lake Geneva, City Of 4,508,233 495,377 193,998 689,374 0 Lake Mills, City Of 2,940,765 284,965 205,853 490,818 119,555 Lancaster, City Of 1,335,241 107,417 92,037 199,454 0 Lodi, City Of 1,225,375 94,564 85,613 180,176 0 Loyal, City Of 343,926 30,240 24,075 54,314 11,662 Madison, City Of 180,555,530 16,309,082 12,642,631 28,951,713 0 Manawa, City Of 565,799 58,214 33,515 91,729 96,081 Manitowoc, City Of 21,308,496 2,215,930 1,218,573 3,434,503 0 Marinette, City Of 5,391,970 660,778 222,301 883,079 0 Marion, City Of 115,179 12,336 8,063 20,398 9,081 Markesan, City Of 420,724 37,084 29,451 66,535 44,154 Marshfield, City Of 10,834,459 1,212,226 624,192 1,836,418 0 Mauston, City Of 1,461,840 181,810 38,977 220,787 47,032 Mayville, City Of 1,652,994 132,429 113,911 246,341 0 Medford, City Of 2,098,523 165,344 146,716 312,059 0 Mellen, City Of 320,631 24,970 22,444 47,414 0 Menasha, City Of 8,665,694 875,500 605,033 1,480,533 0 Menomonie, City Of 7,085,987 942,691 285,522 1,228,213 0 Mequon, City Of 7,251,806 637,287 489,861 1,127,148 0 Merrill, City Of 6,308,015 674,514 372,522 1,047,036 0 Middleton, City Of 9,162,017 761,533 640,720 1,402,253 0 Milton, City Of 1,754,899 163,776 100,188 263,964 0 Mineral Point, City Of 664,441 68,402 33,872 102,274 6,124 Mondovi, City Of 816,150 64,306 57,130 121,436 0 Monona, City Of 3,945,874 383,951 234,063 618,014 0 Monroe, City Of 4,901,508 482,715 261,256 743,970 0 Montello, City Of 339,869 29,104 23,791 52,895 48,319 Montreal, City Of 142,707 26,829 9,989 36,818 586,211 Mosinee, City Of 1,121,942 105,631 66,530 172,161 0 Muskego, City Of 7,320,021 630,718 512,900 1,143,618 0 Neenah, City Of 13,691,283 1,310,568 955,792 2,266,360 0 Neillsville, City Of 1,008,743 93,322 58,482 151,804 0 Nekoosa, City Of 1,269,102 123,820 66,411 190,232 0 New Berlin, City Of 15,084,689 1,493,080 941,651 2,434,731 0 New Holstein, City Of 1,791,384 139,626 123,148 262,775 0 New Lisbon, City Of 774,222 61,427 53,146 114,573 0 New London, City Of 4,187,310 332,734 293,112 625,846 0 New Richmond, City Of 4,111,276 382,141 261,999 644,140 167,205 Niagara, City Of 685,089 71,126 32,225 103,351 0 Oak Creek, City Of 17,775,702 1,674,231 1,244,137 2,918,369 0 Oconomowoc, City Of 7,751,645 691,325 471,110 1,162,435 0 Oconto Falls, City Of 1,387,526 112,154 93,128 205,282 0 Oconto, City Of 2,044,068 250,499 87,057 337,556 0 Omro, City Of 1,107,813 111,218 56,211 167,429 0 Onalaska, City Of 5,070,926 570,454 237,323 807,777 0 Oshkosh, City Of 34,551,515 3,217,198 2,418,621 5,635,819 0 Osseo, City Of 593,641 48,133 41,555 89,688 0 Owen, City Of 423,082 34,130 29,616 63,746 0 Park Falls, City Of 1,209,958 96,675 84,697 181,372 0 Peshtigo, City Of 329,410 53,389 3,631 57,021 0 Phillips, City Of 827,289 99,990 37,963 137,953 49,700 Pittsville, City Of 71,523 7,374 5,007 12,381 0
Contributions UnfundedName Covered Payroll Employer Paid* Employee Paid Total Liability Balance

2014 COMPREHENSIVE ANNUAL FINANCIAL REPORT 147
CONTRIBUTIONS PAID AND UAAL
Platteville, City Of 4,080,595 322,391 285,642 608,033 0 Plymouth, City Of 3,807,620 360,025 207,666 567,691 0 Port Washington, City Of 4,782,327 392,238 334,985 727,222 0 Portage, City Of 4,085,943 429,839 215,998 645,838 0 Prairie Du Chien, City Of 1,836,757 194,278 85,155 279,434 0 Prescott, City Of 1,375,745 117,054 92,765 209,819 0 Princeton, City Of 503,951 41,110 35,277 76,386 0 Racine, City Of 49,050,285 7,407,535 1,021,753 8,429,288 0 Reedsburg, City Of 4,956,357 385,555 346,922 732,476 0 Rhinelander, City Of 5,876,759 569,867 391,367 961,234 0 Rice Lake, City Of 5,013,726 514,351 293,727 808,078 0 Richland Center, City Of 2,410,225 188,900 168,716 357,616 0 Ripon, City Of 2,755,563 257,016 156,715 413,731 0 River Falls, City Of 6,109,604 512,450 391,815 904,265 0 Schofield, City Of 381,432 26,701 26,699 53,400 0 Seymour, City Of 1,191,183 100,209 75,502 175,711 0 Shawano, City Of 3,166,388 265,442 221,760 487,202 0 Sheboygan Falls, City Of 2,401,593 256,767 110,385 367,152 0 Sheboygan, City Of 26,387,532 2,531,666 1,714,327 4,245,993 0 Shell Lake, City Of 421,809 32,663 29,516 62,179 0 Shullsburg, City Of 362,415 27,198 25,369 52,567 0 South Milwaukee, City Of 9,506,242 1,155,394 639,980 1,795,374 0 Sparta, City Of 3,063,529 279,026 187,272 466,298 0 Spooner, City Of 1,330,491 126,329 70,597 196,926 0 St Croix Falls, City Of 970,204 98,594 48,514 147,109 0 St Francis, City Of 5,028,033 555,385 352,320 907,705 0 Stanley, City Of 565,815 59,945 25,807 85,752 0 Stevens Point, City Of 12,351,569 1,303,604 763,821 2,067,425 0 Stoughton, City Of 5,696,627 493,651 353,639 847,290 0 Sturgeon Bay, City Of 5,350,151 566,192 298,719 864,911 0 Sun Prairie, City Of 3,544,279 365,415 248,100 613,515 0 Superior, City Of 14,543,573 1,671,682 1,018,198 2,689,880 0 Thorp, City Of 483,938 39,096 33,497 72,593 0 Tomah, City Of 3,889,332 385,712 200,485 586,197 0 Tomahawk, City Of 1,333,436 132,216 69,477 201,694 0 Two Rivers, City Of 7,273,639 923,155 457,560 1,380,715 4,179,969 Verona, City Of 4,286,287 440,443 221,388 661,832 0 Viroqua, City Of 1,678,136 221,935 114,205 336,140 1,376,720 Washburn, City Of 856,178 67,788 59,982 127,770 0 Waterloo, City Of 1,517,985 123,391 106,259 229,650 0 Watertown, City Of 9,184,102 846,441 610,300 1,456,741 0 Waukesha, City Of 35,230,655 3,785,441 2,019,952 5,805,394 0 Waupaca, City Of 2,935,377 275,174 163,411 438,586 0 Waupun, City Of 3,657,352 362,992 192,968 555,960 0 Wausau, City Of 18,179,898 1,732,852 1,273,626 3,006,477 0 Wautoma, City Of 680,299 55,886 47,603 103,489 0 Wauwatosa, City Of 28,350,192 2,786,733 1,984,264 4,770,997 0 West Allis, City Of 35,558,481 4,010,997 1,884,732 5,895,729 0 West Bend, City Of 13,505,764 1,512,010 766,353 2,278,362 0 Westby, City Of 801,973 67,008 50,520 117,528 0 Weyauwega, City Of 601,430 49,527 42,100 91,627 0 Whitehall, City Of 862,855 66,595 60,400 126,994 0 Whitewater, City Of 4,826,161 462,995 269,790 732,785 0 Wisconsin Dells, City Of 3,003,648 280,605 173,130 453,735 0 Wisconsin Rapids, City Of 14,261,723 1,271,344 1,000,505 2,271,849 0 Total Cities (188) 1,284,899,697 130,934,523 78,382,848 209,317,370 12,151,397 Villages Adell, Village Of 114,663 8,026 8,026 16,053 0 Albany, Village Of 404,876 32,996 28,341 61,337 0 Allouez, Village Of 1,752,012 122,641 122,640 245,282 0 Amherst, Village Of 231,056 16,174 16,174 32,348 0 Argyle, Village Of 256,935 23,159 14,473 37,632 0 Arlington, Village Of 120,473 10,843 8,433 19,276 0 Ashwaubenon, Village Of 7,482,338 863,897 366,283 1,230,180 0 Athens, Village Of 224,409 17,231 15,709 32,940 0 Avoca, Village Of 116,247 9,111 8,137 17,248 0
Contributions UnfundedName Covered Payroll Employer Paid* Employee Paid Total Liability Balance

148 COMPREHENSIVE ANNUAL FINANCIAL REPORT 2014
CONTRIBUTIONS PAID AND UAAL
Baldwin, Village Of 1,250,830 131,895 69,864 201,759 13,391 Balsam Lake, Village Of 330,606 27,343 23,061 50,403 11,047 Bangor, Village Of 745,888 66,559 41,578 108,137 0 Bay City, Village Of 90,516 6,336 6,336 12,672 0 Bayside, Village Of 2,849,315 246,629 185,893 432,521 0 Belgium, Village Of 315,068 22,055 22,055 44,110 0 Belleville, Village Of 773,743 67,057 48,717 115,774 0 Bellevue, Village Of (Brown) 1,784,724 138,319 124,931 263,250 0 Belmont, Village Of 279,889 21,218 19,592 40,811 0 Benton, Village Of 229,693 16,079 16,079 32,157 0 Big Bend, Village Of 360,939 47,424 10,605 58,030 0 Birchwood, Village Of 167,349 13,525 11,299 24,824 0 Birnamwood, Village Of 69,178 4,941 4,744 9,685 0 Biron, Village Of 296,482 20,754 20,754 41,508 0 Black Creek, Village Of 312,358 23,456 21,865 45,321 0 Black Earth, Village Of 243,592 17,051 17,051 34,103 0 Blanchardville, Village Of 160,618 11,243 11,243 22,487 0 Bloomfield, Village Of 980,450 81,957 68,631 150,589 0 Blue Mounds, Village Of 213,998 16,855 14,980 31,835 0 Blue River, Village Of 109,235 7,646 7,646 15,293 0 Boyceville, Village Of 307,724 29,450 21,535 50,984 26,170 Boyd, Village Of 214,938 16,340 15,046 31,386 0 Brandon, Village Of 223,480 15,644 15,644 31,287 0 Bristol, Village Of 750,600 72,764 52,542 125,306 306,549 Brooklyn, Village Of 301,622 22,614 21,113 43,727 0 Brown Deer, Village Of 4,687,391 408,371 328,117 736,488 0 Brownsville, Village Of 146,119 10,228 10,228 20,457 0 Browntown, Village Of 65,351 4,957 4,192 9,149 0 Bruce, Village Of 144,480 10,114 10,114 20,227 0 Butler, Village Of 838,206 74,849 58,321 133,170 0 Cadott, Village Of 572,869 54,556 30,289 84,844 0 Caledonia, Village Of (Racine) 8,007,763 941,024 461,514 1,402,537 0 Cambria, Village Of 208,299 14,581 14,581 29,162 0 Cambridge, Village Of 408,893 28,622 28,623 57,245 0 Cameron, Village Of 392,909 32,403 27,504 59,906 0 Camp Douglas, Village Of 112,764 7,947 7,840 15,787 0 Campbellsport, Village Of 492,059 40,523 32,029 72,552 0 Cascade, Village Of 111,990 7,839 7,839 15,679 0 Casco, Village Of 56,947 3,992 3,981 7,973 0 Cashton, Village Of 595,057 45,387 41,654 87,041 0 Cedar Grove, Village Of 355,800 25,178 24,634 49,812 0 Centuria, Village Of 341,653 32,870 23,916 56,786 106,315 Chaseburg, Village Of 67,771 4,744 4,744 9,488 0 Chenequa, Village Of 768,759 99,363 26,358 125,722 0 Clayton, Village Of 161,343 12,777 11,294 24,071 0 Clear Lake, Village Of 401,638 31,885 28,115 59,999 0 Cleveland, Village Of 327,555 23,200 24,684 47,885 0 Clinton, Village Of 701,023 58,713 49,071 107,785 0 Clyman, Village Of 109,129 7,871 7,626 15,496 2,261 Cobb, Village Of 85,014 5,951 5,951 11,902 0 Cochrane, Village Of 82,000 5,740 5,740 11,480 0 Coleman, Village Of 202,504 15,619 14,237 29,856 0 Colfax, Village Of 433,797 34,222 29,239 63,460 0 Coloma, Village Of 222,860 17,607 15,600 33,207 0 Combined Locks, Village Of 427,772 34,222 29,944 64,166 201,783 Coon Valley, Village Of 196,316 15,007 13,742 28,750 0 Cottage Grove, Village Of 1,421,828 151,889 66,705 218,595 0 Crivitz, Village Of 287,376 22,792 20,116 42,909 0 Cross Plains, Village Of 932,557 102,647 52,964 155,611 107,146 Dallas, Village Of 36,284 2,540 2,540 5,080 0 Dane, Village Of 209,976 15,949 14,698 30,647 0 Darien, Village Of 357,153 51,680 2,607 54,287 0 De Soto, Village Of 67,801 4,866 4,865 9,731 0 Deerfield, Village Of 446,461 31,252 31,252 62,504 0 Deforest, Village Of 2,751,776 234,795 191,881 426,676 0 Denmark, Village Of 447,473 34,680 31,323 66,003 0 Dickeyville, Village Of 221,009 17,685 15,457 33,142 0
Contributions UnfundedName Covered Payroll Employer Paid* Employee Paid Total Liability Balance
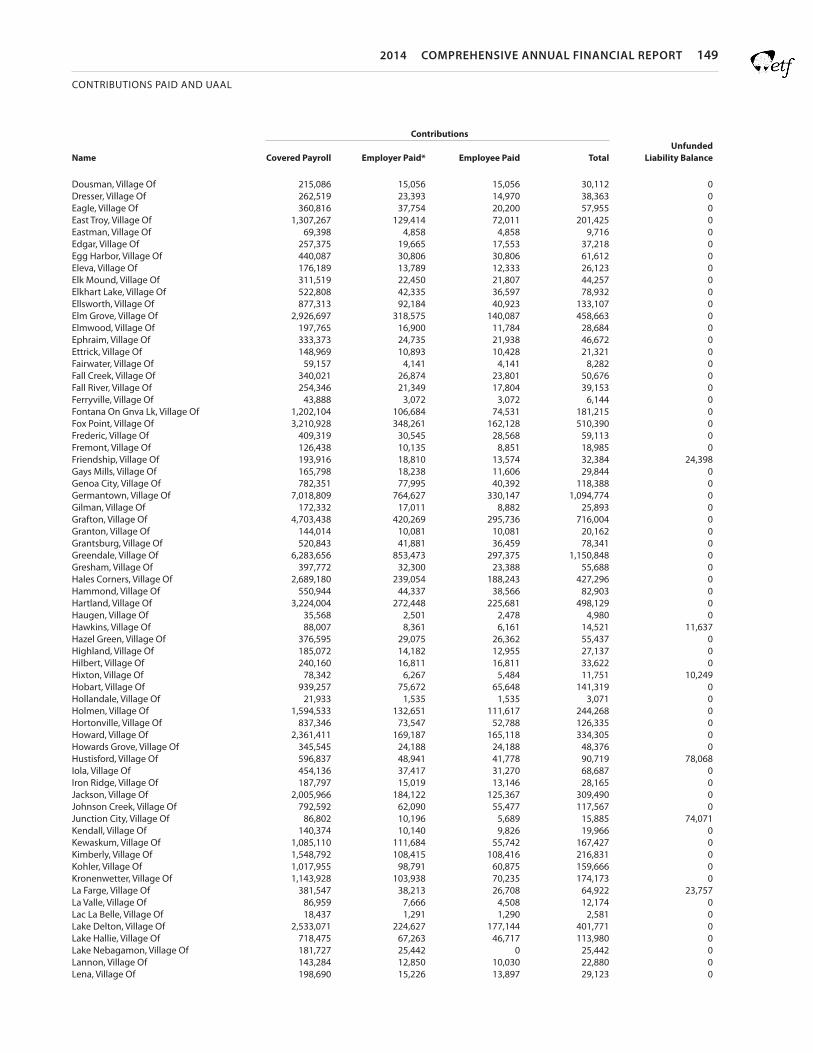
2014 COMPREHENSIVE ANNUAL FINANCIAL REPORT 149
CONTRIBUTIONS PAID AND UAAL
Dousman, Village Of 215,086 15,056 15,056 30,112 0 Dresser, Village Of 262,519 23,393 14,970 38,363 0 Eagle, Village Of 360,816 37,754 20,200 57,955 0 East Troy, Village Of 1,307,267 129,414 72,011 201,425 0 Eastman, Village Of 69,398 4,858 4,858 9,716 0 Edgar, Village Of 257,375 19,665 17,553 37,218 0 Egg Harbor, Village Of 440,087 30,806 30,806 61,612 0 Eleva, Village Of 176,189 13,789 12,333 26,123 0 Elk Mound, Village Of 311,519 22,450 21,807 44,257 0 Elkhart Lake, Village Of 522,808 42,335 36,597 78,932 0 Ellsworth, Village Of 877,313 92,184 40,923 133,107 0 Elm Grove, Village Of 2,926,697 318,575 140,087 458,663 0 Elmwood, Village Of 197,765 16,900 11,784 28,684 0 Ephraim, Village Of 333,373 24,735 21,938 46,672 0 Ettrick, Village Of 148,969 10,893 10,428 21,321 0 Fairwater, Village Of 59,157 4,141 4,141 8,282 0 Fall Creek, Village Of 340,021 26,874 23,801 50,676 0 Fall River, Village Of 254,346 21,349 17,804 39,153 0 Ferryville, Village Of 43,888 3,072 3,072 6,144 0 Fontana On Gnva Lk, Village Of 1,202,104 106,684 74,531 181,215 0 Fox Point, Village Of 3,210,928 348,261 162,128 510,390 0 Frederic, Village Of 409,319 30,545 28,568 59,113 0 Fremont, Village Of 126,438 10,135 8,851 18,985 0 Friendship, Village Of 193,916 18,810 13,574 32,384 24,398 Gays Mills, Village Of 165,798 18,238 11,606 29,844 0 Genoa City, Village Of 782,351 77,995 40,392 118,388 0 Germantown, Village Of 7,018,809 764,627 330,147 1,094,774 0 Gilman, Village Of 172,332 17,011 8,882 25,893 0 Grafton, Village Of 4,703,438 420,269 295,736 716,004 0 Granton, Village Of 144,014 10,081 10,081 20,162 0 Grantsburg, Village Of 520,843 41,881 36,459 78,341 0 Greendale, Village Of 6,283,656 853,473 297,375 1,150,848 0 Gresham, Village Of 397,772 32,300 23,388 55,688 0 Hales Corners, Village Of 2,689,180 239,054 188,243 427,296 0 Hammond, Village Of 550,944 44,337 38,566 82,903 0 Hartland, Village Of 3,224,004 272,448 225,681 498,129 0 Haugen, Village Of 35,568 2,501 2,478 4,980 0 Hawkins, Village Of 88,007 8,361 6,161 14,521 11,637 Hazel Green, Village Of 376,595 29,075 26,362 55,437 0 Highland, Village Of 185,072 14,182 12,955 27,137 0 Hilbert, Village Of 240,160 16,811 16,811 33,622 0 Hixton, Village Of 78,342 6,267 5,484 11,751 10,249 Hobart, Village Of 939,257 75,672 65,648 141,319 0 Hollandale, Village Of 21,933 1,535 1,535 3,071 0 Holmen, Village Of 1,594,533 132,651 111,617 244,268 0 Hortonville, Village Of 837,346 73,547 52,788 126,335 0 Howard, Village Of 2,361,411 169,187 165,118 334,305 0 Howards Grove, Village Of 345,545 24,188 24,188 48,376 0 Hustisford, Village Of 596,837 48,941 41,778 90,719 78,068 Iola, Village Of 454,136 37,417 31,270 68,687 0 Iron Ridge, Village Of 187,797 15,019 13,146 28,165 0 Jackson, Village Of 2,005,966 184,122 125,367 309,490 0 Johnson Creek, Village Of 792,592 62,090 55,477 117,567 0 Junction City, Village Of 86,802 10,196 5,689 15,885 74,071 Kendall, Village Of 140,374 10,140 9,826 19,966 0 Kewaskum, Village Of 1,085,110 111,684 55,742 167,427 0 Kimberly, Village Of 1,548,792 108,415 108,416 216,831 0 Kohler, Village Of 1,017,955 98,791 60,875 159,666 0 Kronenwetter, Village Of 1,143,928 103,938 70,235 174,173 0 La Farge, Village Of 381,547 38,213 26,708 64,922 23,757 La Valle, Village Of 86,959 7,666 4,508 12,174 0 Lac La Belle, Village Of 18,437 1,291 1,290 2,581 0 Lake Delton, Village Of 2,533,071 224,627 177,144 401,771 0 Lake Hallie, Village Of 718,475 67,263 46,717 113,980 0 Lake Nebagamon, Village Of 181,727 25,442 0 25,442 0 Lannon, Village Of 143,284 12,850 10,030 22,880 0 Lena, Village Of 198,690 15,226 13,897 29,123 0
Contributions UnfundedName Covered Payroll Employer Paid* Employee Paid Total Liability Balance

150 COMPREHENSIVE ANNUAL FINANCIAL REPORT 2014
CONTRIBUTIONS PAID AND UAAL
Little Chute, Village Of 3,734,471 324,476 260,164 584,640 0 Loganville, Village Of 44,320 4,428 1,777 6,205 0 Lomira, Village Of 497,309 40,105 34,811 74,916 0 Luck, Village Of 435,771 36,996 30,504 67,500 33,850 Luxemburg, Village Of 202,310 18,795 11,016 29,811 0 Maple Bluff, Village Of 1,079,573 102,739 75,570 178,309 0 Marathon City, Village Of 469,498 40,040 28,956 68,997 0 Marshall, Village Of 967,281 81,460 67,710 149,170 0 Mattoon, Village Of 81,163 10,084 1,279 11,363 0 Mazomanie, Village Of 238,437 16,822 16,560 33,381 0 Mcfarland, Village Of 2,735,705 287,531 137,262 424,793 0 Menomonee Falls, Village Of 12,593,512 1,406,596 567,207 1,973,803 0 Milltown, Village Of 275,869 21,947 19,311 41,257 0 Minong, Village Of 227,641 18,965 15,750 34,714 0 Mishicot, Village Of 294,970 23,026 20,648 43,674 0 Montfort, Village Of 87,822 6,424 5,871 12,295 0 Mount Horeb, Village Of 2,777,106 221,099 194,398 415,497 0 Mt Pleasant, Village Of(Racine 9,478,618 1,094,464 493,674 1,588,138 0 Mukwonago, Village Of 3,077,565 321,774 154,298 476,072 0 Muscoda, Village Of 527,903 40,209 36,953 77,162 0 Necedah, Village Of 305,410 22,778 21,379 44,156 0 Neshkoro, Village Of 48,927 7,966 2,602 10,568 116,634 New Glarus, Village Of 952,140 84,296 56,382 140,678 0 Newburg, Village Of 126,113 8,828 8,828 17,656 0 Nichols, Village Of 41,736 2,921 2,922 5,843 0 North Fond Du Lac, Village Of 2,140,635 212,277 116,780 329,057 0 North Freedom, Village Of 83,443 5,841 5,841 11,682 0 North Hudson, Village Of 577,390 67,798 21,827 89,625 0 Oconomowoc Lake, Village Of 610,660 94,469 7,629 102,098 0 Oostburg, Village Of 349,095 28,626 24,437 53,062 16,202 Oregon, Village Of 2,749,471 259,925 156,753 416,678 0 Orfordville, Village Of 427,407 36,867 26,604 63,471 0 Osceola, Village Of 861,405 85,983 45,263 131,246 0 Oxford, Village Of (Marquette) 110,059 8,538 7,704 16,242 0 Paddock Lake, Village Of 337,804 23,646 23,646 47,293 0 Pardeeville, Village Of 506,363 35,446 35,445 70,891 0 Pepin, Village Of 201,503 15,668 13,979 29,647 0 Pewaukee, Village Of 2,931,622 293,444 162,219 455,663 0 Plain, Village Of 197,739 13,842 13,842 27,683 0 Plainfield, Village Of 234,347 19,260 16,405 35,665 0 Pleasant Prairie,Village Of 11,218,417 939,806 763,402 1,703,208 0 Plover, Village Of 3,659,454 358,520 201,225 559,745 0 Port Edwards, Village Of 708,337 55,424 49,584 105,007 0 Pound, Village Of 59,522 4,167 4,167 8,333 0 Poynette, Village Of 746,732 79,653 40,279 119,931 0 Prairie Du Sac, Village Of 948,208 66,384 66,365 132,749 0 Prairie Farm, Village Of 1,131,055 79,174 79,174 158,348 0 Pulaski, Village Of 922,111 80,759 59,337 140,096 0 Randolph, Village Of 391,277 43,218 27,390 70,607 111,869 Random Lake, Village Of 268,673 18,807 18,807 37,614 0 Rib Lake, Village Of 151,247 10,587 10,587 21,175 0 Rio, Village Of 248,576 21,962 15,684 37,647 0 River Hills, Village Of 1,359,770 111,225 109,291 220,515 0 Roberts, Village Of 615,825 60,890 31,035 91,924 0 Rochester, Village Of 249,861 17,490 17,490 34,981 0 Rock Springs, Village Of 70,017 4,901 4,901 9,802 0 Rockland, Village Of 116,811 8,177 8,177 16,354 0 Rosendale, Village Of 192,706 15,284 13,489 28,774 0 Rosholt, Village Of 68,779 4,814 4,815 9,629 0 Rothschild, Village Of 1,372,456 149,868 64,442 214,310 0 Sauk City, Village Of 841,495 58,905 58,905 117,809 0 Saukville, Village Of 1,695,155 183,502 77,389 260,892 0 Sharon, Village Of 588,990 64,288 27,106 91,394 0 Sherwood, Village Of 313,736 21,961 21,962 43,923 0 Shiocton, Village Of 247,045 18,766 17,291 36,057 0 Shorewood Hills, Village Of 1,229,578 103,893 86,070 189,963 0 Shorewood, Village Of 4,792,475 450,056 291,679 741,735 0
Contributions UnfundedName Covered Payroll Employer Paid* Employee Paid Total Liability Balance

2014 COMPREHENSIVE ANNUAL FINANCIAL REPORT 151
CONTRIBUTIONS PAID AND UAAL
Silver Lake, Village Of 486,090 58,584 17,353 75,937 0 Siren, Village Of 322,895 26,221 22,603 48,823 0 Sister Bay, Village Of 473,511 33,146 33,146 66,292 0 Slinger, Village Of 1,737,333 181,304 84,166 265,470 0 Soldiers Grove, Village Of 134,453 16,964 9,255 26,218 145,371 Solon Springs, Village Of 123,750 9,146 8,582 17,728 0 Somerset, Village Of 957,956 100,136 44,678 144,814 0 South Wayne, Village Of 75,231 5,266 5,266 10,532 0 Spencer, Village Of 474,622 47,816 23,791 71,607 0 Spring Green, Village Of 535,231 42,415 37,466 79,882 0 Spring Valley, Village Of 305,000 23,581 21,338 44,919 0 St Nazianz, Village Of 172,543 12,078 12,078 24,156 0 Stockbridge, Village Of 26,780 1,875 1,875 3,749 0 Stratford, Village Of 472,548 38,532 33,078 71,610 0 Strum, Village Of 276,847 45,547 0 45,547 26,173 Suamico, Village Of 1,206,416 88,207 84,430 172,637 0 Sullivan, Village Of 136,473 9,553 9,553 19,106 0 Summit, Village Of (Waukesha) 1,144,847 104,316 80,139 184,456 0 Suring, Village Of 229,752 19,092 16,083 35,175 41,527 Sussex, Village Of 2,281,238 166,508 159,688 326,196 0 Thiensville, Village Of 1,050,177 88,674 73,295 161,969 0 Trempealeau, Village Of 546,593 46,750 32,923 79,673 0 Turtle Lake, Village Of 518,003 55,468 24,191 79,659 0 Twin Lakes, Village Of 2,281,585 237,123 112,592 349,715 0 Union Center, Village Of 85,522 6,620 5,847 12,466 0 Union Grove, Village Of 875,648 61,402 61,189 122,591 0 Valders, Village Of 303,510 22,984 21,246 44,230 0 Walworth, Village Of 792,252 86,081 43,363 129,444 25,156 Warrens, Village Of 132,695 9,388 9,289 18,677 0 Waunakee, Village Of 3,382,014 275,704 236,741 512,444 0 Wausaukee, Village Of 129,762 9,083 9,083 18,167 0 Wauzeka, Village Of 100,615 7,044 7,043 14,086 0 West Baraboo, Village Of 204,768 14,334 14,334 28,668 0 West Milwaukee, Village Of 2,688,324 359,347 117,393 476,740 5,541,597 West Salem, Village Of 880,933 89,009 45,641 134,650 0 Westfield, Village Of 334,935 27,243 23,446 50,689 0 Weston, Village Of (Marathon) 2,005,535 149,199 139,021 288,220 0 White Lake, Village Of 82,787 5,795 5,795 11,590 0 Whitefish Bay, Village Of 3,958,309 384,771 229,182 613,953 0 Whitelaw, Village Of 81,398 5,698 5,698 11,396 0 Whiting, Village Of 187,679 13,138 13,138 26,275 0 Wild Rose, Village Of 232,906 19,047 16,303 35,351 0 Williams Bay, Village Of 1,042,751 126,559 42,779 169,339 91,026 Wilson, Village Of 41,864 3,218 2,810 6,028 4,184 Wind Point, Village Of 212,660 14,899 14,873 29,772 0 Winneconne, Village Of 820,805 90,498 40,713 131,211 74,185 Withee, Village Of 110,474 7,733 7,733 15,466 0 Wonewoc, Village Of 272,344 23,350 16,299 39,649 0 Woodville, Village Of 495,963 41,336 34,717 76,054 0 Wrightstown, Village Of 541,886 39,260 37,932 77,192 0 Wyocena, Village Of 123,850 8,669 8,670 17,339 0 Total Villages (261) 238,218,736 22,770,659 14,212,878 36,983,537 7,224,616 Special Districts Adrc Of The Northwoods 222,784 15,595 15,595 31,190 0 Algoma City Housing Auth 67,121 4,698 4,698 9,397 0 Algoma Sanitary Dist 399,871 27,991 27,991 55,982 0 Allenton Sanitary Dist 127,301 8,911 8,911 17,822 0 Altoona City Housing Authority 28,314 2,564 1,967 4,530 4,228 Antigo City Housing Auth 361,244 25,287 25,287 50,574 0 Appleton City Housing Auth 621,880 43,531 43,532 87,063 0 Ashland City Housing Auth 315,470 24,607 22,083 46,690 16,836 Ashland County Housing Auth 511,292 35,790 35,791 71,581 0 Baraboo District Ambulance 1,405,956 141,330 98,250 239,580 0 Barron Co Housing Authority 108,117 7,568 7,568 15,136 0 Bay Area Rural Transit Commiss 432,348 30,443 30,086 60,529 0 Bayfield County Housing Auth 105,022 7,351 7,352 14,703 0
Contributions UnfundedName Covered Payroll Employer Paid* Employee Paid Total Liability Balance

152 COMPREHENSIVE ANNUAL FINANCIAL REPORT 2014
CONTRIBUTIONS PAID AND UAAL
Bay-Lake Regional Plan Comm 338,747 26,761 23,712 50,473 77,118 Big Cedar Lake Prot/Rehab Dist 47,342 9,468 (2,579) 6,889 0 Brockway Sanitary District #1 101,574 7,110 7,110 14,220 0 Brookfield, Town San Dist #4 212,711 14,890 14,890 29,780 0 Bruce Village Housing Auth 63,924 4,475 4,475 8,949 0 Burlington City Housing Auth 44,768 3,134 3,134 6,268 0 Cambridge-Oakland Wstewtr Comm 108,992 7,629 7,629 15,259 0 Capital Area Reg Plan Comm 487,287 34,111 34,110 68,220 0 Central Brown Cty Water Auth 87,461 6,122 6,122 12,245 0 Chilton City Housing Auth 58,877 4,133 4,110 8,243 0 Chippewa Co Housing Auth 376,972 26,388 26,388 52,776 0 Chippewa Fire District 767,688 78,133 53,707 131,840 0 Christmas Mountain Sntry Dist 40,480 2,834 2,834 5,667 0 City-County Data Center Comm 1,891,317 132,395 132,390 264,784 0 Clintonville City Hous Auth 94,904 7,403 6,643 14,046 13,919 Colby/Abbotsford Jt Police Com 358,106 55,864 4,978 60,842 0 Community Care Of Cent Wiscon 20,724,743 1,450,818 1,450,646 2,901,464 0 Consol Koshkonong Sanitary Dis 308,019 21,561 21,561 43,123 0 Continu Us 14,331,049 1,003,429 1,002,918 2,006,347 0 Country Estates San Dist 32,438 2,292 2,249 4,541 0 Cross Plains Area Ems 48,718 4,665 3,410 8,076 0 Cumberland Municipal Utility 597,953 41,857 41,857 83,713 0 Dane County Dist #1 Ems 46,807 4,826 3,276 8,102 0 Dane County Housing Authority 424,112 34,780 29,685 64,465 355,127 Dane-Iowa Wastewater Comm 144,790 10,135 10,135 20,271 0 Deer-Grove Ems Dist 359,002 36,591 25,130 61,721 0 Deforest Area Fire Board Dist 283,610 28,473 19,739 48,212 0 Delafield-Hartl Water Pol Cntl 478,211 33,475 33,475 66,949 0 Delavan Lake Sanitary District 530,917 37,164 37,164 74,328 0 Dells-Delton Ems Comm 985,808 69,006 69,007 138,013 0 Delton Fire & Ambulance Comm 15,756 1,223 1,103 2,326 0 Dodge County Housing Authority 146,710 11,346 9,194 20,539 0 Dousman Fire District 306,846 31,636 21,479 53,115 0 Eagle River Union Airport 128,136 8,970 8,969 17,939 0 East Central Wis Reg Plan Comm 1,105,566 77,389 77,390 154,779 0 Eastern Columbia Cty Jm Court 52,210 3,760 3,760 7,519 0 Eastern Shores Lib Sys 350,847 24,559 24,560 49,119 0 Eau Claire City Housing Auth 685,614 48,125 47,860 95,986 0 Eauclaire City-Co Health Dpt 2,741,691 191,919 191,918 383,837 0 Edgerton City Housing Auth 146,787 10,275 10,275 20,550 0 Edgerton Fire Prot Dist 248,932 43,090 0 43,090 0 Everest Metro Police Comm 1,785,974 240,149 64,703 304,852 0 Fish Creek Sanitary Dist #1 190,186 13,313 13,313 26,626 0 Fitch-Rona Ems District 1,025,458 133,365 43,688 177,054 0 Fond Du Lac City Housing Auth 674,643 47,225 47,225 94,450 0 Fontana/Walworth Wtr Pol Cn Cm 301,972 21,138 21,138 42,276 0 Fox Lake Wastewater Contr Comm 95,597 6,692 6,692 13,384 0 Freedom Sanitary District #1 130,900 9,163 9,163 18,326 0 Gb/Brown Co Pro Ftbll Stad Dis 108,656 7,606 7,606 15,212 0 Goodman Sanitary District No 1 33,280 2,330 2,330 4,659 0 Grand Chute-Menasha Ws Sew Com 332,264 23,398 23,119 46,517 0 Green Bay Metro Sewerage Dist 6,481,885 453,732 453,732 907,464 0 Green Lake Sanitary District 196,203 20,376 7,092 27,468 0 Harmony Grove-Okee Jt Sew Comm 148,349 10,384 10,384 20,769 0 Heart Of The Valley Met Sew Ds 728,599 51,002 51,002 102,004 0 Holmen Area Fire Dept 231,845 23,903 16,229 40,132 0 Hudson City Housing Authority 82,891 5,802 5,802 11,605 0 Hum Srv Ctr Onida Vilas Forst 2,000,755 140,052 140,054 280,106 0 Hurley Housing Authority 61,666 4,625 4,317 8,942 1,178 Indianhead Fed Library System 665,296 46,571 46,570 93,141 0 Iron River Sanitary Dist #1 83,945 5,876 5,876 11,752 0 Jefferson City Housing Auth 131,936 10,291 9,236 19,526 12,594 Kaukauna City Housing Auth 132,504 9,327 9,223 18,551 0 Kegonsa Sanitary District 96,961 6,787 6,787 13,574 0 Kelly Lake Sanitary Dist #1 21,964 1,574 1,501 3,075 0 Kenosha Joint Services 3,712,043 259,875 259,811 519,686 0 La Crosse City Housing Auth 955,746 66,902 66,902 133,804 0
Contributions UnfundedName Covered Payroll Employer Paid* Employee Paid Total Liability Balance

2014 COMPREHENSIVE ANNUAL FINANCIAL REPORT 153
CONTRIBUTIONS PAID AND UAAL
Ladysmith Housing Auth 80,859 5,660 5,660 11,320 0 Lake Como Sanitary Dist #1 197,801 14,835 13,846 28,681 19,962 Lake Country Fire & Rescue 1,033,683 105,181 72,356 177,537 0 Lake Mills City Housing Auth 98,412 12,527 1,251 13,778 0 Lake Ripley Mgt District 37,143 2,711 2,600 5,312 6,178 Lakeland Care District 9,079,636 638,783 632,366 1,271,149 0 Lakeland Sanitary District #1 282,807 19,797 19,796 39,593 0 Lakeshores Library System 247,186 17,303 17,303 34,606 0 Laona Sanitary District #1 64,397 4,508 4,508 9,016 0 League Of Wisc Municipalities 641,804 44,927 44,926 89,853 0 Lincoln County Housing Auth 99,495 6,965 6,965 13,929 0 Lodi Community Ambulance Serv 100,636 14,391 3,029 17,420 0 Lyons Sanitary District #2 90,583 6,341 6,341 12,682 0 Madeline Sanitary District 58,187 4,097 4,049 8,146 0 Madison Metro Sewerage Dist 7,095,005 496,651 496,650 993,301 0 Manitowoc City Housing Auth 118,545 8,298 8,298 16,596 0 Manitowoc-Calumet Lib Sys 95,388 6,677 6,677 13,354 0 Marinette City Housing Auth 166,562 13,991 11,659 25,651 77,689 Marshall Area Ems Dist #14 71,734 6,983 5,021 12,005 0 Marshfield Cda 330,283 23,120 23,120 46,240 0 Marshfield Electric & Water 2,992,698 209,489 209,488 418,978 0 Menasha Electric & Water 2,796,060 195,724 195,724 391,448 0 Menomonie City Housing Auth 213,156 14,921 14,921 29,842 0 Mequon - Thiensville Library 435,777 30,504 30,505 61,009 0 Mercer Sanitary District #1 123,575 8,650 8,650 17,300 0 Merrill City Housing Authority 248,075 17,365 17,366 34,731 0 Middleton Fire District 303,822 51,781 5,912 57,693 0 Mid-Moraine Municipal Court 345,487 24,739 24,739 49,478 0 Mid-Wis Federated Lib Sys 246,295 17,241 17,241 34,481 0 Milw Area Dom Animal Cont Comm 1,254,955 87,893 87,801 175,694 0 Milwaukee Co Fed Lib Sys 368,826 25,818 25,818 51,636 0 Mississippi River Reg Plan Com 230,009 16,100 16,101 32,201 0 Monroe City Housing Authority 163,875 11,471 11,471 22,942 0 Mosinee Fire Dist 137,232 16,392 9,606 25,998 0 Mt Horeb Area Fire Dept 256,727 35,711 17,971 53,682 0 Muni Court W Waukesha County 190,106 13,612 13,612 27,225 0 New Glarus Ems 82,660 14,308 0 14,308 0 New London City Housing Auth 86,802 6,858 6,076 12,933 2,510 New Richmond Ambulance 338,734 23,804 23,619 47,423 0 Nicolet Federated Library Sys 308,837 21,619 21,619 43,237 0 North Central Health Care Fac 26,908,431 1,886,161 1,881,019 3,767,180 0 North Central Wis Reg Plan Com 380,906 26,663 26,664 53,327 0 North Shore Fire Dept 8,060,190 1,604,800 564,213 2,169,013 0 North Shore Water Commission 459,178 32,142 32,143 64,285 0 Northern Bridges 412,496 28,878 28,872 57,749 0 Northern Moraine Utility Comm 124,119 8,688 8,688 17,377 0 Northern Waters Library Serv 319,953 22,397 22,397 44,793 0 Northwest Regional Plan Comm 998,141 69,870 69,870 139,740 0 Norway Sanitary District #1 249,582 17,471 17,471 34,942 0 Oconto City Housing Authority 123,052 8,614 8,614 17,227 0 Oregon Area Fire - Ems Dist 416,644 55,623 16,498 72,121 0 Orfordville Vol Fire Prot Dist 38,661 3,986 2,706 6,692 0 Oshkosh City Housing Authority 1,398,663 97,906 97,907 195,813 0 Outagamie County Housing Auth 1,114,865 78,040 78,041 156,081 0 Outagamie Waupc Co Fed Libr Sy 578,938 40,526 40,526 81,051 0 Phelps Sanitary District #1 43,836 6,137 0 6,137 0 Pleasant Springs San Dis #1 44,331 3,103 3,103 6,206 0 Plymouth City Housing Auth 93,624 6,554 6,554 13,107 0 Prairie Du Sac Jt Sewer Comm 61,269 4,290 4,288 8,578 0 Racine County Housing Auth 484,609 36,251 31,594 67,845 0 Reedsburg Area Ambulance Svces 272,010 26,047 19,041 45,088 0 Reedsville Vil Housing Auth 29,002 2,030 2,030 4,060 0 Rhinelander City Housing Auth 124,048 8,683 8,683 17,367 0 Rib Mountain Metro Sew Dist 449,375 31,456 31,456 62,912 0 Rice Lake City Housing Auth 267,855 27,373 18,698 46,071 99,680 Richland Center City Hous Auth 82,515 5,776 5,776 11,552 0 Richland Fire Department 25,045 2,582 1,753 4,335 0
Contributions UnfundedName Covered Payroll Employer Paid* Employee Paid Total Liability Balance

154 COMPREHENSIVE ANNUAL FINANCIAL REPORT 2014
CONTRIBUTIONS PAID AND UAAL
Ripon Area Fire District 66,410 6,847 4,649 11,496 0 River Falls City Housing Auth 292,349 22,803 20,464 43,268 17,768 Sauk City Housing Authority 36,594 2,562 2,562 5,123 0 Sauk County Housing Authority 236,280 16,621 16,458 33,079 0 Sauk Prairie Ambulance Assoc 169,141 22,921 6,357 29,278 0 Sauk Prairie Police Commission 871,174 115,749 32,653 148,402 0 Sauk Prairie Recreation Comm 50,000 3,500 3,500 7,000 0 Sawyer County Housing Auth 127,714 8,957 8,924 17,880 0 Shawano City Housing Authority 187,562 14,767 12,992 27,759 53,075 Shawano County Housing Auth 159,694 11,178 11,179 22,357 0 Shawano Lake Sanitary Dist #1 633,877 48,745 39,998 88,743 0 Shawano Municipal Utilities 1,236,383 86,547 86,547 173,094 0 Sheboygan City Housing Auth 292,573 22,821 20,480 43,301 38,266 Silver Lake San. Dist. 284,155 24,138 15,644 39,782 0 Slinger Village Housing Auth 55,839 7,817 0 7,817 0 South Central Library System 2,325,719 162,834 162,767 325,601 0 South Milwaukee Cda 148,895 10,423 10,423 20,845 0 Southeastern Wis Reg Plan Comm 3,886,202 272,096 271,972 544,068 0 Southwest Wis Library System 226,243 15,837 15,837 31,674 0 Southwestern Wis Reg Plan Comm 315,123 22,059 22,059 44,117 0 Spooner City Housing Auth 72,985 5,109 5,109 10,218 0 Spooner Fire District 60,500 6,238 4,235 10,473 0 St Joseph Sanitary District #1 30,801 2,156 2,156 4,312 0 Stevens Point City Hous Auth 401,264 28,089 28,088 56,177 0 Sullivan Sanitary District #1 31,515 2,206 2,206 4,412 0 Superior City Housing Auth 1,077,969 75,458 75,458 150,916 0 Taylor County Housing Auth 9,951 697 697 1,393 0 Three Lakes Sanitary Dist #1 62,420 4,369 4,369 8,739 0 Trempealeau County Hous Auth 298,331 23,270 20,883 44,153 26,465 Unified Community Services 1,480,290 103,620 103,621 207,241 0 Valley Ridge Clean Water Comm 43,101 3,017 3,017 6,034 0 Vanguard Electric Util Comm 364,453 25,512 25,512 51,023 0 Viroqua City Housing Authority 186,905 13,388 12,778 26,167 0 Wabeno Sanitary District #1 57,946 4,056 4,056 8,112 0 Wales/Genesee Joint Fire Bd 109,125 11,251 7,639 18,890 0 Walter E Olson Memorial Lib 80,317 5,622 5,622 11,244 0 Walworth County Metro Sew Dist 984,582 76,797 68,921 145,718 101,982 Washburn City Housing Auth 115,957 8,117 8,117 16,234 0 Watertown City Housing Auth 113,332 10,199 6,574 16,773 10,349 Waukesha City Housing Auth 540,430 37,830 37,830 75,660 0 Waunakee Area Ems 45,000 3,150 3,150 6,300 0 Waunakee Area Fire Dist 51,547 3,608 3,608 7,217 0 Waunakee Water & Light 1,108,688 77,608 77,608 155,216 0 Waupaca Chain O’Lakes San Dist 57,200 4,004 4,004 8,008 0 Wausaukee Village Hous Auth 88,491 6,195 6,194 12,389 0 Waverly Sanitary District 314,136 21,990 21,989 43,979 0 West Bend City Housing Auth 228,040 15,963 15,963 31,926 0 West Central Wi Bisolids Comm 149,483 10,464 10,464 20,928 0 West Central Wis Reg Plan Comm 676,283 47,340 47,340 94,680 0 Western Racine Co Sewerage Dis 89,828 6,288 6,288 12,576 0 Western Wisconsin Cares 12,283,849 859,860 859,879 1,719,739 0 Winding Rivers Library Sys 369,855 25,890 25,890 51,780 0 Windsor Sanitary District #1 97,416 6,819 6,819 13,638 0 Winnefox Library System 696,457 50,165 47,339 97,504 0 Wis Dells-Lake Delton Sew Comm 184,224 12,896 12,896 25,791 0 Wisconsin Counties Association 1,746,054 122,223 122,224 244,448 0 Wisconsin Munic Mutal Ins Co 627,032 53,781 34,004 87,784 0 Wisconsin Rapids City Hs Auth 415,301 32,393 29,071 61,465 17,444 Wisconsin Towns Association 371,717 26,020 26,020 52,040 0 Wisconsin Valley Library Srv 343,210 24,025 24,025 48,049 0 Total Special Districts (207) 187,767,760 14,846,033 12,889,414 27,735,447 952,366 Towns Addison, Town Of(Washington) 128,087 8,966 8,966 17,932 0 Alban, Town Of (Portage) 63,518 4,455 4,437 8,892 0 Albion, Town Of (Dane) 136,243 9,765 9,309 19,074 0 Albion, Town Of (Jackson) 26,935 1,934 1,836 3,771 0
Contributions UnfundedName Covered Payroll Employer Paid* Employee Paid Total Liability Balance

2014 COMPREHENSIVE ANNUAL FINANCIAL REPORT 155
CONTRIBUTIONS PAID AND UAAL
Algoma, Town Of 42,318 2,967 2,958 5,924 0 Anson, Town Of (Chippewa) 56,586 5,065 3,960 9,026 51,472 Arbor Vitae, Town Of (Vilas) 186,354 16,026 13,045 29,071 20,265 Ashippun, Town Of (Dodge Co) 122,038 8,543 8,543 17,085 0 Ashland, Town Of (Ashland) 69,434 4,869 4,852 9,721 0 Athelstane, Town Of(Marinette) 117,109 8,198 8,197 16,395 0 Aztalan, Town Of(Jefferson) 57,161 5,557 4,113 9,670 117,707 Baileys Harbor, Town Of (Door) 335,474 23,483 23,483 46,966 0 Balsam Lake, Town Of (Polk) 47,805 3,346 3,346 6,693 0 Baraboo, Town Of (Sauk) 79,045 5,766 5,766 11,531 0 Barksdale, Town Of (Bayfield) 53,456 3,742 3,742 7,484 0 Barron, Town Of (Barron) 51,057 3,574 3,574 7,148 0 Bayview, Town Of (Bayfield) 42,224 2,956 2,956 5,911 0 Bear Creek, Town Of (Sauk) 68,257 4,971 4,852 9,822 0 Belmont, Town Of (Lafayette) 29,264 2,069 2,028 4,097 0 Beloit, Town Of (Rock) 2,183,982 222,394 152,879 375,273 0 Bennett, Town Of (Douglas) 86,129 6,029 6,029 12,058 0 Bergen, Town Of (Vernon) 39,929 2,795 2,795 5,590 0 Berry, Town Of (Dane) 79,779 293 10,876 11,169 0 Bloomfield, Town Of (Walworth) 6,300 441 441 882 0 Blooming Grove, Town Of(Dane) 405,085 35,751 28,269 64,020 0 Blue Mounds, Town Of (Dane) 62,600 4,547 4,547 9,094 0 Boulder Junction, Town (Vilas) 219,671 17,142 15,377 32,519 0 Brigham, Town Of (Iowa) 120,662 9,765 7,128 16,893 0 Brockway, Town Of (Jackson) 77,556 5,535 5,535 11,071 0 Brookfield, Town Of (Waukesha) 2,623,812 301,707 126,469 428,176 0 Brooklyn, Town Of (Green) 54,810 3,846 3,827 7,673 0 Brothertown, Town Of(Calumet) 59,292 8,597 4,150 12,748 92,090 Buchanan, Town Of(Outagamie) 175,133 12,259 12,259 24,519 0 Burke, Town Of (Dane) 196,139 13,730 13,730 27,459 0 Burlington, Town Of (Racine) 345,396 26,664 24,178 50,841 0 Campbell, Town Of (La Crosse) 514,798 44,626 36,036 80,662 0 Carey, Town Of (Iron) 49,808 3,487 3,487 6,973 0 Cassian, Town Of (Oneida) 87,926 6,197 6,113 12,310 0 Cedarburg, Town Of (Ozaukee) 568,300 39,781 39,781 79,562 0 Chetek, Town Of (Barron) 69,473 5,025 5,021 10,046 0 Clayton, Town Of (Polk) 40,275 2,819 2,819 5,639 0 Clayton, Town Of (Winnebago) 242,794 16,996 16,996 33,991 0 Clear Lake, Town Of (Polk) 38,905 3,657 2,723 6,380 27,665 Clifton, Town Of (Monroe) 40,302 2,821 2,821 5,642 0 Clinton, Town Of (Barron) 49,757 3,483 3,483 6,966 0 Clover,Town Of (Bayfield) 73,909 5,175 5,172 10,347 0 Colby, Town Of (Clark) 45,248 3,317 3,017 6,335 0 Corning, Town Of (Lincoln) 34,040 2,387 2,379 4,766 0 Crescent, Town Of (Oneida) 130,265 16,752 1,998 18,750 0 Cross Plains, Town Of (Dane) 68,966 4,954 4,954 9,908 0 Dairyland, Town Of (Douglas) 19,024 1,797 866 2,663 0 Darien, Town Of (Walworth) 67,725 5,386 4,637 10,023 0 Delavan, Town Of (Walworth) 1,239,491 157,977 43,067 201,044 0 Delta, Town Of (Bayfield) 92,985 6,637 6,637 13,274 0 Delton, Town Of (Sauk) 155,987 11,116 11,116 22,232 0 Dover, Town Of (Racine) 58,322 4,083 4,083 8,165 0 Draper, Town Of (Sawyer) 76,058 5,324 5,324 10,648 0 Drummond, Town Of (Bayfield) 211,987 14,938 14,938 29,876 0 Dunkirk, Town Of (Dane) 118,861 9,751 6,890 16,641 0 Dunn, Town Of (Dane) 441,766 30,923 30,924 61,847 0 Eagle Point, Town Of(Chippewa) 99,808 7,152 7,152 14,303 0 Eagle, Town Of (Waukesha) 256,736 28,053 10,421 38,474 0 East Troy, Town Of(Walworth) 749,529 98,617 21,180 119,798 0 Easton, Town Of (Marathon) 87,964 6,157 6,158 12,315 0 Eau Galle, Town Of (Dunn) 49,226 4,676 3,446 8,122 55,787 Egg Harbor, Town Of (Door) 37,991 2,659 2,659 5,319 0 Elk Mound, Town Of 37,890 2,658 2,647 5,305 0 Erin, Town Of (Washington) 162,882 11,473 11,473 22,946 0 Exeter, Town Of (Green County) 83,961 5,877 5,877 11,755 0 Farmington, Town Of (Lacrosse) 69,196 4,844 4,844 9,687 0 Farmington, Town Of (Waupaca) 44,702 3,464 3,464 6,929 0
Contributions UnfundedName Covered Payroll Employer Paid* Employee Paid Total Liability Balance

156 COMPREHENSIVE ANNUAL FINANCIAL REPORT 2014
CONTRIBUTIONS PAID AND UAAL
Flambeau, Town Of (Rusk) 1,269 128 89 217 19,879 Florence, Town Of (Florence) 769,928 54,168 54,168 108,336 0 Franklin, Town Of (Manitowoc) 69,473 5,236 4,640 9,876 0 Freedom, Town Of (Outagamie) 335,284 27,531 23,448 50,979 0 Freedom, Town Of (Sauk) 35,015 2,451 2,451 4,902 0 Fulton, Town Of (Rock) 53,788 3,765 3,765 7,530 0 Geneva, Town Of (Walworth) 658,099 71,021 32,820 103,841 0 Georgetown, Town Of (Polk) 41,513 5,895 2,906 8,801 144,235 Germantown, Town Of 128,907 9,024 9,024 18,047 0 Gibraltar, Town Of (Door) 211,162 14,781 14,781 29,563 0 Gilman, Town Of (Pierce) 54,392 3,807 3,807 7,615 0 Goodman, Town Of(Marinette) 73,543 5,153 5,143 10,296 0 Grand Chute, Town Of(Outagame) 5,454,449 499,639 377,062 876,701 0 Grand Rapids, Town Of (Wood) 715,305 68,392 44,479 112,871 0 Grant, Town Of (Portage) 35,301 2,481 2,461 4,942 0 Gratiot, Town Of (Lafayette) 71,107 4,977 4,978 9,955 0 Green Lake, Town Of (Grn Lake) 45,134 3,159 3,159 6,319 0 Greenfield, Town Of (Lacrosse) 65,445 4,581 4,581 9,162 0 Greenville, Town Of (Outagamie 1,273,897 96,146 89,140 185,285 0 Greenwood, Town Of (Vernon) 43,855 3,095 3,045 6,140 0 Hamburg, Town Of (Vernon) 49,264 3,479 3,418 6,897 0 Hay River, Town Of (Dunn) 34,716 2,430 2,430 4,860 0 Hayward, Town Of (Sawyer) 151,490 11,530 10,604 22,134 0 Hazelhurst, Town Of (Oneida) 119,676 9,608 7,381 16,990 0 Highland, Town Of (Iowa) 73,297 5,237 5,237 10,474 0 Hughes, Town Of (Bayfield) 61,672 4,317 4,317 8,634 0 Hull, Town Of (Portage) 246,084 17,489 17,489 34,977 0 Iron River, Town Of (Bayfield) 334,683 27,442 23,574 51,016 0 Ixonia, Town Of (Jefferson) 305,533 21,387 21,388 42,775 0 Jackson, Town Of (Washington) 222,524 18,695 12,459 31,153 0 Jefferson, Town Of (Jefferson) 14,360 1,005 1,005 2,010 0 Kimball, Town Of (Iron) 96,704 15,956 0 15,956 57,705 Knight, Town Of (Iron) 57,394 4,018 4,018 8,035 0 Komensky, Town Of (Jackson) 49,257 6,896 0 6,896 0 La Pointe, Town Of (Ashland) 770,443 59,562 54,218 113,780 0 La Valle, Town Of (Sauk) 132,840 9,299 9,298 18,598 0 Lac Du Flambeau, Town (Vilas) 256,899 21,879 18,193 40,071 166,738 Lafayette, Town Of (Chippewa) 182,349 13,288 12,748 26,036 0 Lafayette, Town Of (Walworth) 86,888 6,082 6,082 12,164 0 Lake Holcombe, Town (Chippewa) 72,813 5,179 5,150 10,329 0 Lake, Town Of (Marinette) 69,912 5,024 5,024 10,048 0 Laketown, Town Of (Polk) 51,778 3,624 3,624 7,249 0 Land O Lakes, Town Of (Vilas) 310,141 24,242 21,995 46,237 0 Laona, Town Of (Forest) 169,829 13,382 12,091 25,473 0 Lawrence, Town Of (Brown Co) 365,566 25,590 25,590 51,179 0 Lebanon, Town Of (Dodge) 101,557 7,109 7,109 14,218 0 Ledgeview, Town Of (Brown) 368,328 25,783 25,783 51,566 0 Lincoln, Town Of (Vilas) 40,500 3,162 3,115 6,278 0 Linn, Town Of (Walworth) 544,297 77,913 11,924 89,837 0 Linwood, Town Of (Portage) 41,893 2,933 2,933 5,865 0 Lisbon, Town Of (Waukesha) 804,079 68,984 51,044 120,028 0 Lodi, Town Of (Columbia) 60,549 4,238 4,238 8,477 0 Lyons, Town Of (Walworth) 134,805 9,587 9,586 19,173 0 Madison, Town Of (Dane) 2,371,178 235,447 164,963 400,410 0 Maple, Town Of (Douglas) 53,067 3,715 3,715 7,429 0 Marengo, Town Of (Ashland) 46,012 3,269 3,172 6,442 0 Marion, Town Of (Waushara) 26,561 3,719 0 3,719 0 Martell, Town Of (Pierce) 50,798 9,927 (2,815) 7,112 0 Mazomanie, Town Of (Dane) 53,222 3,882 3,882 7,763 0 Medford, Town Of (Taylor) 53,292 3,730 3,730 7,461 0 Menasha, Town Of (Winnebago) 4,979,203 425,864 348,713 774,577 0 Mercer, Town Of (Iron) 272,266 19,370 19,311 38,682 0 Merton, Town Of (Waukesha) 644,151 45,091 45,091 90,181 0 Middleton, Town Of (Dane) 443,098 31,017 31,017 62,034 0 Milltown, Town Of (Polk) 98,325 10,717 6,883 17,600 51,549 Minocqua, Town Of(Oneida) 1,466,706 139,466 103,442 242,908 335,926 Minong, Town Of (Washburn) 177,297 12,846 11,976 24,822 0
Contributions UnfundedName Covered Payroll Employer Paid* Employee Paid Total Liability Balance

2014 COMPREHENSIVE ANNUAL FINANCIAL REPORT 157
CONTRIBUTIONS PAID AND UAAL
Mishicot, Town Of(Manitowoc) 48,456 3,392 3,392 6,784 0 Montrose, Town Of (Dane) 52,117 3,648 3,648 7,296 0 Mukwonago, Town Of 690,621 65,348 45,460 110,808 0 Neenah, Town Of 555 39 39 78 0 New Glarus, Town Of (Green) 97,903 6,853 6,853 13,706 0 New Haven, Town Of (Dunn) 36,979 2,889 2,584 5,473 3,533 Newbold, Town Of (Oneida) 260,988 21,443 15,881 37,324 0 Norway, Town Of (Racine) 494,299 36,857 34,601 71,458 0 Oakdale, Town Of (Monroe) 44,023 3,082 3,082 6,163 0 Oakland, Town Of (Jefferson) 182,363 12,792 12,739 25,531 0 Oconomowoc, Town Of (Waukesha) 1,520,293 135,971 106,416 242,387 0 Oma, Town Of (Iron) 89,958 12,594 0 12,594 0 Onalaska, Town Of (La Crosse) 157,276 12,583 9,435 22,019 0 Oregon, Town Of (Dane) 173,758 12,163 12,163 24,326 0 Orienta, Town Of (Bayfield) 38,480 2,694 2,694 5,387 0 Ottawa, Town Of (Waukesha) 79,179 5,543 5,543 11,085 0 Parkland, Town Of (Douglas) 70,062 4,974 4,904 9,879 1,527 Pelican, Town Of (Oneida) 99,626 6,974 6,974 13,948 0 Pewaukee, City Of 4,320,562 370,024 302,439 672,463 0 Phelps, Town Of (Vilas) 191,144 13,380 13,380 26,760 0 Pine Lake, Town Of (Oneida) 106,236 7,436 7,437 14,873 0 Pleasant Springs, Town(Dane) 143,117 10,018 10,018 20,036 0 Pleasant Valley, Town(Eauclr) 116,011 8,121 8,121 16,242 0 Port Wing, Town Of (Bayfield) 103,500 7,245 7,245 14,490 0 Prairie Lake, Town Of (Barron) 73,114 5,118 5,118 10,236 0 Presque Isle, Town Of(Vilas) 276,476 19,599 19,574 39,172 0 Preston, Town Of (Adams) 62,993 4,538 4,524 9,062 0 Primrose, Town Of (Dane) 51,891 3,632 3,632 7,265 0 Quincy, Town Of (Adams) 115,863 8,384 8,385 16,769 0 Raymond, Town Of (Racine) 242,937 18,329 15,682 34,011 0 Rib Mountain, Town (Marathon) 876,118 69,411 61,328 130,740 0 Rice Lake, Town Of (Barron) 105,232 7,366 7,366 14,732 0 Richfield, Village Of(Washing) 587,206 41,104 41,104 82,209 0 Richmond, Town Of (Walworth) 66,540 4,784 4,711 9,496 0 Ripon, Town Of(Fond Du Lac) 82,387 7,350 5,767 13,117 0 River Falls, Town Of (Pierce) 127,983 9,120 9,165 18,285 0 Rome, Town Of (Adams) 916,354 99,836 43,460 143,296 0 Rudolph, Town Of (Wood) 40,848 2,870 2,848 5,719 0 Rutland, Town Of (Dane) 118,971 8,561 8,561 17,122 0 Salem, Town Of (Kenosha) 1,428,839 109,473 100,019 209,491 0 Sanborn, Town Of (Ashland) 92,586 12,421 947 13,368 0 Scott, Town Of (Brown) 146,584 10,261 10,261 20,522 0 Scott, Town Of (Sheboygan) 117,490 8,237 8,211 16,449 0 Sharon, Town Of (Portage) 82,138 5,750 5,750 11,499 0 Sharon, Town Of (Walworth) 46,812 3,281 3,273 6,554 0 Sheboygan, Town Of (Sheboygan) 359,511 25,170 25,162 50,332 0 Shelby, Town Of (La Crosse) 574,501 44,444 40,215 84,659 0 Somers, Town Of (Kenosha) 1,376,535 152,296 60,850 213,146 0 Somerset, Town Of (St Croix) 164,347 11,504 11,504 23,009 0 South Lancaster, Town (Grant) 44,231 3,096 3,096 6,192 0 Sparta, Town Of (Monroe) 79,351 5,554 5,555 11,109 0 Spirit, Town Of (Price) 36,113 2,889 2,528 5,417 1,121 Spring Lake, Town Of (Pierce) 44,471 3,113 3,113 6,226 0 Springdale, Town Of (Dane) 74,289 5,328 5,328 10,655 0 Springfield, Town Of (Dane) 137,271 9,609 9,609 19,218 0 Springfield, Town Of (Jackson) 32,959 3,032 2,307 5,339 49,660 St Germain, Town Of (Vilas) 267,524 19,074 19,074 38,148 0 Stanton, Town Of (Dunn) 69,954 10,095 0 10,095 0 Stettin, Town Of (Marathon) 166,643 10,771 13,418 24,190 0 Stockton, Town Of (Portage) 171,972 12,301 12,301 24,603 0 Strongs Prairie, Town Of(Adms) 35,595 2,492 2,492 4,983 0 Sugar Creek, Town Of(Walworth) 106,518 7,774 7,774 15,547 0 Sullivan, Town Of (Jefferson) 80,313 11,244 0 11,244 0 Summit, Town Of (Douglas) 107,117 7,498 7,498 14,996 0 Summit, Town Of (Juneau) 40,363 2,825 2,825 5,651 0 Sumner, Town Of (Barron) 37,140 2,600 2,600 5,200 0 Superior, Town Of (Douglas) 106,491 10,543 7,454 17,997 120,107
Contributions UnfundedName Covered Payroll Employer Paid* Employee Paid Total Liability Balance

158 COMPREHENSIVE ANNUAL FINANCIAL REPORT 2014
CONTRIBUTIONS PAID AND UAAL
Tainter, Town Of (Dunn) 118,042 8,263 8,263 16,526 0 Theresa, Town Of (Dodge) 74,335 5,307 5,305 10,612 0 Three Lakes, Town Of (Oneida) 685,471 57,017 47,983 105,000 0 Tiffany, Town Of (Dunn) 44,236 3,097 3,097 6,193 0 Trade Lake, Town Of (Burnett) 51,046 3,573 3,573 7,146 0 Trempealeau, Town (Trempeleau) 117,494 8,224 8,225 16,449 0 Trenton, Town Of (Washington) 208,135 15,204 14,569 29,774 0 Troy, Town Of (Walworth) 105,042 8,521 7,523 16,044 4,846 Turtle Lake, Town Of (Barron) 49,306 3,452 3,451 6,903 0 Unity, Town Of (Clark) 31,820 2,235 2,220 4,455 0 Vermont, Town Of (Dane) 73,758 5,292 5,292 10,584 0 Vernon, Town Of (Waukesha) 559,196 45,022 39,922 84,944 0 Verona, Town Of (Dane) 239,079 16,735 16,736 33,471 0 Vienna, Town Of (Dane) 159,034 11,517 11,517 23,034 0 Viroqua, Town Of (Vernon) 128,208 9,359 8,975 18,334 1,331 Wabeno, Town Of (Forest) 122,532 11,315 8,352 19,667 26,352 Walworth, Town Of (Walworth) 77,006 6,006 5,390 11,397 10,383 Warren, Town Of 40,580 2,841 2,841 5,681 0 Wascott, Town Of (Douglas) 210,794 16,137 14,257 30,394 0 Washington, Town Of (Door) 446,003 34,274 31,220 65,494 0 Washington, Town Of (Lacrosse) 50,906 7,127 0 7,127 0 Washington, Town Of (Vilas) 115,643 8,292 8,292 16,584 0 Washington, Town Of(Eauclaire) 325,495 22,785 22,785 45,569 0 Waterford, Town Of (Racine) 818,348 94,240 35,529 129,769 0 Waukesha, Town Of(Waukesha) 338,783 29,117 23,715 52,832 0 Wayne, Town Of (Lafayette) 56,408 3,957 3,940 7,897 0 Wescott, Town Of (Shawano) 245,674 17,197 17,197 34,394 0 West Bend, Town Of(Washington) 164,565 11,546 11,493 23,039 0 West Point, Town Of 23,000 1,782 1,782 3,565 0 West Sweden, Town Of (Polk) 41,049 2,873 2,873 5,747 0 Weston, Town Of (Marathon) 11,200 952 784 1,736 0 Westport, Town Of (Dane) 454,251 45,715 17,880 63,595 0 Wheatland, Town Of (Vernon) 48,709 3,410 3,410 6,819 0 Wheaton, Town Of (Chippewa) 104,213 7,425 7,425 14,849 0 Wilson, Town Of (Sheboygan) 137,691 9,766 9,766 19,533 0 Wilton, Town Of (Monroe) 39,444 2,761 2,761 5,522 0 Windsor, Town Of (Dane) 682,675 47,787 47,787 95,575 0 Winter, Town Of (Sawyer) 196,446 14,099 14,099 28,198 0 Wiota, Town Of (Lafayette) 38,181 2,676 2,670 5,345 0 Woodruff, Town Of (Oneida) 578,652 76,767 16,346 93,113 0 Yorkville, Town Of (Racine) 97,795 7,327 6,364 13,691 0 Total Towns (246) 68,919,976 6,032,355 4,460,196 10,492,551 1,359,877 Counties Adams County 11,066,583 836,031 775,811 1,611,841 0 Ashland County 6,477,355 553,468 394,082 947,550 0 Barron County 13,946,719 1,054,475 961,786 2,016,261 0 Bayfield County 7,716,343 651,216 483,044 1,134,260 0 Brown County 73,958,935 5,868,379 4,903,187 10,771,566 0 Buffalo County 4,656,431 379,528 294,221 673,750 0 Burnett County 7,047,951 526,628 495,020 1,021,648 0 Calumet County 12,531,666 930,156 879,021 1,809,177 0 Chippewa County 18,214,274 1,424,326 1,191,095 2,615,422 0 Clark County 19,818,369 1,549,812 1,282,219 2,832,032 0 Columbia County 22,947,444 1,869,305 1,440,257 3,309,562 0 Crawford County 6,036,362 530,217 358,498 888,715 0 Dane County 146,643,799 11,676,632 10,255,095 21,931,727 0 Dodge County 38,076,862 2,778,443 2,668,655 5,447,097 0 Door County 17,263,674 1,601,457 964,160 2,565,617 0 Douglas County 13,601,696 1,647,860 455,004 2,102,864 0 Dunn County 19,744,668 1,564,347 1,279,721 2,844,069 0 Eau Claire County 25,767,642 1,963,178 1,804,477 3,767,655 0 Florence County 3,073,165 242,917 216,804 459,721 0 Fond Du Lac County 37,742,253 2,948,608 2,467,571 5,416,179 0 Forest County 4,422,207 382,364 275,298 657,661 0 Grant County 16,007,910 1,174,907 1,122,483 2,297,390 0 Green County 16,321,637 1,288,823 1,082,019 2,370,842 0
Contributions UnfundedName Covered Payroll Employer Paid* Employee Paid Total Liability Balance

2014 COMPREHENSIVE ANNUAL FINANCIAL REPORT 159
CONTRIBUTIONS PAID AND UAAL
Green Lake County 8,852,136 700,977 579,073 1,280,050 0 Iowa County 9,310,865 710,871 652,738 1,363,609 0 Iron County 3,948,198 354,860 221,777 576,637 0 Jackson County 7,883,896 650,464 495,546 1,146,010 0 Jefferson County 25,012,937 2,312,584 1,410,952 3,723,536 0 Juneau County 10,852,445 896,904 717,276 1,614,180 0 Kenosha County 52,348,117 4,512,823 3,123,983 7,636,806 0 Kewaunee County 8,021,235 701,700 469,458 1,171,158 0 La Crosse County 49,049,387 3,600,058 3,360,828 6,960,887 0 Lafayette County 12,001,154 936,853 795,557 1,732,410 0 Langlade County 7,367,284 599,897 469,210 1,069,107 0 Lincoln County 15,567,327 1,151,625 1,091,389 2,243,014 0 Manitowoc County 21,537,221 1,887,610 1,263,106 3,150,716 0 Marathon County 39,317,347 2,955,977 2,755,804 5,711,781 0 Marinette County 16,438,902 1,279,992 1,091,794 2,371,786 0 Marquette County 7,287,215 561,193 511,397 1,072,590 0 Menominee County 3,369,212 251,209 236,837 488,046 0 Monroe County 14,683,347 1,155,651 977,257 2,132,908 0 Oconto County 13,033,210 1,102,030 786,412 1,888,442 0 Oneida County 12,780,692 976,901 896,547 1,873,448 0 Outagamie County 53,021,217 3,951,478 3,667,899 7,619,377 0 Ozaukee County 26,830,076 2,146,133 1,719,830 3,865,963 0 Pepin County 3,933,119 329,280 253,415 582,695 0 Pierce County 13,779,386 1,222,691 803,034 2,025,725 0 Polk County 20,067,237 1,604,207 1,274,146 2,878,352 0 Portage County 25,526,690 2,096,469 1,604,274 3,700,742 0 Price County 6,155,115 525,013 373,322 898,334 0 Racine County 40,818,992 3,843,649 2,842,025 6,685,674 0 Richland County 10,940,454 833,995 733,079 1,567,074 0 Rock County 57,733,976 4,781,737 3,673,799 8,455,536 0 Rusk County 14,268,666 1,161,256 895,509 2,056,765 0 Sauk County 26,706,620 2,241,950 1,695,680 3,937,629 0 Sawyer County 8,213,631 635,283 565,678 1,200,961 0 Shawano County 14,980,081 1,273,170 1,029,255 2,302,425 0 Sheboygan County 38,151,964 2,831,605 2,672,938 5,504,543 0 St Croix County 28,226,246 2,119,887 2,007,211 4,127,098 0 Taylor County 7,993,066 628,773 533,713 1,162,485 0 Trempealeau County 19,680,754 1,511,088 1,293,691 2,804,780 0 Vernon County 11,007,041 885,486 703,177 1,588,663 0 Vilas County 8,337,745 649,827 586,379 1,236,206 0 Walworth County 39,961,501 3,420,146 2,415,279 5,835,425 0 Washburn County 7,500,743 576,335 527,145 1,103,480 0 Washington County 35,859,016 2,881,052 2,320,916 5,201,967 0 Waukesha County 81,351,432 6,366,276 5,461,407 11,827,683 0 Waupaca County 20,225,627 1,510,508 1,412,088 2,922,596 0 Waushara County 12,267,001 976,025 828,299 1,804,324 0 Winnebago County 50,604,492 4,232,926 3,172,760 7,405,686 0 Wood County 25,864,500 2,066,113 1,666,470 3,732,583 0 Total Counties (71) 1,591,752,458 128,045,618 104,688,882 232,734,500 0 School Districts Abbotsford School District 3,219,763 225,383 225,384 450,767 0 Adams-Friendship Area Sch Dist 10,200,500 714,035 714,035 1,428,070 0 Albany School District 2,772,616 195,741 192,425 388,166 0 Algoma School District 3,737,996 261,659 261,661 523,320 0 Alma Center-Humbrd-Meril Sch D 3,388,199 237,174 237,174 474,348 0 Alma School District 1,724,000 120,680 120,680 241,360 0 Almond-Bancroft School Dist 2,423,245 169,628 169,627 339,254 0 Altoona School District 8,486,195 594,036 594,031 1,188,067 0 Amery School District 10,375,540 726,288 726,287 1,452,576 0 Antigo Unified School District 13,648,754 955,410 955,415 1,910,826 0 Appleton Area School District 87,953,382 6,156,811 6,156,662 12,313,474 0 Arbor Vitae-Woodruff Jsd #1 2,602,201 182,154 182,154 364,308 0 Arcadia School District 6,799,222 475,944 475,947 951,891 0 Argyle School District 1,657,805 116,046 116,047 232,093 0 Arrowhead Union High Sch Dist 12,817,990 897,240 897,279 1,794,519 0 Ashland School District 11,444,427 801,117 801,103 1,602,220 0
Contributions UnfundedName Covered Payroll Employer Paid* Employee Paid Total Liability Balance
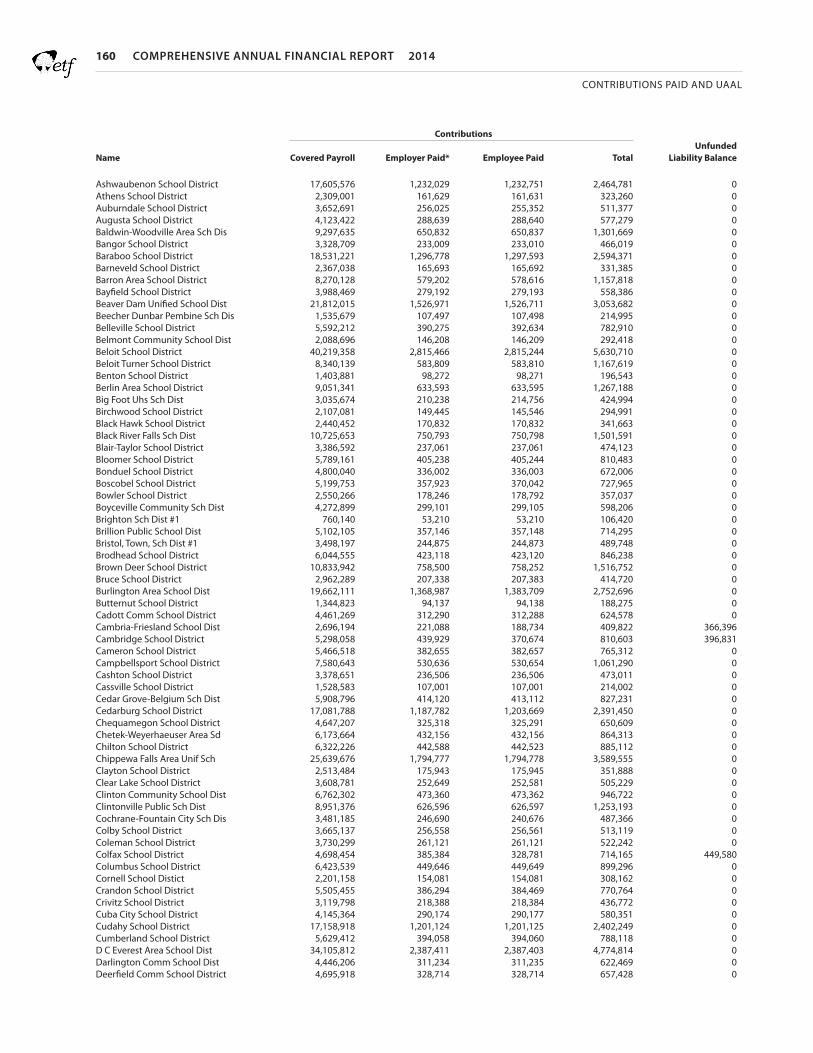
160 COMPREHENSIVE ANNUAL FINANCIAL REPORT 2014
CONTRIBUTIONS PAID AND UAAL
Ashwaubenon School District 17,605,576 1,232,029 1,232,751 2,464,781 0 Athens School District 2,309,001 161,629 161,631 323,260 0 Auburndale School District 3,652,691 256,025 255,352 511,377 0 Augusta School District 4,123,422 288,639 288,640 577,279 0 Baldwin-Woodville Area Sch Dis 9,297,635 650,832 650,837 1,301,669 0 Bangor School District 3,328,709 233,009 233,010 466,019 0 Baraboo School District 18,531,221 1,296,778 1,297,593 2,594,371 0 Barneveld School District 2,367,038 165,693 165,692 331,385 0 Barron Area School District 8,270,128 579,202 578,616 1,157,818 0 Bayfield School District 3,988,469 279,192 279,193 558,386 0 Beaver Dam Unified School Dist 21,812,015 1,526,971 1,526,711 3,053,682 0 Beecher Dunbar Pembine Sch Dis 1,535,679 107,497 107,498 214,995 0 Belleville School District 5,592,212 390,275 392,634 782,910 0 Belmont Community School Dist 2,088,696 146,208 146,209 292,418 0 Beloit School District 40,219,358 2,815,466 2,815,244 5,630,710 0 Beloit Turner School District 8,340,139 583,809 583,810 1,167,619 0 Benton School District 1,403,881 98,272 98,271 196,543 0 Berlin Area School District 9,051,341 633,593 633,595 1,267,188 0 Big Foot Uhs Sch Dist 3,035,674 210,238 214,756 424,994 0 Birchwood School District 2,107,081 149,445 145,546 294,991 0 Black Hawk School District 2,440,452 170,832 170,832 341,663 0 Black River Falls Sch Dist 10,725,653 750,793 750,798 1,501,591 0 Blair-Taylor School District 3,386,592 237,061 237,061 474,123 0 Bloomer School District 5,789,161 405,238 405,244 810,483 0 Bonduel School District 4,800,040 336,002 336,003 672,006 0 Boscobel School District 5,199,753 357,923 370,042 727,965 0 Bowler School District 2,550,266 178,246 178,792 357,037 0 Boyceville Community Sch Dist 4,272,899 299,101 299,105 598,206 0 Brighton Sch Dist #1 760,140 53,210 53,210 106,420 0 Brillion Public School Dist 5,102,105 357,146 357,148 714,295 0 Bristol, Town, Sch Dist #1 3,498,197 244,875 244,873 489,748 0 Brodhead School District 6,044,555 423,118 423,120 846,238 0 Brown Deer School District 10,833,942 758,500 758,252 1,516,752 0 Bruce School District 2,962,289 207,338 207,383 414,720 0 Burlington Area School Dist 19,662,111 1,368,987 1,383,709 2,752,696 0 Butternut School District 1,344,823 94,137 94,138 188,275 0 Cadott Comm School District 4,461,269 312,290 312,288 624,578 0 Cambria-Friesland School Dist 2,696,194 221,088 188,734 409,822 366,396 Cambridge School District 5,298,058 439,929 370,674 810,603 396,831 Cameron School District 5,466,518 382,655 382,657 765,312 0 Campbellsport School District 7,580,643 530,636 530,654 1,061,290 0 Cashton School District 3,378,651 236,506 236,506 473,011 0 Cassville School District 1,528,583 107,001 107,001 214,002 0 Cedar Grove-Belgium Sch Dist 5,908,796 414,120 413,112 827,231 0 Cedarburg School District 17,081,788 1,187,782 1,203,669 2,391,450 0 Chequamegon School District 4,647,207 325,318 325,291 650,609 0 Chetek-Weyerhaeuser Area Sd 6,173,664 432,156 432,156 864,313 0 Chilton School District 6,322,226 442,588 442,523 885,112 0 Chippewa Falls Area Unif Sch 25,639,676 1,794,777 1,794,778 3,589,555 0 Clayton School District 2,513,484 175,943 175,945 351,888 0 Clear Lake School District 3,608,781 252,649 252,581 505,229 0 Clinton Community School Dist 6,762,302 473,360 473,362 946,722 0 Clintonville Public Sch Dist 8,951,376 626,596 626,597 1,253,193 0 Cochrane-Fountain City Sch Dis 3,481,185 246,690 240,676 487,366 0 Colby School District 3,665,137 256,558 256,561 513,119 0 Coleman School District 3,730,299 261,121 261,121 522,242 0 Colfax School District 4,698,454 385,384 328,781 714,165 449,580 Columbus School District 6,423,539 449,646 449,649 899,296 0 Cornell School Distict 2,201,158 154,081 154,081 308,162 0 Crandon School District 5,505,455 386,294 384,469 770,764 0 Crivitz School District 3,119,798 218,388 218,384 436,772 0 Cuba City School District 4,145,364 290,174 290,177 580,351 0 Cudahy School District 17,158,918 1,201,124 1,201,125 2,402,249 0 Cumberland School District 5,629,412 394,058 394,060 788,118 0 D C Everest Area School Dist 34,105,812 2,387,411 2,387,403 4,774,814 0 Darlington Comm School Dist 4,446,206 311,234 311,235 622,469 0 Deerfield Comm School District 4,695,918 328,714 328,714 657,428 0
Contributions UnfundedName Covered Payroll Employer Paid* Employee Paid Total Liability Balance

2014 COMPREHENSIVE ANNUAL FINANCIAL REPORT 161
CONTRIBUTIONS PAID AND UAAL
Deforest Area School District 19,620,368 1,373,425 1,373,427 2,746,851 0 Delavan-Darien School District 14,159,470 992,069 990,257 1,982,326 0 Denmark School District 7,742,971 542,010 542,006 1,084,016 0 Depere Unified School District 21,538,802 1,507,715 1,507,717 3,015,432 0 Desoto Area School District 3,370,639 235,944 235,946 471,890 0 Dodgeland School District 5,238,982 366,728 366,729 733,458 0 Dodgeville School District 6,977,067 488,393 488,397 976,789 0 Drummond School District 2,365,002 165,580 165,521 331,100 0 Durand School District 4,802,665 336,185 336,188 672,373 0 East Troy Community Sch Dist 8,998,269 629,933 629,825 1,259,758 0 Eau Claire Area School Dist 61,246,881 4,264,438 4,310,125 8,574,563 0 Edgar School District 3,112,629 217,887 217,881 435,768 0 Edgerton School District 10,568,083 739,765 739,767 1,479,532 0 Elcho School District 2,522,410 178,188 174,949 353,137 0 Eleva-Strum School District 3,753,548 262,747 262,749 525,497 0 Elk Mound Area School District 5,971,140 418,021 417,938 835,960 0 Elkhart Lake-Glenbeulah Sch Ds 2,802,191 196,153 196,153 392,307 0 Elkhorn Area School District 17,276,953 1,209,384 1,209,390 2,418,773 0 Ellsworth Comm Sch Dist 8,819,224 617,349 617,342 1,234,691 0 Elmbrook School District 48,610,258 3,402,808 3,402,628 6,805,436 0 Elmwood School District 2,370,459 165,865 165,999 331,864 0 Erin Sch Dist #2 1,372,009 96,041 96,040 192,081 0 Evansville Comm Sch Dist 9,985,239 697,698 700,235 1,397,933 0 Fall Creek School District 4,414,991 309,045 309,053 618,099 0 Fall River School District 2,266,525 162,987 154,327 317,314 0 Fennimore Community Sch Dist 5,194,176 363,592 363,592 727,185 0 Flambeau School District 3,388,190 237,173 237,173 474,347 0 Florence County Sch Dist 2,929,280 204,903 205,196 410,099 0 Fond Du Lac School District 43,612,777 3,042,745 3,063,044 6,105,789 0 Fontana Jt Sch Dist #8 Etal 1,832,154 128,250 128,251 256,502 0 Fort Atkinson School District 16,422,849 1,150,485 1,148,714 2,299,199 0 Fox Point Jt Sch Dist # 2 Etal 6,420,636 447,608 451,281 898,889 0 Franklin Public School Dist 27,876,137 1,950,369 1,952,290 3,902,659 0 Frederic School District 2,946,928 207,367 205,203 412,570 0 Freedom Area School District 8,652,205 605,652 605,657 1,211,309 0 Friess Lake School District 992,007 69,675 69,206 138,881 0 Galesville School Distrct Etal 8,264,729 578,531 578,531 1,157,062 0 Geneva Jt Sch Dist #4 Etal 976,480 69,311 67,396 136,707 0 Genoa City Jt Sch Dist #2 Etal 3,278,004 229,460 229,461 458,921 0 Germantown School District 23,773,176 1,654,892 1,673,353 3,328,245 0 Gibraltar Area School District 5,049,554 353,610 353,328 706,938 0 Gillett School District 3,535,017 247,451 247,451 494,902 0 Gilman School District 1,948,225 136,375 136,376 272,751 0 Gilmanton School District 705,712 49,400 49,400 98,800 0 Glendale-River Hills Sch Dist 7,057,424 494,071 493,968 988,039 0 Glenwood City School District 3,939,594 275,772 275,771 551,543 0 Goodman-Armstrong School Dist 909,282 63,650 63,650 127,300 0 Grafton School District 13,069,141 915,000 914,679 1,829,680 0 Granton Area School District 1,487,976 104,159 104,158 208,317 0 Grantsburg School District 5,203,869 365,996 362,546 728,542 0 Green Bay Area Public Schools 136,779,918 9,577,786 9,571,402 19,149,189 0 Green Lake School District 2,004,345 140,304 140,304 280,608 0 Greendale School District 17,156,664 1,200,976 1,200,957 2,401,933 0 Greenfield School District 20,355,628 1,419,587 1,430,201 2,849,788 0 Greenwood School District 2,202,084 154,169 154,123 308,292 0 Gresham School Dist 1,617,753 113,271 113,215 226,485 0 Hamilton School District 26,643,312 1,866,318 1,863,746 3,730,064 0 Hartford Jt Sch Dist #1 Etal 10,000,577 700,040 700,041 1,400,081 0 Hartford Union High Sch Dist 8,488,466 591,373 597,012 1,188,385 0 Hartland Jt Sch Dist #3 Etal 6,932,207 485,254 485,255 970,509 0 Hayward Community School Dist 9,905,210 693,363 693,367 1,386,729 0 Herman Sch Dist #22 468,671 37,493 32,807 70,301 179,502 Highland School District 1,315,571 92,093 92,087 184,180 0 Hilbert School District 2,606,466 182,453 182,452 364,905 0 Hillsboro School District 3,250,151 227,511 227,510 455,021 0 Holmen School District 25,881,034 1,811,647 1,811,698 3,623,345 0 Horicon School District 4,510,203 315,713 315,715 631,428 0
Contributions UnfundedName Covered Payroll Employer Paid* Employee Paid Total Liability Balance

162 COMPREHENSIVE ANNUAL FINANCIAL REPORT 2014
CONTRIBUTIONS PAID AND UAAL
Hortonville Area School Dist 18,619,765 1,303,385 1,303,382 2,606,767 0 Howards Grove School District 5,235,809 366,561 366,453 733,013 0 Howard-Suamico School District 28,478,506 1,991,795 1,995,196 3,986,991 0 Hudson School District 32,287,584 2,260,133 2,260,128 4,520,262 0 Hurley School District 3,609,180 252,642 252,644 505,285 0 Hustisford School District 2,493,820 174,777 174,358 349,135 0 Independence School District 2,225,256 156,196 155,340 311,536 0 Iola-Scandinavia School Dist 3,788,507 265,956 264,435 530,391 0 Iowa-Grant School District 4,978,129 348,469 348,469 696,938 0 Ithaca School District 2,330,480 163,222 163,046 326,267 0 Janesville School District 63,306,487 4,431,217 4,431,691 8,862,908 0 Jefferson School District 11,338,306 793,681 793,681 1,587,363 0 Johnson Creek School District 4,078,384 285,487 285,487 570,974 0 Juda School District 1,501,531 105,339 104,875 210,214 0 Kansasville Dover Dist #1 564,647 39,525 39,525 79,051 0 Kaukauna Area School District 19,980,071 1,393,784 1,403,426 2,797,210 0 Kenosha Unified Sch Dist #1 141,510,815 9,921,156 9,890,358 19,811,514 0 Kettle Moraine School District 23,892,884 1,672,504 1,672,500 3,345,004 0 Kewaskum School District 10,654,676 739,918 751,737 1,491,655 0 Kewaunee School District 5,238,067 366,663 366,666 733,329 0 Kickapoo Area School District 2,869,686 200,887 200,869 401,756 0 Kiel Area School District 7,672,067 659,797 537,045 1,196,842 0 Kimberly Area School District 24,215,128 1,695,056 1,695,062 3,390,118 0 Kohler School District 3,939,634 275,773 275,776 551,549 0 La Crosse School District 48,932,237 3,424,997 3,425,516 6,850,513 0 Lac Du Flambeau Sch Dist #1 5,173,303 362,131 362,131 724,262 0 Ladysmith-Hawkins Sch Dist 5,721,812 400,526 400,528 801,054 0 Lafarge School District 1,784,073 124,885 124,885 249,770 0 Lake Country Sch Dist 3,121,039 217,910 219,035 436,945 0 Lake Geneva Jt Sch Dis #1 Etal 11,387,379 797,116 797,117 1,594,233 0 Lake Geneva School District 9,602,849 672,198 672,200 1,344,399 0 Lake Holcombe School District 2,005,227 140,366 140,366 280,732 0 Lake Mills Area School Dist 7,375,756 516,411 516,194 1,032,606 0 Lakeland Union High Sch Dist 6,185,708 432,999 433,000 865,999 0 Lancaster Comm Sch Dist 5,578,314 390,482 390,482 780,964 0 Laona School District 1,464,808 102,537 102,537 205,073 0 Lena Public School District 2,050,934 143,565 143,566 287,131 0 Linn Jt Sch Dist #4 Etal 870,744 61,073 60,831 121,904 0 Linn Jt Sch Dist #6 Etal 656,910 45,984 45,984 91,967 0 Little Chute Area School Dist 8,593,633 601,553 601,555 1,203,109 0 Lodi School District 8,929,532 624,285 625,850 1,250,134 0 Lomira School District 5,998,475 419,893 419,894 839,787 0 Loyal School District 2,738,724 192,790 190,631 383,421 0 Luck School District 3,075,808 215,293 215,320 430,613 0 Luxemburg-Casco School Dist 8,491,555 593,937 594,881 1,188,818 0 Madison Metro School District 213,983,673 14,963,827 14,993,887 29,957,714 0 Manawa School District 3,910,781 273,754 273,756 547,509 0 Manitowoc Public School Dist 31,813,322 2,226,930 2,226,935 4,453,865 0 Maple Dale-Indian Hill Sch Dis 3,822,428 317,846 259,708 577,554 1,250,674 Maple School District 7,438,373 520,684 520,688 1,041,372 0 Marathon City School District 2,941,119 205,878 205,879 411,757 0 Marinette School District 10,417,674 729,237 729,237 1,458,474 0 Marion School District 1,957,845 137,049 137,050 274,098 0 Markesan School District 4,394,897 307,642 307,644 615,286 0 Marshall Jt Sch Dist #2 Etal 7,174,883 504,231 500,252 1,004,484 0 Marshfield Unified School Dist 21,715,697 1,566,497 1,473,701 3,040,198 0 Mauston School District 8,389,370 583,620 590,892 1,174,512 0 Mayville School District 7,162,167 501,257 501,446 1,002,703 0 Mcfarland School District 14,811,127 1,040,419 1,033,139 2,073,558 0 Medford Area Public Schl Dist 11,850,077 829,504 829,506 1,659,011 0 Mellen School District 1,282,844 93,271 86,327 179,598 0 Melrose-Mindoro School Dist 4,355,866 304,910 304,912 609,821 0 Menasha Joint School District 20,908,290 1,462,095 1,465,066 2,927,161 0 Menominee Indian School Dist 7,700,640 535,842 542,247 1,078,090 0 Menomonee Falls School Distrct 27,545,397 1,924,434 1,931,921 3,856,356 0 Menomonie Area School District 18,863,936 1,320,900 1,320,051 2,640,951 0 Mequon-Thiensville School Dist 21,251,565 1,483,761 1,491,458 2,975,219 0
Contributions UnfundedName Covered Payroll Employer Paid* Employee Paid Total Liability Balance

2014 COMPREHENSIVE ANNUAL FINANCIAL REPORT 163
CONTRIBUTIONS PAID AND UAAL
Mercer School District 1,329,246 105,928 80,166 186,095 0 Merrill Area Common Pub Sch 16,428,345 1,150,053 1,149,915 2,299,968 0 Merton Community School Dist 4,606,946 322,486 322,486 644,972 0 Middleton-Cross Plns Sch Dist 42,732,742 2,983,855 2,998,729 5,982,584 0 Milton School District 17,159,106 1,201,149 1,201,126 2,402,275 0 Milwaukee Teachers Retirem Sys 369,586,810 25,871,749 25,870,404 51,742,153 0 Mineral Point Unif Sch Dist 3,803,283 266,230 266,230 532,460 0 Minocqua Jt Sch Dist #1 M-H-Lt 3,555,849 248,909 248,910 497,819 0 Mishicot School District 5,209,855 364,690 364,690 729,380 0 Mondovi School District 5,602,579 392,181 392,180 784,361 0 Monona Grove School District 18,318,844 1,281,952 1,282,686 2,564,638 0 Monroe School District 16,346,879 1,144,282 1,144,281 2,288,563 0 Montello School District 4,154,811 290,837 290,837 581,673 0 Monticello School District 2,234,193 156,394 156,393 312,787 0 Mosinee School District 11,666,854 816,680 816,680 1,633,360 0 Mount Horeb Area School Dist 13,382,645 932,157 941,413 1,873,570 0 Mukwonago School District 25,061,949 1,754,328 1,754,345 3,508,673 0 Muskego-Norway School District 28,175,879 1,970,424 1,974,199 3,944,623 0 Necedah Area School District 4,166,133 290,528 292,730 583,259 0 Neenah Joint School District 34,673,406 2,562,836 2,291,441 4,854,277 0 Neillsville School District 4,988,369 349,185 349,187 698,372 0 Nekoosa School District 6,313,290 441,930 441,931 883,861 0 Neosho Jt Sch Dist #3 Etal 1,214,507 100,804 85,015 185,820 223,476 New Auburn School District 2,047,125 143,298 143,299 286,598 0 New Berlin School District 24,193,417 1,693,537 1,693,542 3,387,078 0 New Glarus School District 5,397,914 377,853 377,855 755,708 0 New Holstein School District 6,025,028 421,750 421,754 843,504 0 New Lisbon School District 3,517,313 246,213 246,211 492,424 0 New London School District 12,076,368 845,809 844,883 1,690,692 0 New Richmond School District 16,587,730 1,161,702 1,160,580 2,322,282 0 Niagara School District 2,707,143 189,500 189,500 379,000 0 Nicolet High School District 10,074,890 705,240 705,244 1,410,485 0 Norris School District 1,187,521 100,939 83,127 184,066 13,163 North Cape Consolidated S D 1,173,915 83,058 81,290 164,348 0 North Crawford School District 3,021,781 211,544 211,505 423,049 0 North Fond Du Lac Sch Dist 6,761,750 473,322 473,323 946,645 0 North Lake School District 1,762,429 123,370 123,370 246,740 0 North Lakeland School District 1,285,661 89,874 90,119 179,993 0 Northern Ozaukee School Dist 4,708,161 329,571 329,571 659,143 0 Northland Pines School Dist 9,381,033 656,661 656,683 1,313,345 0 Northwood School District 2,453,513 175,346 168,146 343,492 0 Norwalk-Ontario School Dist 4,114,792 288,035 288,035 576,071 0 Norway-Raymond Jt#7 Sd 394,246 32,722 27,597 60,320 72,812 Oak Creek-Franklin Jt Sch Dist 35,262,069 2,425,312 2,511,378 4,936,690 0 Oakfield School District 2,966,940 207,685 207,686 415,372 0 Oconomowoc Area School Dist 22,746,966 1,592,287 1,592,288 3,184,575 0 Oconto Falls Public Sch Dist 10,257,713 718,039 718,041 1,436,080 0 Oconto Unified School District 6,373,748 446,163 446,161 892,325 0 Omro School District 6,754,260 471,537 474,060 945,596 0 Onalaska School District 17,880,425 1,251,630 1,251,629 2,503,260 0 Oostburg School District 5,277,230 369,406 369,406 738,812 0 Oregon School District 23,112,504 1,602,001 1,633,750 3,235,751 0 Osceola School District 10,658,345 746,084 746,084 1,492,168 0 Oshkosh Area School District 55,757,935 3,882,868 3,923,243 7,806,111 0 Osseo-Fairchild School Dist 4,955,704 346,899 346,899 693,799 0 Owen-Withee School District 2,906,939 203,485 203,486 406,971 0 Palmyra-Eagle Area School Dist 5,526,727 386,871 386,871 773,742 0 Pardeeville Area School Dist 4,915,638 403,083 344,094 747,177 597,027 Paris Jt Sch Dist #1 Etal 1,077,758 75,456 75,430 150,886 0 Parkview School District 5,619,479 394,352 392,375 786,727 0 Pecatonica Area School Dist 2,931,973 205,535 204,941 410,476 0 Pepin Area School District 1,835,277 128,469 128,470 256,939 0 Peshtigo School District 6,219,826 435,387 435,389 870,776 0 Pewaukee School District 14,983,365 1,048,260 1,049,412 2,097,671 0 Phelps School District 1,179,854 82,620 82,560 165,180 0 Phillips School District 4,330,324 303,123 303,122 606,245 0 Pittsville School District 3,407,663 238,536 238,537 477,073 0
Contributions UnfundedName Covered Payroll Employer Paid* Employee Paid Total Liability Balance

164 COMPREHENSIVE ANNUAL FINANCIAL REPORT 2014
CONTRIBUTIONS PAID AND UAAL
Platteville School District 8,975,928 628,314 628,316 1,256,630 0 Plum City School District 1,232,503 86,275 86,275 172,550 0 Plymouth Joint School District 13,355,444 934,878 934,884 1,869,762 0 Port Edwards School Distict 2,435,831 170,549 170,468 341,016 0 Port Washington-Saukville Sch 16,323,993 1,173,696 1,111,663 2,285,359 0 Portage Community School Dist 13,269,281 928,848 928,852 1,857,699 0 Potosi School District 2,479,733 173,581 173,581 347,163 0 Poynette School District 5,828,830 408,018 408,018 816,036 0 Prairie Du Chien Area Sch Dist 7,179,496 502,565 502,564 1,005,129 0 Prairie Farm Public Sch Dist 2,082,519 145,777 145,776 291,553 0 Prentice School District 2,612,381 182,867 182,867 365,733 0 Prescott School District 8,369,144 587,052 584,628 1,171,680 0 Princeton School District 2,247,453 175,470 157,153 332,623 382,881 Pulaski Community School Dist 23,121,477 1,612,512 1,624,495 3,237,007 0 Racine Unified School District 133,929,709 9,380,439 9,369,720 18,750,159 0 Randall Jt Sch Dist #1 Etal 3,600,573 254,322 249,759 504,080 0 Randolph School District 3,306,422 231,449 231,450 462,899 0 Random Lake School District 5,715,972 401,437 398,799 800,236 0 Raymond Sch Dist #14 2,324,485 162,450 162,978 325,428 0 Reedsburg School District 15,737,228 1,102,990 1,100,222 2,203,212 0 Reedsville School District 3,580,242 250,616 250,618 501,234 0 Rhinelander School District 13,086,654 916,064 916,068 1,832,132 0 Rib Lake School District 2,377,368 166,415 166,416 332,832 0 Rice Lake Area School District 14,165,808 991,492 991,721 1,983,213 0 Richfield Jsd #1 1,412,548 99,277 98,480 197,757 0 Richland School District 7,849,688 549,480 549,476 1,098,956 0 Richmond School District 2,155,678 149,896 151,899 301,795 0 Rio Community School District 2,988,849 207,522 210,917 418,439 0 Ripon Area School District 10,036,208 702,534 702,535 1,405,069 0 River Falls School District 17,456,504 1,221,015 1,222,896 2,443,911 0 River Ridge School District 3,159,612 221,172 221,173 442,346 0 River Valley School District 8,384,543 587,204 586,633 1,173,836 0 Riverdale School District 3,287,194 230,103 230,104 460,207 0 Rosendale-Brandon School Dist 5,430,164 380,111 380,112 760,223 0 Rosholt School District 2,963,029 207,412 207,412 414,824 0 Royall School District 3,318,546 232,297 232,299 464,596 0 Rubicon Jt Sch Dist #6 Etal 449,230 31,446 31,446 62,892 0 Salem School District 5,535,613 460,455 386,493 846,949 597,104 Sauk Prairie School District 15,706,993 1,100,020 1,098,959 2,198,979 0 Seneca School District 1,634,063 114,384 114,385 228,769 0 Sevastopol School District 3,498,022 244,861 244,862 489,723 0 Seymour Community School Dist 12,875,587 901,291 901,292 1,802,582 0 Sharon Jt Sch Dist # 11 Etal 1,462,551 103,321 101,436 204,757 0 Shawano School Dist 13,642,351 954,633 955,297 1,909,929 0 Sheboygan Area School District 64,314,368 4,502,490 4,501,522 9,004,012 0 Sheboygan Falls School Dist 10,164,666 711,526 711,527 1,423,053 0 Shell Lake School District 4,021,190 281,483 281,483 562,967 0 Shiocton School District 4,056,268 284,328 283,549 567,877 0 Shorewood School District 13,959,685 969,758 984,598 1,954,356 0 Shullsburg School District 2,002,469 166,204 140,174 306,378 167,991 Silver Lake Jt Sch Dis #1 Etal 2,562,627 179,383 179,384 358,768 0 Siren School District 3,091,492 216,333 216,476 432,809 0 Slinger School District 15,005,884 1,050,411 1,050,413 2,100,824 0 Solon Springs School District 1,840,839 128,860 128,857 257,717 0 Somerset School District 9,182,410 642,767 642,771 1,285,537 0 South Milwaukee School Dist 20,601,595 1,441,272 1,442,951 2,884,223 0 South Shore School District 1,342,297 94,168 93,754 187,922 0 Southern Door County Sch Dist 6,228,167 435,975 435,968 871,943 0 Southwestern Wisc Comm Sch Dis 2,545,346 178,173 178,175 356,349 0 Sparta Area School District 15,028,048 1,051,962 1,051,965 2,103,927 0 Spencer School District 3,583,382 250,836 250,837 501,673 0 Spooner Area School District 7,484,064 524,270 523,498 1,047,769 0 Spring Valley School District 4,262,676 298,387 298,387 596,775 0 St Croix Central Sch Dist 7,885,283 551,970 551,970 1,103,940 0 St Croix Falls School District 6,794,685 475,627 475,629 951,256 0 St Francis School District #6 6,533,899 453,986 460,760 914,746 0 Stanley-Boyd Area School Dist 5,441,184 380,883 380,883 761,766 0
Contributions UnfundedName Covered Payroll Employer Paid* Employee Paid Total Liability Balance

2014 COMPREHENSIVE ANNUAL FINANCIAL REPORT 165
CONTRIBUTIONS PAID AND UAAL
Stevens Point Area Pub Sch Dis 40,034,258 2,811,110 2,793,686 5,604,796 0 Stockbridge Sch Dist 1,092,006 75,554 77,327 152,881 0 Stone Bank School District 2,191,568 152,217 154,602 306,820 0 Stoughton Area School District 19,824,482 1,387,413 1,388,014 2,775,427 0 Stratford School District 4,342,464 303,973 303,972 607,945 0 Sturgeon Bay School District 7,805,519 546,387 546,386 1,092,773 0 Sun Prairie Area Sch Dis 47,507,723 3,325,265 3,325,816 6,651,081 0 Superior School District 28,754,988 2,005,568 2,020,131 4,025,698 0 Suring Public School District 2,403,535 168,248 168,247 336,495 0 Swallow School District 2,847,400 199,318 199,318 398,636 0 Thorp School District 3,266,284 228,727 228,552 457,280 0 Three Lakes School District 4,113,599 287,950 287,954 575,904 0 Tigerton School District 1,209,752 84,683 84,683 169,365 0 Tomah Area School District 17,439,794 1,220,784 1,220,787 2,441,571 0 Tomahawk School District 7,173,805 502,166 502,167 1,004,333 0 Tomorrow River School District 5,757,457 403,022 403,022 806,044 0 Trevor-Wilmot Cons Gr S.D. 3,377,753 240,750 232,136 472,885 0 Tri-County Area Sch Dist-Plnfd 4,089,121 286,235 286,242 572,477 0 Turtle Lake School District 2,319,175 162,342 162,342 324,684 0 Twin Lakes Sch Dist #4 2,565,301 179,571 179,571 359,142 0 Two Rivers Public School Dist 10,020,734 701,451 701,451 1,402,903 0 Union Grove Jt Sch Dis #1 Etal 4,649,935 325,583 325,408 650,991 0 Union Grove Union High Sch Dis 4,859,977 340,198 340,199 680,397 0 Unity School District 6,411,811 449,458 448,196 897,654 0 Valders Area School District 5,988,556 418,832 419,566 838,398 0 Verona Area School District 34,790,332 2,435,376 2,435,270 4,870,647 0 Viroqua Area School District 6,077,077 425,394 425,396 850,791 0 Wabeno Area School District 3,088,862 216,219 216,222 432,441 0 Walworth Jt Sch Dist # 1 Etal 2,428,403 169,906 170,071 339,976 0 Washburn School District 3,662,851 256,399 256,400 512,799 0 Washington School District 638,871 52,056 44,414 96,470 79,010 Washington-Caldwell Sch Dist 1,162,851 81,402 81,397 162,799 0 Waterford Union High Sch Dist 7,047,206 493,315 493,294 986,609 0 Waterford Vil Jt Sch Dist #1 6,685,750 463,284 472,721 936,005 0 Waterloo School District 4,594,019 321,581 321,581 643,163 0 Watertown Unified School Dist 22,512,117 1,557,677 1,594,019 3,151,696 0 Waukesha School District 78,615,846 5,349,029 5,657,190 11,006,219 0 Waunakee Community School Dist 22,917,086 1,604,196 1,604,196 3,208,392 0 Waupaca School District 13,747,134 962,300 962,299 1,924,599 0 Waupun Area School District 10,074,687 746,250 664,206 1,410,456 0 Wausau School District 56,913,887 3,982,980 3,984,964 7,967,944 0 Wausaukee School District 2,163,014 151,412 151,410 302,822 0 Wautoma Area School District 9,144,275 640,568 639,631 1,280,198 0 Wauwatosa School District 42,188,567 2,953,228 2,953,172 5,906,399 0 Wauzeka Jt Sch Dist Etal 2,183,553 153,068 152,629 305,697 0 Webster School District 4,129,024 289,239 288,825 578,063 0 West Allis-West Milw Sch Dist 55,591,510 3,890,000 3,892,812 7,782,811 0 West Bend Jt Sch Dist #1 39,381,219 2,756,683 2,756,688 5,513,371 0 West Depere School District 15,899,785 1,112,983 1,112,987 2,225,970 0 West Salem School District 10,187,973 713,157 713,160 1,426,316 0 Westby Area School District 5,794,636 405,624 405,626 811,249 0 Westfield School District 5,025,332 351,772 351,774 703,547 0 Weston School District 2,018,520 142,520 140,073 282,593 0 Westosha Central High Sch Dist 6,856,894 479,982 479,983 959,965 0 Weyauwega-Fremont School Dist 5,002,860 350,199 350,201 700,400 0 Wheatland Jt Sch Dist #1 Etal 2,714,573 231,841 188,918 420,759 86,923 White Lake School District 1,144,164 80,092 80,091 160,183 0 Whitefish Bay School District 18,987,254 1,329,107 1,329,108 2,658,216 0 Whitehall School District 3,867,942 270,757 270,755 541,512 0 Whitewater Unified School Dist 10,892,777 762,493 762,496 1,524,989 0 Whitnall School District 14,461,830 1,012,327 1,012,329 2,024,656 0 Wild Rose School District 3,394,694 237,628 237,629 475,257 0 Williams Bay School District 3,333,441 233,329 233,353 466,682 0 Wilmot Union High School Dist 7,267,174 508,052 509,352 1,017,404 0 Winneconne Comm School Dist 8,067,291 565,250 564,171 1,129,421 0 Winter School District 2,078,046 145,483 145,443 290,926 0 Wisconsin Dells School Dist 10,244,993 719,154 715,145 1,434,299 0
Contributions UnfundedName Covered Payroll Employer Paid* Employee Paid Total Liability Balance

166 COMPREHENSIVE ANNUAL FINANCIAL REPORT 2014
CONTRIBUTIONS PAID AND UAAL
Wisconsin Heights School Dist 4,323,041 302,613 302,613 605,226 0 Wisconsin Rapids School Dist 33,599,478 2,351,613 2,352,314 4,703,927 0 Wittenberg-Birnamwood Sch Dist 6,245,699 437,199 437,199 874,398 0 Wonewoc & Union Center Sch Dis 2,138,257 149,678 149,678 299,356 0 Wrightstown Community Sch Dist 6,052,786 423,693 423,697 847,390 0 Yorkville Jt Sch Dist #2 Etal 2,199,734 153,981 153,982 307,963 0 Total School Districts (424) 4,976,666,616 348,893,024 348,429,203 697,322,227 4,863,369 Technical Colleges Blackhawk Technical College 16,059,648 1,124,180 1,124,171 2,248,351 0 Chippewa Valley Tech College 31,248,811 2,190,017 2,184,817 4,374,833 0 Fox Valley Technical College 58,054,078 5,943,538 2,184,033 8,127,571 0 Gateway Tech College 45,832,538 3,208,438 3,208,117 6,416,555 0 Lakeshore Technical College 18,257,138 1,277,998 1,278,001 2,555,999 0 Madison Area Tech College 91,871,959 418,187 12,443,887 12,862,074 0 Mid-State Technical College 15,057,878 1,054,051 1,054,052 2,108,103 0 Milwaukee Area Tech College 109,043,390 8,799,249 6,466,825 15,266,075 0 Moraine Park Technical College 24,821,863 1,737,527 1,737,534 3,475,061 0 Nicolet Area Technical College 11,575,952 810,316 810,317 1,620,633 0 North Central Tech College 25,366,952 1,775,558 1,775,815 3,551,373 0 Northeast Wisc Tech College 51,213,086 3,584,904 3,584,928 7,169,832 0 Southwest Wisc Tech College 12,149,964 850,640 850,355 1,700,995 0 Waukesha Co Technical College 41,492,596 2,904,482 2,904,481 5,808,963 0 Western Tech College 27,347,818 1,914,348 1,914,346 3,828,695 0 Wisconsin Indianhead Tech Coll 25,616,447 1,797,526 1,788,777 3,586,303 0 Total Technical Colleges (16) 605,010,119 39,390,960 45,310,456 84,701,417 0 CESAs CESA #1 5,119,694 424,934 358,379 783,313 387,871 CESA #2 6,117,576 428,230 428,231 856,461 0 CESA #3, Fennimore 1,700,450 119,031 119,032 238,063 0 CESA #4, Lacrosse 2,026,947 166,444 141,652 308,096 0 CESA #5, Portage 9,091,321 754,579 636,394 1,390,972 357,593 CESA #6, Oshkosh 8,765,315 727,698 613,395 1,341,093 2,166,976 CESA #7, Green Bay 7,525,312 525,340 528,204 1,053,544 0 CESA #8, Gillett 5,448,528 382,567 380,227 762,794 0 CESA #9, Tomahawk 1,896,084 132,726 132,726 265,452 0 CESA #10, Chippewa Falls 6,593,983 461,579 461,578 923,158 0 CESA #11 6,515,666 455,942 456,251 912,193 0 CESA #12, Ashland 2,352,198 164,654 164,654 329,308 0 Total CESAs (12) 63,153,073 4,743,723 4,420,723 9,164,446 2,912,440
Total WRS (1,482) 13,219,104,559 1,086,722,019 891,852,244 1,978,574,263 31,749,855
* Includes contributons for WRS, Accumulated Sick Leave Conversion and Duty Disability
Contributions UnfundedName Covered Payroll Employer Paid* Employee Paid Total Liability Balance