Kensington Centennial Park Flood Study - randwick.nsw.gov.au · Final April 2013 . Level 2, 160...
74
RANDWICK CITY COUNCIL Kensington - Centennial Park Flood Study Final April 2013
-
Upload
truongnhan -
Category
Documents
-
view
214 -
download
0
Transcript of Kensington Centennial Park Flood Study - randwick.nsw.gov.au · Final April 2013 . Level 2, 160...

RANDWICK CITY COUNCIL
Kensington - Centennial Park Flood Study Final April 2013
Level 2, 160 Clarence Street Sydney, NSW, 2000 Tel: 9299 2855 Fax: 9262 6208 Email: [email protected] Web: www.wmawater.com.au
KENSINGTON – CENTENNIAL PARK FLOOD STUDY
FINAL
APRIL, 2013
Project Kensington – Centennial Park Flood Study
Project Number 111011
Client Randwick City Council
Client’s Representative Terry Kefalianos
Authors Matt Chadwick, Bowen Hicks, Richard Dewar
Prepared by
Date 10 April 2013
Verified by
Revision Description Date
5 Final 10 April 2013
4 Final for Public Exhibition Nov 2012
3 1st Draft for Public Exhibition Feb 2012
2 Final Draft Report (Updated TUFLOW modelling) June 2011
1 Preliminary Draft for Council comment Dec 2010
KENSINGTON – CENTENNIAL PARK FLOOD STUDY
TABLE OF CONTENTS
PAGE
FOREWORD ............................................................................................................................... i
EXECUTIVE SUMMARY ............................................................................................................ ii
1. INTRODUCTION ........................................................................................................ 1
1.1. Public Exhibition of Draft Report in February/March 2013 ........................... 1
2. BACKGROUND ......................................................................................................... 3
2.1. Catchment Description ............................................................................... 3
2.2. Causes of Flooding ..................................................................................... 4
3. AVAILABLE DATA .................................................................................................... 5
3.1. Drainage Information .................................................................................. 5
3.2. Survey Data ................................................................................................ 5
3.2.1. Aerial Laser Scanning Survey ..................................................................... 5
3.2.2. Detail Survey Data ...................................................................................... 5
3.3. Aerial Photography ..................................................................................... 6
3.4. Rainfall Data ............................................................................................... 6
3.4.1. Overview .................................................................................................... 6
3.4.2. Available Rainfall Data ................................................................................ 7
3.4.3. Analysis of Daily Read Data ....................................................................... 8
3.4.4. Analysis of Recent Storms .......................................................................... 9
3.5. Stream Flow Gauging ............................................................................... 10
3.6. Historical Flood Records ........................................................................... 10
3.7. Previous Studies ....................................................................................... 11
3.7.1. Kensington Flooding Drainage Works Investigation 1985 (Reference 2) ... 11
3.7.2. Centennial Park – Kensington Pond Stormwater Flow Control Structure
Restoration Works Flood Study November 2002 (Reference 3) ............. 12
3.7.3. Sydney Storms November 1984 – Hydrological Aspects October 1985
(Reference 4) ......................................................................................... 12
3.7.4. Hydrologic and Hydraulic Study Botany Wetlands June 1992 (Reference 5)
.............................................................................................................. 12
3.7.5. Assessment of Hydrological and Hydraulic Modelling of Centennial Park
and Kensington Catchments May 2003 (Reference 6) ........................... 13
3.8. Community and Local Resident Survey .................................................... 13
3.8.1. Overview .................................................................................................. 13
3.8.2. Aboud Avenue .......................................................................................... 14
3.8.3. Cottenham Avenue – Opposite Kensington Park ...................................... 16
3.8.4. Barker Street Trapped Low Point .............................................................. 17
3.8.5. Market Street Trapped Low Point & Centennial Avenue ........................... 19
3.8.6. Wentworth Street and Dangar Lane .......................................................... 21
3.8.7. Clovelly Road ........................................................................................... 22
4. APPROACH ADOPTED ........................................................................................... 24
4.1. General ..................................................................................................... 24
4.2. Hydrologic Modelling ................................................................................ 24
4.2.1. Mike-Storm Hydrologic Modelling Software .............................................. 24
4.3. Hydraulic Modelling .................................................................................. 25
4.3.1. Overview .................................................................................................. 25
4.3.2. TUFLOW Modelling Software ................................................................... 25
5. HYDROLOGIC MODEL CONFIGURATION ............................................................. 27
5.1. Sub-catchment Layout .............................................................................. 27
5.2. Model Parameters .................................................................................... 27
5.2.1. Impervious Fraction .................................................................................. 27
5.2.2. Rainfall Losses & Soil Type (MIKE-Storm Hydrologic Component) ........... 27
5.2.3. Time of Concentration (MIKE-Storm Hydrologic Component) ................... 28
5.2.4. DRAINS Model Parameters ...................................................................... 28
6. TUFLOW MODEL CONFIGURATION ...................................................................... 29
6.1. Hydraulic Model Extent ............................................................................. 29
6.2. Model DTM ............................................................................................... 29
6.3. Centennial Parklands Storage .................................................................. 29
6.4. Stormwater Assets .................................................................................... 29
6.4.1. Pipes ........................................................................................................ 30
6.4.2. Pits ........................................................................................................... 30
6.4.3. Culverts .................................................................................................... 31
6.4.4. Concrete Open Channel ........................................................................... 31
6.5. 2D Manning’s ‘n’ and Overland Flow Obstructions .................................... 31
6.6. Boundary Conditions ................................................................................ 32
6.6.1. Hydrologic Inputs ...................................................................................... 32
6.6.2. Downstream Tailwater .............................................................................. 32
7. MODEL CALIBRATION AND VERIFICATION ......................................................... 33
7.1. Overview .................................................................................................. 33
7.2. Approach .................................................................................................. 33
7.3. Model Calibration ...................................................................................... 34
7.4. Model Verification ..................................................................................... 35
8. DESIGN EVENT MODELLING ................................................................................. 37
8.1. Approach .................................................................................................. 37
8.2. Embedded Design Storm Approach .......................................................... 37
8.2.1. Background .............................................................................................. 37
8.2.2. Methodology ............................................................................................. 38
8.2.3. Outcomes ................................................................................................. 38
8.3. Key Model Parameters ............................................................................. 39
8.4. Boundary Conditions ................................................................................ 39
8.4.1. Hydrologic (MIKE-Storm) Model ............................................................... 39
8.4.2. Hydraulic (TUFLOW) Model ...................................................................... 39
8.5. Results ..................................................................................................... 39
8.5.1. Critical Storm Duration .............................................................................. 39
8.5.2. Overview .................................................................................................. 40
8.5.3. Flood Hazard and Hydraulic Categorisation .............................................. 42
8.5.4. Comparison of Results with Previous Studies ........................................... 43
9. SENSITIVITY ANALYSES AND CLIMATE CHANGE .............................................. 44
9.1. Sensitivity Analyses .................................................................................. 44
9.2. Climate Change ........................................................................................ 46
10. ACKNOWLEDGEMENTS ......................................................................................... 48
11. REFERENCES ......................................................................................................... 49
LIST OF APPENDICES
Appendix A Glossary of Terms
Appendix B Drainage within the Study Area circa 1850-1870
Appendix C Survey Questionnaire
Appendix D Summary of Submissions from Public Exhibition
LIST OF DIAGRAMS
Diagram 1 Pit Schematisation ................................................................................................... 30
LIST OF FIGURES
Figure 1 Study Catchment
Figure 2 Key Locations
Figure 3 Available ALS Survey Data
Figure 4 Recorded Rainfall Comparison November 1984 Events
Figure 5 Community Survey Results
Figure 6 Hydrologic Models - Catchment Layouts
Figure 7 Drainage Network Layout
Figure 8 Overland Flow Model Layout
Figure 9 Model Calibration 8-9 November Event
Figure 10 Model Validation 5-6 November Event
Figure 11 Peak Flood Levels and Depths 20% AEP Event (5yr ARI)
Figure 12 Peak Flow Velocities 20% AEP Event (5yr ARI)
Figure 13 Peak Flood Levels and Depths 10% AEP Event (10yr ARI)
Figure 14 Peak Flow Velocities 10% AEP Event (10yr ARI)
Figure 15 Peak Flood Levels and Depths 5% AEP Event (20yr ARI)
Figure 16 Peak Flow Velocities 5% AEP Event (20yr ARI)
Figure 17 Peak Flood Levels and Depths 2% AEP Event (50yr ARI)
Figure 18 Peak Flow Velocities 2% AEP Event (50yr ARI)
Figure 19 Peak Flood Levels and Depths 1% AEP Event (100yr ARI)
Figure 20 Peak Flow Velocities 1% AEP Event (100yr ARI)
Figure 21 Peak Flood Levels and Depths 0.5% AEP Event (200yr ARI)
Figure 22 Peak Flow Velocities 0.5% AEP Event (200yr ARI)
Figure 23 Peak Flood Levels and Depths 0.2% AEP Event (500yr ARI)
Figure 24 Peak Flow Velocities 0.2% AEP Event (500yr ARI)
Figure 25 Peak Flood Levels and Depths PMF Event
Figure 26 Peak Flow Velocities PMF Event
Figure 27 Centennial Parkland Ponds 1% AEP Peak Flood Extent
Figure 28 Provisional Hydraulic Hazard Categories 1% AEP Event
Figure 29 Hydraulic Categorisation
Figure 30 Climate Change Sensitivity – 1% AEP Event

LIST OF ACRONYMS
AEP Annual Exceedance Probability
AHD Australian Height Datum
ARI Average Recurrence Interval
ALS Aerial Laser Scanning
ARR87 Australian Rainfall & Runoff 1987
BOM Bureau of Meteorology
CoS City of Sydney
DECC Department of Environment and Climate Change (NSW)
DECCW Department of Environment, Climate Change and Water (NSW)
EBD Embedded Design Storm
FL Friction Loss co-efficient
FPL Flood Planning Level
GIS Geographic Information System
LGA Local Government Area
m metre
m3/s cubic metres per second
OC Open Channel
OEH Office of Environment and Heritage
PMF Probable Maximum Flood
RCC Randwick City Council
SW Sydney Water
TLP Trapped Low Point
TUFLOW one-dimensional (1D) and two-dimensional (2D) flood and tide simulation software
program (hydraulic computer model)
UNSW University of New South Wales
US Upstream
1D One dimensional hydraulic computer model
2D Two dimensional hydraulic computer model
LIST OF PHOTOGRAPHS Photo 1: Ground Elevation – Aboud Avenue low point .............................................................. 15
Photo 2: Aboud Avenue looking south ...................................................................................... 16
Photo 3: Ground Elevation – Cottenham Avenue trapped low point .......................................... 17
Photo 4: Ponding in Eastern Avenue within low point following 1984 floods – note waterline on
garage ...................................................................................................................................... 17
Photo 5: Ground Elevation – Barker Street trapped low point .................................................... 18
Photo 6: Barker Street low point (looking west) ......................................................................... 18
Photo 7: High-level overland flowpath from Barker Street low point (looking south from UNSW
campus back to road)................................................................................................................ 19
Photo 8: Ground Elevation – Market Street and Centennial Avenue ......................................... 20
Photo 9: Properties adjacent to the low point in Market Street. Note absence of any clearly
defined overland flowpath. ........................................................................................................ 20
Photo 10: Ground Elevation – Wentworth Street low point ........................................................ 21
Photo 11: Wentworth Street low point (looking north) ................................................................ 22
Photo 12: Ground Elevation – Clovelly Road trapped low point ................................................. 22
Photo 13: Debris marks at residential property (April 2007)....................................................... 23
Photo 14: Evidence of flooding along shopfronts in Clovelly Road (April 2007) ......................... 23
Photo 15: Damaged goods following flooding within Clovelly Road low point (April 2007) ......... 23
LIST OF TABLES
Table 1: Rainfall Stations with a 6km Radius of Paddington Station ............................................ 7
Table 2: Daily Rainfall greater than 150 mm ............................................................................... 8
Table 3: 5 November 1984, 8/9 November 1984, January 1989, and January 1994 Maximum
Recorded Storm Depths (in mm) ................................................................................................. 9
Table 4: ARI estimates of the 8-9th November 1984 Rainfall (Reference 4) ............................... 10
Table 5: Locations of Additional Resident Survey ..................................................................... 14
Table 6: Initial Assumed Land Use Paved Percentage .............................................................. 27
Table 7 Parameters for Buried Stormwater Pipes ..................................................................... 30
Table 8 Parameters for Culverts ............................................................................................... 31
Table 9 Overland Flow Manning’s ‘n’ ........................................................................................ 31
Table 10 Fence Blockage Assumptions (applied to the height of the fence) .............................. 32
Table 11: MIKEStorm Hydrological Model Parameters: November 8-9th Storm Event ............... 34
Table 12: Design flood levels (m AHD) and flows (m3/s) (1D and 2D) for key locations ............. 41
Table 13 Centennial Parkland Design Flood Levels (mAHD) .................................................... 42
Table 14: Comparison of Previous Results and Parameters ..................................................... 43
Table 15: Sensitivity of Model Assumptions to 1% AEP Design Model Results (change in depth
(m) and % change in peak flow) ................................................................................................ 45
Table 16: Climate Change Results (change in depth (m) and % change in peak flow) .............. 47
Kensington – Centennial Park Flood Study
WMAwater 111011:CentennialPk_WestKensingtonFS.docx:10 April 2013
i
FOREWORD
The NSW State Government’s Flood Policy provides a framework to ensure the sustainable use
of floodplain environments. The Policy is specifically structured to provide solutions to existing
flooding problems in rural and urban areas. In addition, the Policy provides a means of ensuring
that any new development is compatible with the flood hazard and does not create additional
flooding problems in other areas.
Under the Policy, the management of flood liable land remains the responsibility of local
government. The State Government subsidises flood mitigation works to alleviate existing
problems and provides specialist technical advice to assist Councils in the discharge of their
floodplain management responsibilities.
The Policy provides for technical and financial support by the Government through four
sequential stages:
1. Flood Study
Determine the nature and extent of the flood problem.
2. Floodplain Risk Management Study
Evaluates management options for the floodplain in respect of both existing and
proposed development.
3. Floodplain Risk Management Plan
Involves formal adoption by Council of a plan of management for the floodplain.
4. Implementation of the Plan
Construction of flood mitigation works to protect existing development,
Use of Local Environmental Plans to ensure new development is compatible with
the flood hazard.
The following Kensington - Centennial Park Flood Study constitutes the first stage of the
management process for this catchment area. WMAwater (formerly known as Webb, McKeown
& Associates) were commissioned by Randwick City Council to prepare this flood study on
behalf of the Kensington-Centennial Park Floodplain Risk Management Committee.
Funding for this study was provided from the Commonwealth and State Government’s Flood
Risk Management Program and Randwick City Council.
The following report documents the work undertaken and presents outcomes that define flood
behaviour for existing catchment conditions.
Kensington – Centennial Park Flood Study
WMAwater 111011:CentennialPk_WestKensingtonFS.docx:10 April 2013
ii
EXECUTIVE SUMMARY
The Kensington – Centennial Park catchment is an urban catchment located in the eastern
suburbs of Sydney (refer Figure 1). Urbanisation has significantly altered the nature of drainage
within the catchment with urban development located along many of the existing drainage paths
from Centennial Parklands south to Botany Bay. The study area is unique in that many trapped
low points exist. These depressions historically drained only via infiltration to the underlying
Botany aquifer (no overland flow path and hence termed trapped low points). With increased
hard stand areas and property development, flooding in these trapped low points and along
historic drainage lines needs to be properly understood in order to properly inform development
and manage the flood risk.
Model Build
The overall study area was broken into two model domains:
Upper Model – Queens Park, Centennial Park, east of Randwick Racecourse,
Lower Model – Alison Road entrance of Randwick Racecourse south to Gardeners Road
including overflow from Centennial Park.
Hydrologic modelling was undertaken using a combination of Mike-Storm and DRAINS.
Hydraulic modelling was undertaken using a 2m resolution dynamically integrated 1D/2D
TUFLOW model. The high resolution 2D domain is particularly advantageous in this study area
to define the floodplain storage in the trapped low points and the high level relief areas.
Model Calibration / Verification
In November 1984 two flood events occurred over a period of a few days causing significant
flooding and property damages in the study area.
Extensive peak flood level flood data were collected for the two storms of the 5/6th November
and the 8/9th of November 1984. The 8/9th November event was utilised as a calibration event
while the prior 5/6th November event was used to verify the calibrated model.
A reasonable calibration and verification outcome was achieved to the historical flood height
data.
Model Sensitivity and Climate Change
The 1% AEP event was used to test model sensitivity to the following parameters:
± 20 % Manning’s ‘n’ change,
Culvert Blockage of 0%, 25% and 100%,
20% increase in rainfall intensity,
Non-embedded storm versus adopted embedded storm for design hydrology,
Rainfall increases of 10%, 20% and 30% for potential climate change projections.
Across the broader model there is typically low model sensitivity to changes in these
parameters.
Kensington – Centennial Park Flood Study
WMAwater 111011:CentennialPk_WestKensingtonFS.docx:10 April 2013
iii
The trapped low points however are sensitive to the runoff volume. Immediately upstream of
Gardeners Road is also sensitive to the runoff volume and culvert blockage assumptions.
As a result of a review of the sensitivity analysis to culvert blockage a 25% blockage for culverts
was adopted for design.
Design Flood Levels
Design flood analysis of the calibrated model has been undertaken for the 20%, 10%, 5%, 2%,
1%, 0.5% and 0.2% Annual Exceedance Probability (AEP) flood events as well as for the
Probable Maximum Flood (PMF).
Figures are provided showing the flood level, depth and velocity and tabular results of flood
levels and flows are provided at key locations.
Flood levels, depth and velocity for all the above design events have been provided to Council in
electronic format (raster) to supplement this report.
Provisional Hazard
Provisional flood hazard for the 1% AEP flood event has also been provided. High hazard
floodways are predominantly confined to the road ways with minimal properties located in high
flood hazard zones. The most notable exception to this is upstream of Gardeners Road. This
area is a low velocity ponded water surface but with water depths greater than 1m.
Recommendations
Through much of the catchment floodwaters are conveyed via overland flow paths and hence
demonstrate little sensitivity to modelled parameters. Exceptions to this are areas where no
overland flow path exists or the overland flow path initiates after considerable ponding depth is
reached. The Wentworth trapped low point which is drained by a single 450mm diameter pipe is
a good example. Also, upstream of Gardeners Road (drained through an undersized culvert)
receives high volumes of runoff from the Centennial Parklands which flow south along Anzac
Parade resulting in considerable ponding depths.
The subsequent floodplain management study should consider management of the risk and
augmenting the current drainage scheme to minimise flood impacts or to specifically identify
high risk properties and examine local solutions.
It is recommended in the interim that design flood levels produced from this report are adopted
with an additional 0.5m freeboard for Flood Planning Levels (FPL).
Kensington – Centennial Park Flood Study
WMAwater 111011:CentennialPk_WestKensingtonFS.docx:10 April 2013
1
1. INTRODUCTION
The Kensington - Centennial Park catchment is located in the eastern suburbs of Sydney. The
study catchment comprises an area of 9.7 km2 and extends east to approximately Frenchmans
Road/Avoca Street, south to Gardeners Road and west to South Dowling Street (Figure 1). The
Centennial Parklands are located in the northern portion of the catchment.
The study area is unique within the Sydney metropolitan area given the relatively large portion of
parkland and open space present within the urban catchment. The presence of sandy soils in
and around the Centennial Park, Randwick Racecourse and Kensington areas, in combination
with potential flood storage in many of the open spaced areas, has pronounced effects on the
catchment response to rainfall and the generation of runoff. These aspects are of particular
significance for the Centennial Park area. This large open space area is drained via a series of
ponds and interacts with the Botany aquifer via a series of complex and poorly understood
infiltration processes.
The definition of design flood behaviour for existing catchment conditions is an important first
stage in the development of an overall Floodplain Risk Management Plan for the catchment.
This Flood Study documents the approach and outcomes of the technical work undertaken to
achieve this. In accordance with the NSW Government Floodplain Development Manual
(Reference 1), the primary objectives of this Flood Study are to:
define the flood behaviour of the study catchment by quantifying flood levels, flows and
velocities for a range of design flood events under existing catchment conditions,
establish suitable hydrologic/hydraulic model(s) that can be used in a subsequent
Floodplain Risk Management Study and the assessment of development options.
This report details the methodology and results of the Flood Study with the key elements being:
a summary of available data,
an outline of the overall methodology adopted, including details on the numerical models
established,
a description of the design flood behaviour throughout the study area in figures and at
key locations (shown on Figure 2), and
documentation of the assumptions made to derive the information and conclusions
presented herein.
1.1. Public Exhibition of Draft Report in February/March 2013
The Draft Kensington – Centennial Park Flood Study was placed on public exhibition from
Tuesday 19th February 2013 to Tuesday 26th March 2013.
Public displays were placed at the following locations:
Bowen Library, 669-673 Anzac Parade, Maroubra,
Randwick Library, Level 1 Royal Randwick Shopping Centre, Randwick,
Council’s administration centre, 30 Frances Street, Randwick.
Kensington – Centennial Park Flood Study
WMAwater 111011:CentennialPk_WestKensingtonFS.docx:10 April 2013
2
Exhibition material at the public displays included:
Copies of the draft reports,
Fact Sheets,
Comment Sheets,
Comment Box.
Newspaper advertisements were placed in the Southern Courier on 19th February and 5th March
providing details of the public exhibition.
The public exhibition was also advertised on Council’s website and included a copy of the draft
Flood Study.
A letter was sent to all property owners identified as being below the 1% AEP flood level plus
0.5m freeboard or below the Probable Maximum Flood. A total of 6236 letters were sent to
property owners providing details of the public exhibition and the community drop in session. A
community drop in session was held at Council’s Administration centre on Wednesday 13th
March between 6pm and 8pm. Staff from Council, WMAWater and the Office of Environment
and Heritage were available for the community to come along and find out about the study or
ask questions.
A total of four written submissions were received during the public exhibition period. A summary
of the feedback from residents during the public exhibition period is provided in Appendix D.
Kensington – Centennial Park Flood Study
WMAwater 111011:CentennialPk_WestKensingtonFS.docx:10 April 2013
3
2. BACKGROUND
2.1. Catchment Description
The Kensington - Centennial Park catchment is an urban catchment located in the eastern
suburbs of Sydney (refer to Figure 1). The catchment covers an area of approximately 9.7 km2
and spans the local government areas (LGA) of Randwick City Council (RCC), City of Sydney
(CoS) and Waverley Council. The majority of the catchment is located within the RCC LGA.
The north-western portion of the catchment in and around the Moore Park area (CoS LGA)
drains into the Centennial Park site and into Anzac Parade. Parts of Waverley, Bondi Junction
and Queens Park (Waverley Council LGA) also drain into the RCC portion of the catchment at
Centennial Park. The catchment covers the suburbs of Randwick, Kensington and Kingsford
within the RCC LGA.
Much of the catchment consists of established residential areas typically consisting of single
dwellings, although there are localised zones of higher density housing throughout the area,
particularly in close proximity to commercial districts (e.g. Kensington). It has been estimated
that the general extent of current urban development within the catchment was reached by
approximately 1940, with infill/re-development type activities being typical of land-use changes
since that time (Reference 2). Major commercial districts within the study area include Anzac
Parade and Gardeners Road frontages (Kensington) and Clovelly Road (Randwick).
In addition to community parks and reserves, there are several significant open space areas
including:
Centennial Parklands,
Randwick Racecourse,
Moore Park and Sydney Cricket Ground,
Kensington Oval, and
Portions of the University of New South Wales (UNSW) campus at Kensington.
The catchment drains predominantly from north to south and is generally bound by Oxford
Street in the north and Gardeners Road in the south. The topography throughout the catchment
varies significantly. Many of the urbanised upper reaches are characterised by areas of steep
terrain interspersed with localised depressions. By comparison, the lower reaches of the
catchment are distinctly flatter, particularly downstream of Centennial Parklands (i.e. south of
Alison Road) and west of Wansey Road (located along the eastern boundary of Randwick
Racecourse). Runoff from the catchment ultimately drains into the Eastlakes Golf Course, south
of Gardeners Road. The ground elevation across the study area ranges from 106 mAHD to 15
mAHD (approximately).
The study area defined by RCC also includes a smaller catchment located adjacent to the
south- eastern boundary of the main catchment. This sub-catchment (termed the “Eastlakes”
catchment for the purposes of this study) is effectively divided from the main catchment by a
ridge that runs parallel to Aboud Avenue. It is a small residential subcatchment that discharges
into Eastlakes Golf Course, to the west of the point of discharge from the main catchment.
Kensington – Centennial Park Flood Study
WMAwater 111011:CentennialPk_WestKensingtonFS.docx:10 April 2013
4
2.2. Causes of Flooding
Urbanisation has dramatically altered the nature of drainage within the catchment. Reference 2
includes a map of historical catchment conditions circa 1850-1870 (reproduced in Appendix B).
The map shows a number of natural drainage paths and low-lying depressions from the site of
Centennial Park extending downstream through to Kensington and Kingsford.
The drainage paths and other water features can be aligned with current development and
provides the context for many of the flood problems known to exist in the area today. For
example, there is a high correlation between the historical map and RCC’s database of reported
flooding problems and areas known to have been flooded during the November 1984 events.
Patterns of flood behaviour observed in the last twenty to thirty years reflect the historical pattern
of drainage. Key examples include the major flowpaths formed in Doncaster Avenue and
flooding experienced further downstream in the catchment (e.g. in and around Mooramie
Avenue). It is evident that development has altered natural flowpaths and/or has occurred in
areas likely to have been susceptible to flooding under pre-development conditions.
Compared to historical (pre-development) conditions, development within the catchment is likely
to have exacerbated flooding as a result of:
a major increase in the proportion of paved area and consequent reduction in pervious
areas, resulting in corresponding increases in runoff (in terms of both peak flows and
volumes),
modification of natural surface drainage system including encroachment of development
within flowpaths across the catchment, and
development within trapped depressions that were once swamps, resulting in flood
problems in these areas.

Kensington – Centennial Park Flood Study
WMAwater 111011:CentennialPk_WestKensingtonFS.docx:10 April 2013
5
3. AVAILABLE DATA
3.1. Drainage Information
As part of the present study, a comprehensive drainage assets database was prepared. The
database contains details of the drainage network for the catchment within the Randwick City
Council LGA. This data was collected by AWT Survey and included details regarding:
sub-surface pits and pipes,
reaches of the Sydney Water stormwater channel in the lower catchment,
the connectivity between components of the system.
The database used for the present study was provided in the form of ArcGIS shapefiles for
various sub-catchments in the study area.
For details of both current and historical information in other areas of the catchment, the
drainage network was sourced from existing models, reports, survey plans and drawings
provided by both RCC and CoS.
3.2. Survey Data
3.2.1. Aerial Laser Scanning Survey
RCC provided several topographic datasets for use in the present study. Initially, topographic
contours at 2m intervals were provided for the whole LGA.
Subsequent to this, RCC commissioned AAMHATCH Pty. Ltd. to undertake an Aerial Laser
Scanning (ALS) survey within the extents of the Randwick LGA including parts of the study
catchment (refer to Figure 3). The survey was flown in December 2005 and the resultant
mapping was provided to Council in March 2006. The ALS survey provides over 1 million
ground level spot heights, from which a Digital Terrain Model (DTM) can be constructed.
For well defined points mapped in clear areas, the expected nominal point accuracies (based on
a 68% confidence interval) are in the order of:
Vertical Accuracy: ±0.15 m,
Horizontal Accuracy: ±0.57 m.
When interpreting the above, it should be noted that the accuracy of the ground definition can be
adversely affected by the nature and density of vegetation and/or the presence of steeply
varying terrain.
3.2.2. Detail Survey Data
Detail ground survey is available in a limited number of locations within the catchment. In the
main, these additional datasets provide more accurate information compared to the ALS and
Kensington – Centennial Park Flood Study
WMAwater 111011:CentennialPk_WestKensingtonFS.docx:10 April 2013
6
were used to define the dimensions and levels of specific features (such as road crests, channel
dimensions, etc.) likely to act as hydraulic controls during a major flood. The detail survey was
obtained from a combination of sources including RCC and previous studies and included:
AWT Survey obtained as part of present study (refer to Section 3.1),
RCC survey of road levels within several major trapped low points,
Centennial Park survey,
Topographic survey of Centennial Park ponds (Reference 3).
3.3. Aerial Photography
Two key aerial photographic data sets have been provided by RCC for the entire study area.
The first and most recent data set was recorded in 2006. The second data set dated
approximately 1980 was used to confirm conditions for the calibration and verification modelling
of the November 1984 storm events.
3.4. Rainfall Data
3.4.1. Overview
Rainfall data is recorded either daily (24hr rainfall totals to 9:00am) or continuously
(pluviometers measuring depths within small time periods of typically 2 to 5 mins). Daily rainfall
data have been recorded for over 100 years at many locations within the Sydney basin. In
general, pluviometers have only been installed since the 1970's. Together these records
provide a picture of when and how often large rainfall events have occurred in the past.
Care must be taken when interpreting historical rainfall measurements. Rainfall records may not
provide an accurate representation of past events due to a combination of factors including local
site conditions, human error or limitations inherent to the type of recording instrument used.
Examples of limitations that may impact the quality of data used for the present study are
highlighted in the following:
Rainfall gauges frequently fail to accurately record the total amount of rainfall. This can
occur for a range of reasons including operator error, instrument failure, overtopping and
vandalism. In particular, many gauges fail during periods of heavy rainfall and records of
large events are often lost or misrepresented.
Daily read information is usually obtained at 9:00am in the morning. Thus if the storm
encompasses this period it becomes “split” between two days of record and a large
single day total cannot be identified.
In the past, rainfall over weekends was often erroneously accumulated and recorded as
a combined Monday 9:00am reading.
Rainfall records can frequently have “gaps” ranging from a few days to several weeks or
even years.
Pluviometer records provide a much greater insight into the intensity (depth vs time) of
rainfall events and have the advantage that the data can generally be analysed
Kensington – Centennial Park Flood Study
WMAwater 111011:CentennialPk_WestKensingtonFS.docx:10 April 2013
7
electronically. These data have much fewer limitations than daily read data. The main
drawback is that a number of relevant gauges have only been installed since 1990 and
hence have a very short period of record compared to the daily read data. These types
of gauges can also fail during storm events due to extreme conditions. There are
several pluviometer records of limited length available for stations located within the
study catchment.
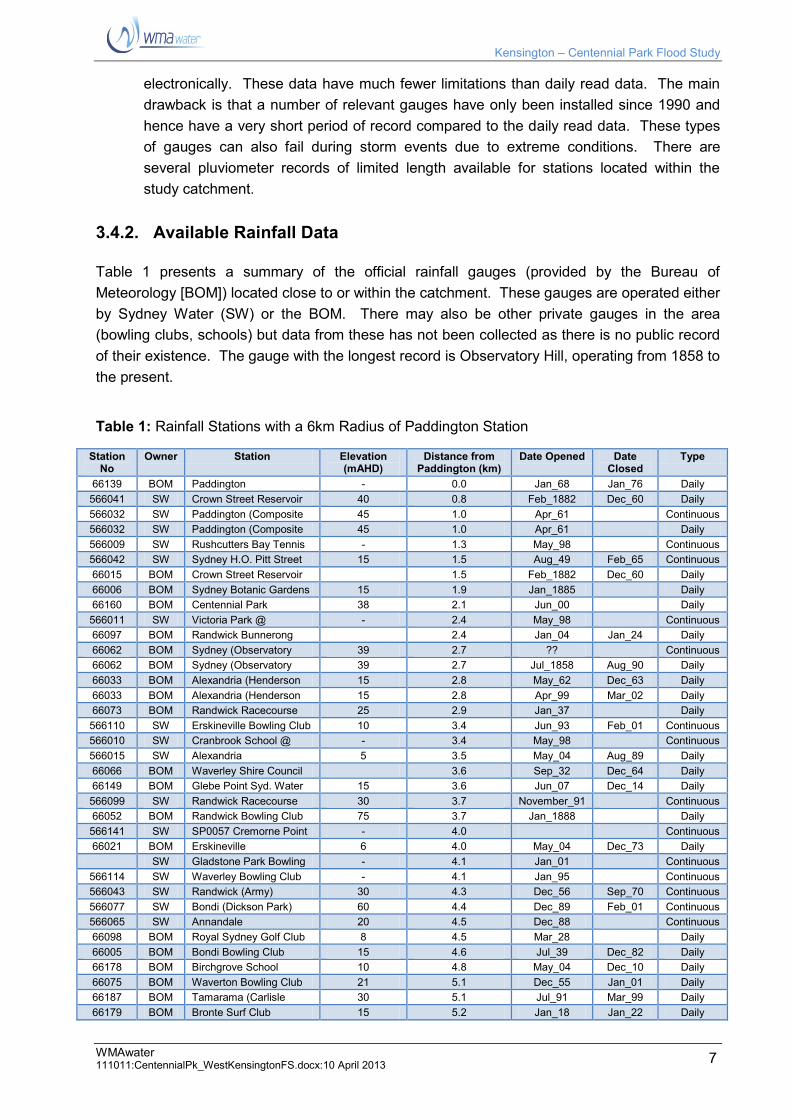
3.4.2. Available Rainfall Data
Table 1 presents a summary of the official rainfall gauges (provided by the Bureau of
Meteorology [BOM]) located close to or within the catchment. These gauges are operated either
by Sydney Water (SW) or the BOM. There may also be other private gauges in the area
(bowling clubs, schools) but data from these has not been collected as there is no public record
of their existence. The gauge with the longest record is Observatory Hill, operating from 1858 to
the present.
Table 1: Rainfall Stations with a 6km Radius of Paddington Station
Station No
Owner Station Elevation (mAHD)
Distance from Paddington (km)
Date Opened Date Closed
Type
66139 BOM Paddington - 0.0 Jan_68 Jan_76 Daily 566041 SW Crown Street Reservoir 40 0.8 Feb_1882 Dec_60 Daily 566032 SW Paddington (Composite
Site) 45 1.0 Apr_61 Continuous
566032 SW Paddington (Composite Site)
45 1.0 Apr_61 Daily 566009 SW Rushcutters Bay Tennis
Club - 1.3 May_98 Continuous
566042 SW Sydney H.O. Pitt Street 15 1.5 Aug_49 Feb_65 Continuous 66015 BOM Crown Street Reservoir 1.5 Feb_1882 Dec_60 Daily 66006 BOM Sydney Botanic Gardens 15 1.9 Jan_1885 Daily 66160 BOM Centennial Park 38 2.1 Jun_00 Daily 566011 SW Victoria Park @
Camperdown - 2.4 May_98 Continuous
66097 BOM Randwick Bunnerong Road 2.4 Jan_04 Jan_24 Daily
66062 BOM Sydney (Observatory Hill)
39 2.7 ?? Continuous 66062 BOM Sydney (Observatory
Hill) 39 2.7 Jul_1858 Aug_90 Daily
66033 BOM Alexandria (Henderson Road)
15 2.8 May_62 Dec_63 Daily 66033 BOM Alexandria (Henderson
Road) 15 2.8 Apr_99 Mar_02 Daily
66073 BOM Randwick Racecourse 25 2.9 Jan_37 Daily 566110 SW Erskineville Bowling Club 10 3.4 Jun_93 Feb_01 Continuous 566010 SW Cranbrook School @
Bellevue Hill - 3.4 May_98 Continuous
566015 SW Alexandria 5 3.5 May_04 Aug_89 Daily 66066 BOM Waverley Shire Council 3.6 Sep_32 Dec_64 Daily 66149 BOM Glebe Point Syd. Water
Supply 15 3.6 Jun_07 Dec_14 Daily
566099 SW Randwick Racecourse 30 3.7 November_91 Continuous 66052 BOM Randwick Bowling Club 75 3.7 Jan_1888 Daily 566141 SW SP0057 Cremorne Point - 4.0 Continuous 66021 BOM Erskineville 6 4.0 May_04 Dec_73 Daily
SW Gladstone Park Bowling Club
- 4.1 Jan_01 Continuous 566114 SW Waverley Bowling Club - 4.1 Jan_95 Continuous 566043 SW Randwick (Army) 30 4.3 Dec_56 Sep_70 Continuous 566077 SW Bondi (Dickson Park) 60 4.4 Dec_89 Feb_01 Continuous 566065 SW Annandale 20 4.5 Dec_88 Continuous 66098 BOM Royal Sydney Golf Club 8 4.5 Mar_28 Daily 66005 BOM Bondi Bowling Club 15 4.6 Jul_39 Dec_82 Daily 66178 BOM Birchgrove School 10 4.8 May_04 Dec_10 Daily 66075 BOM Waverton Bowling Club 21 5.1 Dec_55 Jan_01 Daily 66187 BOM Tamarama (Carlisle
Street) 30 5.1 Jul_91 Mar_99 Daily
66179 BOM Bronte Surf Club 15 5.2 Jan_18 Jan_22 Daily
Kensington – Centennial Park Flood Study
WMAwater 111011:CentennialPk_WestKensingtonFS.docx:10 April 2013
8
566130 SW Mosman (Reid Park) - 5.3 Jan_98 Jun_98 Continuous 566030 SW North Sydney Bowling
Club 80 5.5 Apr_50 Sep_95 Daily
66007 BOM Botany No.1 Dam 6 5.5 Jan_1870 Jan_78 Daily 66067 BOM Wollstonecraft 53 5.8 Jan_15 Jan_75 Daily 66061 BOM Sydney North Bowling
Club 75 5.8 Apr_50 Dec_74 Daily
566027 SW Mosman (Bradleys Head) 85 5.8 Jun_04 Continuous 566027 SW Mosman (Bradleys Head) 85 5.8 Jun_04 Daily 566006 BOM Bondi (Sydney Water) 10 5.9 Jun_97 Operational 66175 BOM Schnapper Island 5 5.9 Mar_32 Dec_39 Daily BOM = Bureau of Meteorology
SW = Sydney Water
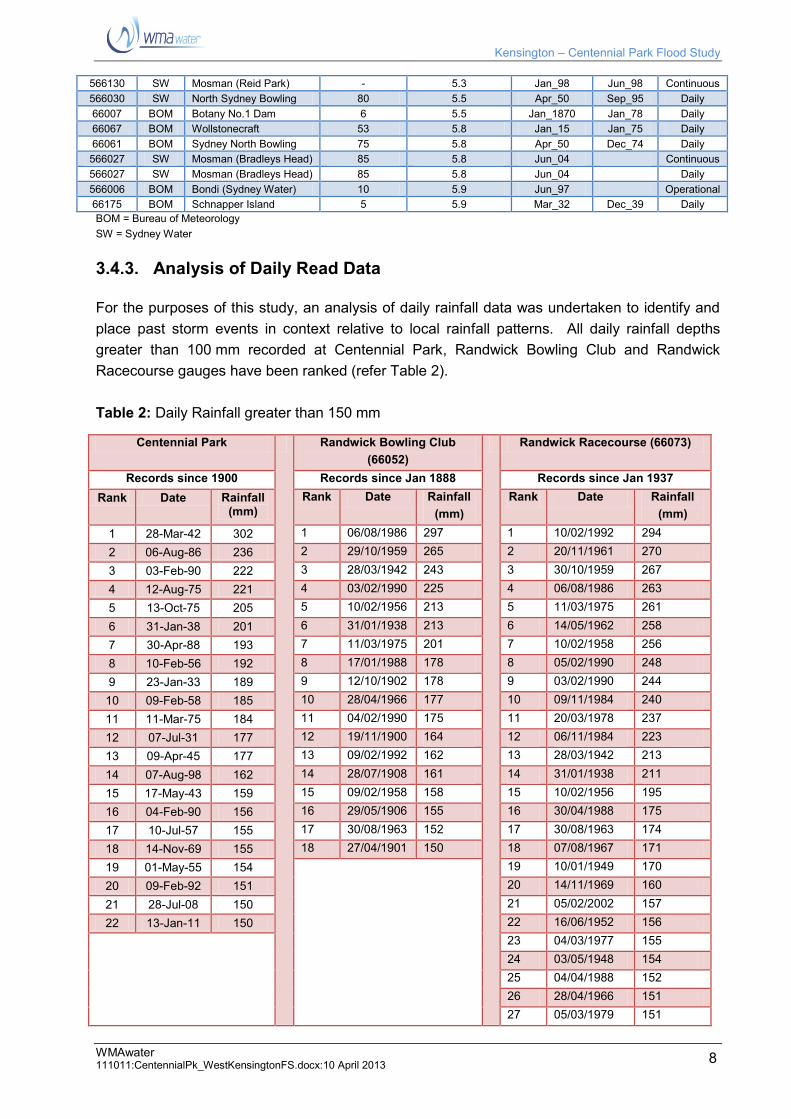
3.4.3. Analysis of Daily Read Data
For the purposes of this study, an analysis of daily rainfall data was undertaken to identify and
place past storm events in context relative to local rainfall patterns. All daily rainfall depths
greater than 100 mm recorded at Centennial Park, Randwick Bowling Club and Randwick
Racecourse gauges have been ranked (refer Table 2).
Table 2: Daily Rainfall greater than 150 mm
Centennial Park Randwick Bowling Club
(66052)
Randwick Racecourse (66073)
Records since 1900 Records since Jan 1888 Records since Jan 1937
Rank Date Rainfall (mm)
Rank Date Rainfall
(mm)
Rank Date Rainfall
(mm)
1 28-Mar-42 302 1 06/08/1986 297 1 10/02/1992 294
2 06-Aug-86 236 2 29/10/1959 265 2 20/11/1961 270
3 03-Feb-90 222 3 28/03/1942 243 3 30/10/1959 267
4 12-Aug-75 221 4 03/02/1990 225 4 06/08/1986 263
5 13-Oct-75 205 5 10/02/1956 213 5 11/03/1975 261
6 31-Jan-38 201 6 31/01/1938 213 6 14/05/1962 258
7 30-Apr-88 193 7 11/03/1975 201 7 10/02/1958 256
8 10-Feb-56 192 8 17/01/1988 178 8 05/02/1990 248
9 23-Jan-33 189 9 12/10/1902 178 9 03/02/1990 244
10 09-Feb-58 185 10 28/04/1966 177 10 09/11/1984 240
11 11-Mar-75 184 11 04/02/1990 175 11 20/03/1978 237
12 07-Jul-31 177 12 19/11/1900 164 12 06/11/1984 223
13 09-Apr-45 177 13 09/02/1992 162 13 28/03/1942 213
14 07-Aug-98 162 14 28/07/1908 161 14 31/01/1938 211
15 17-May-43 159 15 09/02/1958 158 15 10/02/1956 195
16 04-Feb-90 156 16 29/05/1906 155 16 30/04/1988 175
17 10-Jul-57 155 17 30/08/1963 152 17 30/08/1963 174
18 14-Nov-69 155 18 27/04/1901 150 18 07/08/1967 171
19 01-May-55 154 19 10/01/1949 170
20 09-Feb-92 151 20 14/11/1969 160
21 28-Jul-08 150 21 05/02/2002 157
22 13-Jan-11 150 22 16/06/1952 156
23 04/03/1977 155
24 03/05/1948 154
25 04/04/1988 152
26 28/04/1966 151
27 05/03/1979 151
Kensington – Centennial Park Flood Study
WMAwater 111011:CentennialPk_WestKensingtonFS.docx:10 April 2013
9
The main points regarding this data are:
At Centennial Park there have been 6 days of rainfall over 200 mm between 1900 and
1995.
From the analysis of Centennial Park data there are at least 8 events where 2 or more
consecutive days have recorded rainfalls above 100 mm. These are December 1920,
March 1958, November 1961, May 1962, April 1966, October 1975, August 1986 and
February 1990. Of these events 7 are within the second half of the century.
Periods with daily rainfall greater than 200 mm at Centennial Park are well known
periods of heavy rainfall which caused flooding in Sydney.
Common large events in all three gauges include 10/02/1956 and 9 to10/02/1958. The
more recent events of 11/03/1975 and 6/08/1986 occur in both Randwick gauges still
operating. Only 136mm was recorded at Centennial Park on 9/11/1984.
These records are based on 24 hour totals (to 9:00am) and show rainfall throughout the
entire day, whereas the critical duration for some parts of the catchment is likely to be
under two hours. Hence a large daily rainfall of greater than 200 mm may not
necessarily produce severe flooding if the rain was spread evenly throughout the day.
There can be a significant variation in rainfall between the gauges (February 1992 was
294mm at the Racecourse but 150/160mm at the other two gauges – this is difficult to
believe and the Racecourse record may be in error).
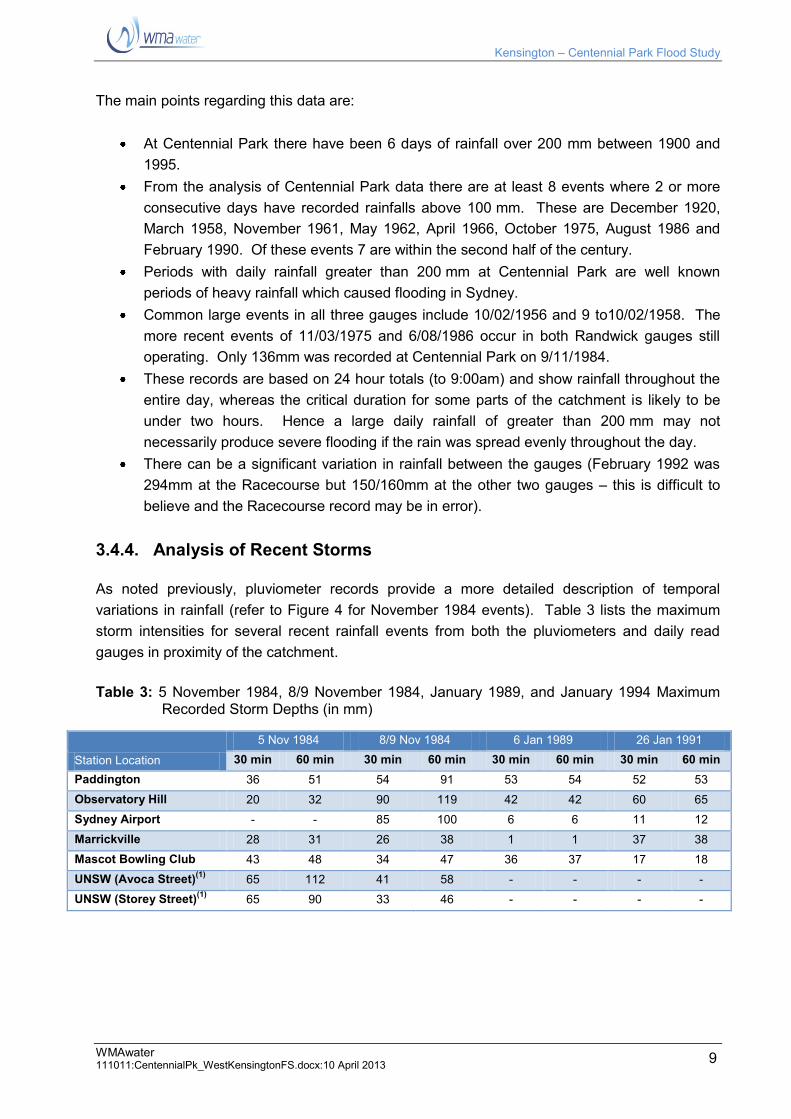
3.4.4. Analysis of Recent Storms
As noted previously, pluviometer records provide a more detailed description of temporal
variations in rainfall (refer to Figure 4 for November 1984 events). Table 3 lists the maximum
storm intensities for several recent rainfall events from both the pluviometers and daily read
gauges in proximity of the catchment.
Table 3: 5 November 1984, 8/9 November 1984, January 1989, and January 1994 Maximum Recorded Storm Depths (in mm)
Station Location
5 Nov 1984 8/9 Nov 1984 6 Jan 1989 26 Jan 1991
30 min 60 min 30 min 60 min 30 min 60 min 30 min 60 min
Paddington 36 51 54 91 53 54 52 53
Observatory Hill 20 32 90 119 42 42 60 65
Sydney Airport - - 85 100 6 6 11 12
Marrickville 28 31 26 38 1 1 37 38
Mascot Bowling Club 43 48 34 47 36 37 17 18
UNSW (Avoca Street)(1) 65 112 41 58 - - - -
UNSW (Storey Street)(1) 65 90 33 46 - - - -
Kensington – Centennial Park Flood Study
WMAwater 111011:CentennialPk_WestKensingtonFS.docx:10 April 2013
10
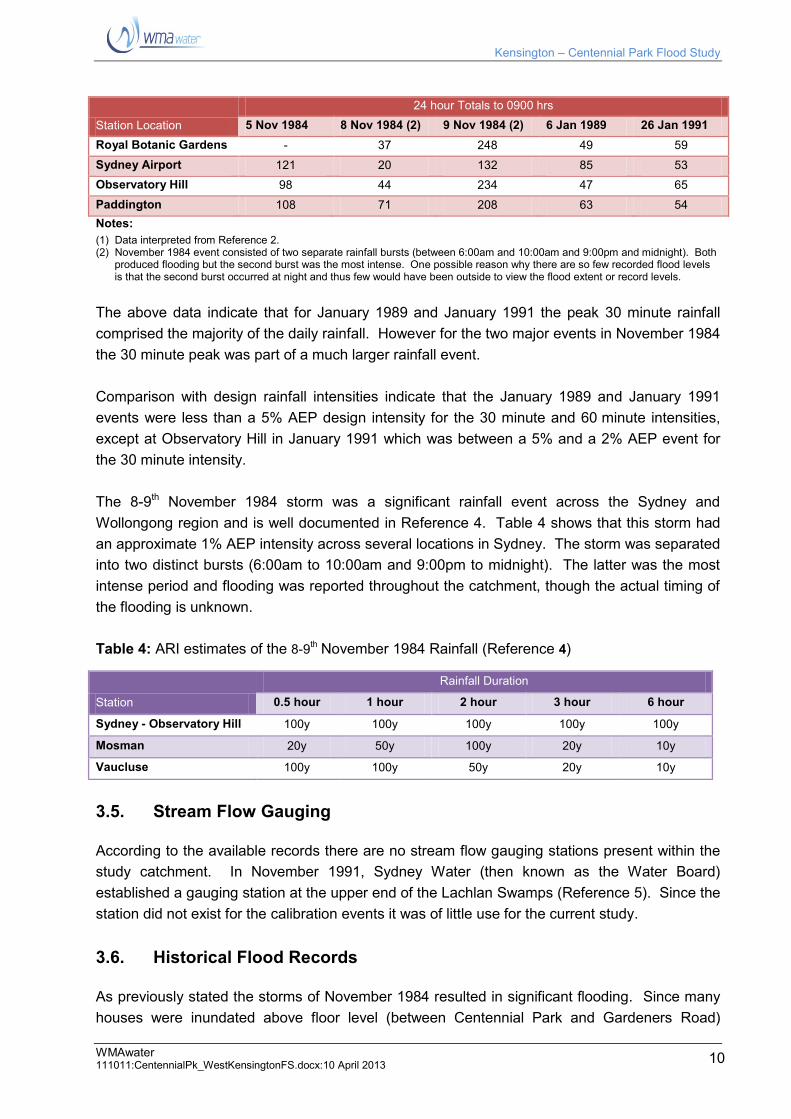
Station Location
24 hour Totals to 0900 hrs
5 Nov 1984 8 Nov 1984 (2) 9 Nov 1984 (2) 6 Jan 1989 26 Jan 1991
Royal Botanic Gardens - 37 248 49 59
Sydney Airport 121 20 132 85 53
Observatory Hill 98 44 234 47 65
Paddington 108 71 208 63 54
Notes:
(1) Data interpreted from Reference 2. (2) November 1984 event consisted of two separate rainfall bursts (between 6:00am and 10:00am and 9:00pm and midnight). Both
produced flooding but the second burst was the most intense. One possible reason why there are so few recorded flood levels is that the second burst occurred at night and thus few would have been outside to view the flood extent or record levels.
The above data indicate that for January 1989 and January 1991 the peak 30 minute rainfall
comprised the majority of the daily rainfall. However for the two major events in November 1984
the 30 minute peak was part of a much larger rainfall event.
Comparison with design rainfall intensities indicate that the January 1989 and January 1991
events were less than a 5% AEP design intensity for the 30 minute and 60 minute intensities,
except at Observatory Hill in January 1991 which was between a 5% and a 2% AEP event for
the 30 minute intensity.
The 8-9th November 1984 storm was a significant rainfall event across the Sydney and
Wollongong region and is well documented in Reference 4. Table 4 shows that this storm had
an approximate 1% AEP intensity across several locations in Sydney. The storm was separated
into two distinct bursts (6:00am to 10:00am and 9:00pm to midnight). The latter was the most
intense period and flooding was reported throughout the catchment, though the actual timing of
the flooding is unknown.
Table 4: ARI estimates of the 8-9th November 1984 Rainfall (Reference 4)
Station
Rainfall Duration
0.5 hour 1 hour 2 hour 3 hour 6 hour
Sydney - Observatory Hill 100y 100y 100y 100y 100y
Mosman 20y 50y 100y 20y 10y
Vaucluse 100y 100y 50y 20y 10y
3.5. Stream Flow Gauging
According to the available records there are no stream flow gauging stations present within the
study catchment. In November 1991, Sydney Water (then known as the Water Board)
established a gauging station at the upper end of the Lachlan Swamps (Reference 5). Since the
station did not exist for the calibration events it was of little use for the current study.
3.6. Historical Flood Records
As previously stated the storms of November 1984 resulted in significant flooding. Since many
houses were inundated above floor level (between Centennial Park and Gardeners Road)
Kensington – Centennial Park Flood Study
WMAwater 111011:CentennialPk_WestKensingtonFS.docx:10 April 2013
11
appropriate attention was given and flood levels were recorded from the 5-6th November storm
and the 8-9th November storm. The flood levels recorded are documented in Reference 2 and
represent the most substantial and detailed record of past flooding within the catchment.
Further evidence regarding historical flood levels was also sought during this study through
consultation with RCC, CoS, major organisations within the catchment (e.g. Centennial
Parklands, University of New South Wales) and with members of the local community (via mail-
out questionaries and targeted door-knocking campaigns). The information obtained was used
to confirm observed behaviour for the November 1984 storms and to identify/confirm other
floods that had occurred previously within the catchment. Further details of the information and
the community consultation process are presented in later sections.
3.7. Previous Studies
There have been a number of flood studies undertaken within the catchment. These studies
range from small flood assessments covering limited areas to more complex investigations
extending to the Botany Wetlands. However, the present Flood Study represents the first
comprehensive investigation that specifically provides detailed design flood information
throughout the study area.
A brief overview of significant previous studies follows. A full list of previous flood-related
reports is provided in the references.
3.7.1. Kensington Flooding Drainage Works Investigation 1985 (Reference
2)
Many parts of the Kensington area experienced severe flooding following two major rainfall
events in early November 1984. Extensive damages resulted from these floods including the
inundation of numerous properties. Shortly after these events, local and state government
authorities commissioned a study to examine flooding within the Kensington catchment, the
scope of which included:
documentation of observed flood behaviour from the November 1984 storms,
technical analysis of design flood behaviour for a range of storms for this catchment,
preparation of a flood mitigation strategy including an assessment of the feasibility of various
measures in terms of economic, social and technical aspects.
Reference 2 is a comprehensive report on flood behaviour within the lower Kensington
catchment at the time and made best use of the limited modelling tools then available.
Importantly, this reference provides the best available record of historical catchment conditions
and rainfall flood behaviour for the November 1984 events.
Kensington – Centennial Park Flood Study
WMAwater 111011:CentennialPk_WestKensingtonFS.docx:10 April 2013
12
3.7.2. Centennial Park – Kensington Pond Stormwater Flow Control
Structure Restoration Works Flood Study November 2002 (Reference
3)
After an extended period of heavy rainfall, the area in and around the lower Kensington pond in
Centennial Park experienced flooding on the 4-5th February 2002. As a result of this, the main
control structure at the outlet of this lower pond collapsed.
Following these events the above study was commissioned to analyse the design flood
behaviour of the Centennial Parkland pond system and to develop and assess a new control
structure for the outlet of the lower Kensington pond above Alison Road.
Detailed ground survey of all major ponds was obtained at the commencement of the study (this
data was made available by Centennial Parklands for this Flood Study). This survey was used
to define stage-volume and rating (stage-discharge) relationships for each of the ponds. A
hydrologic analysis was undertaken of the catchment down to Alison Road using RAFTS-XP.
The performance of this model for various historical events (including those of November 1984
and February 2002) was assessed together with the impacts of varying assumptions regarding
assumed model parameters (e.g. rainfall losses). The outcomes were then used to assess the
design performance of alternative options for the re-construction of the collapsed outlet for a
range of design storm events.
3.7.3. Sydney Storms November 1984 – Hydrological Aspects October
1985 (Reference 4)
This report was produced by the then Public Works and provided information on the November
1984 storms.
3.7.4. Hydrologic and Hydraulic Study Botany Wetlands June 1992
(Reference 5)
Undertaken as part of the Plan of Management of Botany Wetlands, this study established
hydrologic and hydraulic models to quantify the design flood behaviour of the wetlands
downstream of Gardeners Road through to Botany Bay.
The hydrologic model covered the study catchment, albeit with broadly defined sub-areas.
However, the upstream extent of the hydraulic model was located downstream of Gardeners
Road, outside of the present study area.
The models were calibrated and verified against minor events that occurred in December 1991
although these events were significantly smaller then the estimated 10% AEP (1 in 10 year)
design flood event.
Kensington – Centennial Park Flood Study
WMAwater 111011:CentennialPk_WestKensingtonFS.docx:10 April 2013
13
3.7.5. Assessment of Hydrological and Hydraulic Modelling of Centennial
Park and Kensington Catchments May 2003 (Reference 6)
This study was prepared for RCC to address uncertainties regarding differences in assumed
model parameters and corresponding design flood estimates from various flood studies of the
Centennial Park/Kensington catchment. The assessment was undertaken by Dr Geoffrey
O’Loughlin, a recognised expert in the field of engineering hydrology and hydraulics.
The report concludes that much of the Centennial Park and Kensington catchments are located
on sandy soils and may therefore be expected to have relatively higher hydrological losses
compared to ‘typical’ loss factors used in design flood estimation. It is noted that a number of
previous studies have employed high loss rates based on calibration to historical storms such as
those of November 1984.
On the basis of these studies, anecdotal evidence and infiltration testing within Centennial Park,
the author concludes that for design flood estimation a continuing loss of 50mm/hr and an initial
loss of 50mm is considered appropriate for sandy areas within Centennial Park and Kensington.
It is also noted that these estimates are conservative and that higher rates (e.g. 100mm initial
loss and 100mm/hr continuing loss) could well apply. A “typical” continuing loss used in design
flood analysis in the Sydney basin is 2.5mm/hr.
3.8. Community and Local Resident Survey
3.8.1. Overview
A key objective of the current study is to describe and quantify the flood behaviour under
existing catchment conditions. In this regard, an understanding and appreciation of past floods
is of significant importance. Although there are a number of existing reports documenting
historical events, a community awareness and consultation component was initiated by Council
for this study.
A media release describing the nature of the study including a general request for flood related
information was provided to Council. A more detailed flood survey/questionnaire was then
distributed to over 1500 households/businesses/organisations throughout the study area. A
copy of the survey questionnaire is included in Appendix C. In all, more than 100 responses
were received in addition to a number of phone calls and discussions with residents by both
Council and WMAwater staff. These responses were then collated by RCC to yield a range of
useful information including knowledge of property/household inundation and the identification of
areas perceived as being particularly susceptible to flooding.
A summary of outcomes from this initial survey is provided in Figure 5. In terms of property
inundation, a number of the reported sites correspond to properties that have been previously
documented as having a flood related problem in the past (e.g. in Council’s existing database of
stormwater reports or in studies of past floods such as the November 1984 event). It should be
noted that of the 68 reports of property inundation, there were a reasonable number of instances
Kensington – Centennial Park Flood Study
WMAwater 111011:CentennialPk_WestKensingtonFS.docx:10 April 2013
14
in which floodwaters were reported to have entered garages and houses.
Detailed records regarding the nature and extent of flooding throughout much of the lower
catchment (between Centennial Park/Alison Road and south to Gardeners Road) are
documented in Reference 2. Much of the data for areas in the lower reaches affected by the
November 1984 event obtained for this study supported the observations reported in Reference
2, including responses from Doncaster and Mooramie Avenues. The survey conducted for this
study also identified flood-related issues in a number of other areas including a number of
trapped low points in the upper reaches (e.g. Market Street/Centennial Avenue and Wentworth
Street) and locations adjacent to the main study catchment including parts of Duke Street and
Aboud Avenue.
Following further work during the course of the project, RCC commissioned an additional series
of resident surveys in major trapped low points. In addition to gathering historical flood
information, a primary objective was to identify the frequency and severity of past flooding in
each location. The outcomes were then used to compare against assumptions used in the
modelling process (e.g. potential infiltration capacity, likely overland flow paths etc.).
These later surveys were undertaken as a “door knocking” exercise on-site with individual
residents being interviewed. Where there was no answer at the time of the survey then a short
questionnaire was left at each address allowing any follow up information to be submitted. The
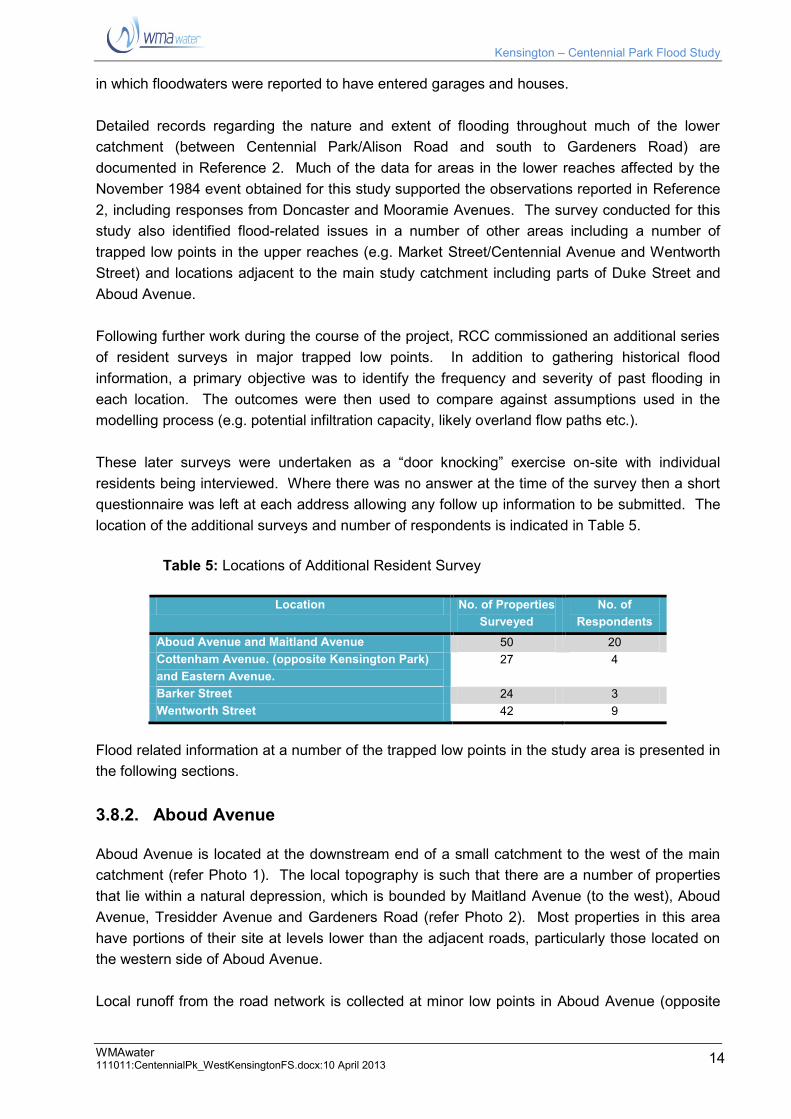
location of the additional surveys and number of respondents is indicated in Table 5.
Table 5: Locations of Additional Resident Survey
Location No. of Properties
Surveyed
No. of
Respondents
Aboud Avenue and Maitland Avenue 50 20
Cottenham Avenue. (opposite Kensington Park)
and Eastern Avenue.
27 4
Barker Street 24 3
Wentworth Street 42 9
Flood related information at a number of the trapped low points in the study area is presented in
the following sections.
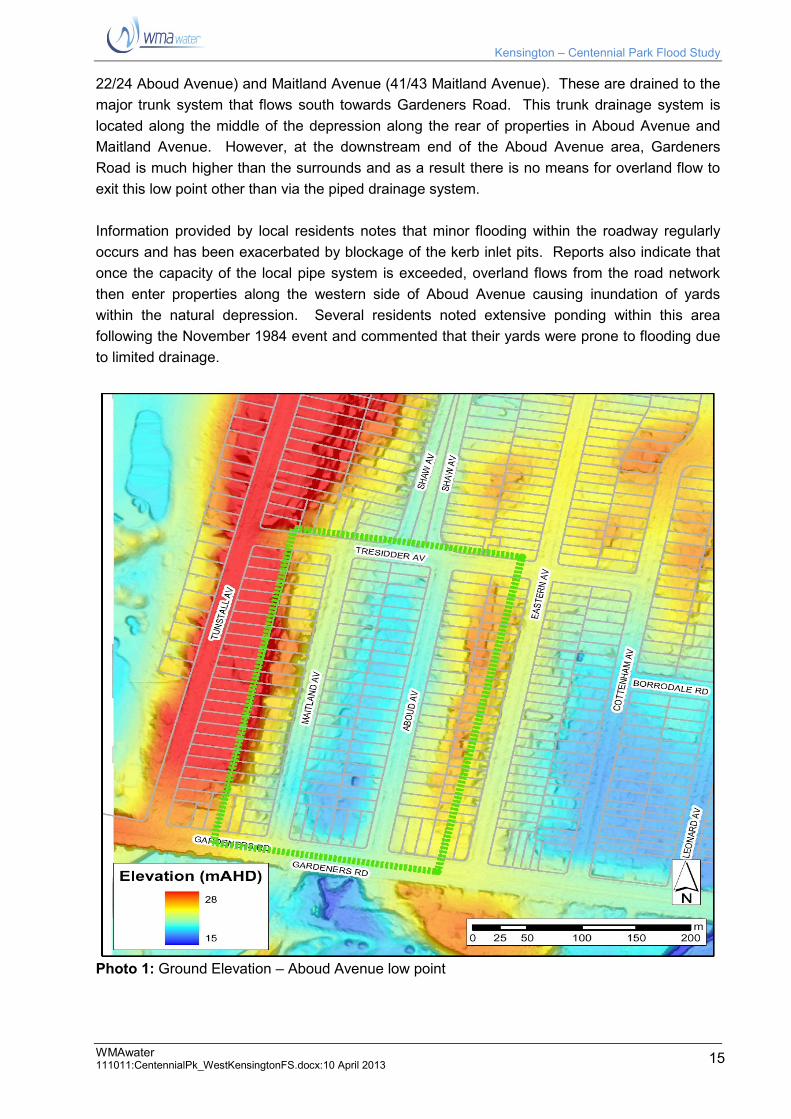
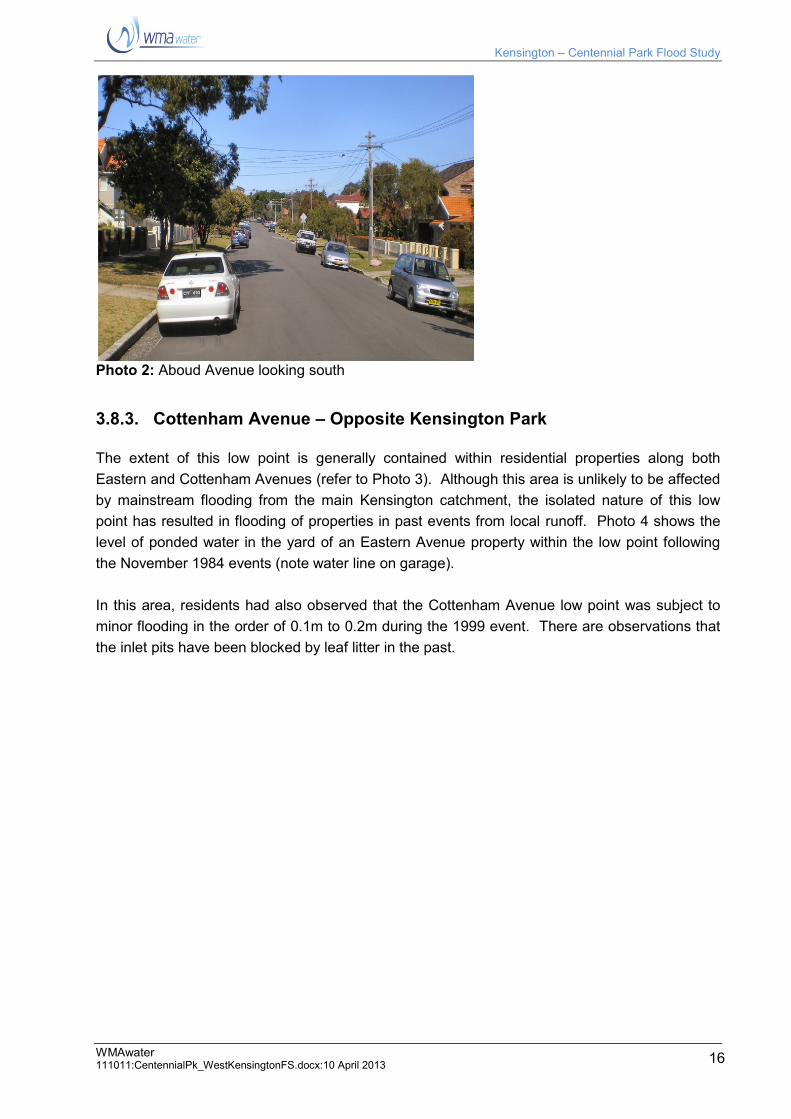
3.8.2. Aboud Avenue
Aboud Avenue is located at the downstream end of a small catchment to the west of the main
catchment (refer Photo 1). The local topography is such that there are a number of properties
that lie within a natural depression, which is bounded by Maitland Avenue (to the west), Aboud
Avenue, Tresidder Avenue and Gardeners Road (refer Photo 2). Most properties in this area
have portions of their site at levels lower than the adjacent roads, particularly those located on
the western side of Aboud Avenue.
Local runoff from the road network is collected at minor low points in Aboud Avenue (opposite
Kensington – Centennial Park Flood Study
WMAwater 111011:CentennialPk_WestKensingtonFS.docx:10 April 2013
15
22/24 Aboud Avenue) and Maitland Avenue (41/43 Maitland Avenue). These are drained to the
major trunk system that flows south towards Gardeners Road. This trunk drainage system is
located along the middle of the depression along the rear of properties in Aboud Avenue and
Maitland Avenue. However, at the downstream end of the Aboud Avenue area, Gardeners
Road is much higher than the surrounds and as a result there is no means for overland flow to
exit this low point other than via the piped drainage system.
Information provided by local residents notes that minor flooding within the roadway regularly
occurs and has been exacerbated by blockage of the kerb inlet pits. Reports also indicate that
once the capacity of the local pipe system is exceeded, overland flows from the road network
then enter properties along the western side of Aboud Avenue causing inundation of yards
within the natural depression. Several residents noted extensive ponding within this area
following the November 1984 event and commented that their yards were prone to flooding due
to limited drainage.
Photo 1: Ground Elevation – Aboud Avenue low point
Kensington – Centennial Park Flood Study
WMAwater 111011:CentennialPk_WestKensingtonFS.docx:10 April 2013
16
Photo 2: Aboud Avenue looking south
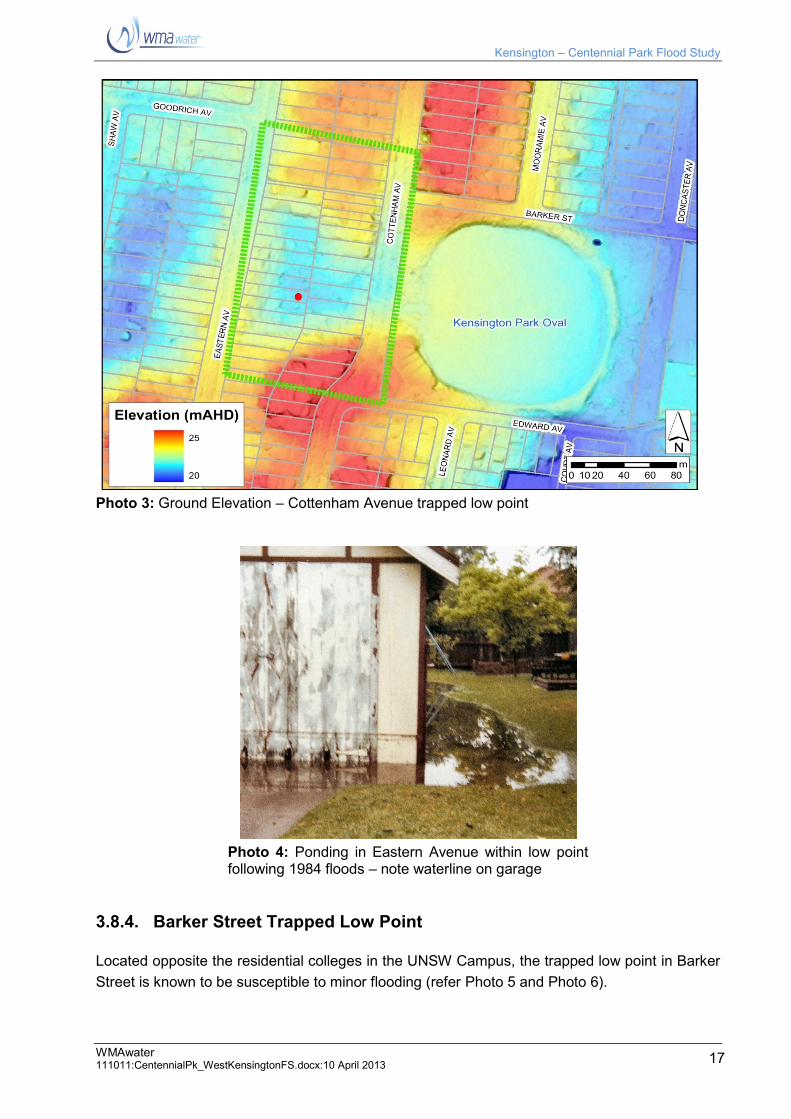
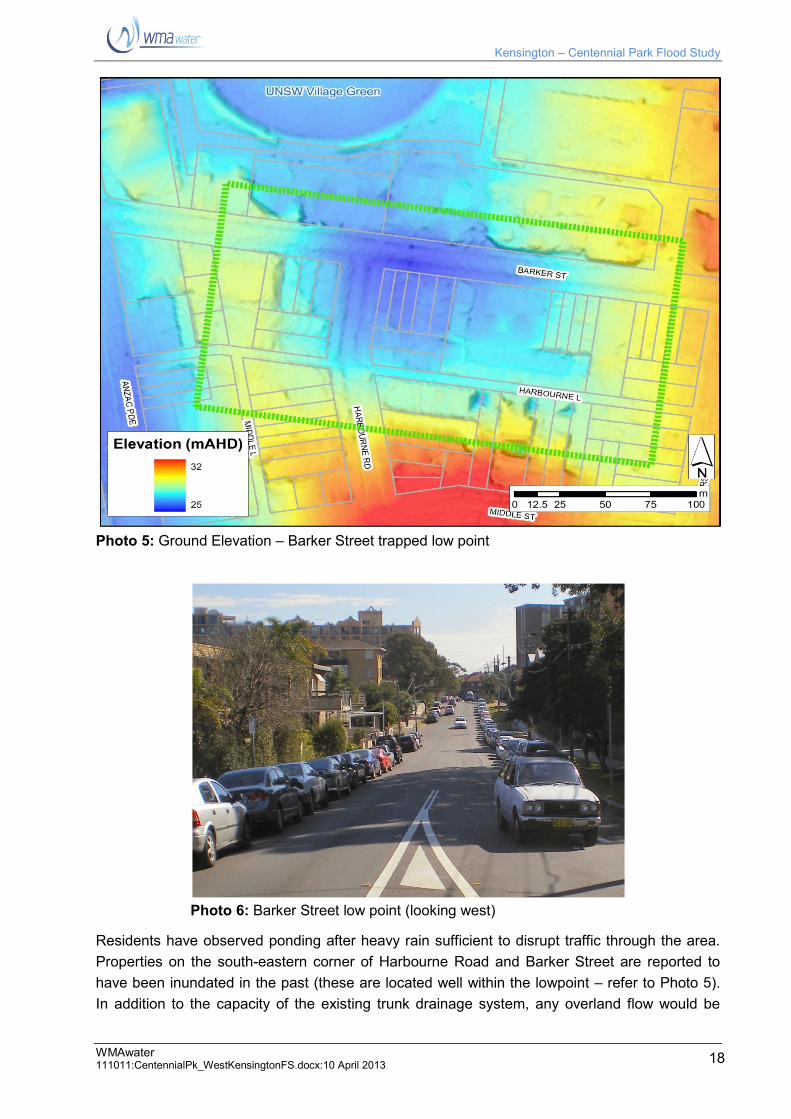
3.8.3. Cottenham Avenue – Opposite Kensington Park
The extent of this low point is generally contained within residential properties along both
Eastern and Cottenham Avenues (refer to Photo 3). Although this area is unlikely to be affected
by mainstream flooding from the main Kensington catchment, the isolated nature of this low
point has resulted in flooding of properties in past events from local runoff. Photo 4 shows the
level of ponded water in the yard of an Eastern Avenue property within the low point following
the November 1984 events (note water line on garage).
In this area, residents had also observed that the Cottenham Avenue low point was subject to
minor flooding in the order of 0.1m to 0.2m during the 1999 event. There are observations that
the inlet pits have been blocked by leaf litter in the past.
Kensington – Centennial Park Flood Study
WMAwater 111011:CentennialPk_WestKensingtonFS.docx:10 April 2013
17
Photo 3: Ground Elevation – Cottenham Avenue trapped low point
Photo 4: Ponding in Eastern Avenue within low point following 1984 floods – note waterline on garage
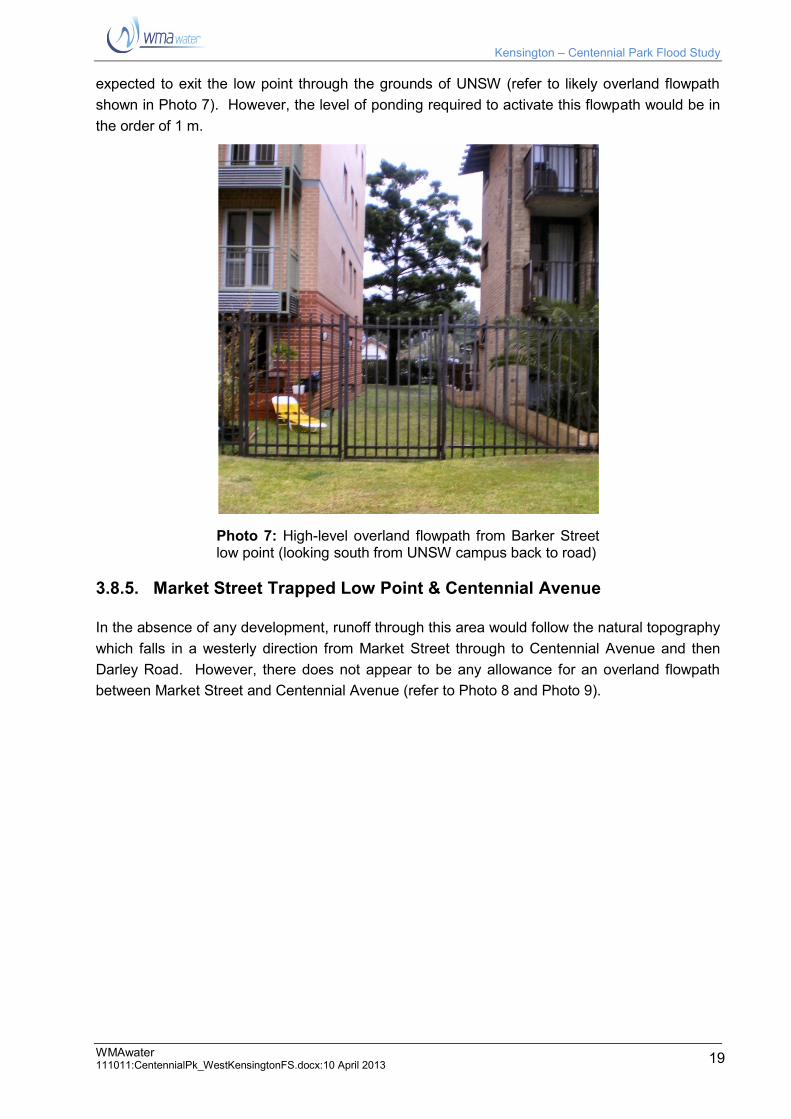
3.8.4. Barker Street Trapped Low Point
Located opposite the residential colleges in the UNSW Campus, the trapped low point in Barker
Street is known to be susceptible to minor flooding (refer Photo 5 and Photo 6).
Kensington – Centennial Park Flood Study
WMAwater 111011:CentennialPk_WestKensingtonFS.docx:10 April 2013
18
Photo 5: Ground Elevation – Barker Street trapped low point
Photo 6: Barker Street low point (looking west)
Residents have observed ponding after heavy rain sufficient to disrupt traffic through the area.
Properties on the south-eastern corner of Harbourne Road and Barker Street are reported to
have been inundated in the past (these are located well within the lowpoint – refer to Photo 5).
In addition to the capacity of the existing trunk drainage system, any overland flow would be
Kensington – Centennial Park Flood Study
WMAwater 111011:CentennialPk_WestKensingtonFS.docx:10 April 2013
19
expected to exit the low point through the grounds of UNSW (refer to likely overland flowpath
shown in Photo 7). However, the level of ponding required to activate this flowpath would be in
the order of 1 m.
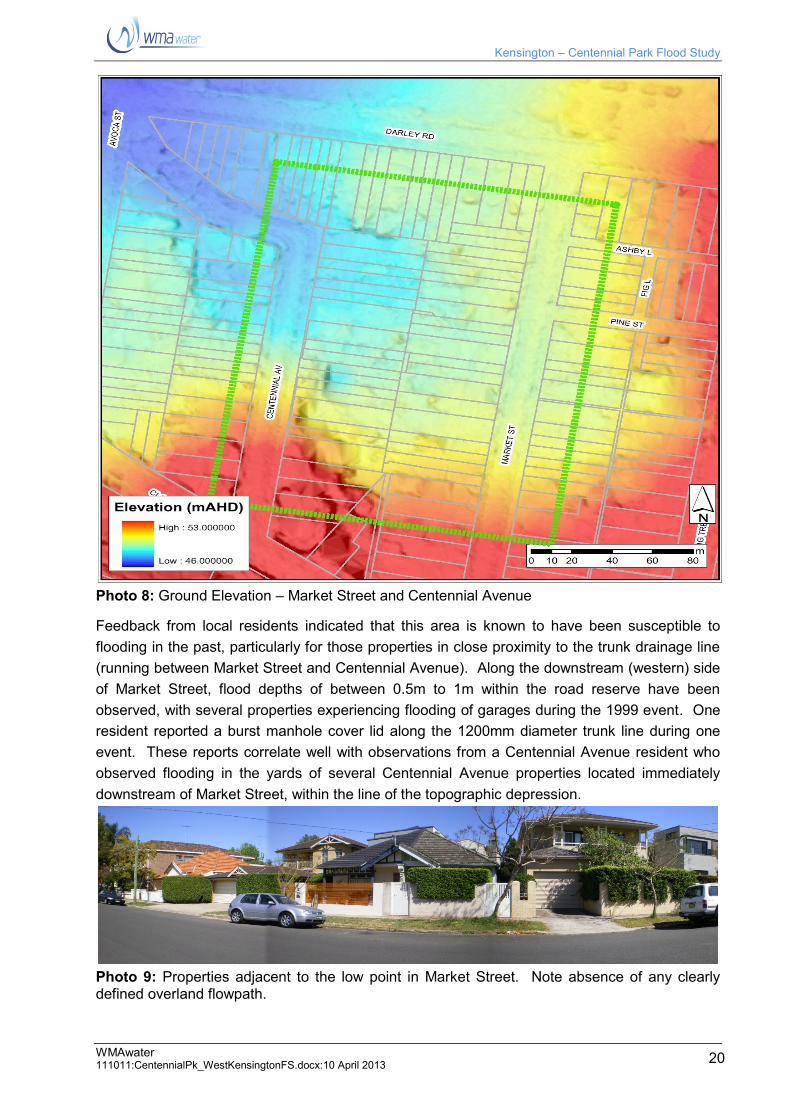
3.8.5. Market Street Trapped Low Point & Centennial Avenue
In the absence of any development, runoff through this area would follow the natural topography
which falls in a westerly direction from Market Street through to Centennial Avenue and then
Darley Road. However, there does not appear to be any allowance for an overland flowpath
between Market Street and Centennial Avenue (refer to Photo 8 and Photo 9).
Photo 7: High-level overland flowpath from Barker Street low point (looking south from UNSW campus back to road)
Kensington – Centennial Park Flood Study
WMAwater 111011:CentennialPk_WestKensingtonFS.docx:10 April 2013
20
Photo 8: Ground Elevation – Market Street and Centennial Avenue
Feedback from local residents indicated that this area is known to have been susceptible to
flooding in the past, particularly for those properties in close proximity to the trunk drainage line
(running between Market Street and Centennial Avenue). Along the downstream (western) side
of Market Street, flood depths of between 0.5m to 1m within the road reserve have been
observed, with several properties experiencing flooding of garages during the 1999 event. One
resident reported a burst manhole cover lid along the 1200mm diameter trunk line during one
event. These reports correlate well with observations from a Centennial Avenue resident who
observed flooding in the yards of several Centennial Avenue properties located immediately
downstream of Market Street, within the line of the topographic depression.
Photo 9: Properties adjacent to the low point in Market Street. Note absence of any clearly defined overland flowpath.
Kensington – Centennial Park Flood Study
WMAwater 111011:CentennialPk_WestKensingtonFS.docx:10 April 2013
21
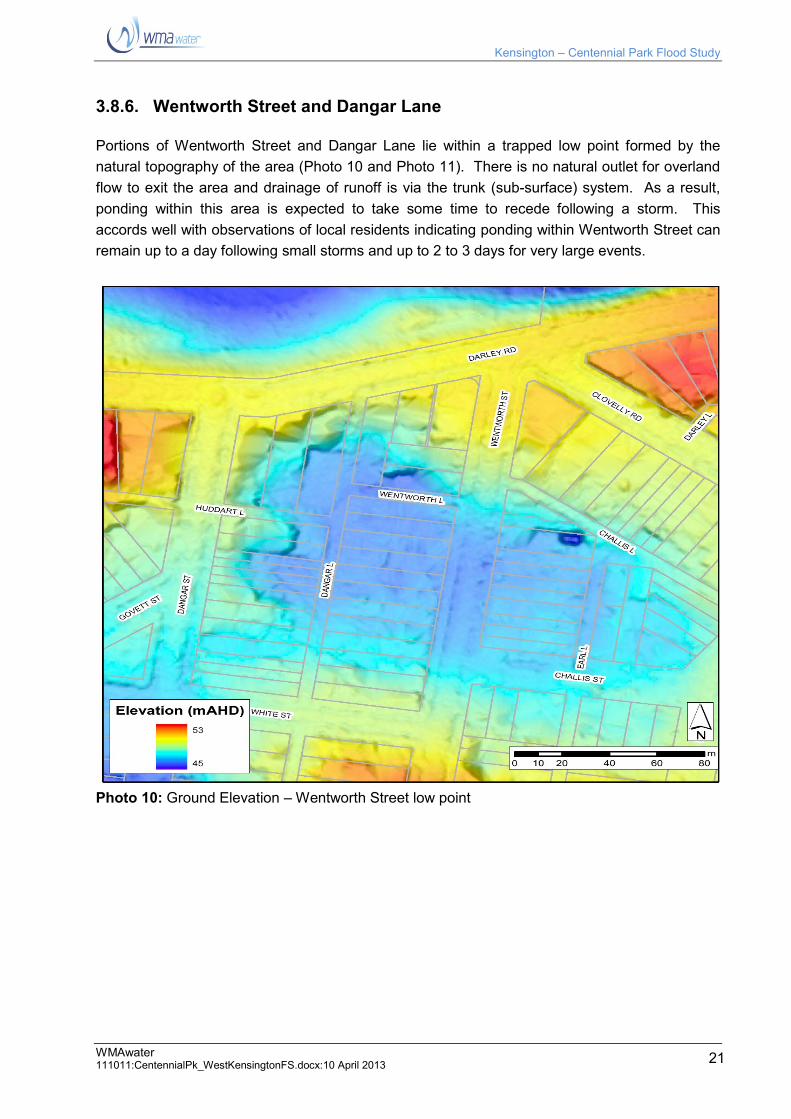
3.8.6. Wentworth Street and Dangar Lane
Portions of Wentworth Street and Dangar Lane lie within a trapped low point formed by the
natural topography of the area (Photo 10 and Photo 11). There is no natural outlet for overland
flow to exit the area and drainage of runoff is via the trunk (sub-surface) system. As a result,
ponding within this area is expected to take some time to recede following a storm. This
accords well with observations of local residents indicating ponding within Wentworth Street can
remain up to a day following small storms and up to 2 to 3 days for very large events.
Photo 10: Ground Elevation – Wentworth Street low point
Kensington – Centennial Park Flood Study
WMAwater 111011:CentennialPk_WestKensingtonFS.docx:10 April 2013
22
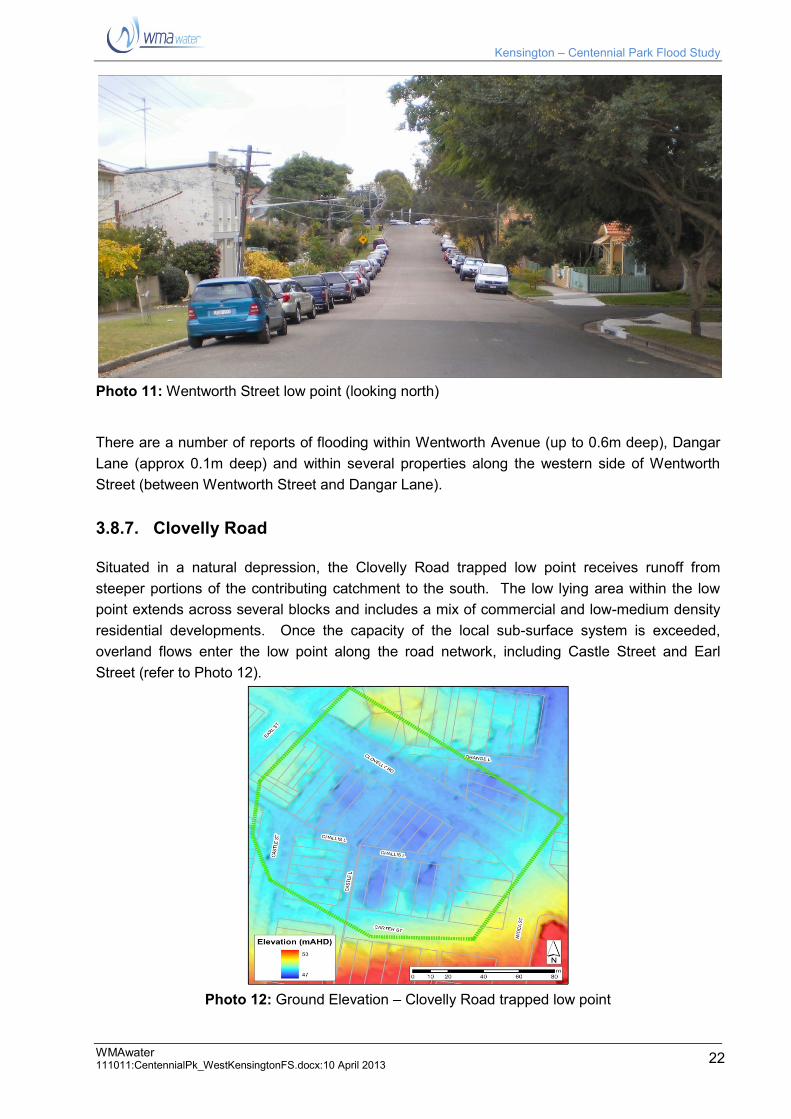
Photo 11: Wentworth Street low point (looking north)
There are a number of reports of flooding within Wentworth Avenue (up to 0.6m deep), Dangar
Lane (approx 0.1m deep) and within several properties along the western side of Wentworth
Street (between Wentworth Street and Dangar Lane).
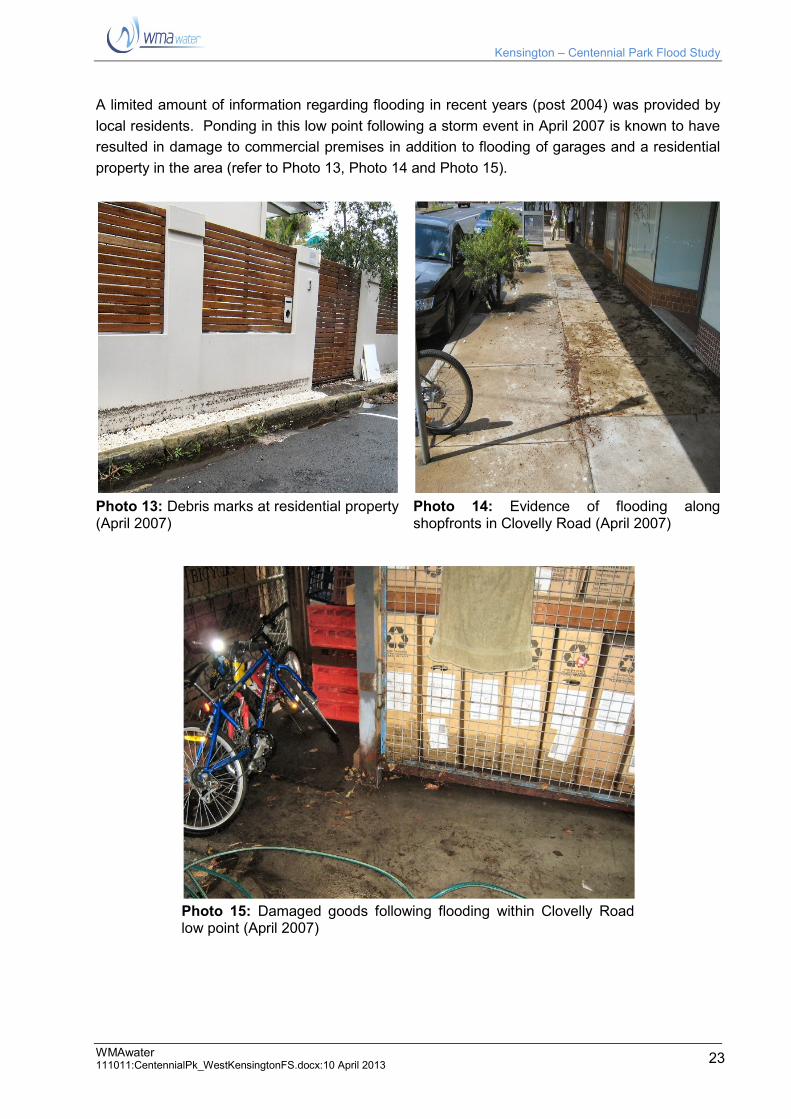
3.8.7. Clovelly Road
Situated in a natural depression, the Clovelly Road trapped low point receives runoff from
steeper portions of the contributing catchment to the south. The low lying area within the low
point extends across several blocks and includes a mix of commercial and low-medium density
residential developments. Once the capacity of the local sub-surface system is exceeded,
overland flows enter the low point along the road network, including Castle Street and Earl
Street (refer to Photo 12).
Photo 12: Ground Elevation – Clovelly Road trapped low point
Kensington – Centennial Park Flood Study
WMAwater 111011:CentennialPk_WestKensingtonFS.docx:10 April 2013
23
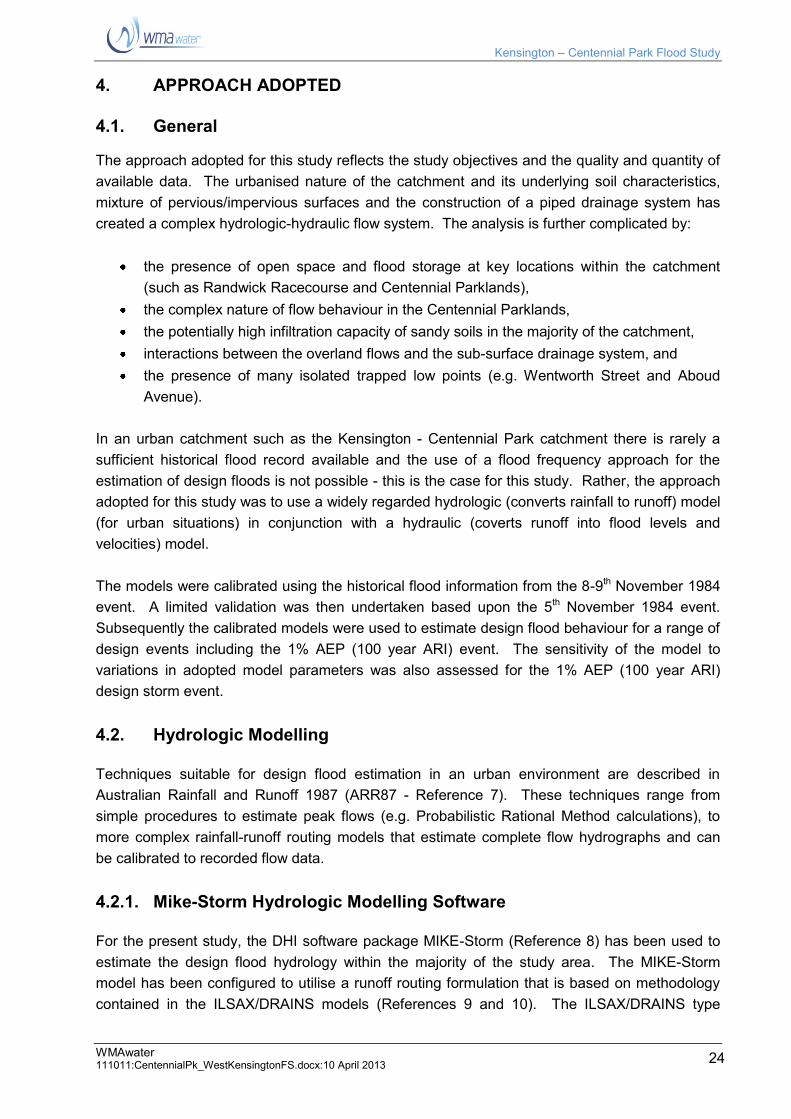
A limited amount of information regarding flooding in recent years (post 2004) was provided by
local residents. Ponding in this low point following a storm event in April 2007 is known to have
resulted in damage to commercial premises in addition to flooding of garages and a residential
property in the area (refer to Photo 13, Photo 14 and Photo 15).
Photo 13: Debris marks at residential property (April 2007)
Photo 14: Evidence of flooding along shopfronts in Clovelly Road (April 2007)
Photo 15: Damaged goods following flooding within Clovelly Road low point (April 2007)
Kensington – Centennial Park Flood Study
WMAwater 111011:CentennialPk_WestKensingtonFS.docx:10 April 2013
24
4. APPROACH ADOPTED
4.1. General
The approach adopted for this study reflects the study objectives and the quality and quantity of
available data. The urbanised nature of the catchment and its underlying soil characteristics,
mixture of pervious/impervious surfaces and the construction of a piped drainage system has
created a complex hydrologic-hydraulic flow system. The analysis is further complicated by:
the presence of open space and flood storage at key locations within the catchment
(such as Randwick Racecourse and Centennial Parklands),
the complex nature of flow behaviour in the Centennial Parklands,
the potentially high infiltration capacity of sandy soils in the majority of the catchment,
interactions between the overland flows and the sub-surface drainage system, and
the presence of many isolated trapped low points (e.g. Wentworth Street and Aboud
Avenue).
In an urban catchment such as the Kensington - Centennial Park catchment there is rarely a
sufficient historical flood record available and the use of a flood frequency approach for the
estimation of design floods is not possible - this is the case for this study. Rather, the approach
adopted for this study was to use a widely regarded hydrologic (converts rainfall to runoff) model
(for urban situations) in conjunction with a hydraulic (coverts runoff into flood levels and
velocities) model.
The models were calibrated using the historical flood information from the 8-9th November 1984
event. A limited validation was then undertaken based upon the 5th November 1984 event.
Subsequently the calibrated models were used to estimate design flood behaviour for a range of
design events including the 1% AEP (100 year ARI) event. The sensitivity of the model to
variations in adopted model parameters was also assessed for the 1% AEP (100 year ARI)
design storm event.
4.2. Hydrologic Modelling
Techniques suitable for design flood estimation in an urban environment are described in
Australian Rainfall and Runoff 1987 (ARR87 - Reference 7). These techniques range from
simple procedures to estimate peak flows (e.g. Probabilistic Rational Method calculations), to
more complex rainfall-runoff routing models that estimate complete flow hydrographs and can
be calibrated to recorded flow data.
4.2.1. Mike-Storm Hydrologic Modelling Software
For the present study, the DHI software package MIKE-Storm (Reference 8) has been used to
estimate the design flood hydrology within the majority of the study area. The MIKE-Storm
model has been configured to utilise a runoff routing formulation that is based on methodology
contained in the ILSAX/DRAINS models (References 9 and 10). The ILSAX/DRAINS type
Kensington – Centennial Park Flood Study
WMAwater 111011:CentennialPk_WestKensingtonFS.docx:10 April 2013
25
method has been widely adopted in Australia for use in urban catchments, similar to that of the
present study. Furthermore, the use of ILSAX/DRAINS style hydrology is consistent with the
approaches taken in previous studies of adjacent catchments (e.g. Reference 11).
The exception to the above was for the Fox Studios/Moore Park area in the upper north-west
portion of the catchment. For this area, an existing DRAINS model (supplied by CoS) was
utilised to determine the hydrology. The DRAINS model utilised a pit and pipe configuration and
routed rainfall excess flow to the downstream boundary control of the DRAINS model. Flow
hydrographs at this location were utilised as inflow boundary conditions for the hydraulic model.
4.3. Hydraulic Modelling
4.3.1. Overview
A key objective of the present study is to produce estimates of design flood behaviour
throughout the catchment suitable for the preparation of a flood study. The outcomes are to
facilitate the detailed analysis of potential flood management options. Dynamic hydraulic
modelling integrating the sub-surface drainage system and overland flow paths has been
employed for this study.
The sub-surface drainage system was represented using a one-dimensional model that was
linked to overland flow paths.
Given that drainage network data was not available for the areas of the catchment covered by
Waverley Council, the drainage network and overland flow paths for this area could not be
modelled in the hydraulic model. Rather this portion of the catchment was represented as a
series of sub-catchments in MIKE-Storm. Runoff from these sub-catchments was applied as
inflows into the hydraulic model within Queens Park. Results from the existing CoS DRAINS
model of the Fox Studios/Moore Park area were used to define upstream boundary conditions
for the hydraulic model at Centennial Park and Alison Road as appropriate.
The majority of overland flooding was modelled in a two-dimensional model. Exceptions include
storage and cross flow in the Centennial Parkland ponds and concrete open channels in the
trunk system of the lower model.
4.3.2. TUFLOW Modelling Software
The TUFLOW model established for the present study includes definition of both the trunk
drainage and the majority of the minor drainage system elements as well as the overland flow
paths.
The TUFLOW modelling package includes a finite difference numerical model for the solution of
the depth averaged shallow water flow equations in two dimensions. The TUFLOW software is
produced by BMT WBM (Reference 12) and has been widely used for a range of similar
projects. The model is capable of dynamically simulating complex overland flow regimes. It is
especially applicable to the hydraulic analysis of flooding in urban areas which is typically
Kensington – Centennial Park Flood Study
WMAwater 111011:CentennialPk_WestKensingtonFS.docx:10 April 2013
26
characterised by short duration events and a combination of supercritical and subcritical flow
behaviour.
For the hydraulic analysis of overland flow paths, a two-dimensional (2D) model such as
TUFLOW provides several key advantages when compared to a traditional one-dimensional
(1D) model. For example, in comparison to a 1D approach, a 2D model can:
• provide localised detail of any topographic and/or structural features that may influence
flood behaviour,
• better facilitate the identification of the potential overland flow paths and flood problem
areas,
• inherently represent the available floodplain storage within the 2D model geometry.
Importantly, a 2D hydraulic model can better define the spatial variations in flood behaviour
across the study area. Information such as flow velocity, flood levels and hydraulic hazard can
be readily mapped in detail across the model extent. This information can then be easily
integrated into a GIS based environment enabling the outcomes to be incorporated into
Council’s planning activities.
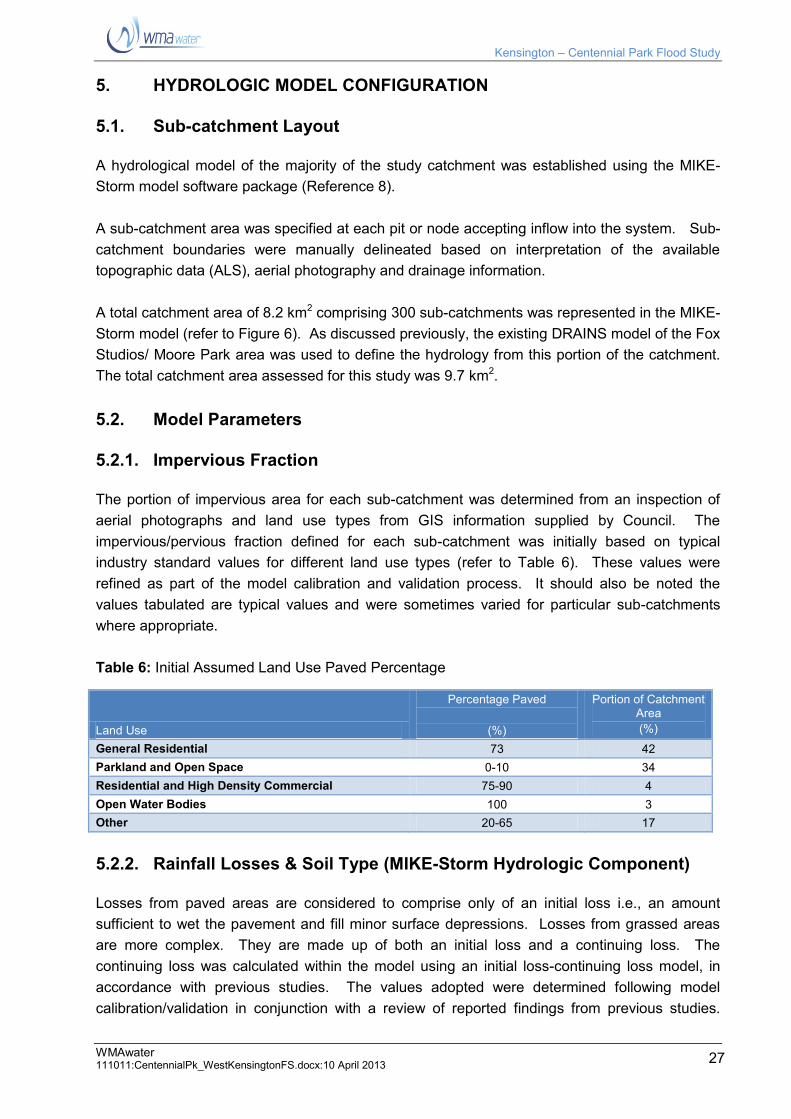
Kensington – Centennial Park Flood Study
WMAwater 111011:CentennialPk_WestKensingtonFS.docx:10 April 2013
27
5. HYDROLOGIC MODEL CONFIGURATION
5.1. Sub-catchment Layout
A hydrological model of the majority of the study catchment was established using the MIKE-
Storm model software package (Reference 8).
A sub-catchment area was specified at each pit or node accepting inflow into the system. Sub-
catchment boundaries were manually delineated based on interpretation of the available
topographic data (ALS), aerial photography and drainage information.
A total catchment area of 8.2 km2 comprising 300 sub-catchments was represented in the MIKE-
Storm model (refer to Figure 6). As discussed previously, the existing DRAINS model of the Fox
Studios/ Moore Park area was used to define the hydrology from this portion of the catchment.
The total catchment area assessed for this study was 9.7 km2.
5.2. Model Parameters
5.2.1. Impervious Fraction
The portion of impervious area for each sub-catchment was determined from an inspection of
aerial photographs and land use types from GIS information supplied by Council. The
impervious/pervious fraction defined for each sub-catchment was initially based on typical
industry standard values for different land use types (refer to Table 6). These values were
refined as part of the model calibration and validation process. It should also be noted the
values tabulated are typical values and were sometimes varied for particular sub-catchments
where appropriate.
Table 6: Initial Assumed Land Use Paved Percentage
Land Use
Percentage Paved
(%)
Portion of Catchment Area
(%)
General Residential 73 42
Parkland and Open Space 0-10 34
Residential and High Density Commercial 75-90 4
Open Water Bodies 100 3
Other 20-65 17
5.2.2. Rainfall Losses & Soil Type (MIKE-Storm Hydrologic Component)
Losses from paved areas are considered to comprise only of an initial loss i.e., an amount
sufficient to wet the pavement and fill minor surface depressions. Losses from grassed areas
are more complex. They are made up of both an initial loss and a continuing loss. The
continuing loss was calculated within the model using an initial loss-continuing loss model, in
accordance with previous studies. The values adopted were determined following model
calibration/validation in conjunction with a review of reported findings from previous studies.

Kensington – Centennial Park Flood Study
WMAwater 111011:CentennialPk_WestKensingtonFS.docx:10 April 2013
28
The actual rates adopted are presented in later sections.
5.2.3. Time of Concentration (MIKE-Storm Hydrologic Component)
Overland travel times for surface runoff within a sub-catchment were calculated using the
kinematic wave equation. This relationship is based on the nature of the sub-catchment and
accounts for different travel times with varying rainfall intensities.
5.2.4. DRAINS Model Parameters
For the DRAINS model of the Fox Studios/ Moore Park area the existing model parameters with
regards to assumed land use where maintained for the present study. However, the assumed
loss parameters in the DRAINS model were adjusted to ensure consistency with those adopted
for the MIKE-Storm model.
Kensington – Centennial Park Flood Study
WMAwater 111011:CentennialPk_WestKensingtonFS.docx:10 April 2013
29
6. TUFLOW MODEL CONFIGURATION
6.1. Hydraulic Model Extent
Hydraulic modelling of the study area utilised two sub models in order to optimise computation
time and allow a high grid resolution to more accurately model in 2D the narrow roads, flow
through properties and other such features typical for an urban context.
The approximate divide for the Upper and Lower models is Alison Road adjacent to Randwick
Racecourse and Wansey Road. West of the intersection of Alison Road and Darley Road, near
the racecourse entrance, the lower model supersedes.
The two hydraulic sub models are referred to as the Upper and Lower hydraulic models (refer
Figure 7 and Figure 8).
6.2. Model DTM
The primary ground survey utilised to generate the digital terrain model (DTM) for the 2D
hydraulic model is the ALS dataset. Grid cell resolutions for both the sub models are 2m by 2m.
It should be noted that TUFLOW records ground levels for each cell at the four corners rather
than as a single cell value. This means the effective resolution of the 2m model is doubled, i.e.
1m grid resolution. This level of resolution is at the limits of the ALS survey resolution and is
sufficient to model most overland flow paths in 2D. At key locations such as Gardeners Road
and the embankment along Alison Road, containing Centennial Parkland flows, break-lines were
used to ensure the exact elevations of critical controls were used.
6.3. Centennial Parklands Storage
Centennial Parklands upstream of Alison Road are comprised of a series of cascading storages.
These storage ponds are important features for flood mitigation and attenuate flow from Moore
Park and areas of Randwick and Waverly LGAs via Queens Park.
1D storage nodes linked by 1D weirs were used to simulate the Centennial Parkland ponds.
The embankment along Alison Road was interpreted from ALS and field survey and is
represented in 2D so that the correct spilling locations are modelling, together with the correct
velocity of embankment overflow. The ponds are assumed to be full prior to the design event
modelling. For verification and calibration modelling the starting level of the most downstream
pond was a calibration parameter.
6.4. Stormwater Assets
An extensive network of stormwater assets exist throughout the model domains which need to
be incorporated into the hydraulic model. Stormwater assets include pits, pipes, concrete open
channels and culverts under roads. These structures are modelled as 1D elements dynamically
linked to the 2D domain overland flow. The model assumptions of each asset type are
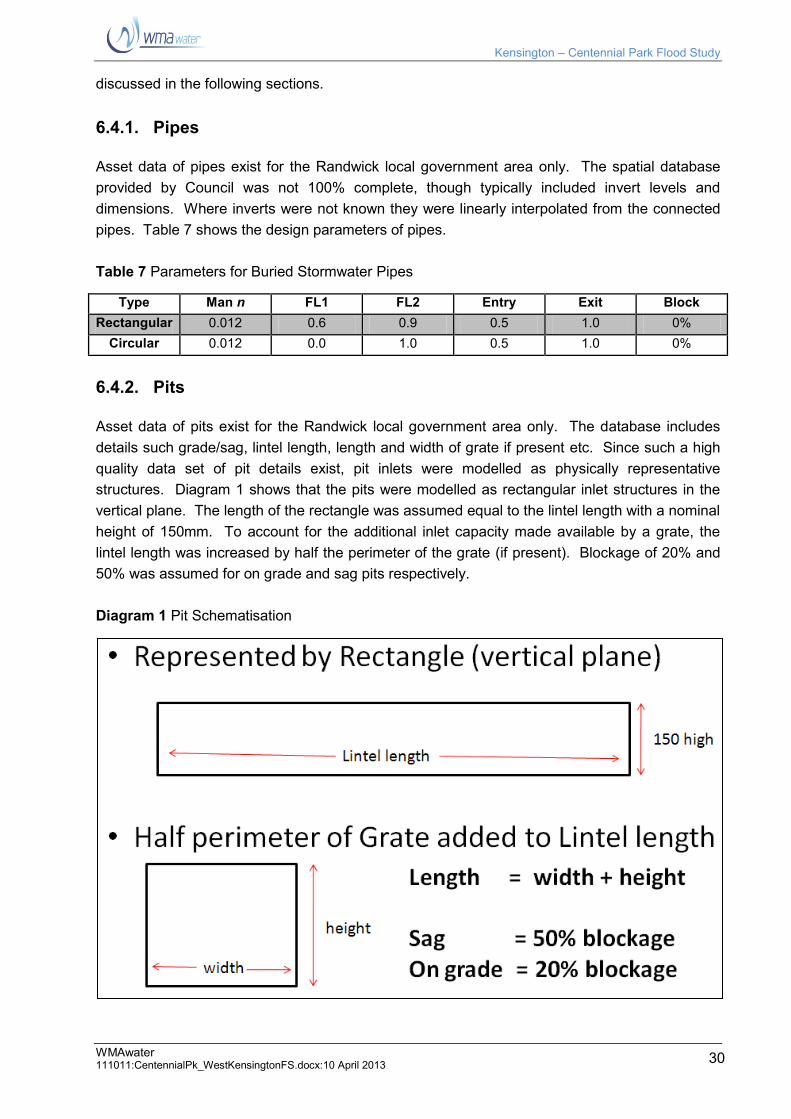
Kensington – Centennial Park Flood Study
WMAwater 111011:CentennialPk_WestKensingtonFS.docx:10 April 2013
30
discussed in the following sections.
6.4.1. Pipes
Asset data of pipes exist for the Randwick local government area only. The spatial database
provided by Council was not 100% complete, though typically included invert levels and
dimensions. Where inverts were not known they were linearly interpolated from the connected
pipes. Table 7 shows the design parameters of pipes.
Table 7 Parameters for Buried Stormwater Pipes
Type Man n FL1 FL2 Entry Exit Block
Rectangular 0.012 0.6 0.9 0.5 1.0 0%
Circular 0.012 0.0 1.0 0.5 1.0 0%
6.4.2. Pits
Asset data of pits exist for the Randwick local government area only. The database includes
details such grade/sag, lintel length, length and width of grate if present etc. Since such a high
quality data set of pit details exist, pit inlets were modelled as physically representative
structures. Diagram 1 shows that the pits were modelled as rectangular inlet structures in the
vertical plane. The length of the rectangle was assumed equal to the lintel length with a nominal
height of 150mm. To account for the additional inlet capacity made available by a grate, the
lintel length was increased by half the perimeter of the grate (if present). Blockage of 20% and
50% was assumed for on grade and sag pits respectively.
Diagram 1 Pit Schematisation
Kensington – Centennial Park Flood Study
WMAwater 111011:CentennialPk_WestKensingtonFS.docx:10 April 2013
31
6.4.3. Culverts
Three key culverts exist in the lower model. These rectangular structures convey water under
Koorinda Avenue, Day Avenue and Gardeners Road. As discussed subsequently in the
sensitivity analysis (Section 9), the flood levels immediately upstream of Gardeners Road are
very sensitive to blockage assumptions. As a result of post flood experiences at North
Wollongong - 1998, Coffs Harbour - 1996 and 2009 and Newcastle – 2007 it is considered best
practice to implement some level of blockage for design events. There is no rigorous approach
for determining an appropriate level of blockage, Wollongong City Council have a code for their
LGA that culverts less than 6m diagonal width should be 100% blocked. For the Randwick LGA
this level of blockage is considered unlikely and after discussion with Council a level of 25% was
adopted. Table 8 shows the design parameters for culverts.
Table 8 Parameters for Culverts
Type Man n FL1 FL2 Entry Exit Block
Rectangular 0.012 0.6 0.9 0.5 1.0 25%
6.4.4. Concrete Open Channel
Concrete open channels exist between Roma Avenue and Gardeners Road. The width of these
structures is not wide enough to accurately model in 2D so they were represented as 1D
elements dynamically linked to the 2D domain. The Manning’s ‘n’ of these 1D reaches is 0.015.
6.5. 2D Manning’s ‘n’ and Overland Flow Obstructions
Based on calibration of the hydraulic models, Table 9 lists the adopted Manning’s ‘n’ values
adopted for design modelling. The flow restriction of houses was typically undertaken by
removing the house footprint from the model domain. In trapped low points where ponding
depths can exceed the house floor level this method would unduly remove temporary flood
storage. In such areas of high depth flooding digitised houses were assigned a high Manning’s
‘n’ which restricted flow, though did not remove flood storage.
Table 9 Overland Flow Manning’s ‘n’
Surface Manning’s ‘n’ Surface Manning’s ‘n’
Default 0.05 Buildings 1.00
Road 0.02 Parklands 0.045
Grass Reserve 0.03 Footpaths 0.03
Lots 0.06
Where fences obstruct significant overland flow paths a method of modelling was adopted which
restricted a percentage available flow area up to the height of the fence. Above the fence top,
no flow area restriction was applied. Table 10 shows the typically assumed blockages for the
height of the fence. If the difference in hydraulic head exceeded 1m from one side of the fence
to the other a manual decision was made whether or not to maintain the fence in the hydraulic
Kensington – Centennial Park Flood Study
WMAwater 111011:CentennialPk_WestKensingtonFS.docx:10 April 2013
32
model depending on its material of construction.
Table 10 Fence Blockage Assumptions (applied to the height of the fence)
Type Blockage %
Brick 90
Wood 80
Wire/Metal 20
6.6. Boundary Conditions
TUFLOW model boundary conditions include both hydrologic model inputs and downstream
tailwater boundaries.
6.6.1. Hydrologic Inputs
Hydrologic inputs exist for both the MIKE-Storm and DRAINS modelling of the Moore Park area.
Since such an extensive database of pit structures was available, hydrologic model inputs were
delivered to the 2D domain of the hydraulic model and allowed to enter the stormwater via the
pit inlet. Flow was directed to the 2D cells connected to the pit nodes to maximise the
opportunity for inflow to the pit inlet. In the most upstream reaches of the stormwater system
where overland flow was not concentrated; flow was allocated directly to the pipe if the flow was
less than the capacity of the pipe. This is an appropriate assumption given most house roof
drainage is directly connected to the road gutter.
In the Centennial Parklands, flow was allocated directly to the 1D storage nodes.
6.6.2. Downstream Tailwater
Downstream tailwater conditions exist for flow leaving the lower model to the west via Todman
Avenue and Duke Street, in addition, downstream of Gardeners Road flow exits from the
hydraulic model into the Eastlakes and Lakes golf courses.
For all three locations, a height/flow boundary type was utilised based on a water slope of
0.02m/m. The location of the flow boundary was always such that in the study area, flood levels
were not influence by boundary conditions. Figure 8 shows the locations of the downstream
boundaries.
Kensington – Centennial Park Flood Study
WMAwater 111011:CentennialPk_WestKensingtonFS.docx:10 April 2013
33
7. MODEL CALIBRATION AND VERIFICATION
7.1. Overview
It is desirable to test the performance of the hydrological/hydraulic models against observed
flood behaviour from past events within the catchment to ensure the accuracy. In this way the
assumed model parameters can be adjusted so that the modelled behaviour best reproduces
the historical patterns of flooding. The process of adjusting model parameters to best reproduce
observed flood behaviour is known as model calibration. Usually, the models are calibrated to a
single flood event for which there is sufficient flood data available (e.g. peak flood levels,
observations regarding flowpaths or flood extents etc.). The performance of the calibrated
model can then be tested by simulating other historical floods and comparing the ability of the
calibrated models to reproduce the observed behaviour. This process is known as model
validation/verification.
To calibrate/verify the models requires a sufficient amount of flood data within the modelling
extent. Although other major floods are known to have occurred within the catchment (e.g. in
1933, 1958, 1975 and 2003), the two storms in November 1984 are the largest of recent events
for which there is a sufficient amount of flood height data available. The records for the
November 1984 events have been sourced from Reference 2. As the flood of 8-9th November
was distinctly larger than the preceding 5-6th November flood, the hydrologic/hydraulic models
were calibrated to the 8-9th November event and validated against the 5-6th November event.
When flooding occurs within the catchment in future, it is recommended that Council collect any
available information (rainfall data, flood heights etc) as soon as practicable after the event
(including after smaller, more frequent flooding such as would be expected in the 50% AEP or 2
year ARI event).
7.2. Approach
There have been a number of significant changes within the catchment since the November
1984 floods. Hence, the existing conditions hydraulic model described earlier was modified to
account for these changes. For example, much of the trunk drainage network downstream of
Centennial Park was upgraded following the November 1984 events (including both sub-surface
drainage and the sections of open channel downstream of Roma Street). To account for these
works, the TUFLOW hydraulic model was extensively modified to represent 1984 conditions on
the basis of information found in Reference 2. Detailed information of the trunk drainage
infrastructure present in 1984 was also obtained from surveyed data contained in Works-As-
Executed drawings for the Kensington drainage works provided by RCC.
After a review of available rainfall data, the pluviometer records from the BoM station at
Paddington and the UNSW station at Avoca Street were used to define the rainfall patterns for
the November 1984 events (Figure 4). The data for the Avoca Street station could not be
sourced directly from UNSW and was obtained from records provided in Reference 2. To
account for spatial variability, the historical rainfall patterns from these two gauges were

Kensington – Centennial Park Flood Study
WMAwater 111011:CentennialPk_WestKensingtonFS.docx:10 April 2013
34
interpolated linearly across the catchment.
For this study, calibration of the models was achieved through a tandem approach where
changes to both the hydrological and hydraulic models were undertaken so that the model
results reproduced observed behaviour. These changes included adjustments to the assumed
hydrologic parameters e.g. loss rates, effective impervious area as well as changes to the
hydraulic (TUFLOW) model e.g. initial storage levels in Centennial Park ponds.
7.3. Model Calibration
The TUFLOW models were calibrated using the peak flood level observations documented in
Reference 2. A comparison of this data against the model results for the 8-9th November event
is provided in Figure 9. The hydrological model parameters adopted to achieve this calibration
are provided in Table 11. The typical Manning’s ‘n’ values shown previously in Table 9 were
adopted in the hydraulic model.
Table 11: MIKEStorm Hydrological Model Parameters: November 8-9th Storm Event
Land Use Types
Effective
Fraction
Impervious
Initial
Loss
(mm)
Continuing
Loss
(mm/hr)
Comments
Impervious Area 100% 1 0 Typical parameters consistent
with ARR87
Urban Residential
Development
73% 401
251
Parameters adjusted through
calibration
Higher Density Urban
Development
90% 401
251
Loss rates adjusted through
calibration
Large Open Space
Areas2
10% 501
501
Loss rates adjusted through
calibration
Notes: 1 Rates for pervious area portion.
2 Includes features such as Centennial Parklands and Randwick Racecourse
In terms of outflow from the Centennial Parklands into Alison Road, Reference 2 notes
observations that indicate outflow from the lower pond was unable to enter the culverts under
Alison Road. As a consequence, outflows from this area were directed downstream across
Alison Road rather than into the existing sub-surface drainage system. Due to the relative
uncertainty regarding outlet control from the parklands system, the hydraulic (TUFLOW) model
was adjusted to best represent this behaviour by blocking the Alison Road culverts downstream
of the main Centennial Park outlet.
The available flood storage within the Centennial Parklands system prior to the November 1984
events is difficult to reliably determine due to the lack of suitable information. The following
approach was therefore adopted for modelling the November 8-9th event:
all ponds within the Centennial Parklands were assumed to be full, except for the Lower
Kensington pond directly upstream of Alison Road,
for the Lower Kensington pond, the initial water level in the pond was adjusted iteratively
such that the outflow from the pond (in combination with inflows from other contributing
catchments downstream) successfully reproduced the observed flooding behaviour in
Kensington – Centennial Park Flood Study
WMAwater 111011:CentennialPk_WestKensingtonFS.docx:10 April 2013
35
the vicinity of Alison Road and along Doncaster Avenue. The resulting peak outflow
from the Lower Kensington pond adopted to achieve this was found to be in the order of
9m3/s. This compares favourably with corresponding estimates reported in Reference 2.
Concurrently, preliminary model runs using industry-standard values for hydrologic parameters
(e.g. rainfall losses) were found to over-estimate the level of ponding in the lower reaches of the
catchment. The rainfall loss values for pervious portions of residential areas were increased
iteratively until an initial loss of 40mm and continuing loss of 25mm/hr was reached. For large
open space areas, these values were increased to 50mm initial loss and 50mm/hr continuing
loss. These rates are considered to be the maximum that could be reasonably justified for
design flood estimation in the absence of detailed rainfall/runoff data for the catchment and are
consistent with previous expert reviews commissioned by RCC (Reference 6).
The outcomes of the model calibration for the 8-9th November 1984 event shown on Figure 9
compare favourably with observed behaviour and a large proportion of the modelled peak flood
levels are within ±0.2m of the corresponding observed level. The model successfully
reproduced observed flood gradients in key reaches including:
along Doncaster Avenue (between Alison Road downstream to Todman Avenue),
in and around the intersection of Anzac Parade, Doncaster Avenue and Roma Avenue,
and
along the main stormwater easement (and adjacent roadways) from Koorinda Avenue
downstream to Edward Avenue.
In other areas where there were larger discrepancies, these could be attributed to a number of
features including possible localised hydraulic effects and the significant scatter in the observed
levels.
7.4. Model Verification
Using the available rainfall data, the calibrated model was then used to estimate flooding from
the 5-6th November 1984 event. Preliminary runs using the same loss assumptions as those
adopted for the calibration event (i.e. the flood event of 8-9th November 1984) indicated that the
modelled flood behaviour consistently overestimated observed flood levels for the main
floodplain from downstream of Centennial Park to Gardeners Road.
It can be reasonably assumed that the pervious areas of the catchment were significantly drier
before the first storm (5-6th November) than before the second storm (8-9th November). All other
model parameters and assumptions remained as per that adopted for the November 8-9th
calibration event. To improve this result the assumed previous area losses adopted for the 8-9th
November 1984 event were increased to better reflect antecedent conditions for the earlier 5-6th
November 1984 event.
Following an iterative trial/error process, a more reasonable representation of general behaviour
was found when adopting the following pervious area loss assumptions:
Pervious open space areas: initial loss = 110 mm, continuing loss 110mm/hr.
Kensington – Centennial Park Flood Study
WMAwater 111011:CentennialPk_WestKensingtonFS.docx:10 April 2013
36
Pervious urban areas (e.g. residential): initial loss 100mm, continuing loss 100mm/hr.
These higher loss rates are consistent with previous studies documented in Reference 6.
The results of the model validation are shown in Figure 10. Compared to the 8-9th November
1984 event, the relative differences between modelled and observed flood levels are greater
and more variable. Generally, the TUFLOW model tends to overestimates levels in the lower
reaches (below Roma Avenue) compared to upstream areas through to Alison Road. However,
a review of each area also shows that there are significant localised variations present in the
observed levels throughout the area. There are several levels which are difficult to resolve,
particularly when considering corresponding flood levels in similar locations for the 8-9th
November event. For example, the recorded flood level at Doncaster Avenue is 0.5m higher
than the observations from the 8-9th November event despite the earlier event being recorded as
a smaller storm event at the Paddington pluviometer.
Unfortunately more definitive conclusions regarding the quality of the model validation for the 5-
6th November 1984 event are difficult to draw given the significant variations in observed levels,
the uncertainties regarding antecedent conditions and the fact that there were only 39 recorded
flood heights versus 124 recorded flood heights for the 8-9th November 1984 event.
The calibration event of 8-9th November has a high quality and quantity data set of surveyed
flood levels and the modelling system provides a good overall match. Thus the model
calibration is of a high quality. Discrepancies exist in isolated sections of the model verification
that cannot be resolved, however the overall performance of the calibration and verification
exercise gives confidence in the suitability of the models for design flood modelling.
Kensington – Centennial Park Flood Study
WMAwater 111011:CentennialPk_WestKensingtonFS.docx:10 April 2013
37
8. DESIGN EVENT MODELLING
8.1. Approach
The calibrated models were used to estimate design flood behaviour for existing conditions (as
opposed to the model setup for the November 1984 events). A number of design storms were
analysed ranging from smaller events (e.g. 20% AEP or 5 year ARI event) through to large and
rarer events such as the 1% AEP (100 year ARI) flood and the PMF.
The traditional ARR87 approach to design storm hydrology is based on the estimation of a peak
flow generated by a critical duration peak burst rainfall pattern. This method assumes that
antecedent rainfall prior to the critical duration burst does not impact upon the peak flow
estimates. Several other studies indicate that a failure to incorporate antecedent conditions
prior to the critical duration peak burst may result in the underestimation of peak flows for some
catchments (References 13 to 15). As noted in Reference 14, this is particularly the case for
catchments where the ARR87 critical burst durations are much shorter than the duration of
historic flood-producing storms. It is also important for the Kensington - Centennial Park
catchment as there is a significant amount of temporary floodplain storage (Centennial Park and
Randwick Racecourse) and it is likely that high-intensity short duration storm bursts likely to
cause major flooding will occur during a broader low intensity, longer duration storm.
To address these issues, this study adopts an alternative approach to design flood estimation
whereby a critical duration design storm burst is embedded within a longer duration storm of the
same AEP magnitude. This approach was originally presented Reference 14 and has been
further documented in Reference 13. Initially, the critical burst is embedded to coincide with the
peak of the larger duration storm. To ensure that the average intensities reflect the original
AEPs the intensities of the longer duration storm are adjusted on either side of the peak burst
such that the total rainfall depth is consistent with that of the original longer duration storm.
Further details regarding the procedure can be found in References 13 and 14.
PMP rainfalls were obtained in accordance with Reference 16.
8.2. Embedded Design Storm Approach
8.2.1. Background
The selection of appropriate storm durations for design event modelling is complicated by the
nature of the study catchment. In the Centennial Parklands area, the catchment response is a
function of runoff potential in combination with the available flood storage provided by the ponds.
As a result, the dominant flooding mechanism is strongly dependant upon the volume of runoff
generated, hence longer duration storms are more likely to be critical. In contrast, the flood
response of much of the urban areas upstream and downstream of the Centennial Parklands is
primarily determined by the rainfall intensity - hence shorter duration storms (having higher
intensity rainfalls) are responsible for major flooding. This variability within the catchment
complicates the selection of a critical duration storm that is appropriate for the whole catchment.
Kensington – Centennial Park Flood Study
WMAwater 111011:CentennialPk_WestKensingtonFS.docx:10 April 2013
38
Past studies have adopted peak burst storms based on ARR87 guidelines. These studies have
found the critical duration of urban areas downstream of Centennial Parklands to be 2 hours,
while the critical duration for the Centennial Parklands was found to be longer, in the range of 24
to 48 hours (Reference 6).
In accordance with previous studies, it was decided to adopt a shorter peak burst as the critical
duration. However, for this study the peak burst was embedded in a longer duration storm. This
takes into account the “impact of lead rainfall on burst response” for design events. Initially, a 2
hour peak burst was embedded into a range of longer duration storms to form a range of
Embedded Design Storms (EDS). The rainfall patterns for various embedded design storms
were then compared to a number of historical events to identify the most appropriate design
storm for the catchment.
8.2.2. Methodology
The EDS were prepared based on the procedure outlined in Reference 14. This technique
involves embedding the shorter duration peak burst storm into the longer duration storms (of 6,
12 and 24 hour durations) so that the peaks of both patterns coincided. The intensity of the
storm was then adjusted so that the intensities were consistent with those for the critical burst
average intensity and overall design storm average intensity for their respective durations and
AEPs.
Pluviograph data for a number of large historical events was also analysed to determine an
appropriate duration for the overall design storm. Information from the March 1975, and
November 1984 storms were included in the analysis.
8.2.3. Outcomes
From this analysis it was concluded that a shorter peak burst (such as the 2 hour peak burst) be
embedded in a 12 hour duration storm for this study. This conclusion takes into account a
number of aspects including:
The shorter duration peak burst embedded within a 6 hour duration storm was
considered to be inappropriate due to insufficient overall rainfall depth. For example,
when compared to recorded rainfalls from past floods, the total rainfall depth of the 6
hour duration EDS has been exceeded three times over the 32 years of limited historical
data (e.g. Paddington 08/11/1984, Avoca Street 05/11/1984 and Airport 10/03/1975 –
refer Figure 4). This outcome suggests that the 6 hour design storm may underestimate
the magnitude of 6 hour storms experienced in this area in the past.
The use of a longer duration storm such as the 24 hour storm was also considered
inappropriate. While the total depth of the 24 hour design storm is similar to the
recorded depths for large historical events, the historical storms of these durations
examined generally do not exhibit the higher intensities found in this EDS.
In view of the preceding factors, the 12 hour EDS was therefore adopted for the purposes of this

Kensington – Centennial Park Flood Study
WMAwater 111011:CentennialPk_WestKensingtonFS.docx:10 April 2013
39
study.
It is noted that the preceding analysis assumed a 2 hour peak burst since previous studies had
found this to be the critical duration storm for the catchment. However, this assumption does
not affect the outcomes of the above and the particular duration to be adopted as the peak burst
duration was confirmed using the hydraulic model (discussed in later sections).
8.3. Key Model Parameters
The parameters adopted within the hydrologic model were based on those adopted from the
model calibration (refer to Table 11). The Manning’s ‘n’ values adopted within the hydraulic
model were based on those adopted from the model calibration (refer to Table 9).
8.4. Boundary Conditions
8.4.1. Hydrologic (MIKE-Storm) Model
Design rainfall depths and temporal patterns across different storm durations for the embedded
design storms were obtained in accordance with ARR87 and the embedded design storm
approach presented in Section 8.2.
The resulting rainfall hyetographs were converted by the MIKE-Storm and DRAINS hydrologic
models into paved area and pervious area runoff hydrographs. These hydrographs were then
super-imposed for each sub-catchment to give total flow hydrographs and used to provide inflow
boundary conditions to the TUFLOW hydraulic model.
8.4.2. Hydraulic (TUFLOW) Model
The runoff hydrographs for each sub-catchment were defined as point source inflow boundaries
defined at the corresponding kerb inlet pit in the TUFLOW model.
Tailwater boundaries were used at the downstream limit of the TUFLOW model downstream of
Gardeners Road. A stage-discharge relationship was established at each location and defined
as a control relationship at these boundaries in the hydraulic (TUFLOW) model. The sensitivity
of the model results to various tailwater assumptions is provided in Section 9.
8.5. Results
8.5.1. Critical Storm Duration
The determination of the critical storm duration for an urban catchment is more complex than for
a rural catchment. Consideration must be taken of:
the peak flow from the sub-catchment surface,
the peak flow arriving at a surface inlet pit from upstream (conduit and overland flows),
the peak flow in the pit,
Kensington – Centennial Park Flood Study
WMAwater 111011:CentennialPk_WestKensingtonFS.docx:10 April 2013
40
the volume temporarily collected in ponding areas,
the location within the catchment.
To determine the critical duration(s) for the catchment, a number of design storm peak bursts
ranging from 30 minutes to 3 hours were embedded within the 12 hour duration EDS for the 1%
AEP event. The corresponding peak flow and water level estimates were then compared. The
critical duration was found to vary across the catchment ranging from 60 minutes to 120
minutes. However, a detailed review of the results showed that the relative differences between
these storm durations were only minor. The 60 minute storm was therefore adopted for all
design events up the 0.2% AEP as the representative critical duration for the study area to
ensure consistency in results and reporting. However, it is recommended that the full range of
storm durations are considered if undertaking detailed investigations for drainage upgrade works
within the catchment.
To determine the critical duration for the PMF modelling, a number of design storm durations
ranging from 30 minutes to 3 hours were run. The critical duration for the PMF modelling varied
at different points in the catchment however the 120 minute event was typically the critical
duration event and was used for design modelling.
8.5.2. Overview
The results from the design event modelling provide a description of the design flood behaviour
of the study area. Information such as peak flood levels, flows and depths were extracted and
have been documented as part of this report. In addition, the model results have also been
produced in a digital format that can be readily imported into Council’s GIS systems.
The results of the hydraulic modelling have been analysed and presented in accordance with
the Brief. Table 12 provides a summary of design flood levels and flows at key locations for
each event (refer Figure 2 for locations). Corresponding flood level and depth information is
provided in Figure 11 through to Figure 26 for that portion of the floodplain represented in the 2D
model. Table 13 shows the 1D levels determined for the ponds in Centennial Park and the
approximate extent of flooding in Centennial Park is shown on Figure 27 for the 1% AEP event
(the lateral extent does not vary much between the design events).
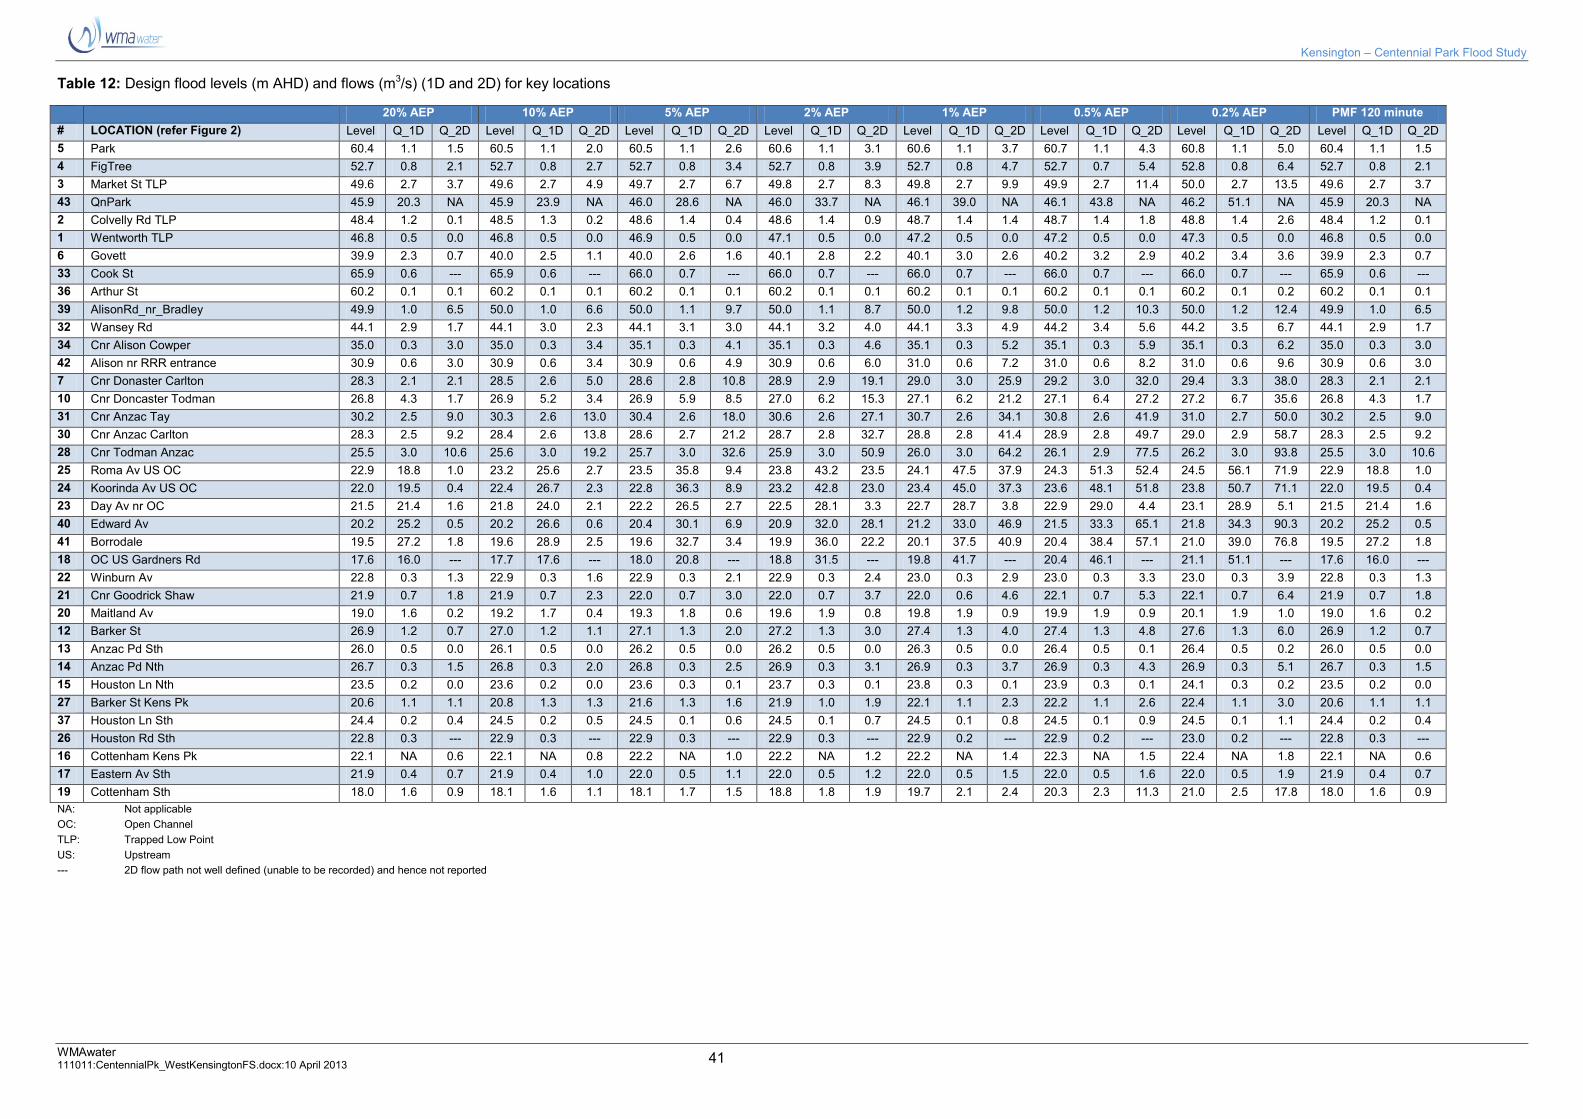
Kensington – Centennial Park Flood Study
WMAwater 111011:CentennialPk_WestKensingtonFS.docx:10 April 2013
41
Table 12: Design flood levels (m AHD) and flows (m3/s) (1D and 2D) for key locations
20% AEP 10% AEP 5% AEP 2% AEP 1% AEP 0.5% AEP 0.2% AEP PMF 120 minute
# LOCATION (refer Figure 2) Level Q_1D Q_2D Level Q_1D Q_2D Level Q_1D Q_2D Level Q_1D Q_2D Level Q_1D Q_2D Level Q_1D Q_2D Level Q_1D Q_2D Level Q_1D Q_2D
5 Park 60.4 1.1 1.5 60.5 1.1 2.0 60.5 1.1 2.6 60.6 1.1 3.1 60.6 1.1 3.7 60.7 1.1 4.3 60.8 1.1 5.0 60.4 1.1 1.5
4 FigTree 52.7 0.8 2.1 52.7 0.8 2.7 52.7 0.8 3.4 52.7 0.8 3.9 52.7 0.8 4.7 52.7 0.7 5.4 52.8 0.8 6.4 52.7 0.8 2.1
3 Market St TLP 49.6 2.7 3.7 49.6 2.7 4.9 49.7 2.7 6.7 49.8 2.7 8.3 49.8 2.7 9.9 49.9 2.7 11.4 50.0 2.7 13.5 49.6 2.7 3.7
43 QnPark 45.9 20.3 NA 45.9 23.9 NA 46.0 28.6 NA 46.0 33.7 NA 46.1 39.0 NA 46.1 43.8 NA 46.2 51.1 NA 45.9 20.3 NA
2 Colvelly Rd TLP 48.4 1.2 0.1 48.5 1.3 0.2 48.6 1.4 0.4 48.6 1.4 0.9 48.7 1.4 1.4 48.7 1.4 1.8 48.8 1.4 2.6 48.4 1.2 0.1
1 Wentworth TLP 46.8 0.5 0.0 46.8 0.5 0.0 46.9 0.5 0.0 47.1 0.5 0.0 47.2 0.5 0.0 47.2 0.5 0.0 47.3 0.5 0.0 46.8 0.5 0.0
6 Govett 39.9 2.3 0.7 40.0 2.5 1.1 40.0 2.6 1.6 40.1 2.8 2.2 40.1 3.0 2.6 40.2 3.2 2.9 40.2 3.4 3.6 39.9 2.3 0.7
33 Cook St 65.9 0.6 --- 65.9 0.6 --- 66.0 0.7 --- 66.0 0.7 --- 66.0 0.7 --- 66.0 0.7 --- 66.0 0.7 --- 65.9 0.6 ---
36 Arthur St 60.2 0.1 0.1 60.2 0.1 0.1 60.2 0.1 0.1 60.2 0.1 0.1 60.2 0.1 0.1 60.2 0.1 0.1 60.2 0.1 0.2 60.2 0.1 0.1
39 AlisonRd_nr_Bradley 49.9 1.0 6.5 50.0 1.0 6.6 50.0 1.1 9.7 50.0 1.1 8.7 50.0 1.2 9.8 50.0 1.2 10.3 50.0 1.2 12.4 49.9 1.0 6.5
32 Wansey Rd 44.1 2.9 1.7 44.1 3.0 2.3 44.1 3.1 3.0 44.1 3.2 4.0 44.1 3.3 4.9 44.2 3.4 5.6 44.2 3.5 6.7 44.1 2.9 1.7
34 Cnr Alison Cowper 35.0 0.3 3.0 35.0 0.3 3.4 35.1 0.3 4.1 35.1 0.3 4.6 35.1 0.3 5.2 35.1 0.3 5.9 35.1 0.3 6.2 35.0 0.3 3.0
42 Alison nr RRR entrance 30.9 0.6 3.0 30.9 0.6 3.4 30.9 0.6 4.9 30.9 0.6 6.0 31.0 0.6 7.2 31.0 0.6 8.2 31.0 0.6 9.6 30.9 0.6 3.0
7 Cnr Donaster Carlton 28.3 2.1 2.1 28.5 2.6 5.0 28.6 2.8 10.8 28.9 2.9 19.1 29.0 3.0 25.9 29.2 3.0 32.0 29.4 3.3 38.0 28.3 2.1 2.1
10 Cnr Doncaster Todman 26.8 4.3 1.7 26.9 5.2 3.4 26.9 5.9 8.5 27.0 6.2 15.3 27.1 6.2 21.2 27.1 6.4 27.2 27.2 6.7 35.6 26.8 4.3 1.7
31 Cnr Anzac Tay 30.2 2.5 9.0 30.3 2.6 13.0 30.4 2.6 18.0 30.6 2.6 27.1 30.7 2.6 34.1 30.8 2.6 41.9 31.0 2.7 50.0 30.2 2.5 9.0
30 Cnr Anzac Carlton 28.3 2.5 9.2 28.4 2.6 13.8 28.6 2.7 21.2 28.7 2.8 32.7 28.8 2.8 41.4 28.9 2.8 49.7 29.0 2.9 58.7 28.3 2.5 9.2
28 Cnr Todman Anzac 25.5 3.0 10.6 25.6 3.0 19.2 25.7 3.0 32.6 25.9 3.0 50.9 26.0 3.0 64.2 26.1 2.9 77.5 26.2 3.0 93.8 25.5 3.0 10.6
25 Roma Av US OC 22.9 18.8 1.0 23.2 25.6 2.7 23.5 35.8 9.4 23.8 43.2 23.5 24.1 47.5 37.9 24.3 51.3 52.4 24.5 56.1 71.9 22.9 18.8 1.0
24 Koorinda Av US OC 22.0 19.5 0.4 22.4 26.7 2.3 22.8 36.3 8.9 23.2 42.8 23.0 23.4 45.0 37.3 23.6 48.1 51.8 23.8 50.7 71.1 22.0 19.5 0.4
23 Day Av nr OC 21.5 21.4 1.6 21.8 24.0 2.1 22.2 26.5 2.7 22.5 28.1 3.3 22.7 28.7 3.8 22.9 29.0 4.4 23.1 28.9 5.1 21.5 21.4 1.6
40 Edward Av 20.2 25.2 0.5 20.2 26.6 0.6 20.4 30.1 6.9 20.9 32.0 28.1 21.2 33.0 46.9 21.5 33.3 65.1 21.8 34.3 90.3 20.2 25.2 0.5
41 Borrodale 19.5 27.2 1.8 19.6 28.9 2.5 19.6 32.7 3.4 19.9 36.0 22.2 20.1 37.5 40.9 20.4 38.4 57.1 21.0 39.0 76.8 19.5 27.2 1.8
18 OC US Gardners Rd 17.6 16.0 --- 17.7 17.6 --- 18.0 20.8 --- 18.8 31.5 --- 19.8 41.7 --- 20.4 46.1 --- 21.1 51.1 --- 17.6 16.0 ---
22 Winburn Av 22.8 0.3 1.3 22.9 0.3 1.6 22.9 0.3 2.1 22.9 0.3 2.4 23.0 0.3 2.9 23.0 0.3 3.3 23.0 0.3 3.9 22.8 0.3 1.3
21 Cnr Goodrick Shaw 21.9 0.7 1.8 21.9 0.7 2.3 22.0 0.7 3.0 22.0 0.7 3.7 22.0 0.6 4.6 22.1 0.7 5.3 22.1 0.7 6.4 21.9 0.7 1.8
20 Maitland Av 19.0 1.6 0.2 19.2 1.7 0.4 19.3 1.8 0.6 19.6 1.9 0.8 19.8 1.9 0.9 19.9 1.9 0.9 20.1 1.9 1.0 19.0 1.6 0.2
12 Barker St 26.9 1.2 0.7 27.0 1.2 1.1 27.1 1.3 2.0 27.2 1.3 3.0 27.4 1.3 4.0 27.4 1.3 4.8 27.6 1.3 6.0 26.9 1.2 0.7
13 Anzac Pd Sth 26.0 0.5 0.0 26.1 0.5 0.0 26.2 0.5 0.0 26.2 0.5 0.0 26.3 0.5 0.0 26.4 0.5 0.1 26.4 0.5 0.2 26.0 0.5 0.0
14 Anzac Pd Nth 26.7 0.3 1.5 26.8 0.3 2.0 26.8 0.3 2.5 26.9 0.3 3.1 26.9 0.3 3.7 26.9 0.3 4.3 26.9 0.3 5.1 26.7 0.3 1.5
15 Houston Ln Nth 23.5 0.2 0.0 23.6 0.2 0.0 23.6 0.3 0.1 23.7 0.3 0.1 23.8 0.3 0.1 23.9 0.3 0.1 24.1 0.3 0.2 23.5 0.2 0.0
27 Barker St Kens Pk 20.6 1.1 1.1 20.8 1.3 1.3 21.6 1.3 1.6 21.9 1.0 1.9 22.1 1.1 2.3 22.2 1.1 2.6 22.4 1.1 3.0 20.6 1.1 1.1
37 Houston Ln Sth 24.4 0.2 0.4 24.5 0.2 0.5 24.5 0.1 0.6 24.5 0.1 0.7 24.5 0.1 0.8 24.5 0.1 0.9 24.5 0.1 1.1 24.4 0.2 0.4
26 Houston Rd Sth 22.8 0.3 --- 22.9 0.3 --- 22.9 0.3 --- 22.9 0.3 --- 22.9 0.2 --- 22.9 0.2 --- 23.0 0.2 --- 22.8 0.3 ---
16 Cottenham Kens Pk 22.1 NA 0.6 22.1 NA 0.8 22.2 NA 1.0 22.2 NA 1.2 22.2 NA 1.4 22.3 NA 1.5 22.4 NA 1.8 22.1 NA 0.6
17 Eastern Av Sth 21.9 0.4 0.7 21.9 0.4 1.0 22.0 0.5 1.1 22.0 0.5 1.2 22.0 0.5 1.5 22.0 0.5 1.6 22.0 0.5 1.9 21.9 0.4 0.7
19 Cottenham Sth 18.0 1.6 0.9 18.1 1.6 1.1 18.1 1.7 1.5 18.8 1.8 1.9 19.7 2.1 2.4 20.3 2.3 11.3 21.0 2.5 17.8 18.0 1.6 0.9
NA: Not applicable
OC: Open Channel
TLP: Trapped Low Point
US: Upstream
--- 2D flow path not well defined (unable to be recorded) and hence not reported
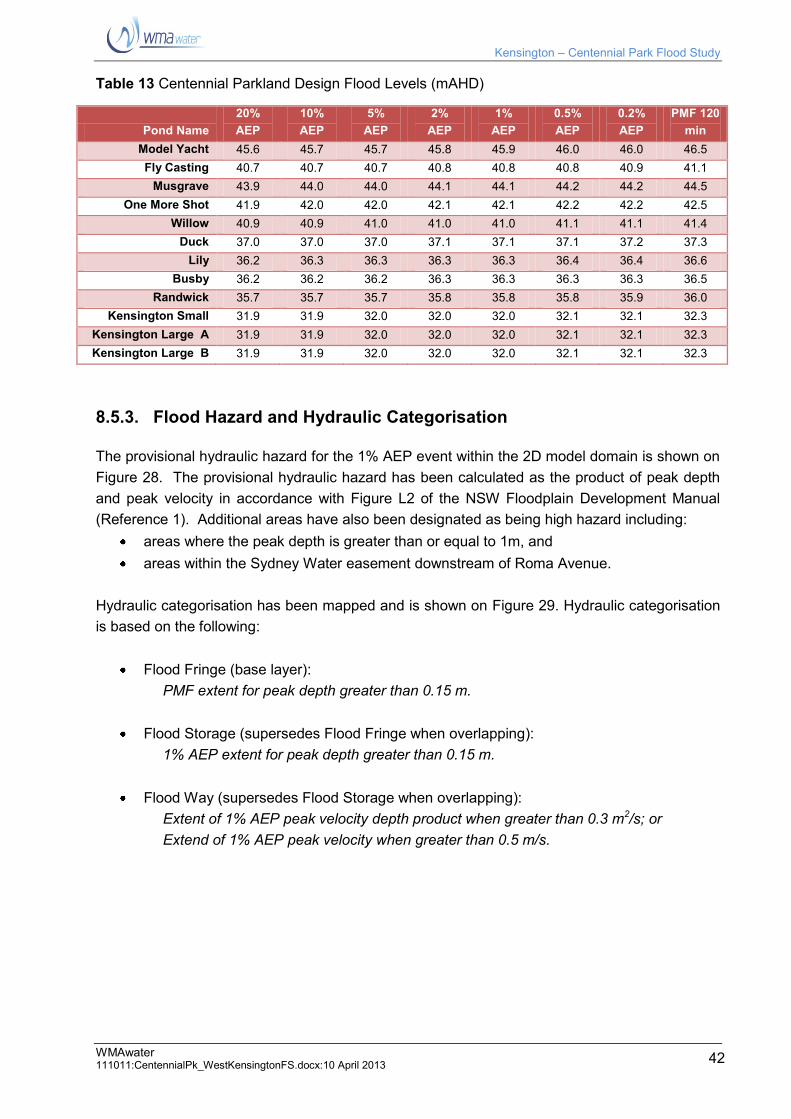
Kensington – Centennial Park Flood Study
WMAwater 111011:CentennialPk_WestKensingtonFS.docx:10 April 2013
42
Table 13 Centennial Parkland Design Flood Levels (mAHD)
Pond Name
20%
AEP
10%
AEP
5%
AEP
2%
AEP
1%
AEP
0.5%
AEP
0.2%
AEP
PMF 120
min
Model Yacht 45.6 45.7 45.7 45.8 45.9 46.0 46.0 46.5
Fly Casting 40.7 40.7 40.7 40.8 40.8 40.8 40.9 41.1
Musgrave 43.9 44.0 44.0 44.1 44.1 44.2 44.2 44.5
One More Shot 41.9 42.0 42.0 42.1 42.1 42.2 42.2 42.5
Willow 40.9 40.9 41.0 41.0 41.0 41.1 41.1 41.4
Duck 37.0 37.0 37.0 37.1 37.1 37.1 37.2 37.3
Lily 36.2 36.3 36.3 36.3 36.3 36.4 36.4 36.6
Busby 36.2 36.2 36.2 36.3 36.3 36.3 36.3 36.5
Randwick 35.7 35.7 35.7 35.8 35.8 35.8 35.9 36.0
Kensington Small 31.9 31.9 32.0 32.0 32.0 32.1 32.1 32.3
Kensington Large A 31.9 31.9 32.0 32.0 32.0 32.1 32.1 32.3
Kensington Large B 31.9 31.9 32.0 32.0 32.0 32.1 32.1 32.3
8.5.3. Flood Hazard and Hydraulic Categorisation
The provisional hydraulic hazard for the 1% AEP event within the 2D model domain is shown on
Figure 28. The provisional hydraulic hazard has been calculated as the product of peak depth
and peak velocity in accordance with Figure L2 of the NSW Floodplain Development Manual
(Reference 1). Additional areas have also been designated as being high hazard including:
areas where the peak depth is greater than or equal to 1m, and
areas within the Sydney Water easement downstream of Roma Avenue.
Hydraulic categorisation has been mapped and is shown on Figure 29. Hydraulic categorisation
is based on the following:
Flood Fringe (base layer):
PMF extent for peak depth greater than 0.15 m.
Flood Storage (supersedes Flood Fringe when overlapping):
1% AEP extent for peak depth greater than 0.15 m.
Flood Way (supersedes Flood Storage when overlapping):
Extent of 1% AEP peak velocity depth product when greater than 0.3 m2/s; or
Extend of 1% AEP peak velocity when greater than 0.5 m/s.
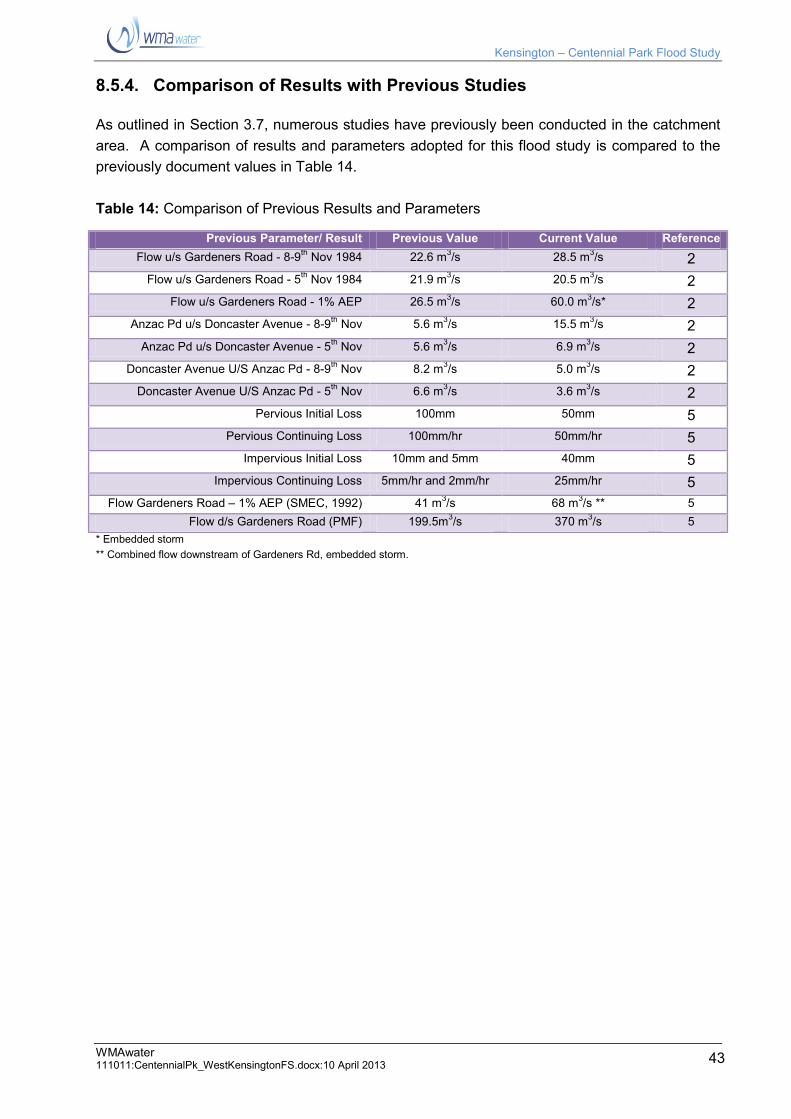
Kensington – Centennial Park Flood Study
WMAwater 111011:CentennialPk_WestKensingtonFS.docx:10 April 2013
43
8.5.4. Comparison of Results with Previous Studies
As outlined in Section 3.7, numerous studies have previously been conducted in the catchment
area. A comparison of results and parameters adopted for this flood study is compared to the
previously document values in Table 14.
Table 14: Comparison of Previous Results and Parameters
Previous Parameter/ Result Previous Value Current Value Reference
Flow u/s Gardeners Road - 8-9th
Nov 1984 22.6 m3/s 28.5 m
3/s 2
Flow u/s Gardeners Road - 5th Nov 1984 21.9 m
3/s 20.5 m
3/s 2
Flow u/s Gardeners Road - 1% AEP 26.5 m3/s 60.0 m
3/s* 2
Anzac Pd u/s Doncaster Avenue - 8-9th
Nov 5.6 m3/s 15.5 m
3/s 2
Anzac Pd u/s Doncaster Avenue - 5th Nov 5.6 m
3/s 6.9 m
3/s 2
Doncaster Avenue U/S Anzac Pd - 8-9th Nov 8.2 m
3/s 5.0 m
3/s 2
Doncaster Avenue U/S Anzac Pd - 5th
Nov 6.6 m3/s 3.6 m
3/s 2
Pervious Initial Loss 100mm 50mm 5
Pervious Continuing Loss 100mm/hr 50mm/hr 5
Impervious Initial Loss 10mm and 5mm 40mm 5
Impervious Continuing Loss 5mm/hr and 2mm/hr 25mm/hr 5
Flow Gardeners Road – 1% AEP (SMEC, 1992) 41 m3/s 68 m
3/s ** 5
Flow d/s Gardeners Road (PMF) 199.5m3/s 370 m
3/s 5
* Embedded storm
** Combined flow downstream of Gardeners Rd, embedded storm.
Kensington – Centennial Park Flood Study
WMAwater 111011:CentennialPk_WestKensingtonFS.docx:10 April 2013
44
9. SENSITIVITY ANALYSES AND CLIMATE CHANGE
9.1. Sensitivity Analyses
The models established for the present study rely on a number of assumed parameters, the
values of which are considered to be the most appropriate for the catchment based on limited
calibration/validation and published studies of similar catchments. Although a limited model
validation has been performed, a range of sensitivity analyses were also undertaken to quantify
the potential variation in the model results due to different assumptions in the key modelling
parameters adopted.
The following scenarios were considered to represent the envelope of likely parameter values:
± 20% change in design rainfall,
± 20% change in Manning’s ‘n’ value for overland flow paths,
comparisons between embedded and peak burst design storm hydrology, and
culvert blockage.
When interpreting the results, it should also be noted that the sensitivity analysis for the
drainage system may not always result in a change in peak flow attained downstream if (for
instance) the size of the pipe or pit is the control and there is no change in the flow conveyed in
the pipe. There may be a change in the overland flow but the effect further downstream will
depend on the particular characteristics of the pit and pipe network. At some locations the
change in upstream flow is not reflected downstream due to the effects of ponding at sag pits or
the relative timing of overland flows.
For each of the above scenarios (excluding the peak burst hydrology scenario), the models were
run for the 1% AEP 60 minute duration embedded design storm using the design model
parameters. A relative comparison of the resultant changes in peak overland flows and flood
heights at various locations (refer Figure 2) is provided in Table 15.
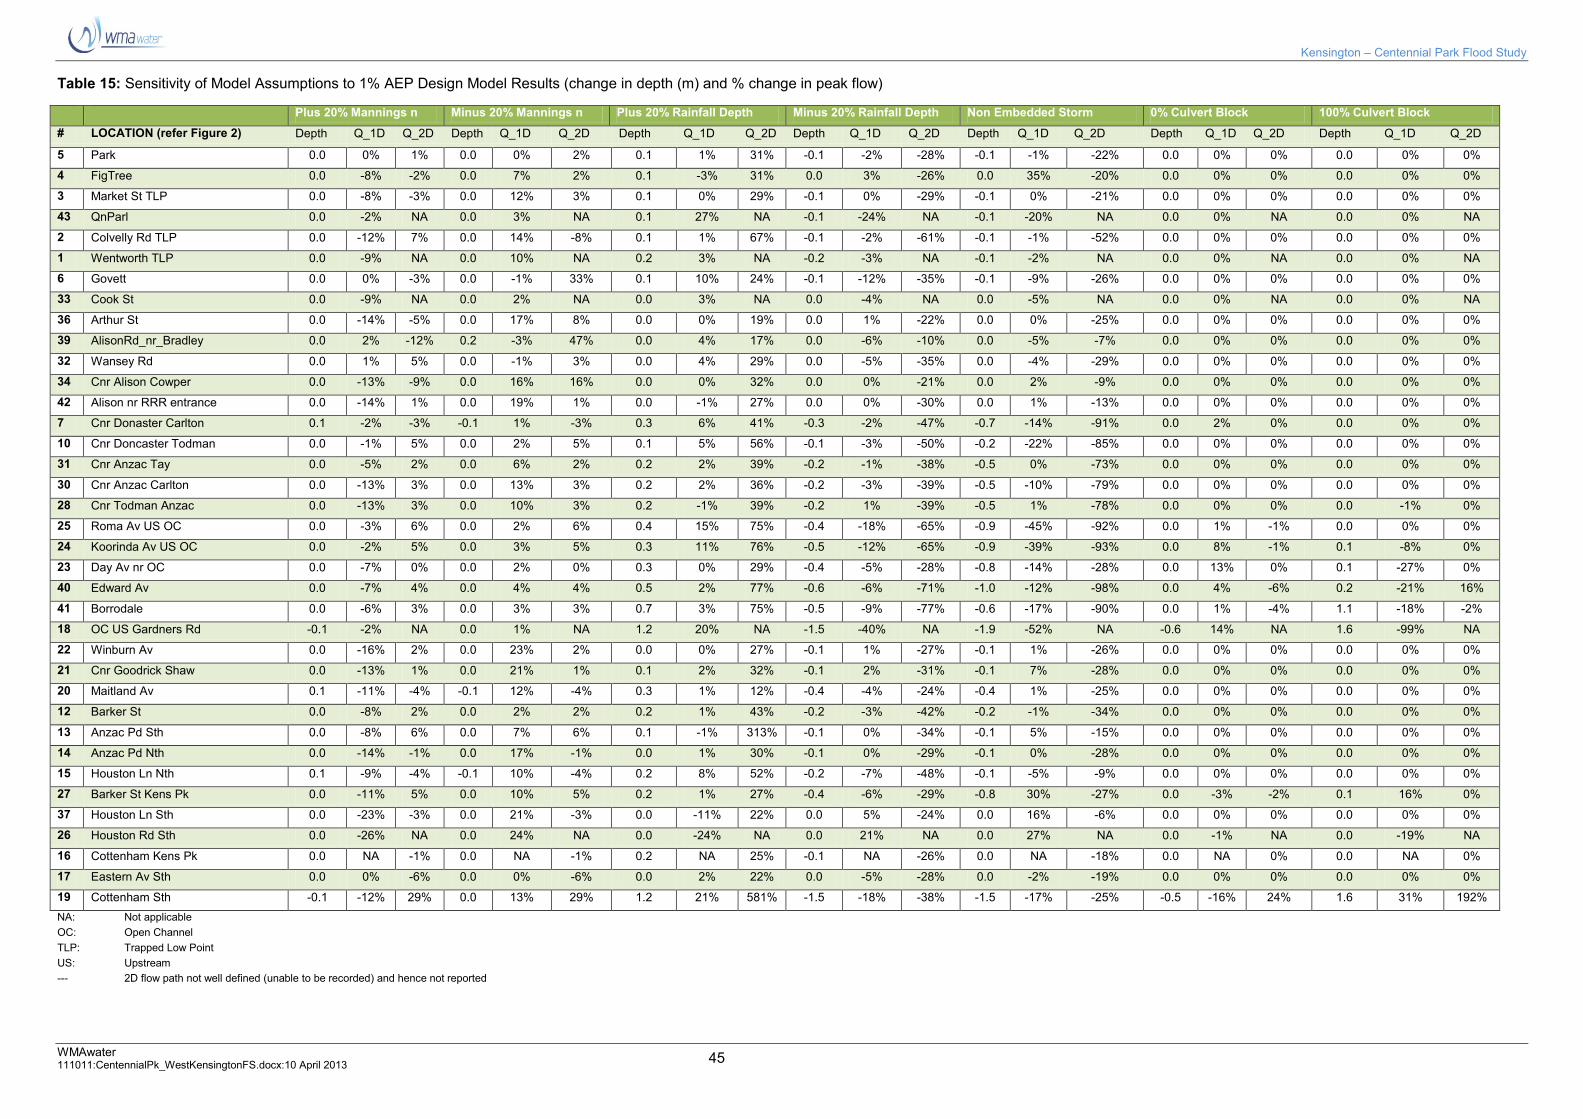
Kensington – Centennial Park Flood Study
WMAwater 111011:CentennialPk_WestKensingtonFS.docx:10 April 2013
45
Table 15: Sensitivity of Model Assumptions to 1% AEP Design Model Results (change in depth (m) and % change in peak flow)
Plus 20% Mannings n Minus 20% Mannings n Plus 20% Rainfall Depth Minus 20% Rainfall Depth Non Embedded Storm 0% Culvert Block 100% Culvert Block
# LOCATION (refer Figure 2) Depth Q_1D Q_2D Depth Q_1D Q_2D Depth Q_1D Q_2D Depth Q_1D Q_2D Depth Q_1D Q_2D Depth Q_1D Q_2D Depth Q_1D Q_2D
5 Park 0.0 0% 1% 0.0 0% 2% 0.1 1% 31% -0.1 -2% -28% -0.1 -1% -22% 0.0 0% 0% 0.0 0% 0%
4 FigTree 0.0 -8% -2% 0.0 7% 2% 0.1 -3% 31% 0.0 3% -26% 0.0 35% -20% 0.0 0% 0% 0.0 0% 0%
3 Market St TLP 0.0 -8% -3% 0.0 12% 3% 0.1 0% 29% -0.1 0% -29% -0.1 0% -21% 0.0 0% 0% 0.0 0% 0%
43 QnParl 0.0 -2% NA 0.0 3% NA 0.1 27% NA -0.1 -24% NA -0.1 -20% NA 0.0 0% NA 0.0 0% NA
2 Colvelly Rd TLP 0.0 -12% 7% 0.0 14% -8% 0.1 1% 67% -0.1 -2% -61% -0.1 -1% -52% 0.0 0% 0% 0.0 0% 0%
1 Wentworth TLP 0.0 -9% NA 0.0 10% NA 0.2 3% NA -0.2 -3% NA -0.1 -2% NA 0.0 0% NA 0.0 0% NA
6 Govett 0.0 0% -3% 0.0 -1% 33% 0.1 10% 24% -0.1 -12% -35% -0.1 -9% -26% 0.0 0% 0% 0.0 0% 0%
33 Cook St 0.0 -9% NA 0.0 2% NA 0.0 3% NA 0.0 -4% NA 0.0 -5% NA 0.0 0% NA 0.0 0% NA
36 Arthur St 0.0 -14% -5% 0.0 17% 8% 0.0 0% 19% 0.0 1% -22% 0.0 0% -25% 0.0 0% 0% 0.0 0% 0%
39 AlisonRd_nr_Bradley 0.0 2% -12% 0.2 -3% 47% 0.0 4% 17% 0.0 -6% -10% 0.0 -5% -7% 0.0 0% 0% 0.0 0% 0%
32 Wansey Rd 0.0 1% 5% 0.0 -1% 3% 0.0 4% 29% 0.0 -5% -35% 0.0 -4% -29% 0.0 0% 0% 0.0 0% 0%
34 Cnr Alison Cowper 0.0 -13% -9% 0.0 16% 16% 0.0 0% 32% 0.0 0% -21% 0.0 2% -9% 0.0 0% 0% 0.0 0% 0%
42 Alison nr RRR entrance 0.0 -14% 1% 0.0 19% 1% 0.0 -1% 27% 0.0 0% -30% 0.0 1% -13% 0.0 0% 0% 0.0 0% 0%
7 Cnr Donaster Carlton 0.1 -2% -3% -0.1 1% -3% 0.3 6% 41% -0.3 -2% -47% -0.7 -14% -91% 0.0 2% 0% 0.0 0% 0%
10 Cnr Doncaster Todman 0.0 -1% 5% 0.0 2% 5% 0.1 5% 56% -0.1 -3% -50% -0.2 -22% -85% 0.0 0% 0% 0.0 0% 0%
31 Cnr Anzac Tay 0.0 -5% 2% 0.0 6% 2% 0.2 2% 39% -0.2 -1% -38% -0.5 0% -73% 0.0 0% 0% 0.0 0% 0%
30 Cnr Anzac Carlton 0.0 -13% 3% 0.0 13% 3% 0.2 2% 36% -0.2 -3% -39% -0.5 -10% -79% 0.0 0% 0% 0.0 0% 0%
28 Cnr Todman Anzac 0.0 -13% 3% 0.0 10% 3% 0.2 -1% 39% -0.2 1% -39% -0.5 1% -78% 0.0 0% 0% 0.0 -1% 0%
25 Roma Av US OC 0.0 -3% 6% 0.0 2% 6% 0.4 15% 75% -0.4 -18% -65% -0.9 -45% -92% 0.0 1% -1% 0.0 0% 0%
24 Koorinda Av US OC 0.0 -2% 5% 0.0 3% 5% 0.3 11% 76% -0.5 -12% -65% -0.9 -39% -93% 0.0 8% -1% 0.1 -8% 0%
23 Day Av nr OC 0.0 -7% 0% 0.0 2% 0% 0.3 0% 29% -0.4 -5% -28% -0.8 -14% -28% 0.0 13% 0% 0.1 -27% 0%
40 Edward Av 0.0 -7% 4% 0.0 4% 4% 0.5 2% 77% -0.6 -6% -71% -1.0 -12% -98% 0.0 4% -6% 0.2 -21% 16%
41 Borrodale 0.0 -6% 3% 0.0 3% 3% 0.7 3% 75% -0.5 -9% -77% -0.6 -17% -90% 0.0 1% -4% 1.1 -18% -2%
18 OC US Gardners Rd -0.1 -2% NA 0.0 1% NA 1.2 20% NA -1.5 -40% NA -1.9 -52% NA -0.6 14% NA 1.6 -99% NA
22 Winburn Av 0.0 -16% 2% 0.0 23% 2% 0.0 0% 27% -0.1 1% -27% -0.1 1% -26% 0.0 0% 0% 0.0 0% 0%
21 Cnr Goodrick Shaw 0.0 -13% 1% 0.0 21% 1% 0.1 2% 32% -0.1 2% -31% -0.1 7% -28% 0.0 0% 0% 0.0 0% 0%
20 Maitland Av 0.1 -11% -4% -0.1 12% -4% 0.3 1% 12% -0.4 -4% -24% -0.4 1% -25% 0.0 0% 0% 0.0 0% 0%
12 Barker St 0.0 -8% 2% 0.0 2% 2% 0.2 1% 43% -0.2 -3% -42% -0.2 -1% -34% 0.0 0% 0% 0.0 0% 0%
13 Anzac Pd Sth 0.0 -8% 6% 0.0 7% 6% 0.1 -1% 313% -0.1 0% -34% -0.1 5% -15% 0.0 0% 0% 0.0 0% 0%
14 Anzac Pd Nth 0.0 -14% -1% 0.0 17% -1% 0.0 1% 30% -0.1 0% -29% -0.1 0% -28% 0.0 0% 0% 0.0 0% 0%
15 Houston Ln Nth 0.1 -9% -4% -0.1 10% -4% 0.2 8% 52% -0.2 -7% -48% -0.1 -5% -9% 0.0 0% 0% 0.0 0% 0%
27 Barker St Kens Pk 0.0 -11% 5% 0.0 10% 5% 0.2 1% 27% -0.4 -6% -29% -0.8 30% -27% 0.0 -3% -2% 0.1 16% 0%
37 Houston Ln Sth 0.0 -23% -3% 0.0 21% -3% 0.0 -11% 22% 0.0 5% -24% 0.0 16% -6% 0.0 0% 0% 0.0 0% 0%
26 Houston Rd Sth 0.0 -26% NA 0.0 24% NA 0.0 -24% NA 0.0 21% NA 0.0 27% NA 0.0 -1% NA 0.0 -19% NA
16 Cottenham Kens Pk 0.0 NA -1% 0.0 NA -1% 0.2 NA 25% -0.1 NA -26% 0.0 NA -18% 0.0 NA 0% 0.0 NA 0%
17 Eastern Av Sth 0.0 0% -6% 0.0 0% -6% 0.0 2% 22% 0.0 -5% -28% 0.0 -2% -19% 0.0 0% 0% 0.0 0% 0%
19 Cottenham Sth -0.1 -12% 29% 0.0 13% 29% 1.2 21% 581% -1.5 -18% -38% -1.5 -17% -25% -0.5 -16% 24% 1.6 31% 192%
NA: Not applicable
OC: Open Channel
TLP: Trapped Low Point
US: Upstream
--- 2D flow path not well defined (unable to be recorded) and hence not reported
Kensington – Centennial Park Flood Study
WMAwater 111011:CentennialPk_WestKensingtonFS.docx:10 April 2013
46
9.2. Climate Change
In accordance with the DECC Guideline October 2007 (Reference 17) and the DECCW
Guideline August 2010 (Reference 18), the possible effects of climate change on flooding have
been investigated. The possible effects relevant to this study are an increase in sea level and
an increase in the design rainfall intensity. The guidelines suggests the following scenarios be
examined:
ocean level rise:
2050 mean sea level rise = 0.4 m,
2100 mean sea level rise = 0.9 m,
increase in peak rainfall and storm volume:
low level rainfall increase = 10%,
medium level rainfall increase = 20%,
high level rainfall increase = 30%.
An increase in ocean level of 0.9m will have no measurable impact on design flood levels within
the study area due to its altitude above sea level. For this reason the effects of sea level rise
have not been considered further in this study.
A high level rainfall increase of up to 30% is recommended for consideration due to the
uncertainties associated with this aspect of climate change. It is generally acknowledged that a
30% rainfall increase is probably overly conservative and that a timeframe for the provision of
definitive predictions of the actual increase is unknown.
Table 16 provides an assessment of the potential increase in design rainfalls of 10%, 20% and
30% for the 1% AEP event. Figure 30 shows the change in flood extent for the three rainfall
climate change scenarios modelled.
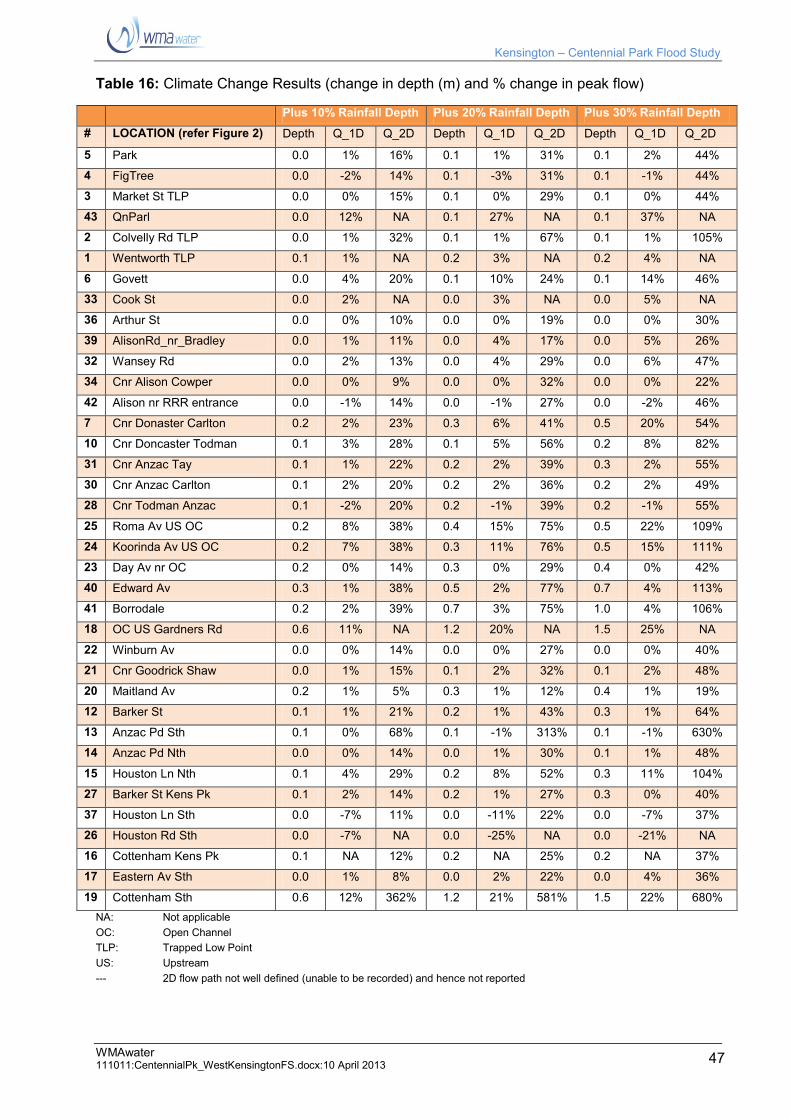
Kensington – Centennial Park Flood Study
WMAwater 111011:CentennialPk_WestKensingtonFS.docx:10 April 2013
47
Table 16: Climate Change Results (change in depth (m) and % change in peak flow)
Plus 10% Rainfall Depth Plus 20% Rainfall Depth Plus 30% Rainfall Depth
# LOCATION (refer Figure 2) Depth Q_1D Q_2D Depth Q_1D Q_2D Depth Q_1D Q_2D
5 Park 0.0 1% 16% 0.1 1% 31% 0.1 2% 44%
4 FigTree 0.0 -2% 14% 0.1 -3% 31% 0.1 -1% 44%
3 Market St TLP 0.0 0% 15% 0.1 0% 29% 0.1 0% 44%
43 QnParl 0.0 12% NA 0.1 27% NA 0.1 37% NA
2 Colvelly Rd TLP 0.0 1% 32% 0.1 1% 67% 0.1 1% 105%
1 Wentworth TLP 0.1 1% NA 0.2 3% NA 0.2 4% NA
6 Govett 0.0 4% 20% 0.1 10% 24% 0.1 14% 46%
33 Cook St 0.0 2% NA 0.0 3% NA 0.0 5% NA
36 Arthur St 0.0 0% 10% 0.0 0% 19% 0.0 0% 30%
39 AlisonRd_nr_Bradley 0.0 1% 11% 0.0 4% 17% 0.0 5% 26%
32 Wansey Rd 0.0 2% 13% 0.0 4% 29% 0.0 6% 47%
34 Cnr Alison Cowper 0.0 0% 9% 0.0 0% 32% 0.0 0% 22%
42 Alison nr RRR entrance 0.0 -1% 14% 0.0 -1% 27% 0.0 -2% 46%
7 Cnr Donaster Carlton 0.2 2% 23% 0.3 6% 41% 0.5 20% 54%
10 Cnr Doncaster Todman 0.1 3% 28% 0.1 5% 56% 0.2 8% 82%
31 Cnr Anzac Tay 0.1 1% 22% 0.2 2% 39% 0.3 2% 55%
30 Cnr Anzac Carlton 0.1 2% 20% 0.2 2% 36% 0.2 2% 49%
28 Cnr Todman Anzac 0.1 -2% 20% 0.2 -1% 39% 0.2 -1% 55%
25 Roma Av US OC 0.2 8% 38% 0.4 15% 75% 0.5 22% 109%
24 Koorinda Av US OC 0.2 7% 38% 0.3 11% 76% 0.5 15% 111%
23 Day Av nr OC 0.2 0% 14% 0.3 0% 29% 0.4 0% 42%
40 Edward Av 0.3 1% 38% 0.5 2% 77% 0.7 4% 113%
41 Borrodale 0.2 2% 39% 0.7 3% 75% 1.0 4% 106%
18 OC US Gardners Rd 0.6 11% NA 1.2 20% NA 1.5 25% NA
22 Winburn Av 0.0 0% 14% 0.0 0% 27% 0.0 0% 40%
21 Cnr Goodrick Shaw 0.0 1% 15% 0.1 2% 32% 0.1 2% 48%
20 Maitland Av 0.2 1% 5% 0.3 1% 12% 0.4 1% 19%
12 Barker St 0.1 1% 21% 0.2 1% 43% 0.3 1% 64%
13 Anzac Pd Sth 0.1 0% 68% 0.1 -1% 313% 0.1 -1% 630%
14 Anzac Pd Nth 0.0 0% 14% 0.0 1% 30% 0.1 1% 48%
15 Houston Ln Nth 0.1 4% 29% 0.2 8% 52% 0.3 11% 104%
27 Barker St Kens Pk 0.1 2% 14% 0.2 1% 27% 0.3 0% 40%
37 Houston Ln Sth 0.0 -7% 11% 0.0 -11% 22% 0.0 -7% 37%
26 Houston Rd Sth 0.0 -7% NA 0.0 -25% NA 0.0 -21% NA
16 Cottenham Kens Pk 0.1 NA 12% 0.2 NA 25% 0.2 NA 37%
17 Eastern Av Sth 0.0 1% 8% 0.0 2% 22% 0.0 4% 36%
19 Cottenham Sth 0.6 12% 362% 1.2 21% 581% 1.5 22% 680%
NA: Not applicable
OC: Open Channel
TLP: Trapped Low Point
US: Upstream
--- 2D flow path not well defined (unable to be recorded) and hence not reported
Kensington – Centennial Park Flood Study
WMAwater 111011:CentennialPk_WestKensingtonFS.docx:10 April 2013
48
10. ACKNOWLEDGEMENTS
This study was undertaken by WMAwater and was jointly funded by the NSW State Government
and Randwick City Council. The assistance of the following in providing data and input during
the course of the study is gratefully acknowledged:
Members of the Kensington - Centennial Park Floodplain Risk Management Committee,
Local residents and members of the general public, many of who contributed information
to this Study,
Randwick City Council,
City of Sydney,
NSW Office of Environment and Heritage (formerly the NSW Department of
Environment, Climate Change and Water),
Sydney Water.
Kensington – Centennial Park Flood Study
WMAwater 111011:CentennialPk_WestKensingtonFS.docx:10 April 2013
49
11. REFERENCES
1. NSW State Government
Floodplain Development Manual
April 2005
2. Public Works Department NSW Civil Engineering Division
Kensington Flooding Drainage Works Investigation
PWD Report No. 84030 January 1985
3. NSW Department of Public Works and Services
Centennial Park – Kensington Pond Stormwater Flow Control Structure
Restoration Works Flood Study (Summary of RAFTS Modelling)
Technical Report No. DC002245 prepared for Centennial Park and Moore Park Trust
and Randwick City Council, November 2002
4. NSW Department of Public Works Civil Engineering Division
Sydney Storms November 1984 – Hydrological Aspects
PWD Report No. 85014, October 1985
5. Snowy Mountains Engineering Corporation Limited
Hydrologic and Hydraulic Study – Botany Wetland – Volumes 1 and 2
Technical Report prepared for Sydney Water Board, June 1992
6. WP Brown & Partners Pty Ltd
Assessment of Hydrological and Hydraulic Modelling of Centennial Park and
Kensington Catchments
May 2003
7. Institution of Engineers, Australia
Australian Rainfall and Runoff – Third Edition
1987
8. DHI Water and Environment
MIKE-Storm User Guide
2004
9. G. G. O’Loughlin
The ILSAX program for urban drainage design and analysis
School of Civil Engineering, NSW Institute of Technology 1986
10. Watercom Pty. Ltd. and Dr G. G. O’Loughlin
DRAINS Software Manual v2006.02
2006
Kensington – Centennial Park Flood Study
WMAwater 111011:CentennialPk_WestKensingtonFS.docx:10 April 2013
50
11. Webb McKeown and Associates Pty. Ltd.
Sheas Creek Flood Study
Technical Report prepared for the Water Board and the City of South Sydney, August
1991
12. BMT WBM
TUFLOW User Manual
2008
13. Rigby, E., Boyd, M., Roso, S. and VanDrie, S.
Storms, Storm Bursts and Flood Estimation - A Need for Review of the AR&R
Procedures
Proc. 28th Hydrology and Water Resources Symposium (IEAust), Wollongong, 2003
14. Rigby, E. and Bannigan, D.
The Embedded Design Storm Concept - A Critical Review
Proc. 23rd Hydrology and Water Resources Symposium (IEAust), Hobart, 1996
15. Phillips, B., Lees, S., Lynch, S.
Embedded Design Storms - An Improved Procedure For Design Flood Level
Estimation
Proc. Water Down Under (IEAust.), Adelaide, 1994
16. Bureau of Meteorology
The Estimation of Probable Maximum Precipitation in Australia: Generalised
Short-Duration Method
Melbourne, Australia, June 2003 (39pp)
17. NSW Department of Environment and Climate Change (DECC) Floodplain Risk Management Guidelines – Practical Consideration of Climate
Change
October 2007
18. NSW Department of Environment, Climate Change and Water (DECCW) Floodplain Risk Management Guideline – Incorporating sea level rise
benchmarks in flood risk assessments
August 2010


Kensington – Centennial Park Flood Study
WMAwater
111011 :CentennialPk_WestKensingtonFS.docx10 April 2013 A1
APPENDIX A: GLOSSARY
Taken from the Floodplain Development Manual (April 2005 edition)
acid sulfate soils Are sediments which contain sulfidic mineral pyrite which may become extremely
acid following disturbance or drainage as sulfur compounds react when exposed
to oxygen to form sulfuric acid. More detailed explanation and definition can be
found in the NSW Government Acid Sulfate Soil Manual published by Acid Sulfate
Soil Management Advisory Committee.
Annual Exceedance
Probability (AEP)
The chance of a flood of a given or larger size occurring in any one year, usually
expressed as a percentage. For example, if a peak flood discharge of 500 m3/s
has an AEP of 5%, it means that there is a 5% chance (that is one-in-20 chance)
of a 500 m3/s or larger event occurring in any one year (see ARI).
Australian Height Datum
(AHD)
A common national surface level datum approximately corresponding to mean sea
level.
Average Annual Damage
(AAD)
Depending on its size (or severity), each flood will cause a different amount of
flood damage to a flood prone area. AAD is the average damage per year that
would occur in a nominated development situation from flooding over a very long
period of time.
Average Recurrence
Interval (ARI)
The long term average number of years between the occurrence of a flood as big
as, or larger than, the selected event. For example, floods with a discharge as
great as, or greater than, the 20 year ARI flood event will occur on average once
every 20 years. ARI is another way of expressing the likelihood of occurrence of a
flood event.
caravan and moveable
home parks
Caravans and moveable dwellings are being increasingly used for long-term and
permanent accommodation purposes. Standards relating to their siting, design,
construction and management can be found in the Regulations under the LG Act.
catchment The land area draining through the main stream, as well as tributary streams, to a
particular site. It always relates to an area above a specific location.
consent authority The Council, Government agency or person having the function to determine a
development application for land use under the EP&A Act. The consent authority
is most often the Council, however legislation or an EPI may specify a Minister or
public authority (other than a Council), or the Director General of DIPNR, as
having the function to determine an application.
development Is defined in Part 4 of the Environmental Planning and Assessment Act (EP&A
Act).
infill development: refers to the development of vacant blocks of land that are
generally surrounded by developed properties and is permissible under the
current zoning of the land. Conditions such as minimum floor levels may be
imposed on infill development.
new development: refers to development of a completely different nature to that
associated with the former land use. For example, the urban subdivision of an
area previously used for rural purposes. New developments involve rezoning and
typically require major extensions of existing urban services, such as roads, water
supply, sewerage and electric power.
redevelopment: refers to rebuilding in an area. For example, as urban areas
age, it may become necessary to demolish and reconstruct buildings on a
relatively large scale. Redevelopment generally does not require either rezoning
or major extensions to urban services.
disaster plan (DISPLAN) A step by step sequence of previously agreed roles, responsibilities, functions,
actions and management arrangements for the conduct of a single or series of
Kensington – Centennial Park Flood Study
WMAwater
111011 :CentennialPk_WestKensingtonFS.docx10 April 2013 A2
connected emergency operations, with the object of ensuring the coordinated
response by all agencies having responsibilities and functions in emergencies.
discharge The rate of flow of water measured in terms of volume per unit time, for example,
cubic metres per second (m3/s). Discharge is different from the speed or velocity
of flow, which is a measure of how fast the water is moving for example, metres
per second (m/s).
ecologically sustainable
development (ESD)
Using, conserving and enhancing natural resources so that ecological processes,
on which life depends, are maintained, and the total quality of life, now and in the
future, can be maintained or increased. A more detailed definition is included in
the Local Government Act 1993. The use of sustainability and sustainable in this
manual relate to ESD.
effective warning time The time available after receiving advice of an impending flood and before the
floodwaters prevent appropriate flood response actions being undertaken. The
effective warning time is typically used to move farm equipment, move stock, raise
furniture, evacuate people and transport their possessions.
emergency management A range of measures to manage risks to communities and the environment. In the
flood context it may include measures to prevent, prepare for, respond to and
recover from flooding.
flash flooding Flooding which is sudden and unexpected. It is often caused by sudden local or
nearby heavy rainfall. Often defined as flooding which peaks within six hours of
the causative rain.
flood Relatively high stream flow which overtops the natural or artificial banks in any
part of a stream, river, estuary, lake or dam, and/or local overland flooding
associated with major drainage before entering a watercourse, and/or coastal
inundation resulting from super-elevated sea levels and/or waves overtopping
coastline defences excluding tsunami.
flood awareness Flood awareness is an appreciation of the likely effects of flooding and a
knowledge of the relevant flood warning, response and evacuation procedures.
flood education Flood education seeks to provide information to raise awareness of the flood
problem so as to enable individuals to understand how to manage themselves an
their property in response to flood warnings and in a flood event. It invokes a
state of flood readiness.
flood fringe areas The remaining area of flood prone land after floodway and flood storage areas
have been defined.
flood liable land Is synonymous with flood prone land (i.e. land susceptible to flooding by the PMF
event). Note that the term flood liable land covers the whole of the floodplain, not
just that part below the flood planning level (see flood planning area).
flood mitigation standard The average recurrence interval of the flood, selected as part of the floodplain risk
management process that forms the basis for physical works to modify the
impacts of flooding.
floodplain Area of land which is subject to inundation by floods up to and including the PMF
event, that is, flood prone land.
floodplain risk management
options
The measures that might be feasible for the management of a particular area of
the floodplain. Preparation of a floodplain risk management plan requires a
detailed evaluation of floodplain risk management options.
floodplain risk management
plan
A management plan developed in accordance with the principles and guidelines in
this manual. Usually includes both written and diagrammatic information
describing how particular areas of flood prone land are to be used and managed
to achieve defined objectives.
flood plan (local) A sub-plan of a disaster plan that deals specifically with flooding. They can exist
at State, Division and local levels. Local flood plans are prepared under the
Kensington – Centennial Park Flood Study
WMAwater
111011 :CentennialPk_WestKensingtonFS.docx10 April 2013 A3
leadership of the State Emergency Service.
flood planning area The area of land below the flood planning level and thus subject to flood related
development controls. The concept of flood planning area generally supersedes
the Aflood liable land@ concept in the 1986 Manual.
Flood Planning Levels
(FPLs)
FPLs are the combinations of flood levels (derived from significant historical flood
events or floods of specific AEPs) and freeboards selected for floodplain risk
management purposes, as determined in management studies and incorporated
in management plans. FPLs supersede the Astandard flood event@ in the 1986
manual.
flood proofing A combination of measures incorporated in the design, construction and alteration
of individual buildings or structures subject to flooding, to reduce or eliminate flood
damages.
flood prone land Island susceptible to flooding by the PMF event. Flood prone land is synonymous
with flood liable land.
flood readiness Flood readiness is an ability to react within the effective warning time.
flood risk Potential danger to personal safety and potential damage to property resulting
from flooding. The degree of risk varies with circumstances across the full range
of floods. Flood risk in this manual is divided into 3 types, existing, future and
continuing risks. They are described below.
existing flood risk: the risk a community is exposed to as a result of its location
on the floodplain.
future flood risk: the risk a community may be exposed to as a result of new
development on the floodplain.
continuing flood risk: the risk a community is exposed to after floodplain risk
management measures have been implemented. For a town protected by levees,
the continuing flood risk is the consequences of the levees being overtopped. For
an area without any floodplain risk management measures, the continuing flood
risk is simply the existence of its flood exposure.
flood storage areas Those parts of the floodplain that are important for the temporary storage of
floodwaters during the passage of a flood. The extent and behaviour of flood
storage areas may change with flood severity, and loss of flood storage can
increase the severity of flood impacts by reducing natural flood attenuation.
Hence, it is necessary to investigate a range of flood sizes before defining flood
storage areas.
floodway areas Those areas of the floodplain where a significant discharge of water occurs during
floods. They are often aligned with naturally defined channels. Floodways are
areas that, even if only partially blocked, would cause a significant redistribution of
flood flows, or a significant increase in flood levels.
freeboard Freeboard provides reasonable certainty that the risk exposure selected in
deciding on a particular flood chosen as the basis for the FPL is actually provided.
It is a factor of safety typically used in relation to the setting of floor levels, levee
crest levels, etc. Freeboard is included in the flood planning level.
habitable room in a residential situation: a living or working area, such as a lounge room, dining
room, rumpus room, kitchen, bedroom or workroom.
in an industrial or commercial situation: an area used for offices or to store
valuable possessions susceptible to flood damage in the event of a flood.
hazard A source of potential harm or a situation with a potential to cause loss. In relation
to this manual the hazard is flooding which has the potential to cause damage to
the community. Definitions of high and low hazard categories are provided in the
Manual.
Kensington – Centennial Park Flood Study
WMAwater
111011 :CentennialPk_WestKensingtonFS.docx10 April 2013 A4
hydraulics Term given to the study of water flow in waterways; in particular, the evaluation of
flow parameters such as water level and velocity.
hydrograph A graph which shows how the discharge or stage/flood level at any particular
location varies with time during a flood.
hydrology Term given to the study of the rainfall and runoff process; in particular, the
evaluation of peak flows, flow volumes and the derivation of hydrographs for a
range of floods.
local overland flooding Inundation by local runoff rather than overbank discharge from a stream, river,
estuary, lake or dam.
local drainage Are smaller scale problems in urban areas. They are outside the definition of
major drainage in this glossary.
mainstream flooding Inundation of normally dry land occurring when water overflows the natural or
artificial banks of a stream, river, estuary, lake or dam.
major drainage Councils have discretion in determining whether urban drainage problems are
associated with major or local drainage. For the purpose of this manual major
drainage involves:
$ the floodplains of original watercourses (which may now be piped, channelised
or diverted), or sloping areas where overland flows develop along alternative
paths once system capacity is exceeded; and/or
$ water depths generally in excess of 0.3 m (in the major system design storm
as defined in the current version of Australian Rainfall and Runoff). These
conditions may result in danger to personal safety and property damage to
both premises and vehicles; and/or
$ major overland flow paths through developed areas outside of defined
drainage reserves; and/or
$ the potential to affect a number of buildings along the major flow path.
mathematical/computer
models
The mathematical representation of the physical processes involved in runoff
generation and stream flow. These models are often run on computers due to the
complexity of the mathematical relationships between runoff, stream flow and the
distribution of flows across the floodplain.
merit approach The merit approach weighs social, economic, ecological and cultural impacts of
land use options for different flood prone areas together with flood damage,
hazard and behaviour implications, and environmental protection and well being of
the State=s rivers and floodplains.
The merit approach operates at two levels. At the strategic level it allows for the
consideration of social, economic, ecological, cultural and flooding issues to
determine strategies for the management of future flood risk which are formulated
into Council plans, policy and EPIs. At a site specific level, it involves
consideration of the best way of conditioning development allowable under the
floodplain risk management plan, local floodplain risk management policy and
EPIs.
minor, moderate and major
flooding
Both the State Emergency Service and the Bureau of Meteorology use the
following definitions in flood warnings to give a general indication of the types of
problems expected with a flood:
minor flooding: causes inconvenience such as closing of minor roads and the
submergence of low level bridges. The lower limit of this class of flooding on the
reference gauge is the initial flood level at which landholders and townspeople
begin to be flooded.
moderate flooding: low-lying areas are inundated requiring removal of stock
and/or evacuation of some houses. Main traffic routes may be covered.
major flooding: appreciable urban areas are flooded and/or extensive rural areas
Kensington – Centennial Park Flood Study
WMAwater
111011 :CentennialPk_WestKensingtonFS.docx10 April 2013 A5
are flooded. Properties, villages and towns can be isolated.
modification measures Measures that modify either the flood, the property or the response to flooding.
Examples are indicated in Table 2.1 with further discussion in the Manual.
peak discharge The maximum discharge occurring during a flood event.
Probable Maximum Flood
(PMF)
The PMF is the largest flood that could conceivably occur at a particular location,
usually estimated from probable maximum precipitation, and where applicable,
snow melt, coupled with the worst flood producing catchment conditions.
Generally, it is not physically or economically possible to provide complete
protection against this event. The PMF defines the extent of flood prone land, that
is, the floodplain. The extent, nature and potential consequences of flooding
associated with a range of events rarer than the flood used for designing
mitigation works and controlling development, up to and including the PMF event
should be addressed in a floodplain risk management study.
Probable Maximum
Precipitation (PMP)
The PMP is the greatest depth of precipitation for a given duration
meteorologically possible over a given size storm area at a particular location at a
particular time of the year, with no allowance made for long-term climatic trends
(World Meteorological Organisation, 1986). It is the primary input to PMF
estimation.
probability A statistical measure of the expected chance of flooding (see AEP).
risk Chance of something happening that will have an impact. It is measured in terms
of consequences and likelihood. In the context of the manual it is the likelihood of
consequences arising from the interaction of floods, communities and the
environment.
runoff The amount of rainfall which actually ends up as streamflow, also known as
rainfall excess.
stage Equivalent to Awater level@. Both are measured with reference to a specified
datum.
stage hydrograph A graph that shows how the water level at a particular location changes with time
during a flood. It must be referenced to a particular datum.
survey plan A plan prepared by a registered surveyor.
water surface profile A graph showing the flood stage at any given location along a watercourse at a
particular time.
wind fetch The horizontal distance in the direction of wind over which wind waves are
generated.

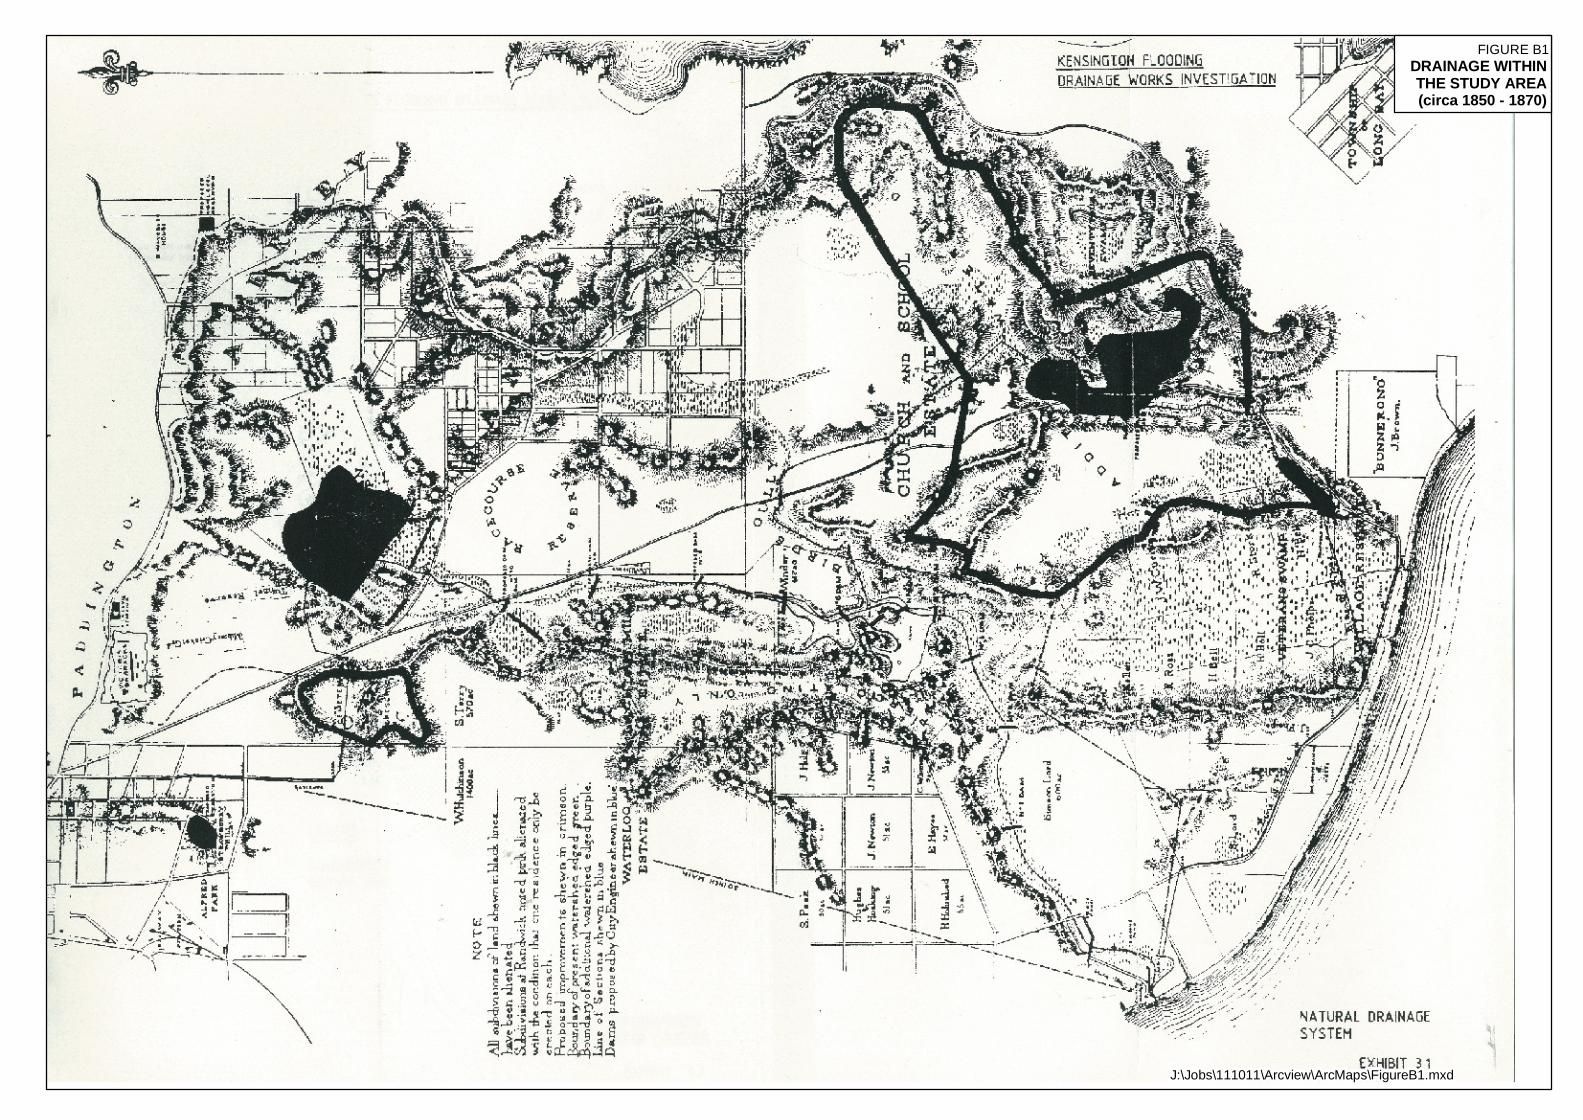
FIGURE B1DRAINAGE WITHINTHE STUDY AREA(circa 1850 - 1870)
J:\Jobs\111011\Arcview\ArcMaps\FigureB1.mxd

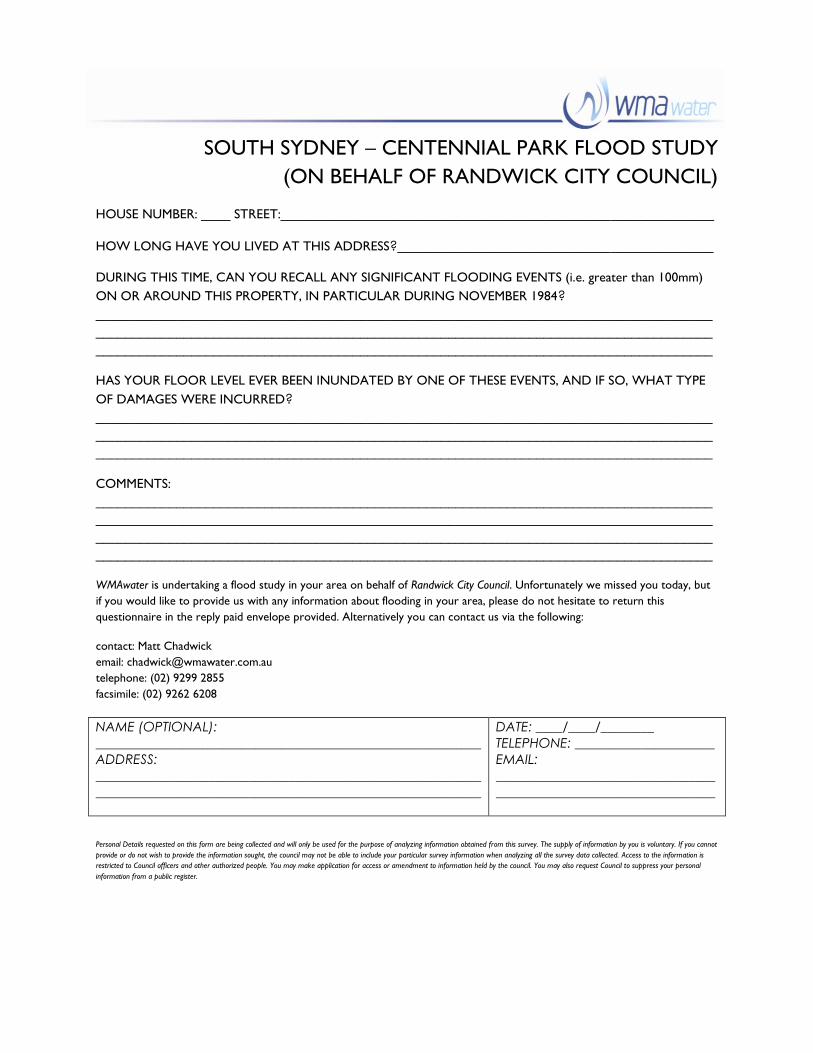
SOUTH SYDNEY – CENTENNIAL PARK FLOOD STUDY
(ON BEHALF OF RANDWICK CITY COUNCIL)
HOUSE NUMBER: ____ STREET:___________________________________________________________
HOW LONG HAVE YOU LIVED AT THIS ADDRESS?___________________________________________
DURING THIS TIME, CAN YOU RECALL ANY SIGNIFICANT FLOODING EVENTS (i.e. greater than 100mm)
ON OR AROUND THIS PROPERTY, IN PARTICULAR DURING NOVEMBER 1984?
____________________________________________________________________________________
____________________________________________________________________________________
____________________________________________________________________________________
HAS YOUR FLOOR LEVEL EVER BEEN INUNDATED BY ONE OF THESE EVENTS, AND IF SO, WHAT TYPE
OF DAMAGES WERE INCURRED?
____________________________________________________________________________________
____________________________________________________________________________________
____________________________________________________________________________________
COMMENTS:
____________________________________________________________________________________
____________________________________________________________________________________
____________________________________________________________________________________
____________________________________________________________________________________
WMAwater is undertaking a flood study in your area on behalf of Randwick City Council. Unfortunately we missed you today, but
if you would like to provide us with any information about flooding in your area, please do not hesitate to return this
questionnaire in the reply paid envelope provided. Alternatively you can contact us via the following:
contact: Matt Chadwick
email: [email protected]
telephone: (02) 9299 2855
facsimile: (02) 9262 6208
NAME (OPTIONAL):
__________________________________________________________
ADDRESS:
__________________________________________________________
__________________________________________________________
DATE: ____/____/________
TELEPHONE: _____________________
EMAIL:
_________________________________
_________________________________
Personal Details requested on this form are being collected and will only be used for the purpose of analyzing information obtained from this survey. The supply of information by you is voluntary. If you cannot
provide or do not wish to provide the information sought, the council may not be able to include your particular survey information when analyzing all the survey data collected. Access to the information is
restricted to Council officers and other authorized people. You may make application for access or amendment to information held by the council. You may also request Council to suppress your personal
information from a public register.

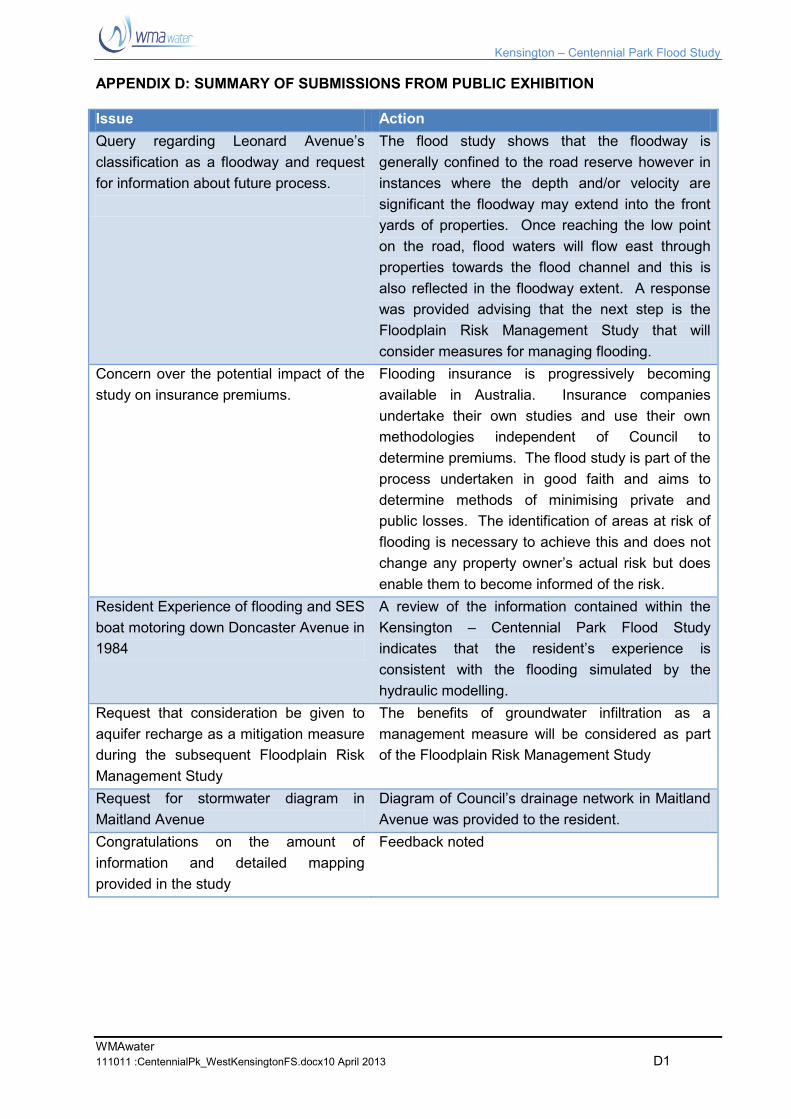
Kensington – Centennial Park Flood Study
WMAwater
111011 :CentennialPk_WestKensingtonFS.docx10 April 2013 D1
APPENDIX D: SUMMARY OF SUBMISSIONS FROM PUBLIC EXHIBITION
Issue Action
Query regarding Leonard Avenue’s
classification as a floodway and request
for information about future process.
The flood study shows that the floodway is
generally confined to the road reserve however in
instances where the depth and/or velocity are
significant the floodway may extend into the front
yards of properties. Once reaching the low point
on the road, flood waters will flow east through
properties towards the flood channel and this is
also reflected in the floodway extent. A response
was provided advising that the next step is the
Floodplain Risk Management Study that will
consider measures for managing flooding.
Concern over the potential impact of the
study on insurance premiums.
Flooding insurance is progressively becoming
available in Australia. Insurance companies
undertake their own studies and use their own
methodologies independent of Council to
determine premiums. The flood study is part of the
process undertaken in good faith and aims to
determine methods of minimising private and
public losses. The identification of areas at risk of
flooding is necessary to achieve this and does not
change any property owner’s actual risk but does
enable them to become informed of the risk.
Resident Experience of flooding and SES
boat motoring down Doncaster Avenue in
1984
A review of the information contained within the
Kensington – Centennial Park Flood Study
indicates that the resident’s experience is
consistent with the flooding simulated by the
hydraulic modelling.
Request that consideration be given to
aquifer recharge as a mitigation measure
during the subsequent Floodplain Risk
Management Study
The benefits of groundwater infiltration as a
management measure will be considered as part
of the Floodplain Risk Management Study
Request for stormwater diagram in
Maitland Avenue
Diagram of Council’s drainage network in Maitland
Avenue was provided to the resident.
Congratulations on the amount of
information and detailed mapping
provided in the study
Feedback noted