YE 1314 GPFS - randwick.nsw.gov.au · Financial Statements 2014 Randwick City Council. Statement of...
114
2013-14 FINANCIAL REPORTS
Transcript of YE 1314 GPFS - randwick.nsw.gov.au · Financial Statements 2014 Randwick City Council. Statement of...
2013-14
FINANCIAL REPORTS


Financial Statements 2014
Randwick City Council
General Purpose Financial Statements for the financial year ended 30 June 2014
Contents
2. Statement by Councillors & Management
3. Primary Financial Statements:
- Income Statement- Statement of Comprehensive Income- Statement of Financial Position- Statement of Changes in Equity- Statement of Cash Flows
4. Notes to the Financial Statements
5. Independent Auditor's Reports:
- On the Financial Statements (Sect 417 [2]) - On the Conduct of the Audit (Sect 417 [3])
Overview
(i) These financial statements are General Purpose Financial Statements and cover the consolidated operationsfor Randwick City Council.
(ii) Randwick City Council is a body politic of NSW, Australia - being constituted as a Local Government areaby proclamation and is duly empowered by the Local Government Act (LGA) 1993 of NSW.
Council's Statutory Charter is detailed in Paragraph 8 of the LGA and includes giving Council;
the ability to provide goods, services & facilities, and to carry out activities appropriate to the current & futureneeds of the local community and of the wider public,
the responsibility for administering regulatory requirements under the LGA and
a role in the management, improvement and development of the resources in the area.
A description of the nature of Council's operations and its principal activities are provided in Note 2(b).
(iii) All figures presented in these financial statements are presented in Australian Currency.
(iv) These financial statements were authorised for issue by the Council on 15 August 2014.Council has the power to amend and reissue these financial statements.
i
i
i
7
8
77
Page
3
56
4
2
page 1

Financial Statements 2014
Randwick City Council
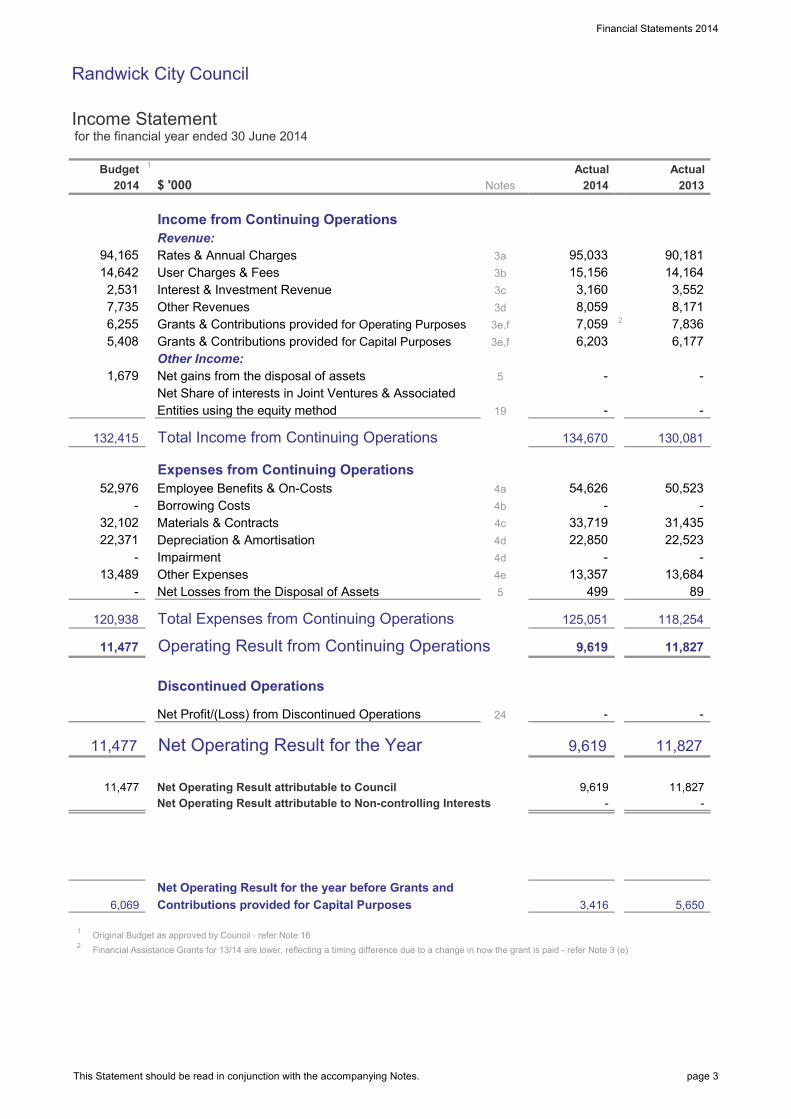
Income Statement for the financial year ended 30 June 2014
$ '000
Income from Continuing OperationsRevenue:Rates & Annual ChargesUser Charges & FeesInterest & Investment RevenueOther RevenuesGrants & Contributions provided for Operating Purposes 2
Grants & Contributions provided for Capital PurposesOther Income:Net gains from the disposal of assetsNet Share of interests in Joint Ventures & AssociatedEntities using the equity method
Total Income from Continuing Operations
Expenses from Continuing OperationsEmployee Benefits & On-CostsBorrowing CostsMaterials & ContractsDepreciation & AmortisationImpairmentOther ExpensesNet Losses from the Disposal of Assets
Total Expenses from Continuing Operations
Operating Result from Continuing Operations
Discontinued Operations
Net Profit/(Loss) from Discontinued Operations
Net Operating Result for the Year
Net Operating Result attributable to CouncilNet Operating Result attributable to Non-controlling Interests
Net Operating Result for the year before Grants andContributions provided for Capital Purposes
Original Budget as approved by Council - refer Note 16Financial Assistance Grants for 13/14 are lower, reflecting a timing difference due to a change in how the grant is paid - refer Note 3 (e)2
19
4a
4d
89
130,081
50,523
-
- 31,435 22,523
11,827
-
4e499
Budget 1
-
-
4c
3e,f
13,684
11,827
11,827
13,357
4d
5
4b
24
5
14,164 3,552 8,171 7,836
3,160 8,059
54,626
-
134,670
7,059 6,177
-
2014
2,531
5,408
14,642
7,735 6,255
3b
Notes
3a
3d3c
3e,f
1,679
1
11,477
6,069
11,477
- 32,102
94,165
120,938
11,477
-
132,415
52,976
22,371 -
13,489
-
125,051
9,619
9,619
-
9,619
118,254
Actual 2013
5,650
-
90,181
22,850 -
33,719
Actual 2014
-
6,203
95,033 15,156
3,416
This Statement should be read in conjunction with the accompanying Notes. page 3
Financial Statements 2014
Randwick City Council
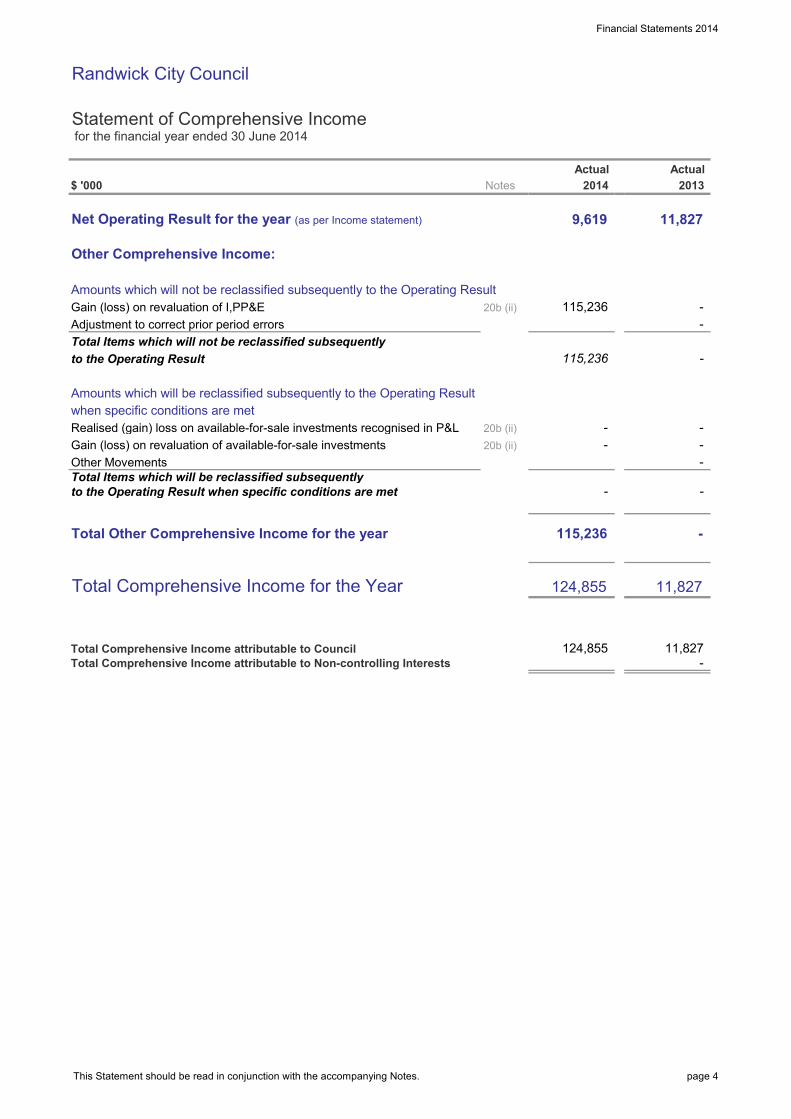
Statement of Comprehensive Income for the financial year ended 30 June 2014
$ '000
Net Operating Result for the year (as per Income statement)
Other Comprehensive Income:
Amounts which will not be reclassified subsequently to the Operating Result Gain (loss) on revaluation of I,PP&EAdjustment to correct prior period errorsTotal Items which will not be reclassified subsequentlyto the Operating Result
Amounts which will be reclassified subsequently to the Operating Resultwhen specific conditions are metRealised (gain) loss on available-for-sale investments recognised in P&LGain (loss) on revaluation of available-for-sale investmentsOther MovementsTotal Items which will be reclassified subsequentlyto the Operating Result when specific conditions are met
Total Other Comprehensive Income for the year
Total Comprehensive Income for the Year
Total Comprehensive Income attributable to CouncilTotal Comprehensive Income attributable to Non-controlling Interests
-
20b (ii)20b (ii)
Notes
20b (ii)
-
2014
-
115,236
9,619
124,855
-
115,236
124,855
-
Actual
-
-
2013
-
11,827
- -
115,236 -
-
11,827
11,827
Actual
This Statement should be read in conjunction with the accompanying Notes. page 4

Financial Statements 2014
Randwick City Council
Statement of Financial Position as at 30 June 2014
$ '000
ASSETSCurrent AssetsCash & Cash EquivalentsInvestmentsReceivablesInventoriesOtherNon-current assets classified as "held for sale"Total Current Assets
Non-Current AssetsInvestmentsReceivablesInventoriesInfrastructure, Property, Plant & EquipmentInvestments accounted for using the equity methodInvestment PropertyIntangible AssetsOtherTotal Non-Current Assets
TOTAL ASSETS
LIABILITIESCurrent LiabilitiesPayablesBorrowingsProvisionsTotal Current Liabilities
Non-Current LiabilitiesPayablesBorrowingsProvisionsTotal Non-Current Liabilities
TOTAL LIABILITIES
Net Assets
EQUITYRetained EarningsRevaluation ReservesCouncil Equity InterestNon-controlling Interests
Total Equity
6b
8
7
Notes
1,428,735 -
7
8
1,458,947
14,481
6b
8
10
65,283
2014
1,393,664
10
10
20
10
20
-
1,428,735
1,303,880
753,093
-
1,428,735
51,938
17,487
-
452
30,212
Actual
7
14199
53,784
29,743
260
762,712
469 465
31,187
30,722
209
1,303,880
550,787
-
81,283,129
7
1,335,067
15,871
260
- 14,851 15,262
26,700 18,000
5,939
25
10
1,303,880
666,023
10
384 -
573 568
1,265,139
-
-
-
- -
- 205
2013Actual
22
6a 4,090
- -
1,393,205
897
496
-
-
6,286
This Statement should be read in conjunction with the accompanying Notes. page 5

Financial Statements 2014
Randwick City Council
Statement of Changes in Equity for the financial year ended 30 June 2014
$ '000
Opening Balance (as per Last Year's Audited Accounts)
a. Correction of Prior Period Errorsb. Changes in Accounting Policies (prior year effects)
Revised Opening Balance (as at 1/7/13)
c. Net Operating Result for the Year
d. Other Comprehensive Income - Revaluations : IPP&E Asset Revaluation Rsve - Revaluations: Other Reserves - Transfers to Income Statement - Impairment (loss) reversal relating to I,PP&EOther Comprehensive Income
Total Comprehensive Income (c&d)
e. Distributions to/(Contributions from) Non-controlling Interests
f. Transfers between Equity
Equity - Balance at end of the reporting period
$ '000
Opening Balance (as per Last Year's Audited Accounts)
a. Correction of Prior Period Errorsb. Changes in Accounting Policies (prior year effects)
Revised Opening Balance (as at 1/7/12)
c. Net Operating Result for the Year
d. Other Comprehensive Income - Revaluations : IPP&E Asset Revaluation Rsve - Revaluations: Other Reserves - Transfers to Income Statement - Impairment (loss) reversal relating to I,PP&EOther Comprehensive Income
Total Comprehensive Income (c&d)
e. Distributions to/(Contributions from) Non-controlling Interests
f. Transfers between Equity
Equity - Balance at end of the reporting period
Earnings
Non-
Notes
2014
20b (ii)
20b (ii)
- 20 (c)
753,093
9,619
753,093 - 20 (d)
-
9,619
20b (ii)
2013
- 11,827
741,266
- 550,787
550,787 -
20 (d) -
Earnings (Refer 20b)
-
-
- -
Interest
- - -
- -
-
-
-
-
-
- 11,827
20b (ii)
20b (ii)
20b (ii)
-
1,303,880
11,827
20b (ii)
550,787
Retained
20b (ii)
Notes
741,266
20 (c) -
-
762,712
-
753,093 550,787 -
- -
- - - -
-
1,303,880
(Refer 20b)
1,303,880
1,303,880 -
- -
124,855
-
-
- 115,236
-
-
115,236
- 550,787
115,236
- -
115,236
1,428,735
- -
-
Equity
-
1,292,053
-
-
1,292,053
1,292,053 -
-
-
-
-
-
-
-
115,236
-
-
115,236
1,303,880
115,236
9,619
1,303,880
Equity
-
Interest
1,428,735
-
Council controllingInterest
- - -
- -
-
-
- -
11,827 -
-
-
Interest
-
11,827
Non-
124,855
9,619
-
Retained Reserves Total
Total
666,023
-
Reserves Council controlling
-
-
11,827
1,292,053
-
-
This Statement should be read in conjunction with the accompanying Notes. page 6

Financial Statements 2014
Randwick City Council
Statement of Cash Flows for the financial year ended 30 June 2014
$ '000
Cash Flows from Operating ActivitiesReceipts:Rates & Annual ChargesUser Charges & FeesInvestment & Interest Revenue ReceivedGrants & ContributionsBonds, Deposits & Retention amounts receivedOtherPayments:Employee Benefits & On-CostsMaterials & ContractsBorrowing CostsBonds, Deposits & Retention amounts refundedOther
Net Cash provided (or used in) Operating Activities
Cash Flows from Investing ActivitiesReceipts:Sale of Investment SecuritiesSale of Infrastructure, Property, Plant & EquipmentPayments:Purchase of Investment SecuritiesPurchase of Infrastructure, Property, Plant & Equipment
Net Cash provided (or used in) Investing Activities
Cash Flows from Financing ActivitiesReceipts:Nil
Net Cash Flow provided (used in) Financing Activities
Net Increase/(Decrease) in Cash & Cash Equivalents
plus: Cash & Cash Equivalents - beginning of year
Cash & Cash Equivalents - end of the year
Additional Information:
plus: Investments on hand - end of year
Total Cash, Cash Equivalents & Investments
Please refer to Note 11 for information on the following:- Non Cash Financing & Investing Activities.- Financing Arrangements.- Net cash flow disclosures relating to any Discontinued Operations
- - - (37,282) (54,160)
(16,587)
11b
57,874
53,784
(54,781)
4,090
26,700
(22,610)
-
62,187
26,700
27,833
-
(1,133)
35,487
(81,689)
1,533 819
32,171 36,038
72,186 65,092
(28,487)
(37,171)
(52,976)
13,461
Budget
94,165
- 11,667
2014
14,642 2,531
(32,102)
7,735
-
-
32,173
(13,489)
11a53,924
107
-
53,817
(32,066)
11a
(33,745)
1,679
- (38,328) (83,078)
Actual
951 1,418
16,375
(19,492)
2,784 15,627 3,596
(50,263)
14,029
13,459
89,892
(33,896)
14,790
(517) (1,237)
Notes
95,261
20132014Actual
6b
This Statement should be read in conjunction with the accompanying Notes. page 7

Financial Statements 2014
Randwick City Council
Notes to the Financial Statements for the financial year ended 30 June 2014
Contents of the Notes accompanying the Financial Statements
Details
Summary of Significant Accounting PoliciesCouncil Functions / Activities - Financial InformationCouncil Functions / Activities - Component DescriptionsIncome from Continuing OperationsExpenses from Continuing OperationsGains or Losses from the Disposal of AssetsCash & Cash Equivalent AssetsInvestmentsRestricted Cash, Cash Equivalents & Investments - DetailsReceivablesInventories & Other AssetsInfrastructure, Property, Plant & EquipmentExternally Restricted Infrastructure, Property, Plant & EquipmentInfrastructure, Property, Plant & Equipment - Current Year ImpairmentsPayables, Borrowings & ProvisionsDescription of (and movements in) ProvisionsStatement of Cash Flows - Additional InformationCommitments for ExpenditureStatement of Performance Measures:13a (i) Local Government Industry Indicators (Consolidated)13a (ii) Local Government Industry Graphs (Consolidated)Investment PropertiesFinancial Risk ManagementMaterial Budget VariationsStatement of Developer ContributionsContingencies and Other Liabilities/Assets not recognisedControlled Entities, Associated Entities & Interests in Joint VenturesEquity - Retained Earnings and Revaluation Reserves
Financial Result & Financial Position by Fund"Held for Sale" Non Current Assets & Disposal GroupsEvents occurring after the Reporting DateDiscontinued OperationsIntangible AssetsReinstatement, Rehabilitation & Restoration LiabilitiesFair Value Measurement
Additional Council Disclosures
Council Information & Contact Details
27 68
50
66
52
61
56
66
58
65
64
76
6767
66
9252627
78
9(a)9(b)
28
33
37
47
59
49
52
Page
1
25
19
1516
20
21
49
48
43
44
18
1213
23
26
Note
22
14
10(a)10(b)
17
6(a)
4
6(c)
9(c)
11
24
41
36
3839
46
44
45
42
2(a)
32(b)
6(b)
5
page 8

Financial Statements 2014_
Randwick City Council Notes to the Financial Statements for the financial year ended 30 June 2014 Note 1. Summary of Significant Accounting Policies
page 9
The principal accounting policies adopted by Council in the preparation of these consolidated financial statements are set out below in order to assist in its general understanding. Under Australian Accounting Standards (AASBs), accounting policies are defined as those specific principles, bases, conventions, rules and practices applied by a reporting entity (in this case Council) in preparing and presenting its financial statements. (a) Basis of preparation (i) Background These financial statements are general purpose financial statements which have been prepared in accordance with; Australian Accounting Standards and Australian
Accounting Interpretations issued by the Australian Accounting Standards Board,
the Local Government Act (1993) & Regulation,
and the Local Government Code of Accounting
Practice and Financial Reporting. For the purpose of preparing these financial statements, Council has been deemed to be a not-for-profit entity. (ii) Compliance with International Financial Reporting Standards (IFRSs) Because AASBs are sector neutral, some standards either:
(a) have local Australian content and prescription that is specific to the Not-For-Profit sector (including Local Government) which are not in compliance with IFRS’s, or
(b) specifically exclude application by Not for Profit entities.
Accordingly in preparing these financial statements and accompanying notes, Council has been unable to comply fully with International Accounting Standards, but has complied fully with Australian Accounting Standards.
Under the Local Government Act (LGA), Regulations and Local Government Code of Accounting Practice & Financial Reporting, it should be noted that Councils in NSW only have a requirement to comply with AASBs. (iii) New and amended standards adopted by Council During the current year, the following relevant standards became mandatory for Council and have been adopted: AASB 13 Fair Value Measurement AASB 119 Employee Benefits AASB 13 Fair Value Measurement has not affected the assets or liabilities which are to be measured at fair value, however it provides detailed guidance on how to measure fair value in accordance with the accounting standards. It introduces the concept of highest and best use for non-financial assets and has caused the Council to review their valuation methodology. The level of disclosures regarding fair value have increased significantly and have been included in the financial statements at Note 27. AASB 119 Employee Benefits introduced revised definitions for short-term employee benefits. Whilst the Council has reviewed the annual leave liability to determine the level of annual leave which is expected to be paid more than 12 months after the end of the reporting period, there has been no effect on the amounts disclosed as leave liabilities since Council’s existing valuation policy was to discount annual leave payable more than 12 months after the end of the reporting period to present values. (iv) Early adoption of Accounting Standards Council has not elected to apply any pronouncements before their operative date in the annual reporting period beginning 1 July 2013. Refer further to paragraph (ab) relating to a summary of the effects of Standards with future operative dates.

Financial Statements 2014_
Randwick City Council Notes to the Financial Statements for the financial year ended 30 June 2014 Note 1. Summary of Significant Accounting Policies
page 10
(v) Basis of Accounting These financial statements have been prepared under the historical cost convention except for: (i) certain financial assets and liabilities at fair
value through profit or loss and available-for-sale financial assets which are all valued at fair value,
(ii) the write down of any Asset on the basis of Impairment (if warranted) and
(iii) certain classes of non current assets(eg.
Infrastructure, Property, Plant & Equipment) that are accounted for at fair valuation.
The accrual basis of accounting has also been applied in their preparation. (vi) Changes in Accounting Policies Council’s accounting policies have been consistently applied to all the years presented, unless otherwise stated. There have also been no changes in accounting policies when compared with previous financial statements unless otherwise stated. (vii) Critical Accounting Estimates The preparation of financial statements requires the use of certain critical accounting estimates (in conformity with AASBs). Accordingly this requires management to exercise its judgement in the process of applying the Council's accounting policies. Estimates and judgements are continually evaluated and are based on historical experience and other factors, including expectations of future events that may have a financial impact on the entity and that are believed to be reasonable under the circumstances. Critical accounting estimates and assumptions Council makes estimates and assumptions concerning the future. The resulting accounting estimates will, by definition, seldom equal the related actual results.
The estimates and assumptions that have a significant risk of causing a material adjustment to the carrying amounts of assets and liabilities within the next financial year are set out below. (i) Estimated fair values of investment properties
(ii) Estimated fair values of infrastructure, property,
plant and equipment.
(iii) Estimated tip remediation provisions.
Critical judgements in applying Council's accounting policies (i) Impairment of Receivables - Council has made
a significant judgement about the impairment of a number of its receivables in Note 7.
(ii) Projected Section 94 Commitments - Council
has used significant judgement in determining future Section 94 income and expenditure in Note 17.
(b) Revenue recognition Council recognises revenue when the amount of revenue can be reliably measured, it is probable that future economic benefits will flow to it and specific criteria have been met for each of the Council’s activities as described below. Council bases any estimates on historical results, taking into consideration the type of customer, the type of transaction and the specifics of each arrangement. Revenue is measured at the fair value of the consideration received or receivable. Revenue is measured on major income categories as follows: Rates, Annual Charges, Grants and Contributions Rates, annual charges, grants and contributions (including developer contributions) are recognised as revenues when the Council obtains control over the assets comprising these receipts. Control over assets acquired from rates and annual charges is obtained at the commencement of the rating year as it is an enforceable debt linked to the

Financial Statements 2014_
Randwick City Council Notes to the Financial Statements for the financial year ended 30 June 2014 Note 1. Summary of Significant Accounting Policies
page 11
rateable property or, where earlier, upon receipt of the rates. A provision for the impairment on rates receivables has not been established as unpaid rates represent a charge against the rateable property that will be recovered when the property is next sold. Control over granted assets is normally obtained upon their receipt (or acquittal) or upon earlier notification that a grant has been secured, and is valued at their fair value at the date of transfer. Revenue from Contributions is recognised when the Council either obtains control of the contribution or the right to receive it, (i) it is probable that the economic benefits comprising the contribution will flow to the Council and (ii) the amount of the contribution can be measured reliably. Where grants or contributions recognised as revenues during the financial year were obtained on condition that they be expended in a particular manner or used over a particular period and those conditions were undischarged at balance date, the unused grant or contribution is disclosed in Note 3(g). Note 3(g) also discloses the amount of unused grant or contribution from prior years that was expended on Council’s operations during the current year. The Council has obligations to provide facilities from contribution revenues levied on developers under the provisions of S94 of the EPA Act 1979. Whilst Council generally incorporates these amounts as part of a Development Consents Order, such developer contributions are only recognised as income upon their physical receipt by Council, due to the possibility that individual Development Consents may not be acted upon by the applicant and accordingly would not be payable to Council. Developer contributions may only be expended for the purposes for which the contributions were required but the Council may apply contributions according to the priorities established in work schedules. A detailed Note relating to developer contributions can be found at Note 17.
User Charges, Fees and Other Income User charges, fees and other income (including parking fees and fines) are recognised as revenue when the service has been provided, the payment is received, or when the penalty has been applied, whichever first occurs. A provision for the impairment of these receivables is recognised when collection in full is no longer probable. A liability is recognised in respect of revenue that is reciprocal in nature to the extent that the requisite service has not been provided as at balance date. Sale of Infrastructure, Property, Plant and Equipment The profit or loss on sale of an asset is determined when control of the asset has irrevocably passed to the buyer. Interest and Rents Rental income is accounted for on a straight-line basis over the lease term. Interest Income from Cash & Investments is accounted for using the effective interest rate at the date that interest is earned. Other Income Other income is recorded when the payment is due, the value of the payment is notified or the payment is received, whichever occurs first. (c) Principles of Consolidation These financial statements incorporate (i) the assets and liabilities of Council and any Entities (or operations) that it controls (as at 30 June 2014) and (ii) all the related operating results (for the financial year ended the 30th June 2014). The financial statements also include Council’s share of the assets, liabilities, income and expenses of any Jointly Controlled Operations under the appropriate headings. In the process of reporting on Council’s activities as a single unit, all inter-entity year end balances and

Financial Statements 2014_
Randwick City Council Notes to the Financial Statements for the financial year ended 30 June 2014 Note 1. Summary of Significant Accounting Policies
page 12
reporting period transactions have been eliminated in full between Council and its controlled entities. (i) The Consolidated Fund In accordance with the provisions of Section 409(1) of the LGA 1993, all money and property received by Council is held in the Council’s Consolidated Fund unless it is required to be held in the Council’s Trust Fund. The Consolidated Fund and other entities through which the Council controls resources to carry on its functions have been included in the financial statements forming part of this report. The following entities have been included as part of the Consolidated Fund: General Purpose Operations (ii) The Trust Fund In accordance with the provisions of Section 411 of the Local Government Act 1993 (as amended), a separate and distinct Trust Fund is maintained to account for all money and property received by the Council in trust which must be applied only for the purposes of or in accordance with the trusts relating to those monies. No trust funds are currently held (iii) Joint Ventures Jointly Controlled Assets & Operations The proportionate interests in the assets, liabilities and expenses of a Joint Venture Activity have been incorporated throughout the financial statements under the appropriate headings. Jointly Controlled Entities Any interests in Joint Venture Entities & Partnerships are accounted for using the equity method and is carried at cost. Under the equity method, the share of the profits or losses of the partnership is recognised in the income statement, and the share of movements in retained earnings & reserves is recognised in the balance sheet.
(iv) Associated Entities Where Council has the power to participate in the financial and operating decisions (of another entity), ie. where Council is deemed to have “significant influence” over the other entities operations but neither controls nor jointly controls the entity, then Council accounts for such interests using the equity method of accounting – in a similar fashion to Joint Venture Entities & Partnerships. Such entities are usually termed Associates. (v) County Councils Council is not a member of any County Councils. (vi) Additional Information Note 19 provides more information in relation to Joint Venture Entities, Associated Entities and Joint Venture Operations where applicable. (d) Cash and Cash Equivalents For Statement of Cash Flows (and Statement of Financial Position) presentation purposes, cash and cash equivalents includes; cash on hand, deposits held at call with financial institutions, other short-term, highly liquid investments with
original maturities of three months or less that are readily convertible to known amounts of cash and which are subject to an insignificant risk of changes in value, and
bank overdrafts. Bank overdrafts are shown within borrowings in current liabilities on the balance sheet but are incorporated into Cash & Cash Equivalents for presentation of the Cash Flow Statement. (e) Investments and Other Financial Assets Council (in accordance with AASB 139) classifies each of its investments into one of the following categories for measurement purposes:

Financial Statements 2014_
Randwick City Council Notes to the Financial Statements for the financial year ended 30 June 2014 Note 1. Summary of Significant Accounting Policies
page 13
financial assets at fair value through profit or loss,
loans and receivables, held-to-maturity investments, and available-for-sale financial assets. Each classification depends on the purpose/intention for which the investment was acquired & at the time it was acquired. Management determines each Investment classification at the time of initial recognition and re-evaluates this designation at each reporting date. (i) Financial assets at fair value through profit or loss Financial assets at fair value through profit or loss include financial assets that are “held for trading”. A financial asset is classified in the “held for trading” category if it is acquired principally for the purpose of selling in the short term. Derivatives are classified as held for trading unless they are designated as hedges. Assets in this category are primarily classified as current assets as they are primarily held for trading &/or are expected to be realised within 12 months of the balance sheet date. (ii) Loans and receivables Loans and receivables are non derivative financial assets with fixed or determinable payments that are not quoted in an active market. They arise when the Council provides money, goods or services directly to a debtor with no intention (or in some cases ability) of selling the resulting receivable. They are included in current assets, except for those with maturities greater than 12 months after the balance sheet date which are classified as non-current assets.
(iii) Held-to-maturity investments Held-to-maturity investments are non-derivative financial assets with fixed or determinable payments and fixed maturities that the Council’s management has the positive intention and ability to hold to maturity. In contrast to the “Loans & Receivables” classification, these investments are generally quoted in an active market. Held-to-maturity financial assets are included in non-current assets, except for those with maturities less than 12 months from the reporting date, which are classified as current assets. (iv) Available-for-sale financial assets Available-for-sale financial assets are non-derivatives that are either designated in this category or not classified in any of the other categories. Investments must be designated as available-for-sale if they do not have fixed maturities and fixed or determinable payments and management intends to hold them for the medium to long term. Accordingly, this classification principally comprises marketable equity securities, but can include all types of financial assets that could otherwise be classified in one of the other investment categories. They are generally included in non-current assets unless management intends to dispose of the investment within 12 months of the balance sheet date or the term to maturity from the reporting date is less than 12 months. Financial Assets – Reclassification Council may choose to reclassify a non-derivative trading financial asset out of the held-for-trading category if the financial asset is no longer held for the purpose of selling it in the near term. Financial assets other than loans and receivables are permitted to be reclassified out of the held-for-trading category only in rare circumstances arising from a single event that is unusual and highly unlikely to recur in the near term. Council may also choose to reclassify financial assets that would meet the definition of loans and

Financial Statements 2014_
Randwick City Council Notes to the Financial Statements for the financial year ended 30 June 2014 Note 1. Summary of Significant Accounting Policies
page 14
receivables out of the held-for-trading or available-for-sale categories if it has the intention and ability to hold these financial assets for the foreseeable future or until maturity at the date of reclassification. Reclassifications are made at fair value as of the reclassification date. Fair value becomes the new cost or amortised cost as applicable, and no reversals of fair value gains or losses recorded before reclassification date are subsequently made. Effective interest rates for financial assets reclassified to loans and receivables and held-to-maturity categories are determined at the reclassification date. Further increases in estimates of cash flows adjust effective interest rates prospectively. General Accounting & Measurement of Financial Instruments: (i) Initial Recognition Investments are initially recognised (and measured) at fair value, plus in the case of investments not at “fair value through profit or loss”, directly attributable transactions costs Purchases and sales of investments are recognised on trade-date - the date on which the Council commits to purchase or sell the asset. Financial assets are derecognised when the rights to receive cash flows from the financial assets have expired or have been transferred and the Council has transferred substantially all the risks and rewards of ownership. (ii) Subsequent Measurement Available-for-sale financial assets and financial assets at fair value through profit and loss are subsequently carried at fair value. Loans and receivables and held-to-maturity investments are carried at amortised cost using the effective interest method. Realised and unrealised gains and losses arising from changes in the fair value of the financial assets classified as “fair value through profit or loss” category are included in the income statement in the period in which they arise.
Unrealised gains and losses arising from changes in the fair value of non monetary securities classified as "available-for-sale" are recognised in equity in the available-for-sale investments revaluation reserve. When securities classified as "available-for-sale" are sold or impaired, the accumulated fair value adjustments are included in the income statement as gains and losses from investment securities. Impairment Council assesses at each balance date whether there is objective evidence that a financial asset or group of financial assets is impaired. A financial asset or a group of financial assets is impaired and impairment losses are incurred only if there is objective evidence of impairment as a result of one or more events that occurred after the initial recognition of the asset (a ‘loss event’) and that loss event (or events) has an impact on the estimated future cash flows of the financial asset or group of financial assets that can be reliably estimated. (iii) Types of Investments Council has an approved Investment Policy in order to undertake its investment of money in accordance with (and to comply with) Section 625 of the Local Government Act and S212 of the LG (General) Regulation 2005. Investments are placed and managed in accordance with the Policy and having particular regard to authorised investments prescribed under the Ministerial Local Government Investment Order. Council maintains its investment Policy in compliance with the Act and ensures that it or its representatives exercise care, diligence and skill that a prudent person would exercise in investing Council funds. Council amended its policy following revisions to the Ministerial Local Government Investment Order arising from the Cole Inquiry recommendations. Certain investments that Council holds are no longer prescribed (eg. managed funds, CDOs, and equity linked notes), however they have been retained under grandfathering provisions of the Order. These will be disposed of when most financially advantageous to Council.

Financial Statements 2014_
Randwick City Council Notes to the Financial Statements for the financial year ended 30 June 2014 Note 1. Summary of Significant Accounting Policies
page 15
(f) Fair value estimation The fair value of financial assets and financial liabilities must be estimated for recognition and measurement or for disclosure purposes. The fair value of financial instruments traded in active markets is based on quoted market prices at the balance sheet date. The fair value of financial instruments that are not traded in an active market is determined using valuation techniques. Council uses a variety of methods and makes assumptions that are based on market conditions existing at each balance date. Quoted market prices or dealer quotes for similar instruments are used for long-term debt instruments held. If the market for a financial asset is not active (and for unlisted securities), the Council establishes fair value by using valuation techniques. These include reference to the fair values of recent arm’s length transactions, involving the same instruments or other instruments that are substantially the same, discounted cash flow analysis, and option pricing models refined to reflect the issuer’s specific circumstances. The nominal value less estimated credit adjustments of trade receivables and payables are assumed to approximate their fair values. The fair value of financial liabilities for disclosure purposes is estimated by discounting the future contractual cash flows at the current market interest rate that is available to the Council for similar financial instruments. (g) Receivables Receivables are initially recognised at fair value and subsequently measured at amortised cost, less any provision for impairment. Receivables (excluding Rates & Annual Charges) are generally due for settlement no more than 30 days from the date of recognition.
The collectibility of receivables is reviewed on an ongoing basis. Debts which are known to be uncollectible are written off in accordance with Council’s policy. A provision for impairment (ie. an allowance account) relating to receivables is established when there is objective evidence that the Council will not be able to collect all amounts due according to the original terms of each receivable. The amount of the provision is the difference between the asset’s carrying amount and the present value of estimated future cash flows, discounted at the effective interest rate. Impairment losses are recognised in the Income Statement within other expenses. When a receivable for which an impairment allowance had been recognised becomes uncollectible in a subsequent period, it is written off against the allowance account. Subsequent recoveries of amounts previously written off are credited against other expenses in the income statement. (h) Inventories Raw Materials and Stores, Work in Progress and Finished Goods Raw materials and stores, work in progress and finished goods in respect of business undertakings are all stated at the lower of cost and net realisable value. Cost comprises direct materials, direct labour and an appropriate proportion of variable and fixed overhead expenditure, the latter being allocated on the basis of normal operating capacity. Costs are assigned to individual items of inventory on the basis of weighted average costs. Net realisable value is the estimated selling price in the ordinary course of business less the estimated costs of completion and the estimated costs necessary to make the sale. Inventories held in respect of non-business undertakings have been valued at cost subject to adjustment for loss of service potential.
Financial Statements 2014_
Randwick City Council Notes to the Financial Statements for the financial year ended 30 June 2014 Note 1. Summary of Significant Accounting Policies
page 16
(i) Infrastructure, Property, Plant and Equipment (I,PP&E) Acquisition of assets Council’s non current assets are continually revalued (over a 5 year period) in accordance with the fair valuation policy as mandated by the Division of Local Government. At balance date, the following classes of I,PP&E were stated at their Fair Value; - Investment Properties – refer Note 1(o), - Operational Land (External Valuation)
- Buildings – Specialised/Non Specialised
(External Valuation) - Plant and Equipment
(as approximated by depreciated historical cost)
- Roads Assets incl. roads, bridges & footpaths (Internal Valuation)
- Drainage Assets (Internal Valuation) - Community Land (External Valuation)
- Depreciable Land Improvements (Internal
Valuation)
- Other Open Space/Recreational asset (Internal Valuation)
- Other Assets (as approximated by depreciated historical cost)
Initial Recognition On initial recognition, an assets cost is measured at its fair value, plus all expenditure that is directly attributable to the acquisition. Where settlement of any part of an asset’s cash consideration is deferred, the amounts payable in the future are discounted to their present value as at the date of recognition (ie. date of exchange) of the asset to arrive at fair value. The discount rate used is the Council’s incremental borrowing rate, being the rate at which a similar borrowing could be obtained from an independent financier under comparable terms and conditions.
Where infrastructure, property, plant and equipment assets are acquired for no cost or for an amount other than cost, the assets are recognised in the financial statements at their fair value at acquisition date - being the amount that the asset could have been exchanged between knowledgeable willing parties in an arm’s length transaction. Subsequent costs Subsequent costs are included in the asset’s carrying amount or recognised as a separate asset, as appropriate, only when it is probable that future economic benefits associated with the item will flow to Council and the cost of the item can be measured reliably. All other repairs and maintenance are charged to the income statement during the financial period in which they are incurred. Asset Revaluations (including Indexation) In accounting for Asset Revaluations relating to Infrastructure, Property, Plant & Equipment: Increases in the combined carrying amounts of
asset classes arising on revaluation are credited to the asset revaluation reserve.
To the extent that a net asset class increase
reverses a decrease previously recognised via the profit or loss, then increase is first recognised in profit or loss.
Net decreases that reverse previous increases of
the same asset class are first charged against revaluation reserves directly in equity to the extent of the remaining reserve attributable to the asset, with all other decreases charged to the Income statement.
For all other assets, Council assesses at each reporting date whether there is any indication that a revalued asset’s carrying amount may differ materially from that which would be determined if the asset were revalued at the reporting date. If any such indication exists, Council determines the asset’s fair value and revalues the asset to that amount. Full revaluations are undertaken for all assets on a 5 year cycle.

Financial Statements 2014_
Randwick City Council Notes to the Financial Statements for the financial year ended 30 June 2014 Note 1. Summary of Significant Accounting Policies
page 17
Capitalisation Thresholds Items of infrastructure, property, plant and equipment are not capitalised unless their cost of acquisition exceeds the following; Land - council land 100% Capitalised - open space 100% Capitalised - land under roads (purchases after 30/6/08) 100% Capitalised Plant & Equipment Office Furniture > $5,000 Office Equipment > $2,000 Other Plant &Equipment > $2,000 Buildings & Land Improvements Park Furniture & Equipment > $25,000 Building - construction/extensions 100% Capitalised - renovations > $125,000 Other Structures > $25,000 Stormwater Assets Drains & Culverts > $10,000 Other > $10,000 Transport Assets Road construction & reconstruction > $10,000 Reseal/Re-sheet & major repairs: > $10,000 Bridge construction & reconstruction > $10,000 Depreciation Depreciation on Council's infrastructure, property, plant and equipment assets is calculated using the straight line method in order to allocate an assets cost (net of residual values) over its estimated useful life. Land is not depreciated. Estimated useful lives for Council's I,PP&E include: Plant & Equipment - Office Equipment 5 to 10 years - Office furniture 10 years - Computer Equipment 5 to 10 years - Vehicles 7 years - Heavy Plant/Road Making equip. 6 to 10 years
- Other plant and equipment 2 to 25 years Furniture and Fittings - Furniture and Fittings 10 years Buildings - Structure 60 years - Other Components 20 years Stormwater Drainage - Pits 80 to 120 years - Pipe/Conduit 50 to 120 years - GPT Basket 20 years - Other 100 to 120 years Transportation Assets - Road Formation Infinite - Road Pavement 100 years - Road Surface 25 years - Kerb & Gutter 110 years - Footpaths 20 to 80 years - Road Furniture 10 years - Road Structures 80 years Other Infrastructure Assets - Bulk earthworks Infinite Open Space Assets - Ocean Pool 100 years - Swimming Pool 50 years - Playground equipment 15 years - Irrigation System 6 to 20 years - Park Furniture 15 years - Tennis Court 15 years - Skate Park 50 years - Cricket Net 10 years - Turf Cricket Wicket 15 years - Fencing 20 years - Lighting 20 years - Scoreboard 30 years - Signage and Flagpoles 20 years - Water Tank 15 to 50 years Library Resources - Library Resources 5 years All asset residual values and useful lives are reviewed and adjusted (if appropriate), at each reporting date.

Financial Statements 2014_
Randwick City Council Notes to the Financial Statements for the financial year ended 30 June 2014 Note 1. Summary of Significant Accounting Policies
page 18
An asset’s carrying amount is written down immediately to its recoverable amount if the asset’s carrying amount is greater than its estimated recoverable amount – refer Note 1(s) on Asset Impairment. Disposal and De-recognition An item of property, plant and equipment is derecognised upon disposal or when no further future economic benefits are expected from its use or disposal. Any gain or loss arising on derecognition of the asset (calculated as the difference between the net disposal proceeds and the carrying amount of the asset) is included in Council’s Income Statement in the year the asset is derecognised. (j) Land Land (other than Land under Roads) is in accordance with Part 2 of Chapter 6 of the Local Government Act (1993) classified as either Operational or Community. This classification of Land is disclosed in Note 9(a). (k) Land under roads Land under roads is land under roadways and road reserves including land under footpaths, nature strips and median strips. Council has elected not to recognise land under roads acquired before 1 July 2008 in accordance with AASB 1051. Land under roads acquired after 1 July 2008 is recognised in accordance with AASB 116 – Property, Plant and Equipment. (l) Intangible Assets No intangible asset is held by Council.
(m) Crown Reserves Crown Reserves under Council’s care and control are recognised as assets of the Council. While ownership of the reserves remains with the Crown, Council retains operational control of the reserves and is responsible for their maintenance and use in accordance with the specific purposes to which the reserves are dedicated. Improvements on Crown Reserves are also recorded as assets, while maintenance costs incurred by Council and revenues relating the reserves are recognised within Council’s Income Statement. Representations are currently being sought across State and Local Government to develop a consistent accounting treatment for Crown Reserves across both tiers of government. (n) Investment property Investment property comprises land &/or buildings that are principally held for long-term rental yields, capital gains or both that is not occupied by Council. No investment property is held by Council. (o) Non-Current Assets (or Disposal Groups) “Held for Sale” & Discontinued Operations Council does not hold No Non-Current Assets “Held for Sale” or discontinued operations. (p) Impairment of assets All Council's I,PP&E is subject to an annual assessment of impairment. Assets that are subject to amortisation are reviewed for impairment whenever events or changes in circumstances indicate that the carrying amount may not be recoverable. An impairment loss is recognised for the amount by which the asset’s carrying amount exceeds its recoverable amount.

Financial Statements 2014_
Randwick City Council Notes to the Financial Statements for the financial year ended 30 June 2014 Note 1. Summary of Significant Accounting Policies
page 19
The recoverable amount is the higher of an asset’s fair value less costs to sell and value in use. Where an asset is not held principally for cash generating purposes (for example Infrastructure Assets) and would be replaced if the Council was deprived of it then depreciated replacement cost is used as value in use, otherwise value in use is estimated by using a discounted cash flow model. Non-financial assets (other than goodwill) that suffered a prior period impairment are reviewed for possible reversal of the impairment at each reporting date. Goodwill & other Intangible Assets that have an indefinite useful life and are not subject to amortisation are tested annually for impairment. (q) Payables These amounts represent liabilities and include goods and services provided to the Council prior to the end of financial year which are unpaid. The amounts for goods and services are unsecured and are usually paid within 30 days of recognition. (r) Borrowings Borrowings are initially recognised at fair value, net of transaction costs incurred. Borrowings are subsequently measured at amortised cost. Amortisation results in any difference between the proceeds (net of transaction costs) and the redemption amount being recognised in the Income Statement over the period of the borrowings using the effective interest method. Borrowings are removed from the balance sheet when the obligation specified in the contract is discharged, cancelled or expired. Borrowings are classified as current liabilities unless the Council has an unconditional right to defer settlement of the liability for at least 12 months after the balance sheet date. Council currently has no borrowings.
(s) Borrowing costs Borrowing costs are expensed except to the extent that the they are incurred during the construction of qualifying assets. Borrowing costs incurred for the construction of any qualifying asset are capitalised during the period of time that is required to complete and prepare the asset for its intended use or sale. (t) Provisions Provisions for legal claims, service warranties and other like liabilities are recognised when: Council has a present legal or constructive
obligation as a result of past events; it is more likely than not that an outflow of
resources will be required to settle the obligation; and
the amount has been reliably estimated. Provisions are not recognised for future operating losses. Where there are a number of similar obligations, the likelihood that an outflow will be required in settlement is determined by considering the class of obligations as a whole. A provision is recognised even if the likelihood of an outflow with respect to any one item included in the same class of obligations may be small. Provisions are measured at the present value of management’s best estimate of the expenditure required to settle the present obligation at the reporting date. The discount rate used to determine the present value reflects current market assessments of the time value of money and the risks specific to the liability. The increase in the provision due to the passage of time is recognised as interest expense.
Financial Statements 2014_
Randwick City Council Notes to the Financial Statements for the financial year ended 30 June 2014 Note 1. Summary of Significant Accounting Policies
page 20
(u) Employee benefits (i) Short Term Obligations Short term employee benefit obligations include liabilities for wages and salaries (including non-monetary benefits), annual leave and vesting sick leave expected to be wholly settled within the 12 months after the reporting period. Leave liabilities are recognised in the provision for employee benefits in respect of employees’ services up to the reporting date with other short term employee benefit obligations disclosed under payables.. These provisions are measured at the amounts expected to be paid when the liabilities are settled. All other short-term employee benefit obligations are presented as payables. Liabilities for non vesting sick leave are recognised at the time when the leave is taken and measured at the rates paid or payable, and accordingly no Liability has been recognised in these reports. Wages & salaries, annual leave and vesting sick leave are all classified as Current Liabilities. (ii) Other Long Term Obligations The liability for all long service and annual leave in respect of services provided by employees up to the reporting date (which is not expected to be wholly settled within the 12 months after the reporting period) are recognised in the provision for employee benefits. These liabilities are measured at the present value of the expected future payments to be made using the projected unit credit method. Consideration is given to expected future wage and salary levels, experience of employee departures and periods of service. Expected future payments are then discounted using market yields at the reporting date based on national government bonds with terms to maturity and currency that match as closely as possible the estimated future cash outflows.
Due to the nature of when and how Long Service Leave can be taken, all Long Service Leave for employees with 4 or more years of service has been classified as Current, as it has been deemed that Council does not have the unconditional right to defer settlement beyond 12 months – even though it is not anticipated that all employees with more than 4 years service (as at reporting date) will apply for and take their leave entitlements in the next 12 months. (iii) Retirement benefit obligations All employees of the Council are entitled to benefits on retirement, disability or death. Council contributes to various defined benefit plans and defined contribution plans on behalf of its employees. Defined Benefit Plans A liability or asset in respect of defined benefit superannuation plans would ordinarily be recognised in the balance sheet, and measured as the present value of the defined benefit obligation at the reporting date plus unrecognised actuarial gains (less unrecognised actuarial losses) less the fair value of the superannuation fund’s assets at that date and any unrecognised past service cost. The present value of the defined benefit obligation is based on expected future payments which arise from membership of the fund to the reporting date, calculated annually by independent actuaries using the projected unit credit method. Consideration is given to expected future wage and salary levels, experience of employee departures and periods of service. However, when this information is not reliably available, Council can account for its obligations to defined benefit plans on the same basis as its obligations to defined contribution plans – i.e. as an expense when they become payable. Council is party to an Industry Defined Benefit Plan under the Local Government Superannuation Scheme, named the “Local Government Superannuation Scheme – Pool B” This Scheme has been deemed to be a “multi employer fund” for the purposes of AASB 119. Sufficient information is not available to account for the Scheme as a defined benefit plan (in accordance

Financial Statements 2014_
Randwick City Council Notes to the Financial Statements for the financial year ended 30 June 2014 Note 1. Summary of Significant Accounting Policies
page 21
with AASB 119) because the assets to the scheme are pooled together for all Councils. The last valuation of the Scheme was performed by Richard Boyfield of Mercer Consulting Pty Ltd and covers the period ended 30/03/2014. However the position is monitored annually and the Actuary has estimated that as at 30 June 2014 the prior period deficit still exists. Effective from 1 July 2009, employers are required to contribute additional contributions to assist in extinguishing this deficit. The amount of employer contributions to the defined benefit section of the Local Government Superannuation Scheme and recognised as an expense and disclosed as part of Superannuation Expenses at Note 4(a) for the year ending 30 June 2014 was $1,283,573. The amount of additional contributions included in the total employer contribution advised above is $581,158 per year. The share of this deficit that can be broadly attributed to Council is estimated to be in the order of $2,324,632 until 30 June 2018. Council’s share of that deficiency cannot be accurately calculated as the Scheme is a mutual arrangement where assets and liabilities are pooled together for all member councils. For this reason, no liability for the deficiency has been recognised in these financial statements. Council has, however, disclosed a contingent liability in Note 18 to reflect the possible obligation that may arise should the Scheme require immediate payment to correct the deficiency. Defined Contribution Plans Contributions to Defined Contribution Plans are recognised as an expense as they become payable. Prepaid contributions are recognised as an asset to the extent that a cash refund or a reduction in the future payments is available. (iv) Employee Benefit On-Costs Council has recognised at year end the aggregate on-cost liabilities arising from employee benefits,
and in particular those on-cost liabilities that will arise when payment of current employee benefits is made in future periods. These amounts include Superannuation and Workers Compensation expenses which will be payable upon the future payment of certain Leave Liabilities accrued as at 30/6/14. (v) Self insurance Council does not self insure. (w) Allocation between current and non-current assets & liabilities In the determination of whether an asset or liability is classified as current or non-current, consideration is given to the time when each asset or liability is expected to be settled. The asset or liability is classified as current if it is expected to be settled within the next 12 months, being the Council’s operational cycle. Exceptions In the case of liabilities where Council does not have the unconditional right to defer settlement beyond 12 months (such as vested long service leave), the liability is classified as current even if not expected to be settled within the next 12 months. In the case of inventories that are “held for trading”, these are also classified as current even if not expected to be realised in the next 12 months. (x) Taxes The Council is exempt from both Commonwealth Income Tax and Capital Gains Tax. Council does however have to comply with both Fringe Benefits Tax and Goods and Services Tax (GST). Goods & Services Tax (GST) Income, expenses and assets are all recognised net of the amount of GST, except where the amount of

Financial Statements 2014_
Randwick City Council Notes to the Financial Statements for the financial year ended 30 June 2014 Note 1. Summary of Significant Accounting Policies
page 22
GST incurred is not recoverable from the Australian Tax Office (ATO). In these circumstances the GST is recognised as part of the cost of acquisition of the asset or as part of the revenue / expense. Receivables and payables within the Balance Sheet are stated inclusive of any applicable GST. The net amount of GST recoverable from or payable to the ATO is included as a current asset or current liability in the Balance Sheet. Operating cash flows within the Cash Flow Statement are on a gross basis, ie. they are inclusive of GST where applicable. Investing and Financing cash flows are treated on a net basis (where recoverable form the ATO), ie. they are exclusive of GST. Instead, the GST component of investing and financing activity cash flows which are recoverable from or payable to the ATO are classified as operating cash flows. Commitments and contingencies are disclosed net of the amount of GST recoverable from (or payable to) the ATO. (y) New accounting standards and UIG interpretations Certain new (or amended) accounting standards and interpretations have been published that are not mandatory for reporting periods ending 30 June 2014. Council has not adopted any of these standards early. Council’s assessment of the impact of these new standards and interpretations is set out below. Applicable to Local Government with implications: AASB 9 Financial Instruments, associated standards, AASB 2010-7 Amendments to Australian Accounting Standards arising from AASB 9 and AASB 2012-6 Amendments to Australian Accounting Standards – Mandatory Effective Date of AASB 9 and transitional disclosures and AASB 2013-9 Amendments to Australian Accounting Standards – Conceptual Framework, Materiality and Financial Instruments (effective from 1 January 2017)
AASB 9 Financial Instruments addresses the classification, measurement and de-recognition of financial assets and financial liabilities. The standard is not applicable until 1 January 2015 but is available for early adoption. When adopted, the standard will affect in particular Council’s accounting for its available-for-sale financial assets, since AASB 9 only permits the recognition of fair value gains and losses in other comprehensive income if they relate to equity investments that are not held for trading. Fair value gains and losses on available-for-sale debt investments, for example, will therefore have to be recognised directly in profit or loss although there is currently a proposal by the IASB to introduce a Fair value through Other Comprehensive Income category for debt instruments. There will be no impact on Council’s accounting for financial liabilities, as the new requirements only affect the accounting for financial liabilities that are designated at fair value through profit or loss and Council does not have any such liabilities. The de-recognition rules have been transferred from AASB 139 Financial Instruments: Recognition and Measurement and have not been changed. The Council has not yet fully assessed the impact on the reporting financial position and performance on adoption of AASB 9. Applicable to Local Government but no implications for Council; AASB 2013-3 Amendments to AASB 136 Recoverable Amount Disclosures for Non-Financial Assets (effective for 30 June 2015 Financial Statements) There are no changes to reported financial position or performance from AASB 2013 – 3, however additional disclosures may be required. Applicable to Local Government but not relevant to Council at this stage; AASB 10 Consolidated Financial Statements, AASB 11 Joint Arrangements, AASB 12 Disclosure of Interests in Other Entities, revised AASB 127 Separate Financial Statements and

Financial Statements 2014_
Randwick City Council Notes to the Financial Statements for the financial year ended 30 June 2014 Note 1. Summary of Significant Accounting Policies
page 23
AASB 128 Investments in Associates and Joint Ventures and AASB 2011-7 Amendments to Australian Accounting Standards arising from the Consolidation and Joint Arrangements Standards (effective for 30 June 2015 Financial Statements for not-for-profit entities) This suite of five new and amended standards address the accounting for joint arrangements, consolidated financial statements and associated disclosures. AASB 10 replaces all of the guidance on control and consolidation in AASB 127 Consolidated and Separate Financial Statements, and Interpretation 12 Consolidation – Special Purpose Entities. The core principle that a consolidated entity presents a parent and its subsidiaries as if they are a single economic entity remains unchanged, as do the mechanics of consolidation. However, the standard introduces a single definition of control that applies to all entities. It focuses on the need to have both power and rights or exposure to variable returns. Power is the current ability to direct the activities that significantly influence returns. Returns must vary and can be positive, negative or both. Control exists when the investor can use its power to affect the amount of its returns. There is also new guidance on participating and protective rights and on agent/principal relationships. Council does not expect the new standard to have a significant impact on its composition. AASB 11 introduces a principles based approach to accounting for joint arrangements. The focus is no longer on the legal structure of joint arrangements, but rather on how rights and obligations are shared by the parties to the joint arrangement. Based on the assessment of rights and obligations, a joint arrangement will be classified as either a joint operation or a joint venture. Joint ventures are accounted for using the equity method, and the choice to proportionately consolidate will no longer be permitted.
Parties to a joint operation will account their share of revenues, expenses, assets and liabilities in much the same way as under the previous standard. AASB 11 also provides guidance for parties that participate in joint arrangements but do not share joint control. Council's investment in the joint venture partnership will be classified as a joint venture under the new rules. As Council already applies the equity method in accounting for this investment, AASB 11 will not have any impact on the amounts recognised in its financial statements. AASB 12 sets out the required disclosures for entities reporting under the two new standards, AASB 10 and AASB 11, and replaces the disclosure requirements currently found in AASB 127 and AASB 128. Application of this standard by Council will not affect any of the amounts recognised in the financial statements, but will impact the type of information disclosed in relation to Council's investments. Amendments to AASB 128 provide clarification that an entity continues to apply the equity method and does not remeasure its retained interest as part of ownership changes where a joint venture becomes an associate, and vice versa. The amendments also introduce a “partial disposal” concept. Council is still assessing the impact of these amendments. Council does not expect to adopt the new standards before their operative date. They would therefore be first applied in the financial statements for the annual reporting period ending 30 June 2015. Not applicable to Local Government per se; None There are no other standards that are “not yet effective” and expected to have a material impact on Council in the current or future reporting periods and on foreseeable future transactions.

Financial Statements 2014_
Randwick City Council Notes to the Financial Statements for the financial year ended 30 June 2014 Note 1. Summary of Significant Accounting Policies
page 24
(z) Rounding of amounts Unless otherwise indicated, amounts in the financial statements have been rounded off to the nearest thousand dollars. (aa) Comparative Figures To ensure comparability with the current reporting period’s figures, some comparative period line items and amounts may have been reclassified or individually reported for the first time within these financial statements and/or the notes. (ab) Disclaimer Nothing contained within these statements may be taken to be an admission of any liability to any person under any circumstance.

Ran
dwic
k C
ity C
ounc
il
Not
es to
the
Fina
ncia
l Sta
tem
ents
for t
he fi
nanc
ial y
ear e
nded
30
June
201
4
Not
e 2(
a). C
ounc
il Fu
nctio
ns /
Act
iviti
es -
Fina
ncia
l Inf
orm
atio
n
1. In
clud
es: R
ates
& A
nnua
l Cha
rges
(inc
l. E
x-G
ratia
), U
ntie
d G
ener
al P
urpo
se G
rant
s &
Unr
estri
cted
Inte
rest
& In
vest
men
t Inc
ome.
21,6
77
21
,122
(10,
884)
(8
,940
)
91,5
96
(4
7,78
7)
(52,
335)
955
(49,
001)
3,
553
3,02
3
1,
331,
289
1,21
5,87
4
20
Gov
erna
nce
& F
inan
cial
Ser
vice
s6,
600
7,69
6
7,
750
935
55
8
1,01
4
5,
665
7,13
8
6,
736
-
126,
707
11
6,89
1
Offi
ce o
f the
Gen
eral
Man
ager
(238
)
21,4
99
-
16
City
Ser
vice
s47
,105
46,6
03
42
,595
94,8
92
98
,938
(7,9
20)
622
95
6
928
76
-
96
238
-
(2
0)
10,6
15
12
,737
13,2
02
C
ity P
lann
ing
page 25
67,1
12
S
hare
of g
ains
/(los
ses)
in A
ssoc
iate
s &
Gen
eral
Pur
pose
Inco
me
1
Con
tinui
ng O
pera
tions
67,5
58
J
oint
Ven
ture
s (u
sing
the
Equ
ity M
etho
d)
Ope
ratin
g R
esul
t fro
m
64,3
20
T
otal
Fun
ctio
ns &
Act
iviti
es
68,0
95
134,
670
13
2,41
5
125,
051
12
0,93
8
130,
081
-
-
-
63,5
47
12
0,93
8
125,
051
66,5
34
Financial Statements 2014
-
3,98
3
3,88
6
1,
335,
060
1,45
8,94
0
1,33
5,06
7
7
-
1,45
8,94
7
7,
869
7
2,
451
6,
637
118,
254
-
-
118,
254
-
4,18
6
(5
4,70
7) 11
,827
(56,
618)
11,4
77
-
9,61
9
66,5
34
68
,095
67,5
58
-
(57,
939)
(93)
1,
320
Act
ual
2014
-
2013
11
(4
,284
)
(3
,782
)
Act
ual
-
Gov
erna
nce
(3,6
12)
2014
Act
ual
Orig
inal
B
udge
t 20
14A
ctua
l B
udge
t
4,28
4
3,
782
3,61
2
Ope
ratin
g R
esul
t fro
m
Con
tinui
ng O
pera
tions
Orig
inal
B
udge
t O
rigin
al
Act
ual
2014
2013
2014
2014
Act
ual
2013
Act
ual
2013
2014
$ '0
00
Inco
me,
Exp
ense
s an
d As
sets
hav
e be
en d
irect
ly a
ttrib
uted
to th
e fo
llow
ing
Func
tions
/ Ac
tiviti
es.
Det
ails
of t
hese
Fun
ctio
ns/A
ctiv
ities
are
pro
vide
d in
Not
e 2(
b).
Inco
me
from
Con
tinui
ng
Ope
ratio
nsEx
pens
es fr
om C
ontin
uing
O
pera
tions
Tota
l Ass
ets
held
(C
urre
nt &
N
on-c
urre
nt)
Fun
ctio
ns/A
ctiv
ities
2014
2013
Act
ual
Act
ual
Act
ual
Gra
nts
incl
uded
in
Inco
me
from
C
ontin
uing
O
pera
tions

Financial Statements 2014
Randwick City Council
Notes to the Financial Statements for the financial year ended 30 June 2014
Note 2(b). Council Functions / Activities - Component Descriptions
Details relating to the Council's functions / activities as reported in Note 2(a) are as follows:
CITY SERVICESManagement, technical and professional advice on all engineering matters, design, estimate and set-out of allengineering works, traffic committee, works depot, nursery and plant management.
Ancillary/administrative services - clerical, secretarial, survey, SES, plans of management for open space land,libraries, Des Renford Aquatic Centre and waste management,
Construction of the City's public parks and recreational facilities, cleaning service for all parks, beaches, poolsand other recreational facilities under Council's control, maintenance services for all parks, beaches, pools andother recreational facilities under Council's control, professional patrol of all major beaches, communityconsultation for future planning of parks and beaches, protection and restoration of remnant bushland,preparation of all facilities prior to use and routine and preventative maintenance of buildings.
Construction of roads, drainage, vehicular accesses, kerb and gutter, footpaths, traffic facilities, car parks, streetfurniture. Routine and preventative maintenance of roads and drainage. Routine maintenance of nature strips,street trees and on-street gardens. Street tree planting. Routine maintenance of street furniture and signage.Stormwater pollution management, construction and maintenance of bus shelters.
CITY PLANNINGManagement and operation of Assessment and Building Services, Strategic Planning, Environmental Health andBuilding Services, Community Programs and Partnerships, Home and Community Care, Events, Inspection Services, Community Centre Management, Moverly Children's Centre, ordinance inspectors, parking patroland the Environmental Sustaining our City program.
GOVERNANCE and FINANCIAL SERVICESCorporate Governance, Financial Management, Corporate Information Systems, InsuranceCoordination, Stores Management, Contracts, Public Office and Meeting Support, Customer Service Centre,Call Centre and Property Management.
OFFICE OF THE GENERAL MANAGEROverall Council Management including General Management, Internal Audit, Corporate Improvement, Risk Management, Workplace Health and Safety, Organisational Staff Services and Communications.
GOVERNANCECosts relating to the Council’s role as a component of democratic government, including elections, members feesand expenses, subscriptions to local authority associations, meetings of council and policy making committees,area representation and public disclosure and compliance, together with related administration costs.
page 26

Financial Statements 2014
Randwick City Council
Notes to the Financial Statements for the financial year ended 30 June 2014
Note 3. Income from Continuing Operations
$ '000
(a) Rates & Annual Charges
Ordinary RatesResidentialBusinessTotal Ordinary Rates
Special RatesEnvironmentalTotal Special Rates
Annual Charges (pursuant to s.496, s.496A, s.496B, s.501 & s.611)Domestic Waste Management ServicesStormwater Management ServicesSection 611 ChargesTotal Annual Charges
TOTAL RATES & ANNUAL CHARGES
Council has used 2012 year valuations provided by the NSW Valuer General in calculating its rates.
139
26,123 1,125
3,612
11,847 62,250
2014
91
2013
3,486
47,509
NotesActual
49,462 12,788
Actual
59,356
3,612 3,486
29,171
95,033 90,181
27,339
27,900 1,132
page 27

Financial Statements 2014
Randwick City Council
Notes to the Financial Statements for the financial year ended 30 June 2014
Note 3. Income from Continuing Operations (continued)
$ '000
(b) User Charges & Fees
Specific User Charges (per s.502 - Specific "actual use" charges)
Waste Management Services (non-domestic)
Total User Charges
Other User Charges & Fees(i) Fees & Charges - Statutory & Regulatory Functions (per s.608)
Alignment FeesConstruction ZonesPlanning & Building RegulationPrivate Works - Section 67Regulatory/ Statutory FeesOtherTotal Fees & Charges - Statutory/Regulatory
(ii) Fees & Charges - Other (incl. General User Charges (per s.608)
Leisure Centre FeesBus Shelter Advertising FeesChild Care Centre FeesCommunity Facilities & Park HireEnquiriesFilming PermitsGrave MaintenanceHome Maintenance ServicesLeaseback Fees - Council VehiclesLibraryMaps & CodesMicrofilm PrintsParking MetersParking Schemes & Traffic ManagementPhotocopyingRoad & Other Infrastructure ReinstatementsSale of Recycled MaterialsShrub & Tree SalesOtherTotal Fees & Charges - Other
TOTAL USER CHARGES & FEES
1,349 46 43
116 111
818 847 516
43
25 252
179
1
41 53
56
127 580 127
1
498
14,164 15,156
423
1,576
1,128 1,190
2014
1,555
2013Actual
1,190
86
-
1,128
1,553
86 428
Actual
51
535
39
419 4,962 3,678
484
1,540
3,718
109 105
3,694
10,248 9,342 124
Notes
595
637
55
35
60
165
482
1,086
305
-
page 28

Financial Statements 2014
Randwick City Council
Notes to the Financial Statements for the financial year ended 30 June 2014
Note 3. Income from Continuing Operations (continued)
$ '000
(c) Interest & Investment Revenue (incl. losses)
Interest & Dividends - Interest on Overdue Rates & Annual Charges (incl. Special Purpose Rates)
- Interest earned on Investments (interest & coupon payment income)
- Interest & Dividend Income (Other)
Fair Value Adjustments - Fair Valuation movements in Investments (at FV or Held for Trading)
- Fair Valuation movements in Cash Equivalents - unrealised gains/(losses)
- Fair Valuation movements in Investments - realised gains/(losses)
- Fair Valuation movements in Investments (Other)
TOTAL INTEREST & INVESTMENT REVENUE
Interest Revenue is attributable to:Unrestricted Investments/Financial Assets:Overdue Rates & Annual Charges (General Fund)
General Council Cash & InvestmentsRestricted Investments/Funds - External:Development Contributions - Section 94 - Section 93D Affordable HousingDomestic Waste Management operationsDomestic Waste Management operations - overdue Annual ChargesStormwater Management Operations - overdue Annual ChargesRestricted Investments/Funds - Internal:Internally Restricted AssetsTotal Interest & Investment Revenue Recognised
(d) Other Revenues
Rental Income - Other Council PropertiesFines - ParkingFines - OtherLegal Fees Recovery - OtherCommissions & Agency FeesInsurance Claim RecoveriesAquatic Centre Kiosk & Merchandise SalesMerchant Service Fee RecoveryOtherTOTAL OTHER REVENUE
3,552
2,727
52
12
95 175 (64) 234
6 2,887
12
Actual
248
8
Notes
655 140
8,059
89
144
225
31
Actual
-
2014
311
248
-
2,932
3,160
241
50
2013
311 15
88
128
3,552
-
225
1
3,160
47
2,587
2,544
76
3,920
153
2,761
50 90
50 37
4,206
651
179 8,171
1
76
page 29

Financial Statements 2014
Randwick City Council
Notes to the Financial Statements for the financial year ended 30 June 2014
Note 3. Income from Continuing Operations (continued)
$ '000
(e) Grants
General Purpose (Untied)Financial Assistance - General Component
Financial Assistance - Local Roads Component
Pensioners' Rates Subsidies - General Component
Total General Purpose
1 The Financial Assistance Grant for 13/14 reflects a one off reduction due to the fact that this grant is no longer being paid in advance by up to 50% as has occurred in previous years - it does not represent a loss of income but is instead a timing difference.
Specific PurposePensioners' Rates Subsidies: - Domestic Waste ManagementChild CareCommunity ServicesEnvironmental ProtectionLibraryParks & BeachesStreet LightingTraffic Route SubsidyTransportOtherTotal Specific PurposeTotal Grants
Grant Revenue is attributable to:- Commonwealth Funding- State Funding- Other Funding
-
Capital
- -
486
1,126
- -
- -
-
1
1
671 436
781
1,126
-
364
Capital
-
566
-
- -
13
-
-
-
-
Operating
811 2,686
-
332 -
455
-
930
-
1,126
298 -
338
6,743
6,743 227
-
930
238
465
Operating 2014
1,507
-
2,451
239
3,983
-
2013
1,106
2013
537
479
30
494
930
- 374
2,721 2,449
2
278
5,707
- -
5,707 -
3,256
-
2,760
376
374
-
3,795
2014
1,483
3,258
343
page 30

Financial Statements 2014
Randwick City Council
Notes to the Financial Statements for the financial year ended 30 June 2014
Note 3. Income from Continuing Operations (continued)
$ '000
(f) Contributions
Developer Contributions:(s93 & s94 - EP&A Act, s64 of the LGA):NilS 94 - Contributions towards amenities/servicesS 94A - Fixed Development Consent LeviesS 93D - Affordable HousingTotal Developer Contributions
Other Contributions:Community ServicesDrivewaysEx Gratia RatesParks & BeachesRoads & BridgesRMS Contributions (Regional Roads, Block Grant)
Capital DedicationsDisaster RecoveryInsurance Incentive ContributionsPaid Parental Leave SchemeInterest Free Loan for IT DevicesOtherTotal Other ContributionsTotal Contributions
TOTAL GRANTS & CONTRIBUTIONS
3,295
Capital
-
6,203
-
5,273
2014
150 -
-
- -
-
- 680
5,051
2013
1,335
-
3,938 171
- -
-
52
1,457
456 488 -
- -
Capital
246 242 47
247
-
-
3,594
2013
- -
6,177
3,767
17 -
31
Operating
- -
124
-
-
103 199
-
240
78
-
2014
14
Operating
7,836
- 226
178 15
-
-
1,352 46 37
1,093
281
1,352
452
-
105
-
142
483
7,059
75
1,093
99
page 31
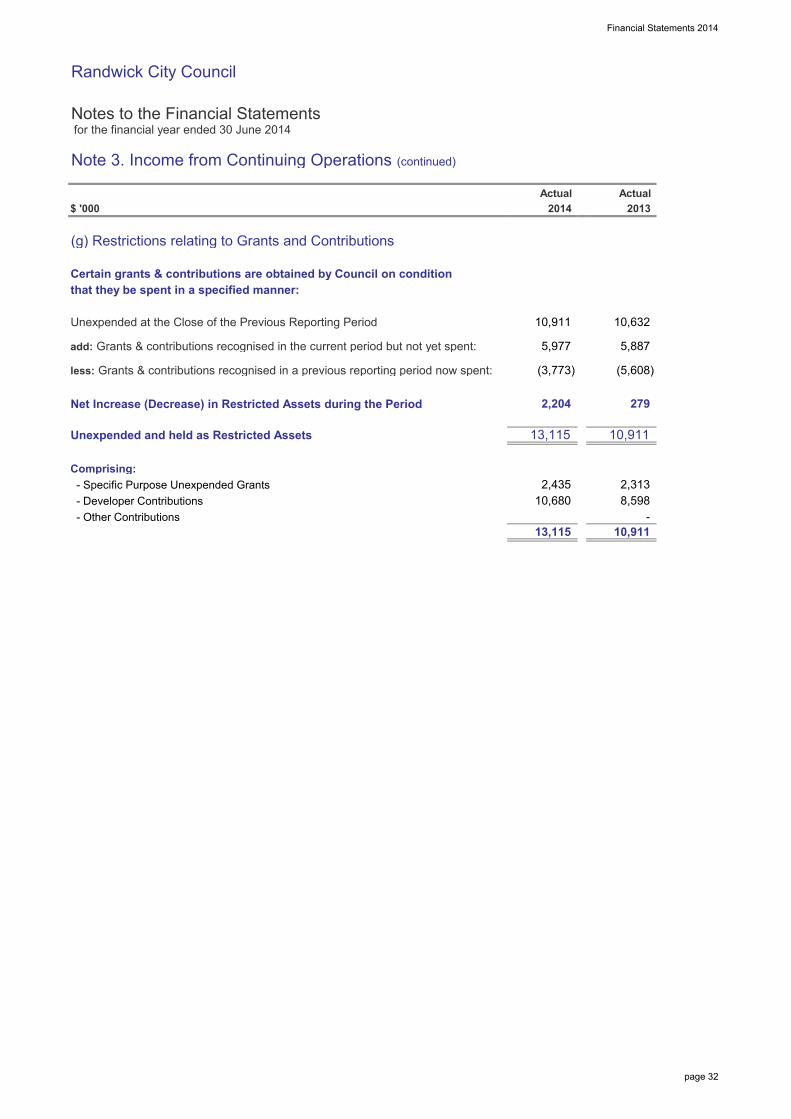
Financial Statements 2014
Randwick City Council
Notes to the Financial Statements for the financial year ended 30 June 2014
Note 3. Income from Continuing Operations (continued)
$ '000
(g) Restrictions relating to Grants and Contributions
Certain grants & contributions are obtained by Council on conditionthat they be spent in a specified manner:
Unexpended at the Close of the Previous Reporting Period
add: Grants & contributions recognised in the current period but not yet spent:
less: Grants & contributions recognised in a previous reporting period now spent:
Net Increase (Decrease) in Restricted Assets during the Period
Unexpended and held as Restricted Assets
Comprising: - Specific Purpose Unexpended Grants - Developer Contributions - Other Contributions
2,313
(5,608) (3,773)
13,115
2,204
10,911
10,911
2013
5,887
Actual
279
-
2014
10,632
Actual
10,911
8,598
5,977
2,435
13,115
10,680
page 32

Financial Statements 2014
Randwick City Council
Notes to the Financial Statements for the financial year ended 30 June 2014
Note 4. Expenses from Continuing Operations
$ '000
(a) Employee Benefits & On-Costs
Salaries and WagesEmployee Termination Costs (where material - other than vested leave paid)
TravellingEmployee Leave Entitlements (ELE)
Superannuation - Defined Contribution Plans
Superannuation - Defined Benefit Plans
Workers' Compensation InsuranceFringe Benefit Tax (FBT)
Training Costs (other than Salaries & Wages)
OtherTotal Employee Costsless: Capitalised CostsTOTAL EMPLOYEE COSTS EXPENSED
Number of "Equivalent Full Time" Employees at year end
(b) Borrowing CostsNil
611
84
39,824
2,749
50,571 (48)
361
1,255
566
50,523
Actual 2013
377
74 4
4,469
Actual
54,626
799
43,122
54,662 373
2014
522
(36)
Notes
506
933
4,780
336
3,230 1,284
2
page 33

Financial Statements 2014
Randwick City Council
Notes to the Financial Statements for the financial year ended 30 June 2014
Note 4. Expenses from Continuing Operations (continued)
$ '000
(c) Materials & Contracts
Raw Materials & ConsumablesContractor & Consultancy Costs - Garbage & Recycling Contracts - IT Managed Service Provider - Other Contractor & Consultancy CostsAuditors Remuneration (1)
Infringement Notice Contract Costs (SEINS)
Legal Expenses: - Legal Expenses: Planning & Development - Legal Expenses: OtherTotal Materials & Contractsless: Capitalised CostsTOTAL MATERIALS & CONTRACTS
1. Auditor Remuneration During the year, the following fees were incurred for services provided by the Council's Auditor (& the Auditors of other Consolidated Entities):
(i) Audit and Other Assurance Services - Audit & review of financial statements: Council's AuditorRemuneration for audit and other assurance services
$ '000
(d) Depreciation, Amortisation & Impairment
Plant and EquipmentOffice EquipmentFurniture & FittingsLand Improvements (depreciable)
Buildings - Non SpecialisedBuildings - SpecialisedInfrastructure: - Roads - Footpaths - Stormwater Drainage - Swimming Pools - Other Open Space/Recreational AssetsOther Assets - Heritage Collections - Library BooksTotal Depreciation & Impairment Costsless: Capitalised Costsless: Impairments (to)/from ARR [Equity]
TOTAL DEPRECIATION &IMPAIRMENT COSTS EXPENSED
-
344 -
15,125
22,523
59
Actual
2,570
911 266
2013
2,014
59
5
7,601
2,954
229
1,170 415
2,464
1,991
1,023
- 22,850
3,052
22,523
1,234 1,188
33,719
2014
2,134
-
-
10,485
2,969
527
31,435
1,625
6,271
1
5,773
540
13,724
31,435
552
10,912 71
- 33,719
314
7,315
- -
-
Depreciation/Amortisation Actual
9a
-
22,850
-
1,551 - - -
-
-
-
59
Actual
-
-
- -
Actual
71 71
-
-
Notes
-
-
2013
-
Impairment Costs
-
-
-
-
2013
-
-
-
-
2014
- -
7
-
172
- - -
-
-
-
341
- -
Actual
Actual
Notes 2014
628
page 34
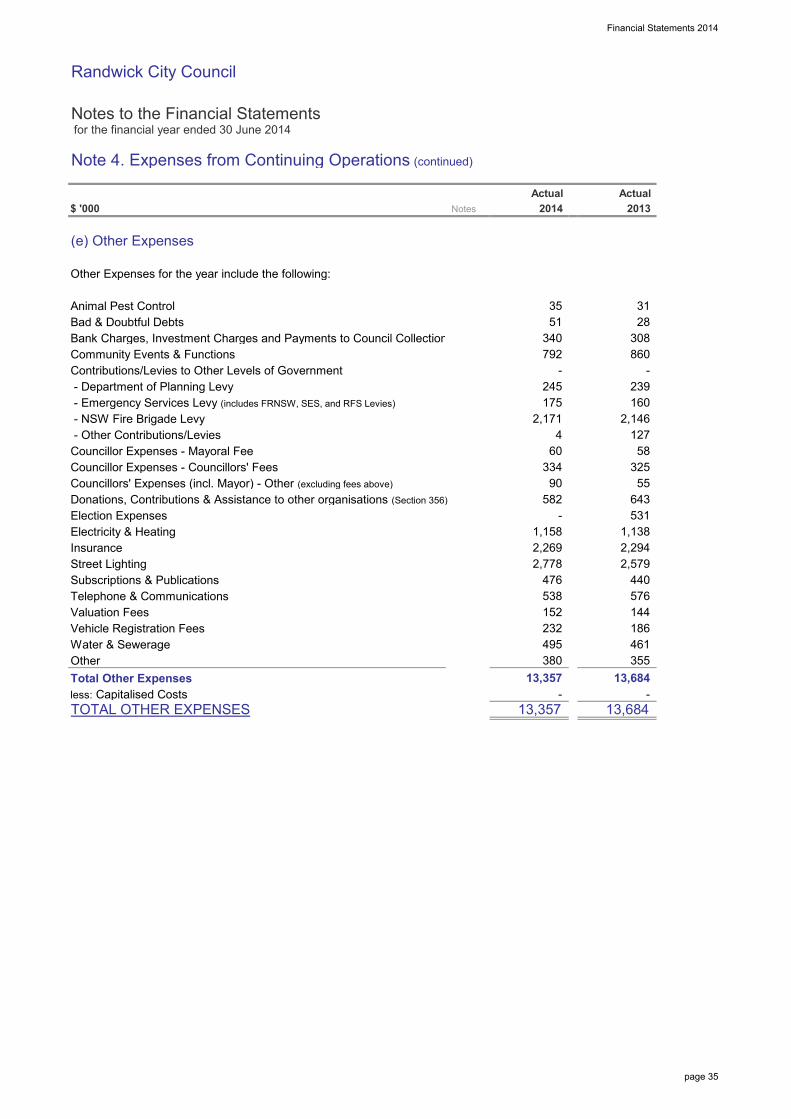
Financial Statements 2014
Randwick City Council
Notes to the Financial Statements for the financial year ended 30 June 2014
Note 4. Expenses from Continuing Operations (continued)
$ '000
(e) Other Expenses
Other Expenses for the year include the following:
Animal Pest ControlBad & Doubtful DebtsBank Charges, Investment Charges and Payments to Council CollectionCommunity Events & FunctionsContributions/Levies to Other Levels of Government - Department of Planning Levy - Emergency Services Levy (includes FRNSW, SES, and RFS Levies)
- NSW Fire Brigade Levy - Other Contributions/LeviesCouncillor Expenses - Mayoral FeeCouncillor Expenses - Councillors' FeesCouncillors' Expenses (incl. Mayor) - Other (excluding fees above)
Donations, Contributions & Assistance to other organisations (Section 356)
Election ExpensesElectricity & HeatingInsuranceStreet LightingSubscriptions & PublicationsTelephone & CommunicationsValuation FeesVehicle Registration FeesWater & SewerageOtherTotal Other Expensesless: Capitalised CostsTOTAL OTHER EXPENSES
2,146
58
-
160
325
239
13,684
643
461
152
380
576
2,294
308 792 860
2,579
538
Actual
2,171
440
28
2013
35
- 13,684
355
127
144
1,138
55
2,778
531
- 13,357
476
582
Actual
340
-
90
13,357
186
31
2,269
245
1,158
2014
175
4
-
51
60 334
495 232
Notes
page 35

Financial Statements 2014
Randwick City Council
Notes to the Financial Statements for the financial year ended 30 June 2014
Note 5. Gains or Losses from the Disposal of Assets
$ '000
Property (excl. Investment Property)Proceeds from Disposal - Propertyless: Carrying Amount of Property Assets Sold / Written OffNet Gain/(Loss) on Disposal
Plant & EquipmentProceeds from Disposal - Plant & Equipmentless: Carrying Amount of P&E Assets Sold / Written OffNet Gain/(Loss) on Disposal
InfrastructureProceeds from Disposal - Infrastructureless: Carrying Amount of Infrastructure Assets Sold / Written OffNet Gain/(Loss) on Disposal
Financial AssetsProceeds from Disposal / Redemptions / Maturities - Financial Assetsless: Carrying Amount of Financial Assets Sold / Redeemed / MaturedNet Gain/(Loss) on Disposal
NET GAIN/(LOSS) ON DISPOSAL OF ASSETS
-
-
-
72,186
-
1,538
-
(89)
(89)
20132014
(831)
-
(499)
- (72,186)
Actual
742
-
65,092 (65,092)
-
(2,037)
-
-
-
(499)
Notes
- -
Actual
page 36

Financial Statements 2014
Randwick City Council
Notes to the Financial Statements for the financial year ended 30 June 2014
Note 6a. - Cash Assets and Note 6b. - Investments
$ '000
Cash & Cash Equivalents (Note 6a)Cash on Hand and at BankCash-Equivalent Assets1
- Deposits at Call- Managed Funds- Short Term Deposits
Total Cash & Cash Equivalents
Investments (Note 6b)- Long Term Deposits- Covered Bond- NCD's, FRN's (with Maturities > 3 months)
Total InvestmentsTOTAL CASH ASSETS, CASHEQUIVALENTS & INVESTMENTS
1 Those Investments where time to maturity (from date of purchase) is < 3 mths.
Cash, Cash Equivalents & Investments wereclassified at year end in accordance withAASB 139 as follows:
Cash & Cash EquivalentsNila. "At Fair Value through the Profit & Loss"
Investmentsa. "At Fair Value through the Profit & Loss"- "Held for Trading"b. "Held to Maturity"Investments
Refer to Note 27 - Fair Value Measurement for information regarding the fair value of investments held.
-
17,487 -
-
17,487
-
4,000
13,487
-
16,000
-
2,000
32
2014Actual
- -
Actual 2013
17,487
17,487
18,000
26,700
26,700
44,700
Non Current
-
1,547
18,000
53,784 -
6(b-i)
53,784
53,784
3,129
4,059
4,090
4,090
31
Notes
2014
-
-
-
Non Current
14,655
36,000
- 18,000
-
-
-
57,874
- -
- -
-
6,121
-
6(b-ii)
19,000
2013
Current
-
- -
Actual Actual Current
page 37

Financial Statements 2014
Randwick City Council
Notes to the Financial Statements for the financial year ended 30 June 2014
Note 6b. Investments (continued)
$ '000
Note 6(b-i)Reconciliation of Investments classified as"At Fair Value through the Profit & Loss"Balance at the Beginning of the YearRevaluations (through the Income Statement)AdditionsDisposals (sales & redemptions)
Transfers from/(to) "Held to Maturity"Balance at End of Year
Comprising:- Managed Funds- Covered Bond- NCD's, FRN's (with Maturities > 3 months)- Long Term Deposits
Total
Note 6(b-ii)Reconciliation of Investmentsclassified as "Held to Maturity"Balance at the Beginning of the YearAdditionsDisposals (sales & redemptions)
Transfers between Current/Non CurrentTransfers from/(to) "At Fair Value"Balance at End of Year
Comprising:- Long Term Deposits- NCD's, FRN's (with Maturities > 3 months)
Total
-
-
-
-
-
-
Non Current
-
4,000
Actual
-
-
-
-
-
- - -
5,676
16,000
18,000
(68,013)
(22,473)
10,000
17,487
(2,000)
14,655
-
2,000 17,487
(5,001) (4,173)
-
2013
-
53,784
71,091
2014
18,000
Actual
53,473
311
-
-
3,129
-
36,000
-
(60,091)
53,784
2,000
-
-
76,013
-
(31,000)
-
-
11,987
2014
-
-
Current
-
- -
-
2013
-
-
-
17,487
-
Actual Actual Current
-
Non Current
-
-
15,984
18,000
13,487
page 38
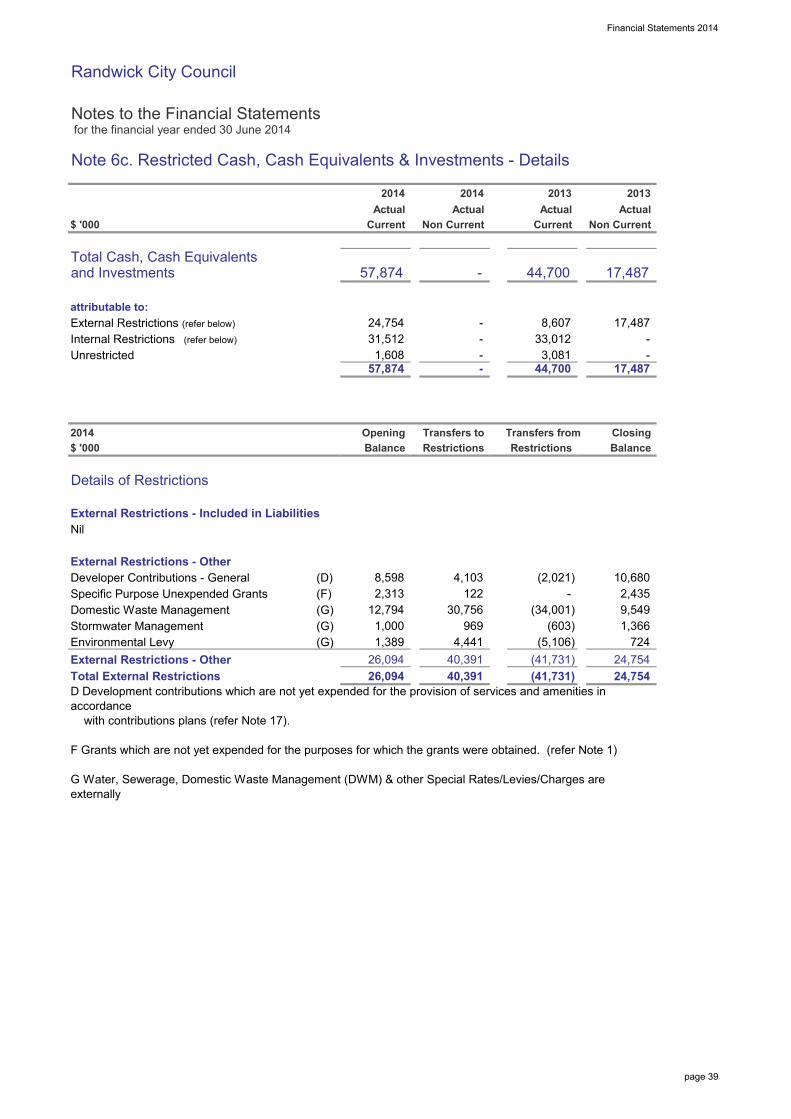
Financial Statements 2014
Randwick City Council
Notes to the Financial Statements for the financial year ended 30 June 2014
Note 6c. Restricted Cash, Cash Equivalents & Investments - Details
$ '000
Total Cash, Cash Equivalentsand Investments
attributable to:External Restrictions (refer below)
Internal Restrictions (refer below)
Unrestricted
$ '000
Details of Restrictions
External Restrictions - Included in LiabilitiesNil
External Restrictions - OtherDeveloper Contributions - General (D)Specific Purpose Unexpended Grants (F)Domestic Waste Management (G)Stormwater Management (G)Environmental Levy (G)External Restrictions - OtherTotal External Restrictions
44,700
17,487
3,081
Opening
-
Closing
-
2014
2,313
Actual
24,754
-
-
Transfers to Transfers from
8,607 31,512
Non Current
2014
(603) 9,549 1,366
30,756
724
Restrictions
24,754 (41,731) 24,754
26,094 40,391
969
26,094 D Development contributions which are not yet expended for the provision of services and amenities in accordance with contributions plans (refer Note 17).
F Grants which are not yet expended for the purposes for which the grants were obtained. (refer Note 1)
G Water, Sewerage, Domestic Waste Management (DWM) & other Special Rates/Levies/Charges are externally
(41,731)
-
8,598
-
2014
Actual
-
1,608
12,794
Current
1,000
57,874
57,874
Balance
-
Non Current
2013
Balance
1,389
(34,001)
10,680 4,103
4,441
2,435 122
40,391 (5,106)
(2,021)
2013Actual
17,487 44,700
Current Actual
17,487
Restrictions
33,012
page 39

Financial Statements 2014
Randwick City Council
Notes to the Financial Statements for the financial year ended 30 June 2014
Note 6c. Restricted Cash, Cash Equivalents & Investments - Details (continued)
$ '000
Internal RestrictionsPlant & Vehicle ReplacementEmployees Leave EntitlementCarry Over WorksDeposits, Retentions & BondsAffordable Housing Rental SchemeBuilding LevyDes Renford Aquatic Centre UpgradeElection of CouncillorsInformation TechnologyInfrastructure ReserveInsurance Claims / Risk ManagementLand AcquisitionPrince Henry CentreProperty DevelopmentRandwick Environmental ParkTown Hall/Council ChambersGIS & Online ServicesEconomic DevelopmentTotal Internal Restrictions
TOTAL RESTRICTIONS
Closing
(4,409)
6,047
Restrictions
(201) 559
260
-
(2,696)
(86)
(3,424)
(46)
2,394
77
(931)
640
1,849
-
2014
3,446
Restrictions Transfers to
285
-
-
Balance
5,118
- -
349
2,812
442
322
140 1,530
6,655 (50)
(12)
(5,996)
3,086
2,632
(1,901)
Balance
- 2,995
6,456
2,466
33,012
2,077
100
1,144
1,025
63
1,436 -
56,266
18,356
2,995
55
(19,856)
59,106
Opening
71
5,739
251
260 407
6,304
411 640
100 -
85
-
1,209
58,747
(50)
249
-
31,512
54
(54)
(61,587)
4,326
- 1,144 2,023
152
Transfers from
page 40

Financial Statements 2014
Randwick City Council
Notes to the Financial Statements for the financial year ended 30 June 2014
Note 7. Receivables
$ '000
PurposeRates & Annual ChargesInterest & Extra ChargesUser Charges & FeesCapital Debtors (being sale of assets)
- Other Asset SalesAccrued Revenues - Interest on Investments - Other Income AccrualsGovernment Grants & SubsidiesNet GST ReceivableOther DebtorsTotal
less: Provision for ImpairmentUser Charges & FeesTotal Provision for Impairment - Receivables
TOTAL NET RECEIVABLES
Externally Restricted ReceivablesDomestic Waste ManagementTotal External RestrictionsInternally Restricted ReceivablesNilUnrestricted ReceivablesTOTAL NET RECEIVABLES
Notes on Debtors above:(i) Rates & Annual Charges Outstanding are secured against the property.
(ii) Doubtful Rates Debtors are provided for where the value of the property is less than the debt outstanding. An allowance for other doubtful debts is made when there is objective evidence that a receivable is impaired.
(iii) Interest was charged on overdue rates & charges at 9.00% (2013 10.00%).Generally all other receivables are non interest bearing.
(iv) Please refer to Note 15 for issues concerning Credit Risk and Fair Value disclosures.
1,490 118
2014 2013Current Non Current
106 1,687
124
Notes
-
393 452
103
5,858
-
-
-
1,037 870
6,018
876
6,286
5,939
103 102 428
1,193 1,146
-
111
608
452 4
-
5,545
452
5,939
394 428 102
Current
(79) (79)
-
394
33
-
850
856 -
-
350
-
Non Current
341
6,316
496
(30)
372
496
6,286
(30) -
-
496
28
-
-
-
890
-
- -
542
page 41

Financial Statements 2014
Randwick City Council
Notes to the Financial Statements for the financial year ended 30 June 2014
Note 8. Inventories & Other Assets
$ '000
InventoriesStores & MaterialsTrading StockTotal Inventories
Other AssetsPrepaymentsTotal Other Assets
TOTAL INVENTORIES / OTHER ASSETS
Externally Restricted Assets
There are no restrictions applicable to the above assets.Total Unrestricted AssetsTOTAL INVENTORIES & OTHER ASSETS
Refer to Note 27 - Fair Value Measurement for information regarding the fair value of other assets held.
-
952 -
-
-
Non Current
-
2014
207
Non Current
-
2013
- 1,470 1,470
1,470
Current
897 897
Notes
- -
-
568
384 -
573
366
-
- 952
-
-
-
384
952
Current
333 235
page 42

Ran
dwic
k C
ity C
ounc
il
Not
es to
the
Fina
ncia
l Sta
tem
ents
for t
he fi
nanc
ial y
ear e
nded
30
June
201
4
Not
e 9a
. Inf
rast
ruct
ure,
Pro
perty
, Pla
nt &
Equ
ipm
ent
AtC
arry
ing
AtC
arry
ing
$ '0
00Fa
ir Va
lue
Dep
'nVa
lue
Fair
Valu
eD
ep'n
Valu
e P
lant
& E
quip
men
t20
,813
7,61
1
13,2
02
6,
274
(2,0
37)
(2,1
34)
23,0
60
7,
755
15,3
05
O
ffice
Equ
ipm
ent
19,9
22
13
,556
6,
366
2,81
4
(9
11)
22
,736
14,4
67
8,26
9
F
urni
ture
& F
ittin
gs7,
170
4,18
9
2,98
1
24
4
(266
)
7,41
4
4,
455
2,95
9
L
and:
-
Ope
ratio
nal L
and
170,
142
-
170,
142
7,
412
177,
554
-
177,
554
- C
omm
unity
Lan
d19
6,48
1
-
19
6,48
1
467
19
6,94
8
-
19
6,94
8
-
Land
und
er R
oads
(pre
1/7
/08)
-
-
-
-
-
-
-
Land
und
er R
oads
(pos
t 30/
6/08
)3,
388
-
3,
388
15
40
9
3,81
2
-
3,81
2
D
epre
ciab
le L
and
Impr
ovem
ents
11,0
84
2,
965
8,
119
374
(2
29)
5,
455
19,4
00
5,
681
13,7
19
B
uild
ings
- N
on S
peci
alis
ed78
,282
35,8
43
42,4
39
84
9
(2,5
70)
13,9
43
95
,390
40,7
29
54,6
61
B
uild
ings
- Sp
ecia
lised
112,
618
54
,014
58
,604
4,52
0
(2
,954
)
13
,954
126,
220
52
,096
74
,124
Infr
astr
uctu
re:
-
Roa
ds71
8,64
1
276,
085
442,
556
7,
370
(7,6
01)
73,9
75
83
7,65
7
321,
357
516,
300
- Fo
otpa
ths
97,8
82
25
,591
72
,291
4,67
2
(1
,234
)
(4
,810
)
93
,802
22,8
83
70,9
19
- St
orm
wat
er D
rain
age
374,
125
18
0,67
8
19
3,44
7
429
(3
,052
)
4,
479
305,
652
11
0,34
9
19
5,30
3
-
Swim
min
g Po
ols
115
28
87
19
(7
)
1,
826
3,83
4
1,
909
1,92
5
- O
ther
Ope
n Sp
ace/
Rec
reat
iona
l Ass
ets
71,1
32
18
,937
52
,195
8,84
4
(1
,551
)
(1
,407
)
77
,903
19,8
22
58,0
81
O
ther
Ass
ets:
-
Her
itage
Col
lect
ions
1,96
9
82
1,
887
511
-
2,
480
82
2,39
8
- Li
brar
y Bo
oks
5,97
3
5,
019
95
4
315
(3
41)
6,
287
5,35
9
92
8
TOTA
L IN
FRAS
TRU
CTU
RE,
PRO
PER
TY, P
LAN
T &
EQ
UIP
.
Addi
tions
to B
uild
ings
& In
frast
ruct
ure
Asse
ts a
re m
ade
up o
f Ass
et R
enew
als
($23
,192
) and
New
Ass
ets
($3,
511)
.R
enew
als
are
defin
ed a
s th
e re
plac
emen
t of e
xist
ing
asse
ts (a
s op
pose
d to
the
acqu
isiti
on o
f new
ass
ets)
.
Ref
er to
Not
e 27
- Fa
ir Va
lue
Mea
sure
men
t for
info
rmat
ion
rega
rdin
g th
e fa
ir va
lue
of o
ther
Infra
stru
ctur
e, P
rope
rty, P
lant
& E
quip
men
t.
as a
t 30/
6/20
14
Ass
et
Add
ition
s
WD
Vof
Ass
et
Dis
posa
ls
Dep
reci
atio
n E
xpen
se
Rev
alua
tion
Dec
rem
ents
to E
quity
(A
RR
)
Rev
alua
tion
Incr
emen
tsto
Equ
ity
(AR
R)
Accu
mul
ated
1,88
9,73
7
624,
598
1,
265,
139
as a
t 30/
6/20
13As
set M
ovem
ents
dur
ing
the
Rep
ortin
g Pe
riod
Accu
mul
ated
Adj
ustm
ents
& T
rans
fers
37,7
17
(2
,037
)
(22,
850)
-
(6
,217
)
121,
453
page 43
Financial Statements 2014
2,00
0,14
9
606,
944
1,
393,
205

Financial Statements 2014
Randwick City Council
Notes to the Financial Statements for the financial year ended 30 June 2014
Note 9b. Externally Restricted Infrastructure, Property, Plant & Equipment
Note 9c. Infrastructure, Property, Plant & Equipment - Current Year Impairments
Council has recognised no impairment losses during the reporting period nor reversed any prior period losses.
2013
3,620 1,443
Actual
2,177 1,443 3,620 3,015
4,176 - 2,177 1,443 - 2,177
Carrying Value
AtImpairm'tFair ValueA/Dep & Carrying
ValueCostAt
Fair ValueCost Impairm't
3,620 1,161 3,015 4,176 3,015
$ '000
Class of Asset
Domestic Waste Management
Total DWM
Actual
At A/Dep &At2014
- 1,161 TOTAL RESTRICTED I,PP&E - 4,176
Plant & Equipment1,161 -
page 44
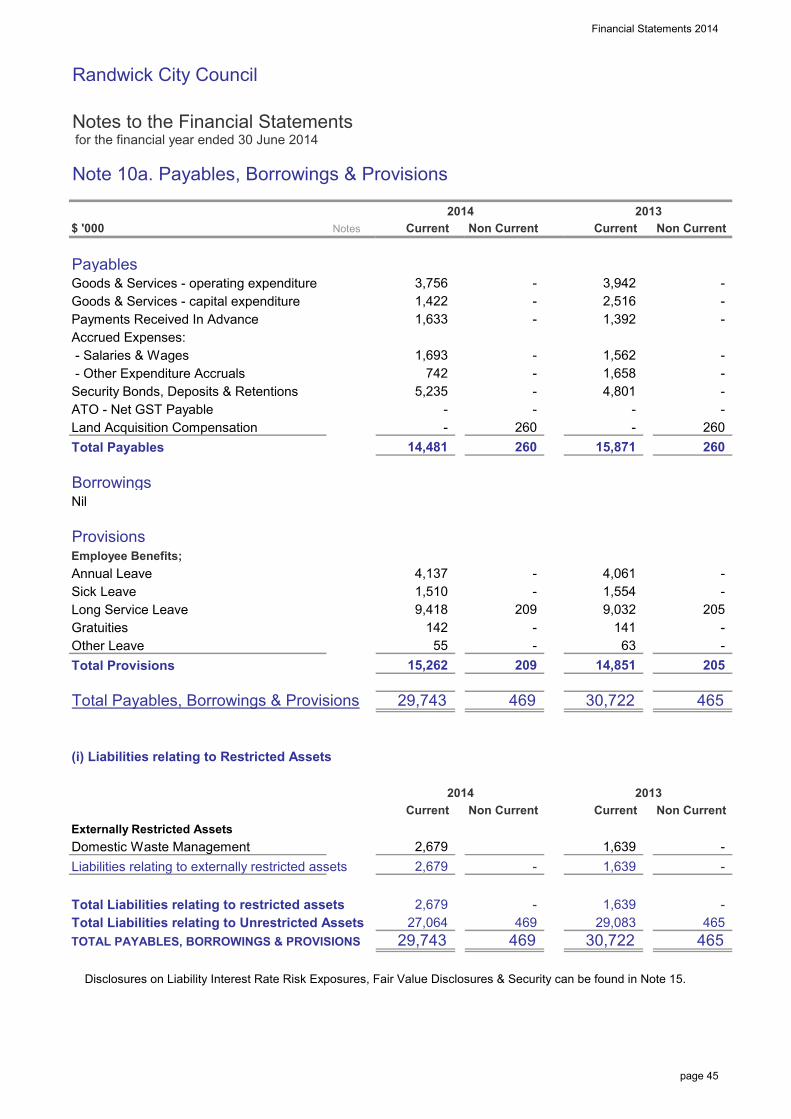
Financial Statements 2014
Randwick City Council
Notes to the Financial Statements for the financial year ended 30 June 2014
Note 10a. Payables, Borrowings & Provisions
$ '000
PayablesGoods & Services - operating expenditureGoods & Services - capital expenditurePayments Received In AdvanceAccrued Expenses: - Salaries & Wages - Other Expenditure AccrualsSecurity Bonds, Deposits & RetentionsATO - Net GST PayableLand Acquisition CompensationTotal Payables
BorrowingsNil
ProvisionsEmployee Benefits;Annual LeaveSick LeaveLong Service LeaveGratuitiesOther LeaveTotal Provisions
Total Payables, Borrowings & Provisions
(i) Liabilities relating to Restricted Assets
Externally Restricted AssetsDomestic Waste ManagementLiabilities relating to externally restricted assets
Total Liabilities relating to restricted assetsTotal Liabilities relating to Unrestricted AssetsTOTAL PAYABLES, BORROWINGS & PROVISIONS
Disclosures on Liability Interest Rate Risk Exposures, Fair Value Disclosures & Security can be found in Note 15.
29,743 469
469 465
465
1,639
469
209
-
30,722
1,639 29,083
2,679
1,554 205
- -
-
-
4,801 -
260
-
-
-
-
Non Current
4,061
-
-
209
-
Current
15,871
5,235
3,942
Non Current
2,516 -
260 -
-
260 260
-
1,392
2014
- -
-
27,064
2,679
1,693
15,262
3,756
Current
1,562
-
14,481
-
- 1,658
-
2013
29,743
205
2014
9,418 -
14,851
-
1,510
30,722 465
2,679 1,639
4,137
142
Non Current
- 141 9,032
63
Current
- 55
-
Current 2013
Non Current
1,633 1,422
-
742
-
Notes
page 45

Financial Statements 2014
Randwick City Council
Notes to the Financial Statements for the financial year ended 30 June 2014
Note 10a. Payables, Borrowings & Provisions (continued)
$ '000
(ii) Current Liabilities not anticipated to be settled within the next 12 months
The following Liabilities, even though classified as current, are not expectedto be settled in the next 12 months.
Provisions - Employees BenefitsPayables - Security Bonds, Deposits & Retentions
Note 10b. Description of and movements in Provisions
a. Gratuities represents those benefits accrued and payable and an estimate of those that will become payable in the future as a result of past service. Gratuity accrual is based on years of service up to 30 June 1996. The uncertaintyof gratuity is the employee's pay level on termination.
142
Actual
(6)
2014
-
3,833 14,144
Actual
Unused amounts reversed
2014
(6)
2013
9,440 10,311
Remeasurement effects due to
Discounting
ClosingBalance
as at 30/6/14
142 141 7 - Gratuities 141 7 TOTAL
Class of Provision Decrease due to Payments
Additional Provisions
OpeningBalance
as at 1/7/13
3,515 12,955
2013
page 46
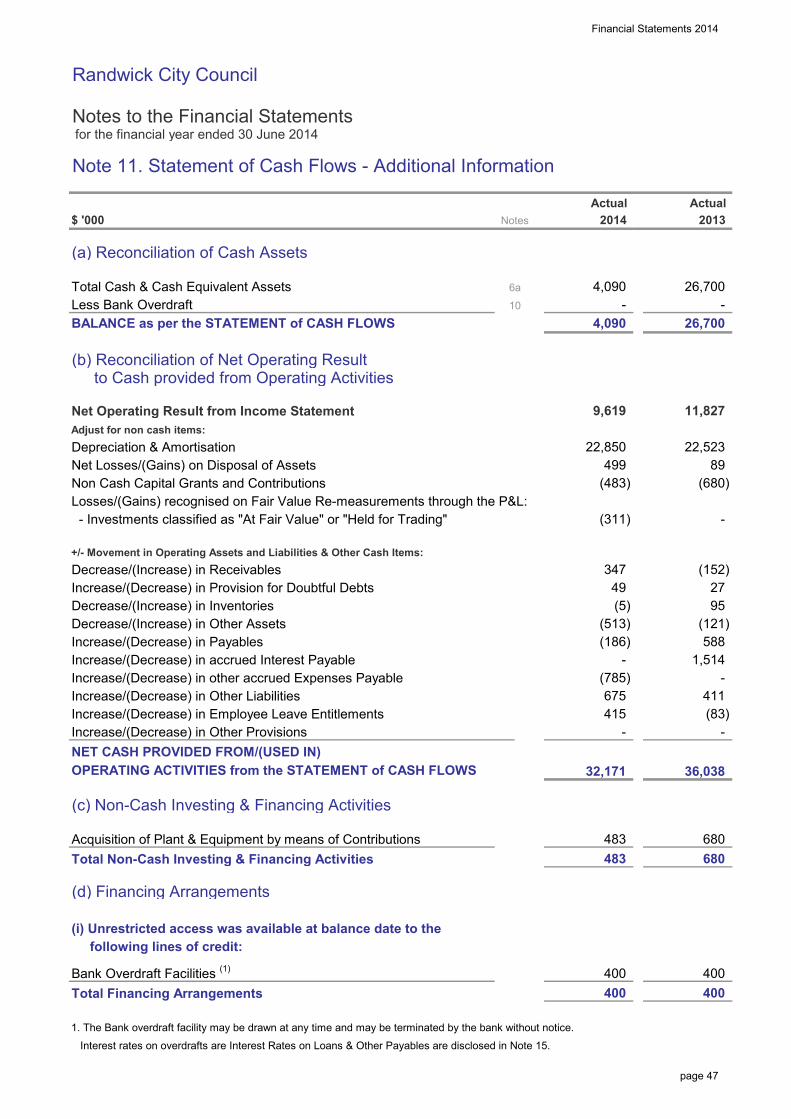
Financial Statements 2014
Randwick City Council
Notes to the Financial Statements for the financial year ended 30 June 2014
Note 11. Statement of Cash Flows - Additional Information
$ '000
(a) Reconciliation of Cash Assets
Total Cash & Cash Equivalent AssetsLess Bank OverdraftBALANCE as per the STATEMENT of CASH FLOWS
(b) Reconciliation of Net Operating Result to Cash provided from Operating Activities
Net Operating Result from Income StatementAdjust for non cash items:Depreciation & AmortisationNet Losses/(Gains) on Disposal of AssetsNon Cash Capital Grants and ContributionsLosses/(Gains) recognised on Fair Value Re-measurements through the P&L: - Investments classified as "At Fair Value" or "Held for Trading"
+/- Movement in Operating Assets and Liabilities & Other Cash Items:Decrease/(Increase) in ReceivablesIncrease/(Decrease) in Provision for Doubtful DebtsDecrease/(Increase) in InventoriesDecrease/(Increase) in Other AssetsIncrease/(Decrease) in PayablesIncrease/(Decrease) in accrued Interest PayableIncrease/(Decrease) in other accrued Expenses PayableIncrease/(Decrease) in Other LiabilitiesIncrease/(Decrease) in Employee Leave EntitlementsIncrease/(Decrease) in Other ProvisionsNET CASH PROVIDED FROM/(USED IN)OPERATING ACTIVITIES from the STATEMENT of CASH FLOWS
(c) Non-Cash Investing & Financing Activities
Acquisition of Plant & Equipment by means of ContributionsTotal Non-Cash Investing & Financing Activities
(d) Financing Arrangements
(i) Unrestricted access was available at balance date to the following lines of credit:
Bank Overdraft Facilities (1)
Total Financing Arrangements
1. The Bank overdraft facility may be drawn at any time and may be terminated by the bank without notice.
Interest rates on overdrafts are Interest Rates on Loans & Other Payables are disclosed in Note 15.
1,514
(5) (513)
26,700 -
6a
10
89
4,090
22,523
26,700 -
NotesActual
-
11,827
400
Actual 2013
411
36,038
680
-
483
(121) 588
95
499
9,619
(186)
4,090
27
(680)
49
2014
22,850
415
32,171
(785)
-
675
347
(83)
483 680
- -
(483)
400
(311)
(152)
400 400
page 47

Financial Statements 2014
Randwick City Council
Notes to the Financial Statements for the financial year ended 30 June 2014
Note 12. Commitments for Expenditure
$ '000
(a) Capital Commitments (exclusive of GST)
Capital expenditure committed for at the reporting date but notrecognised in the financial statements as liabilities:
Property, Plant & EquipmentBuildingsPlant & EquipmentOpen SpaceRoadsDrainageTotal Commitments
These expenditures are payable as follows:Within the next yearTotal Payable
Sources for Funding of Capital Commitments:Unrestricted General FundsExternally Restricted ReservesInternally Restricted ReservesTotal Sources of Funding
(b) Finance Lease Commitments
Nil
(c) Operating Lease Commitments (Non Cancellable)
Nil
(d) Investment Property Commitments
Nil
(e) Investment in Associates / Joint Ventures - Commitments
For Capital Commitments and Other Commitments relating to Investments in Associates & Joint Ventures, refer to Note 19 (b)
2,528
12,591
4,510
4,510
283
2,793
55 53
4,510
7,437
2014
4,510
9,405 3,133
12,591
Actual
2,268 966 288
1,565 1,315
Actual
106
1,927
2013
12,591
80 12,591
Notes
page 48

Financial Statements 2014
Randwick City Council
Notes to the Financial Statements for the financial year ended 30 June 2014
Note 13a(i). Statement of Performance Measurement - Indicators (Consolidated)
$ '000
Local Government Industry Indicators - Consolidated
1. Operating Performance RatioTotal continuing operating revenue (1)
(excl. Capital Grants & Contributions) - Operating ExpensesTotal continuing operating revenue (1)
(excl. Capital Grants & Contributions)
2. Own Source Operating Revenue RatioTotal continuing operating revenue (1)
(less ALL Grants & Contributions)
Total continuing operating revenue (1)
3. Unrestricted Current RatioCurrent Assets less all External Restrictions (2)
Current Liabilities less Specific Purpose Liabilities (3, 4)
4. Debt Service Cover RatioOperating Result (1) before capital excluding interestand depreciation / impairment / amortisation (EBITDA)
Principal Repayments (from the Statement of Cash Flows)
+ Borrowing Interest Costs (from the Income Statement)
5. Rates, Annual Charges, Interest & Extra Charges Outstanding PercentageRates, Annual and Extra Charges OutstandingRates, Annual and Extra Charges Collectible
6. Cash Expense Cover RatioCurrent Year's Cash and Cash Equivalentsincluding All Term DepositsPayments from cash flow of operating andfinancing activities
Notes
(1) Excludes fair value adjustments and reversal of revaluation decrements, net gain/(loss) on sale of assets and net share of interests in joint ventures.(2) Refer Notes 6-8 inclusive. Also excludes any Real Estate & Land for resale not expected to be sold in the next 12 months(3) Refer to Note 10(a).(4) Refer to Note 10(a)(ii) - excludes all payables & provisions not expected to be paid in the next 12 months (incl. ELE).
2012
97,547
5.50
87.37%
4.32
3,604 2.81%
2014
128,156
2,060
2.83
2.37%2.11%
0.00%
x129,288
40,090
2.90%
90.13%
0.00%
12,920
89.23%
2014
4.65
2.66
2.48%
0.00%
3.11 : 1
121,097 134,359
26,454 -
40,135
2013Amounts Prior Periods
4.63%
Indicator
page 49

Financial Statements 2014
Randwick City Council
Notes to the Financial Statements for the financial year ended 30 June 2014
Note 13a(ii). Local Government Industry Indicators - Graphs (Consolidated)
―― Minimum -4.00%
Source for Benchmark: NSW Treasury Corporation (T-Corp)
―― Minimum 60.00%
Source for Benchmark: NSW Treasury Corporation (T-Corp)
―― Minimum 1.50
Source for Benchmark: NSW Treasury Corporation (T-Corp)
Commentary on 2013/14 Result
Purpose of Unrestricted Current
Ratio
This ratio measures Council’s
achievement of containing operating expenditure within operating revenue.
Purpose of Own Source Operating
Revenue Ratio
To assess the adequacy of working capital and its ability to satisfy obligations in the short term for
the unrestricted activities of Council.
Randwick City Council has produced another healthy operating surplus for the financial year. Significant FAG Entitlements in previous years distort the upward trend of the Operating Performance Ratio.
This 2014 results shows the more than adequate capacity Council has to meet its current obligations. The level of current assets reflects Council's programmed and disciplined approach to funding its future works together with the structure of its investment portfolio.
2013/14 Ratio 90.13%
Commentary on 2013/14 Result
2013/14 Ratio 2.81%
2013/14 Ratio 3.11 : 1
Commentary on 2013/14 Result
Randwick City Council is continuing to become less and less reliant on external grants and contributions.
This ratio measures fiscal flexibility. It is
the degree of reliance on external funding
sources such as operating grants &
contributions.
Purpose of Operating
Performance Ratio
2.44
2.83 2.66
3.11
0.0
0.5
1.0
1.5
2.0
2.5
3.0
3.5
4.0
2011 2012 2013 2014
Ra
tio
: 1
3. Unrestricted Current Ratio
2.26% 2.90%
4.63%
2.81%
-6%
-4%
-2%
0%
2%
4%
6%
8%
2011 2012 2013 2014
Ra
tio
%
1. Operating Performance Ratio
80.69% 87.37% 89.23% 90.13%
0%
20%
40%
60%
80%
100%
120%
2011 2012 2013 2014
Ra
tio
%
2. Own Source Operating Revenue Ratio
page 50

Financial Statements 2014
Randwick City Council
Notes to the Financial Statements for the financial year ended 30 June 2014
Note 13a(ii). Local Government Industry Indicators - Graphs (Consolidated)
―― Minimum 2.00%
Source for Benchmark: NSW Treasury Corporation (T-Corp)
―― Maximum 5.00%
Source for Benchmark: NSW Office of Local Government
―― Minimum 3.00
Source for Benchmark: NSW Treasury Corporation (T-Corp)
Purpose of Cash Expense Cover
Ratio
Commentary on Result
2013/14 Ratio 4.32
This liquidity ratio indicates the number of months a Council can continue paying
for its immediate expenses without
additional cash inflow.
Purpose of Debt Service Cover Ratio
The outstanding rates are at their lowest ever levels. This high level of receivable conversion to cash has a positive impact on Council's liquidity.
Purpose of Rates & Annual Charges
Outstanding Ratio
Commentary on 2013/14 Result
2013/14 Ratio 2.11%
Randwick City Council continues to be debt free.
The level of cash Council has available is more than sufficient to meet its immediate expenses. This ratio illustrates that Council can continue to pay its immediate expenses for a period of 4.32 months before additional cashflow is required. This is well above the benchmark.
This ratio measures the availability of operating cash to
service debt including interest, principal and
lease payments
To assess the impact of uncollected rates and annual charges on Council's liquidity and the adequacy of
recovery efforts.
2013/14 Ratio 0.00%
Commentary on 2013/14 Result
2.22% 2.37% 2.48% 2.11%
0%
1%
2%
3%
4%
5%
6%
7%
2011 2012 2013 2014
Ra
tio
%
5. Rates, Annual Charges, Interest & Extra Charges Outstanding Percentage
0.00% 0.00% 0.00% 0.00%
0%
1%
1%
2%
2%
3%
3%
2011 2012 2013 2014
Ra
tio
%
4. Debt Service Cover Ratio
4.74 4.65
5.50
4.32
0.0
1.0
2.0
3.0
4.0
5.0
6.0
7.0
2011 2012 2013 2014
Ra
tio
(m
ths)
6. Cash Expense Cover Ratio
page 51

Financial Statements 2014
Randwick City Council
Notes to the Financial Statements for the financial year ended 30 June 2014
Note 14. Investment PropertiesCouncil has not classified any Land or Buildings as "Investment Properties"
Note 15. Financial Risk Management
Risk Management
Council's activities expose it to a variety of financial risks including (1) price risk, (2) credit risk, (3) liquidity riskand (4) interest rate risk.
The Council's overall risk management program focuses on the unpredictability of financial markets and seeksto minimise potential adverse effects on the financial performance of the Council.
Council does not engage in transactions expressed in foreign currencies and is therefore not subject to foreigncurrency risk.
Financial risk management is carried out by Council's Finance Section under policies approved by the Council.
A comparison by category of the carrying amounts and fair values of Council's Financial Assets & FinancialLiabilities recognised in the financial statements is presented below.
Financial AssetsCash and Cash EquivalentsInvestments - "Held for Trading" - "Designated At Fair Value on Initial Recognition" - "Held to Maturity" - "Loans & Receivables" - "Available for Sale"ReceivablesOther Financial AssetsTotal Financial Assets
Financial LiabilitiesBank OverdraftPayablesLoans / AdvancesLease LiabilitiesOther Financial LiabilitiesTotal Financial Liabilities
Fair Value is determined as follows:
- Cash & Cash Equivalents, Receivables, Payables - are estimated to be the carrying value which approximates mkt value.
- Borrowings & Held to Maturity Investments - are based upon estimated future cash flows discounted by the current market interest rates applicable to assets & liabilities with similar risk profiles, unless quoted market prices are available.
- Financial Assets classified (i) "at fair value through profit & loss" or (ii) Available for Sale - are based upon quoted market prices (in active markets for identical investments) at the reporting date or independent valuation.
Refer to Note 27 - Fair Value Measurement for information regarding the fair value of financial assets & liabilities
-
6,782 -
-
64,265
-
13,108 -
6,391
4,090
2013
-
-
-
-
-
-
14,739
26,700
35,487
14,739
6,391
13,108 14,739
-
53,784
2014
- -
13,108 -
68,969 68,969 64,265 -
14,739
26,700
-
- -
-
6,782
- -
53,784
4,090
35,487
2013
-
-
13,108
-
-
Fair Value Carrying Value 2014
page 52

Financial Statements 2014
Randwick City Council
Notes to the Financial Statements for the financial year ended 30 June 2014
Note 15. Financial Risk Management (continued)
$ '000
(a) Cash & Cash Equivalents, Financial assets 'at fair value through the profit & Loss' "Available-for-sale" financial assets & "Held-to-maturity" Investments
Council's objective is to maximise its return on cash & investments whilst maintaining an adequate level ofliquidity and preserving capital.
Council's Finance area manages the Cash & Investments portfolio with the assistance of independent advisors.
Council has an Investment Policy which complies with the Local Government Act & Minister's Investment Order.This Policy is regularly reviewed by Council and it's staff and an Investment Report is tabled before Council ona monthly basis setting out the portfolio breakup and its performance.
The risks associated with the investments held are:
- Price Risk - the risk that the capital value of Investments may fluctuate due to changes in market prices, whether there changes are caused by factors specific to individual financial instruments or their issuers or are caused by factors affecting similar instruments traded in a market.
- Interest Rate Risk - the risk that movements in interest rates could affect returns and income.
- Credit Risk - the risk that the investment counterparty) will not complete their obligations particular to a financial instrument, resulting in a financial loss to Council - be it of a capital or income nature.
Council manages these risks (amongst other measures) by diversifying its portfolio and only purchasinginvestments with high credit ratings or capital guarantees.
Council also seeks advice from independent advisers before placing any funds in Cash Equivalents &Investments.
The following represents a summary of the sensitivity of Council's Income Statement and Accumulated Surplus(for the reporting period) due to a change in either the price of a financial asset or the interest rates applicable.
It is assumed that the change in interest rates would have been constant throughout the reporting period.
2014Possible impact of a 10% movement in Market ValuesPossible impact of a 1% movement in Interest Rates
2013Possible impact of a 10% movement in Market ValuesPossible impact of a 1% movement in Interest Rates
(178)
Increase of Values/Rates
155
(41)
267 (155) (155)
178 (41)
267 (267)
(178) 41 41
178 Equity
(267)
Profit Decrease of Values/Rates
Equity Profit
155
page 53

Financial Statements 2014
Randwick City Council
Notes to the Financial Statements for the financial year ended 30 June 2014
Note 15. Financial Risk Management (continued)
(b) Receivables
Council's major receivables comprise (i) Rates & Annual charges and (ii) User Charges & Fees.
The major risk associated with these receivables is credit risk - the risk that debts due and payable to Councilmay not be repaid in full.
Council manages this risk by monitoring outstanding debt and employing stringent debt recovery procedures.It also encourages ratepayers to pay their rates by the due date through incentives.
Credit risk on rates and annual charges is minimised by the ability of Council to secure a charge over the landrelating to the debts - that is, the land can be sold to recover the debt. Council is also able to charge intereston overdue rates & annual charges at higher than market rates which further encourages the payment of debt.
Council makes suitable provision for doubtful receivables as required.
There are no material receivables that have been subjected to a re-negotiation of repayment terms.
A profile of Council's receivables credit risk at balance date follows:
(i) Ageing of Receivables - %Current (not yet overdue)Overdue
(ii) Ageing of Receivables - valueCurrent (not yet overdue)Past due by up to 30 daysPast due between 31 and 60 daysPast due between 61 and 90 daysOverdue
(iii) Movement in Provision for Impairment of ReceivablesBalance at the beginning of the year+ new provisions recognised during the year- amounts already provided for & written off this year- amounts provided for but recovered during the year- previous impairment losses reversedBalance at the end of the year
1,359 4,753
2,059
79
4,639
100%
0%
Other Rates & Rates &
2014
0%
3
100%
-
2013
76%
Receivables Annual
Receivables Charges Charges
71%
2014 2013
3,527
79
1,831
29%100%
3,394
20132014
1,112
24%100%
100%
Annual Other
100%
-
1,831
30
27
2,059
page 54

Financial Statements 2014
Randwick City Council
Notes to the Financial Statements for the financial year ended 30 June 2014
Note 15. Financial Risk Management (continued)
(c) Payables & Borrowings
Payables & Borrowings are both subject to liquidity risk - the risk that insufficient funds may be on hand to meetpayment obligations as and when they fall due.
Council manages this risk by monitoring its cash flow requirements and liquidity levels and maintaining anadequate cash buffer.
Payment terms can (in extenuating circumstances) also be extended & overdraft facilities utilised as required.
The contractual undiscounted cash outflows (ie. principal and interest) of Council's Payables & Borrowings areset out in the maturity table below:
$ '000
Bank OverdraftTrade/Other PayablesLoans & AdvancesLease LiabilitiesTotal Financial Liabilities
Bank OverdraftTrade/Other PayablesLoans & AdvancesLease LiabilitiesTotal Financial Liabilities
Borrowings are also subject to interest rate risk - the risk that movements in interest rates could adverselyaffect funding costs & debt servicing requirements. Council manages this risk through the diversification ofborrowing types, maturities & interest rate structures.
The following interest rates were applicableto Council's Borrowings at balance date:
Bank OverdraftTrade/Other PayablesLoans & Advances - Fixed Interest RateLoans & Advances - Variable Interest RateLease Liabilities
10.0%
2014
-
-
-
13,108
-
-
-
-
14,739
Total
14,739
- 14,739
-
13,108
-
2-3 Yrs 4-5 YrsCarrying
14,739
-
-
3-4 Yrs
Actual
Outflows
13,108
Value
13,108
-
-
-
-
-
13,108
-
2013
2014-
Cash
7,873
payable in:Subject
to no1-2 Yrs Values
- 13,108
5,235
maturity
-
≤ 1 Year
-
14,739 -
-
- -
-
-
Value
2013Carrying
14,739
-
-
-
Average
-
-
0.0%
10.0%
Interest RateInterest RateCarrying Average
-
-
-
-
4,801
4,801 9,938
- -
- 9,938
-
- -
-
7,873 5,235
- -
-
-
-
-
> 5 Yrs
-
-
-
-
-
page 55

Financial Statements 2014
Randwick City Council
Notes to the Financial Statements for the financial year ended 30 June 2014
Note 16. Material Budget Variations
Council's Original Financial Budget for 13/14 was adopted by the Council on 25 June 2013.
While the Income Statement included in this General Purpose Financial Report must disclose the OriginalBudget adopted by Council, the Local Government Act requires Council to review its Financial Budget on aQuarterly Basis, so that it is able to manage the various variations between actuals versus budget thatinvariably occur throughout the year.
This Note sets out the details of MATERIAL VARIATIONS between Council's Original Budget and its Actualresults for the year as per the Income Statement - even though such variations may have been adjusted forduring each Quarterly Budget Review.
Note that for Variations* of Budget to Actual :Material Variations represent those variances that amount to 10% or more of the original budgeted figure.F = Favourable Budget Variation, U = Unfavourable Budget Variation
$ '000
REVENUESRates & Annual Charges
User Charges & Fees
Interest & Investment RevenueCouncil's cash reserves were high during a large proportion of the year resulting in higher revenue yields. Council's investments were also performing well which also contributed to the higher than budgeted amounts. Council has a conservative approach to investment income budgeting.
Other Revenues
Operating Grants & ContributionsCouncil receives various operating Grants and Contributions for a variety of activities that it does not originallybudget for. During 2013-14 Council received two large grants for the Waste Less Recycle More Initiatives and the Waste and Sustainability Improvement Program. These two grants totalled over $1 million.
Capital Grants & ContributionsEach year Council receives section 94 contributions relating to developments. The high levels of contributions receives during the financial year was not anticipated when the original budget was developed.
Net Gains from Disposal of AssetsCouncil does not budget for the Net Loss or Gain made from the disposal of its assets. These gain or lossesresult from a movement in their written down value which is a non-cash item. Council only budgets forthe cash proceeds received from the sale of the asset.
U
F
(1,679) (100%)
804 13%
8,059
F
324
F5,408
1,679
6,255
-
15%6,203
7,059
4%
795
F7,735
F
3,160
95,033 94,165
4%14,642 15,156
Actual
1%
514
2014
F
629 25%
2014Budget
2014---------- Variance* ----------
868
2,531
page 56

Financial Statements 2014
Randwick City Council
Notes to the Financial Statements for the financial year ended 30 June 2014
Note 16. Material Budget Variations (continued)
$ '000
EXPENSESEmployee Benefits & On-Costs
Borrowing Costs
Materials & Contracts
Depreciation & Amortisation
Impairment Expenses
Other Expenses
Net Losses from Disposal of AssetsCouncil does not budget for the Net Loss or Gain made from the disposal of its assets. These gain or lossesresult from a movement in their written down value which is a non-cash item. Council only budgets for the cash proceeds received from the sale of the asset.
F
132
-
13,357
-
1%
U499
33,719
0%
0%(499)
22,371 U22,850
U
-
2014
- -
0%
(5%)32,102
-
Budget
52,976
2014
13,489 F
(1,617)
(1,650) 54,626
Actual2014
U
(2%)(479)
---------- Variance* ----------
(3%)
- F
page 57

Ran
dwic
k C
ity C
ounc
il
Not
es to
the
Fina
ncia
l Sta
tem
ents
for t
he fi
nanc
ial y
ear e
nded
30
June
201
4
Not
e 17
. Sta
tem
ent o
f Dev
elop
er C
ontri
butio
ns
$ '0
00
Cou
ncil
reco
vers
con
tribu
tions
, rai
ses
levi
es &
ent
ers
into
pla
nnin
g ag
reem
ents
on
deve
lopm
ent w
orks
that
are
sub
ject
to a
dev
elop
men
t con
sent
issu
ed b
y C
ounc
il.A
ll co
ntrib
utio
ns m
ust b
e sp
ent/u
tilis
ed fo
r the
spe
cific
pur
pose
they
wer
e le
vied
and
any
inte
rest
app
licab
le to
uns
pent
fund
s m
ust b
e at
tribu
ted
to re
mai
ning
fund
s.
The
follo
win
g ta
bles
det
ail t
he re
ceip
t, in
tere
st a
nd u
se o
f the
abo
ve c
ontri
butio
ns &
levi
es a
nd th
e va
lue
of a
ll re
mai
ning
fund
s w
hich
are
"res
trict
ed" i
n th
eir f
utur
e us
e.
SUM
MAR
Y O
F C
ON
TRIB
UTI
ON
S &
LEV
IES
page 58
Financial Statements 2014
12
2,
294
8,59
8
3,76
7
2,11
1
Expe
nditu
reea
rned
durin
gC
ash
Year
Non
Cas
h
171
-
PUR
POSE
Ope
ning
Bal
ance
Con
trib
utio
nsre
ceiv
ed d
urin
g th
e Ye
arIn
tere
st
-
153
-
(2,0
21)
165
15
3
Hel
d as
(2,0
21)
Inte
rnal
Res
tric
ted
(to)/f
rom
in Y
ear
8,38
6
-
-
-
-
-
(2,0
21)
6,48
7
-
-
S93
D C
ontri
butio
ns (A
fford
able
Hou
sing
)
Tota
l S94
Rev
enue
Und
er P
lans
Tota
l Con
trib
utio
ns
S94A
Lev
ies
- und
er a
Pla
n
-
6,48
7
S94
not
und
er P
lans
3,76
7
-
3,93
8
(30,
451)
(30,
451)
-
10,6
80
-
Asse
tB
orro
win
g
22,0
65
-
8,38
6
-
-
22,0
65
(3
0,45
1)
-
Exp still
Inte
rnal
Ove
r or
outs
tand
ing
Bor
row
ings
(und
er)
Cum
ulat
ive
Proj
ectio
ns
due/
(pay
able
)
Futu
rein
com
eFu
ndin
g
-
-
-
-
22
,065
-

Financial Statements 2014
Randwick City Council
Notes to the Financial Statements for the financial year ended 30 June 2014
Note 18. Contingencies & Other Assets/Liabilities Not Recognised
$ '000
The following assets and liabilities do not qualify for (ii) Statewide Limitedrecognition in the Statement of Financial Position, buttheir knowledge & disclosure is considered relevant Council is a member of Statewide Mutual, a mutualto the users of Council's Financial Report. pool scheme providing liability insurance to Local
Government.
LIABILITIES NOT RECOGNISED: Membership includes the potential to share in eitherthe net assets or liabilities of the fund depending on
1. Guarantees its past performance. Council’s share of the NetAssets or Liabilities reflects Councils contributions to
(i) Defined Benefit Superannuation the pool and the result of insurance claims within Contribution Plans each of the Fund Years.
Council participates in an employer sponsored The future realisation and finalisation of claimsDefined Benefit Superannuation Scheme, and makes incurred but not reported to 30/6 this year may resultcontributions as determined by the Superannuation in future liabilities or benefits as a result of pastScheme's Trustees. events that Council will be required to fund or share
in respectively.Member Councils bear responsibility of ensuring thereare sufficient funds available to pay out the required (iii) StateCover Limitedbenefits as they fall due.
Council is a member of StateCover Mutual LimitedThe Schemes most recent full actuarial review and holds a partly paid share in the entity.indicated that the Net Assets of the Scheme werenot sufficient to meet the accrued benefits of the StateCover is a company providing workersSchemes Defined Benefit member category with compensation insurance cover to the NSW Localmember Councils required to make significantly Government Industry and specifically Council.higher contributions in future years.
Council has a contingent liability to contribute furtherThe Local Government Superannuation Scheme equity in the event of the erosion of the Company'showever is unable to provide Council with an accurate capital base as a result of the company's pastestimate of its share of the net deficit and accordingly performance and/or claims experience or as a resultCouncil has not recorded any net liability from it's of any increased prudential requirements from APRA.Defined Benefit Scheme obligations in accordancewith AASB 119. These future equity contributions would be required
to maintain the company’s minimum level of NetFuture contributions made to the defined benefit Assets in accordance with its Licence Requirements.scheme to rectify the net deficit position will berecognised as an expense when they become (iv) Other Guaranteespayable - similar to the accounting for DefinedContributions Plans. Council has provided no other Guarantees other than
those listed above.
page 59
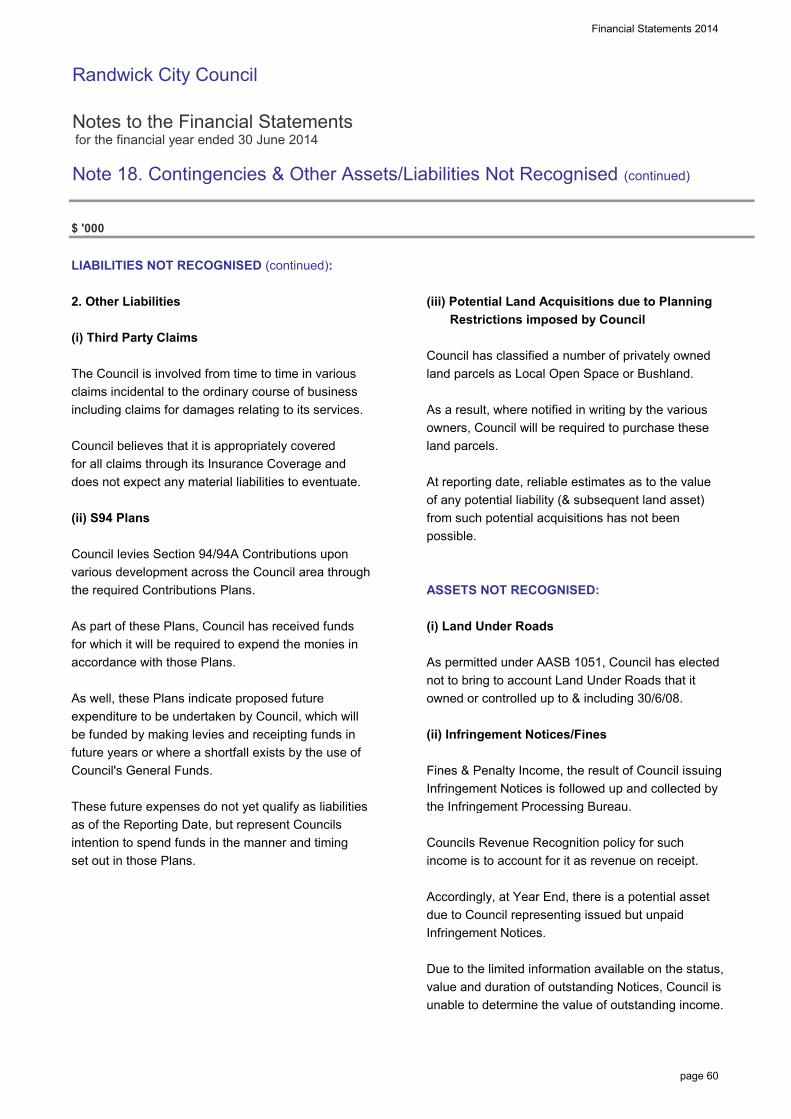
Financial Statements 2014
Randwick City Council
Notes to the Financial Statements for the financial year ended 30 June 2014
Note 18. Contingencies & Other Assets/Liabilities Not Recognised (continued)
$ '000
LIABILITIES NOT RECOGNISED (continued):
2. Other Liabilities (iii) Potential Land Acquisitions due to Planning Restrictions imposed by Council
(i) Third Party ClaimsCouncil has classified a number of privately owned
The Council is involved from time to time in various land parcels as Local Open Space or Bushland.claims incidental to the ordinary course of businessincluding claims for damages relating to its services. As a result, where notified in writing by the various
owners, Council will be required to purchase theseCouncil believes that it is appropriately covered land parcels.for all claims through its Insurance Coverage anddoes not expect any material liabilities to eventuate. At reporting date, reliable estimates as to the value
of any potential liability (& subsequent land asset)(ii) S94 Plans from such potential acquisitions has not been
possible.Council levies Section 94/94A Contributions uponvarious development across the Council area throughthe required Contributions Plans. ASSETS NOT RECOGNISED:
As part of these Plans, Council has received funds (i) Land Under Roadsfor which it will be required to expend the monies inaccordance with those Plans. As permitted under AASB 1051, Council has elected
not to bring to account Land Under Roads that itAs well, these Plans indicate proposed future owned or controlled up to & including 30/6/08.expenditure to be undertaken by Council, which willbe funded by making levies and receipting funds in (ii) Infringement Notices/Finesfuture years or where a shortfall exists by the use ofCouncil's General Funds. Fines & Penalty Income, the result of Council issuing
Infringement Notices is followed up and collected byThese future expenses do not yet qualify as liabilities the Infringement Processing Bureau.as of the Reporting Date, but represent Councilsintention to spend funds in the manner and timing Councils Revenue Recognition policy for suchset out in those Plans. income is to account for it as revenue on receipt.
Accordingly, at Year End, there is a potential assetdue to Council representing issued but unpaidInfringement Notices.
Due to the limited information available on the status,value and duration of outstanding Notices, Council isunable to determine the value of outstanding income.
page 60

Financial Statements 2014
Randwick City Council
Notes to the Financial Statements for the financial year ended 30 June 2014
Note 19. Controlled Entities, Associated Entities & Interests in Joint Ventures
$ '000
Council's objectives can and in some cases are best met through the use of separate entities & operations.
These operations and entities range from 100% ownership and control through to lower levels of ownershipand control via co-operative arrangements with other Councils, Bodies and other Outside Organisations.
The accounting and reporting for these various entities, operations and arrangements varies in accordancewith accounting standards, depending on the level of Councils (i) interest and (ii) control and the type (form) ofentity/operation, as follows;
Subsidiaries Note 19(a)Operational Arrangements where Councils Control (but not necessarily Interest) exceeds 50%
Associated Entities & Joint Venture Entities Note 19(b) (i)&(ii)Arrangements in the form of a Separate Entity that deploys the resources of the operation itself.Under Associated Entities, Council significantly influences the operations (but does not controlthem, whilst for JV Entities, Council Jointly Controls the Operations with other parties.
Joint Venture Operations Note 19(c)Arrangements that do not comprise an actual individual entity which can deploy the resourcesof the individual participants. Under JV Operations, Council Jointly Controls the operations withthe Other Parties involved.
Subsidiaries, Associated Entities and Joint Ventures Not Recognised Note 19(d)
Accounting Recognition:
(i) Subsidiaries disclosed under Note 19(a), and Joint Venture Operations disclosed at Note 19(c), are accounted for on a Line by Line Consolidation basis within the Income Statement and Statement of Financial Position.
(ii) Associated Entities and Joint Venture Entities as per Notes 19(b)(i) & (ii) are accounted for using the Equity Accounting Method - and are disclosed as a 1 line entry in both the Income Statement and Statement of Financial Position.
Associated EntitiesJoint Venture EntitiesTotal
Council's Share of Net Assets
7
Actual2013
- 7
Council's Share of Net Income Actual
- 7
Actual Actual
- 7
2013 2014
-
2014
- -
page 61

Financial Statements 2014
Randwick City Council
Notes to the Financial Statements for the financial year ended 30 June 2014
Note 19. Controlled Entities, Associated Entities & Interests in Joint Ventures
$ '000
(a) Subsidiaries (ie. Entities & Operations controlled by Council)
Council has no interest in any Subsidiaries.
(b) Associated Entities & Joint Venture Entities
(i) ASSOCIATED ENTITIES
(a) Net Carrying Amounts - Council's Share
Name of Entity
Total Carrying Amounts - Associated Entities
(b) Relevant Interests
Name of Entity
(c) Movement in Carrying Amounts of Council's Equity Interest
Opening BalanceCouncil's Equity Share in the Associated Entity
(d) Summarised Financial Information of Associated Entities - Council's Share
Premsure(in "wind down" mode)
-
Net Assets Revenues- 12 - - 12
Liabilities12
19 2013
Totals
Premsure (in "wind down" mode)7 Totals 19
Assets
12 19 Premsure (in "wind down" mode)2014
19 Assets
Liabilities
7
7
OutputsInterest inInterest inOwnership Voting Power
2014
2013 2013
20137
6%Premsure (in "wind down" mode)2014 2014 20132014
Premsure (in "wind down" mode)
Revenues ProfitNet Assets
Principal Activity7 7
6%
- -
6%
2013
7
Proportion of
7 7
2014
Profit
7
7
7
page 62
Financial Statements 2014
Randwick City Council
Notes to the Financial Statements for the financial year ended 30 June 2014
Note 19. Controlled Entities, Associated Entities & Interests in Joint Ventures
$ '000
(b) Associated Entities & Joint Venture Entities (continued)
(ii) JOINT VENTURE ENTITIES
Council has no interest in any Joint Venture Entities.
(c) Joint Venture Operations
Council has no interest in any Joint Venture Operations.
(d) Subsidiaries, Associated Entities & Joint Venture Operations Not Recognised
All Subsidiaries, Associated Entities & Joint Ventures have been recognised in this Financial Report as required.
page 63
Financial Statements 2014
Randwick City Council
Notes to the Financial Statements for the financial year ended 30 June 2014
Note 20. Equity - Retained Earnings and Revaluation Reserves
$ '000
(a) Retained Earnings
Movements in Retained Earnings were as follows:Balance at beginning of Year (from previous years audited accounts)
a. Correction of Prior Period Errorsb. Changes in Accounting Policies (prior period effects)d. Net Operating Result for the YearBalance at End of the Reporting Period
(b) Reserves
(i) Reserves are represented by:
- Infrastructure, Property, Plant & Equipment Revaluation ReserveTotal
(ii) Reconciliation of movements in Reserves:
Infrastructure, Property, Plant & Equipment Revaluation Reserve- Opening Balance- Revaluations for the year- Balance at End of Year
(iii) Nature & Purpose of Reserves
Infrastructure, Property, Plant & Equipment Revaluation Reserve- The Infrastructure, Property, Plant & Equipment Revaluation Reserve is used to record increments/decrements of Non Current Asset values due to their revaluation.
666,023 550,787
753,093
666,023
550,787
-
Actual 2014
- -
9,619
Notes
20 (c)
753,093
550,787
550,787
666,023
Actual
9(a) - 115,236
741,266
762,712
- 11,827
20 (d)
2013
550,787
page 64

Financial Statements 2014
Randwick City Council
Notes to the Financial Statements for the financial year ended 30 June 2014
Note 20. Equity - Retained Earnings and Revaluation Reserves (continued)
$ '000
(c) Correction of Error/s relating to a Previous Reporting Period
Council made no correction of errors during the current reporting period.
(d) Voluntary Changes in Accounting Policies
Council made no voluntary changes in any accounting policies during the year.
Note 21. Financial Result & Financial Position by Fund
Council utilises only a General Fund for its operations.
20132014NotesActual Actual
page 65
Financial Statements 2014
Randwick City Council
Notes to the Financial Statements for the financial year ended 30 June 2014
Note 22. "Held for Sale" Non Current Assets & Disposal Groups
Council did not classify any Non Current Assets or Disposal Groups as "Held for Sale".
Note 23. Events occurring after the Reporting Date
Events that occur between the end of the reporting period (ending 30 June 2014) and the date when the financialstatements are "authorised for issue" have been taken into account in preparing these statements.
Council has adopted the date of receipt of the Auditors' Report as the applicable "authorised for issue" daterelating to these General Purpose Financial Statements.
Accordingly, the "authorised for issue" date is 15/08/14.
Events that occur after the Reporting Period represent one of two types:
(i) Events that provide evidence of conditions that existed at the Reporting Period
These financial statements (and the figures therein) incorporate all "adjusting events" that provided evidence ofconditions that existed at 30 June 2014.
(ii) Events that provide evidence of conditions that arose after the Reporting Period
These financial statements (& figures therein) do not incorporate any "non-adjusting events" that have occurredafter 30 June 2014 and which are only indicative of conditions that arose after 30 June 2014.
Council is unaware of any material or significant "non-adjusting events" that should be disclosed.
Note 24. Discontinued Operations
Council has not classified any of its Operations as "Discontinued".
page 66

Financial Statements 2014
Randwick City Council
Notes to the Financial Statements for the financial year ended 30 June 2014
Note 25. Intangible Assets
Intangible Assets represent identifiable non-monetary asset without physical substance.
Council is unaware of any control over Intangible Assets that warrant recognition in the Financial Statements,including either internally generated and developed assets or purchased assets.
Note 26. Reinstatement, Rehabilitation & Restoration Liabilities
Council has no outstanding obligations to make, restore, rehabilitate or reinstate any of its assets/operations.
page 67

Financial Statements 2014
Randwick City Council
Notes to the Financial Statements for the financial year ended 30 June 2014
Note 27. Fair Value Measurement
$ '000
The Council measures the following asset and liability classes at fair value on a recurring basis:
- Infrastructure, Property, Plant and Equipment- Financial Assets & Liabilities
The fair value of assets and liabilities must be estimated in accordance with various Accounting Standards foreither recognition and measurement requirements or for disclosure purposes.
AASB 13 Fair Value Measurement requires all assets and liabilities measured at fair value to be assigned to a"level" in the fair value hierarchy as follows:
Level 1: Unadjusted quoted prices in active markets for identical assets or liabilities that the entity can access at the measurement date.
Level 2: Inputs other than quoted prices included within Level 1 that are observable for the asset or liability, either directly or indirectly.
Level 3: Inputs for the asset or liability that are not based on observable market data (unobservable inputs).
(1) The following table presents all assets and liabilities that have been measured & recognised at fair values:
2014
Recurring Fair Value Measurements
Financial AssetsInvestments- "Held for Trading"Total Financial Assets
Infrastructure, Property, Plant & EquipmentPlant & EquipmentOffice EquipmentFurniture & FittingsOperational LandCommunity LandLand Under RoadsDepreciable Land ImprovementsBuildings - Non SpecialisedBuildings - SpecialisedRoadsFootpathsStormwater DrainageSwimming PoolsOther Open Space/Recreational AssetsHeritage CollectionsLibrary BooksTotal Infrastructure, Property, Plant & Equipment - - 1,393,205 1,393,205
30/06/2014 195,303 195,303 30/06/2014 1,925 1,925 30/06/2014 58,081 58,081
30/06/2014 928 928 30/06/2014 2,398 2,398
30/06/2014 54,661 54,661 30/06/2014 74,124 74,124 30/06/2014 516,300 516,300 30/06/2014 70,919 70,919
30/06/2014 177,554 177,554 30/06/2014 196,948 196,948 30/06/2014 3,812 3,812 30/06/2014 13,719 13,719
30/06/2014 2,959 2,959
30/06/2014 15,305 15,305 30/06/2014 8,269 8,269
4,090 - 53,784 57,874
Valuation active mkts inputs inputs
30/06/2014 4,090 53,784 57,874
Fair Value Measurement HierarchyLevel 1 Level 2 Level 3 Total
Date Quoted Significant Significantof latest prices in observable unobservable
page 68

Financial Statements 2014_
Randwick City Council Notes to the Financial Statements for the financial year ended 30 June 2014 Note 27. Fair Value Measurement
page 69
(2) Transfers between Level 1 & Level 2 Fair Value Hierarchies During the year, there were no transfers between Level 1 and Level 2 Fair Value hierarchies for recurring fair value measurements. (3) Valuation techniques used to derive Level 2 and Level 3 Fair Values Where Council is unable to derive Fair Valuations using quoted market prices of identical assets (ie. Level 1 inputs), Council instead utilises a spread of both observable inputs (Level 2 inputs) and unobservable inputs (Level 3 inputs). The Fair Valuation techniques Council has employed while utilising Level 2 and Level 3 inputs are as follows: Financial Assets At fair value through profit and loss are represented by Floating Rate Notes, Covered Bonds and Term Deposits. Council obtains valuations from its Investment Advisor on a monthly basis and at the end of each accounting period to ensure the financial statements reflect the most up to date valuation. The valuations of Floating Rate Notes are sourced from UBS based on mid-market prices. That is, valuations are marked at the mid-point of the bid and ask prices in the secondary market. This price represents a general market value for the asset. There has been no change to the valuation techniques during the reporting period. Plant & Equipment, Office Equipment and Furniture & Fittings The purchase cost of Plant & Equipment, Office Equipment and Furniture & Fittings are taken as their fair value. There has been no change to the valuation techniques during the reporting period. Operational Land The valuation of Council's operational land was undertaken at 30 June 2014 by Scott Fullarton Valuations Pty Ltd, FAPI, Certified Practising Valuer, Registration No. VAL2144. Operational land has been valued at market value, having regard to the “highest and best use”, after identifying all elements that would be taken into account by buyers and sellers in settling the price, including but not limited to:
The land’s description and/or dimensions; Planning and other constraints on development; and The potential for alternative use.
Sale prices of comparable land parcels in close proximity were adjusted for differences in key attributes such as size and configuration. The most significant inputs into this valuation approach are price per square metre. Since extensive professional judgements were required to determine the inputs these assets were classified as having been valued using Level 3 valuation inputs. There has been no change to the valuation techniques during the reporting period. Community Land Council's community land was valued based on the Land Value (LV) provided by the Valuer-General in 2012. Where the Valuer-General did not provide LV an average unit rate based on the LV for similar community land

Financial Statements 2014_
Randwick City Council Notes to the Financial Statements for the financial year ended 30 June 2014 Note 27. Fair Value Measurement
page 70
was used, having regard to the highest and best use for the land. There has been no change to the valuation techniques during the reporting period. Land Under Roads Land Under Roads acquired post 1 July 2008 have been valued using the square meter rates of adjacent Community Land having regard to the highest and best use for the land. There has been no change to the valuation techniques during the reporting period. Buildings - Non specialised and Specialised Council's buildings were valued utilising the cost approach by Scott Fullarton Valuations Pty Ltd in June 2014. The approach estimated the replacement cost of each building and componentising of significant parts with different useful lives and taking into account a range of factors. The unit rates could be supported by market evidence (Level 2 inputs), other inputs (such as estimates of residual value, useful life and asset condition) required extensive professional judgement and impacted significantly on the final determination of fair value. As such, these assets have been valued using Level 3 inputs. There has been no change to the valuation techniques during the reporting period. Roads The roads asset class includes roads, defined as the trafficable portion of a road, between but not including the kerb and gutter. It also includes “other roads” assets including Bridges, Carparks, Kerb and Gutter, Traffic facilities and Footpaths. The ‘Cost Approach’ using Level 3 inputs was used to value the road carriageway and other road infrastructure. Valuations for the road carriageway, comprising surface, pavement and formation were based primarily on unit rates derived from the Councils schedule of rates tender. Other inputs (such as estimates pattern of consumption, residual value, asset condition and useful life) required extensive professional judgement and impacted significantly on the final determination of fair value. Additionally due to limitations in the historical records of very long lived assets there some uncertainty regarding the actual design, specifications and dimensions of some assets. There has been no change to the valuation process during the reporting period. Stormwater Drainage Assets within this class comprise pits, pipes, open channels, headwalls and various types of water quality devices. The ‘Cost Approach’ estimated the replacement cost for each asset by componentising the assets into significant parts with different useful lives and taking into account a range of factors. While the unit rates based on linear metres of certain diameter pipes and prices per pit or similar could be supported from market evidence (Level 2) other inputs (such as estimates of pattern of consumption, residual value, asset condition and useful life) required extensive professional judgement and impacted significantly on the final determination of fair value. Additionally due to limitations in the historical records of very long lived assets there is uncertainty regarding the actual design, specifications and dimensions of some assets. There has been no change to the valuation process during the reporting period.

Financial Statements 2014_
Randwick City Council Notes to the Financial Statements for the financial year ended 30 June 2014 Note 27. Fair Value Measurement
page 71
Swimming Pools Assets within this class comprise the Des Renford Leisure Centre Pools and also Councils rockpools. The indoor pool at the aquatic centre was valued by Scott Fullarton in June 2014 using the cost approach, while the outdoor pools at the aquatic centre and rockpools were valued inhouse using the cost approach by experienced Council engineers and asset management staff. The approach estimated the replacement cost for each pool by componentising its significant parts. While some elements of gross replacement values could be supported from market evidence (Level 2 input) other inputs (such as estimates of pattern of consumption, residual value, asset condition and useful life) required extensive professional judgement and impacted significantly on the final determination of fair value. There has been no change to the valuation process during the reporting period. There has been no change to the valuation process during the reporting period. Open Space Assets Assets within this class comprise Tennis Courts, Synthetic Surfaces, BBQs, Regional Sporting Facilities and Playgrounds. All assets in this class were valued in-house by experienced engineering & asset management staff. While some elements of gross replacement values could be supported from market evidence (Level 2 input) other inputs (such as estimates of pattern of consumption, residual value, asset condition and useful life) required extensive professional judgement and impacted significantly on the final determination of fair value. There has been no change to the valuation process during the reporting period. There has been no change to the valuation process during the reporting period.

Financial Statements 2014
Randwick City Council
Notes to the Financial Statements for the financial year ended 30 June 2014
Note 27. Fair Value Measurement (continued)
$ '000
(4). Fair value measurements using significant unobservable inputs (Level 3)
a. The following tables present the changes in Level 3 Fair Value Asset Classes.
Opening Balance - 1/7/12
Transfers from/(to) Level 1Transfers from/(to) Level 2
Adoption of AASB 13
Closing Balance - 30/6/13
Adoption of AASB 13Transfers from/(to) Level 1 FV hierarchyTransfers from/(to) Level 2 FV hierarchyTransfers from/(to) another asset classPurchases (GBV)Disposals (WDV)Depreciation & ImpairmentFV Gains - Other Comprehensive IncomeFV Gains - Income Statement Revaluation DecrementsRevaluation Increments
Closing Balance - 30/6/14
Financial Plant & Land DepreciableAssets Equipment Land
Improvemt Total
35,487 22,549 370,011 8,119 436,166
- - - - - - - - - -
- - - - -
35,487 22,549 370,011 8,119 436,166
- - - - - (b) - - - - - (b) - - - - -
- - - - - 83,078 9,332 482 374 93,266
(65,092) (2,037) - - (67,129) - (3,311) - (229) (3,540) - - - - -
311 - - - 311 - - - - - - - 7,821 5,455 13,276
53,784 26,533 378,314 13,719 472,350
page 72

Financial Statements 2014
Randwick City Council
Notes to the Financial Statements for the financial year ended 30 June 2014
Note 27. Fair Value Measurement (continued)
$ '000
(4). Fair value measurements using significant unobservable inputs (Level 3) (continued)
a. The following tables present the changes in Level 3 Fair Value Asset Classes. (continued)
Opening Balance - 1/7/12
Transfers from/(to) Level 1Transfers from/(to) Level 2
Adoption of AASB 13Other movement (details here)Other movement (details here)
Closing Balance - 30/6/13
Adoption of AASB 13Transfers from/(to) Level 1 FV hierarchyTransfers from/(to) Level 2 FV hierarchyTransfers from/(to) another asset classPurchases (GBV)Disposals (WDV)Depreciation & ImpairmentRevaluation DecrementsRevaluation Increments
Closing Balance - 30/6/14
864,460
- - - - - - - - - -
- - - - - -
Buidlings Infrastruc- Otherture Assets
Total
101,043 760,576 2,841 -
- - - - - - - - -
101,043 760,576 2,841 - 864,460
- - - - - (b) - - - - - (b) - - - - -
- - - - - 5,369 21,334 826 - 27,529
- - - - - (5,524) (13,445) (341) - (19,310)
- (6,217) - - (6,217) 27,897 80,280 - - 108,177
128,785 842,528 3,326 - 974,639
page 73

Financial Statements 2014
Randwick City Council
Notes to the Financial Statements for the financial year ended 30 June 2014
Note 27. Fair Value Measurement (continued)
$ '000
(4). Fair value measurements using significant unobservable inputs (Level 3) (continued)
b. Information relating to the transfers into and out of the Level 3 Fair Valuation hierarchy (as disclosed in the Table above) includes:
There are no transfers identified in the table above.
c. Significant unobservable valuation inputs used (for Level 3 asset classes) and their relationship to fair value.
The following table summarises the quantitative information relating to the significant unobservable inputs used inderiving the various Level 3 Asset Class fair values.
Financial Assets
Investments
I,PP&E
Plant & Equipment
Operational Land
Community Land
Land Under Roads
Buildings
Roads & Footpath
26,533
177,554
196,948
3,812
13,719
128,785
587,219
ClassFair
Value(30/6/14)
$'000
UnobservableInputs
Rangeof Inputs
(incl. probable)
Relationship of unobservableinputs to Fair Value
* Unit price $0.70 to $1.00Significant changes in unit price would result in significant changes to fair value measurement.
* Gross replacement cost* Remaining useful life
* Varies* 2 to 25 years
Significant changes in gross replacement value or remaining useful life would result in significant changes to fair value measurement.
* Price per square metre * $600 - $5,000 per square metre
Significant changes in price per square metre would result in significant changes to fair value measurement.
Depreciable Land Improvement
53,784
* VG value (price per square metre)
* $2 - $541 per square metre
Significant changes in price per square metre would result in significant changes to fair value measurement.
* VG value (price per square metre)
* $641 per square metre
Significant changes in price per square metre would result in significant changes to fair value measurement.
* Gross replacement cost* Asset condition* Remaining useful life
* Varies* Very Poor to Excellent* 15 - 100 years
Significant changes in gross replacement value, asset condition or remaining useful life would result in significant changes to fair value measurement.
* Gross replacement cost* Asset condition* Remaining useful life
* Varies* Very Poor to Excellent* 20 - 60 years
Significant changes in gross replacement value, asset condition or remaining useful life would result in significant changes to fair value measurement.
* Gross replacement cost* Asset condition* Remaining useful life
* Varies* Very Poor to Excellent* 25 - 100 years
Significant changes in gross replacement value, asset condition or remaining useful life would result in significant changes to fair value measurement.
page 74

Financial Statements 2014
Randwick City Council
Notes to the Financial Statements for the financial year ended 30 June 2014
Note 27. Fair Value Measurement (continued)
$ '000
(4). Fair value measurements using significant unobservable inputs (Level 3) (continued)
Stormwater Drainage
Swimming Pools
Library Books
Heritage Collections
(5). Highest and best use
All of Council's non financial assets are considered as being utilised for their highest and best use.
195,303
1,925
58,081
928
* Varies* Very Poor to Excellent* 10 - 100 years
Significant changes in gross replacement value, asset condition or remaining useful life would result in significant changes to fair value measurement.
* Gross replacement cost* Remaining useful life
* Varies* 5 years
Significant changes in gross replacement value or remaining useful life would result in significant changes to fair value measurement.
* Gross replacement cost * VariesSignificant changes in gross replacement value would result in significant changes to fair value measurement.
* Gross replacement cost* Asset condition* Remaining useful life
Other Open Space/Recreational Assets
2,398
* Gross replacement cost* Asset condition* Remaining useful life
* Varies* Very Poor to Excellent* 50 - 120 years
Significant changes in gross replacement value, asset condition or remaining useful life would result in significant changes to fair value measurement.
* Gross replacement cost* Asset condition* Remaining useful life
* Varies* Very Poor to Excellent* 60 - 100 years
Significant changes in gross replacement value, asset condition or remaining useful life would result in significant changes to fair value measurement.
page 75

Financial Statements 2014
Randwick City Council
Notes to the Financial Statements for the financial year ended 30 June 2014
Note 28. Council Information & Contact Details
Principal Place of Business:30 Frances StreetRandwick NSW 2031
Contact DetailsMailing Address: Opening Hours:30 Frances Street Mon to FriRandwick NSW 2031 8:30am to 5.00pm
Telephone: 02 9399 0999 Internet: www.randwick.nsw.gov.auFacsimile: 02 9319 1510 Email: [email protected]
Officers Elected MembersGENERAL MANAGER MAYORMr Ray Brownlee Councillor Scott Nash
RESPONSIBLE ACCOUNTING OFFICER COUNCILLORSMr Mitchel Woods Councillor Anthony Andrews (Deputy Mayor)
Councillor Noel D'SouzaPUBLIC OFFICER Councillor Geoff StevensonMr David Kelly Councillor Ted Seng
Councillor Murray MatsonAUDITORS Councillor Brendan RobertsHill Rogers Spencer Steer Councillor Kiel SmithLevel 5 1 Chifley Square Councillor Kathy NeilsonSydney NSW 2000 Councillor Lindsay Shurey
Councillor Robert BelleliCouncillor Pat GarciaCouncillor Greg Moore Councillor Tony Bowen
Other Information Councillor Harry StavrinosABN: 77 362 844 121
page 76


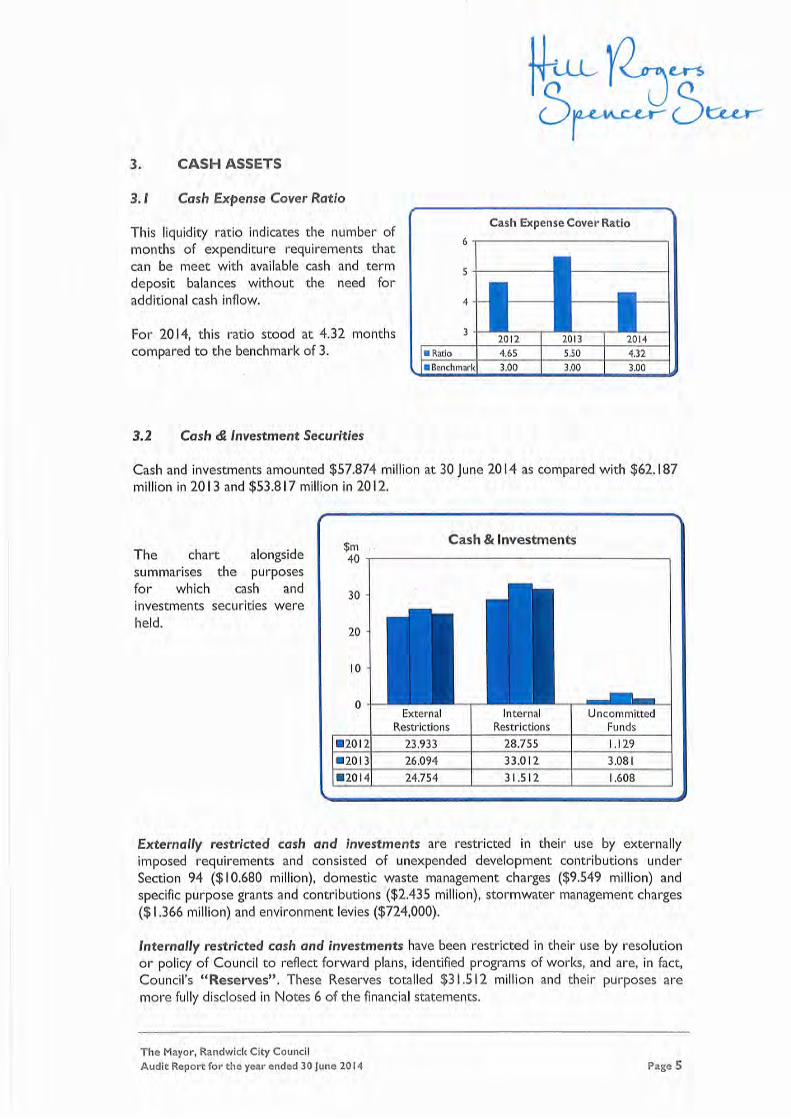


Randwick City Council SPECIAL PURPOSE FINANCIAL STATEMENTS for the year ended 30 June 2014

SPFS 2014
Randwick City Council
Special Purpose Financial Statements for the financial year ended 30 June 2014
Contents
1. Statement by Councillors & Management
2. Special Purpose Financial Statements:
Income Statement - Water Supply Business ActivityIncome Statement - Sewerage Business ActivityIncome Statement - Other Business Activities
Statement of Financial Position - Water Supply Business ActivityStatement of Financial Position - Sewerage Business ActivityStatement of Financial Position - Other Business Activities
3. Notes to the Special Purpose Financial Statements
4. Auditor's Report
Background
These Special Purpose Financial Statements have been prepared for the use by both Council and the Division ofLocal Government in fulfilling their requirements under National Competition Policy.
The principle of competitive neutrality is based on the concept of a "level playing field" between persons/entitiescompeting in a market place, particularly between private and public sector competitors.
Essentially, the principle is that government businesses, whether Commonwealth, State or Local, should operatewithout net competitive advantages over other businesses as a result of their public ownership.
For Council, the principle of competitive neutrality & public reporting applies only to declared business activities.
These include (a) those activities classified by the Australian Bureau of Statistics as business activities beingwater supply, sewerage services, abattoirs, gas production and reticulation and (b) those activities with a turnoverof over $2 million that Council has formally declared as a Business Activity (defined as Category 1 activities).
In preparing these financial statements for Council's self classified Category 1 businesses and ABS definedactivities, councils must (a) adopt a corporatisation model and (b) apply full cost attribution including tax equivalentregime payments & debt guarantee fees (where the business benefits from councils borrowing position bycomparison with commercial rates).
(iv)
9
6n/a
(i)
(ii)
13
(iii)
n/a
Page
n/an/a3
2
page 1


SPFS 2014
Randwick City Council
Income Statement of Council's Other Business Activities for the financial year ended 30 June 2014
$ '000
Income from continuing operationsUser chargesFeesGrants and contributions provided for non capital purposesTotal income from continuing operations
Expenses from continuing operationsEmployee benefits and on-costsMaterials and contractsDepreciation and impairmentCalculated taxation equivalentsOther expensesTotal expenses from continuing operationsSurplus (deficit) from Continuing Operations before capital amounts
Grants and contributions provided for capital purposesSurplus (deficit) from Continuing Operations after capital amounts
Surplus (deficit) from discontinued operationsSurplus (deficit) from ALL Operations before taxless: Corporate Taxation Equivalent (30%) [based on result before capital]
SURPLUS (DEFICIT) AFTER TAX
plus Opening Retained Profitsplus Adjustments for amounts unpaid:- Taxation equivalent paymentsadd:- Subsidy Paid/Contribution To Operationsless:- Dividend paidClosing Retained Profits
Return on Capital %Subsidy from Council
Category 1 Category 2
-402.7%
29
-547.9%301
55
403
(400) - -
8
(298)
603
-
307 366
9
37 55 18,706
(400)
(1,985)
- (1,985)
(1,985) -
9,780
649
4,673
(1,985)
-
6,658 56
(7,455)
(2,074)
- (2,074)
(2,074) -
102
(298)
682
-
-
5,358
(2,074)
649 603 5,524
-
203 112 -
6,550 175
4,476
2014Actual
2013Actual Actual
20132014
298 278 814
- 4,673
- -
203 226
762 -
211
-1.2%
Property Management Child Care Centre
9,299
855
6,876
9,780
7,762
-
-1.6%
484
(400) (298)
8 9
715
4,476 - -
Actual
516
-
1,112 319 327
(298)
1,162
-
(400) -
page 3

SPFS 2014
Randwick City Council
Income Statement of Council's Other Business Activities for the financial year ended 30 June 2014
$ '000
Income from continuing operationsUser chargesFeesGrants and contributions provided for non capital purposesOther incomeTotal income from continuing operations
Expenses from continuing operationsEmployee benefits and on-costsMaterials and contractsDepreciation and impairmentCalculated taxation equivalentsOther expensesTotal expenses from continuing operationsSurplus (deficit) from Continuing Operations before capital amounts
Grants and contributions provided for capital purposesSurplus (deficit) from Continuing Operations after capital amounts
Surplus (deficit) from discontinued operationsSurplus (deficit) from ALL Operations before taxless: Corporate Taxation Equivalent (30%) [based on result before capital]
SURPLUS (DEFICIT) AFTER TAX
plus Opening Retained Profitsplus Adjustments for amounts unpaid:- Taxation equivalent paymentsadd:- Subsidy Paid/Contribution To Operationsless:- Dividend paidClosing Retained Profits
Return on Capital %Subsidy from Council
Category 1 Category 2
(871) 360 -
1,050
(348)
(352)
390 -
(1,902)
-
245
462
2,990
-
796
(1,902)
(871)
(1,050) 7,518 5,380 1,888
173
(1,902)
1,417
(1,050)
-
30
407 3,050
-
740 355 379
655
4,399
471
-
4,330 652
313
245
-
5,616
986
- -
216
2013Actual Actual
166
2014
Community Nursery
- 3,678
2013Actual
4,961
Aquatic Centre
Actual 2014
449 305 233
-
(352)
- -
28
53
- (1,050)
- (1,050)
- (1,902)
173
(790)
- -
(348)
-
390
(352) (348)
801 819 (348) (352)
-
-
-
-
361 -128.1% -13125.0% -145.6%
1,955
-
-142.5%
-
338
357
318
- 55
404
-
page 4

SPFS 2014
Randwick City Council
Income Statement of Council's Other Business Activities for the financial year ended 30 June 2014
$ '000
Income from continuing operationsUser chargesFeesGrants and contributions provided for non capital purposesOther incomeTotal income from continuing operations
Expenses from continuing operationsEmployee benefits and on-costsMaterials and contractsDepreciation and impairmentCalculated taxation equivalentsOther expensesTotal expenses from continuing operationsSurplus (deficit) from Continuing Operations before capital amounts
Grants and contributions provided for capital purposesSurplus (deficit) from Continuing Operations after capital amounts
Surplus (deficit) from discontinued operationsSurplus (deficit) from ALL Operations before taxless: Corporate Taxation Equivalent (30%) [based on result before capital]
SURPLUS (DEFICIT) AFTER TAX
plus Opening Retained Profitsplus Adjustments for amounts unpaid:- Taxation equivalent paymentsadd:- Subsidy Paid/Contribution To Operationsless:- Dividend paidClosing Retained Profits
Return on Capital %Subsidy from Council
434
(151) (113)
-
1,128 1,210
Trade Waste
2013Actual Actual
0 Category 2
- -
2014
- -
-
(331) (474) 1,570
483 1,623
468
-
475
1,149 29 21
1,239
653 680
(331) -
(474)
- (474)
-
-
(331) -
- -
-
-
369 502
474 331 n/a n/a
(474)
(179)
-
(331)
(151)
page 5

SPFS 2014
Randwick City Council
Statement of Financial Position - Council's Other Business Activities as at 30 June 2014
$ '000
ASSETSCurrent AssetsCash and cash equivalentsInvestmentsReceivablesInventoriesOtherNon-current assets classified as held for saleTotal Current Assets
Non-Current AssetsInvestmentsReceivablesInventoriesInfrastructure, property, plant and equipmentOtherTotal Non-Current AssetsTOTAL ASSETS
LIABILITIESCurrent LiabilitiesPayablesInterest bearing liabilitiesProvisionsTotal Current Liabilities
Non-Current LiabilitiesPayablesProvisionsTotal Non-Current LiabilitiesTOTAL LIABILITIESNET ASSETS
EQUITYRetained earningsRevaluation reservesCouncil equity interestNon-controlling equity interestTOTAL EQUITY
61
-
3
55 29
13
3
43
-
55 127,395
75
9,299
162,223 -
117,615 162,223 127,395
-
-
29 -
61
-
73
-
29
-
29
-
Property Management
-
-
73
-
-
Category 1
-
Actual
- 31
Child Care Centre
Category 2
-
2014
-
2013
2
Actual 2013
55
- 46
9,780
-
127,395 162,223
80
-
74
-
-
-
- -
-
15
73
-
-
-
127,376
127,456
- - - 73
152,924
-
34 55
4
28
4 -
30
89
-
Actual
30 -
-
2
-
74
15
-
-
127,376 162,265 162,296
61
-
-
162,265
-
-
-
31 -
- -
Actual 2014
- -
2
-
- -
80
73
-
-
page 6

SPFS 2014
Randwick City Council
Statement of Financial Position - Council's Other Business Activities as at 30 June 2014
$ '000
ASSETSCurrent AssetsCash and cash equivalentsInvestmentsReceivablesInventoriesOtherTotal Current Assets
Non-Current AssetsInvestmentsReceivablesInventoriesInfrastructure, property, plant and equipmentOtherTotal Non-Current AssetsTOTAL ASSETS
LIABILITIESCurrent LiabilitiesPayablesOtherProvisionsTotal Current Liabilities
Non-Current LiabilitiesPayablesProvisionsOther LiabilitiesTotal Non-Current LiabilitiesTOTAL LIABILITIESNET ASSETS
EQUITYRetained earningsRevaluation reservesCouncil equity interestNon-controlling equity interestTOTAL EQUITY 390 (871) 360 462
4 1,047
462
2 98
462 (871)
12 15 88 922
(871) 360
360
- 360 (871)
- - - 462
-
-
- -
- - 15 12
- -
- -
- - 4 2
94 86 94 86 910 1,032
665 560 - -
1,509
367 350
51
- -
1,485 8 239
Category 2
13
- - - -
2014
- 239
209
247
241
- -
13 11
15
2013
247
226 - -
196
-
43
34 9
- -
- -
Category 1
Actual
-
Actual 2014 2013
-
Aquatic Centre
1,485
-
8
-
Community Nursery
- - -
Actual Actual
-
- -
24
-
488
-
-
390
390 -
390
-
448
-
page 7
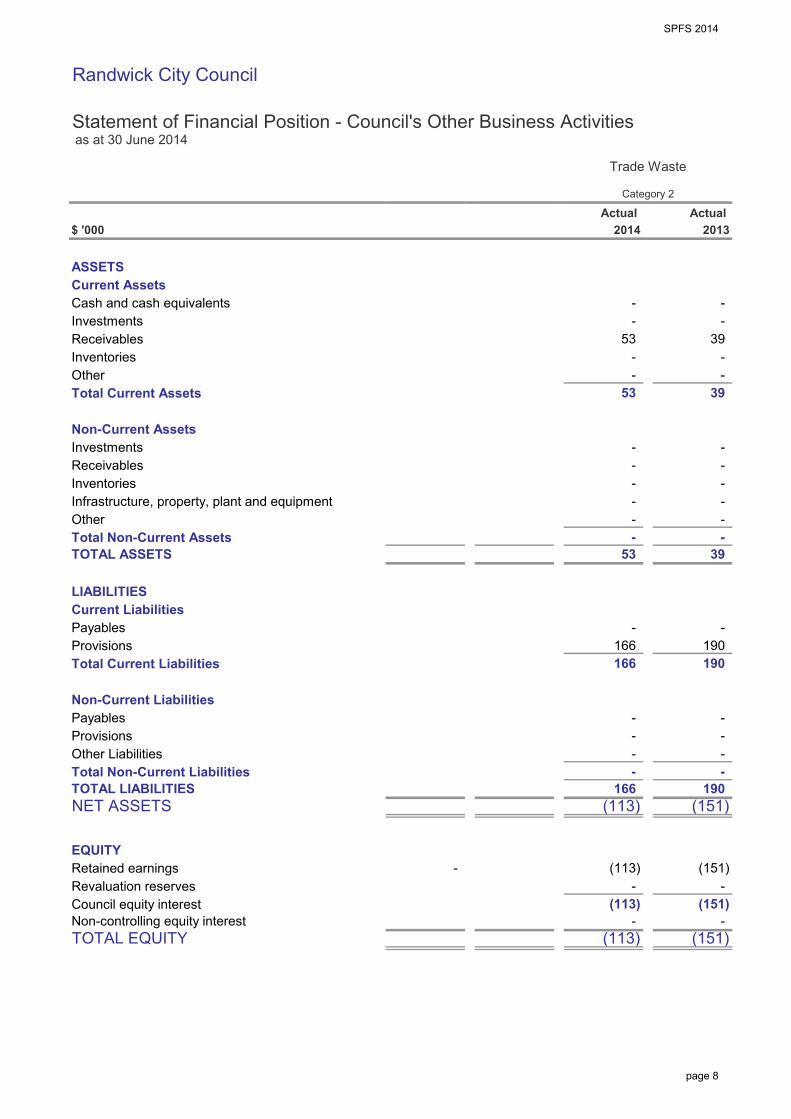
SPFS 2014
Randwick City Council
Statement of Financial Position - Council's Other Business Activities as at 30 June 2014
$ '000
ASSETSCurrent AssetsCash and cash equivalentsInvestmentsReceivablesInventoriesOtherTotal Current Assets
Non-Current AssetsInvestmentsReceivablesInventoriesInfrastructure, property, plant and equipmentOtherTotal Non-Current AssetsTOTAL ASSETS
LIABILITIESCurrent LiabilitiesPayablesProvisionsTotal Current Liabilities
Non-Current LiabilitiesPayablesProvisionsOther LiabilitiesTotal Non-Current LiabilitiesTOTAL LIABILITIESNET ASSETS
EQUITYRetained earningsRevaluation reservesCouncil equity interestNon-controlling equity interestTOTAL EQUITY
- -
- - (113) (151)
(113) (151)
166 190
- - - (113) (151)
(113) (151)
- -
- - - -
- -
166 190 166 190
- -
53 39 - -
- - - - - - - -
53 39
- - - -
- - 53 39
2014Actual Actual
Trade Waste
-
Category 2
-
2013
page 8
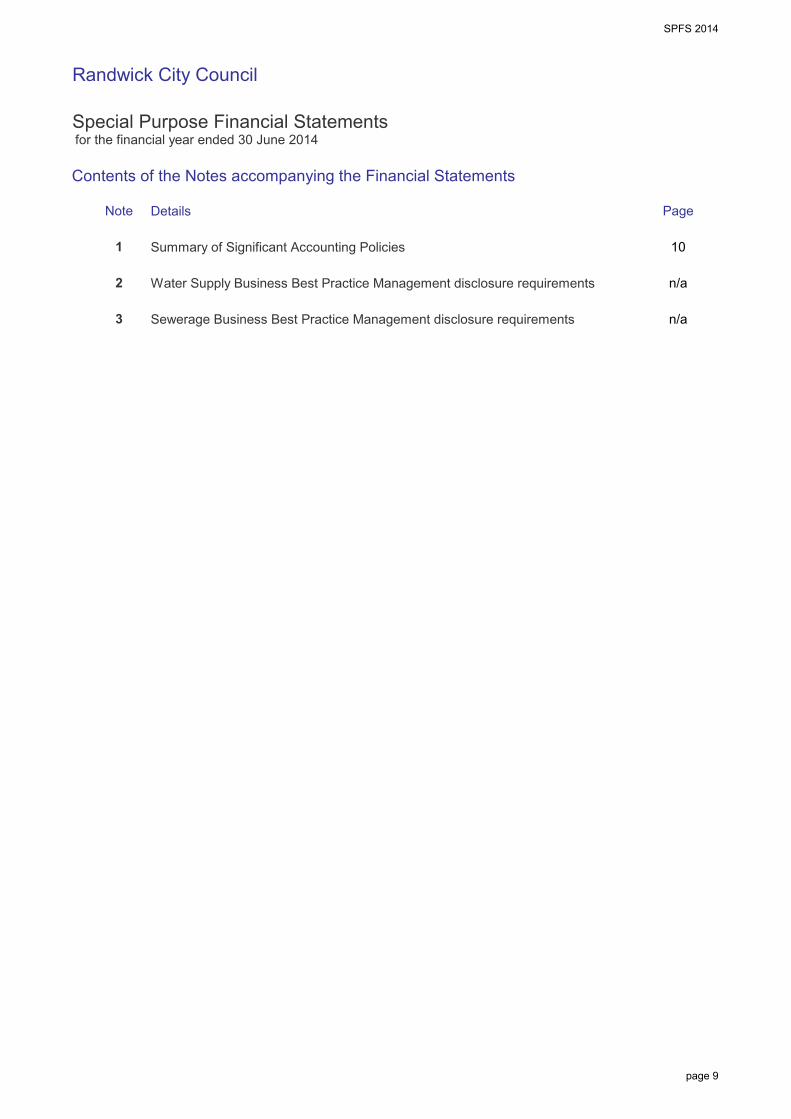
SPFS 2014
Randwick City Council
Special Purpose Financial Statements for the financial year ended 30 June 2014
Contents of the Notes accompanying the Financial Statements
Details
Summary of Significant Accounting Policies
Water Supply Business Best Practice Management disclosure requirements
Sewerage Business Best Practice Management disclosure requirements n/a3
Note Page
1
2
10
n/a
page 9
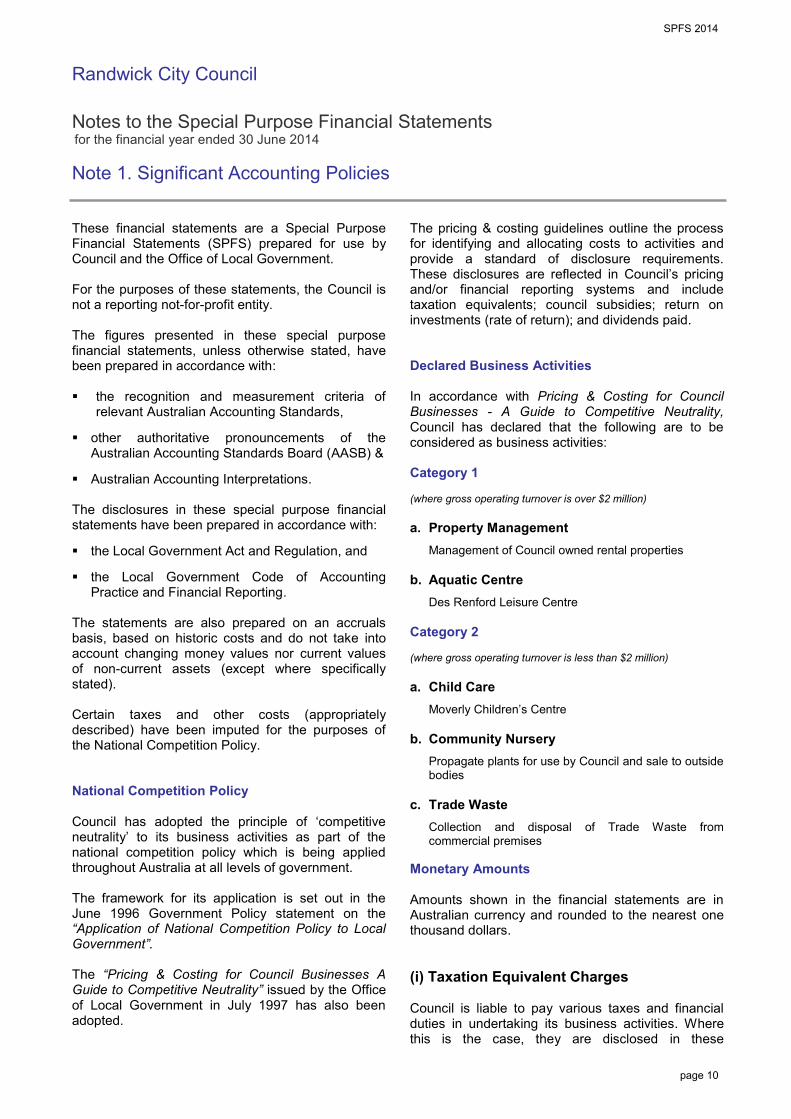
SPFS 2014_
Randwick City Council Notes to the Special Purpose Financial Statements for the financial year ended 30 June 2014 Note 1. Significant Accounting Policies
page 10
These financial statements are a Special Purpose Financial Statements (SPFS) prepared for use by Council and the Office of Local Government. For the purposes of these statements, the Council is not a reporting not-for-profit entity. The figures presented in these special purpose financial statements, unless otherwise stated, have been prepared in accordance with: the recognition and measurement criteria of
relevant Australian Accounting Standards,
other authoritative pronouncements of the Australian Accounting Standards Board (AASB) &
Australian Accounting Interpretations.
The disclosures in these special purpose financial statements have been prepared in accordance with: the Local Government Act and Regulation, and the Local Government Code of Accounting
Practice and Financial Reporting. The statements are also prepared on an accruals basis, based on historic costs and do not take into account changing money values nor current values of non-current assets (except where specifically stated). Certain taxes and other costs (appropriately described) have been imputed for the purposes of the National Competition Policy. National Competition Policy Council has adopted the principle of ‘competitive neutrality’ to its business activities as part of the national competition policy which is being applied throughout Australia at all levels of government. The framework for its application is set out in the June 1996 Government Policy statement on the “Application of National Competition Policy to Local Government”. The “Pricing & Costing for Council Businesses A Guide to Competitive Neutrality” issued by the Office of Local Government in July 1997 has also been adopted.
The pricing & costing guidelines outline the process for identifying and allocating costs to activities and provide a standard of disclosure requirements. These disclosures are reflected in Council’s pricing and/or financial reporting systems and include taxation equivalents; council subsidies; return on investments (rate of return); and dividends paid. Declared Business Activities In accordance with Pricing & Costing for Council Businesses - A Guide to Competitive Neutrality, Council has declared that the following are to be considered as business activities: Category 1 (where gross operating turnover is over $2 million) a. Property Management
Management of Council owned rental properties b. Aquatic Centre
Des Renford Leisure Centre Category 2 (where gross operating turnover is less than $2 million) a. Child Care
Moverly Children’s Centre b. Community Nursery
Propagate plants for use by Council and sale to outside bodies
c. Trade Waste
Collection and disposal of Trade Waste from commercial premises
Monetary Amounts Amounts shown in the financial statements are in Australian currency and rounded to the nearest one thousand dollars. (i) Taxation Equivalent Charges Council is liable to pay various taxes and financial duties in undertaking its business activities. Where this is the case, they are disclosed in these

SPFS 2014_
Randwick City Council Notes to the Special Purpose Financial Statements for the financial year ended 30 June 2014 Note 1. Significant Accounting Policies
page 11
statements as a cost of operations just like all other costs. However, where Council is exempt from paying taxes which are generally paid by private sector businesses (such as income tax), equivalent tax payments have been applied to all Council nominated business activities and are reflected in these financial statements. For the purposes of disclosing comparative information relevant to the private sector equivalent, the following taxation equivalents have been applied to all council nominated business activities (this does not include council’s non-business activities): Notional Rate Applied % Corporate Income Tax Rate – 30% Land Tax – The first $412,000 of combined land values attracts 0%. From $412,001 to $2,519,000 the rate is 1.6% + $100. For the remaining combined land value that exceeds $2,519,000, a premium marginal rate of 2.0% applies. Payroll Tax – 5.45% on the value of taxable salaries and wages in excess of $750,000. Income Tax An income tax equivalent has been applied on the profits of each reported Business Activity. Whilst income tax is not a specific cost for the purpose of pricing a good or service, it needs to be taken into account of in terms of assessing the rate of return required on capital invested. Accordingly, the return on capital invested is set at a pre-tax level (gain/(loss) from ordinary activities before capital amounts) as would be applied by a private sector competitor – that is, it should include a provision equivalent to the corporate income tax rate, currently 30%. Income Tax is only applied where a positive gain/(loss) from ordinary activities before capital amounts has been achieved. Since this taxation equivalent is notional - that is, it is payable to the “Council” as the owner of business operations, it represents an internal payment and
has no effect on the operations of the council. Accordingly, there is no need for disclosure of internal charges in Council's General Purpose Financial Statements. The rate applied of 30% is the equivalent company tax rate prevalent as at balance date. Local Government Rates & Charges A calculation of the equivalent rates and charges payable on all Category 1 businesses has been applied to all land assets owned or exclusively used by the Business Activity. Loan & Debt Guarantee Fees The debt guarantee fee is designed to ensure that council business activities face “true” commercial borrowing costs in line with private sector competitors. In order to calculate a debt guarantee fee, council has determined what the differential borrowing rate would have been between the commercial rate and the council’s borrowing rate for its business activities. (ii) Subsidies Government policy requires that subsidies provided to customers and the funding of those subsidies must be explicitly disclosed. Subsidies occur where council provides services on a less than cost recovery basis. This option is exercised on a range of services in order for council to meet its community service obligations. Accordingly, Subsidies disclosed (in relation to National Competition Policy) represents the difference between revenue generated from ‘rate of return’ pricing and revenue generated from prices set by the council in any given financial year. The overall effect of subsidies is contained within the Income Statement of each reported Business Activity.

SPFS 2014_
Randwick City Council Notes to the Special Purpose Financial Statements for the financial year ended 30 June 2014 Note 1. Significant Accounting Policies
page 12
(iii) Return on Investments (Rate of Return) The Policy statement requires that councils with Category 1 businesses “would be expected to generate a return on capital funds employed that is comparable to rates of return for private businesses operating in a similar field”. Such funds are subsequently available for meeting commitments or financing future investment strategies. The Rate of Return on Capital is calculated as follows: Operating Result before Capital Income + Interest Expense
Written Down Value of I,PP&E as at 30 June As a minimum, business activities should generate a return equal to the Commonwealth 10 year bond rate which is 3.56% at 30/6/14. The actual rate of return achieved by each Business Activity is disclosed at the foot of each respective Income Statement. (iv) Dividends Council is not required to pay dividends to either itself (as owner of a range of businesses) or to any external entities.


Randwick City Council SPECIAL SCHEDULES for the year ended 30 June 2014

Special Schedules 2014
Randwick City Council
Special Schedules for the financial year ended 30 June 2014
Contents
Special Schedules1
Net Cost of Services
Statement of Long Term Debt (all purposes)
Statement of Internal Loans (Sect. 410(3) LGA 1993)
Water Supply Operations - incl. Income StatementWater Supply - Statement of Financial Position
Sewerage Service Operations - incl. Income StatementSewerage Service - Statement of Financial Position
- Notes to Special Schedules No. 3 & 5
Report on Infrastructure Assets (as at 30 June 2014)
Financial Projections
Permissible Income Calculation
1 Special Schedules are not audited (with the exception of Special Schedule 9).
Background
These Special Schedules have been designed to meet the requirements of special purpose users such as;
the NSW Grants Commissionthe Australian Bureau of Statistics (ABS),the NSW Office of Water (NOW), andthe Office of Local Government (OLG).
The financial data is collected for various uses including;
the allocation of Financial Assistance Grants,the incorporation of Local Government financial figures in national statistics,the monitoring of loan approvals,the allocation of borrowing rights, andthe monitoring of the financial activities of specific services.i
i
i
i
i
4- Special Schedule No. 7
n/a
n/a
(ii)
i
i
- Special Schedule No. 8
(i)
i
i
- Special Schedule No. 9 9
- Special Schedule No. 6
8
- Special Schedule No. 5 n/a
Page
2
n/a
n/a
- Special Schedule No. 1
- Special Schedule No. 2(a)n/a
- Special Schedule No. 4
- Special Schedule No. 2(b)
- Special Schedule No. 3n/a
page 1

Special Schedules 2014
Randwick City Council
Special Schedule No. 1 - Net Cost of Services for the financial year ended 30 June 2014
$'000
Governance
Administration
Public Order and Safety
Beach ControlEnforcement of Local Govt. RegulationsAnimal ControlOtherTotal Public Order & Safety
Health
EnvironmentNoxious Plants and Insect/Vermin ControlOther Environmental ProtectionSolid Waste ManagementStreet CleaningDrainageStormwater ManagementTotal Environment
Community Services and EducationAdministration & EducationSocial Protection (Welfare)Aged Persons and DisabledChildren's ServicesTotal Community Services & Education
Housing and Community AmenitiesPublic CemeteriesPublic ConveniencesStreet LightingTown PlanningOther Community AmenitiesTotal Housing and Community Amenities
Water Supplies
Sewerage Services
Expenses from. Continuing. Operations. Non Capital.
1,149
2
1,195 -
Capital.
Income fromcontinuing operations
109
-
3,627 154
30,930
144
35,908
4,039
(23) -
-
-
-
8 2,633
164
2,244
1,800 941
-
374
- - -
-
(2,625)
(68) (2,256)
204 (2,206)
(1,533)
134
55
2,845
-
2,318
2,493
1,462
- (552) (7,170)
- (75)
-
75
552 552
7,314
Function or Activity
8
Fire Service Levy, Fire Protection, Emergency Services
2,568
2,474
2,580 5,977
Net Cost.of Services.
(1,040) (2,560) (2,516)
-
(5,809) (4,112)
3,782 - - (3,782)
(502) - -
(856)
-
50
1,442
1,238
6,076
2,420
709 -
-
3,937 -
13,733
123
4,175 -
26,754
41,717 5,307
3,937
-
-
- -
(1,654) -
(529)
16
-
(6,951)
(4,276)
1,788 576
-
-
-
-
(560)
(1,288)
4,176 -
-
- (412)
(4,173)
-
page 2

Special Schedules 2014
Randwick City Council
Special Schedule No. 1 - Net Cost of Services (continued) for the financial year ended 30 June 2014
$'000
Recreation and CulturePublic LibrariesMuseumsArt GalleriesCommunity Centres and HallsPerforming Arts VenuesOther Performing ArtsOther Cultural ServicesSporting Grounds and VenuesSwimming PoolsParks & Gardens (Lakes)Other Sport and RecreationTotal Recreation and Culture
Fuel & Energy
Agriculture
Mining, Manufacturing and ConstructionBuilding ControlOther Mining, Manufacturing & ConstructionTotal Mining, Manufacturing and Const.
Transport and CommunicationUrban Roads (UR) - LocalUrban Roads - RegionalSealed Rural Roads (SRR) - LocalSealed Rural Roads (SRR) - RegionalUnsealed Rural Roads (URR) - LocalUnsealed Rural Roads (URR) - RegionalBridges on UR - LocalBridges on SRR - LocalBridges on URR - LocalBridges on Regional RoadsParking AreasFootpathsAerodromesOther Transport & CommunicationTotal Transport and Communication
Economic AffairsCamping Areas & Caravan ParksOther Economic AffairsTotal Economic Affairs
Totals – FunctionsGeneral Purpose Revenues (2)
NET OPERATING RESULT (1)
(1) As reported in the Income Statement (2) Includes: Rates & Annual Charges (incl. Ex Gratia, excl. Water & Sewer), Non Capital General Purpose Grants, Interest on Investments (excl. Ext. Restricted Assets) & Interest on overdue Rates & Annual Charges
Income fromcontinuing operations
- - -
5,616
746
-
125,051
-
17,322 8,021
493 493
128,467
1,672
- -
67,558 125,051
1,672
-
60,909
- -
6,203
-
5,267
-
731 -
-
- 417
3,765
- -
2,225 456
-
-
- -
1,269
Function or Activity
997
-
-
813
-
- -
-
-
514
-
-
-
-
-
-
-
-
- -
-
997 29,414 - -
8,060
- -
-
2,807
2,807
- - - -
-
-
Non Capital.
-
Expenses from. Continuing. Operations.
8,482
1,691 7,155
1,602
323
38 -
- -
- -
11,332 1,606
-
997
536
-
(1,038)
(1,539)
- (1,564)
-
(20,357)
483 801
-
Capital.
-
-
-
-
- - -
6,203
- - - -
9,619
-
(57,939) 1,179
-
(8,032) 417
1,179
-
1,502
-
-
-
67,558
7,759 -
-
(7,013) -
2,725
-
-
(1,810)
(641)
(2,402)
-
Net Cost.of Services.
-
(1,810)
-
-
(8,913)
-
-
- (7,198)
Share of interests - joint ventures & associates using the equity method
page 3

Ran
dwic
k C
ity C
ounc
il
Spe
cial
Sch
edul
e N
o. 7
- R
epor
t on
Infra
stru
ctur
e A
sset
s a
s at
30
June
201
4
$'00
0
37,3
25
27
%15
%0%
587,
219
4,
322
1%12
,359
0%
354
42
37
2,83
1
3,05
6
4,
518
562
1%
3,21
8
0%23
8
209
69
3
610
0%
0%4,
473
24
,789
0%
0.0%
43.6
%
308
27
1
403
0%
1%0%
659
996
128,
785
0.
5%
436
61,9
00
Kerb
and
Gut
ter
sub
tota
l
Seal
ed R
oads
Stru
ctur
e Fo
otpa
ths
61%
Oth
er R
oad
Asse
ts
26.5
%
13,3
54
0%
0%11
,910
54
42%
43%
35%
99%
0%0%
1%1,
544
51,8
71
360,
315
1,
003
0%
0%0%
58%
45%
5
Cou
ncil
Publ
ic H
alls
Oth
er B
uild
ings
Spec
ialis
ed B
uild
ings
3
Cou
ncil
Wor
ks D
epot
8%30
%0%0%
74
100%
78%
15%
22%
Asse
t Cat
egor
y4
Annu
al
Mai
nten
ance
D
own
Valu
e (W
DV)
(4)-
Mai
nten
ance
sa
tisfa
ctor
y 2
1
472
0%0%50
%
Asse
t Cla
ss
11%
Cou
ncil
Offi
ces
/Ad
min
istra
tion
Cen
tres
to b
ring
up to
a
Estim
ated
cos
t Ac
tual
(3)-
-R
equi
red
(2)-
Writ
ten
stan
dard
(1)_
2013
/14
1,35
0
1,
534
Libr
arie
s
578
600
569
31
2
225
1,39
1
1,
113
614
1,
316
0.0%
29.4
%
36%
44%
0%
21.2
%
Bui
ldin
gs
Seal
ed R
oads
Sur
face
R
oads
sub
tota
l
18%
18%
66,8
40
2%
70,8
68
6.5%
1.1%
71.1
%
Special Schedules 2014
Asse
ts in
Con
ditio
n as
a %
of W
DV
(4),
(5)
578
1%1%
0%68
%13
%57
%
1%18
%80
%
page 4

Ran
dwic
k C
ity C
ounc
il
Spe
cial
Sch
edul
e N
o. 7
- C
ondi
tion
of P
ublic
Wor
ks (c
ontin
ued)
as
at 3
0 Ju
ne 2
014
$'00
0
Not
es:
(1).
Sat
isfa
ctor
y is
def
ined
as
“sat
isfy
ing
expe
ctat
ions
or n
eeds
, lea
ving
no
room
for c
ompl
aint
, cau
sing
sat
isfa
ctio
n, a
dequ
ate”
.Th
e es
timat
ed c
ost t
o br
ing
asse
ts to
a s
atis
fact
ory
stan
dard
is th
e am
ount
of m
oney
that
is re
quire
d to
be
spen
t on
an a
sset
to e
nsur
e th
at it
is in
a s
atis
fact
ory
stan
dard
.Th
is e
stim
ated
cos
t sho
uld
not i
nclu
de a
ny p
lann
ed e
nhan
cem
ents
(ie.
to h
eigh
ten,
inte
nsify
or i
mpr
ove
the
faci
litie
s).
(2).
Req
uire
d A
nnua
l Mai
nten
ance
is “w
hat s
houl
d be
spe
nt to
mai
ntai
n as
sets
in a
sat
isfa
ctor
y st
anda
rd.
(3).
Act
ual M
aint
enan
ce is
wha
t has
bee
n sp
ent i
n th
e cu
rrent
yea
r to
mai
ntai
n th
e as
sets
.A
ctua
l Mai
nten
ance
may
be
high
er o
r low
er th
an th
e re
quire
d an
nual
mai
nten
ance
due
to th
e tim
ing
of w
hen
the
mai
nten
ance
act
ually
occ
urs.
(4).
Writ
ten
Dow
n V
alue
is in
acc
orda
nce
with
Not
e 9
of C
ounc
il's G
ener
al P
urpo
se F
inan
cial
Sta
tem
ents
(5).
Infr
astr
uctu
re A
sset
Con
ditio
n A
sses
smen
t "K
ey"
Exce
llent
No
wor
k re
quire
d (n
orm
al m
aint
enan
ce)
Goo
dO
nly
min
or m
aint
enan
ce w
ork
requ
ired
Ave
rage
Mai
nten
ance
wor
k re
quire
dPo
orR
enew
al re
quire
dVe
ry P
oor
Urg
ent r
enew
al/u
pgra
ding
requ
ired
page 5
Asse
t Cla
ss
5
878
Rec
reat
iona
l As
sets
768
56
6
Stor
mw
ater
Dra
inag
eD
rain
age
Writ
ten
421
195,
303
su
b to
tal
19.4
%
3
Ope
n Sp
ace/
R
ecre
atio
nal A
sset
sSw
imm
ing
Pool
s77
53
1,
925
0%0%
Oth
er O
pen
Spac
e/R
ecre
atio
nal A
sset
s
854
15
7,13
0
73.8
%0.
8%6.
0%1,
238
Asse
t Cat
egor
y
Annu
al
satis
fact
ory
stan
dard
(1)-
Mai
nten
ance
5
2013
/14
Mai
nten
ance
24
Dow
n Va
lue
75%
Req
uire
d (2
)-to
brin
g up
to a
18%
21
3(W
DV)
(4)-
202
16
9
86
4
1,03
6
38
,173
0%
Actu
al (3
)-
0%0%25
%6%
Estim
ated
cos
t
6%
0%
100%
0%
0.0%
1,03
3
1% 1%
Special Schedules 2014
sub
tota
l76
8
643
1,
002
60,0
06
10
.6%
69.7
%18
.7%
1.0%
0.0%
Asse
ts in
Con
ditio
n as
a %
of W
DV
(4),
(5)
4
0%
949
58
,081
11%
72%
16%
Stor
mw
ater
Con
duits
69%
Inle
t and
Jun
ctio
n Pi
ts
TOTA
L - A
LL A
SSET
S6,
764
7,56
3
9,
780
971,
313
21
.3%
65.7
%12
.1%
1.0%
0.0%

Special Schedules 2014
Randwick City Council
Special Schedule No. 7 - Report on Infrastructure Assets (continued) for the financial year ended 30 June 2014
$ '000
Infrastructure Asset Performance IndicatorsConsolidated
1. Building and Infrastructure Renewals RatioAsset Renewals (Building and Infrastructure) (1)
Depreciation, Amortisation & Impairment
2. Infrastructure Backlog RatioEstimated Cost to bring Assets to aSatisfactory ConditionTotal value(2) of Infrastructure, Building, Other Structures& depreciable Land Improvement Assets
3. Asset Maintenance RatioActual Asset MaintenanceRequired Asset Maintenance
4. Capital Expenditure RatioAnnual Capital ExpenditureAnnual Depreciation
Notes
(1) Asset Renewals represent the replacement &/or refurbishment of existing assets to an equivalent capacity/performance
as opposed to the acquisition of new assets (or the refurbishment of old assets) that increases capacity/performance.
Asset Renewals include building and infrastructure assets only.
(2) Written down value
Amounts Indicator Prior Periods
6,764 0.01 0.01 0.06985,032
2014 2014 2013 2012
23,192 122.26% 113.05% 89.84%18,969
35,680 1.56 1.32 1.2622,850
9,780 1.29 1.52 1.407,563
page 6

Special Schedules 2014
Randwick City Council
Special Schedule No. 7 - Report on Infrastructure Assets (continued) for the financial year ended 30 June 2014
―― Minimum 100.00%Source for Benchmark: NSW Treasury Corporation (T-Corp)
―― Maximum .02Source for Benchmark: NSW Treasury Corporation (T-Corp)
―― Minimum 1.00Source for Benchmark: NSW Treasury Corporation (T-Corp)
―― Minimum 1.10Source for Benchmark: NSW Treasury Corporation (T-Corp)
Purpose of Capital Expenditure Ratio
Commentary on 2013/14 Result
2013/14 Ratio 1.56 x
To assess the extent to which a Council is expanding its asset
base thru capital expenditure on both new assets and the
replacement and renewal of existing
assets.
Council continues not only to have the capacity to maintain its existing assets at a satisfactory condition, but also the capacity
to create new assets for the community.
Compares actual vs. required annual asset maintenance. A ratio above 1.0 indicates Council is investing
enough funds to stop the Infrastructure Backlog growing.
Randwick City Council continues to sufficetnly fund the maintenance of the City's assets. This ensures that these assets are kept in a condition that is
satifactory to the community.
Purpose of Asset Renewals Ratio
Commentary on 2013/14 Result
2013/14 Ratio 122.26%
To assess the rate at which these assets are being renewed
relative to the rate at which they are depreciating.
Randwick City Council continues to grow the rate at which is is renewing its infrastructure. Through very strong
infrastructrue planning and management practices this will continue to be above the
benchmark and continue to reduce the infrastructure backlog.
Purpose of Infrastructure Backlog Ratio
Commentary on 2013/14 Result
2013/14 Ratio 0.01 x
This ratio showswhat proportion the backlog is against
the total valueof a Council’s infrastructure.
The decrease in the infrastructure backlog of Randwick City is correlated to the
increase in the level of asset renewals and asset maintenance ratios.
Purpose of Asset Maintenance Ratio
Commentary on 2013/14 Result
2013/14 Ratio 1.29 x
1.03
1.40 1.52
1.29
0.00
0.20
0.40
0.60
0.80
1.00
1.20
1.40
1.60
1.80
2011 2012 2013 2014
Ra
tio
(x
)
3. Asset Maintenance Ratio
83.06% 89.84%
113.05% 122.26%
0%
20%
40%
60%
80%
100%
120%
140%
160%
2011 2012 2013 2014
Ra
tio
%
1. Building and Infrastructure Renewals Ratio
0.076
0.064
0.011 0.007
0.00
0.01
0.02
0.03
0.04
0.05
0.06
0.07
0.08
0.09
2011 2012 2013 2014
Ra
tio
(x
)
2. Infrastructure Backlog Ratio
1.45
1.26 1.32
1.56
0.00
0.20
0.40
0.60
0.80
1.00
1.20
1.40
1.60
1.80
2.00
2011 2012 2013 2014
Ra
tio
(x
)
4. Capital Expenditure Ratio
page 7

Ran
dwic
k C
ity C
ounc
il
Spe
cial
Sch
edul
e N
o. 8
- Fi
nanc
ial P
roje
ctio
ns a
s at
30
June
201
4
$'00
0
(i) O
PER
ATI
NG
BU
DG
ETIn
com
e fro
m c
ontin
uing
ope
ratio
nsE
xpen
ses
from
con
tinui
ng o
pera
tions
Ope
ratin
g R
esul
t fro
m C
ontin
uing
Ope
ratio
ns
(ii) C
APIT
AL
BU
DG
ETN
ew C
apita
l Wor
ks (2
)
Rep
lace
men
t/Ref
urbi
shm
ent o
f Exi
stin
g A
sset
sTo
tal C
apita
l Bud
get
Fund
ed b
y:–
Loan
s–
Ass
et s
ales
– R
eser
ves
– G
rant
s/C
ontri
butio
ns–
Rec
urre
nt re
venu
e–
Oth
er
Not
es:
(1)
From
13/
14 In
com
e S
tate
men
t.(2
)N
ew C
apita
l Wor
ks a
re m
ajor
non
-rec
urre
nt p
roje
cts,
eg
new
Lei
sure
Cen
tre, n
ew L
ibra
ry, n
ew S
wim
min
g po
ol e
tc.
(3)
Fina
ncia
l pro
ject
ions
sho
uld
be in
acc
orda
nce
with
Cou
ncil’
s In
tegr
ated
Pla
nnin
g an
d R
epor
ting
fram
ewor
k.
Special Schedules 2014
page 8
22/2
3
174,
533
165,
475
9,05
8
34,7
20
34,7
20
31
,893
35
,919
3,52
6
2,84
3
29,2
19
35,5
88
4,73
3
2,51
3
25,8
84
2,64
0
26,7
50
Fore
cast
(3)
6,52
9
3,
578
Fore
cast
(3)
21/2
2
169,
095
160,
094
9,00
1
34,7
20
3,44
0
2,77
4
28,5
06
2,
706
25
,609
Fore
cast
(3)
Fore
cast
(3)
23/2
4
180,
160
171,
104
9,05
6
35,5
88
35,5
88
20/2
1
163,
839
155,
498
8,34
1
35,9
19 35
,919
31
,893
31,8
93
33,1
30
Fore
cast
(3)
19/2
0
158,
137
149,
503
8,63
4
33,0
56 33
,056
3,68
6
4,06
2
25,3
08 33
,056
Fore
cast
(3)
18/1
9
152,
640
144,
409
8,23
1
33,1
30 33
,130
34,6
24
37,2
36
32,8
84
30,6
82
31,5
25
2,55
1
26,8
86
2,31
3
2,
533
3,67
8
6,
020
28
,903
28
,989
1,
720
22,8
65
25,0
39
2,17
5
2,
808
5,28
4
31,5
25
34,6
24 34
,624
31
,525
5,18
7
37,2
36
32,8
84
30,6
82
134,
670
13
5,09
1
129,
839
9,93
1
7,
997
139,
344
7,01
8
135,
199
33,5
31
28,5
38
30,6
82
125,
051
12
5,16
0
9,61
9
7,
423
3,70
5
4,
346
17/1
8
Fore
cast
(3)
Fore
cast
(3)
16/1
7
142,
217
13
7,26
2
147,
341
13/1
4
Fore
cast
(3)
15/1
6
14/1
5
Fore
cast
(3)
Actu
al(1
)

Special Schedules 2014
Randwick City Council
Special Schedule No. 9 - Permissible Income Calculation for the financial year ended 30 June 2015
$'000
Notional General Income Calculation (1)
Last Year Notional General Income YieldPlus or minus Adjustments (2)
Notional General Income
Permissible Income Calculation
Special variation percentage (3)
or Rate peg percentageor Crown land adjustment incl. rate peg percentage
less expiring Special variation amountplus Special variation amount
or plus Rate peg amountor plus Crown land adjustment and rate peg amount
sub-total
plus (or minus) last year's Carry Forward Totalless Valuation Objections claimed in the previous yearsub-total
Total Permissible income
less Notional General Income YieldCatch-up or (excess) result
plus Income lost due to valuation objections claimed (4)
less Unused catch-up (5)
Carry forward to next year
Notes1 The Notional General Income will not reconcile with rate income in the financial statements in the
corresponding year. The statements are reported on an accrual accounting basis which include amountsthat relate to prior years' rates income.
2 Adjustments account for changes in the number of assessments and any increase or decrease in landvalue occurring during the year. The adjustments are called "supplementary valuations" as defined in theValuation of Land Act 1916.
3 The Special Variation Percentage is inclusive of the Rate Peg percentage and where applicable crown landadjustment.
4 Valuation objections are unexpected changes in land values as a result of land owners successfullyobjecting to the land value issued by the Valuer-General. Councils can claim the value of the income lostdue to valuation objections in any single year.
5 Unused catch-up amounts will be deducted if they are not caught up within 2 years. Usually councils willhave a nominal carry forward figure. These amounts can be adjusted for in setting the rates in a future year.
p
q = o - p
r
st = q + r - s
b
d
e
f
k = (c+g+h+i+j)
j = c x f
i = c x e
h = c x d
c
l
m
n = (l + m)
o = k + n
g
a
2 1
Calculation Calculation2013/14 2014/15
- -
(71) (13)
73 14
66,733 69,395
66,804 69,408
(4) (73) (4) (71)
2,313 6,079
- 2
- - - -
66,737 69,466
- (3,595)
3.59% 9.59%3.40% 2.30%
64,296 66,804 128 178
64,424 66,982
page 9