KEMA Proposal_Report w Appendices Template … · Web viewClimate Action Plan Template City and...
96
Climate Action Plan Template City and County Association of Governments of San Mateo County Prepared by DNV GL September 29, 2016 Version 5 Instructions: This following pages of this document contain the draft semi-standard language for the CAP Template. This is the language that individual cities will be providing to the consultant for inclusion in the CAP when developing the full blown document (if the consultant is brought on by municipalities). Individual cities should also use the semi-standard language as a starting point for making modifications to customize for their specific communities. For sections that we do not provide semi-standard language, the RICAPS User’s Guide will provide more guidance on how to complete these sections. Yellow highlights indicate sections and text that cities must customize. The following fields are designed to allow cities to find and replace (Ctrl+h) to customize: Field (include brackets) Replacement text (for example) [CITY] San Mateo [CITY’s] San Mateo’s [BaselineYear] 2005
Transcript of KEMA Proposal_Report w Appendices Template … · Web viewClimate Action Plan Template City and...

Climate Action Plan Template
City and County Association of Governments of San Mateo CountyPrepared by DNV GLSeptember 29, 2016Version 5
Instructions:This following pages of this document contain the draft semi-standard language for the CAP Template. This is the language that individual cities will be providing to the consultant for inclusion in the CAP when developing the full blown document (if the consultant is brought on by municipalities). Individual cities should also use the semi-standard language as a starting point for making modifications to customize for their specific communities.
For sections that we do not provide semi-standard language, the RICAPS User’s Guide will provide more guidance on how to complete these sections.
Yellow highlights indicate sections and text that cities must customize.
The following fields are designed to allow cities to find and replace (Ctrl+h) to customize:
Field (include brackets) Replacement text (for example)[CITY] San Mateo[CITY’s] San Mateo’s[BaselineYear] 2005[TargetYear] 2020[Target%] 15%

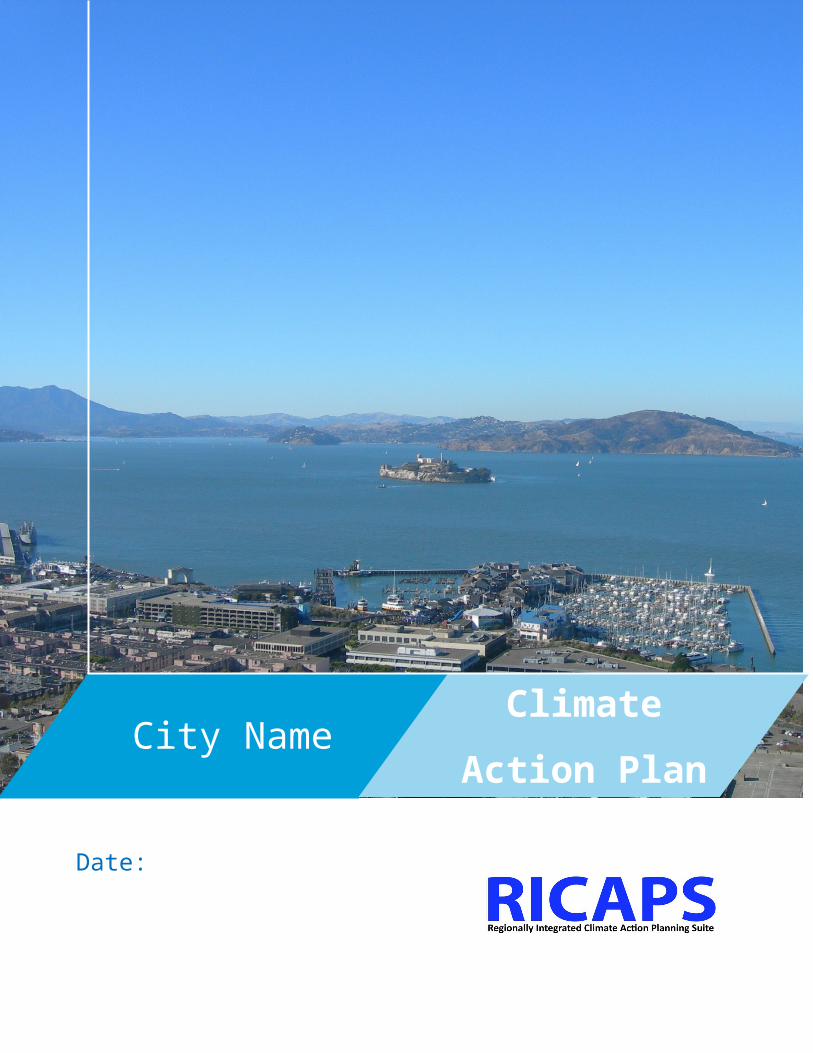
Date:
City Name Climate
Action Plan
Acknowledgements
[CITY] City Council
City Manager
[CITY] City Staff
This climate action plan was developed using the Regionally Integrated Climate Action Planning Suite (RICAPS) funded by a grant from the Bay Area Air Quality Management District (BAAQMD) and by California utility customers, administered by Pacific Gas and Electric Company (PG&E) under the auspices of the California Public Utilities Commission and with matching funds provided by the City and County Association of Governments of San Mateo County (C/CAG).
RICAPS Steering Committee: Elizabeth Claycomb (City of Pacifica), Erin Cooke (City of Cupertino), Brandi de Garmeaux (City of Portola Valley), Shelly Reider (City of Millbrae), Jim Shannon (City of San Bruno)
RICAPS Project Consultant: Kema Services, Inc.
RICAPS Staff: Richard Napier (C/CAG), Kim Springer (County of San Mateo), Susan Wright (County of San Mateo)
Prepared in collaboration with City/County Association of Governments of San Mateo County

Table of Contents1. Introduction.............................................................................................................................4
1.1 Why the City [Town] of [CITY] has a Climate Action Plan.............................................41.2 Climate Science............................................................................................................51.3 Projected San Francisco Bay Area Climate Impacts....................................................7
1.3.1 Extreme Heat & Storm Events........................................................................111.3.2 Public Health...................................................................................................12
1.4 State Policy and Regulatory Context..........................................................................131.5 Regional Efforts...........................................................................................................151.6 Local efforts.................................................................................................................171.7 City of [CITY]’s Climate Action Plan Process..............................................................17
1.7.1 Framework for Climate Action.........................................................................181.7.2 Public Outreach and Community Engagement...............................................19
2. Greenhouse Gas Inventory and Forecast............................................................................202.1 Inventory Sources and Data Collection Process.........................................................202.2 Baseline Emissions Inventory for [BaselineYear]........................................................21
2.2.1 Electricity and Natural Gas Emissions............................................................222.2.2 Transportation Emissions................................................................................242.2.3 Solid Waste.....................................................................................................252.2.4 Municipal Operations.......................................................................................252.2.5 Emissions Forecast for 2020 and 2035...........................................................26
2.3 Emission Reduction Targets.......................................................................................282.3.1 Reductions from State-Level Actions..............................................................292.3.2 The City of [CITY] Reduction Target...............................................................29
3. Climate Action Strategies.....................................................................................................313.1 Energy.........................................................................................................................31
3.1.1 Goal: [EACH city to include a sub-section for each goal]................................343.2 Transportation and Land Use......................................................................................34
3.2.1 Goal: [EACH city to include a sub-section for each goal]................................363.3 Solid Waste.................................................................................................................36
3.3.1 Goal: [EACH city to include a sub-section for each goal]................................37
RICAPS CAP Template Version 4 January 8, 2013 page I
3.4 Adaptation...................................................................................................................384. Implementation.....................................................................................................................39
4.1 Prioritizing measures for action...................................................................................394.2 Results of measure prioritization.................................................................................394.3 Summary of Measures................................................................................................394.4 Meeting the emission targets......................................................................................414.5 Management of GHG Reduction Strategy..................................................................414.6 Public Participation and Community Engagement......................................................414.7 Timeline.......................................................................................................................43
5. Monitoring and Improvement................................................................................................446. Conclusion............................................................................................................................45Appendix A. Glossary of Terms...................................................................................................46Appendix B. 10 Steps to Reduce Your Carbon Footprint............................................................47Appendix C. Summary of Funding Sources.................................................................................50
6.1 Federal Funding..........................................................................................................506.2 State Funding..............................................................................................................506.3 Utility Rebate Programs..............................................................................................526.4 Local Energy Programs...............................................................................................536.5 Other Funding Opportunities.......................................................................................55
Appendix D. Adaptation Planning for Climate Impacts................................................................57Appendix E. Future Opportunities for Emissions Reductions......................................................60Appendix F. Baseline GHG Inventory and Forecast....................................................................61Appendix G. Emission Reduction Measures: Calculations..........................................................62
RICAPS CAP Template Version 4 January 8, 2013 page II
Letter from the Mayor (representative)
Right now is a critical time for our community, our economy, and our environment. We are fortunate here in [CITY] to be surrounded by a wealth of knowledge and opportunity, fostered by our businesses’ innovation and emboldened by our residents’ entrepreneurial spirit. [CITY] has a strong history of supporting environmental preservation principles, as exemplified by [example]. This drive to protect natural resources is one of the core values of our community. However, resources fundamental to the vibrancy of [CITY] are at risk from the effects of climate change, which in San Mateo County, including [CITY] threatens to increase sea level, summer temperatures, the prevalence and strength of storms, and air pollution; aggravate health problems; and decrease the reliability of the water supply.
Climate change is a global problem and only through local solutions designed to meet the needs of our community can we mitigate and adapt to its impacts and protect the environment. Together, we can conserve our scarce resources, thereby saving our families and companies money, increasing the resilience of our economy and emergence of new markets that prioritize green technologies. This plan is a comprehensive and strategic approach to sustainability, offering a suite of recommended actions that will engage all members of [CITY’s] community in this journey to safeguard our environment. The Plan also includes ideas to allow our City government to “walk the talk” by implementing practices that minimize our own impacts on the environment by echoing the energy efficiency, water conservation and alternative transportation programs and services our Climate Action Plan proposes to establish for our community.
This small but important step is just the beginning of an exciting time of environmental stewardship and community transformation in which the City [or Town] of [CITY] is taking the lead. But, as you can see when reviewing this Plan, the proposed efforts of [CITY] are small when compared to the collective action of our citizenry. Sustainability requires more than just environmental protection, it will take leadership and partnership to deploy these actions. We invite you to actively join [CITY’s] transition to a clean environment, healthy community, and prosperous future. The key to [CITY]’s success is you!
[Mayor Name]
Mayor
RICAPS CAP Template Version 4 January 8, 2013 page III
[Insert mayor picture here]

Introduction The City [Town] of [CITY] is pleased to present the following Climate Action Plan (Plan). This Plan is designed to be a blueprint of our community’s response to the challenges posed by climate change. Climate scientists around the world, represented by the Intergovernmental Panel on Climate Change, have an unequivocal position: human activity is changing the earth’s climate through the release of greenhouse gas (GHG) emissions resulting from the combustion of fossil fuels. The longer communities delay taking action, the greater the risk humans face of irreversibly depleting nonrenewable resources and harming our environment. However, it is conceivable, and increasingly foreseeable, that humans will delay so long that useful policy and programs will become infeasible and both human civilization and the biosphere will be permanently damaged.
Our city cannot solve the climate crisis alone. Together with our partners in county, state, and federal government, [CITY] has committed to taking steps to reduce our emissions and create new programs and services that will support our community and our families in doing the same. This Plan offers ways to make our homes more energy efficient and increase the amount of locally produced renewable energy. It recommends “smart” development patterns that emphasize vibrant complete neighborhoods that allow people to go about their business on foot, by bicycle, or via public transportation. It provides transit solutions and offers ways to reduce the waste heading to our landfills. Finally, this Plan outlines measures that will make our municipal government an efficient and resource-conservation minded organization.
RICAPS CAP Template Version 4 January 8, 2013 page 1

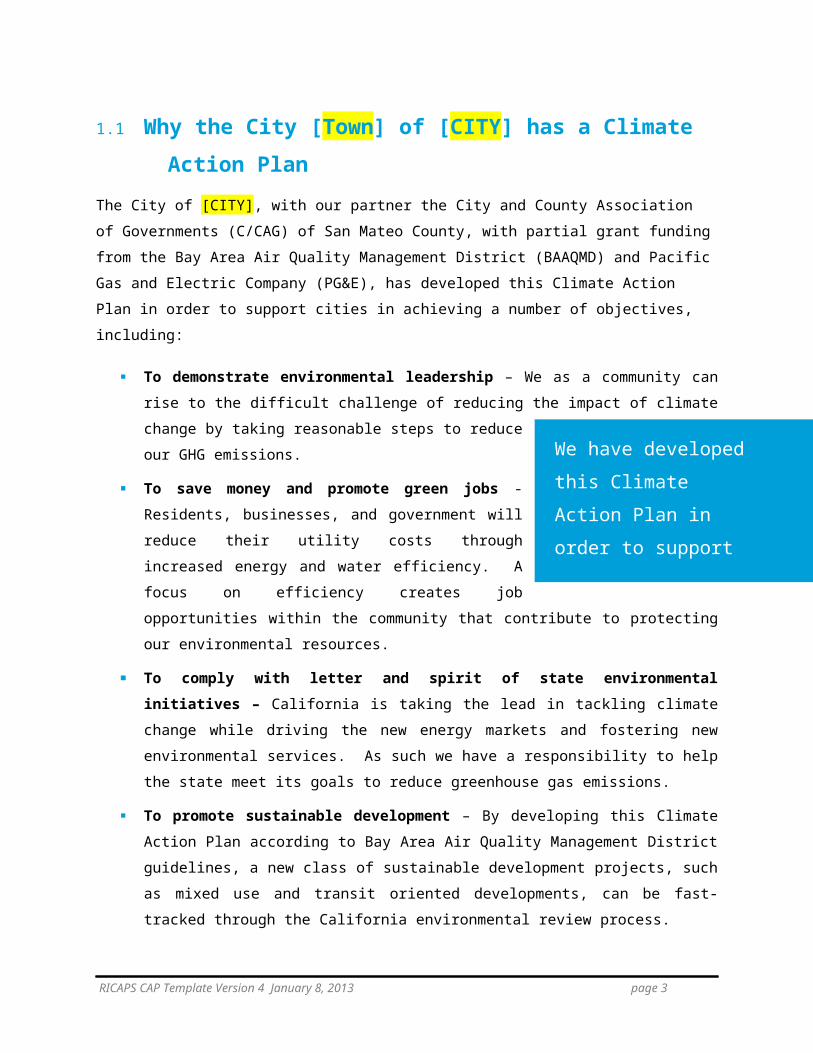
1.1 Why the City [Town] of [CITY] has a Climate Action PlanThe City of [CITY], with our partner the City and County Association of Governments (C/CAG) of San Mateo County, with partial grant funding from the Bay Area Air Quality Management District (BAAQMD) and Pacific Gas and Electric Company (PG&E), has developed this Climate Action Plan in order to support cities in achieving a number of objectives, including:
To demonstrate environmental leadership – We as a community can rise to the difficult challenge of reducing the impact of climate change by taking reasonable steps to reduce our GHG emissions.
To save money and promote green jobs - Residents, businesses, and government will reduce their utility costs through increased energy and water efficiency. A focus on efficiency creates job opportunities within the community that contribute to protecting our environmental resources.
To comply with letter and spirit of state environmental initiatives – California is taking the lead in tackling climate change while driving the new energy markets and fostering new environmental services. As such we have a responsibility to help the state meet its goals to reduce greenhouse gas emissions.
To promote sustainable development – By developing this Climate Action Plan according to Bay Area Air Quality Management District guidelines, a new class of sustainable development projects, such as mixed use and transit oriented developments, can be fast-tracked through the California environmental review process.
1.2 Climate ScienceClimate change presents one of the most profound challenges of our time. A broad international consensus exists among atmospheric scientists that the Earth’s climate system is being destabilized in response to elevated levels of greenhouse gas emissions in the atmosphere. This is primarily from the combustion of fossil fuels for energy use. Greenhouse gas emissions include carbon dioxide (CO2) methane (CH4), nitrous oxide (N2O), and three man-made gasses: hydrofluorocarbons (HFCs), perfluorocarbons (PFCs), and sulfur hexafluoride (SF6).
RICAPS CAP Template Version 4 January 8, 2013 page 2
We have developed this Climate Action Plan in order to support cities in achieving a number of different objectives

The following graphic from the Intergovernmental Panel on Climate Change (IPCC), the leading international scientific body on climate change, shows the growth and distribution of anthropogenic (human-caused) greenhouse gas emissions in the atmosphere.
Figure 1: Growth and Distribution of Global Anthropogenic GHG emissions
Source: International Panel on Climate Change, Fifth Assessment Report
The largest anthropogenic contributor to climate change is carbon dioxide emissions from carbon dixoide and industrial processes (65%), followed by methane (16%), carbon dioxide from forestry and other land use changes (11%), nitrous oxide (6.2%) and fluorinated gases (2.0%). Carbon dioxide is emitted through the combustion of fossil fuels such as coal and petroleum as well as through the decomposition of clear-cut forests (deforestation).
RICAPS CAP Template Version 4 January 8, 2013 page 3

Figure 2: Greenhouse Gas Emissions by Economic Sector in the United States
Source: Environmental Protection Agency, Inventory of U.S. Greenhouse Gas Emissions and Sinks
In the United States, the larget contributer to greenhouse gas emissions is the electricity sector (30%), followed by the transportation (26%), industry (21%) commercial & residential (12%) and agriculture (9%).
A 2009 comprehensive study of climate impacts on the United States, written by a task force of U.S. government science agencies, led by the National Oceanic and Atmospheric Administration (NOAA),1 makes the following key conclusions:
1. Global warming is unequivocal and primarily human-induced. Average global temperature has increased over the past 50 years. This observed increase is due primarily to human-induced emissions of heat-trapping gases.
2. Climate changes are underway in the United States and are projected to grow. Climate-related changes have already been observed in the United States and within its coastal waters. These changes include increases in heavy downpours, rising temperatures and sea level, rapidly retreating glaciers, thawing permafrost, lengthened
1U.S. Global Change Research Program 2009. “Global Climate Change Impacts in the United States.” Page 12. http://www.globalchange.gov/publications/reports/scientific-assessments/us-impacts
RICAPS CAP Template Version 4 January 8, 2013 page 4
growing seasons, lengthened ice-free seasons in the ocean and on lakes and rivers, earlier snowmelt, and alterations in river flows.
3. Widespread climate-related impacts are occurring now and are expected to increase. Climate changes are already affecting water, energy, transportation, agriculture, ecosystems, and health. These impacts are different from region to region and will grow under projected climate changes.
4. Climate change will stress water resources. Access to clean water is an issue in every region, but the nature of the potential impacts varies. Drought, related to reduced precipitation, increased evaporation, and increased water loss from plants, is an important issue, especially in the West. Floods and water quality problems are likely to be amplified by climate change in most regions. Declines in mountain snowpack are important in the West and Alaska, where snowpack provides vital natural water storage and supply.
5. Crop and livestock production will be increasingly challenged. Agriculture is considered one of the sectors most adaptable to changes in climate. However, increased heat, pests, water stress, diseases, and weather extremes will pose adaptation challenges for crop and livestock production.
6. Coastal areas are at increasing risk from sea-level rise and storm surge. Sea-level rise and storm surges place many U.S. coastal areas at increasing risk of erosion and flooding, especially along the Atlantic and Gulf Coasts, Pacific Islands, and parts of Alaska. Energy and transportation infrastructure and other property in coastal areas are very likely to be adversely affected.
7. Threats to human health will increase. Health impacts resulting from climate change are related to heat stress, waterborne diseases, poor air quality, extreme weather events, and diseases transmitted by insects and rodents.
8. Climate change will interact with many social and environmental stresses. Climate change will combine with pollution; population growth; overuse of resources; urbanization; and other social, economic, and environmental stresses to create larger impacts than from any of these factors alone.
9. Thresholds will be crossed, leading to large changes in climate and ecosystems. There are a variety of thresholds in the climate system and ecosystems. These
RICAPS CAP Template Version 4 January 8, 2013 page 5
“Climate changes are already affecting water, energy, transportation, agriculture, ecosystems, and health.”

thresholds determine, for example, the presence of sea ice and permafrost and the survival of species, from fish to insect pests. These all have implications for society.
10. Future climate change and its impacts depend on choices made today. The amount and rate of future climate change depend primarily on current and future human-caused emissions of heat-trapping gases and airborne particles. Responses involve reducing emissions to limit future warming and adapting to the changes that are unavoidable.
According to the current scientific consensus, a 2°C increase in average global temperature over the next century is a “safe” level of global warming. To limit the average global temperature increase to 2°C, GHG concentrations need to be stabilized at a level well below 450 parts per million (ppm). In 2015, the global atmospheric concentration of CO2 passed 400 ppm2. Achieving this level requires global GHG emissions to be reduced by at least 50 percent below their 1990 levels by the year 2050.
1.3 Projected San Francisco Bay Area Climate ImpactsHistorical records show that sea level in San Francisco Bay has risen about 7 inches (18 cm) over the past 100 years. Scientists agree that the rate of sea level rise is accelerating, but projections of future sea levels vary considerably. Present projections used by the State of California3 are for 14 inches of sea level rise by 2050 (using 2000 as the baseline) and for between 40 and 55 inches by 2100, depending upon the emission scenario used. In 2009, the Bay Conservation and Development Commission (BCDC) released Living With a Rising Bay, an assessment that included the following4:
Increased flooding risk for 270,000 Bay Area residents with a 55 inch rise
Estimated $36 billion in at-risk property by 2050, and $62 billion by 2100
2 National Oceanic and Atmospheric Administration (NOAA), “Greenhouse gas benchmark reached”, http://research.noaa.gov/News/NewsArchive/LatestNews/TabId/684/ArtMID/1768/ArticleID/11153/Greenhouse-gas-benchmark-reached-.aspx3 Sea-Level Rise Task Force of the Coastal and Ocean Working Group of the California Climate Action Team (CO-CAT), 2010. State of California Sea‐Level Rise Interim Guidance Document. October 2010.4 San Francisco Bay Conservation and Development Commission. 2009. (April) Draft Staff Report. Living with a Rising Bay: Vulnerability and Adaptation in San Francisco Bay and on its Shoreline. Available at: http://www.bcdc.ca.gov/proposed_bay_plan/bp_1-08_cc_draft.pdf
RICAPS CAP Template Version 4 January 8, 2013 page 6

Estimated 95% of tidal wetlands vulnerable to sea level rise, which may increase flooding and erosion
The Pacific Institute, with support from the California Energy Commission, California Department of Transportation, and the Ocean Protection Council, has produced inundation maps for the shores of San Francisco Bay that indicate which areas are vulnerable to 16-inch and 55-inch rises in sea level.5 The Bay shoreline, from Brisbane to East Palo Alto, is a typical San Francisco Bay low-lying shoreline which provides vital ecological, industrial, and residential functions yet is already vulnerable to inundation from both tidal and fluvial sources. Both the San Francisco Airport and the Port of Redwood City are at risk, as are segments of critical transportation infrastructure including segments of Highway 101, approaches to the Dumbarton and San Mateo Bridges, and Caltrain railroad. As show in Figure 2.4, many low-income communities located in Redwood City, East Menlo Park and East Palo Alto are particularly susceptible to sea level rise, and may have fewer resources or alternatives available to bolster their resilience.
According to a 2009 study6 by the CEC, the Pacific Institute, and others, 110,000 people live in areas of San Mateo County that are vulnerable to a 100-year flood event with a 1.4 meter rise in sea level. The County infrastructure and facilities at risk from the same event include:
$24 billion worth of buildings and contents, mostly along the Bay (replacement value)
530 miles of roadways
10 miles of railroads
San Francisco Airport (SFO), including the 31 MW United Cogen power plant there
Wastewater treatment plants operated by the Cities of South San Francisco/San Bruno, City of Millbrae, City of San Mateo, South Bayside System Authority, Mid-Coastside Sewer Authority, and SFO (total treatment capacity of approximately 44 MGD)
78 EPA-regulated hazardous materials sites
34 square miles of coastal wetlands
The Pacific Ocean shoreline, from Daly City to the Santa Cruz County line, has a number of areas that will become increasingly vulnerable with sea level rise. This shore too is vulnerable to tidal and fluvial inundation. With just a 1-foot rise in sea level, areas that are considered to be in
5 Maps available at http://www.pacinst.org/reports/sea_level_rise/hazmaps.html 6 Heberger, Matthew, Heather Cooley, Pablo Herrera, Peter H. Gleick, and Eli Moore (2009). The Impactsof Sea Level Rise on the California Coast. PIER Research Report, CEC-500-2009-024-D, Sacramento,CA: California Energy Commission.
RICAPS CAP Template Version 4 January 8, 2013 page 7
Betty Seto, 01/08/13,
We recommend cities select the text that is most relevant for their community. This section focused on inner Bay cities.
Betty Seto, 01/08/13,
Again, cities should select text that is relevant to their community. This is relevant to Pacific coastline.

100-year flood zones today are likely to experience such events every 10 years. 7 Salt water intrusion into local estuaries and coastal aquifers will impact water quality, transform ecosystems and reduce available fresh water for irrigation and other needs. But the shoreline will also bear the brunt of wave action and storm surges. For instance, the shore south of Pillar Point Harbor in the vicinity of El Grenada south past Miramar and into the town of Half Moon Bay is eroding rapidly. As a result, pedestrian access is restricted and Caltrans has armored the west side of Highway One. Farther north in Moss Beach, a section of Ocean Boulevard was recently closed due to mass sliding of the bluff, initiated by coastal erosion at its base. Erosion in the area just west and north of Airport Road has resulted in the loss of several homes over the years.
Figure 3: Projected Sea Level Rise - San Mateo County Shoreline8
7 Heberger, Matthew, Heather Cooley, Pablo Herrera, Peter H. Gleick, and Eli Moore (2009). The Impactsof Sea Level Rise on the California Coast. PIER Research Report, CEC-500-2009-024-D, Sacramento,CA: California Energy Commission.8 http://www.pacinst.org/reports/sea_level_rise/gmap.html
RICAPS CAP Template Version 4 January 8, 2013 page 8

The range of current sea level rise estimates presents very different scenarios to cities that must decide how to expend limited resources to protect critical land uses and infrastructure. As the shoreline migrates landward, habitats and flood hazard areas will also shift. Past development of residential, commercial, and public access infrastructure may limit the flexibility of set-backs or adjustments to the Bay shoreline.
1.3.1 Extreme Heat & Storm Events
California in general should expect overall hotter and drier conditions with a reduction in winter rain (and concurrent snow in the mountains), as well as increased average temperatures. There is a high likelihood that extreme weather events, including heat waves, wildfires, droughts, and floods will be among the earliest climate impacts experienced.9 In San Mateo County, higher average sea levels means that storms will impact the Pacific coast and Bay shore more severely with higher storm surges, more extensive inland flooding, and increased erosion. If more frequent or severe natural disasters occur, more emergency and public health services will be needed to deal with the consequences.
Heat related illness and mortality are expected to increase. Though extreme heat events in coastal areas like San Mateo County are not expected to be as severe or as long-lasting as further inland, the resident population is not as well prepared or equipped to deal with higher temperatures. Air conditioning is far less common, for example. Outdoor workers, elderly populations, and infants are particularly vulnerable to extreme temperatures.
Higher temperatures and drier summer conditions produce higher levels of ozone, which can exacerbate respiratory illnesses, particularly among vulnerable
9 California Natural Resources Agency, 2009, California Climate Adaptation Strategy, http://www.climatechange.ca.gov/adaptation/
RICAPS CAP Template Version 4 January 8, 2013 page 9

populations such as children and the elderly. Higher temperatures and drier conditions can also increase the potential for wildfires, which could lead to declines in air quality and also cause negative impacts to respiratory and cardiovascular health.
Local agriculture is also likely to be impacted by extreme weather events, higher temperatures, and less water availability for agricultural production, resulting in lower production and a potential decline in food security.
Additional Resources about Climate Change
1.3.2 Public Health
Most Californians are not aware of recent statistics that suggest that California is home to the worst air quality in the nation, with over 90% of Californians breathing unhealthy air. According to the California Air Resources Board, unhealthy levels of ozone (smog) and particulate matter annually contribute to:
19,000 premature deaths
9,400 hospital admissions for respiratory and cardiovascular disease
280,000 asthma and other lower respiratory symptoms
RICAPS CAP Template Version 4 January 8, 2013 page 10
International Panel of Climate Change Fifth Assessment Report: https://www.ipcc.ch/report/ar5/
U.S. Global Change Research Program: http://www.globalchange.gov/publications/reports/scientific-assessments/us-impacts
Pew Center on Climate Change: http://www.pewclimate.org/
National Ocean and Aeronautical Administration (NOAA) http://www.climate.gov/#Data_And_services
U.S. Environmental Protection Agency Climate Change Indicators: http://www.epa.gov/climatechange/indicators.html
Real Climate: http://www.realclimate.org/

22,000 cases of acute bronchitis
Millions of school and work days lost due to respiratory conditions10
In addition, climate change, including increased summer temperatures, can have adverse effects for the health of City of [CITY]’s residents and workers, especially the vulnerable populations such as children, seniors, and those with existing chronic illnesses, as mentioned in Section 1.3.1.
San Mateo County Health System, in accordance with the Centers for Disease Control, serves a number of functions to reduce health risks related to climate change. These include informing cities about the risk to public health from climate change, creating tools that support decision-making and capacity building related to mitigating adverse health outcomes from climate change, and serving as a credible leader in planning for the public health impacts of climate change.
The City of [CITY] intends to work with the San Mateo County Health System to mitigate public health dangers and maintain or improve long-term health by encouraging local residents and workers to be part of the solution. Research shows that individuals who live in mixed-use and walkable communities have a 35 percent lower risk of obesity.11 Another study estimates that the walking associated with transit use saves individuals $5,500 over the course of their life by reducing obesity-related medical costs.12
City of [CITY] and the Health System will support programs that promote more walkable and bikeable cities, which not only promote healthier lifestyles, but also decrease reliance on vehicles that contribute to climate change.
1.4 State Policy and Regulatory Context The State of California has been a leader in developing and implementing policies and regulations to directly address the risk of severe climate change. Below we summarize the key statewide legislation aimed to reduce GHG emissions. There are many supporting pieces of legislation and other related initiatives that are sector specific. These are more fully described in Chapter 3. 10 American Lung Association. Land Use, Climate Change & Public Health Issue Brief: Improving Public Health and combating climate change through sustainable land use and transportation planning. Spring 2010.11 Frank, Lawrence D., et al. Obesity relationships with community design, physical activity, and time spent in cars. American Journal of Preventive Medicine, Volume 27, Issue 2 , Pages 87-96, August 2004.12 Active Living Research; Robert Wood Johnson Foundation, 2009
RICAPS CAP Template Version 4 January 8, 2013 page 11
Susan Wright, 01/08/13,
Cities in other counties can enter the name of the local health system.
Susan Wright, 01/08/13,
Cities in other counties can enter the name of the local health system.

Assembly Bill 32, the California Global Warming Solutions Act of 2006
In September 2006, the California legislature passed Assembly Bill (AB) 32, which set the goal of reducing GHG emissions back to 1990 levels by 2020. AB 32 finds and declares that “global warming poses a serious threat to economic well-being, public health, natural resources and the environment of California.” The legislation granted authority to the Air Resources Board to establish multiple mechanisms (regulatory, reporting, voluntary and market) to achieve quantifiable reductions in GHG emissions to meet the statewide goal.
Senate Bill 32, the California Global Warming Solutions Act of 2006 Emissions Limit
In September of 2016, the California legislature approved Senate Bill (SB) 32, which extends the state’s targets for reducing greenhouse gas from 2020 to 2030. Under SB 32, the state will reduce greenhouse gas emissions 40 percent below 1990 levels by 2030. The bill piggybacks on AB 32, the California Global Warming Solutions Act of 2006, which calls for California to reduce greenhouse gases to 1990 levels by 2020. Governor Jerry Brown set the targets contained in SB 32 in an executive order in 2015. SB 32 codifies the targets set by the executive order.
Assembly Bill 197, State Air Resources Board Greenhouse Gases Regulations
In September of 2016, the California legislature approved Assembly Bill 197, a bill linked to SB 32, which increases legislative oversight over the California Air Resources Board and directs the California Air Resources Board to prioritize disadvantaged communities in its climate-change regulations, and to evaluate the cost-effectiveness of measures it considers. AB 197 requires ARB to "protect the state's most impacted and disadvantaged communities … [and] consider the social costs of the emissions of greenhouse gases" when developing climate change programs. The bill also adds two new legislatively appointed non-voting members to the ARB Board, increasing the Legislature's role in the ARB Board's decisions.
Senate Bill 350, Clean Energy and Pollution Reduction Act of 2015
In October of 2015, Senate Bill (SB) 350 was signed into law, establishing new clean energy, clean air and greenhouse gas reduction goals for 2030 and beyond. SB 350 codifies Governor Jerry Brown’s aggressive clean energy goals and establishes California’s 2030 greenhouse gas reduction target of 40 percent below 1990 levels. To achieve this goal, SB 350 increases California’s renewable electricity procurement goal from 33 percent by 2020 (legislation originally enacted in 2002) to 50 percent by 2030. Renewable resources include wind, solar, geothermal, wave, and small hydroelectric power. In addition, SB 350 requires the state to double statewide energy efficiency savings in electricity and natural gas end uses by 2030.
RICAPS CAP Template Version 4 January 8, 2013 page 12

California Energy Efficiency Strategic Plan of 2008
In September of 2008, the CPUC adopted California’s first Long Term Energy Efficiency Strategic Plan, presenting a single roadmap to achieve maximum energy savings across all major groups and sectors in California. The Strategic Plan was subsequently updated in January 2011 to include a lighting chapter. The Strategic Plan sets goals of all new residential construction and all new commercial construction in California to be zero net energy (ZNE) by 2020 and 2030, respectively. Additionally, the Strategic Plan sets goals of 50% of existing commercial building to be retrofit to ZNE by 2030 and all new state buildings and major renovations to be ZNE by 2025.
Senate Bill 1275, Charge Ahead Initiative
In September of 2014, Senate Bill (SB) 1275 was signed into law, establishing a state goal of 1 million zero-emissions and near-zero-emission vehicles in service by 2020 and directing the Air Resources Board to develop a long-term funding plan to meet this goal. SB 1275 also established the Charge Ahead California Initiative requiring planning and reporting on vehicle incentive programs, and increasing access to and benefits from zero-emissions vehicles for disadvantaged, low-income, and moderate-income communities and consumers.
Assembly Bill 1493, the Pavley Bill
In 2002, the California legislature enacted Assembly Bill (AB) 1493 (aka “the Pavley Bill”), which directs the Air Resources Board to adopt standards that will achieve "the maximum feasible and cost-effective reduction of greenhouse gas emissions from motor vehicles," taking into account environmental, social, technological, and economic factors. In September 2009, the Air Resources Board adopted amendments to the “Pavley” regulations to reduce GHG emissions in new passenger vehicles from 2009 through 2016. The Pavley Bill is considered to be the national model for vehicle emissions standards. In January of 2012, the Air Resources Board approved a new emissions-control program for model years 2017 through 2025. The program combines the control of smog, soot and global warming gases and requirement for greater numbers of zero-emission vehicles into a single package of standards called Advanced Clean Cars.
Assembly Bill 117
AB 117 establishes the creation of Community Choice Aggregation that foster clean and renewable energy markets. Community Choice Aggregations (CCA) allow cities and counties to aggregate the buying power of individual. The Californian Community Choice Aggregation markets were created as an answer to the Brown Outs and energy shortages of the early 2000’s. AB 117 was passed in 2002 as an answer to California being more energy independent
RICAPS CAP Template Version 4 January 8, 2013 page 13

by using more alternative and renewable energy sources in an energy portfolio. With AB 117 municipalities can provide alternative energy choices to their local carrier (e.g. PG&E). Marin Clean Energy was the first CCA in the state of California in 2010 to go online with a 50% - 100% clean energy portfolio. Peninsula Clean Energy (PCE) was created in February 2016 when all 20 towns/cities in San Mateo County, plus the County of San Mateo, voted unanimously to form a Joint Powers Authority to administer the program. PCE is a public, locally-controlled electricity provider that gives PG&E customers in San Mateo County the choice of having 50% to 100% of their electricity supplied from clean, renewable sources at competitive rates. CCAs are governed by the California Public Utilities Commission (CPUC). SB 790 further ensures fair and transparent competition by creating a code of conduct and guiding principles for entrants into the CCA field.
Senate Bill 375
In September 2008, Senate Bill (SB) 375 was signed into law to provide emissions reduction goals related to vehicle-miles traveled on a regional planning level. The bill seeks to align regional transportation planning efforts with regional GHG reduction targets and land use and housing allocations. SB 375 requires metropolitan planning organizations (MPOs) to adopt a sustainable communities strategy or alternative planning strategy. The Air Resources Board, in consultation with the MPOs, has set a per capita GHG reduction target for emissions of passenger cars and light trucks in the San Francisco Bay Area of 7 percent below 2005 levels by 2020, and 15 percent below 2005 levels by 2035.
Senate Bill 97, CEQA Guidelines for Addressing GHG Emissions
California Environmental Quality Act (CEQA) requires public agencies to review the environmental impacts of proposed projects, including General Plans, Specific Plans and specific kinds of development projects. In February 2010, the California Office of Administrative Law approved the recommended amendments to the State CEQA Guidelines for addressing GHG emissions. The amendments were developed to provide guidance to public agencies regarding the analysis, mitigation, and effects of GHG emissions in draft CEQA documents.
Bay Area Air Quality Management District CEQA Guidelines
The Bay Area Air Quality Management District (BAAQMD) encourages local governments to adopt a GHG Reduction Strategy that is consistent with AB 32 goals. The GHG Reduction Strategy may streamline environmental review of community development projects. According to the BAAQMD, if a project is consistent with a GHG Reduction Strategy, then it can be presumed that the project will not have significant GHG impacts. This approach is consistent with the following State CEQA Guidelines, Section 15183.5.a:
“Lead agencies may analyze and mitigate the significant impacts of greenhouse gas
RICAPS CAP Template Version 4 January 8, 2013 page 14
emissions at a programmatic level, such as…a plan to reduce greenhouse gas emissions. Later project-specific environmental documents may tier from and/or incorporate by reference that existing programmatic review. Project-specific environmental documents may rely on an [Environmental Impact Report] containing a programmatic analysis of greenhouse gas emissions.”
This Plan provides a foundation for future development efforts in the community. It is expected that environmental documents for future development projects will identify and incorporate all applicable voluntary and mandatory measures from this Plan for projects undergoing CEQA review.
1.5 Regional EffortsThe following regional efforts promoting GHG reductions are already under way:
City/County Association of Governments of San Mateo County (C/CAG). C/CAG is a council of governments consisting of the County of San Mateo and its 20 cities. The organization deals with topics such as transportation, air quality, stormwater runoff, hazardous waste, solid waste and recycling, land use near airports, abandoned vehicle abatement, and issues that affect quality of life in general. C/CAG supports a number of sustainability initiatives including the following:
San Mateo County Energy Watch. This program is a local government partnership between PG&E and C/CAG to promote energy efficiency in municipal and non-profit buildings. The program is managed and staffed by RecycleWorks, a program of the County of San Mateo.
Congestion Management Agency. C/CAG serves as the Congestion Management Agency for San Mateo County to identify strategies to respond to future transportation needs, develop procedures to alleviate and control congestion, and promote countywide solutions.
Sustainable Communities Strategy/Regional Transportation Plan. C/CAG is collaborating with local governments in San Mateo County as well as regional agencies to develop a Sustainable Communities Strategy (SCS) in compliance with the requirements of SB 375. The SCS will facilitate more focused development in priority development areas near public transit stations. The aim of the San Mateo County SCS is to better integrate land use with public transportation in order to reduce GHG emissions.
Energy Upgrade California in San Mateo County. This San Mateo program aims to help residential consumers make improvements to their homes so they will use less energy,
RICAPS CAP Template Version 4 January 8, 2013 page 15

conserve water and other natural resources, and become healthier and more comfortable. The program connects homeowners with participating contractors who can help plan and complete energy efficiency projects and take advantage of rebates. Energy Upgrade California is a partnership among California counties, cities, non-profit organizations and the state’s investor-owned utilities (e.g. PG&E).More information on this program can be found online at : http://www.energyupgradeca.org/en/
Joint Venture: Silicon Valley Network. Established in 1993, Joint Venture: Silicon Valley Network provides analysis and action on issues affecting the local economy and quality of life. The organization brings together established and emerging leaders -- from business, government, academia, labor, and the broader community -- to spotlight issues and work toward innovative solutions. Joint Venture is dedicated to promoting climate-friendly activities that help the local economy and improve quality of life in Silicon Valley.
PG&E’s Sustainable Communities Team. A PG&E Community Energy Manager has been assigned to San Mateo County to work jointly with each municipality to develop a comprehensive energy management strategy that the city can implement across institutional, residential, business, and industrial sectors. In addition, PG&E can provide city and county energy usage data, GHG inventory assistance and information on innovative pilot grant funding for projects that help to reduce GHG emissions in each community.
Silicon Valley Leadership Group (SVLG) Bay Area Climate Compact. SVLG is an organization consisting of principal officers and senior managers of member companies to work cooperatively with local, regional, state and federal government officials to address major public policy issues affecting the economic health and quality of life in Silicon Valley. In 2009, SVLG organized the Bay Area Climate Compact, which establishes a framework for regional cooperation and setting aggressive goals for the reduction of greenhouse gas emissions.
Sustainable San Mateo County (SSMC). SSMC was established in 1992 by a group of San Mateo County citizens who sought to create a broader awareness of the sustainability concept. SSMC supports multiple programs to promote energy efficiency, alternative transportation and education on sustainability concepts which focus on the intersections of the environment, the economy and social equity. SSMC’s core programs include an Indicators Report that has been produced annually since 1997 and the Sustainable San Mateo County Awards Event which has been held annually since 1999.
Sustainable Silicon Valley (SSV). SSV is a collaboration of businesses, governments, and non-governmental organizations that are identifying and addressing environmental and resource pressures in Silicon Valley. As its first initiative, SSV engage Silicon Valley organizations to work towards a goal of reducing regional carbon dioxide emissions 20% below 1990 levels by 2010. SSV’s Net Positive Bay Area 2050 goals are to 1) Produce more renewable energy than
RICAPS CAP Template Version 4 January 8, 2013 page 16

we consume 2) Sequester more carbon than we emit and 3) Optimize water resources to ensure water resilience. Their current strategy focus on facilitating measure projects, education, events and polices that deliver solutions by activating SSV’s member network to reach the Net Positive Bay Area goals.
1.6 Local efforts While cities may be vulnerable to climate impacts, they also can play a critical role in reducing the emissions that exacerbate climate impacts. With their concentrations of people and activities at high densities, cities can use resources such as energy, materials, and land more efficiently. Cities are places where high-level knowledge-based activities congregate, along with the expertise needed to tackle climate change. This is especially true in the San Francisco Bay Area.
AB 32 identifies local governments as essential partners in achieving California’s goal to reduce GHG emissions. Local governments have primary authority to plan, zone, and permit how and where land is developed to accommodate population growth and the changing needs of their jurisdiction. Cities have varying degrees of responsibility for the collection and processing of waste and have responsibility for other environmental infrastructures, such as energy and water. Cities own and manage buildings and vehicle fleets and are able to form partnerships with private interests to mobilize and coordinate community action. Furthermore, cities are uniquely positioned to promote economic development that emphasizes sustainable development and local green-collar jobs.
To date, the City of [CITY] has undertaken the following sustainability efforts:
EACH city to insert summary of city-specific sustainability initiatives underway, including membership to relevant climate change groups (e.g. U.S. Mayor’s Climate Protection Agreement, The Climate Registry, SSV), and any sustainability or climate actions enacted to date. Also mention any participating citizens groups.
Describe how the CAP is/ is not being done in connection with a General Plan update (or specific elements); description and results from any citizen task force;
1.7 City of [CITY]’s Climate Action Plan ProcessThis climate action plan was developed in partnership with the City and County Association of
Governments of San Mateo County (C/CAG). The climate action plan template project
sponsored by C/CAG assists member jurisdictions and other interested local governments to
develop climate action plans that are consistent with California Environmental Quality Act
RICAPS CAP Template Version 4 January 8, 2013 page 17

(CEQA) guidelines, including both the CEQA Guidelines Amendments effective March 18, 2010,
and the BAAQMD’s CEQA Air Quality Guidelines (Updated May 2011). By combining
resources, the climate action plan template project promotes high quality climate action plans
that can be used to meet regulatory requirements and support planning efforts to reduce GHG
emissions. The template project and [CITY]’s climate strategy is based on the ICLEI ─ Local
Governments for Sustainability (ICLEI) 5-Milestone process as seen in the framework below.
1.7.1 Framework for Climate Action
The ICLEI 5-Milestone process is a management process based on increasing knowledge through each step to achieve the targeted GHG emissions reductions.
Figure 4: Iterative Management Processes for Climate Action (Source: ICLEI)
RICAPS CAP Template Version 4 January 8, 2013 page 18

The ICLEI 5-Milestone Process
Milestone 1Inventory Emissions
Milestone 2Establish Target
Milestone 3Develop Climate
Action Plan
Milestone 5Monitor/Evaluate
Progress
Milestone 4Implement Climate
Action Plan
Leadership Commitment
Leadership Commitment: Define the overall vision and goals for the community.
Milestone 1 (Inventory Emissions): Conduct a baseline emissions inventory and forecast.
Milestone 2 (Establish Target): Adopt an emissions reduction target for the forecast year.
Milestone 3 (Develop Climate Action Plan): Identify feasible and suitable strategies and supporting actions to reduce emissions and achieve co-benefits aligned with the overall vision and goals.
Milestone 4 (Implement Climate Action Plan): Enact the plan.
Milestone 5 (Monitor/Evaluate Progress): Establish feedback loops to assess and improve performance, including an assessment and adjustment of the necessary human, financial and data resources.
In November 2009, all San Mateo County member jurisdictions completed their 2005 community and municipal GHG inventories as part of a joint effort with ICLEI, Joint Venture Silicon Valley Network, the County of San Mateo and funded by C/CAG. This C/CAG climate action plan template project follows this framework by assisting member jurisdictions with Milestones 2 and 3. City of [CITY] is responsible for implementing the actions identified in this climate action plan to complete Milestone 4.
To support Milestone 5, C/CAG is developing forecasting and calculation tools to allow its member jurisdictions to track total community GHG emissions. The tool will assist cities to
RICAPS CAP Template Version 4 January 8, 2013 page 19
monitor the effectiveness of emissions reduction efforts. Specifically, C/CAG is working with Hara, Inc., a software provider, to develop a customized online solution that may be used by each City in the County to track GHG emissions and emission reductions achieved from various strategies. More information about the Hara tool is provided in the Users Guide for this Template document.
1.7.2 Public Outreach and Community Engagement
EACH CITY to describe how its outreach and community engagement activities, including number of community workshops, presentations to businesses,
community surveys (e.g. web survey), use of the city website and other activities to involve the public in the development of this climate action plan
RICAPS CAP Template Version 4 January 8, 2013 page 20

Greenhouse Gas Inventory and ForecastThe emissions inventory provides an important foundation for the climate action plan, providing a baseline year, [BaselineYear], against which progress toward the City goal of reducing greenhouse emissions [Target%] by [TargetYear] can be measured. The completed Plan will include a business-as-usual (BAU) forecast of GHG emissions, which will enable the City of [CITY] to estimate the amount of emissions reductions needed to meet its goal.
1.8 Inventory Sources and Data Collection ProcessAn inventory of GHG emissions requires the collection of information (data) from a variety of sectors and sources. The emissions inventory completed for the City of [CITY] follows the standard outlined in the BAAQMD’s GHG Plan Level Quantification Guidance (dated May 2012), as well as the Local Government Operations Protocol13. Table 1 summarizes the sectors, emissions sources, and energy types included in our GHG inventory.
Table 1: Sectors and Emissions in the GHG Inventory
13 Local Government Operations Protocol – For the quantification and reporting of greenhouse gas emissions inventories (Version 1.0). Developed in partnership by California Air Resources Board, California Climate Action Registry, ICLEI – Local Governments for Sustainability, and The Climate Registry. September 2008. Note that a newer version (version 1.1, dated May 2010) of the LGOP is available; however, at the time the GHG inventory was completed for the City of [CITY], version 1.0 was the only version available.
RICAPS CAP Template Version 4 January 8, 2013 page 21

Sector Emissions sources Energy types
Residential Energy and water use in residential buildings ElectricityNatural gas
Commercial Energy and water use in commercial, government and institutional buildings
ElectricityNatural gas
Industrial Energy and water use in industrial facilities, and processes
ElectricityNatural gas
Transportation and Land Use*
All road vehiclesPublic transportationLight railOff-road vehicles/equipment
GasolineDieselCompressed natural gasLiquefied natural gasBiodiesel
Waste LandfillsWaste stream
Landfill gas (methane)
Wastewater** Process and fugitive emissions from treating wastewater, and associated stationary emissions
Not applicable
Water** To be determined To be determinedStationary Sources**
Stationary combustion of fuel in various equipment, such as boilers and backup generators.
Various – may include natural gas, propane, and diesel
* Some sectors may be updated in a new version of the BAAQMD GHG Plan Level Quantification Guidance.14
** Water, Wastewater, and Staionary Sources were included in the 2010 inventory, but not the 2005 inventory.
While the BAAQMD GHG Plan Level Guidance recommends the inclusion of GHG emissions from water processing, delivery and wastewater treatment that occurs outside of the city’s boundary, these emissions (are) (are not) included in [CITY]’s baseline inventory due to lack of accurate data on water usage in the City of [CITY] in the baseline year, and lack of data on the energy used for water processing and delivery and wastewater treatment in the baseline year. The following are emission sources that are mentioned in the BAAQMD GHG Plan Level Guidance, but were excluded from the City’s inventory because they are not applicable in [CITY]: Airports and sea ports, Non-road vehicle use (planes, trains, ships), and water travel.
In 2012, ICLEI developed the U.S. Community Protocol15, which is the first U.S.-specific protocol for developing community-wide greenhouse gas emissions estimates. In 2013, ICLEI released an updated Version 1.1 of the U.S. Community Protocol. All future inventories should utilize this protocol. Future inventories will also utilize the most recent version of the Local Government Operations Protocol, as well as any updated guidance from the BAAQMD.
The industry-accepted methodology for quantifying a community-wide GHG emissions inventory focuses on emissions that occur from combustion sources within city limits and from electricity consumption. In the future, there may be the opportunity and need to quantity GHG emissions associated with the goods and products procured by communities and its residents. This type of lifecycle emissions accounting is not included in this climate action plan.
14 For updates to the GHG Plan Level Quantification Guidance, check the BAAQMD website: http://www.baaqmd.gov/Divisions/Planning-and-Research/CEQA-GUIDELINES/Tools-and-Methodology.aspx15 U.S. Community Protocol for Accounting and Reporting of Greenhouse Gas Emissions (Version 1.0). Developed by ICLEI – Local Governments for Sustainability. October 2012.
RICAPS CAP Template Version 4 January 8, 2013 page 22
admin, 01/08/13,
Cities will need to update this section as appropriate to reflect the contents of their baseline inventories.
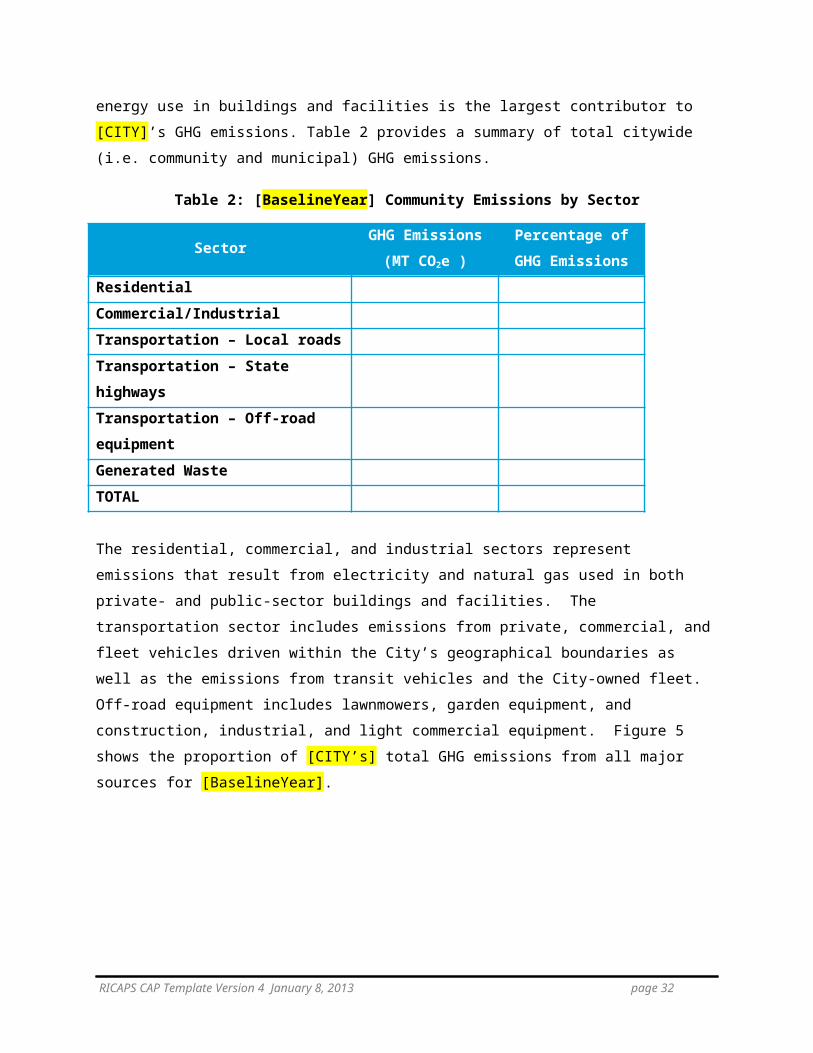
1.9 Baseline Emissions Inventory for [BaselineYear]In the base year of [BaselineYear], the City of [CITY] emitted approximately [XX] metric tons of carbon dioxide equivalent (CO2e) from the residential, commercial, industrial, transportation, waste, and municipal sectors.16 Municipal sector emissions are calculated and reported because the City of [CITY] generally has more control over these emissions than emissions from the other sectors, and thus the City of [CITY] can implement specific policies and programs to reduce these municipal emissions. However, in the context of the community-wide inventory, the municipal emissions are included in the commercial/industrial sector. Burning fossil fuels in vehicles and for energy use in buildings and facilities is the largest contributor to [CITY]’s GHG emissions. Table 2 provides a summary of total citywide (i.e. community and municipal) GHG emissions.
Table 2: [BaselineYear] Community Emissions by Sector
SectorGHG Emissions
(MT CO2e )Percentage of
GHG EmissionsResidentialCommercial/IndustrialTransportation – Local roadsTransportation – State highwaysTransportation – Off-road equipmentGenerated WasteTOTAL
The residential, commercial, and industrial sectors represent emissions that result from electricity and natural gas used in both private- and public-sector buildings and facilities. The transportation sector includes emissions from private, commercial, and fleet vehicles driven within the City’s geographical boundaries as well as the emissions from transit vehicles and the City-owned fleet. Off-road equipment includes lawnmowers, garden equipment, and construction, industrial, and light commercial equipment. Figure 5 shows the proportion of [CITY’s] total GHG emissions from all major sources for [BaselineYear].
16 Carbon dioxide equivalent is a unit of measure that normalizes the varying climate warming potencies of all six GHG emissions, which are carbon dioxide (CO2), methane (CH4), nitrous oxide (N2O), hydrofluorocarbons (HFCs), perfluorocarbons (PFCs), and sulfur hexafluoride (SF6). For example, one metric ton of methane is equivalent to 21 metric tons of CO2e. One metric ton of nitrous oxide is 210 metric tons of CO2e.
RICAPS CAP Template Version 4 January 8, 2013 page 23
Figure 5: Community Emissions by Sector17 ([BaselineYear])
EACH CITY to customize this figure/Example Only
As shown above, the two largest categories of emissions are related to transportation (highway travel, local travel, and off-road equipment) and building energy use (both residential and commercial & industrial).
1.9.1 Electricity and Natural Gas Emissions
EACH CITY to describe the sources of electricity and natural gas emissions in their community. For example, total kWh and therms and any sector breakdowns. Note that BAAQMD also requires that direct access electricity and natural gas emissions be reported, in addition to PG&E. EACH CITY to describe the source of the data used in their baseline inventory. Direct access is when end use customer buys electricity or natural gas on the wholesale market, rather than from PG&E.
Figure 6: Building Energy Use – Fuel Type
17 While [CITY’s] water emissions are not displayed separately in the chart above, they have been accounted for in the commercial/industrial and residential building energy sectors.
RICAPS CAP Template Version 4 January 8, 2013 page 24

EACH CITY to customize this figure/Example Only
Buildings electricity
39%
Buildings natural
gas61%
It is important to note that emissions associated with the generation of electricity, which make up a significant portion of the greenhouse gasses associated with building energy, can vary widely from year to year. The GHG emissions associated with electricity use is based on an emissions factor specific to PG&E’s territory and is calculated annually by PG&E and then made available to Cities. The source of the emission factor used for the [BaselineYear] baseline inventory is the PG&E Power/Utility Protocol (PUP) spreadsheet of the PG&E California Climate Action Registry Report. In future inventory years, the emission factor may be found in the Additional Optional Information tab of PG&E’s Electric Power Sector report spreadsheet, which is part of PG&E’s Report to The Climate Registry. PG&E’s specific emissions factor is calculated by dividing PG&E’s total emissions from their power plants (in pounds of CO2) by the total amount of electricity (in megawatt-hours or MWh) delivered to end users. This factor varies year over year because PG&E’s electricity sources change. For instance, the utility specific emissions factor for PG&E in 2006 was 455.81 lbs/MWh whereas in 2008 it was 641.35 lbs/MWh. For PG&E, the variance is typically dependent on the availability of hydroelectric resources. During low precipitation years, there is less water available to generate emissions free hydropower. Because of this, PG&E must compensate by supplying more electricity generated from natural gas or coal.
For the [BaselineYear] baseline inventory, the [BaselineYear] emissions factor was used. For future inventories, a three-year average emissions factor could be used to address the large variance that may occur from year to year.
Emissions from natural gas usage are calculated using the emissions factor from [EACH CITY to customize this section if necessary. Most Cities are using emissions factors from the Local Government Operations Protocol (state which version), Appendix G.
RICAPS CAP Template Version 4 January 8, 2013 page 25
admin, 01/08/13,
This statement should be reviewed by each City for accuracy. It is assumed that all the baseline inventories used the emission factor from the PG&E PUP spreadsheet.

1.9.2 Transportation Emissions
EACH CITY to summarize the amount of emissions associated with transportation, and methodology used to estimate the amount. Include the data source and source of any emissions factors.
Figure 7: Transportation Emissions – Highways v. Local Travel
EACH CITY to customize this figure/Example Only
Local Roads23%
State Highways
77%
Figure 8: Transportation Emissions – Residential v. Commercial Off-road Equipment EACH CITY to customize this figure/Example Only
Residential 20%
Commercial80%
1.9.3 Solid Waste
EACH CITY to summarize the amount of emissions associated with solid waste, and methodology used to estimate the amount. Include the data source and source of any emissions factors.
RICAPS CAP Template Version 4 January 8, 2013 page 26

Emissions from waste result from organic materials decomposing in the anaerobic environment of a landfill that produces methane—a GHG 21 times more potent than carbon dioxide. Organic materials (e.g., paper, plant debris, food waste, and so forth) generate methane within the anaerobic environment of a landfill while non-organic materials do not (e.g., metal, glass, and so on). Table 3 shows the approximate breakdown of the materials [CITY] sent to landfills in [BaselineYear]. Materials that do not release GHGs as they decompose are included in the “All Other Waste” category. [Note that a CITY may update Table 3 and may update the solid waste GHG calculation methodology if the CITY has access to CITY-specific waste characterization data.]
Table 3: Assumed Waste Composition18
EACH CITY to customize this figure/Example Only
Waste Type Waste Share
Paper Products 21.0 %Food Waste 14.6 %Plant Debris 6.9 %Wood/Textiles 21.8 %All Other Waste 35.7 %Total 100 %
1.9.4 Municipal Operations
EACH CITY to summarize the amount of emissions associated with municipal operations. Include discussion of any specific buildings, facilities or sources which are especially large source of emissions.
18 Waste characterization: CIWMB 2004 Statewide Waste Characterization Study. This state average waste characterization accounts for residential, commercial and self-haul waste. http://www.ciwmb.ca.gov/Publications/default.asp?pubid=1097
RICAPS CAP Template Version 4 January 8, 2013 page 27

Table 4: [BaselineYear] [CITY] Government Operations Emissions by Sector
SectorGreenhouse Gas Emissions
(metric tons CO2e)Employee Commute XXBuildings and Facilities XXVehicle Fleet XXWastewater XXGovernment-generated solid waste XXWater transport XXPublic lighting XXTOTAL X,XXX
Figure 9: Municipal Operations – Greenhouse Gas Emissions
EACH CITY to customize this figure/Example Only
City fleet vehicles29%
Government generated waste
17%
Public lighting4%
Buildings and facilities
4%
Employee commuting
46%
1.9.5 Emissions Forecast for 2020 and 2035
Based on the [BaselineYear] community and municipal operations emissions inventories, the City of [CITY] projected a forecast of future emissions for the year 2020. The emission forecast represents a “business-as-usual” prediction of how GHG emissions would grow in the absence of GHG policy. Conducting an emissions forecast is essential for developing the climate action plan because one must compare future reductions with future emissions levels, not current levels.
RICAPS CAP Template Version 4 January 8, 2013 page 28

The projected business-as-usual GHG emissions are based on the emissions from the existing growth pattern and general plan prior to the adoption of this climate action plan. More specifically, business-as-usual emissions would occur if the City of [CITY] were to continue its [BaselineYear] patterns of travel, energy and water consumption, and waste generation and disposal. Therefore, the business-as-usual emissions are projected in the absence of any mitigation measures, policies or actions that would reduce emissions over time, including landmark state legislation described in section 1.3. Programs, policies, and measures implemented after [BaselineYear] are considered beyond business-as-usual. The projections from the baseline year of [BaselineYear] uses growth factors specific to each of the different economic sectors. Table 5 and 7 below summarizes the results of the forecast.
Table 5: [CITY] “Business as Usual” Emissions Forecast for 2020
Emissions Sources[
BaselineYear](MTCO2e)
2020 BAU Emissions (MT CO2e)
Annual Growth Rate
Percent change from 2005 to
2020Residential xx xx xx xxCommercial/Industrial xx xx xx xxTransportation xx xx xx xxWaste xx xx xx xxTOTAL xx xx xx xx
We projected the emissions forecast for each sector, because specific factors affect each sector differently (e.g. new building energy codes or new fuel economy standards for vehicles). This approach provides a better approximation of future emissions. The following points explain how the emissions forecast was estimated for each sector:
For the residential energy sector, the compounded annual population growth rate was calculated from [BaselineYear] through 2020 using population projections from Association of Bay Area Governments (ABAG).
For the commercial energy sector, the [CITY] relied on the analysis contained within “California Energy Demand 2008-2018: Staff Revised Forecast,”19 a report by the California Energy Commission (CEC), which shows that commercial floor space and the number of jobs have closely tracked the growth in energy use in the commercial sector. Using regional job projections for the San Francisco Bay Area from ABAG’s Projections 2009,20 it was calculated that the compounded annual growth in energy use in the commercial sector from 2005 to 2020 to be [xx] percent.
19 http://www.energy.ca.gov/2007publications/CEC-200-2007-015/CEC-200-2007-015-SF2.PDF 20 http://www.abag.ca.gov/planning/currentfcst/regional.html#
RICAPS CAP Template Version 4 January 8, 2013 page 29
Betty Seto, 01/08/13,
We expect that most cities would use this method. If more recent data and projections are available from an update to the General Plan, then use those projections instead of the ABAG data.
Betty Seto, 01/08/13,
We expect that most cities would use this method. If more recent data and projections are available from an update to the General Plan, then use those projections instead of the ABAG data.
For transportation, the City of [CITY] relied on “Transportation Energy Forecasts for the 2007 Integrated Energy Policy Report,” in which the CEC projects that on-road vehicle miles traveled (VMT) will increase at an annual rate of 1.509 percent per year through 2020.21 The Federal Corporate Average Fuel Economy standards and the State of California’s pending tailpipe emission standards could significantly reduce the demand for transportation fuel in [CITY]. An analysis of potential fuel savings from these measures has not been included in this business-as-usual forecast. Regardless of future changes in the composition of vehicles on the road as a result of state or federal rulemaking, emissions from the transportation sector will continue to be largely determined by growth in VMT.
For waste-related emissions growth, the primary determinate for growth in emissions for the waste sector is population. Therefore, the compounded annual population growth rate for [BaselineYear] to 2020 of [xx] percent (the same as the residential sector projection) was used to estimate future emissions in the waste sector.
1.10 Emission Reduction TargetsThe California AB 32 Scoping Plan seeks to bring California to a low carbon future, reaching 1990 emissions levels by 2020. As part of that reduction, the plan asks municipal governments to reduce their emissions by at least 15 percent by 2020 compared with current levels (current levels are defined as 2008 levels or earlier). The plan also directs local governments to assist the state in meeting California’s emissions goals. Many cities have consequently adopted community-wide emissions reduction targets at least 15 percent below 2005 levels by 2020. Some cities in the Bay Area have sought even stricter emissions targets. For example, since 2002, the City of San Francisco has sought to reduce its emissions to 20 percent below 1990 levels by 201222. Seattle, Portland, and Denver have set similar targets. However, the vast majority of Bay Area cities have adopted the 2020 target of 15 percent reduction compared with 2005 levels as it is in line with State objectives and technically achievable.
This climate action plan summarizes the actions that City of [CITY] is planning to take to reduce emissions within our community.
1.10.1 Reductions from State-Level Actions
In addition to the actions outlined here, regulations aimed at reducing GHG emissions at the state and regional levels will also contribute to emissions reductions in [CITY]. For example, the California Renewable Portfolio Standard (RPS) mandates that 33 percent of electricity sold by
21 Report available at: http://www.energy.ca.gov/2007publications/CEC-600-2007-009/CEC-600-2007-009-SF.PDF. Compounded Annual growth rate for 2005-2020 is calculated from Table 4 on page 12. 22 City of San Francisco 2004. Climate Action Plan. http://www.sfenvironment.org/downloads/library/climateactionplan.pdf
RICAPS CAP Template Version 4 January 8, 2013 page 30
Betty Seto, 01/08/13,
Use this estimate, unless C/CAG has a better estimate for the county.

The City of [CITY] is committing to reducing community-wide greenhouse gas emissions XX percent by 2020, a reduction of XX,XXX metric tons of carbon dioxide equivalent
the State’s investor-owned utilities be generated from renewable resources by 2020. These actions were summarized in Section 1.5 of this report. The impact of state-level actions on reducing local emissions is significant, and is shown in relation to the City of CITY’s emissions baseline, business-as-usual forecast, and reduction target in Figure 9.
A summary of the expected emission reductions from state programs is provided in Table 6 below.
Table 6: Total Emission Reductions from State of California Programs
State Initiative Sector 2020 BAU Emissions in
Sector (MT CO2e)% Reduction from
2020 BAU in SectorReduction in City’s
Emissions (MT CO2e)
AB 1493 (Pavley) Transportation DDDD XX% DDDD
LCFS Transportation DDDD XX% DDDD
33% RPS Electricity (Energy) DDDD XX% DDDD
A. Total Statewide Initiative Emissions Reductions DDDD
1.10.2 The City of [CITY] Reduction Target
Each city to Include: How targets were selected -- top-down, bottoms-up or both (set before the CAP, or based on measures identified in the CAP…).
Each city to discuss selected target(s) -- actual municipal and community targets, expressed in GHGs and kilowatt hours, gallons of water, etc., and as translated into trees, cars and homes via the EPA calculator.
Figure 9 below illustrates how the business-as-usual emissions are estimated to increase, thus widening the emissions reductions needed by 2020. Figure 9 also shows the emissions reductions expected from State-Level actions, and the reductions needed to reach the City of [CITY]’s emission target. The baseline emissions, forecasted emissions, targeted emissions, and emissions needed to reach the target are shown in Table 7.
Figure 10. [City] GHG Reduction Target ([Target%] below [BaselineYear] levels by 2020)
RICAPS CAP Template Version 4 January 8, 2013 page 31
20,000
Betty Seto, 01/08/13,
Each city to customize the graph based on their adopted emissions reduction target.

RICAPS CAP Template Version 4 January 8, 2013 page 32
20,000
75,000
125,000
175,000
225,000
2005
2006
2007
2008
2009
2010
2011
2012
2013
2014
2015
2016
2017
2018
2019
2020
GH
G E
mis
sion
s (M
TCO
2e)
Year
City of Pacifica Community GHG Emissions Projections
Business-as-usual (GHG MTCO2)Reduction Target (15% below 2005)Reductions from State-Level Actions
Table 7: GHG Emissions Projection and Reduction Target
[BaselineYear] Emissions (MTCO2e)
Target Emissions by Target Year(MTCO2e)
2020 BAU Emissions(MTCO2e)
Emissions Reductions
Required(MTCO2e)
140,465 119,395 172,597 53,202
2.
RICAPS CAP Template Version 4 January 8, 2013 page 33
35,000Metric tons
Climate Action Strategies
This climate action plan is a beginning of a journey towards a more sustainable [CITY]. In these pages, the citizens of [CITY] will find policies and programs that aim to reduce emissions, save energy (and money), and help [CITY] continue to be a beautiful and healthy place to live, work, and play as time goes on.
By adopting this climate action plan, the City is committing to take action to reduce GHG emissions. The Plan provides a prioritized list of actions, each of which should be further developed, studied, and vetted independently before being implemented. The programs and policies described give [CITY] a viable path towards reducing emissions that, combined with emissions reductions resulting from State and regional policies, will meet the emissions reduction goals established in AB 32. The previous chapters presented steps 1 and 2 in the Framework for Climate Action (see section 1.6.1): the emissions inventory of [CITY] and the community emissions reduction target. The following sections represent Step 3: the Climate Action Plan.
Each section below outlines the specific actions, which we call “measures,” that seek to reduce GHG emissions from [CITY]. For methodology of how measures were selected and prioritized for action, see Section 4.1. Some measures aim to reduce emissions from the community at large, while other measures may specifically focus on the operations of the City of [CITY]. Also, all measures are assumed to lead to specific, quantifiable reduction of GHG emissions, except for the more general supporting measures described in (if described, name the Section.)
2.1 Energy In the United States, buildings account for 70 percent of total electricity use and
about 40 percent of GHG emissions.23 The State of California has long been a leader in
23 Fuller et al. 2009. Toward a Low-Carbon Economy: Municipal Financing for Energy Efficiency and Solar Power. Environment Magazine
RICAPS CAP Template Version 4 January 8, 2013 page 34
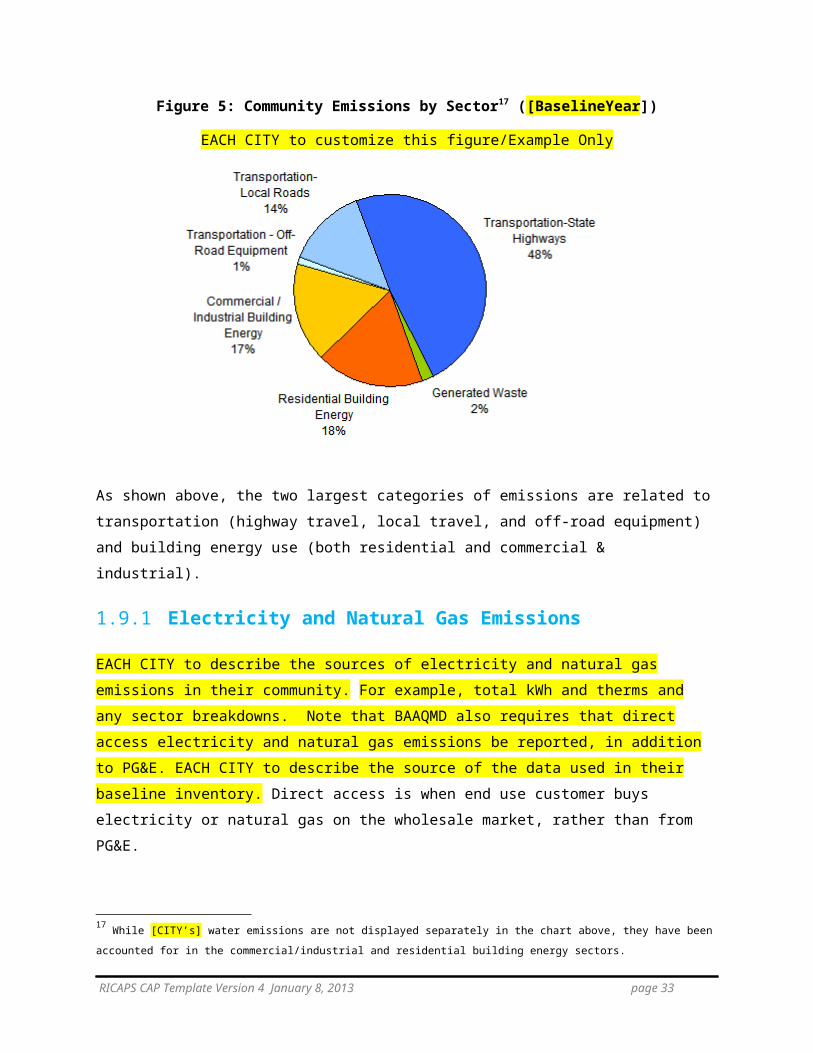
implementing policies aimed at improving the energy efficiency of its building stock. The state is committed to first meet its energy needs “through all available energy efficiency and demand reduction resources that are cost effective, reliable and feasible.”24
Since the 1970s, California has led the nation in developing and implementing successful energy-efficiency efforts. The California Energy Efficiency Standards for Residential and Nonresidential Buildings (Title 24, Part 6 of the California Code of Regulations) mandates minimum levels of energy efficiency in both new construction and renovation projects. These requirements will be updated in 2013 to further increase building and appliance energy efficiency. California has also set targets for “zero net-energy” new buildings, in which efficiency and on-site generation are combined to reduce residential buildings to zero net-energy use by 2020 and commercial buildings by 2030.25
Building energy is the sector with the most immediately achievable and affordable reduction opportunities. Energy efficiency is the most cost-effective measure for GHG reductions and also has numerous co-benefits such as cost savings over time and promotion of green collar jobs. Design and construction of new buildings, or major renovations of existing ones, provides an opportunity to implement energy-saving measures that reduce GHG emissions. Generous utility rebates and federal tax incentives make investing in energy efficiency increasingly attractive. Along with energy efficiency, California has a long history of supporting renewable energy generation. With the idea of “reduce, then produce,” a sensible energy policy seeks to first maximize energy efficiency and then look to generate electricity with low-carbon fuels and renewable resources.
Energy and water use are linked. Energy is needed to transport and to treat water so that it is safe for public consumption. Energy is also used to treat wastewater so that it can be discharged back to the environment. The following diagram demonstrates California’s water use cycle.
24 “Energy Action Plan I”, California Energy Commission, California Public Utilities Commission and Consumer Power and Conservation Financing Authority. May 8, 2003. Available at: http://docs.cpuc.ca.gov/word_pdf/REPORT/28715.pdf 25 California Energy Commission, 2007 Integrated Energy Policy Report, CEC-100-2007-008-CMF
RICAPS CAP Template Version 4 January 8, 2013 page 35

Figure 11: California’s Water Use Cycle
Graphic: California Energy Commission
Energy is used in each step of the process. Water is collected, treated, and distributed to end users in farms, residences, businesses, and industries. Energy, usually natural gas, is used to heat water for use in buildings. Then energy is needed to treat water for discharge back to the environment. Nineteen percent of the state’s electricity and 32 percent of the state’s natural gas is consumed during this cycle.26 58 percent of the electricity and 98.5 percent of the natural gas consumption stems from just the residential, business, and industrial end users.
Reducing water consumption through efficiency and conservation can make a big impact on energy consumption as well as protect against drought, a common problem in California. Senate Bill x7-7 was enacted in November 2009, requiring all water suppliers to increase water use efficiency. The legislation sets an overall goal of reducing per capita urban water use by 20 percent by December 31, 2020. The California State Integrated Water Management Planning Process promotes bringing together and prioritizing water-related efforts in a systematic way to ensure sustainable water uses and reliable water supplies.
In this chapter, we propose City programs and initiatives that will promote energy and water efficiency as well as renewable energy in both existing and new buildings.
26 California Energy Commission 2005. California’s Water-Energy Relationship.
RICAPS CAP Template Version 4 January 8, 2013 page 36

2.1.1 Goal: [EACH city to include a sub-section for each goal]
EACH city to insert goals associated with reducing energy use.
EACH city to insert measures selected. Include a description of each measure, any existing related initiatives or programs, estimated cost, GHG reduction, co-benefits, metrics, etc.
2.2 Transportation and Land UseThirty-eight percent of the California’s GHG emissions stem from transportation27 — the cars and trucks that move people and goods throughout the state. In [CITY], XX percent of emissions stem from transportation. Travel on local roads and state
highways represent XX and XX percent of transportation emissions respectively. Thus, reducing transportation emissions is a critical component of the climate action strategy.
Reducing emissions from the transportation sector requires addressing three constituent components: reducing the carbon intensity of fuels, increasing vehicle efficiency, and reducing vehicle miles travelled (VMT). Fuel carbon intensity, defined as the amount of carbon per gallon, is addressed by the State of California’s Low Carbon Fuel Standard, which mandates that a 10 percent overall reduction in the carbon intensity of transportation fuels (gasoline, diesel, natural gas, electricity, and so on) by 2020. Vehicle efficiency is addressed by AB 1493; California’s Clean Cars Law of 2002 (AB 1493) requires carmakers to reduce global-warming emissions from new passenger cars and light trucks beginning in 2009. First in the world to reduce global-warming pollution from cars, this law has now been adopted by 11 other states. Affecting nearly one-third of the U.S. market, this law is projected to reduce global-warming emissions in 2020 by 64 million tons per year. However, addressing the third component, reducing VMT, is considerably more difficult than the previous two. Californians have driven more and more miles per year over the past five decades. shows the growth in VMT from 1972 – 2010.
Figure 12: California Growth in Vehicle Miles Travelled (VMT) July of each year, 1972-2010
27 Air Resources Board 2008 Scoping Plan.
RICAPS CAP Template Version 4 January 8, 2013 page 37
Betty Seto, 01/08/13,
Template User’s Guide to recommend that each city establish a GHG (and therefore resource) reduction goal for each sector of emissions (e.g. waste tons, transportation VMTs, etc.)
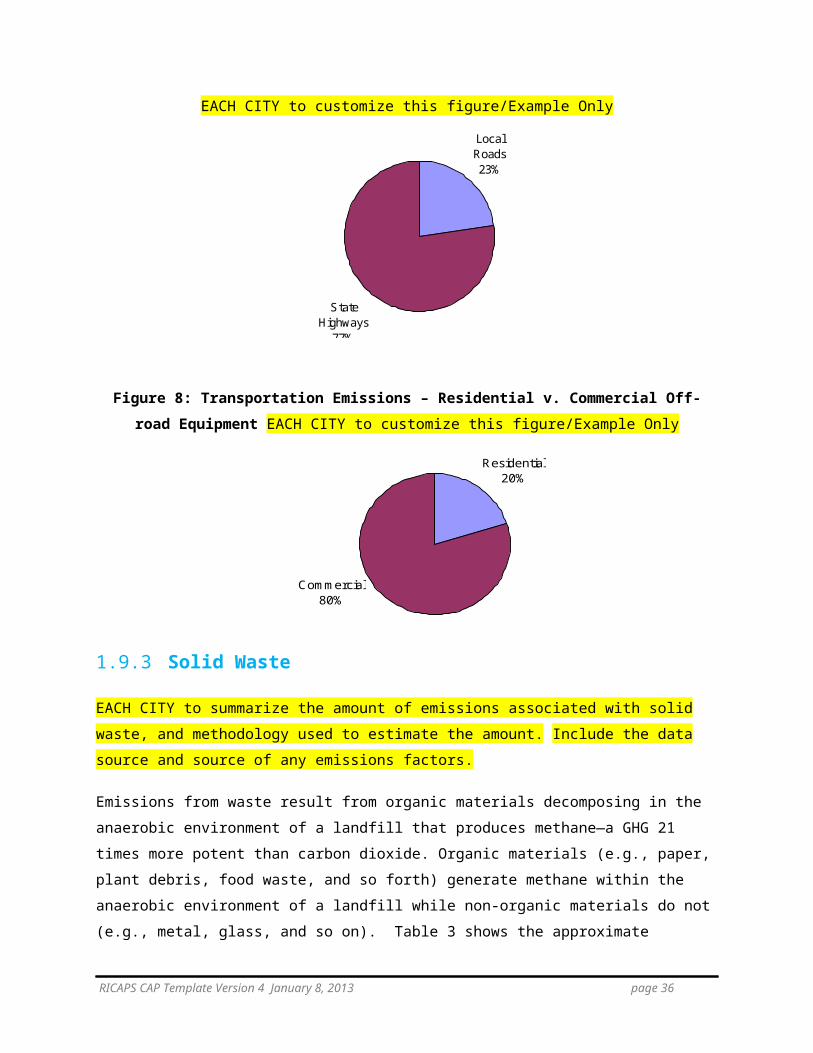
Data: California Department of Transportation
This growth in VMT is attributable in part to following factors:
Growth in gross domestic product
Lack of affordability in urban core housing causes people to live far away from where they work
Lack of viable public transportation options
Low cost of gasoline
Sprawl development patterns such as bedroom communities separated from retail and commercial centers
Streetscapes that discourage pedestrian or bicycle access
In order to reduce VMT and the associated GHG emissions, Governor Schwarzenegger signed Senate Bill 375 in 2008. SB 375 sets regional emissions targets and tasks regional planning organizations to recalibrate land use and transportation planning to meet those emissions targets. This climate action plan seeks to meet the SB 375 targets for the San Francisco Bay Area of 7 percent below 2005 levels by 2020 and 15 percent below 2005 levels by 2035.
The benefits of integrated planning and sustainable development go far beyond simply reducing the GHG emissions that contribute to climate change and its damaging effects. Communities
RICAPS CAP Template Version 4 January 8, 2013 page 38
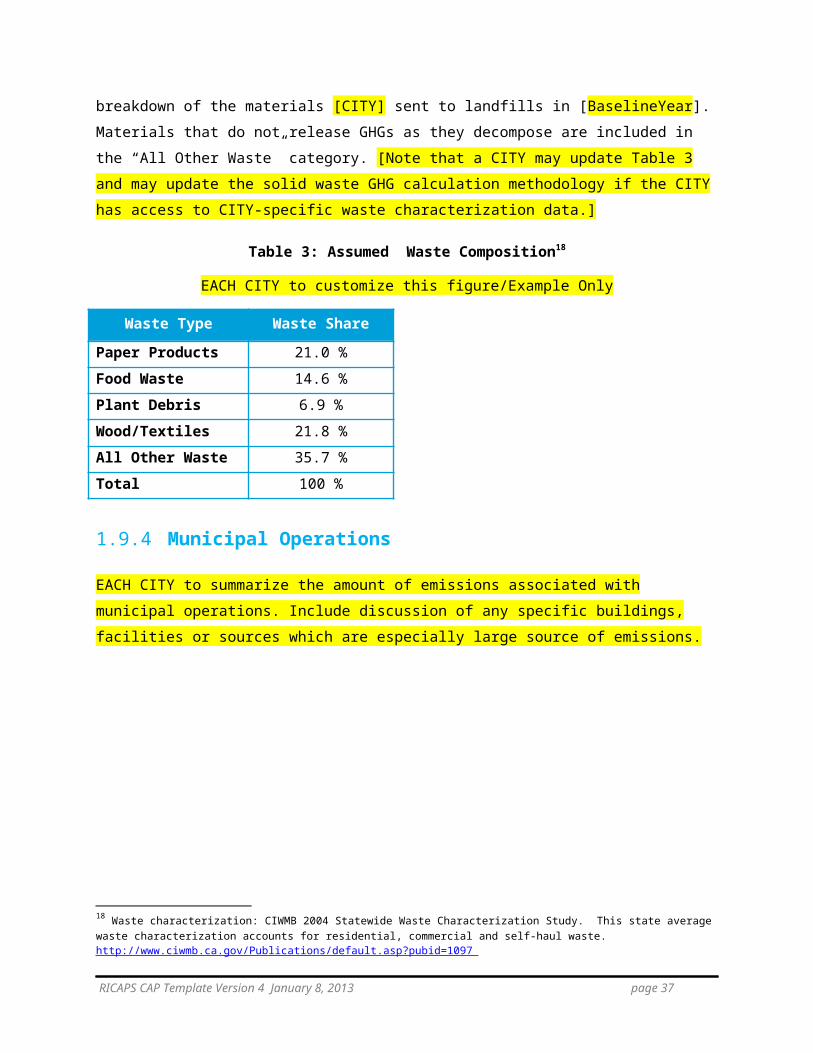
that are well designed provide housing options for all income and age groups and are supported by a range of transportation options that will have many other advantages. Among these are increased mobility and transportation choices; reduced congestion; greater housing choices; improved public health as a result of better air and water quality; natural resource conservation; economic benefits, such as opportunities for neighborhood economic development and lower costs for community infrastructure; reduced dependence on foreign oil; and greater equity through the provision of improved access to jobs, housing, and everyday needs.
[CITY] is fully committed to providing diverse transportation options that are convenient, safe, and affordable. More than that, [CITY] supports grouping new homes, jobs, and services near existing transportation corridors.28 [CITY’s] goal is for the majority of residents’ needs to be met within a 20-minute walk within these corridors. Policies proposed in this climate action plan strive to maintain a quality of life that is environmentally and economically sustainable. These priorities and commitments are reflected and incorporated in this chapter on transportation and land use.
2.2.1 Goal: [EACH city to include a sub-section for each goal]
EACH city to insert goals associated with reducing VMT use.
EACH city to insert measures selected. Include a description of each measure, any existing related initiatives or programs, estimated cost, GHG reduction, co-benefits, etc.
2.3 Solid Waste While it may not be immediately obvious, reducing the amount of waste deposited into the landfill through material reuse, reduction, and recycling is an important strategy [CITY] residents can take to reduce GHG emissions. Some landfills capture
as much methane as possible and combust it for electricity generation. However, for many landfills, much of the methane leaks to the atmosphere. This methane leakage is the primary source of [CITY] GHG emissions in the waste category.
To address the issues of escalating waste production, California AB 939 was passed in 1989 and mandated local jurisdictions to meet a solid waste diversion goal of 50 percent by the year 2000. Each jurisdiction was required to create an Integrated Waste Management Plan that looked at recycling programs, purchasing of recycled products and waste minimization. These plans form the foundation of the waste programs in place today.
28 See http://lomaprieta.sierraclub.org/sustain/guidelines for guidelines on how to integrate land use and mobility strategies to create complete communities.
RICAPS CAP Template Version 4 January 8, 2013 page 39

Greenhouse gas emissions are also associated with product supply chains. Upstream from the consumer, fossil fuel energy is used to extract the raw materials, such as wood, metals, and so forth, from which products are made. Additional energy is needed to manufacture consumer goods in factories. Petroleum is used for the transportation of raw materials to the factory, moving manufactured goods to market, and moving waste from the consumer’s curbside to landfills. These emissions do not show up in [CITY]’s inventory; however, it is good to be aware of them. As consumers, we each have a responsibility to support products that reduce waste and encourage manufacturers to design environmentally-friendly products.
Waste reduction and recycling are powerful tools for reducing emissions all along the consumer materials’ lifecycle. Reducing the amount of materials required through re-use— for example using canvas bags instead of plastic and paper bags from the grocery store—represents the best opportunity to reduce GHG emissions in a significant way. There are regional efforts to ban single-use plastic bags and Styrofoam and local governments can support these efforts.
Recycling represents the second best opportunity to reduce GHG emissions. For these materials, recycling reduces energy-related carbon dioxide emissions in the manufacturing
process and avoids emissions from waste management. The U.S. EPA estimates that if a city of 100,000 people with average waste generation (4.5 pounds/day per capita), recycling (30 percent), and baseline disposal in a landfill with no gas-collection system would increase its recycling rate to 40 percent, it would reduce emissions by more than 3,400 metric tons of CO2e per year.
2.3.1 Goal: [EACH city to include a sub-section for each goal]
EACH city to insert goals associated with reducing solid waste.
EACH city to insert measures selected. Include a description of each measure, any existing related initiatives or programs, estimated cost, GHG reduction, co-benefits, etc.
RICAPS CAP Template Version 4 January 8, 2013 page 40
2.4 AdaptationThe climate is changing rapidly. According to the World Meteorological Organization, in their news release “2000-2009, The Warmest Decade.”29
The decade of the 2000s (2000–2009) was warmer than the decade spanning the 1990s (1990–1999), which in turn was warmer than the 1980s (1980–1989)… The 2000 – 2009 decade will be the warmest on record, with its average global surface temperature about 0.96 degree F above the 20th century average. This will easily surpass the 1990s value of 0.65 degree F.
Even if we stopped emitting GHGs tomorrow, the climate would still continue to change due to the length of the carbon cycle — the ability of the earth to absorb the excess carbon in the ocean and plants. Therefore, our communities must plan for adaptation to climate change.
Adaptation planning may be most effective at the state and regional levels, due to the scale of resources needed to develop and implement a coordinated plan. The 2009 California Climate Adaptation Strategy30 was developed to guide California’s efforts in adapting to climate change impacts. For more information on adaptation planning, see Appendix D.
29 WMO 2010. 2000–2009, THE WARMEST DECADE http://www.wmo.int/pages/mediacentre/press_releases/pr_869_en.html30 http://www.climatechange.ca.gov/adaptation/
RICAPS CAP Template Version 4 January 8, 2013 page 41

Implementation The preceding chapters describe the principal sources of the City of [CITY] GHG emissions and outline related goals and measures for achieving the community’s targets of reducing emissions to 15% below 2005 levels by 2020 and 49% below 2005 levels by 2030. This chapter outlines the main components of the process for putting this plan into action and identifies specific actions from earlier chapters that are recommended for implementation.
Although significant GHG reduction policies and initiatives are already in place, the actions proposed in this Plan, by necessity, far surpass the scale of existing efforts. Implementing the Plan and ensuring that it results in real GHG emissions reductions will require increased coordination across sectors and institutionalized climate protection efforts across the community.
There are a large number of measures and programs that [CITY] may implement to reduce GHG emissions. A cost-benefit analysis and prioritization methodology is presented below to assist the City in developing a phased implementation plan.
2.5 Prioritizing measures for actionEACH city to describe the methodology and criteria used to select and prioritize programs and measures. Describe the ranking (or scoring) of measures against each criteria.
2.6 Results of measure prioritizationEACH city to summarize the results of its individual analysis. For example:
Near-term actions (0 – 2 years), including the no/low cost measures (“no brainers”)Mid-term actions (2-5 years)Long-term actions (More than 5 years)
Optional: add information about implementation if funding or other issues make it difficult to implement all the near-term actions. For an example, see the Solano County CAP and the Constrained and Reduced Implementation alternatives.
RICAPS CAP Template Version 4 January 8, 2013 page 42

2.7 Summary of MeasuresA summary of all the emission reduction measures is provided in Table 8 below.
RICAPS CAP Template Version 4 January 8, 2013 page 43

Table 8: Summary of Measures
Measure Category
Description of MeasureEmission
Reductions (MTCO2E)
Short Term/ Medium Term/ Long
TermAdditional Information
Energy
Transporation and Land Use
Solid Waste
RICAPS CAP Template Version 4 January 8, 2013 page 44
admin, 01/08/13,
Cities will add one row to this table for each measure. Additional information could include the responsible City department, or funding strategies for each measure.
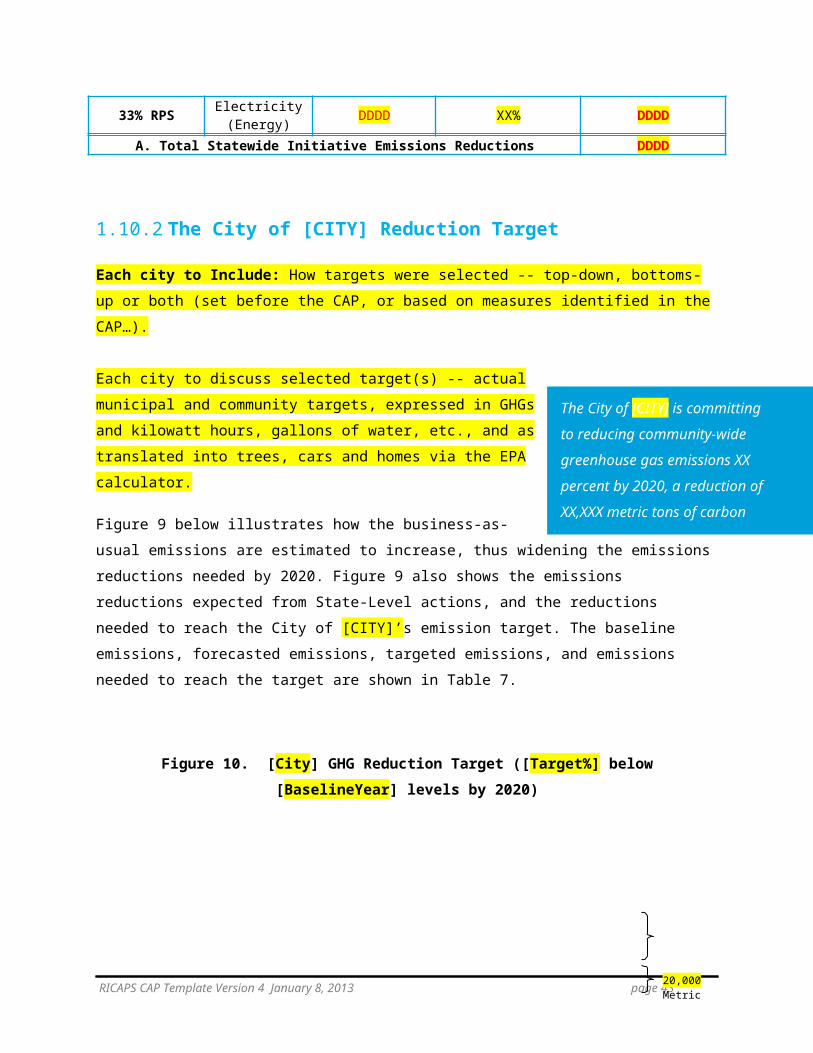
2.8 Meeting the emission targetsEACH city to summarize how the climate action plan results in emissions reductions to meet targets.
Table 9: Meeting the 2020 Target
EACH city to insert the estimated GHG reductions
State InitiativeSector
Impacted2020 BAU
Emissions in Sector (MT CO2e)
% Reduction from 2020 BAU in
Sector
Reduction in City’s Emissions by 2020
(MT CO2e)AB 1493 (Pavley)
Transportation DDDD XX% DDDD
LCFS Transportation DDDD XX% DDDD
33% RPS Electricity (Energy) DDDD XX% DDDD
A. Total Statewide Initiative Emissions Reductions DDDDB. Total City Climate Action Plan Reductions Measures DDDDC. Total Expected Emissions Reductions by 2020 (A+B) DDDDD. [City] Emissions Reduction Requirement for 2020 DDDDE. Percent Emissions Below 2005 Target DDDDF. Percent Emissions Below 2005 with Current Measures DDDDG. Meets/exceeds CAP goals? (F > E) NO/YES
2.9 Management of GHG Reduction StrategySupport will be needed to direct the implementation of the Plan measures. This section details how the city will organize itself to put this plan into action.
Hire or resource a sustainability coordinator – The City will hire a sustainability coordinator to be the person with primary responsibility for implementation of this CAP. If insufficient city funds are available, a existing staff member will take on this role, and must spend at least 50 percent of his or her time on CAP related business.
Establish a Climate Action Task Force (CATF)- Detail task force / sustainability committee function as applicable. Rather than list “establish sustainability staff” in the measures list, mention importance of having staff assigned to sustainability programs here.
[Any other details about roles and responsibilities]
RICAPS CAP Template Version 4 January 8, 2013 page 45
Betty Seto, 01/08/13,
These are examples…
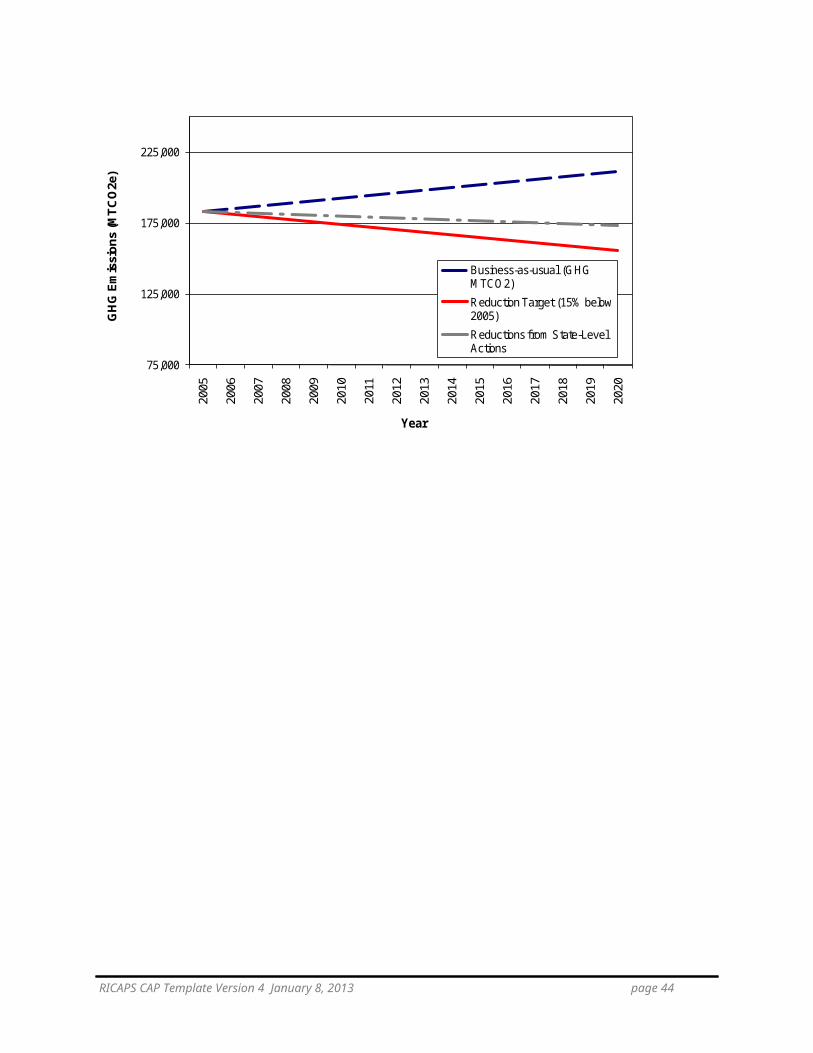
2.10 Public Participation and Community EngagementEACH city to summarize the plan for ongoing communication and education of residents and businesses; media strategy; meetings; social marketing
The City can play a substantial role in generating awareness and educating residents about ways to reduce emissions. While the City can help initiate a movement that emphasizes sustainable practices, it is crucial that other members of the community, such as residents and businesses, are engaged in the process in order to achieve the reduction targets mentioned in this plan while minimizing costs. The target will only be achieved by building a movement that achieves sustained action and coordination across all stakeholders and sectors.
As mentioned previously, there are significant opportunities for the City to leverage existing programs funded by the State of California, PG&E, and others to support community efforts to improve energy efficiency, install renewable energy technologies, facilitate transit/biking/walking initiatives, and support households and businesses in taking other actions. The City of [CITY] seeks to distribute information more widely on funding opportunities for residents and local businesses. Actions may include more information posted on the City website and marketing materials posted at key locations, including City Hall and libraries. Additional actions may include partnering with PG&E and local water districts to further develop marketing presentations and workshops for the community.
Specific actions that community members can take today are included in Appendix B of this climate action plan. Funding opportunities are listed in Appendix C.
RICAPS CAP Template Version 4 January 8, 2013 page 46

2.11 TimelineThe following timeline lists the major milestones in the climate action plan implementation process. Progress and updates to this schedule should be submitted to City Council and the public as part of an annual Plan Implementation Report.
Table 10. Climate Action Plan Implementation
EACH CITY to customer/Example Only
Milestone Target Date
GHG Inventory Completed [MM/YYYY]
GHG Reduction Target Established [MM/YYYY]
Draft CAP Published [MM/YYYY]
Community Comment Period [MM/YYYY] - [MM/YYYY]
Council Review [MM/YYYY]
CAP Adoption [MM/YYYY]
Sustainability Coordinator Begins Implementation
[MM/YYYY]
1st Annual CAP Implementation Report [MM/YYYY]
Community Comment Period [MM/YYYY] - [MM/YYYY]
2nd GHG Inventory Completed [MM/YYYY]
1st CAP Update [MM/YYYY]
3.
RICAPS CAP Template Version 4 January 8, 2013 page 47
Monitoring and Improvement
Monitoring progress is a critical component to ensure that the emissions targets are met. Should monitoring efforts find that the Climate Action Plan is falling short of its goals, the City will add additional voluntary and mandatory measures to the Plan in order to meet the Plan’s GHG reduction target. Ongoing monitoring is critical in order to demonstrate that the Plan is achieving its goals, thereby maintaining its status as a GHG Reduction Strategy over time. The implementation and monitoring of the Plan will be critical to the ability of subsequent projects to tier their GHG analysis under CEQA.
The following describes the monitoring and improvement program.
Every year, the Sustainability Coordinator will issue an Annual Climate Action Plan Implementation Report (ACAPIR), to update the City Council, residents, and other interested stakeholders as to the progress implementing the Plan measures. The ACAPIR will detail lessons learned and make recommendations for changes to the implementation strategy or the Plan itself. Following the release of the ACAPIR, a 30 day public comment period will be open to allow for community input on the implementation of the Plan.
The Sustainability Coordinator will track the emissions, resource savings, and any other effects of each implemented measure as well as estimate costs to government, residences, and businesses. Each measure will be summarized in the ACAPIR and made available for public review.
A full GHG inventory will be conducted every [BAAQMD requires every 5 years] according to the ICLEI community emissions protocol. The inventory will allow the city to understand how emissions levels are tracking in a top-down manner. PG&E can provide annual updates on electricity and natural gas usage to track associated GHG emissions.
RICAPS CAP Template Version 4 January 8, 2013 page 48
Betty Seto, 01/08/13,
Some example language

This Plan may need to be updated based on the results of the GHG inventory. [CITY] may modify and/or add new measures to ensure that the city is on track to meeting its greenhouse gas reduction goals.
RICAPS CAP Template Version 4 January 8, 2013 page 49

Conclusion
Climate change is a global problem and only through local solutions designed to meet the needs of our community can we mitigate and adapt to its impacts and protect the environment. While the challenge of climate change is unprecedented, local-level solutions can reduce emissions, increase efficiency, promote economic development, and improve quality of life for residents.
Together, we can conserve our scarce resources, thereby saving our families and companies money, increasing the resilience of our economy and emergence of new markets that prioritize green technologies. The City of [CITY] has taken a significant step toward a more sustainable future with this climate action plan. This Plan has identified areas and opportunities to reduce GHG emissions within the community and City operations that along with statewide efforts can achieve our environmental goals. The City of [CITY] is poised to reap the benefits of a clean energy economy, with policies that can increase the demand for local green jobs.
These are difficult issues. As you can see, when reviewing this Plan, the proposed efforts of [CITY] are small when compared to the collective action of our citizenry. What can a single individual do? Appendix B provides 10 ways that individuals can reduce their GHG footprint and help safeguard our environment for future generations.
While an important first step, this plan will remain a living document, to be updated as technology and policies progress, to support the City’s efforts to manage GHG emissions for a sustainable future for all.
RICAPS CAP Template Version 4 January 8, 2013 page 50
3.1 Appendix A. Glossary of Terms
AB32 The California Global Warming Solutions Act of 2006
ARB California Air Resources Board
BAAQMD Bay Area Air Quality Management District
CAP climate action plan
CAPPA Climate and Air Pollution Planning Assistant
CEC California Energy Commission
CEQA California Environmental Quality Act
CO2 carbon dioxide
CO2e carbon dioxide equivalent
CPUC California Public Utilities Commission
EIR environmental impact review
GHG greenhouse gas
ICLEI Local Governments for Sustainability
kWh kilowatt hour
MFD multifamily dwelling
MPO metropolitan planning organization
MT metric ton
PACE property-assessed clean energy
PG&E Pacific Gas and Electric Company
ppm parts per million
PV photovoltaic
RPS renewable portfolio standard
U.S. EPA United States Environmental Protection Agency
TOD Transit-oriented development
RICAPS CAP Template Version 4 January 8, 2013 page 51

3.1.1 Appendix B. 10 Steps to Reduce Your Carbon Footprint
Modified from CoolClimate.org
1. Change your commuteDid you know that one third of the CO2 produced in the U.S. is from the transportation of people or goods? Pick one day a week to walk, bike, take public transportation or carpool to work or when you are running errands. Silicon Valley Bicycle Coalition (http://bikesiliconvalley.org/) has great resources and can help you plan your bike commute. Another resource for planning trips via public transportation is 511.org. If possible, live close to your workplace and talk to your employer about working from home or subsidizing the costs of public transportation. When driving, remember to combine several car trips into one trip and avoid idling. Additionally, you can get better fuel efficiency by following the speed limit. Exceeding the speed limit by just 5 mph during highway travel results in an average fuel economy loss of 6 percent.
2. Be a better consumerDid you know that the average American generates about 4.4 lbs of trash each day? To reduce the amount of trash you generate, follow these few easy steps. Use re-usable coffee mugs and shopping bags. If you forget your mug or bag at the store, buy a new reusable mug or bag and keep the extra one in your purse or car for use the next time you are out. Alternatively, set aside $1 each time you forget your mug or bag; depending on your memory, you will have enough funds to purchase a reusable item sooner or later. Also, reuse as many things as possible and recycle at home, work, and school. Compost pick-up is now available in more parts of San Mateo County.
3. Shop localThe shorter the distance your food travels to your plate or that product travels to your home, the fewer greenhouse gases are produced. Declare one day a week to be a "buy local day" and eat foods produced within 50 miles of your house. Participate in community-supported agriculture and community-supported fishery programs and shop at farmers markets.
[For San Mateo County residents…] Buy produce and fish labeled “As Fresh As It Gets,” signifying that it was grown or harvested in San Mateo County. Support restaurants and businesses accredited by the “As Fresh As It Gets” campaign, signifying that they use county-grown produce, fish, and other products. For a list of in-season produce and fish, farmers market locations, and accredited businesses and restaurants, visit www.asfreshasitgets.com.
RICAPS CAP Template Version 4 January 8, 2013 page 52

4. Dry-up Household Water ConsumptionDid you know that water-related energy use consumes 19 percent of California's electricity, 30 percent of its natural gas, and 88 billion gallons of diesel fuel every year? To reduce your water consumption at home, turn off your water when it's not being used, take shorter showers, stop unseen leaks by reading your meter, install low-flow shower heads and aerators on your faucet, install and use water-efficient landscaping and irrigation methods (for example, plant drought tolerant plants and/or install permeable surfaces and drip irrigation systems), and use EnergyStar appliances. The Bay-Friendly Gardening Program (http://www.stopwaste.org/) provides resources for selecting plants, conserving water and fostering soil health.
5. Unplug itDid you know that appliances, chargers, home theater equipment, stereos, and televisions use electricity even when their power is off? Eliminating this "leaking" electricity could save you 6–26 percent on your average monthly electricity bill. Take a walking tour of your home, unplug seldom-used appliances, and install power strips so that the power to frequently used items can be easily turned off.
6. Change the lightsReplace any incandescent light bulbs that remain in your home with compact fluorescent lights (CFLs). Replacing one incandescent light bulb with a CFL can save $30 or more in electricity costs over the bulb‘s lifespan.
7. Set your Thermostat for the SeasonSet your thermostat in winter to 68°or less during the daytime, and 55° before going to sleep (or when you are away for the day), to save 5 to20 percent of your space-heating costs. During the summer, set thermostats to 78° degrees or more to save 5 to20 percent of your cooling costs. For an easy fix, purchase an inexpensive programmable thermostat that makes these changes for you.
8. Increase Energy Efficiency at HomeDid you know that you can save up to 350 pounds of CO2 and $150 per year at home by simply keeping air filters clean? To determine more ways to increase energy efficiency, take advantage of subsidized home energy audits offered through Energy Upgrade California. When you are ready to purchase an appliance, ensure that you purchase an EnergyStar appliance. To reduce carbon emissions associated with energy use, install or purchase alternative energy for your electricity needs.
9. Stop Unwanted ServicesDid you know that junk mail production in the U.S. consumes as much energy as 2.8
RICAPS CAP Template Version 4 January 8, 2013 page 53
million cars? Stop your junk mail at www.directmail.com/junk_mail. Stop unwanted catalogs at www.catalogchoice.org .
10. Get your friends and families to reduce their carbon emissions
RICAPS CAP Template Version 4 January 8, 2013 page 54

3.1.2 Appendix C. Summary of Funding Sources
EACH CITY to customize to reference the mix of sources for implementing the climate action plan. City may wish to list funding sources for drafting of the CAP here.
For implementation of the Climate action plan, [CITY] must evaluate strategies for financing climate protection actions and provide adequate, reliable, and consistent long-term program funding. This appendix provides an overview of available funding sources to help determine appropriate potential program funding sources and funding levels to support existing and new programs outlined in this plan. Other funding sources may be available that are not listed here.
3.2 Federal Funding Federal Transportation Investment Generating Economic Recovery (TIGER) Granthttps://www.transportation.gov/tiger.
The Federal Transportation Investment Generating Economic Recovery (TIGER) grant program was created by the American Investment and Recovery Act (ARRA) of 2009. In 2016, U.S. Transportation Secretary Anthony Foxx announced that nearly $500 million will be made available for transportation projects across the country in the eighth round of the highly successful TIGER grant program. Cities can apply for a TIGER grant to fund parking garages, and infrastructure to support electric battery-swap station and parking for electric vehicles.
3.3 State Funding
Energy Conservation Assistance Act (ECAA) Program Loanshttp://www.energy.ca.gov/efficiency/financing/index.html
Since 1979, more than $399 million has been allocated to more than 850 recipients through ECAA Program Loans. The program offers loans with a one percent interest rate to finance energy efficiency improvements. The maximum loan amount is $3 million per application. Eligible projects include lighting system upgrades, pumps and motors, streetlights and LED traffic signals, energy management systems and equipment controls, building insulation, energy generating including renewable and combined heat and power projects, HVAC equipment, water and waste water treatment equipment and load shifting projects.
Energy Upgrade Californiahttps://energyupgradeca.org
The Energy Upgrade California program helps residential and commercial consumers and the building industry to access available rebate programs and financing options for energy efficiency and renewable energy projects. It is supported by an alliance of the California Public Utilities
RICAPS CAP Template Version 4 January 8, 2013 page 55

Commissions, the California Energy Commissions, utilities, regional energy networks, local governments, businesses and nonprofits. Funding comes from investor-owned utility customers under the auspices of the California Public Utilities Commission.
3.4 Utility Rebate Programs
Pacific Gas and Electric (PG&E) offers a full suite of energy efficiency rebates programs to support its customers in saving energy and money.
Rebates for households: https://www.pge.com/en_US/residential/save-energy-money/savings-solutions-and-rebates/rebates-by-product/rebates-by-product.page?
Rebates for businesses: https://www.pge.com/en_US/business/save-energy-money/business-solutions-and-rebates/product-rebates/product-rebates.page
Below, we provide some specific examples of PG&E programs available to the community.
PG&E San Mateo County Energy Watch Programhttp://www.smcenergywatch.com
San Mateo County Energy Watch provides energy efficiency services and retrofits and assists businesses and moderately low-income households to identify cost-effective projects. The program’s services include energy audits, special rebates and incentives
PG&E Residential Appliance Rebateshttp://www.pge.com/myhome/saveenergymoney/rebates/appliance/
PG&E offers rebates to customers who purchase qualifying energy efficient appliances, including clothes washer, gas storage water heaters, electric heat pump water heaters and variable speed pool pumps/motors.
PG&E LED Streetlight Replacement Programhttp://www.pge.com/mybusiness/energysavingsrebates/rebatesincentives/ref/lighting/lightemittingdiodes/incentives/index.shtml
The [City] may be eligible for PG&E’s LED streetlight replacement program which provides rebates to cities that replace existing streetlights with more energy efficient LED fixtures (up to $125 per fixture). More information on this program is available at
PG&E Commercial Appliance Rebateshttp://www.pge.com/en/mybusiness/save/rebates/erebates/index.page
RICAPS CAP Template Version 4 January 8, 2013 page 56
PG&E offers rebates to business customers on hundreds of products including refrigeration units, lighting fixtures, heating systems, food service appliances, boilers and water heaters, and insulation. More information and a complete list of products eligible for rebates is available online at
PG&E Home Energy Efficiency Improvements Rebateshttp://www.pge.com/myhome/saveenergymoney/rebates/remodeling/
PG&E offers rebates to customers who make energy efficiency improvements when remodeling their homes. Currently PG&E offers a rebate of up to $0.20 per square foot for cool roof installations and $0.15 per square foot of attic and wall installation installed. Additionally, PG&E has rebates for homeowners who upgrade their home’s heating and cooling systems. Rebates are available for installing energy efficient furnaces (up to $300), air conditioning units (up to $50) and whole house fans (up to $100). Finally, PG&E will provide up to $400 in rebates to customers who test and seal their home’s duct system. More information on this program is available at
3.5 Local Energy Programs
California Youth Energy Serviceshttp://www.risingsunenergy.org
Since 2000, Rising Sun Energy Center has run CYES, a summer youth employment and community efficiency retrofit program in the Bay Area. CYES hires young people (ages 15-22) and trains them to become Energy Specialists, serving their communities with a FREE Green House Call. Energy Specialists install free energy and water saving devices, and provide personalized recommendations and education for further savings in homes. CYES provides services to all community members regardless of income. However, it was designed to serve hard-to-reach residents including renters, non-English speaking households, and low-moderate income households. It provides youth with opportunities for training and meaningful employment; which are often not adequately available to them. CYES youth receive employability skills training, paid summer employment, and the foundation for a green career.
Green@Home House Callshttp://www.acterra.org/programs/greenathome/index.html
Green@Home House Calls help fight climate change by saving residents energy, money and CO2. Trained volunteers meet with residents in their homes to install simple energy-saving devices and create home energy conservations plans. Volunteers demonstrate environmentally friendly choices and foster a deeper awareness of the need for change. House Calls are available to all residents of participating cities whether you rent or own.
RICAPS CAP Template Version 4 January 8, 2013 page 57
3.6 Other Funding Opportunities
American Forests Global ReLeaf Grant Programhttp://www.americanforests.org/discover-american-forests/our-work/
American Forests is a non-profit organization founded in 1875 that promotes forest conservation. American Forest’s Global ReLeaf Program provides grants to fund tree-planting projects in urban and natural areas.
California ReLeaf Urban Forestry Grant Programhttp://californiareleaf.org/programs/grants
The California ReLeaf Urban Forestry grant program provides funding to assist nonprofit and community-based groups throughout California with urban forestry projects. The program is funded through a contract with the California Department of Forestry and Fire Protection (CAL FIRE).
Large Landscape Audit http://bawsca.org/conserve/programs/audits
BAWSCA and its participating member agencies offer this audit program to select large landscapes within the service area free of charge. This program includes the development and monthly distribution of landscape water budgets for selected accounts and actual large landscape surveys to assess landscape watering needs. A key component of the program is ongoing monitoring/tracking of actual water use and estimated water savings for the sites surveyed. If you have water conservation related questions, please call 650-349-3000 or send an email to [email protected]. You can also check with your local water company; some offer water audits for no charge.
Waste Audits by Recology
https://www.recology.com/index.php/commercial-beyond-the-cart/84-commercial
Recology offers a free waste audit to its business customers. A Waste Zero Specialist will come to your facility to advise you on the size/type of bins you could use and make other recommendations to help you reduce the amount of waste generated. To make an appointment, call (650) 595-3900.
RICAPS CAP Template Version 4 January 8, 2013 page 58

3.6.1 Appendix D. Adaptation Planning for Climate Impacts
Effective adaptation planning and management entails dealing with uncertainty. It is a long-term process that should allow immediate action when necessary and adjust to changing conditions and new knowledge. [CITY] plans to initiate an inclusive planning process that ensures the resulting actions are feasible and widely accepted. Adaptation will likely be an ongoing process of planning, prioritization and specific project implementation.
Five important steps to effective adaptation planning are summarized below:
1. Increase Public Awareness; Engage and Educate the Community
It is critical that the public understand the magnitude of the challenge and why action is needed. The planning process should be inclusive of all stakeholders. Local outreach campaigns are needed to promote awareness of the dangers of heat exposure and recommend low-cost and low-GHG adaptation strategies. These efforts should leverage similar efforts undertaken at the regional, state, and federal levels.
2. Assess Vulnerability
Understanding vulnerability to sea level rise and other climate change impacts is critical to developing adaptation effective strategies. A detailed vulnerability analysis should be performed to assess potential climate change impacts to infrastructure and natural systems. Future vulnerability of assets and infrastructure can then be assessed using conceptual models of shore response to sea level rise. Shore response models can be applied for one or more climate change scenarios and planning horizons, and a strategy for adapting can be developed with due consideration to priorities and time frames. Both short-term and long-term adaptation strategies should be identified. Level of risk can be categorized in terms of likelihood of damage within the forecasting period and the severity of the damages. This allows planners to prioritize their response to sea level rise. The vulnerability assessment can also provide a framework for agency and community education and participation, feed into other planning documents, and identify funding needs.
3. Establish Goals, Criteria and Planning Principles
Engage with stakeholders to establish planning priorities, determine decision criteria, and build community support for taking action. Rank physical and natural assets for preservation efforts. Where possible, look for situations where a mitigation action has adaptation co-benefits (e.g., planting trees to reduce urban heat islands while sequestering carbon and providing habitat).
RICAPS CAP Template Version 4 January 8, 2013 page 59

4. Develop Adaptation Plan
Identify specific strategies, develop actions and cost estimates, and prioritize actions to increase local resilience of City infrastructure and critical assets, including natural systems like wetlands and urban forests. Look for synergies between natural processes and engineering solutions. There is a continuum of strategies available to manage sea level rise, ranging from coastal armoring (levees, seawalls, etc.) to elevated development to a managed retreat or abandonment of low-lying development. An adaptation plan should include a prioritized list of actions (e.g. projects) with a timeline, capital expenditure plan, and framework for monitoring and adaptive management.
5. Ongoing Monitoring and Adaptive Management
Reassess climate change vulnerabilities on a regular basis and modify actions accordingly. This includes monitoring the effectiveness of current policies, strategies and actions, and keeping up with changing science, funding opportunities, and regulatory actions.
A menu of potential adaptation strategies and measures is provided in the table below.
Table 7. Adaptation Strategies and Measures
Climate Change Impacts Sample Adaptation MeasuresSea Level Rise
Risks to existing facilities, natural systems, private property and public infrastructure
Educate and engage the community on the need for long-range planning
Partner or collaborate with other jurisdictions and agencies to increase awareness and build community support for action
Identify funding mechanisms and seek public-private partnerships where interests converge
Use natural backshore wave-buffering processes to reduce wave erosion and run-up on levees
Increase or maintain the buffering capacity of tidal wetlands to protect against storm surges and keep pace with sea-level rise
Move levees further inland to allow marshes and mudflats to naturally transgress landward
Protect and restore wetlands that provide vital habitat and carbon storage, and allow for landward migration of habitat over time
Make modifications to low-lying wastewater treatment facilities. Consider opportunities for integrating wastewater treatments and wetlands
Avoid new development in areas at risk based on sea level projections
Do coastal armoring with levees and seawalls to protect vital infrastructure from erosion, inundation, and flooding
Extreme Heat Events
Risks to public health and infrastructure
Identify vulnerable communities and develop emergency preparedness plan
Establish cooling centers, especially for vulnerable populations Reduce urban heat islands through use of cool roofs and other
RICAPS CAP Template Version 4 January 8, 2013 page 60
reflective surfaces Do targeted tree planting and enact new requirements for
shading in new parking lots and other large paved areas Reduce risk of wildfires through fuels reduction in the urban-
wild land interfaceRegional Drought
Risks to reliable water supply, and potential conflicts between urban and agriculture users
Increase capacity for community water storage Promote local water conservation Make water conservation a top priority for agriculture in the
region Do water reclamation and reuse projects
Increased Flooding and Severe Weather Events
Risks to public health, private property, public infrastructure, and ecosystems
Integrate local flood management plans with adaptation planning
Identify vulnerable communities and develop emergency preparedness plans
Establish local land use policies that decrease flood risk; avoid building in high-risk areas
Make modifications to storm water system routing and storage. Develop storage areas for peak flows
Maximize use of bioswales and permeable surfaces in both greenscape and hardscape areas to improve aquifer recharge and mitigate flooding from stormwater
Air Quality and Other Public Health Concerns
Restrict use of fireplaces and open fires on high-risk days Monitor potential threats to public health, including new
diseases, and develop public awarenessThreats to Species, Ecosystems, and Ecosystem Services
Design urban forest program to improve biodiversity, provide heat relief, and sequester carbon
Preserve wetlands, salt marshes, and other critical coastal habitats
Risks to Local Agriculture and Food Supply
Promote conservation of local agricultural land Promote the use of public and private land and rooftops for
producing food Promote the planting of fruit and nut trees Support local farmers markets by providing incentives such as
reduced costs for permits and support in attaining electronic benefit transfer (EBT) point-of-sale terminals
Provide incentives and remove regulatory obstacles to encourage animal husbandry and local food production and distribution
Provide and promote educational opportunities for residents at all levels of the educational system (preschool through college) to gain skills in organic gardening; fruit production; animal husbandry; food preservation and cooking; and affordable, healthy eating
Develop a city-run or city-supported food gleaning program that organizes volunteers or compensates workers to collect food from trees and shrubs on land owned by cities or within cities to distribute through food banks and other local distribution channels
Reduce food waste by implementing a local composting where all food scraps, food-soiled paper, waxed cardboard, wood crates and landscape trimmings from markets, restaurants, homes, hotels, and schools, would be collected and made available for distribution to rural or urban gardeners
RICAPS CAP Template Version 4 January 8, 2013 page 61
3.6.2 Appendix E. Future Opportunities for Emissions Reductions
EACH city to insert “Future Opportunities” section – ideas, resources, measures, etc. that the cities wish to consider.
RICAPS CAP Template Version 4 January 8, 2013 page 62
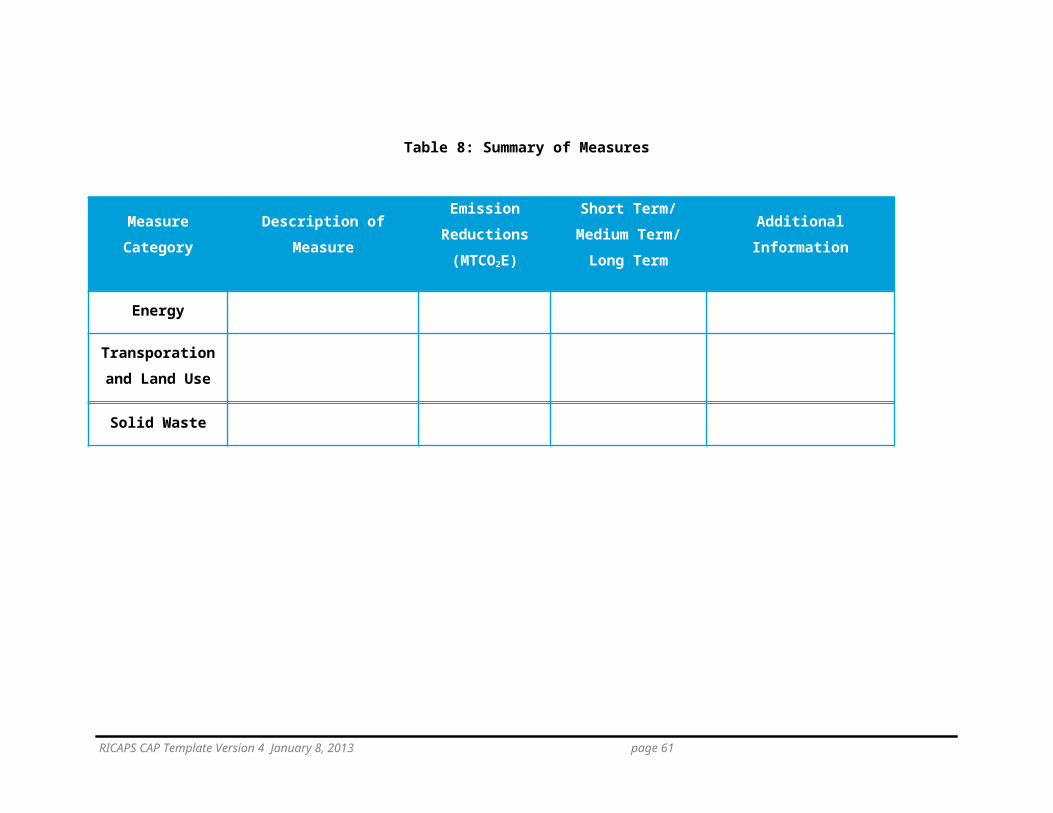
3.6.3 Appendix F. Baseline GHG Inventory and Forecast
EACH city to insert their Baseline GHG Inventory Report and GHG Forecast, clearly showing technical details such as data sources, methodologies, and assumptions.
RICAPS CAP Template Version 4 January 8, 2013 page 63

3.6.4 Appendix G. Emission Reduction Measures: Calculations
EACH city to insert their version of the Manual of Calculations, clearly showing technical details such as data sources, methodologies, and assumptions.
RICAPS CAP Template Version 4 January 8, 2013 page 64


![Work Paper Template 2011 November - Squarespace · Web viewSee table below for a list of all Building Types and Load Shapes. See the KEMA report [31] for a more thorough discussion](https://static.fdocuments.in/doc/165x107/5aa0c9ed7f8b9a6c178e9c23/work-paper-template-2011-november-squarespace-viewsee-table-below-for-a-list-of.jpg)