KEMA Proposal Report w Appendices Template 2008 Gas Flame 2 and Evaluation Reports...into savings...
92
Experience you can trust. Final Report New Hampshire Small Business Energy Solutions Program Impact and Process Contact: Thomas Ledyard (860) 346-5001 x72208 [email protected] Prepared by KEMA, Inc. June 27, 2012
Transcript of KEMA Proposal Report w Appendices Template 2008 Gas Flame 2 and Evaluation Reports...into savings...

Experience you can trust.
Final Report New Hampshire Small Business Energy Solutions Program Impact and Process
Contact: Thomas Ledyard (860) 346-5001 x72208 [email protected] Prepared by KEMA, Inc. June 27, 2012

Experience you can trust.
Copyright © 2012, KEMA, Inc.
The information contained in this document is the exclusive, confidential and proprietary property of KEMA, Inc. and is protected under the trade secret and copyright laws of the U.S. and other international laws, treaties and conventions. No part of this work may be disclosed to any third party or used, reproduced or transmitted in any form or by any means, electronic or mechanical, including photocopying and recording, or by any information storage or retrieval system, without first receiving the express written permission of KEMA, Inc. Except as otherwise noted, all trademarks appearing herein are proprietary to KEMA, Inc.
Table of Contents
KEMA, Inc. June 27, 2012 i
1. Executive Summary ............................................................................................................. 1 1.1 2010 Program Activity Summary ................................................................................. 1 1.2 Key Study Activities .................................................................................................... 3 1.3 Key Study Results ...................................................................................................... 3 1.4 Recommendations .................................................................................................... 10
2. Introduction and Study Overview ........................................................................................ 14 2.1 Program Overview Based upon Interviews ............................................................... 14
3. Evaluation Objectives and Methodology ............................................................................. 19 3.1 Key Evaluation Objectives ........................................................................................ 19 3.2 Impact Evaluation Methods ....................................................................................... 20 3.3 Process Evaluation Methods ..................................................................................... 28
4. Results ............................................................................................................................... 32 4.1 Impact Evaluation Results......................................................................................... 32
4.1.1 Program/State Level ...................................................................................... 33 4.1.2 Public Service New Hampshire ..................................................................... 35 4.1.3 Comparison of 2004 and Current Evaluations ............................................... 36 4.1.4 Summer and Winter Coincidence .................................................................. 37 4.1.5 Error Ratios for Use in Future Studies ........................................................... 40
4.2 Process Evaluation Results ...................................................................................... 40 4.2.1 Program Strengths and Weaknesses ............................................................ 40 4.2.2 Program Operations ...................................................................................... 46 4.2.3 Program Drivers and Barriers ........................................................................ 58 4.2.4 Program Experience and Satisfaction ............................................................ 63 4.2.5 Customer Perceived Energy Use and Opportunities ...................................... 71
5. Conclusions and Recommendations .................................................................................. 76 5.1 Impact Conclusions and Recommendations ............................................................. 76 5.2 Process Conclusions and Recommendations ........................................................... 78
Appendix A: Study Logger Specifications .................................................................................. 83 Appendix B: Site Level Lighting Information from Sample ......................................................... 86 Appendix C: Survey and Interview Instruments ......................................................................... 87
Table of Contents
KEMA, Inc. June 27, 2012 ii
List of Exhibits:
Table ES 1: 2010 SBES Annual Savings Summary by Measure Type and Sponsor .................. 2 Table ES 2: Statewide Annual Energy Savings Adjustment Results by End-Use ....................... 5 Table ES 3: Summary of New Hampshire Results ..................................................................... 5 Table ES 4: Comparison of Lighting Results to 2004 Study ....................................................... 5 Table ES 5: Savings Factor Summary ....................................................................................... 8 Table ES 6: Peak Energy Summary ........................................................................................... 8 Figure ES 1: SBES Annual Energy Savings by Measure Type ................................................... 2 Figure ES 2: Summer Lighting Profile ........................................................................................ 7 Table 1: 2010 SBES Population Summary by Measure Type and Sponsor ...............................21 Table 2: 2010 Final Sample Design ..........................................................................................22 Table 3: Interviewed Contractor Coverage by Sponsor .............................................................31 Table 4: New Hampshire Annual Energy Savings Adjustment Results by End-Use ..................34 Table 5: Summary of New Hampshire Results ..........................................................................35 Table 6: Summary of PSNH Annual Energy Results .................................................................36 Table 7: Summary of PSNH Results .........................................................................................36 Table 8: Comparison of Lighting Results to 2004 Study ............................................................37 Table 9: Comparison of Statewide Lighting 2004 and 2010 Adjustments ..................................37 Table 10: Savings Factor Summary ..........................................................................................39 Table 11: Peak Energy Summary..............................................................................................40 Table 12: Participant Previous Awareness of Efficiency Programs ............................................48 Table 13: Participant-Reported Prior Program Experience ........................................................48 Table 14: Sources of Awareness of SBES and Energy Efficiency Topics and Opportunities .....50 Table 15: Most Influential Sources of SBES and Energy Efficiency Topics and Opportunities ...51 Table 16: Administrative System Element Ratings ....................................................................55 Table 17: Contractor Reported Customer Motivation.................................................................59 Table 18: Factors That Encourage Participation in an Efficiency Program ................................60 Table 19: Barriers to Participation .............................................................................................62 Table 20: Participant Suggestions to Improve Program Attractiveness .....................................62 Table 21: Drop Out Likelihood of Improving Efficiency Based On Different Offerings ................63 Table 22: Overall Customer Satisfaction Ratings ......................................................................66
Table of Contents
KEMA, Inc. June 27, 2012 iii
Table 23: Customer-Reported Problems ...................................................................................68 Table 24: Measure Affect of Business Operation and Profitability .............................................69 Table 25: Was Program Participation Worthwhile? ...................................................................70 Table 26: Likelihood of Non-Participants and Drop Outs Consulting the Utility ..........................70 Table 27: Credibility of Utility as a Source for Energy Efficiency Information .............................70 Table 28: Likelihood of Future Program Participation ................................................................71 Table 29: Percent of Facility Operational Costs Spent On Energy.............................................71 Table 30: Participant and Non-Participant Preferred Method of Measure Installation ................75 Figure 1: Cross-Functional Diagram of SBES Program .............................................................17 Figure 2: Overview of Impact Approach ....................................................................................20 Figure 3: SBES Annual Energy Savings by Measure Type .......................................................21 Figure 4: Logger Installation and Removal Timeline ..................................................................23 Figure 5: Sample Weekly Operating Schedule and Power Consumption (kW) ..........................25 Figure 6: Tracking System vs. Gross On-Site Scatter plot (State) .............................................33 Figure 7: Summer Lighting Profile .............................................................................................38 Figure 8: Participant-Reported Program Strengths ....................................................................42 Figure 9: Participant-Reported Program Weaknesses...............................................................44 Figure 10: Customer Suggestions to Improve Program and Increase Participation ...................45 Figure 11: Customer Ratings of Program and Program Marketing Materials .............................49 Figure 12: Customer Suggested Contact Method ......................................................................52 Figure 13: Participant Reported Program Experience Satisfaction ............................................64 Figure 14: Installation Time Frame vs. Participant Satisfaction with Time Frame ......................65 Figure 15: Customer Satisfaction with Program Features .........................................................66 Figure 16: Participant and Non-Participant-Reported Energy Consumption by End Use ...........72 Figure 17: Participant Level of Interest in Pursuing Upgrades ...................................................73 Figure 18: Non-Participant Level of Interest in Pursuing Upgrades ...........................................74 Figure 19: Testing and Replacement of Lighting Logger Battery ...............................................84

KEMA, Inc. June 27, 2012 1
1. Executive Summary
The New Hampshire Electric Utilities1 commissioned a study to perform an impact and process evaluation of the 2010 program year New Hampshire Small Business Energy Solutions Program (SBES). The overall goal of the program is to help small businesses manage their operating expenses by increasing the efficiency of their electricity use through the installation of efficient lighting and other equipment to reduce energy consumption.
Two major goals were established for this evaluation: 1) to quantify the gross energy savings (impacts) due to the SBES Program with a precision of ±10% at the 90% confidence level, overall; and 2) to evaluate SBES program design assumptions and processes. The purpose of this report is to document the methods undertaken as part of the study effort, the results of KEMA’s analysis efforts and recommendations to support the continued effective implementation of the SBES Program.
1.1 2010 Program Activity Summary
Table 1 presents a summary of annual savings for each utility by measure type for the 629 participating accounts in the program during 2010. Lighting measures comprised the vast majority of savings, representing 85.7% of all program savings. Lighting is further broken down into savings associated with catalog sales that went to small businesses and lighting that was installed through the program audit process.
1 National Grid, New Hampshire Electric Coop (NHEC), Public Service of New Hampshire (PSNH), Unitil.

KEMA, Inc. June 27, 2012 2
Table ES 1: 2010 SBES Annual Savings Summary by Measure Type and Sponsor
Measure Type
Sponsor (Annual kWh) Statewide (Annual
kWh)
PSNH (N=558)
Unitil (N=45)
National Grid (N=13)
NHEC (N=13)
Total (N=629)
% of Total
Compressed Air /Process 203,877 41,299 - - 245,176 2.63%
Audit Lighting 6,727,763 944,727 178,130 62,527 7,913,147 84.92%
Catalog Lighting 60,516 10,608 71,123 0.76%
HVAC 187,391 48,191 - - 235,582 2.53%
Custom 76,052 - - - 76,052 0.82%
Other 204,296 - - 4,303 208,599 2.24%
Refrigeration 387,964 51,840 62,154 20,569 522,527 5.61%
VFD/Motors 5,706 4,467 - 35,870 46,043 0.49%
Total (kWh) 7,853,565 1,090,524 240,284 133,877 9,318,249 100.00%
Average (kWh) 14,074 24,234 18,483 10,298 14,814 N/A Figure ES 1 provides an illustration of the measure-level savings provided above. As discussed above, lighting measures represent the overwhelming majority of program savings.
Figure ES 1: SBES Annual Energy Savings by Measure Type
Lighting7,984,270 kWh
85.7%
Compressed Air/ Process 2.6%
HVAC 2.5%
Custom 0.8%
Other 2.2%
Refrigeration 5.6%
VFD/Motors 0.5%
Other 1,333,979 kWh
14.3%

KEMA, Inc. June 27, 2012 3
1.2 Key Study Activities
In this impact work, KEMA presents the relative impacts between the tracking estimate of savings and the final estimates of savings, including the amount of change due to documentation errors, technology changes, quantity changes, hours of use adjustments and interactive effects. Forty three on-sites with M&V were statistically selected and performed to inform the impact analysis. The team installed a total of 417 lighting loggers and 8 ELITEpro true power meters as part of the on-site evaluation effort.
For the process evaluation, the team conducted a total of 107 participant surveys, 78 non-participant surveys, 40 surveys with customers who signed up for the program but subsequently dropped out before installing measures (program dropouts), four program staff interviews and eight program contractor interviews. These efforts were undertaken to examine program design, determine program efficacy of promotion of conservation measures to the small business market, and assess whether program operations have been consistent with program design, among other things. This portion of the study also examines drivers and barriers inherent to the market and program, customer satisfaction and experience with the program and customer awareness and attitudes.
1.3 Key Study Results
The next two sections present the overall results of the impact and process evaluation followed by a summary of recommendations. The conclusions and recommendations rest upon KEMA’s experience in performing these types of surveys, interviews, on-sites and working with the associated paperwork during the SBES impact evaluation. As this evaluation was concurrent with ongoing program QA/QC activities, some of these recommendations may be underway or completed before this study's publication.
Impact Results It is clear from all evaluation activities that the NH SBES Program is generating significant savings for program participants. The impact study results suggest that over time, the sponsors and their program vendors have become more adept at estimating savings in their tracking systems. The primary impact adjustment factors that contribute to the calculation of energy savings in the SBES Program (technology adjustment, quantity adjustment and operation adjustment) have improved since the last Small Business Program evaluation conducted in 2004, and the overall energy realization rate of the 2010 program year calculated from this study is 100.2%.

KEMA, Inc. June 27, 2012 4
Table ES 2 presents the statewide estimate of program impacts after the calculation of each primary savings adjustment factor. Table ES 3 presents an overall summary of the state level results including energy savings, realization rates and the achieved relative precision. The overall 2010 program energy savings is calculated to be 9,338 MWh, with a realization rate of 100.2%. This is comprised of a lighting savings estimate of 7,738 MWh with a 96.9% realization rate and a non-lighting savings estimate of 1,602 MWh with a 120.1% realization rate. Although not shown, the lighting realization rate without the documentation adjustment is 101.8%.
Based upon the on-site activities, the largest adjustment in annual energy savings is due to documentation errors. The majority of this adjustment is attributed to one large lighting project where there was a transcription error in the entry of the demand savings. The second largest adjustment in energy savings is due to an adjustment for cooling interaction, which yielded a 4.1% increase in energy savings overall. All of the observed interaction savings was due to the interaction between lights and a facilities HVAC system.

KEMA, Inc. June 27, 2012 5
Table ES 2: Statewide Annual Energy Savings Adjustment Results by End-Use
Adjustment Factor Lighting Non Lighting Total
KWh % KWh % KWh %
Gross Tracking Savings 7,984,270 N/A 1,333,979 N/A 9,318,249 N/A
Documentation Adjusted -423,672 -5.3% -28 0.0% -423,700 -4.6%
Technology Adjusted -20,207 -0.3% 42,667 3.2% 22,460 0.2%
Quantity Adjusted -5,702 -0.1% -4,049 -0.3% -9,750 -0.1%
Operation Adjusted -118,580 -1.5% 171,110 12.8% 52,531 0. 6%
Interactive Adjusted 321,521 4.0% 58,000 4.4% 379,521 4.1%
Evaluated Energy Savings 7,737,630 -3.1% 1,601,680 20.1% 9,339,310 0.2%
Table ES 3: Summary of New Hampshire Results
Evaluation Result kWh Realization
Rate
Relative Precision (90%
confidence)
Lighting Savings 7,737,630 96.9% ±11.67%
Non-Lighting Savings 1,601,680 120.1% ±19.98%
Total Savings 9,339,310 100.2% ±10.26%
Table ES 4 compares the realization rate for lighting measures from the current study to the 2004 study for PSNH and statewide. In both cases, the realization rates have improved. An improvement in realization rates over time is expected as programs improve their methods of estimating tracking energy savings based upon evaluations.
Table ES 4: Comparison of Lighting Results to 2004 Study
Dimension
Current Study 2004 Study Tracking
kWh On-Site
kWh % Real Rate
Tracking kWh
On-Site kWh
% Real Rate
Statewide 7,984,270 7,737,630 96.9% 7,838,470 7,744,159 96.4% PSNH 6,788,279 6,353,471 93.6% 6,104,417 5,672,191 92.9%

KEMA, Inc. June 27, 2012 6
Figure ES 2 below presents the summer lighting profile from this study along with the summer profile calculated from the coincident study commissioned by the New England State Program Working Group in 20072 and the summer profile from the C&I Lighting Load Shape Project commissioned by NEEP in 20113. These profiles are driven solely by logger percent on data, and do not include interactive.
The shapes of the three profiles are similar, although the 2011 NEEP load shape does show a ramp up in use that occurs earlier in the day than the other load shapes (which can often be explained by the different mix of building types logged for each study). The 2011 and 2007 studies had higher overall peaks in operation than the current study (80% and 72% versus 66%), and the current study has a somewhat higher base of operation with a nadir of 21% versus the 2007 and 2011 studies (10% and 12%, respectively). The calculated summer on-peak lighting coincident factor (shown in gray; non-holiday average weekday from 1-5 PM throughout June, July and August) from the current study is 63.2% (with a precision of ±8.6% at the 90% confidence interval) versus the 2007 study result of 66.0% and 2011 result of 68.0%.
2http://neep.org/uploads/EMV%20Forum/EMV%20Studies/NECPUC%20CF%20Report%20with%20Bias%20and%20New%20CI%20Analysis.pdf 3http://neep.org/uploads/EMV%20Forum/EMV%20Products/NEEP%20CI%20Lighting%20LS%20FINAL%20Report_ver%205_7-19-11.pdf, Page 12, Table 1-14

KEMA, Inc. June 27, 2012 7
Figure ES 2: Summer Lighting Profile
Although we did not log during the winter months, we made some adjustments to the logger data to estimate an on-peak winter coincident factor. Following these adjustments, we calculated winter on-peak coincident factor (average weekday from 5-7 PM throughout December and January) from the current study to be 46.7% (with a precision of ±10.5% at the 90% confidence interval). This compared to the current assumption being used by the NH utilities of 48.4% (derived from the 2007 study result).
Table ES 5 below presents a summary of the coincident factors and a summer kW HVAC interactive factor as calculated from this study. We also provide the precision associated with each. The summer kW HVAC interactive factor is the percentage of the summer coincidence kW savings that are due to interactive effects.

KEMA, Inc. June 27, 2012 8
Table ES 5: Savings Factor Summary
Period
Factor
Precision at 90% Confidence
Summer Coincident Factor 63.2% ±8.6% Summer kW HVAC Interactive Factor 109.7% ±3.4% Winter Coincident Factor 46.7% ±10.5%
The study sponsors requested that we provide the winter and summer on/off peak energy splits4 as part of our reporting. We performed this analysis on the individual spreadsheets from each site and used the appropriate case weights to estimate the proportion of energy savings that falls into each period. Table ES 6 below presents a summary of the findings from this study as well as those values that are currently being assumed by the sponsors.
Table ES 6: Peak Energy Summary
Period
Current Assumed
Study Results
Winter Peak Energy 37% 45.5% Winter Off-peak Energy 29% 20.0% Summer Peak Energy 19% 24.3% Summer Off-peak Energy 15% 10.2%
Process Results The SBES program is recognized by each of the three categories of stakeholders (utility sponsors, implementing contractors, and utility customers) as providing a valuable service. By most accounts, the program is garnering high degrees of participant satisfaction and is achieving its budgetary and savings goals. Each sponsor attaches importance to the role of the program in helping them establish valuable relationships with customers and as a channel to engage with customers to identify other opportunities and needs that they can help address.
KEMA agrees with the assessment that the SBES program is providing an important service and believe that while there are areas for improvement in the program, its current level of functioning and operations is up to the task of continuing its promotion of energy efficiency 4 For these energy splits, we used the following definition: Summer peak is June through September, Winter is all other months. On-peak hours are Monday through Friday 7am – 11 pm; off peak hours are all others.

KEMA, Inc. June 27, 2012 9
among small businesses in New Hampshire. The SBES program provides flexibility to the sponsors to utilize contractors in the manner that best suits their needs while operating under the general auspices of program guidelines that are developed and maintained by the consensus of the CORE program members. The process evaluation examined the SBES program on several levels. Below we provide a summary of these findings.
1. Program Design – The program design meets utility sponsors’ savings and budget targets. It offers customers a strong package of incentives and support while creating few internal barriers to participation. Program design and processes are well understood by all parties involved in delivering the program service and provides sufficient flexibility for each sponsor to refine their delivery approach to best meet their organizational and customer needs. The design, however, was cited to have some features that are unduly burdensome for implementing contractors, including some marketing challenges, program tracking elements, recycling procedures and funding constraints (for more detail see sections 4.2.1 and 4.2.2).
2. Efficacy of Promotion of energy efficiency – The program is efficient at promoting conservation among program participants. Among participants, 90.7% reported that they would be somewhat or very likely to participate again in the SBS program. The non-participant sample reported only slightly lower likelihood of participation if approached, with 84.6% reporting that they would be somewhat or very likely to participate. The program drop out sample was even stronger than the non-participant sample with 92.3% being somewhat or very likely to participate again. This demonstrates that their experience with the program, while not productive, did not put them off to future participation. It is clear from our review of the NH Saves Catalog that it also provides a significant platform to further the promotion of conservation equipment, tips and case studies.
3. Drivers and Barriers – Customers report that saving both energy and money are the primary drivers for actual or potential participation. However, when asked about strengths and weaknesses of the program, and future participation, the issues of receiving program information was more frequently mentioned than the desire for higher incentives or discounts. This suggests that getting the word out about the program and continuing to build program awareness are likely to continue to generate sufficient participant leads.
4. Customer Satisfaction and Experience – Customers reported high levels of satisfaction with all specific program features and with program participation overall. The feature with the lowest rating was the savings delivered by the installed measures; however,

KEMA, Inc. June 27, 2012 10
even this rating was very favorable. Project duration was a noted concern among some customers.
5. Customer Awareness and Attitudes – Customer awareness of the program, with roughly one quarter of the non-participant sample (customer using > 5,000 kWh/year) unaware of the program, offers room for improvement.5 Customers, both participant and non-participant, reported a preference for and trust of direct mailing from their utility, offering relatively low-cost and high-impact means of addressing this issue. Their attitudes overall were positive towards energy efficiency programs, expressing a higher valuation of direct (e.g. savings) than secondary (e.g. environmental) outcomes.
6. Future Customer Behavior – Both participating and non-participating customers perceive an awareness of substantial opportunities at their facilities to improve energy efficiency. They also expressed moderate near-term interest in pursuing these perceived opportunities. Depending on the technology of interest, customers expressed varying levels of interest in taking advantage of using utility sponsored contractors versus their own in house or existing contractor relationship to have this work performed.
1.4 Recommendations
Impact Recommendations Below are four recommendations that are intended to further assist the sponsors in refining estimated savings and to inform the application of the results of this study.
1. KEMA recommends a renewed effort to ensure all contractors and sponsors are using consistent wattage assumptions. Our impact work indicates that the vast majority of energy savings were calculated for the program based upon the standard approved program wattages, which helps establish the transferability of overall state level impact results to each utilities tracking system. However, there were a handful of instances in which the standard statewide wattages were not used to calculate tracking savings. For example, in one project it was necessary to reduce a fixture wattage by a watt to match up tracking savings estimates from the file. This is not a significant issue, however, we do recommend that the sponsors make a renewed effort to facilitate the use of the standard wattages among their program vendors to ensure the same wattages are being
5 However, it should be noted even with an improvement in the level of program awareness, the final cohort of customers (those using <5,000 kWh/year) to participate in this program is typically also the most difficult to successfully recruit.
KEMA, Inc. June 27, 2012 11
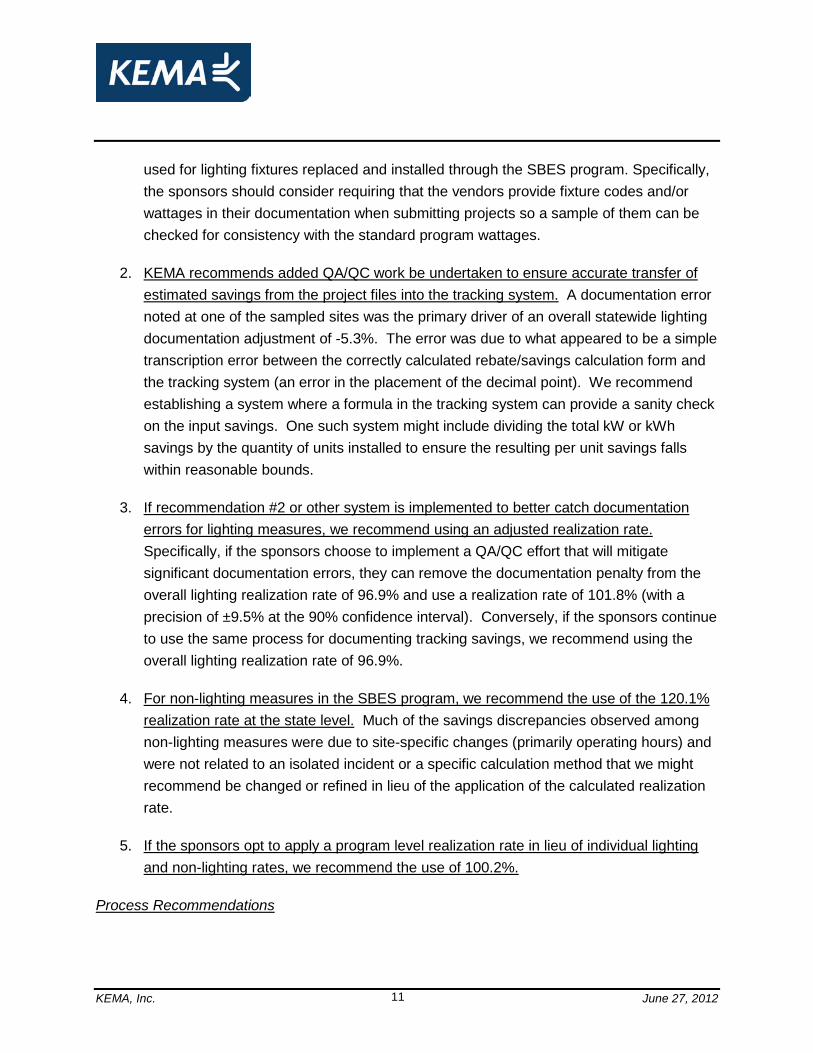
used for lighting fixtures replaced and installed through the SBES program. Specifically, the sponsors should consider requiring that the vendors provide fixture codes and/or wattages in their documentation when submitting projects so a sample of them can be checked for consistency with the standard program wattages.
2. KEMA recommends added QA/QC work be undertaken to ensure accurate transfer of estimated savings from the project files into the tracking system. A documentation error noted at one of the sampled sites was the primary driver of an overall statewide lighting documentation adjustment of -5.3%. The error was due to what appeared to be a simple transcription error between the correctly calculated rebate/savings calculation form and the tracking system (an error in the placement of the decimal point). We recommend establishing a system where a formula in the tracking system can provide a sanity check on the input savings. One such system might include dividing the total kW or kWh savings by the quantity of units installed to ensure the resulting per unit savings falls within reasonable bounds.
3. If recommendation #2 or other system is implemented to better catch documentation errors for lighting measures, we recommend using an adjusted realization rate. Specifically, if the sponsors choose to implement a QA/QC effort that will mitigate significant documentation errors, they can remove the documentation penalty from the overall lighting realization rate of 96.9% and use a realization rate of 101.8% (with a precision of ±9.5% at the 90% confidence interval). Conversely, if the sponsors continue to use the same process for documenting tracking savings, we recommend using the overall lighting realization rate of 96.9%.
4. For non-lighting measures in the SBES program, we recommend the use of the 120.1% realization rate at the state level. Much of the savings discrepancies observed among non-lighting measures were due to site-specific changes (primarily operating hours) and were not related to an isolated incident or a specific calculation method that we might recommend be changed or refined in lieu of the application of the calculated realization rate.
5. If the sponsors opt to apply a program level realization rate in lieu of individual lighting and non-lighting rates, we recommend the use of 100.2%.
Process Recommendations

KEMA, Inc. June 27, 2012 12
KEMA offers the following recommendations for consideration by the program sponsors. We provide these recommendations into two broad categories: activities the program is doing well and should continue and recommendations we believe would improve the program.
Activities the program is doing well and should continue: 1. Continue to use direct mailings and bill inserts as the primary marketing mechanisms to
reach small business customers while maintaining other marketing approaches to generate customer touch points. The use of these mailings and inserts should continue to compliment any marketing activities stemming from contractors who also have responsibilities to market the program and engage participants. As part of this effort, the sponsors should consider updating marketing materials, which were reported to be dated.
2. Maintain two channels for small business customers to receive incentives – through the turnkey program and through prescriptive customer rebates. The sponsors might consider exploring other means of service delivery that offer customers more choice in their contractor selection.
3. Continue to undertake efforts to gather technologies that the contractors believe should be added to the list of eligible measures; specifically cited as missing from was LED lighting technologies6. We recommend that the sponsors increase messaging that makes it clear that any cost-effective measure or package of measures may be eligible for program support by adding them as a custom measure.
4. National Grid and Unitil have recently made changes to their on-bill financing offering. The sponsoring utilities should continue to ensure full awareness among participating contractors of the option of on-bill financing for eligible customers, and consider the possibility of offering on-bill financing to more SBES participants within the context of whatever needs and internal or external limitations there might be to such an offering.
Recommendations for program improvement: 1. The total annual budget could be allocated on a yearly basis to two categories, one
portion contractor-specific as under the current program, and one portion to be competitively allocated to contractors that have expended their annual allocation and/or
6 In 2010, LEDs were treated as custom measures due to there being very few of them on the Energy Star or Design Lights list.

KEMA, Inc. June 27, 2012 13
are meeting their goals and are in need of added funding to continue to provide the program service.
2. Contractors expressed dissatisfaction with several aspects of the PSNH data system and the processes required by the SBES program, including time consuming data entry, how measure codes are handled, and how customers are set up in the program. We recommend that PSNH adopt metrics for the coming year of improving responsiveness to contractor information requests, improving or adding data validation routines to the SBES program data entry system, and streamlining the processes required for contractor data entry.
3. To address the concerns raised about the recycling process, the program could incorporate one or more of the following: for a) improved communication between the various contractors engaged at the customer site; b) improved program processes with regard to the handling of the materials prior to pick-up, in terms of packaging and placement; and, c) improved communication with customers with regard to responsibilities and expectations.
4. We recommend a program improvement goal to establish a system that ensures that the currently experienced duration between when a customer decides to install measures and when the installation is actually occurs, is either maintained or ideally shortened. The maximum duration should not exceed 20 weeks with a future goal of having the maximum duration of around 15 weeks.
5. Sponsors can consider targeting specific measures for enhanced marketing, and perhaps enhanced incentives, during each program year. The targeted measures should be selected by balancing the criteria of the potential number of measures, customer level of interest, cost-effectiveness, potential realized savings, and budget constraints. For example, NHSaves could declare 2012 “The Year of the Small Business Programmable Thermostat”, or target new LED lighting technologies.
6. The utility sponsors convene a structured and collaborative process with the contractors to examine and revise marketing and lead generation activities, tracking system procedures, increased contractor communication and education to better suit the needs of all parties.

KEMA, Inc. June 27, 2012 14
2. Introduction and Study Overview
The New Hampshire Public Utilities Commission and the Electric Utilities commissioned a study to perform an impact and process evaluation of the New Hampshire Small Business Energy Solutions Program. Two major goals were established for this evaluation: 1) to quantify the gross energy savings (impacts) due to the SBES Program with a precision of ±10% at the 90% confidence level, overall; and 2) to evaluate SBES program design assumptions and processes. For the impact evaluation, realization rates have been calculated for lighting and non-lighting measures, in aggregate at the program level, and by utility when reasonable to do so. In our impact work, we present the relative impacts between the tracking estimate of savings and our final estimates of savings, including the amount of change due to documentation errors, technology changes, quantity changes, hours of use adjustments and interactive effects.
For the process evaluation, the team conducted participant surveys, general non-participant surveys, program drop out surveys and staff interviews. These efforts were designed to examine program design, determine program efficacy of promotion of energy efficiency measures to the small business market, and assess whether program operations have been consistent with program design. This portion of the study also examined drivers and barriers inherent to the market and program, customer satisfaction and experience with the program and customer awareness and attitudes. In addition, the process evaluation effort investigated the nature of customer energy use.
Below we provide an overview of the program through use of a cross functional diagram. This diagram is intended to provide a basis for understanding the program and for putting subsequent study results in context. This section is followed by a discussion of the evaluation objectives, methods and study results. We finish the report with a section that presents our conclusions and recommendations and appendices that contain our data collection instruments.
2.1 Program Overview Based upon Interviews
The Small Business Energy Solutions Program is a key component of the New Hampshire Core Energy Efficiency Program portfolio. The four sponsors of this study operate and administer the SBES Program in parallel. The fundamental program design is largely consistent among the sponsors, with only minor differences in their operation noted in our interviews with Program Managers. To ensure that SBES uniformly addresses programmatic issues, the sponsors meet at least once a quarter as part of their management of the overall CORE portfolio. These

KEMA, Inc. June 27, 2012 15
meetings were reported to be manageable, productive and a very effective way to keep SBES program efforts aligned. Staff interviewees note that the program is running very well at this time with only a few points of concern. Interviewees generally regarded the program as well understood by the sponsors and vendors. This particular program has been refined over its years of operation to the point where roles, responsibilities and process are routine.
In the interviews, consistent elements of the SBES Program included the following:
• A program design that has incentives of up to 50% of installation costs, • Common wattages for use in calculating energy savings, • A common portal on NHsaves.com that routes customers to each sponsors efficiency
program webpage, • Near identical intake procedures, and • Highly similar audit paperwork.
Each sponsor also supports the publication and distribution of the NH Saves catalog. This catalog represents an important medium of communication that includes efficiency articles, case studies, introductions to new technologies and a channel for purchasing efficient products. In 2011, the catalog included post cards that promoted the Small Business Program. The catalog is updated annually with new products and pricing and represents a significant instrument in the promotion of efficiency in New Hampshire.
There were only minor differences noted in program operations among the sponsors. These slight differences included the following:
• Different participant eligibility threshold for NHEC (<100 kW)than the other sponsors (<200 kW),
• Varying levels of pre and post inspection rates (although all perform inspections to some degree),
• Varying levels of reliance on vendors in marketing and data tracking, • Minor differences in the final stages of job closeout, and
• Varying eligibility for on-bill financing (some sponsors allow all participants eligibility to this program feature, others limitation it to municipal customers only).
Figure 1 provides a cross-functional diagram of the overall program flow as gathered and understood from interviews with program administrators. We provide this diagram at this point in the report to present the overall program flow within which the context of our results can be

KEMA, Inc. June 27, 2012 16
understood. Included in this diagram are the primary stages of program operations along with the relationship between the parties (utility, contractor and customer), electronic interfaces in the program (common website portal and sponsor tracking systems), and average time lapse as provided in the tracking system data7. Common elements and minor differences in program operations among the sponsors are part of this flow diagram, along with notes that highlight key program elements. The interviewed sponsor representatives fully described and understood the flow of program operations.
7 Milestone dates were only provided by two of the sponsors. The overall averages are largely driven by those provided by PSNH.

KEMA, Inc. June 27, 2012 17
Figure 1: Cross-Functional Diagram of SBES Program

KEMA, Inc. June 27, 2012 18
The program interventions presented in this figure are consistent with those provided in the 2011-2012 CORE NH Energy Efficiency Program filing from August of 20108. Specifically, it includes marketing to leads generated by both utility customer service as well as contractor representatives to ensure adequate broadcasting of the program offering as well as a service that is provided turnkey to customers either through a program vendor or the companies own contractor. In addition, the SBES Program provides incentives equal to 50% of installed costs to assist them in offsetting what is often viewed as prohibitively high costs of installing more efficient equipment in the small business market.
8 http://www.puc.nh.gov/Regulatory/CASEFILE/2010/10-188/INITIAL%20FILING%20-%20PETITION/10-188%202010-08-03%202011-2012%20CORE%20JOINT%20ELECTRIC%20PROGRAM%20PROPOSAL.PDF

KEMA, Inc. June 27, 2012 19
3. Evaluation Objectives and Methodology
This section of the report provides the objectives and methods used to approach each task of the study. We begin with the primary impact and process objectives then provide sampling and data collection methods employed for each task undertaken.
3.1 Key Evaluation Objectives This evaluation was designed to address both process and impact research questions. To support the impact evaluation, KEMA selected a statistical sample of 42 on-sites and performed M&V at each to determine gross energy savings attributable to the program. The impact objectives include:
• A determination of gross energy savings from the 2010 program year, including a realization rate at the state level and for PSNH, which had sufficient sample to support its own result. This also includes the provision of the main discrepancies between the tracked savings and the evaluated gross savings for each level of reporting.
• A determination of lighting and non-lighting gross savings and realization rates. • The provision of summer coincidence factors based on logger data. • A review of the systems and methods employed to track and calculate energy savings,
including appropriate recommendations for improvement.
To support the process evaluation, KEMA performed 107 participant surveys, 78 general non-participant surveys, 40 program drop out surveys, four staff interviews and eight contractor interviews. The process objectives include:
• An assessment of the key drivers and barriers to participation, participation expectations and benefits received, and likelihood of future participation.
• A determination of the ease and timeliness of program processes, barriers to participation, and suggestions to make participation easier/more widespread;
• An exploration of program satisfaction and the effectiveness of marketing, services received, measures installed, and energy savings realized;
• A determination of how customers perceive their energy use and remaining opportunities,
• Awareness and interactions they have had with any other NH Saves programs; and • Other program suggestions for improvement based upon respondent experience.
KEMA, Inc. June 27, 2012 20
3.2 Impact Evaluation Methods
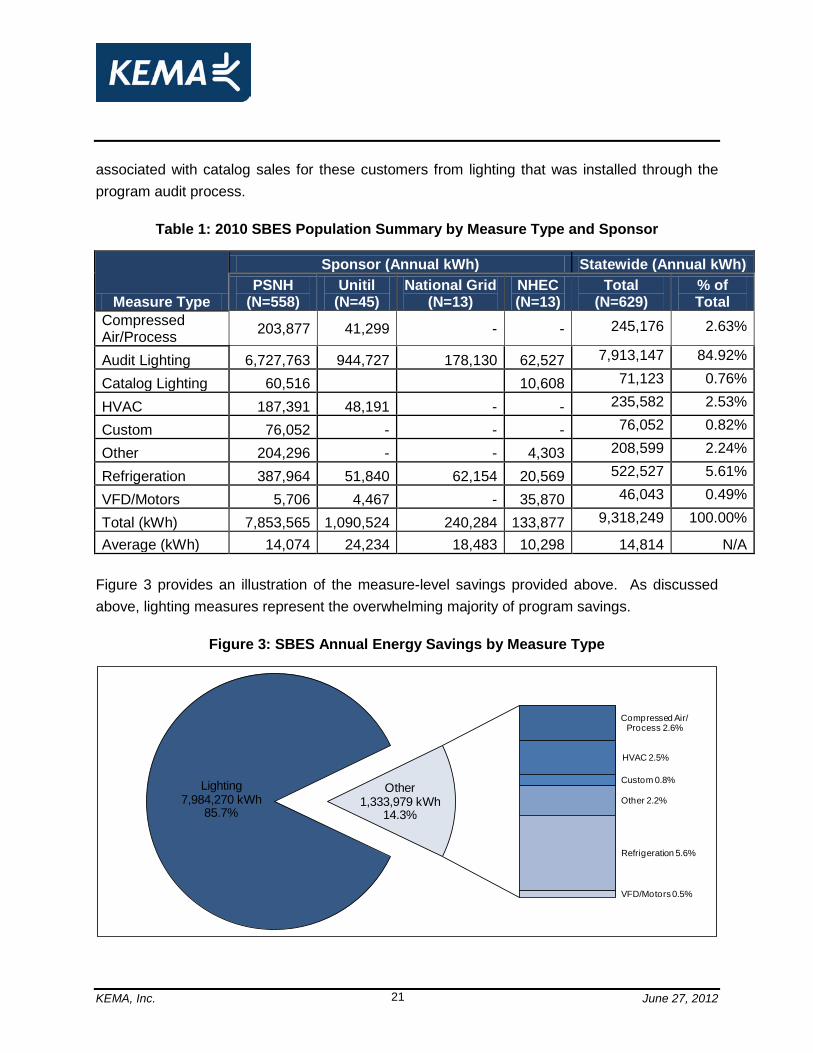
The fundamental data collection activity associated with the impact study was the on-site visits. We present the general flow of the on-site process from sample selection through data analysis in Figure 2. Following this figure, we provide more detail on each stage of the impact work from sampling through site and program level analyses.
Figure 2: Overview of Impact Approach
KEMA gathered 2010 program tracking data from each sponsor to begin the impact evaluation. This information was used to inform a sample design that targeted ±10% precision at 90% confidence. Table 1 provides a summary of the tracked annual savings in 2010, from 629 total participating accounts. In 2010, lighting measures comprised the vast majority of savings, representing 85.7% of all program savings. In this table, we differentiate the lighting savings
KEMA, Inc. June 27, 2012 21
associated with catalog sales for these customers from lighting that was installed through the program audit process.
Table 1: 2010 SBES Population Summary by Measure Type and Sponsor
Measure Type
Sponsor (Annual kWh) Statewide (Annual kWh) PSNH
(N=558) Unitil
(N=45) National Grid
(N=13) NHEC (N=13)
Total (N=629)
% of Total
Compressed Air/Process 203,877 41,299 - - 245,176 2.63%
Audit Lighting 6,727,763 944,727 178,130 62,527 7,913,147 84.92%
Catalog Lighting 60,516 10,608 71,123 0.76%
HVAC 187,391 48,191 - - 235,582 2.53%
Custom 76,052 - - - 76,052 0.82%
Other 204,296 - - 4,303 208,599 2.24%
Refrigeration 387,964 51,840 62,154 20,569 522,527 5.61%
VFD/Motors 5,706 4,467 - 35,870 46,043 0.49%
Total (kWh) 7,853,565 1,090,524 240,284 133,877 9,318,249 100.00%
Average (kWh) 14,074 24,234 18,483 10,298 14,814 N/A Figure 3 provides an illustration of the measure-level savings provided above. As discussed above, lighting measures represent the overwhelming majority of program savings.
Figure 3: SBES Annual Energy Savings by Measure Type
Lighting7,984,270 kWh
85.7%
Compressed Air/ Process 2.6%
HVAC 2.5%
Custom 0.8%
Other 2.2%
Refrigeration 5.6%
VFD/Motors 0.5%
Other 1,333,979 kWh
14.3%
KEMA, Inc. June 27, 2012 22
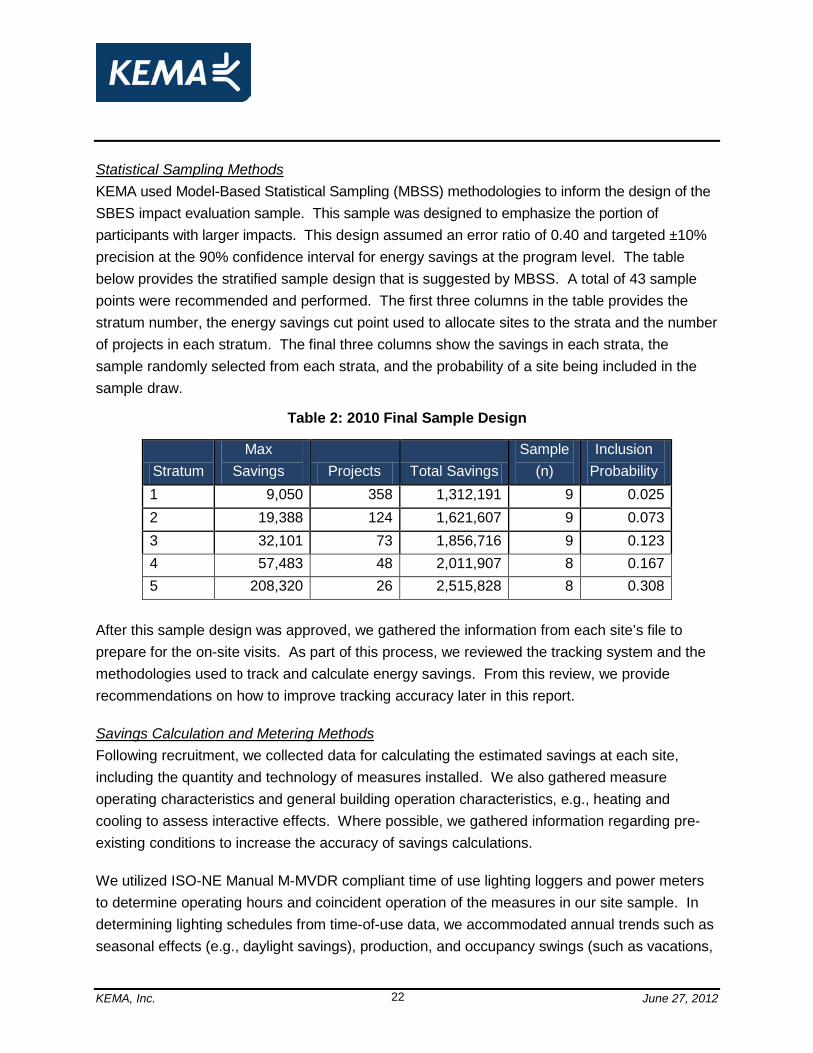
Statistical Sampling Methods KEMA used Model-Based Statistical Sampling (MBSS) methodologies to inform the design of the SBES impact evaluation sample. This sample was designed to emphasize the portion of participants with larger impacts. This design assumed an error ratio of 0.40 and targeted ±10% precision at the 90% confidence interval for energy savings at the program level. The table below provides the stratified sample design that is suggested by MBSS. A total of 43 sample points were recommended and performed. The first three columns in the table provides the stratum number, the energy savings cut point used to allocate sites to the strata and the number of projects in each stratum. The final three columns show the savings in each strata, the sample randomly selected from each strata, and the probability of a site being included in the sample draw.
Table 2: 2010 Final Sample Design
Stratum Max
Savings Projects Total Savings Sample
(n) Inclusion
Probability 1 9,050 358 1,312,191 9 0.025 2 19,388 124 1,621,607 9 0.073 3 32,101 73 1,856,716 9 0.123 4 57,483 48 2,011,907 8 0.167 5 208,320 26 2,515,828 8 0.308
After this sample design was approved, we gathered the information from each site’s file to prepare for the on-site visits. As part of this process, we reviewed the tracking system and the methodologies used to track and calculate energy savings. From this review, we provide recommendations on how to improve tracking accuracy later in this report.
Savings Calculation and Metering Methods Following recruitment, we collected data for calculating the estimated savings at each site, including the quantity and technology of measures installed. We also gathered measure operating characteristics and general building operation characteristics, e.g., heating and cooling to assess interactive effects. Where possible, we gathered information regarding pre-existing conditions to increase the accuracy of savings calculations.
We utilized ISO-NE Manual M-MVDR compliant time of use lighting loggers and power meters to determine operating hours and coincident operation of the measures in our site sample. In determining lighting schedules from time-of-use data, we accommodated annual trends such as seasonal effects (e.g., daylight savings), production, and occupancy swings (such as vacations,

KEMA, Inc. June 27, 2012 23
business cycles, etc.) to the extent supported by the data. As a general rule, visual inspection of time-of-use data should reveal explicable patterns that agree with other data sources, such as the information gathered from the on-site contacts. Loggers installed in schools were left in for the first two weeks of September to capture summer operation and regular school hours.
Appendix D has details on the compliance of these meters with the ISO-NE M&V requirements for metering equipment. We installed a total of 417 lighting loggers and 8 ELITEpro true power meters as part of the evaluation effort. We installed lighting loggers for an average of 7.1 weeks, with a minimum of 4.7 weeks and a maximum of 10 weeks. We installed ELITE loggers for an average of 8.7 weeks, with a minimum of 7 weeks and a maximum of 10 weeks. Figure 4 provides a graphical presentation of the logger installation and removal timeline for each type of meter installed at the sample on-site visits.
Figure 4: Logger Installation and Removal Timeline
On-site Activities and Savings Calculation Methodologies Both lighting and non-lighting measures had similar on-site activities performed, although their metering and savings calculations differed slightly. The primary objective of the site work was to gather the data needed to calculate independent estimates of gross energy savings. Each on-site included the following activities:
• Identify whether the measures were installed and operating as intended;

KEMA, Inc. June 27, 2012 24
• Verify that installation is consistent with the project file; • Review the baseline operating condition of the efficiency measure when possible; and • Perform necessary measurements to discern post-installation energy usage.
Any discrepancies in installed quantity, size, and technology specification were explicitly noted during the on-site surveys. Savings and metering methods varied depending on whether the measure was lighting or non-lighting. We discuss each in turn below.
Lighting Metering In this current study, 417 lighting time of use loggers were installed for a minimum of four weeks for each logger point. At the logged sites, sufficient loggers were installed to gather nearly all unique schedules in a facility, in the interest of maximizing the usefulness of the loggers available in estimating the savings at those sites. At all sites, we gathered self reported hours of operation for the installed lighting that included seasonal variations among other changes in hours a facility might encounter during the course of a year. This information was used as necessary to help expand the hours to represent a full year of operation. Information on operating hour results at the site level are included in this report as Appendix B.
Non-Lighting Metering We used a standard measurement and calculation approach for all non-lighting measures. We installed monitoring equipment at all non-lighting sites, including the installation of Elite power loggers to monitor the operating power of pumps, motors equipped with variable speed drives, and efficient HVAC equipment. We set each power logger to record average volts, amps, power factor, and kW in 15-minute intervals. The power loggers show power used over time and provides the operating schedule for the unit. We downloaded the recorded monitoring data from the power loggers and exported it Excel spreadsheets for review. We created Pivot tables from the data for use in verifying the savings calculations.
Below is an example of a pivot table that we used in savings calculations. This table shows the average power drawn (kW) for each hour of the day and every day of the week. The table also shows the weekly operating schedule of 7:00 am through 9:00 pm.

KEMA, Inc. June 27, 2012 25
Figure 5: Sample Weekly Operating Schedule and Power Consumption (kW)
Hour Sun Mon Tue Wed Thu Fri Sat1 0.0 0.0 0.0 0.0 0.0 0.0 0.02 0.0 0.0 0.0 0.0 0.0 0.0 0.03 0.0 0.0 0.0 0.0 0.0 0.0 0.04 0.0 0.0 0.0 0.0 0.0 0.0 0.05 0.0 0.0 0.0 0.0 0.0 0.0 0.06 0.0 0.0 0.0 0.0 0.0 0.0 0.07 3.7 3.5 3.5 3.0 5.6 2.9 5.58 4.9 5.2 4.9 5.4 7.5 4.5 6.99 6.8 7.2 6.8 7.5 10.1 7.5 7.9
10 9.0 8.9 8.2 9.5 10.9 10.3 8.611 10.7 10.0 10.9 11.4 11.2 11.6 9.912 12.1 10.8 12.2 11.7 11.8 12.3 10.713 11.8 10.8 12.4 12.5 12.1 13.1 11.014 11.9 10.7 12.4 12.8 12.3 13.3 11.515 11.9 11.4 12.6 12.9 12.3 13.7 11.216 11.8 11.3 12.6 13.3 12.4 13.6 11.117 10.7 10.8 12.3 12.9 12.4 13.5 10.918 9.8 9.9 10.2 11.9 11.5 12.9 10.719 9.4 9.3 9.3 10.3 11.8 12.3 9.520 8.3 7.2 8.7 9.1 11.1 10.6 7.721 7.7 6.2 8.3 8.6 10.6 9.8 6.022 0.0 0.0 0.0 0.0 0.0 0.0 0.023 0.0 0.0 0.0 0.0 0.0 0.0 0.024 0.0 0.0 0.0 0.0 0.0 0.0 0.0
We calculated savings for every hour of the year using the monitoring data. This allowed a statistically supported representation of the unique operating parameters of each measure on a weekly/hourly basis. The 8,760 hour format also allows the precise specification of holidays and any other operational factors identified at the site. This format provides an accurate estimate of annual energy savings and the ability to calculate performance for summer and winter demand periods. Additional methodologies for specific measure types we encountered in this study are described below.
Refrigeration Refrigeration measures included the installation of controls that limit evaporator fan operation and humidity controls for door heaters. Additional controls were installed to shut off vendor refrigerated boxes according to a time-of-day schedule. We installed time of use meters on the door heater, walk-in cooler lighting, and evaporator fan circuits. Lighting loggers were installed on vendor showcases as lighting is included in the on/off operation. Instantaneous kW readings were taken on the fans, door heaters, and lights for comparison with documented values. The
KEMA, Inc. June 27, 2012 26
Elite power logger could not be installed in the power panel housing the evaporator fan and door heater circuits due to size limitations. We created weekly operating schedules from each of the TOU logger data. This provided the weekly operating schedules for each technology. We compared the instantaneous kW readings with file values used in the savings calculations.
Premium Efficient Motors TOU loggers were installed in the motor disconnects controlling the units with the premium efficiency motors. We took Instantaneous kW readings on operating units. We used TOU loggers to monitor the on/off operation of the units and create a weekly operating profile for use in the 8,760 hour calculations. We compared the instantaneous power readings with tracking data and used them in the savings calculations. The units encountered in the sample were constant speed/volume systems. The instantaneous kW readings were indicative of operation and consistent with the TOU monitoring.
Efficient Rooftop Unit – HVAC We used Elite power loggers for the HVAC measures in our sample. We installed the loggers in the breaker panel and monitored the power drawn by the compressor, evaporator fan, and condenser fans. The power logger provided the daily/hourly operating kW, which was used to determine the weekly operating schedule of the unit. The duration of the cooling season [seasonal changeover] was obtained from discussions with site personnel. Since HVAC measures are weather sensitive, we compared the hourly power draw to local temperatures during the monitoring period. We used TMY3 weather data in the 8760 calculation spreadsheets. A regression analysis formula obtained from the monitored power and local weather data was used with the TMY3 weather data to estimate annual cooling performance.
Process Measures We encountered a variable speed pumping measure in our SBES sample. We installed two Elite power loggers to monitor the operation of these pumps. This was not a weather sensitive load. Monitoring occurred for 70 days to capture a significant part of the operating season for the pumps. The monitored data for each pump was downloaded into Excel to create summary day and hourly tables. This data was used in the 8,760 hour calculation spreadsheets. The pumps provide irrigation and additional seasonal scheduling outside the monitoring period was provided by site personnel. We used the monitored data and modified scheduling to estimate annual performance and savings.
Savings Calculations

KEMA, Inc. June 27, 2012 27
We compiled the data gathered from the on-sites into spreadsheets for analysis. The savings for constant load measures (such as lighting) were calculated as line-by-line comparisons of pre- and post-retrofit electrical use. We developed pre- and post-retrofit energy estimates for each line item within each measure. Interactive cooling and heating effects of the installed measures were also calculated utilizing engineering algorithms where applicable. The on-site savings calculations included all relevant information gathered during the on-site. Weather sensitive measures (HVAC, refrigeration, or process measures) were typically analyzed in a bin analysis. We conducted all analyses in a manner that allowed us to provide discrepancies between the tracked and gross savings according to each adjustment phase. This approach is described more fully below:
• Documentation Adjustment. The Documentation Adjustment reflects changes in savings due to discrepancies in project documentation. We recalculated the tracking estimates of savings using all quantities, measure type wattages and efficiencies, and hours documented in each project file. If our calculation of savings with the utility approved savings approach did not match up with that in the tracking system, it was deemed a documentation adjustment.
• Technology Adjustment. The Technology Adjustment reflects the change in savings due to the identification of a different lighting technology (e.g., fixture type and wattage) at the site than represented in the tracking system estimate of savings.
• Quantity Adjustment. The Quantity Adjustment reflects the change in savings due to the identification of a different quantity of lighting fixtures at the site than presented in the tracking system estimate of savings.
• Operation Adjustment. The Operation Adjustment reflects the change in savings due to the observation or monitoring of different operating hours at the site than represented in the tracking system estimate of savings.
• Interactive/Heating and Cooling Adjustment. The Heating and Cooling Adjustment reflects changes in savings due to interaction between measures and other systems in the building. Typically, interaction is between lighting measures and HVAC systems, although it can be calculated for any measure installed in a conditioned space that has reduced energy use.
Once all of the analyses were completed, KEMA extrapolated the results to develop final estimates of annual energy savings at the overall program level, and for lighting and non-lighting measures separately. We also calculated savings for PSNH, which had enough sampled sites
KEMA, Inc. June 27, 2012 28
to support such an estimate. All calculated results were sample weighted and statistically representative of the population or appropriate population sub-groups. Final results provided in this report include precisions associated with each level of disaggregation.
3.3 Process Evaluation Methods
In the process evaluation effort, we sought to comprehensively assess what can be recommended to improve the SBES program. We performed interviews with program staff and vendors as well as surveys with participants, non-participants and program drop outs to inform this discussion. Among the instruments designed for this study, we sought to assess a variety of program indices including customer satisfaction, things that could be done to increase participation and cost effectiveness, program drivers and barriers, and program experience, among other things. The following table provides a summary of the questions and sources of data that were designed and gathered to inform the process evaluation tasks.

KEMA, Inc. June 27, 2012 29
Issue in Process Evaluation/ Key Research Questions
Part
icip
ant
Surv
ey
Dro
p ou
t Su
rvey
Non
-Par
ticip
ant
Surv
ey
Prog
ram
Sta
ff In
terv
iew
s
Con
trac
tor
Inte
rvie
ws
Program Marketing
• What did the customer see? • What did the customer respond to? • What does the customer remember from the message? • What sources does the customer use and trust?
Motivation
• Why did the customer choose to participate in the program? • Relative importance of money, values, referrals,
experience? • Have customer drivers changed as a result of experience? • What would increase likelihood of future participation?
Process
• What is the customer perspective of application process? • What barriers and/or encouragements were encountered? • Impact of the installation on the customer’s operations? • Customer perspective of the implementation contractor? • Effect on cash-flow?
Satisfaction
• Is equipment meeting the expectations for performance? • Is equipment meeting expectations for energy savings? • Would you work with contractor/utility on future projects?
Potential
• Inventory of energy end uses at facility? • Energy cost as a percent of operations or gross? • What are the existing barriers to improving efficiency? • How would future energy efficiency project be approached?
Legend: = Major source of information; = Supporting information source
Participant Surveys We conducted a survey of program participants to evaluate customer satisfaction with the program services and the energy efficient equipment installed through the SBES program. Other points of inquiry included topics such as drivers, barriers, expectations met, likelihood of future participation, and program experience. These surveys were performed as part of the on sites (40 completes) and further supplemented with an additional phone effort (67 completes). The phone effort included computer assisted telephone interview (CATI) system to solicit participant feedback. The average survey length was 20 minutes. We sought to achieve

KEMA, Inc. June 27, 2012 30
±10.0% at the 90% confidence interval by sponsor, but small population sizes among some sponsors prevented achievement of this goal. At the state level, the final sample size of 107
achieves ±7.2%precision at the 90% confidence level and PSNH achieves ±7.9% precision at
the 90% confidence interval.
Service Territory Population Final Sample National Grid 13 5 NHEC 13 3 PSNH 558 90 Unitil 45 9 State 629 107
Non-Participant Surveys To collect non-participant feedback, KEMA implemented a CATI survey. There were two sub groups of non-participants we completed surveys with. The first was the performance of 40 surveys with customers from National Grid and PSNH that had dropped out from the program subsequent to completing an application to participate. The second was a group of 78 ‘pure’ non-participants. The sample of this latter group was selected from accounts eligible to participate in the SBES Program as gathered from each of the sponsoring utilities. The data provided by the sponsors included consumption, of which many accounts were noted to have particularly low consumption – even down to 1 kWh a year. To help the survey sample capture customers we would be most interested in, we removed all customers who used less than 5,000 annual kWh (417 kWh/mo) from the sample frame. We selected this cut point in an effort to avoid contacting particularly small accounts that might not represent a true premise of interest to the program. We further stratified the non participant population into three groups based upon annual consumption (<69,524 kWh,69,525 to 229,248 kWh and > 229,249 kWh) to be sure we spoke with customers of all sizes within the Small C&I designation.
We developed a survey for each non-participant group, which are provided in Appendix B. These instruments were designed to capture information on program marketing, awareness, barriers, and suggestions for improvement. In addition, it specifically addressed reasons for not participating (or for deactivating from the program).
In-Depth Interviews KEMA worked with the sponsors to develop a list of program staff and vendors to interview. We utilized senior in-house staff to conduct these interviews, which typically lasted around an hour

KEMA, Inc. June 27, 2012 31
in duration. We began with utility staff interviews, in which we asked about candidates for the subsequent vendor/contractor interviews. We interviewed at least one program staff member from each of the program sponsors. The eight contractors interviewed for this project serve the four NH utilities to different extents. Table 3 summarizes the utilities served by the interviewed contractors, where those respondents are currently under contract to support SBES. It is important to note, however, that the providers may also serve customers in the areas of one or more of the other utilities. In this role, the vendor is acting outside its role as a “contract vendor” to the utility. In this capacity, the vendor can and does provide its ‘normal’ market based services –lighting retrofits, refrigeration or recycling services – to other customers of the utility.
Table 3: Interviewed Contractor Coverage by Sponsor
Type PSNH NHEC Unitil N Grid
TK#1 X X TK#2 X X X TK#3 X TK#4 X X SP#1 X X X X SP#2 X SP#3 X SP#4 X X X X Totals 7 4 3 4
TK = Turnkey contractor, SP = Specialist (e.g., recycling vendor, lighting supplier).
Our interview guides are provided in Appendix B. These guides were designed to gather information on the following topics:
• Confirm and enrich our understanding of program theory and process;
• Solicit staff and contractor perspective on customer motivations and barriers;
• Inform the design of the participant and non-participant instruments;
• Assess performance of the delivery contractors;
• Assess customer and trade ally response to the program;
• Discuss strengths, weaknesses, opportunities and threats with regard to program success and improvement; and,
• Provide a confidential and unconstrained conduit for creativity and feedback.

KEMA, Inc. June 27, 2012 32
4. Results
This section of the report provides the results of the study. We begin with a discussion of the impact evaluation results followed by the results of our process evaluation effort. Following this section, we provide conclusions and recommendations.
4.1 Impact Evaluation Results
This section of the report provides the annual energy savings estimates at the program level and their associated realization rates and relative precision. We also provide this information for lighting versus non-lighting measures and for PSNH separately since we had sufficient sample size to perform that calculation. Each annual savings table in this section presents results through the six stages of tracking savings adjustment presented earlier.
In each table, the final estimate of annual energy savings is the sum of the gross tracking estimate plus the adjustment factors described above. In other words, the on-site estimate of savings equals Gross Energy Savings + Controls Adjustment + Documentation Adjustment + Technology Adjustment + Quantity Adjustment + Operation Adjustment + Heating Adjustment + Cooling Adjustment. In each table, the percent differences reflected in the adjustments are calculated from the gross tracking energy savings. This is due to the fact that the gross tracking savings was the primary expansion variable, and therefore is the most appropriate benchmark to reflect the on-site savings result as it is refined through the calculated adjustments.
Stratified Ratio Estimation Analysis We combined the on-site gross savings estimates in a stratified ratio estimation (SRE) analysis framework in which statistical weights were developed and applied to each sample participant to develop the total gross estimates of savings. These same weights were utilized to compute the impacts of each savings adjustment, including the documentation adjustment, quantity adjustment, etc. The figure below presents a scatter plot of the tracking system estimates of savings versus the on-site engineering estimates of savings for the lighting and non-lighting sampled participants. A one-to-one reference line is plotted as a dashed line on the diagonal of the figure. In addition, the final realization rate for all measures is plotted as a solid black line reflecting the average savings-weighted realization rate of all sample points. More detail on the final realization rates and the impacts of the various adjustment factors on those realization rates are in the next section of this report.

KEMA, Inc. June 27, 2012 33
Figure 6: Tracking System vs. Gross On-Site Scatter plot (State)
4.1.1 Program/State Level
Table 4 and Table 5 summarize the evaluation results for the 2010 Small Business Energy Solutions savings across New Hampshire by end-use. Total evaluated annual lighting energy savings is 9,339.3 MWh, with an overall realization rate of 100.2%. The relative precision for the evaluated annual energy savings is ±10.3%. The relative precision multiplied by the evaluated energy savings provides the error bound of the measured savings, which is calculated to be 957.7 MWh. In other words, the 90% confidence interval for the adjusted gross savings of all projects in the population is 9,339.3 MWh ± 957.7 MWh.

KEMA, Inc. June 27, 2012 34
Based upon the on-site activities, the largest adjustment in annual energy savings is due to an adjustment for documentation errors. The majority of this adjustment was due to one large lighting site (in strata 5), that what appeared to be a transcription error in the entry of the demand savings that results in a kWh tracking value that was approximately 10 times higher than the correct value contained in the project paperwork. Specifically, the project file had a total demand savings of 4.7 kW and energy savings of 12,272 kWh while the tracking system used a total kW savings of 47.028 to calculate a total kWh savings of 122,272 kWh. The second largest adjustment in energy savings is due to an adjustment for cooling interaction, which yielded a 4.1% increase in energy savings. All of the observed interaction savings was due to the interaction between lights and a facilities HVAC system.
On the non-lighting side, the largest adjustment was in operational adjustment, which was driven by one site that had a motor operating scheme that changed the load on the program pumps and two other sites that had changes in the hours of operation that increased savings.
Table 4: New Hampshire Annual Energy Savings Adjustment Results by End-Use
Adjustment Factor Lighting Non Lighting Total
KWh % KWh % KWh % Gross Tracking Savings 7,984,270 N/A 1,333,979 N/A 9,318,249 N/A
Documentation Adjusted -423,672 -5.3% -28 0.0% -423,700 -4.6%
Technology Adjusted -20,207 -0.3% 42,667 3.2% 22,460 0.2%
Quantity Adjusted -5,702 -0.1% -4,049 -0.3% -9,750 -0.1%
Operation Adjusted -118,580 -1.5% 171,110 12.8% 52,531 0.6%
Interactive Adjusted 321,521 4.0% 58,000 4.4% 379,521 4.1%
Evaluated Energy Savings 7,737,630 -3.1% 1,601,680 20.1% 9,339,310 0.2%
KEMA, Inc. June 27, 2012 35
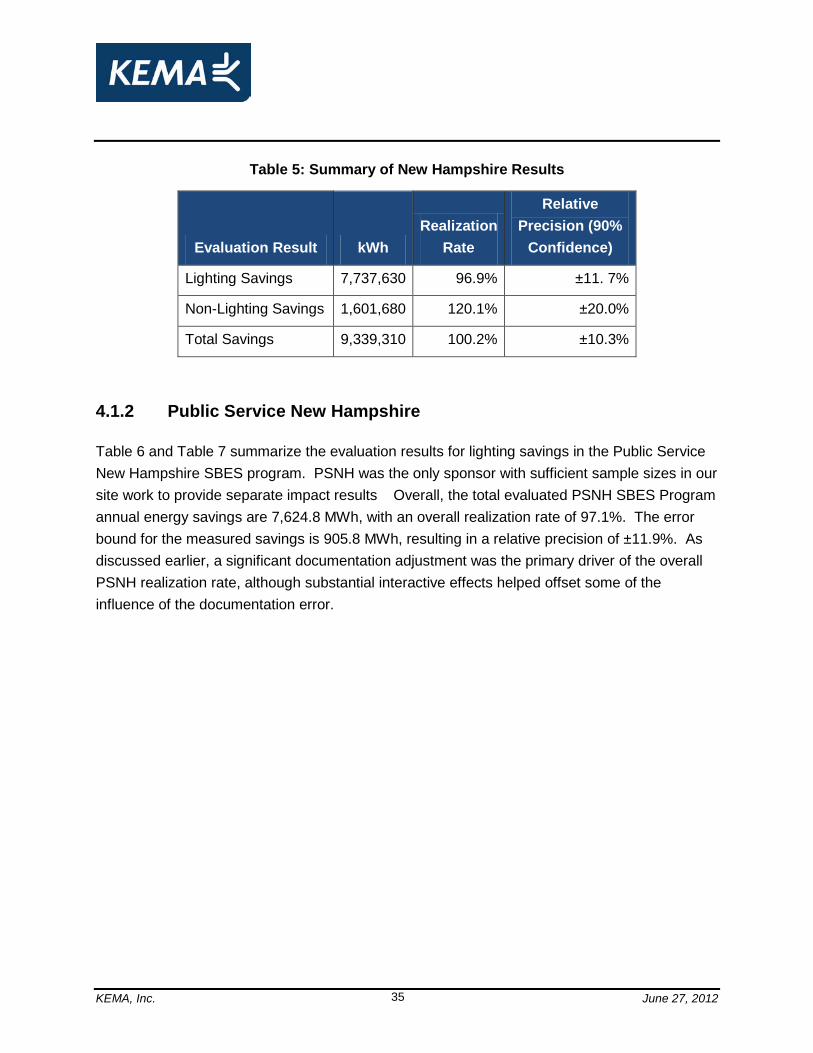
Table 5: Summary of New Hampshire Results
Evaluation Result kWh Realization
Rate
Relative Precision (90%
Confidence)
Lighting Savings 7,737,630 96.9% ±11. 7%
Non-Lighting Savings 1,601,680 120.1% ±20.0%
Total Savings 9,339,310 100.2% ±10.3%
4.1.2 Public Service New Hampshire
Table 6 and Table 7 summarize the evaluation results for lighting savings in the Public Service New Hampshire SBES program. PSNH was the only sponsor with sufficient sample sizes in our site work to provide separate impact results Overall, the total evaluated PSNH SBES Program annual energy savings are 7,624.8 MWh, with an overall realization rate of 97.1%. The error bound for the measured savings is 905.8 MWh, resulting in a relative precision of ±11.9%. As discussed earlier, a significant documentation adjustment was the primary driver of the overall PSNH realization rate, although substantial interactive effects helped offset some of the influence of the documentation error.

KEMA, Inc. June 27, 2012 36
Table 6: Summary of PSNH Annual Energy Results
Adjustment Factor
Lighting Non Lighting Total
KWh % KWh % KWh %
Gross Tracking Savings 6,788,279 N/A 1,065,286 N/A 7,853,565 N/A
Documentation Adjusted -450,507 -6.6% -25 0.00% -450,532 -5.7%
Technology Adjusted -14,922 -0.2% 38,638 3.63% 23,717 0.3%
Quantity Adjusted -13,402 -0.2% -3,666 -0.34% -17,068 -0.2%
Operation Adjusted -240,997 -3.6% 118,530 11.13% -122,467 -1. 6%
Interactive Adjusted 285,019 4.2% 52,524 4.93% 337,543 4.3%
Evaluated Energy Savings 6,353,471 -6.4% 1,271,286 19.34% 7,624,757 -2.9%
Table 7: Summary of PSNH Results
Evaluation Result kWh
Realization
Rate
Relative Precision (90%
Confidence)
Lighting Savings 6,353,471 93.6% ±13.6%
Non-Lighting Savings 1,271,286 119.3% ±21.8%
Total Savings 7,624,757 97.1% ±11.9% 4.1.3 Comparison of 2004 and Current Evaluations
Table 8 compares the realization rate for lighting measures from the current study to the 2004 study for PSNH and statewide. In both cases, the realization rates have improved. An improvement in realization rates over time is expected as programs improve their methods of estimating and tracking energy savings based upon evaluations.

KEMA, Inc. June 27, 2012 37
Table 8: Comparison of Lighting Results to 2004 Study
Dimension
Current Study 2004 Study Tracking
kWh On-Site
kWh % Real Rate
Tracking kWh
On-Site kWh
% Real Rate
Statewide 7,984,270 7,737,630 96.9% 7,838,470 7,744,159 96.4% PSNH 6,788,279 6,353,471 97.1% 6,104,417 5,672,191 92.9%
Table 9 presents a comparison of the lighting adjustment factors calculated in the 2004 Small Business impact report and the current report. We provide this information to show the improvement in the ability of the Small Business Program to estimate accurate savings over time. Setting aside the documentation adjustment, which was driven primarily by a transcription error at a single site, all other adjustment factors that reflect the accuracy of parameters being estimated by the sponsors and their vendors have improved since 2004. Specifically, the adjustments to technology, quantity and operation have all improved, providing strong evidence of a program that is doing a good job at estimating savings in its tracking system.
Table 9: Comparison of Statewide Lighting 2004 and 2010 Adjustments
Adjustment Statewide Factor 2004 Current
Documentation Adjusted -0.70% -5.31%
Technology Adjusted -0.60% -0.25%
Quantity Adjusted -2.20% -0.07%
Operation Adjusted -2.40% -1.49%
Interactive Adjusted 2.50% 4.03%
Final Evaluated Adjustment -3.50% -3.09% 4.1.4 Summer and Winter Coincidence
Figure 7 below presents the summer lighting profile from this study along with the summer profile calculated from the coincident study commissioned by the New England State Program

KEMA, Inc. June 27, 2012 38
Working Group in 20079 and the summer profile from the C&I Lighting Load Shape Project commissioned by NEEP in 201110. Neither of these profiles include interactive adjustments. The shapes of the three profiles are similar, although the 2011 NEEP load shape does show a ramp up in use that occurs earlier in the day than the other load shapes (which can often be explained by the different mix of building types logged for each study). The 2011 and 2007 studies had higher peaks in operation than the current study (80% and 72% versus 65%), and the current study has a somewhat higher base of operation with a nadir of 19% versus the 2007 and 2011 studies (10% and 12%, respectively). The calculated summer on-peak coincident factor (shown in gray, average weekday from 1-5 PM throughout June, July and August) from the current study is 62.9% (with a precision of ±8.7% at the 90% confidence interval) versus the 2007 study result of 66.0% and 2011 result of 68.0%.
Figure 7: Summer Lighting Profile
Although we did not log during the winter months, we are able to estimate an on-peak winter coincident factor based upon the logger data. For lighting spaces that are dependent on
9http://neep.org/uploads/EMV%20Forum/EMV%20Studies/NECPUC%20CF%20Report%20with%20Bias%20and%20New%20CI%20Analysis.pdf 10http://neep.org/uploads/EMV%20Forum/EMV%20Products/NEEP%20CI%20Lighting%20LS%20FINAL%20Report_ver%205_7-19-11.pdf

KEMA, Inc. June 27, 2012 39
ambient light, we made any appropriate adjustments to increase the operation based on hourly sunrise/sunset data for the location. This is typically done for exterior fixtures. Verbal schedules were considered for interior spaces that were seasonal. Following these adjustments, we calculated winter on-peak coincident factor (average weekday from 5-7 PM throughout December and January) from the current study to be 46.7% (with a precision of ±10.5% at the 90% confidence interval) versus the current assumption being used by the NH utilities of 48.4% (derived from the 2007 study result).
Table 10 below presents a summary of the coincident factors and a summer kW HVAC interactive factor as calculated from this study. We also provide the precision associated with each. The summer kW HVAC interactive factor is the percentage of the summer coincidence kW savings that are due to interactive effects.
Table 10: Savings Factor Summary
Period
Factor
Precision at 90% Confidence
Summer Coincident Factor 63.2% ±8.6% Summer kW HVAC Interactive Factor 109.7% ±3.4% Winter Coincident Factor 46.7% ±10.5%
The study sponsors requested that we provide the winter and summer on/off peak energy splits11 as part of our reporting. We performed this analysis on the individual spreadsheets from each site and used the appropriate case weights to estimate the proportion of energy savings that falls into each period. Table 11 below presents a summary of the findings from this study as well as those values that are currently being assumed by the sponsors.
11 For these energy splits, we used the following definition: Summer peak is June through September, Winter is all other months. On-peak hours are Monday through Friday 7am – 11 pm; off peak hours are all others.
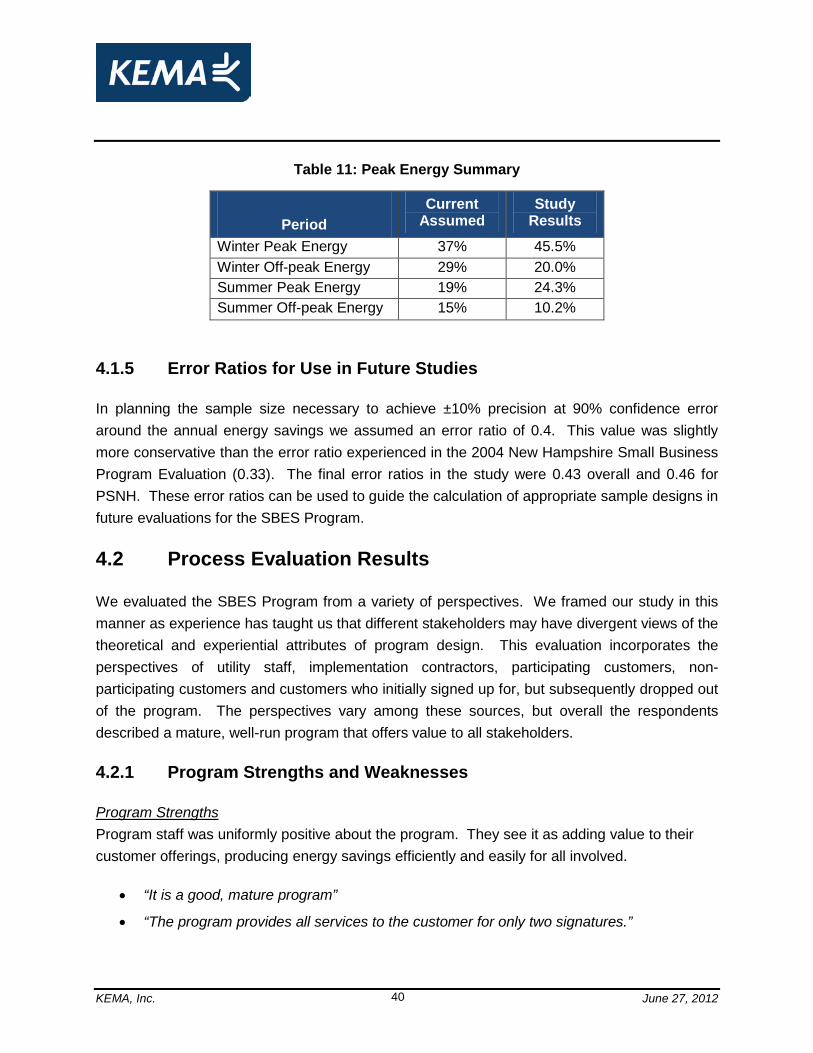
KEMA, Inc. June 27, 2012 40
Table 11: Peak Energy Summary
Period
Current Assumed
Study Results
Winter Peak Energy 37% 45.5% Winter Off-peak Energy 29% 20.0% Summer Peak Energy 19% 24.3% Summer Off-peak Energy 15% 10.2%
4.1.5 Error Ratios for Use in Future Studies
In planning the sample size necessary to achieve ±10% precision at 90% confidence error around the annual energy savings we assumed an error ratio of 0.4. This value was slightly more conservative than the error ratio experienced in the 2004 New Hampshire Small Business Program Evaluation (0.33). The final error ratios in the study were 0.43 overall and 0.46 for PSNH. These error ratios can be used to guide the calculation of appropriate sample designs in future evaluations for the SBES Program.
4.2 Process Evaluation Results
We evaluated the SBES Program from a variety of perspectives. We framed our study in this manner as experience has taught us that different stakeholders may have divergent views of the theoretical and experiential attributes of program design. This evaluation incorporates the perspectives of utility staff, implementation contractors, participating customers, non-participating customers and customers who initially signed up for, but subsequently dropped out of the program. The perspectives vary among these sources, but overall the respondents described a mature, well-run program that offers value to all stakeholders.
4.2.1 Program Strengths and Weaknesses
Program Strengths Program staff was uniformly positive about the program. They see it as adding value to their customer offerings, producing energy savings efficiently and easily for all involved.
• “It is a good, mature program”
• “The program provides all services to the customer for only two signatures.”

KEMA, Inc. June 27, 2012 41
• “The vendor system eases much of the paperwork burden, and effectively gives us a sales force that develops projects.”
When asked to score the overall design of the SBES program, the contractors gave it an average rating of 7.8 on a scale of one to ten. The comments they offered were generally favorable as well.
• “It works pretty well… other utilities, trying to run their own programs themselves, and without the ability to [manage] the data as well as [utility] does, can be very difficult.”
• “It’s very smooth-running – we get all we need relatively quickly from the utilities.”
• “They give you flexibility, between the prescriptive and custom tracks ... that flexibility opens up the range of options I can offer to the customer, and as long as a different item is cost effective and meets the utility’s criteria, we can put it through the program.”
• “They do offer benefits to the customer, and if a customer wants a lighting project, it’s easy enough to do it. It’s not a bad program."
The customer mix is agreed by respondents to be broadly inclusive of small businesses in the <100-200 KW category. Chain stores were reported to be not generally represented because they typically have energy managers that operate across multiple utility territories. The smallest customers were reported to generally not be represented either, with interviewees suggesting that part of this is due to some not passing the cost-benefit tests required of program participation due to low operating hours.
All utility and contractor interviewees also confirmed that they are able to identify and deal with the decision-makers at the target businesses most of the time. This reflects both the deliberate effort by the turn-key vendor as well as the nature of the smaller businesses themselves. One contractor interviewee summed up this by saying that their role includes “...to find & get into contact with those decision-makers. To see what they’re looking for ...what’s their payback criteria, do they have capital available; specific facility objectives, etc.”
We asked Participants for their opinion of the strengths of the program. Sixty-five of the 107 respondents (61%) offered responses. The categories of the responses provided are shown Figure 8 below.

KEMA, Inc. June 27, 2012 42
Figure 8: Participant-Reported Program Strengths
Program Weaknesses Opinions begin to diverge when it comes to perceived gaps in program design. The utility staff interviewed offered only one limited comment in this area; that rebates could be increased a little bit. Generally, interviewees reported little in the way of weaknesses in the program design.
Contractors, on the other hand, provided a different perspective. Their comments revolved around three ideas. First, relates to the budget caps. Contractors perceive that these have an adverse impact on effective program implementation and have increased their risk and uncertainty. Specifically, this comment relates to the ongoing possibility that funds being expended before the yearend can result in vendors making significant investments to prepare a project only to be forced to delay or lose the project opportunity due to lack of incentive funds.
• “There is a budget cap. I exceeded it in August, and so we are shut-off can’t do any more projects. (We have a backlog of $200K in project bids out. This backlog will be carried into 2012 and then will eat up my 2012 budget by April, unless they increase my budget.”
• “But now we have expended our portion… so we are now shut down until December.”
• “The only way we could participate more would be if the utilities increase their programs’ [budgets]”

KEMA, Inc. June 27, 2012 43
The second theme that arose from this group was that incentives levels were not optimal. “… in MA, National Grid offers higher incentives, so people in those border areas (adjoining MA) wish their incentives were greater.” It should be noted that comments of this nature from contractors are typical and understandable; however, utility staff note that 50% seems to provide the right balance of rebate to garner the needed participation and savings goals within the budgets available.
Thirdly, contractors suggested that the range of products covered could be expanded.
• “LEDs are actually very limited in offerings. If more LEDs were possible under the 50-50 plan, we’d do better.” 12
Participants (107) were also asked about program weaknesses. Twenty eight participants (26%) responded to this open-ended question and provided a program weakness, meaning that three quarters (74%) of participants contacted were unable to cite a program weakness. These responses were categorized and the responses by category are summarized in the figure below. The most commonly cited weakness was related to program processes. These program participant respondents were served by diverse vendors and included statements that the program took too long, that the project was not well executed, there was not sufficient follow-up, and that the paper work and processes were a weakness. The next most frequent respondent were those participants that reported they felt program information and awareness efforts were weak. They offered comments about the general lack of awareness of the program in the market place; the lack of clarity in, and difficulty of understanding, program materials; and the lack of contractor knowledge about the program. However, program participants seem largely content with the amount of incentives provided in the program with less than 4% noting it as a feature with room for improvement. One respondent mentioned incentives, then followed up with “It’s a joke. It was fair…they were wonderful.”
12 It should be noted that in 2010 there were few LEDs available prescriptively as there were not many on the Energy Star list, although contractors always had the opportunity to offer them as custom measures. In 2011, more LEDs have been added to the prescriptive measures list.

KEMA, Inc. June 27, 2012 44
Figure 9: Participant-Reported Program Weaknesses
Suggested Improvements Utility staff reported only one opportunity for improvement in program design. Specifically this respondent indicated that “I think shortening the lead creation/approval process would help customers and contractors.” Generally, the interviewee responses to questions soliciting suggested improvements in program design were supportive of the current design. Contractors, on the other hand, had several ideas for improving the program, many of which are related to operations. With regard to program design, some of the suggestions offered include the following:
• Increase marketing by the utility: “The info is probably available, but the customer is left to find it on their own.” (note that this comment was from a contractor who has contractual responsibility to perform their own marketing).
• Faster incorporation of new and proven measures, such as LED lighting: “They need to add the newer technologies in the program, like more LEDs.”
• Financing opportunities, where it is not offered, was mentioned by three out of eight contractors: “’Can I (pay for the project) do it over time?’ Is one of the most common questions I get. …. This is a huge minus for New Hampshire.”

KEMA, Inc. June 27, 2012 45
When offered the opportunity to “think outside the box” of the current design, contractors offered a wide range of suggestions to help improve the program, the most prevalent of which related to increased communication between the utilities and the contractors.
• “offer more internal training... [to vendors].”
• “provide more training to electrical contractors on the regulatory aspects of the products they deal with”
• “Making it clear to their vendors who is the point of contact for each area/accounts”
• “And having the utility work more closely with [us] is huge”
Participants, non-participants, and program dropouts were also asked to provide suggestions on how to increase the attractiveness for participation in the program. Figure 10 presents the most frequent results provided. Multiple responses were allowed. We interpret this figure to indicate that participants believe that communicating the program among other customers would bring in more program activity while non-participants and drop outs are more prone to suggest the provision of more incentives to attract participation.
Figure 10: Customer Suggestions to Improve Program and Increase Participation
0%
5%
10%
15%
20%
25%
30%
35%
40%
45%
50%
More money/ incentives
Improve info/ communication
One-on-one communication
More Energy Savings
Make the Program Easy to Use
Improve timing
% R
espo
ndin
g
Suggested Program Improvement
Participants (n=22)
Non-Participants (n=79)
Drop Outs (n=12)

KEMA, Inc. June 27, 2012 46
4.2.2 Program Operations
This section of the process results provides information regarding program marketing, intake, tracking systems and administrative procedures.
Marketing While the level of utility involvement in marketing varies across the respondent pool, utility staff in general describe the program marketing effort as the responsibility of the contractors, which is part of their contract with these contractors. While the sponsors might engage in marketing through channels such as the Lighting Catalog, the contractors were reported to carry the primary marketing effort. The sponsors evaluated marketing it as sufficient and effective.
• “Customers like it, [it is at a] sufficient level.”
• “No need to increase marketing, have met our goals.”
• “Enough leads from current effort.”
• “No customer comments. Contractors doing well.”
Contractors, on the other hand, voiced a mixed opinion and were generally more critical about SBES marketing. The primary shortfall cited by the contractors is the quality of leads, aging materials and marketing tone. It should be noted, however, that some sponsors have made it the contractor’s responsibility to generate their own leads through their contracting vehicles. Some of these comments may also be considered reflective more of a need to communicate marketing methods and activities as opposed to a criticism of the promotion activities themselves:
• “Most of the leads we have, we get ourselves. They are not passing on leads, and it’s been this way for last 2-3 years.”
• “I don’t know what they send out. The customers that come in are sporadic, and from no specific areas. I have no idea how much contact they do, or how.”
• “Their messages are bureaucratic, where as NH customers are earthier – the messages are not as grass-roots as they could be.”
• “I have seen their program literature over time, but not recently…. It is not very helpful at encouraging their customers to take advantage of the program. It doesn’t seem to drive customers to me or my activities.”
• “They are still using the same brochures we started with in 2004-5, they’ve never upgraded them since.”

KEMA, Inc. June 27, 2012 47
Despite these shortcomings, the four primary contractors rated the clarity of marketing materials highly (average 8.5 on a 10 point scale). Those four contractors reported marketing activities that were particularly dependent on marketing materials, including direct mailings, face-to-face outreach and meetings and workshops to describe the program, such as at Rotaries and Chambers of Commerce. If additional marketing were to become necessary, marketing by the utilities in the form of media ads are widely seen as the next frontier in terms of creating customer awareness, interest and potential action: ads in newspapers, TV, radio and possibly billboards. In fact, as illustrated in the bullets below, contractors spoke with high regard for the effectiveness of marketing efforts that a) emphasize the utility’s endorsement and/or b) create direct customer contact.
• “[Utility’s] direct mail postcards have been effective – because they DON’T come in the bill, so people are more inclined to look at it.”
• “Things that come straight from the utility, which has more trust value.”
• “Direct interaction with a utility employee is the best, educating the customer; this is the most effective form of marketing we see. Utilities can do this through workshops and other forms of direct outreach, etc.”
• “Referrals from a friend, and repeat business from a prior customer, these are the best.”
• “We also find cold calling can work, when you’re good at developing rapport with customers.”
• “Trade shows could help if we needed to do more marketing.”
One measure of the success of marketing efforts is the level of program awareness in the market place. We asked customers about their awareness of energy efficiency programs prior to their participation. Overall, more than four of every ten participants indicated they were aware of efficiency program offerings prior to current participation and 25 (23%) reported they had previously participated in a NH Saves offering. In fact, twenty were prior participants in the SBES program. Table 12 and Table 13 below summarize these responses.

KEMA, Inc. June 27, 2012 48
Table 12: Participant Previous Awareness of Efficiency Programs
Sponsor Yes No DK National Grid (n=5) 60.0% 40.0% 0.0%
NHEC (n=3) 66.7% 33.3% 0.0% PSNH (n=90) 42.2% 46.7% 11.1% Unitil (n=9) 44.4% 44.4% 11.1%
Overall (n=107) 43.9% 45.8% 10.3%
Table 13: Participant-Reported Prior Program Experience
Sponsor SBES NE&C DK National Grid (n=3) 2 0 1
NHEC (n=1) 1 0 0 PSNH (n=20) 17 3 0 Unitil (n=1) 0 0 1
Overall (n=25) 20 3 2
Customers were asked to rate the ease of understanding the program and the completeness and accuracy of the marketing materials on a scale of one to five, with five being the best. Figure 11 compares the results to those from the 2003 study. As the figure shows, each metric was rated similarly favorable across each evaluation year. In this study, 82% of respondents gave the ease of understanding the program a rating of four or greater; compared to 83% in the 2003 evaluation. Similarly, 77% of respondents gave the completeness and accuracy of the marketing materials a rating of four or greater; compared to 79% in the 2003 evaluation.

KEMA, Inc. June 27, 2012 49
Figure 11: Customer Ratings of Program and Program Marketing Materials
0%
10%
20%
30%
40%
50%
60%
2010 Participants (n=103)
2003 Participants (n=85)
2010 Participants (n=78)
2003 Participants (n=85)
% o
f Res
pond
ents
Ease of Understanding Program
5-Rating 4-Rating 3-Rating 2-Rating 1-Rating
Completeness and Accuracy
The objective of marketing is awareness. Participants, non-participants, and program drop outs were surveyed as to their sources of awareness of the SBES Program and energy efficiency topics and opportunities. Table 14 below summarizes their responses. The diversity of sources provided by respondents reflects the importance of flexible and multi-pronged marketing approaches in building awareness and garnering program participation.
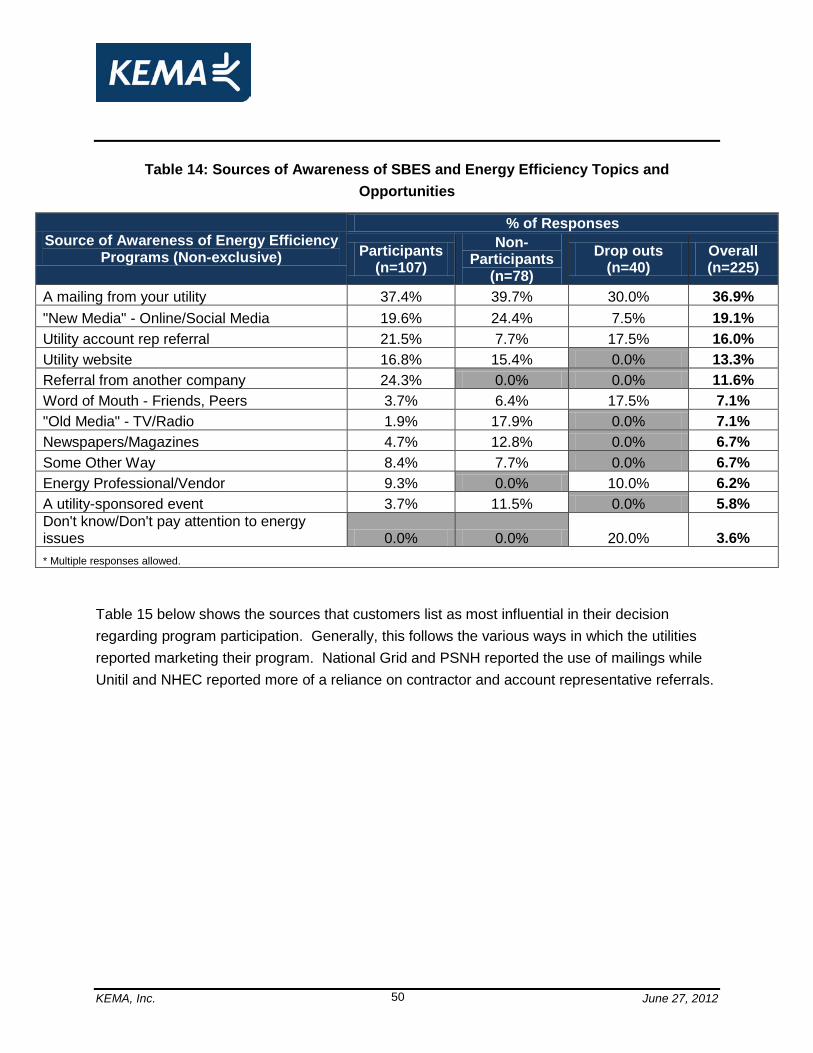
KEMA, Inc. June 27, 2012 50
Table 14: Sources of Awareness of SBES and Energy Efficiency Topics and Opportunities
Source of Awareness of Energy Efficiency Programs (Non-exclusive)
% of Responses
Participants (n=107)
Non-Participants
(n=78) Drop outs
(n=40) Overall (n=225)
A mailing from your utility 37.4% 39.7% 30.0% 36.9% "New Media" - Online/Social Media 19.6% 24.4% 7.5% 19.1% Utility account rep referral 21.5% 7.7% 17.5% 16.0% Utility website 16.8% 15.4% 0.0% 13.3% Referral from another company 24.3% 0.0% 0.0% 11.6% Word of Mouth - Friends, Peers 3.7% 6.4% 17.5% 7.1% "Old Media" - TV/Radio 1.9% 17.9% 0.0% 7.1% Newspapers/Magazines 4.7% 12.8% 0.0% 6.7% Some Other Way 8.4% 7.7% 0.0% 6.7% Energy Professional/Vendor 9.3% 0.0% 10.0% 6.2% A utility-sponsored event 3.7% 11.5% 0.0% 5.8% Don't know/Don't pay attention to energy issues 0.0% 0.0% 20.0% 3.6% * Multiple responses allowed.
Table 15 below shows the sources that customers list as most influential in their decision regarding program participation. Generally, this follows the various ways in which the utilities reported marketing their program. National Grid and PSNH reported the use of mailings while Unitil and NHEC reported more of a reliance on contractor and account representative referrals.

KEMA, Inc. June 27, 2012 51
Table 15: Most Influential Sources of SBES and Energy Efficiency Topics and Opportunities
Most Influential Source of Awareness of Energy Efficiency Programs (Exclusive)
Participants (n=107)
Non-Participants
(n=78) Drop outs
(n=40) Overall (n=225)
A mailing from your utility 20.6% 47.4% 10.0% 28.0% Energy Professional/Vendor 9.3% 26.9% 5.0% 14.7% Don't Know 15.9% 0.0% 17.5% 10.7% "New Media" - Online/Social Media 9.3% 0.0% 30.0% 9.8% Word of Mouth - Friends, Peers 2.8% 14.1% 10.0% 8.0% Utility account rep referral 8.4% 6.4% 7.5% 7.6% Some Other Way 13.1% 0.0% 5.0% 7.1% Referral from another company 12.1% 0.0% 0.0% 5.8% Newspapers/Magazines 0.9% 3.8% 7.5% 3.1% "Old Media" - TV/Radio 1.9% 1.3% 7.5% 2.7% Utility website 3.7% 0.0% 0.0% 1.8% A utility-sponsored event 1.9% 0.0% 0.0% 0.9%
When asked if there would be a better way to inform them about program opportunities, only 17% of participant respondents reported that there was. Figure 12 summarizes their responses below, which focused heavily on the idea of having a utility representative customer outreach effort or the use of direct customer mailings, both of which are currently being used as regular marketing channels.

KEMA, Inc. June 27, 2012 52
Figure 12: Customer Suggested Contact Method
Intake and Eligibility From the utility staff perspective, intake and eligibility procedures are not an issue.
• “Contractors normally do not have contact with customers unless they are eligible.”
• “Customers are fully informed – [Contractor] does a good job of explaining what they can do.”
• “[Contractors] do an excellent job of explaining program eligibility.”
One utility respondent noted that there were some cases where the potential participant was not eligible for SBES services and offered the following comment with regard to exception handling.
• “Contractors normally do not have contact with customers unless they are eligible. In some cases, a small customer may ask a contractor to audit another facility that is a larger account and is therefore not eligible for the program [in those cases] the contractor is free to propose projects as any contractor would under the Large C&I programs, and communicating the differences between the programs is critical to their success on those proposals.”
This comment suggests a level of flexibility in working with customers that allows participation in an energy efficiency initiative to be inclusionary. It also links to the theme suggested by contractors in the program-improvement sequence of enhanced communication between them and the utility. Contractor respondents identified three issues associated with eligibility: a)
KEMA, Inc. June 27, 2012 53
securing access to the utility’s pre-screened customer list in a timely fashion; b) verifying utility territory; and c) for refrigeration measures - conducting an audit to determine whether the customer has eligible equipment on-site. Of these, securing the utility’s confirmation of customer eligibility – by either a pre-screened list or an affirmative reply to a vendors’ request -remains the biggest roadblock:
• “We use a 2 tiered approach – the first step is at [utility], where they look to see if the customer falls within the program boundaries, on every case – there may be a line between small and large, and we can’t determine the boundaries of these classes, they have to do that.”
• “By usage history – we can look them up in our database … (but some customers...) we never got, they’ve opted to hold that internally. I have to call the PM to ask, by meter number, and they’ll respond.”
• “It’s based off of the utility’s customer list. We don’t have a list per se … they prescreen the leads -- The geographic line between [these utility territories] is very thin, so we spend a lot of time verifying – [some towns may have] 2 or 3 different utilities in it...]”
The sponsors and implementers express the belief that the intake process is “effortless” for the customer. When directly queried about their experience, there is little to contradict this in customer responses. Overall, the vast majority of customers were satisfied with the application and intake process, giving it an average rating of 4.1 out of five. There were only two customers (<2% of all respondents) who gave it a rating of less than three were asked the reasons for their dissatisfaction, one that felt like they did not have enough control and one that simply stated they were dissatisfied (who also responded negatively to most other questions). Less than a dozen customers responded to questions asking how the application process could be improved. Of those, the majority were not related to the application process, three suggested improving communications by some undefined means, and one suggested an on-line scheduling tool.
Measure Installation The contractor pool indicated that customers are uniformly interested in the impact that measure installation will have on their businesses. Specifically, they indicate that 85% to 100% of the time, they expect to be asked about the facility access and timing, impacts to the manufacturing operations, dust, and/or other workplace impacts that the project might have. In all cases, the responsible vendors reported that they schedule their work at lunch hours, before or after work shifts as needed, to ensure that workplace disruption of any kind is minimized.

KEMA, Inc. June 27, 2012 54
• “It happens a lot, maybe 85%. [They ask about] access to their facility, displacing people from desks, shutting down the manufacturing areas, disruptions to normal business processes.”
• “Everyone always asks about it. The installers reassure everyone that they can do it during lunch time. Most installers want to work around the customers’ timeframe because they are paid per unit, not per hour anyway, so they want to be as short and efficient in their installations as possible.”
Following the installation, all contractors report that customers are consistently pleased with the installation process.
• “Customers are usually pretty satisfied, because we listen to their needs and respond. For example, when we work in schools, we can’t install during school day, so we just do the work on 2nd shift with no additional charge.”
• “They are usually very happy. Our electricians are clean, quick, get in and out. If customer needs us to, we’ll work at night – usually they coordinate the lunch breaks so work can be done then if needed, when folks aren’t at their desks.”
• “I like to say that, and [utility’s] follow-up shows, that customers are extremely satisfied with our work.”
The recycling component of the SBES was relayed by contractors as a subject of concern they have heard from customers (we did not ask customers about this element of their participation). Recycling is an important part of program operations as lamps and ballasts can be considered hazardous waste and must be disposed of properly. Turn-key contractors reported that customers expressed concern about the clean-up after the installation work is complete, as well as with the requirement that ballasts and other lighting must remain on-site until the recycling contractor picks it up:
• “Customers complain all the time that the material is in the way, but they can’t move it or throw it away. Or they panic about having a “hazardous material on site”, and it does take up room, there’s no question about that.”
• “Recycling is provided by a separate contractor, and we coordinate it. Occasionally we get a complaint that the packaging material hasn’t been picked up ‘in time’ in customers’ eyes, fast enough – this happens about 1 of 25 jobs.”
• “Recycling is the biggest thorn in everyone’s side, because it takes so long for the vendor to come get it.”
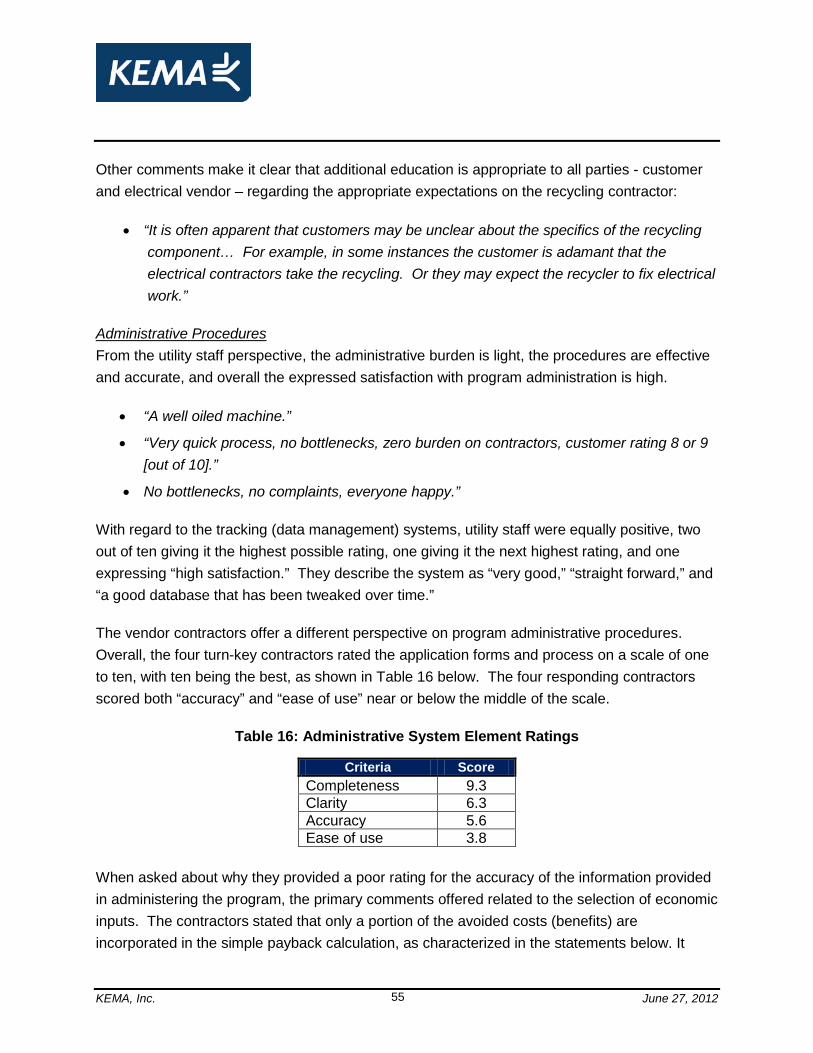
KEMA, Inc. June 27, 2012 55
Other comments make it clear that additional education is appropriate to all parties - customer and electrical vendor – regarding the appropriate expectations on the recycling contractor:
• “It is often apparent that customers may be unclear about the specifics of the recycling component… For example, in some instances the customer is adamant that the electrical contractors take the recycling. Or they may expect the recycler to fix electrical work.”
Administrative Procedures From the utility staff perspective, the administrative burden is light, the procedures are effective and accurate, and overall the expressed satisfaction with program administration is high.
• “A well oiled machine.”
• “Very quick process, no bottlenecks, zero burden on contractors, customer rating 8 or 9 [out of 10].”
• No bottlenecks, no complaints, everyone happy.”
With regard to the tracking (data management) systems, utility staff were equally positive, two out of ten giving it the highest possible rating, one giving it the next highest rating, and one expressing “high satisfaction.” They describe the system as “very good,” “straight forward,” and “a good database that has been tweaked over time.”
The vendor contractors offer a different perspective on program administrative procedures. Overall, the four turn-key contractors rated the application forms and process on a scale of one to ten, with ten being the best, as shown in Table 16 below. The four responding contractors scored both “accuracy” and “ease of use” near or below the middle of the scale.
Table 16: Administrative System Element Ratings
Criteria Score Completeness 9.3 Clarity 6.3 Accuracy 5.6 Ease of use 3.8
When asked about why they provided a poor rating for the accuracy of the information provided in administering the program, the primary comments offered related to the selection of economic inputs. The contractors stated that only a portion of the avoided costs (benefits) are incorporated in the simple payback calculation, as characterized in the statements below. It

KEMA, Inc. June 27, 2012 56
should be noted that this is by design; the sponsors use a tail block rate with the kWh savings to calculate customer savings, which effectively provides a conservative estimate of payback with the intention of over delivering on the expected savings from the customer point of view.
• “Because they can’t add in demand charges, delivery charges, etc… the calculation is technically valid but not representative of the actual customer cost”
• “The dollar-savings are inaccurate… it only looks at cents/kWh savings, not the total of customer [billed] service costs”
The program ease of use ratings provided by contractors, were one, two, three, and nine. Of the three low ratings, only one offered comments on this factor, and these were related to the database system. Although details differ by utility, in general the contractor is responsible for entering customer specific information into a utility-required system and generating the contract paperwork on the customer’s behalf. NHEC varies this process somewhat - the contractor submits a spreadsheet workbook with customer and project specifics, then NHEC generates the contract. Contractors acknowledge that these processes do secure complete information on the customer and project, even while they express concern about the amount of their time required to do so for some systems. In general, the contractors expressed a positive opinion of, and satisfaction with, the system employed by National Grid.
In comparison, the PSNH tracking system was cited by three individual contractors as being difficult to perform data entry in, setting up customers and generally “...cumbersome, and not user-friendly.” As the largest utility in the state, and responsible for the vast majority of projects in the SBES program, the PSNH system has a substantial impact on the contractor’s perception of this program. The general concern expressed by these contractors was that the system is old and takes multiple steps and points of interaction between the contractors and the utility to get a project through the system from the point of entry through closure.
• “For PSNH, we spend time entering everything into their system, it’s slow going, it’s an older system….For a $19,000 project, it took me 2.5 hours.”
• “PSNH’s system is not automated so we can’t do the data entry or any other functions on-line, we have to physically upload and download programs from them, and if it’s done wrong you have to re-enter.. “
In addition to the data entry issues, contractors raised issues of data validation. PSNH uses a unified system for all vendors. According to one contractor, within the system, measure codes

KEMA, Inc. June 27, 2012 57
vary only by a small degree, so typographical errors can be critical, and not caught until the output phase.
• “I could be off by one letter – and then the pricing is incomplete and I have to redo my presentation – this requires a lot of extra QC on our part to go back over every presentation”
The contractors also noted that acquiring customer information from, and getting self-generated leads into, PSNH’s system can cause delays.
• “If a lead comes to me directly, I have to request a project number from PSNH that they have to set up and provide to us, so there’s a delay until they get around to it.”
• “In the PSNH system, requesting files from them is a big time sink – …may take a day to a week
to review and approve it.”
Each program sponsor performs QA/QC to varying degrees on SBES projects. PSNH typically physically inspects all projects that are over $1,000 and makes phone calls to confirm quality of work done on all other projects. National Grid inspects around 25% of their projects while Unitil inspects around 75% and NHEC inspects all projects. We believe each of these levels of inspection are reasonable given the unique circumstances under which each sponsor operates the program.
PSNH had nearly 600 projects in SBES during the period evaluated, making it necessary to rely on phone surveys for part of their QA/QC effort. Given the importance of this program to their portfolio, performing a census of QA/QC contacts is reasonable, albeit a level that is probably not necessary. PSNH also uses these inspections to work with the customer to identify other potential energy efficiency improvement opportunities. NHEC had 13 projects and utilized the program as a key entry point to build relationships with their members so they have decided to take advantage of the opportunity to see members in person as part of their QA/QC work. National Grid had 13 projects and decided to do QA/QC at 25% of their participants in person which seems reasonable to assess overall quality of service since they have one contractor. Unitil performs QA/QC at 75% of their program participants. They used to perform more but they did not identify many significant issues, so they have dialed back the number they do. It is clear that the current levels of site level QA/QC is adequate given the minor number of impact discrepancies observed in the quantity and technology adjustments discussed earlier.

KEMA, Inc. June 27, 2012 58
4.2.3 Program Drivers and Barriers
Below we talk about perceived barriers to the program for both contractor and customer participation.
Contractor Drivers Energy efficiency programs that accurately and comprehensively assess and address the drivers of all stakeholders have the highest probability of success. This section reports on the perceptions of drivers from the surveyed groups.
For the contractors themselves, their decision to participate in the NH program was a business decision made by a senior manager, as either a continuation or expansion of their business focus in energy efficiency and utility program support. The most common reasons given for participating included: a) chance to reach new customers; b) opportunity to close more customer sales supported by more attractive rebates (i.e., the 50-50% offer) than available to competitors; and c) opportunity to expand their role with either an existing or new utility client. Contractors report several benefits they expected from their participation in the NH program. These were given as the reasons for their decisions to bid, and include:
• An “exclusive hunting license” – access to a pool of customers to which they don’t generally have access;
• Increased sales and the revenue that result, although this is not a guaranteed outcome; • Enhanced customer validity, recognition and trust; • “… Being the ”vendor of record” and knowing that the utility will verify this to your
prospects- you have the “[UTILITY] Contractor” badge on – all this gives you an edge..” • Business security; and, • “…a good contract (so) my paycheck won’t bounce”. • Opportunity to broaden business relationships—primarily through the utilities. • “Mostly it’s … a way to make contacts that could lead to future work.” • “… And it’s also a chance to network with the utility PMs, for projects that may not
clearly fit into one bucket may, because they know me, and have a level of comfort with how we handle our work, those may come to me.”
Customer Drivers All contractor respondents agreed that the opportunity to save money is what motivates customers to participate in SBES. A small number are motivated to improve the quality of their old lighting, and a smaller fraction by the chance to do something with environmental benefit.

KEMA, Inc. June 27, 2012 59
Respondents scored the following 7 factors on a scale of one (not at all important) to ten (very important as shown in Table 17 below:
Table 17: Contractor Reported Customer Motivation
Driver
Average Score (n=6)
Initial equipment cost 9 Costs of operation 7.3 Ease of maintenance 7.3 Word of mouth 7.2 Comfort issues 6.8 Ease of installation 5 Life cycle costs 3.3
Although these scores must be prefaced with caution due to the small total number of respondents, the hierarchy of customer concerns and motivations reflects well the vendors’ anecdotal comments. Initial cost is always #1 on the customers’ mind; life cycle costs, even though vendors say they invest time in explaining this concept, continue to remain last on the list of factors that are believed to motivate installation. Ease of installation matters relatively less in a “turn-key” program, as the installation challenge rests primarily in the hands of the vendors. Word of mouth, however, concerning the reputation of either the vendor or the components themselves, can –in the words of one respondent, “make or break the deal”.
Participants, non-participants and program drop outs were all a series of questions to determine the factors that would motivate them to participate in an efficiency program. More than a third of all respondents reported that saving money on-bills was a motivator with improving efficiency to save energy and program incentives reported as distant second and third factors.

KEMA, Inc. June 27, 2012 60
Table 18: Factors That Encourage Participation in an Efficiency Program
Factor % of Responses (Multiple Responses Allowed)
Participants (n=188)
Non-Participants (n=96)
Drop outs (n=23)
Overall (n=307)
To reduce energy bills/save money 35.1% 36.5% 21.7% 34.5% To improve efficiency/save energy 19.1% 14.6% 17.4% 17.6% The program incentive(s) 16.5% 10.4% 8.7% 14.0% To reduce initial purchase costs 9.0% 17.7% 8.7% 11.7% To reduce maintenance costs 9.0% 15.6% 8.7% 11.0% Needed to replace non-working equipment 5.9% 2.1% 13.0% 5.2% Took the advice of professional 1.6% 2.1% 17.4% 2.9% Other 2.1% 0.0% 0.0% 1.3% The technical assistance offered 0.5% 1.0% 4.3% 1.0% Because of past program participation 1.1% 0.0% 0.0% 0.7%
Barriers Below we talk about perceived barriers to the program for both contractor and customer participation.
The majority of the contractors interviewed were clear that their participation in SBES is primarily dependent upon the budget target they are assigned. When their share of the project incentive budget is exhausted, their participation is largely over for that program year. The sponsor’s general approach to allocating budget among contractors is based upon previous performance, satisfaction with services and funding availability. The sponsors exercise an ability to shift money during the year among contractors in an effort to encourage those that are performing particularly well. Among contractors, however, there were concerns voiced that the budgeting process does sometimes prevent their ability to fully engage in the program year around. This general theme is further examined in the quotes provided below.
• “If they gave me a bigger budget, I would definitely use it. There is a budget Cap. I exceeded it in August, and so we are shut off, can’t do any more projects...”
• “There is a project cap associated with … their 2 main programs – they have a gross $ cap for all programs. If they have some funding left over, they can shift it between programs. But now we have expended our portion, and the whole budget is gone as well.”
• ... there are no guarantees until a job is sold, so we’re doing all the audits on spec, and when the utility asks us to, to help a customer even when we all know there is no project
KEMA, Inc. June 27, 2012 61
opportunity -- various companies over the past couple of years may have decided not to rebid, because the ‘juice wasn’t worth the squeeze’.”
Contractors perceive barriers to customer SBES participation and the implementation of projects as awareness, time, and money. The four utility respondents all mentioned the financial cost of participation as a barrier for customers. Overall, however, the consensus of the utility staff appears to be that the program features are sufficient to overcome the customer barriers. The reported history of full subscription of available funds supports this perspective. The interview quotes below further illustrate the perspective of these groups.
• Utility staff - “From feedback we hear from customers, it appears that awareness, time, and money are the three biggest barriers.”
• Utility staff – [The incentive at} “50% might be a little low – lots of money for some customers in this economy.”
• Contractor - “The main barriers are cost, payback and general knowledge of what can be done. They tend to have a ‘If it ain’t broke, don’t fix it’ attitude, which they think is fine if ... ‘hey, my lights are still on’.”
• Contractor - “… most of the time they just don’t know about the program. Even if they are just putting up a new wall with new fixtures, they’d qualify under the “new equipment” program. Their electrician won’t know about the program … (or) about energy efficient options like we do.”
Program participants, program drop outs and non-participants were asked about barriers that businesses like theirs might face to inhibit participation in the program. As Table 19 shows, more than half of the respondents overall affirmed that there were no barriers to participation for business like theirs, which included more than three quarters of drop out respondents. Given the economy and general hardship among small businesses, the idea that time and money were cites as primary barriers is not surprising. In reviewing the barriers outlined in the New Hampshire 2011-2012 Energy Efficiency Plan13, there is only one significant barrier in this table that is not accounted for in the plan. That is the customer reported barrier of not having the time (staff resources) to undertake efficiency installations independently.
13 NH PUC Docket #10-188, January 1, 2011 through December 31, 2012Energy Efficiency Plan, Dated August 2, 2010, P 27.

KEMA, Inc. June 27, 2012 62
Information as a barrier to participation suggests the ongoing importance of having contractors act as program allies in selling and explaining program advantages, processes and services. The themes of increased communication and increased incentives are prevalent in the perspective of all categories of stakeholders. However, all stakeholder input supports the conclusion that these improvements will be on the margin, making a good program even better.
Table 19: Barriers to Participation
Barrier Participants (n=107)
Non-Participants (n=78)
Drop outs (n=40)
Overall (n=225)
No Barriers/Don’t Know 55.1% 35.0% 77.5% 52.1% Cost 21.5% 20.0% 12.5% 19.4% Time / Effort Required 5.6% 11.7% 7.5% 8.0% Not Important Enough 0.0% 15.0% 2.5% 5.6% Information 11.2% 0.0% 0.0% 5.3% Lack of Authority 0.0% 15.0% 0.0% 5.2% Other 2.8% 3.3% 0.0% 2.5% Installer issues 3.7% 0.0% 0.0% 1.8%
In a subsequent question, we asked participants what changes they believed could be implemented to improve the programs’ attractiveness to businesses like theirs. As shown in Table 20, nearly 70% of participants did not have any suggestions to provide; implying that they feel no improvement is needed. Thirteen percent of the respondents suggested improving program outreach and 9% suggested increasing financial incentives.
Table 20: Participant Suggestions to Improve Program Attractiveness
Suggestion National Grid (n=5) NHEC (n=3) PSNH
(n=90) Unitil (n=9) Total (n=107)
None 80.0% 100.0% 68.9% 55.6% 69.2% Improve outreach 20.0% 0.0% 11.1% 33.3% 13.1% Increase financial incentives 0.0% 0.0% 10.0% 11.1% 9.3% Make it easier to understand 0.0% 0.0% 4.4% 0.0% 3.7% Increase convenience 0.0% 0.0% 3.3% 0.0% 2.8% Other 0.0% 0.0% 2.2% 0.0% 1.9%
Program drop outs were asked to rate how much more likely they would be to improve the energy efficiency of their business if offered an efficiency program with the features shown in Table 21 on a scale of 1 (no more likely) to 5 (significantly more likely). Program drop outs

KEMA, Inc. June 27, 2012 63
reported that an energy savings guarantee and rapid payback, product discount, and cash rebate would be the greatest motivators to get them to improve their building’s efficiency. These latter two items are in fact effectively offered as part of the program through the form of incentives.
Table 21: Drop Out Likelihood of Improving Efficiency Based On Different Offerings
Feature Average
Rating (n=21) Savings Guarantee & Rapid Payback 4.5
Product Discount 4.3 Cash Rebate 4.3
"Turn-key Package" 4.0 Low/No Interest Loans 3.8
Contractor-Matching Service 3.7
4.2.4 Program Experience and Satisfaction
Participants were asked an extensive series of questions relating to their experience and perception of the program. This included questions in which they were asked to rate various elements of the program (Figure 13). Each element inquired about rated at four out of five or better, which can be deemed as very favorable ratings.

KEMA, Inc. June 27, 2012 64
Figure 13: Participant Reported Program Experience Satisfaction
0.0
1.0
2.0
3.0
4.0
5.0
Satisfaction with Installation time f rame
Effort required for participation
Time required for participation
Ease of understanding program
Scal
e of
1 (v
ery
diss
atis
fied)
to
5 (v
ery
satis
fied)
Overall (n=103)
Figure 14 combines the results regarding the participant reported duration until measure installation (in weeks) as well as their rated level of satisfaction with the time frame until installation. As might be expected, the longer the duration until measure installation, the poorer the reported level of participant satisfaction. The overall average participant response was that it took 14.1 weeks until installation, which suggests a very good rating of approximately 4.2. This analysis indicates that an installation lag of 16 weeks would begin the period in which participants would become dissatisfied with the duration.

KEMA, Inc. June 27, 2012 65
Figure 14: Installation Time Frame vs. Participant Satisfaction with Time Frame
Figure 15 summarizes participant expressed satisfaction with a range of program features on a one-to-five scale. We consider ratings above four to suggest high levels of satisfaction, which most program elements consistently achieved among the participants asked. Contractors reported in their interviews that customers are very satisfied with their service and the program overall. Some of the comments received by contractors align with the customer reported ratings about the service received, as illustrated below:
• “Customers are usually blown away by LEDs.” • “Customers are always surprised at the amount of savings, even at the proposal stage…
the savings are good.” • “…we get lots of feedback on how great our crews are, on their flexibility, cleaning up
after themselves, etc., overall project experience and professionalism is very high.” • “We don’t get complaints but we do get compliments –… we get a compliment every 1 of
4 jobs.”

KEMA, Inc. June 27, 2012 66
Figure 15: Customer Satisfaction with Program Features
4.4
4.4
4.3
4.3
4.3
4.3
4.2
4.2
4.1
4.1
4.1
3.9
0.0 1.0 2.0 3.0 4.0 5.0
Contractor courtesy and professionalism
Measure performance
Cleanliness of contractor work area
Assessment explained clearly and simply
Contractor knowledge and competence
Timeliness of assesor
Assessment scheduling convenience
Services provided
Application process
Report content and clarity
Rebate levels
Energy savings
Sclae of 1 (very dissatisfied) to 5 (very satisfied)
Table 22 compares the average rating of all of the features presented above to the participant-reported overall satisfaction with the program using the same scale (1-very dissatisfied to 5-very satisfied). Participants provided an average rating of 4.3, which is comparable to the 4.2 average rating they provided for each of the program’s individual features. This is also consistent with the 2003 study, in which participants rated the program a 4.5 on a one to five scale. We also provide the average rating across all elements for each sponsor. All sponsors garnered average ratings better than four, although Unitil received particularly high marks in this regard overall. The high Unitil rating appears to be driven by short project completion times and high levels of satisfaction in the level of effort required of them to participate in the program.
Table 22: Overall Customer Satisfaction Ratings
Sponsor Overall
Customer Satisfaction
Average of All Feature
Responses
National Grid (n=5) 4.0 4.1 NHEC (n=3) 4.3 4.0 PSNH (n=90) 4.3 4.2 Unitil (n=9) 4.8 4.6 Overall (n=107) 4.3 4.2
KEMA, Inc. June 27, 2012 67
Using the same scale, program drop outs were also asked to rate their satisfaction with the interaction they had with the program and provided an average rating of 3.3. Eight program drop outs gave their program interaction a rating of one or two. When asked why they gave this rating, most of the responses were related to a lack of follow-up from program staff. These comments were as follows:
• “No follow up. I didn’t receive information on a timely basis.”
• “It was just because we didn’t receive anything from them.”
• “The fact that it didn’t feel like they took me seriously. It took too long to get back to me.”
• “I spent a lot of time on the phone with you guys and haven’t seen or heard from anyone.”
• “It took awhile. I had to follow up with them, then I never heard from them again. Lack of follow up.”
Utility staff reported a high level of satisfaction with the outcomes of the program. When asked how well it was meeting its objectives on a scale of one to ten where ten is the maximum extent feasible, the staff offered ratings responded “eight or nine,” “nine”, and “ten.” The last respondent did not offer a numerical rating, but stated that the program is successful. The following comments are representative of the overall satisfaction of this stakeholder group:
• “It regularly makes its goals in budget and savings.” • “[The program] consistently meets or exceeds goals” • “Customers are often pleasantly surprised to see that they saved more than we
predicted.”
On the same 10-point satisfaction scale, the contractors interviewed scored themselves at 7.4 and estimated customer satisfaction at 8.2. Computer issues, budget constraints, low project close rate, on top of a limited lead stream have left roughly half of the respondents “on the fence” about their reported level of satisfaction in the program:
• “Given the time I spend on this program and the lack of customer financing, the yield is low, the time I spend in NH isn’t as productive as I’d like. This doesn’t reflect on the program, it’s staffing, etc., it’s just the realities of how it is right now.”
• “It’s a good business line... We have been able to make it profitable for the past 4 years, yet there is some cumbersomeness to it. We could have better ways to overcome customer objections and improve the close rate….My issues are that the current
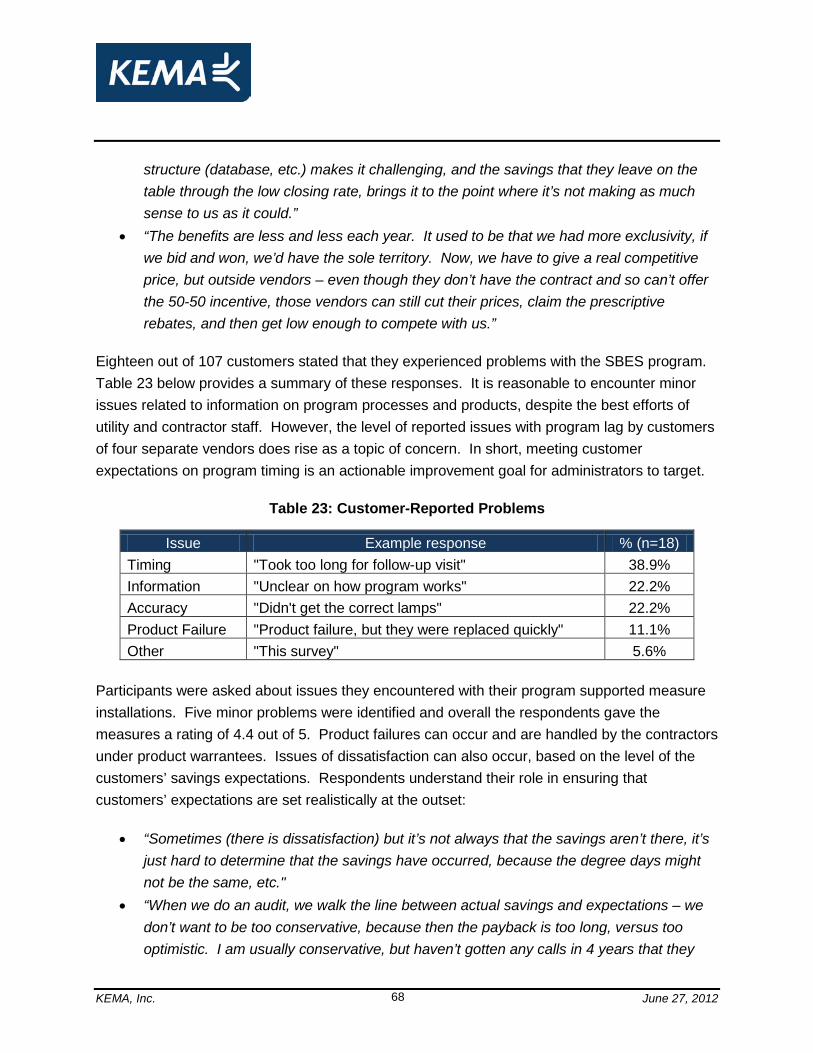
KEMA, Inc. June 27, 2012 68
structure (database, etc.) makes it challenging, and the savings that they leave on the table through the low closing rate, brings it to the point where it’s not making as much sense to us as it could.”
• “The benefits are less and less each year. It used to be that we had more exclusivity, if we bid and won, we’d have the sole territory. Now, we have to give a real competitive price, but outside vendors – even though they don’t have the contract and so can’t offer the 50-50 incentive, those vendors can still cut their prices, claim the prescriptive rebates, and then get low enough to compete with us.”
Eighteen out of 107 customers stated that they experienced problems with the SBES program. Table 23 below provides a summary of these responses. It is reasonable to encounter minor issues related to information on program processes and products, despite the best efforts of utility and contractor staff. However, the level of reported issues with program lag by customers of four separate vendors does rise as a topic of concern. In short, meeting customer expectations on program timing is an actionable improvement goal for administrators to target.
Table 23: Customer-Reported Problems
Issue Example response % (n=18) Timing "Took too long for follow-up visit" 38.9% Information "Unclear on how program works" 22.2% Accuracy "Didn't get the correct lamps" 22.2% Product Failure "Product failure, but they were replaced quickly" 11.1% Other "This survey" 5.6%
Participants were asked about issues they encountered with their program supported measure installations. Five minor problems were identified and overall the respondents gave the measures a rating of 4.4 out of 5. Product failures can occur and are handled by the contractors under product warrantees. Issues of dissatisfaction can also occur, based on the level of the customers’ savings expectations. Respondents understand their role in ensuring that customers’ expectations are set realistically at the outset:
• “Sometimes (there is dissatisfaction) but it’s not always that the savings aren’t there, it’s just hard to determine that the savings have occurred, because the degree days might not be the same, etc."
• “When we do an audit, we walk the line between actual savings and expectations – we don’t want to be too conservative, because then the payback is too long, versus too optimistic. I am usually conservative, but haven’t gotten any calls in 4 years that they

KEMA, Inc. June 27, 2012 69
haven’t met the savings predicted. Generally pleased with all the measures, and they often see a vast improvement in lighting quality as well as energy savings…”
Participants were also asked if the program measures have affected their business operations and profitability in any way. As shown in Table 24, approximately one out of every six customers noted that program participation has had an impact on their operations and nearly four out of ten on their profitability. Participant comments that further elucidates the impact of the program on customer operations includes:
• “It helps with the technicians and their ability to get the job done. It has improved the work performance in the shop.”
• “It has saved us money and made the working environment better for the workers.” • “It allowed more working capital.”
Table 24: Measure Affect of Business Operation and Profitability
Sponsor Yes No Don't Know
Measures affected operations? National Grid (n=5) 0.0% 100.0% 0.0% NHEC (n=3) 33.3% 66.7% 0.0% PSNH (n=90) 16.7% 82.2% 1.1% Unitil (n=9) 22.2% 77.8% 0.0% Overall (n=107) 16.8% 82.2% 0.9%
Measures affected profitability? National Grid (n=5) 20.0% 60.0% 20.0% NHEC (n=3) 33.3% 66.7% 0.0% PSNH (n=90) 36.7% 57.8% 5.6% Unitil (n=9) 66.7% 33.3% 0.0% Overall (n=107) 38.3% 56.1% 5.6%
Participants were asked broadly if from their perspective their participation was worthwhile. Table 25 shows that more than nine of every ten participants reported it was. While there may be select program shortcomings, the overall results of this question suggests the program is a service that is valued and provides benefits that outweigh any difficulties experienced by participants.

KEMA, Inc. June 27, 2012 70
Table 25: Was Program Participation Worthwhile?
Sponsor Yes No Don't Know
National Grid (n=5) 60.0% 20.0% 20.0% NHEC (n=3) 100.0% 0.0% 0.0% PSNH (n=90) 94.4% 3.3% 2.2% Unitil (n=9) 88.9% 0.0% 0.0% Overall (n=107) 92.5% 3.7% 3.7%
Table 26 and Table 27 present the results regarding the likelihood that non-participants and program drop outs would consult the utility to save energy and how credible they believe the utility is as a source for energy efficiency information. Generally, these groups reported being likely to consult the utility on ways to save energy overall (87.1%), with nearly two thirds of program drop outs indicating they are “very likely”. This latter results indicates that despite not fulfilling their initial commitment to participation, program drop outs still view the program and sponsors as institutions they can turn to to help them save energy in the future. Each group also rated the program sponsors favorably as credible sources for energy efficiency information, with a 63.3% overall rating them as at least somewhat credible.
Table 26: Likelihood of Non-Participants and Drop Outs Consulting the Utility
Likelihood Non-Participants
(n=78) Drop outs
(n=39) Overall (n=117)
Very Unlikely 1.3% 0.0% 0.9% Somewhat Unlikely 14.1% 7.7% 12.0% Somewhat Likely 48.7% 30.8% 42.7% Very Likely 35.9% 61.5% 44.4%
Table 27: Credibility of Utility as a Source for Energy Efficiency Information
Credibility Non-Participants
(n=78) Drop outs
(n=39) Overall (n=117)
Very Credible 34.6% 38.5% 35.9% Somewhat Credible 28.2% 25.6% 27.4% Neutral 34.6% 28.2% 32.5% Not Very Credible 1.3% 7.7% 3.4% Not At All Credible 1.3% 0.0% 0.9%

KEMA, Inc. June 27, 2012 71
Finally, the willingness of participants and non-participants to undertake future program-support activities was reported as high (as shown in Table 28), with 85.9% of respondents reporting it as “likely” to some degree.
Table 28: Likelihood of Future Program Participation
Likelihood Participants
(n=107) Non-Participants
(n=78) Overall (n=185)
Very Unlikely 4.7% 6.4% 5.4% Somewhat Unlikely 2.8% 14.1% 7.6% Somewhat Likely 43.0% 59.0% 49.7%
Very Likely 47.7% 20.5% 36.2% Don't Know 1.9% 0.0% 1.1%
4.2.5 Customer Perceived Energy Use and Opportunities
Participants and non-participants were asked two questions regarding their energy use. Table 29 presents the proportion of facility operating costs that each group reported is spent on energy. Overall, energy is estimated to account for approximately 36% of participant operation costs and only 20% of non-participant operation costs. These responses are consistent with the idea that small businesses that perceive themselves to have higher energy costs are more likely to engage in an activity to reduce that cost.
Table 29: Percent of Facility Operational Costs Spent On Energy
Sponsor Participant
Average (n=82) Non-Participant Average (n=64)
National Grid 30.3% 18.6% NHEC 21.7% 21.4% PSNH 35.4% 22.9% Unitil 55.3% 17.4% Overall 35.7% 19.5%
Participants and non-participants were also asked to estimate the allocation of their energy consumption across end uses. Figure 16 below consolidates their responses. Lighting and cooling is estimated to account for almost two-thirds of energy use at participant facilities; and for nearly 55% of the energy used at non-participating facilities. Perceived Lighting consumption in particular seems to be a defining characteristic among the two customer groups
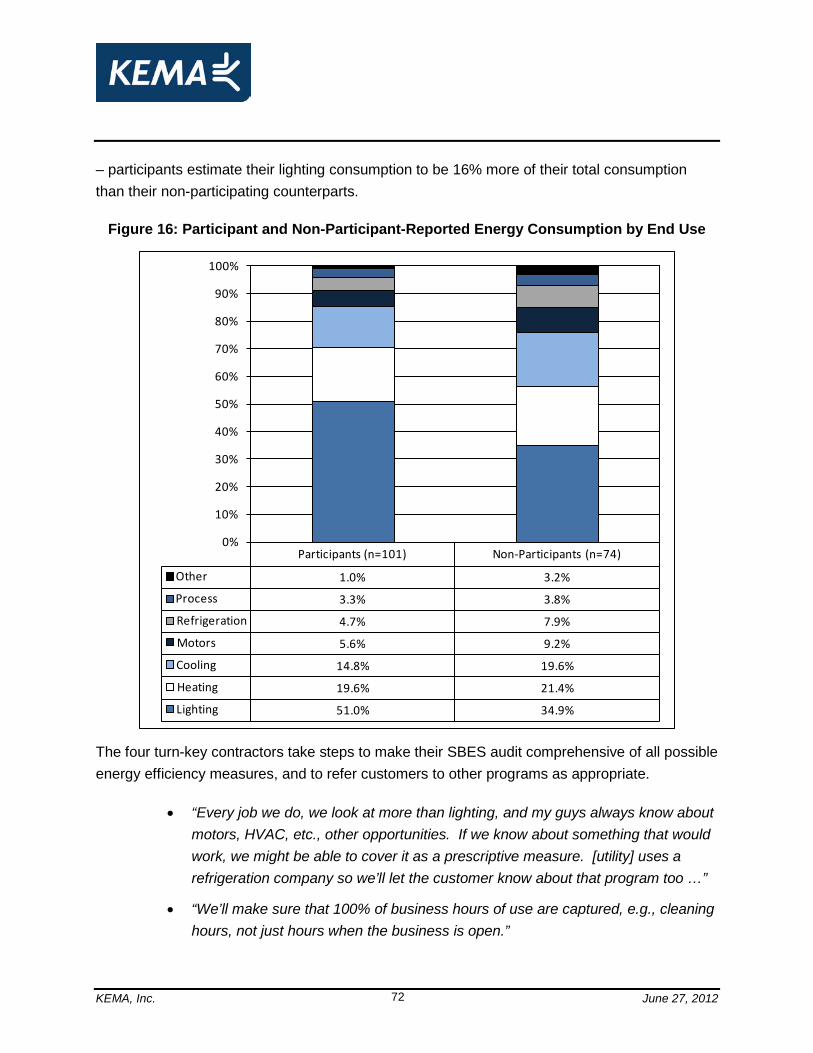
KEMA, Inc. June 27, 2012 72
– participants estimate their lighting consumption to be 16% more of their total consumption than their non-participating counterparts.
Figure 16: Participant and Non-Participant-Reported Energy Consumption by End Use
Participants (n=101) Non-Participants (n=74)
Other 1.0% 3.2%
Process 3.3% 3.8%
Refrigeration 4.7% 7.9%
Motors 5.6% 9.2%
Cooling 14.8% 19.6%
Heating 19.6% 21.4%
Lighting 51.0% 34.9%
0%
10%
20%
30%
40%
50%
60%
70%
80%
90%
100%
The four turn-key contractors take steps to make their SBES audit comprehensive of all possible energy efficiency measures, and to refer customers to other programs as appropriate.
• “Every job we do, we look at more than lighting, and my guys always know about motors, HVAC, etc., other opportunities. If we know about something that would work, we might be able to cover it as a prescriptive measure. [utility] uses a refrigeration company so we’ll let the customer know about that program too …”
• “We’ll make sure that 100% of business hours of use are captured, e.g., cleaning hours, not just hours when the business is open.”

KEMA, Inc. June 27, 2012 73
• “We do a thorough lighting installation and the approved list is inclusive, so there isn’t anything left over.”
• “We’re comprehensive when we go in, we look at every room, even if it’s just documenting what they have- i.e., basements, even unused spaces.”
Participants were asked about efficiency measures that they believe remain as opportunities in their facility and were subsequently asked to categorize their level of interest in installing these identified energy efficiency measures. It is important to note that these are perceived opportunities that might or might not have been examined in the program auditing process. As Figure 17 shows, among the participants surveyed, there remain perceived opportunities; however, the level of interest in moving forward with examining them is minimal. The great majority report that they are interested in waiting at least a year before making any of these upgrades and expressed little interest in pursuing these possible upgrades in the near term.
Figure 17: Participant Level of Interest in Pursuing Upgrades
Programmable Thermostat
(n=58)
Light Fixtures (n=52)
Central/ Rooftop
Heating (n=48)
Central/ Rooftop A/C
(n=40)
Standard Refrigerator
(n=36)
Electric Water Heater (n=33) CFLs (n=31)
Air Compressors
(n=29)
Standard Freezer (n=24)
Room/ Wall A/C (n=23)
Reach-In Refrigerator
(n=19)Other (n=13)
Don't Know 0% 0% 0% 0% 0% 0% 0% 0% 0% 0% 0% 2%
Wait >= 1 Year 39% 40% 31% 22% 29% 28% 24% 23% 18% 16% 17% 5%
Moderate Interest 9% 4% 9% 10% 3% 0% 4% 3% 4% 3% 1% 1%
High Interest 6% 5% 5% 5% 2% 3% 1% 1% 0% 3% 0% 4%
0%
10%
20%
30%
40%
50%
60%
% o
f Par
ticip
ants
With
Opp
ortu
nity
(n=1
07)
Figure 18 shows the same information for perceived efficiency opportunities among non-participants. Those with no interest at all is shown in black. The number of opportunities among all measure categories is much less among this group, with even fewer of them designated with a high interest in pursuing. Respondents reported not having much interest in pursuing the vast majority of perceived opportunities in their facility, although some interest is likely to be encouraged through any future program interactions.

KEMA, Inc. June 27, 2012 74
Figure 18: Non-Participant Level of Interest in Pursuing Upgrades
Participants and non-participants were asked about their preferred method of measure installation. The most common response for each measure is bolded in Table 30 below. Among participants and non-participants, measures that might be considered mission-critical to a customer’s core business – such as refrigeration and air compressors - are designated as preferred install through in house staff or their own contractor. These are likely measures that they are accustomed to having specialists handle for them and might not be comfortable otherwise outsourcing.

KEMA, Inc. June 27, 2012 75
Table 30: Participant and Non-Participant Preferred Method of Measure Installation
Opportunity Group In-House
Own Contractor
Utility Contractor
Don't Know
Participants Lighting-CFLs & Fixtures (n=79) 22.8% 32.9% 44.3% 0.0%
Central HVAC (n=88) 5.6% 47.8% 44.4% 2.2%
Programmable Thermostat (n=58) 27.6% 29.3% 43.1% 0.0% Standard Appliances-Room A/C, Refrigerators, Freezers (n=79) 39.2% 30.4% 30.4% 0.0%
Reach-In Refrigerator (n=17) 11.8% 52.9% 35.3% 0.0%
Air Compressors (n=27) 37.0% 33.3% 29.6% 0.0%
Electric Water Heater (n=31) 38.7% 32.3% 29.0% 0.0%
Other (n=11) 9.1% 45.5% 27.3% 18.2%
All Measures (n=392) 24.2% 36.5% 38.3% 1.0%
Non-Participants Lighting-CFLs & Fixtures (n=27) 74.1% 22.2% 3.7% 0.0%
Central HVAC (n=23) 21.7% 30.4% 47.8% 0.0%
Programmable Thermostat (n=13) 61.5% 30.8% 7.7% 0.0%
Standard Appliances-Room A/C, Refrigerators, Freezers (n=39)
61.5% 20.5% 17.9% 0.0%
Reach-In Refrigerator (n=9) 44.4% 33.3% 22.2% 0.0%
Air Compressors (n=12) 41.7% 25.0% 33.3% 0.0%
Electric Water Heater (n=12) 33.3% 41.7% 25.0% 0.0%
Other (n=5) 40.0% 20.0% 40.0% 0.0%
All Measures (n=140) 51.4% 26.4% 22.1% 0.0%

KEMA, Inc. June 27, 2012 76
5. Conclusions and Recommendations Our conclusions and recommendations rest upon our experience in performing the surveys, interviews, on-sites and working with the associated paperwork during the SBES impact evaluation. We have sought to draw conclusions and recommendations only when we feel there was enough broad evidence to properly base them. As this evaluation was concurrent with ongoing program QA/QC activities, some of these recommendations may be underway or completed before this study's publication.
5.1 Impact Conclusions and Recommendations
It is clear from the impact evaluation activities that the NH SBES Program is generating significant savings for program participants, which we calculate to be around 20-25% of their average consumption as estimated from the non-participant group where consumption was greater than 5,000 kWh/year. The impact study results suggest that over time, the sponsors and their program vendors have become more adept at accurately estimating savings in their tracking systems. The primary impact adjustment factors that contribute to the calculation of energy savings in the SBES Program (technology adjustment, quantity adjustment and operation adjustment) have improved since the last Small Business Program evaluation (2004), and the overall realization rate of the 2010 program year calculated from this study is 100.2%. We calculate the overall savings achieved from the 2010 NH SBES Program is 9,339.3 MWh.
Below we provide four recommendations that are intended to further assist the sponsors in refining estimated savings and to inform the application of the results of this study.
1. Conclusion: Our impact work indicates that the vast majority of energy savings calculated for the program are based upon the list of official wattages available for the calculation of all SBES Program Savings, which helps establish the transferability of overall state level impact results to each utilities tracking system. However, there were a handful of instances in which the standard statewide wattages were not used to calculate tracking savings. For example, in one project it was necessary to reduce a fixture wattage by a watt to match up tracking savings estimates from the file.
Recommendation: This is not a significant issue, however, we do recommend a renewed effort to ensure all contractors and sponsors are using consistent wattage assumptions and that the sponsors facilitate the use of the standard wattages among their program vendors to ensure the same wattages are being used for lighting fixtures
KEMA, Inc. June 27, 2012 77
replaced and installed through the SBES program. Specifically, the sponsors should consider requiring that the vendors provide fixture codes and/or wattages in their documentation when submitting projects so a sample of them can be checked for consistency with the standard program wattages.
2. Conclusion: A documentation error noted at one of the sampled sites was the primary driver of an overall statewide lighting documentation adjustment of -5.3%. The error was due to what appeared to be a simple transcription error between the correctly calculated rebate/savings calculation form and the tracking system (an error in the placement of the decimal point).
Recommendation: We recommend added QA/QC work be undertaken to ensure accurate transfer of estimated savings from the project files into the tracking system. We recommend establishing a system where a formula in the tracking system can provide a sanity check on the input savings. One such system might include dividing the total kW or kWh savings by the quantity of units installed. We believe that a check of this nature would have flagged the per fixture savings at this site as being unusually high and worth exploring for errors. A check of this nature would mitigate the effect of the documentation adjustment in future impact evaluations – which in this case was primarily caused by a single large discrepancy.
If the recommendation above or a similar system is implemented to better catch documentation errors for lighting measures, we recommend that the sponsors use an adjusted realization rate. Specifically, if the sponsors choose to implement a QA/QC effort that will mitigate significant documentation errors, they can remove the documentation penalty from the overall lighting realization rate of 96.9% and use a realization rate of 101.8% (with a precision of ±9.5% at the 90% confidence interval). Conversely, if the sponsors continue to use the same process for documenting tracking savings, we recommend using the overall lighting realization rate of 96.9%.
3. Conclusion: Much of the savings discrepancies observed among non-lighting measures were due to site-specific changes and were not related to an isolated incident nor a specific calculation method that we might recommend be changed or refined in lieu of the application of the calculated realization rate.
Recommendation: For non-lighting measures in the SBES program, we recommend the use of the 120.1% realization rate at the state level.
KEMA, Inc. June 27, 2012 78
4. Conclusion: At the overall program level, evaluation savings appear to be at near unity (100%) to that tracked.
Recommendation: If the sponsors opt to apply a program level realization rate in lieu of individual lighting and non-lighting rates, we recommend the use of 100.2%.
5.2 Process Conclusions and Recommendations
The SBES program is recognized by each of the three categories of stakeholders (utility sponsors, implementing contractors, and utility customers) as providing a valuable service. By most accounts, the program is garnering high degrees of participant satisfaction and is achieving its budgetary and savings goals. Each sponsor attaches importance to the role of the program in helping them establish valuable relationships with customers and as a channel to engage with customers to identify other opportunities and needs that they can help address.
We agree with the assessment that the SBES program is providing an important service and believe that while there are areas for improvement in the program, its current level of functioning and operations is up to the task of continuing its promotion of energy efficiency among small businesses in New Hampshire. The SBES program provides flexibility to the sponsors to utilize contractors in the manner that best suits their needs while operating under the general auspices of program guidelines that are developed and maintained by the consensus of the CORE program members. Below we provide additional conclusions and recommendations that are intended to further refine what we consider to be a well run program. We provide these thoughts in two general categories; activities the program is doing well and should continue and recommendations we believe would improve the program.
Activities the program is doing well and should continue: 1. Conclusion: Customers report that their preferred and most influential source for learning
about efficiency programs is through direct mailings from the utility. Interviewees also reported that some of the marketing materials in use are dated. Recommendation: Continue to use direct mailings and bill inserts as the primary marketing mechanisms to reach small business customers. Both the participants and non-participants identified this method, along with utility representatives and on-line media, as their preferred channel of receiving program offerings and information. This is not intended to displace the responsibilities some contractors have to market the program on behalf of their sponsors, but rather to continue to compliment those

KEMA, Inc. June 27, 2012 79
activities. The benefits of direct mailings include its relatively low cost, ability to target individual customers and specific geographic areas, ability to control the pace of customer intake and ability to convey more program information than most other methods. We also recommend that the sponsors undertake an effort to review and update marketing materials to be sure they reflect proper program messages and tone.
2. Conclusion: Customers have diverse preferences with respect to who they prefer to assist them with perceived energy efficiency opportunities in their facility. While many prefer to use a utility authorized contractor, there are significant numbers of customers who also reported a preference for both in house staff and contractors they have existing relationships with. Recommendation: Continue to ensure the provision of two channels for small business customers to receive incentives – both formally through the program and through prescriptive rebates for customers who prefer to use non-program contractors. The sponsors might consider exploring other means of service delivery that offer customers more choice in their contractor selection.
3. Conclusion: The program continually seeks to review measure opportunities and assess their inclusion on the prescriptive rebate list. However, program contractors indicate that the program does not incorporate all measures that might be appropriate for inclusion; specifically cited was LED lighting technologies.
Recommendation: We believe that LEDs have been more actively supported through the prescriptive rebate channel recently. We recommend that sponsoring utilities continue to aggressively undertake efforts to gather technologies that the contractors believe should be added to the list of eligible measures and increase messaging that makes it clear that any cost-effective measure or package of measures may be eligible for program support by adding them as a custom measure.
4. Conclusion: The absence of measure financing mechanisms was mentioned as a program barrier by three out of eight contractors. The sponsors have on-bill financing available to participants; however, not all sponsors provide that option to all participants. Given the important nature of the availability of funds in the participant decision making process, consideration of the increased availability of on-bill financing to fill out other financing options available to customers (banks, etc.) can be done should the sponsors need to improve participation rates.

KEMA, Inc. June 27, 2012 80
Recommendation: The sponsoring utilities should ensure full awareness among participating contractors of the option of on-bill financing for eligible customers, and consider the possibility of offering on-bill financing to more SBES participants within the context of whatever needs and internal or external and limitations there might be to such an offering.
Recommendations for Program Improvement: 5. Conclusion: The program design allocates the bulk of the project development costs to
contractors. The budget constraints expose the contractors to the risk that a project may be delayed or lost after the customer has agreed to proceed. This is a challenging issue, since one of the alternative approaches, allocating project dollars across the year, entails the risks that budget dollars may not be fully subscribed and that exceptional projects may not be captured.
Recommendation: The current allocation of funds in firm budget amounts to each contractor is the most direct and straightforward, if not the optimal, means of managing the program. If the utility sponsors are committed to this approach, the total annual budget could be allocated on a yearly basis to two categories. The first would be the contractor budget, and would be operated as currently constituted. The second category would be competitively allocated after the contractors have expended their annual allocation and/or are meeting their goals and are in need of added funding to continue to provide the program service. If the allocation to these two categories is negotiated collaboratively with the contractors, it might serve to increase their commitment to the program. The goal of this recommendation is to facilitate certainty among contractors that added funding can be procured in reasonable amounts to ensure project completions of successfully recruited participants.
6. Conclusion: Contractors expressed dissatisfaction with several aspects of the PSNH data system and the processes required by the SBES program, including time consuming data entry, how measure codes are handled, and how customers are set up in the program. This colors their perception overall of the SBES program since PSNH is responsible for the vast majority of potential and actual projects. We suspect that the tracking system in its current structure will remain sufficient at the current level of program activity, however, it would be a limiting factor should the program begin to scale up and is a process that has the potential for improving the speed of project throughput as well as contractor efficiency and satisfaction in their program engagement.

KEMA, Inc. June 27, 2012 81
Recommendation: PSNH can adopt metrics for the coming year of improving responsiveness to contractor information requests, improving or adding data validation routines to the SBES program data entry system, and streamlining the processes required for contractor data entry.
7. Conclusion: The recycling of removed equipment was noted as a significant issue by contractors who further indicated they have observed this being an issue for customers. While many of the comments noted in this report seem to place the onus on the recycling contractor, KEMA’s investigation does not support such a simple conclusion.
Recommendation: To address the concerns raised about recycling, the program could incorporate one or more of the following: a) a structure for improved communication between the various contractors engaged at the customer site with regard to both the scheduling of the recycling and the appropriate procedures for the handling of materials to be recycled including a target time-frame; b) to improve program processes with regard to the handling of the materials prior to pick-up, in terms of packaging and placement; and c), for improved communication with customers with the objectives of making customer responsibilities clear and their expectations realistic.
8. Conclusion: Customers reported average project duration of 14.1 weeks, with some taking much longer. Those customers who reported that the project took too long were served by four separate contractors. According to the data, satisfaction with project duration begins to fall off if it takes longer than 16 weeks. Customers who de-activated from the program also largely reported their disengagement being the result of a lack of timely follow-through, also putting some focus on this important issue.
Recommendation: While there are circumstances where installations are delayed for legitimate reasons that are out of the control of the contractors, we recommend a program improvement goal to establish a system that ensures that the currently experienced duration between when a customer decides to install measures and when the installation actually occurs, is either maintained or ideally shortened. The maximum duration should not exceed 20 weeks with a future goal of having the maximum duration be around 15 weeks.
9. Conclusion: Participating customers reported a moderate or better level of interest in pursuing energy efficiency projects for a substantial number of measures, ranging from a low of 1% for reach-in refrigerators to a high of around 14% for central/roof-top air-conditioning measures and programmable thermostats where available. Non-

KEMA, Inc. June 27, 2012 82
participants expressed interest in pursuing between 1% for reach-in refrigerators, 5% for window/wall AC and 6% for CFLs.
Recommendation: Sponsors can consider targeting specific measures for enhanced marketing, and perhaps enhanced incentives, during each program year. The targeted measures should be selected by balancing the criteria of the potential number of measures, customer level of interest, cost-effectiveness, potential realized savings, and budget constraints. If this approach is taken, a focused marketing campaign should accompany the effort with frequent updates. For example, NHSaves could declare 2012 “The Year of the Small Business Programmable Thermostat”, or target new LED lighting technologies.
10. Conclusion: The program design intentionally shifts the bulk of the implementation burden from utilities to contractors. Utility staff report and the contractors confirm that the contractors benefit from the sales advantage of incentives, the validation provided by affiliation with the sponsors, and to some extent from what one contractor described as “an exclusive hunting license.” However, the narrative offered by the contractors themselves is less positive than that expressed by utility staff. As one contractor put it, “the juice may not be worth the squeeze.”
Recommendation: The utility sponsors could open a structured and collaborative process – a summit - to work with the contractors’ to identify their interests and explore means of increasing the program design features to address them. Topics that can be examined as part of this process include marketing and lead generation activities, tracking system procedures, and increased contractor communication and education.

KEMA, Inc. June 27, 2012 83
Appendix A: Study Logger Specifications
Lighting Loggers All of the data used in the development of the Lighting coincident factor and hours of use came from Dent Instruments Time Of Use (TOU) Lighting Loggers. These loggers use a photocell and an internal time lock to measure when the lights go on and off. The logger software exports interval data in a text format that provides the percent “on time” during each interval in the metering period. These interval data files were used to develop both the annual hour of use and coincidence factors presented in this study.
Section 10.2 of the ISO-NE M&V manual specifies that measurement tools must be synchronized in time within an accuracy of ±2 minutes per month with the National Institute of Standards and Technology (“NIST”) clock. The Dent TOU Lighting Logger contains a solid state circuit that exceeds the ±2 minutes per month standard for time drift. KEMA standard operating procedure for all lighting projects is to synchronize all lighting loggers at the start of a lighting project to a desk top computer clock that is linked to our network server and maintained in synch with the NIST clock. This procedure also allows us to confirm that the logger is communicating properly and providing data output. There are some issues that can occur in the spring and fall when clocks are adjusted to and from daylight savings time, but this did not occur in the monitoring for this study.
Periodically we also check the battery voltage of the loggers to make sure that the voltage is sufficient to power the unit. In these cases, the loggers are equipped with a 3.0 Volt battery that typically provides 3.2 Volts, but the loggers will continue to function properly until the voltage drops below 2.6 Volts. KEMA replaces all batteries when the voltage is below 3.0 Volts, which usually occurs after the loggers have been in use for three years or more. Records of battery testing and maintenance are maintained on the network drive of the KEMA server, which is backed up on a daily basis. Figure 19 shows a KEMA technician testing the lighting logger battery voltage and soldering a new battery into an older logger. Note that for this study, all loggers were new from the manufacturer and were therefore assumed to have adequate battery voltage.

KEMA, Inc. June 27, 2012 84
Figure 19: Testing and Replacement of Lighting Logger Battery
There are essentially two sources of measurement error that are germane to the use of Lighting Loggers, the first related to the clock and the second related to the calibration of the photocell sensor so that the logger only records the operation of the lighting and not daylight. The placement and calibration of loggers to insure that they only monitor the operation of the subject lighting fixture is typically very easy for Commercial and Industrial lighting because the fixtures are typically fluorescent 2’x4’ troffer style fixtures that are located in a drop ceiling. When ambient light is a concern fiber optic wands are used, which fit over the photocell of the lighting logger and can be directed at the intended light source. The loggers are also equipped with a sensitivity screw that can be calibrated in the field so that the logger only registers an “on” reading when the lights are actually on. The pictures below provides photos of typical lighting logger installations as well as the calibration procedure.
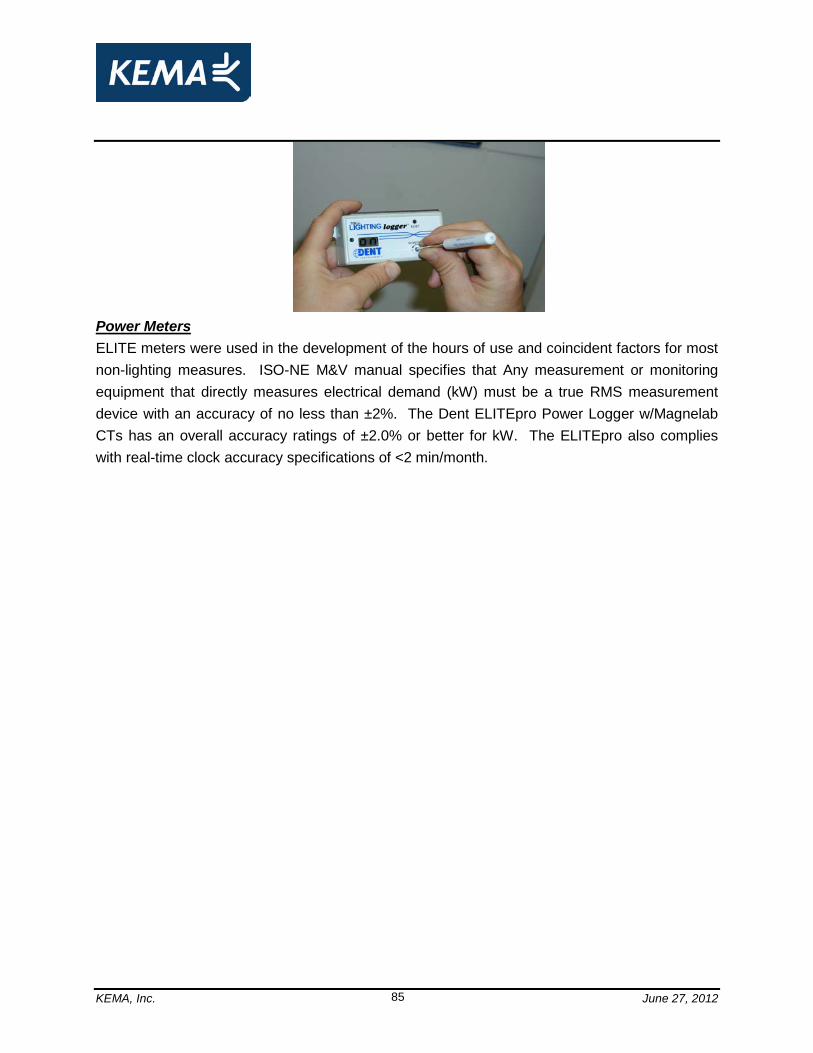
KEMA, Inc. June 27, 2012 85
Power Meters ELITE meters were used in the development of the hours of use and coincident factors for most non-lighting measures. ISO-NE M&V manual specifies that Any measurement or monitoring equipment that directly measures electrical demand (kW) must be a true RMS measurement device with an accuracy of no less than ±2%. The Dent ELITEpro Power Logger w/Magnelab CTs has an overall accuracy ratings of ±2.0% or better for kW. The ELITEpro also complies with real-time clock accuracy specifications of <2 min/month.

KEMA, Inc. June 27, 2012 86
Appendix B: Site Level Lighting Information from Sample
KEMA ID Strata Business Type Assumed Full Load Equivalent Hours
On-site Full Load Equivalent Hours
KEMA-1201 1 MISCELLANEOUS 517 1,465 KEMA-924 1 BANKS, FINANCIAL CENTERS 4,040 3,904 KEMA-807 1 MEDICAL OFFICE 3,032 1,923 KEMA-1074 1 AUTO RELATED 3,120 1,215 KEMA-34 1 MISCELLANEOUS 3,589 8,761 KEMA-169 1 OFFICE 4,783 3,427 KEMA-1149 1 MISCELLANEOUS 2,244 2,213 KEMA-1133 2 BANKS, FINANCIAL CENTERS 3,252 3,915 KEMA-944 2 AUTO RELATED 3,020 1,568 KEMA-1039 2 MISCELLANEOUS 4,244 4,907 KEMA-1227 2 INDUSTRIAL 3,120 2,281 KEMA-992 2 RETAIL 3,640 3,206 KEMA-885 2 BANKS, FINANCIAL CENTERS 3,900 2,708 KEMA-827 2 RETAIL 3,321 3,114 KEMA-875 2 RETAIL 3,744 5,361 KEMA-910 3 RETAIL 4,031 4,062 KEMA-1164 3 RETAIL 1,873 3,057 KEMA-1137 3 WAREHOUSE 2,600 3,058 KEMA-1130 3 BANKS, FINANCIAL CENTERS 3,547 3,479 KEMA-117 3 RETAIL 3,723 5,161 KEMA-1248 3 RETAIL 3,120 2,570 KEMA-115 3 LIGHT MANUFACTURERS 2,557 2,428 KEMA-1009 3 AUTO RELATED 3,007 1,789 KEMA-1129 3 FOOD STORES 4,700 4,498 KEMA-1185L 4 SCHOOLS (K-12) 2,600 2,518 KEMA-1217 4 RETAIL 3,536 3,651 KEMA-864 4 MISCELLANEOUS 3,125 982 KEMA-1162 4 SMALL SERVICES 4,315 4,561 KEMA-894 4 SMALL SERVICES 2,789 7,351 KEMA-877 4 RETAIL 4,680 6,529 KEMA-1262L 4 RETAIL 5,109 5,917 KEMA-824 5 MISCELLANEOUS 8,621 8,699 KEMA-188 5 SCHOOLS (K-12) 1,758 1,974 KEMA-834 5 RETAIL 4,368 4,926 KEMA-911 5 LIGHT MANUFACTURERS 2,600 2,854 KEMA-830 5 MISCELLANEOUS 5,275 5,419 KEMA-1228 5 NURSING HOMES 2,720 2,970

KEMA, Inc. June 27, 2012 87
Appendix C: Survey and Interview Instruments