KELP FOREST FOOD WEBS IN GWAII HAANAS - SFU
40
KELP FOREST FOOD WEBS IN GWAII HAANAS: Ecosystem-Level Effects of Predator Depleon and Recovery 2009 Field Report Coastal Marine Ecology & Conservaon Lab School of Resource and Environmental Management Faculty of Environment | Simon Fraser University Principal Invesgator: Dr. Anne Salomon, SFU REM Co-Invesgators: Lynn Lee, SFU REM PhD Student Rowan Trebilco, SFU Biology PhD Student Dr. Norm Sloan, Gwaii Haanas Naonal Park Reserve & Haida Heritage Site Dr. Hannah Stewart, Fisheries and Oceans Canada Report Submied to: Guujaaw, President, Council of the Haida Naon Robert Davis & Shawn Cowpar, Co-chairs, Haida FIsheries Commiee Russ Jones, Technical Director, Haida FIsheries Program Dr. Norm Sloan, Gwaii Haanas Naonal Park Reserve & Haida Heritage Site Dr. Carita Bergman, Gwaii Haanas Naonal Park Reserve & Haida Heritage Site Nick Irving, Parks Canada Report Dated: 12 April 2010
Transcript of KELP FOREST FOOD WEBS IN GWAII HAANAS - SFU
KELP FOREST FOOD WEBS IN GWAII HAANAS:
Ecosystem-Level Effects of Predator Depletion and Recovery
2009 Field ReportCoastal Marine Ecology & Conservation Lab
School of Resource and Environmental ManagementFaculty of Environment | Simon Fraser University
Principal Investigator: Dr. Anne Salomon, SFU REM
Co-Investigators: Lynn Lee, SFU REM PhD Student Rowan Trebilco, SFU Biology PhD Student Dr. Norm Sloan, Gwaii Haanas National Park Reserve & Haida Heritage Site Dr. Hannah Stewart, Fisheries and Oceans Canada
Report Submitted to: Guujaaw, President, Council of the Haida Nation Robert Davis & Shawn Cowpar, Co-chairs, Haida FIsheries Committee Russ Jones, Technical Director, Haida FIsheries Program Dr. Norm Sloan, Gwaii Haanas National Park Reserve & Haida Heritage Site Dr. Carita Bergman, Gwaii Haanas National Park Reserve & Haida Heritage Site Nick Irving, Parks Canada
Report Dated: 12 April 2010
2
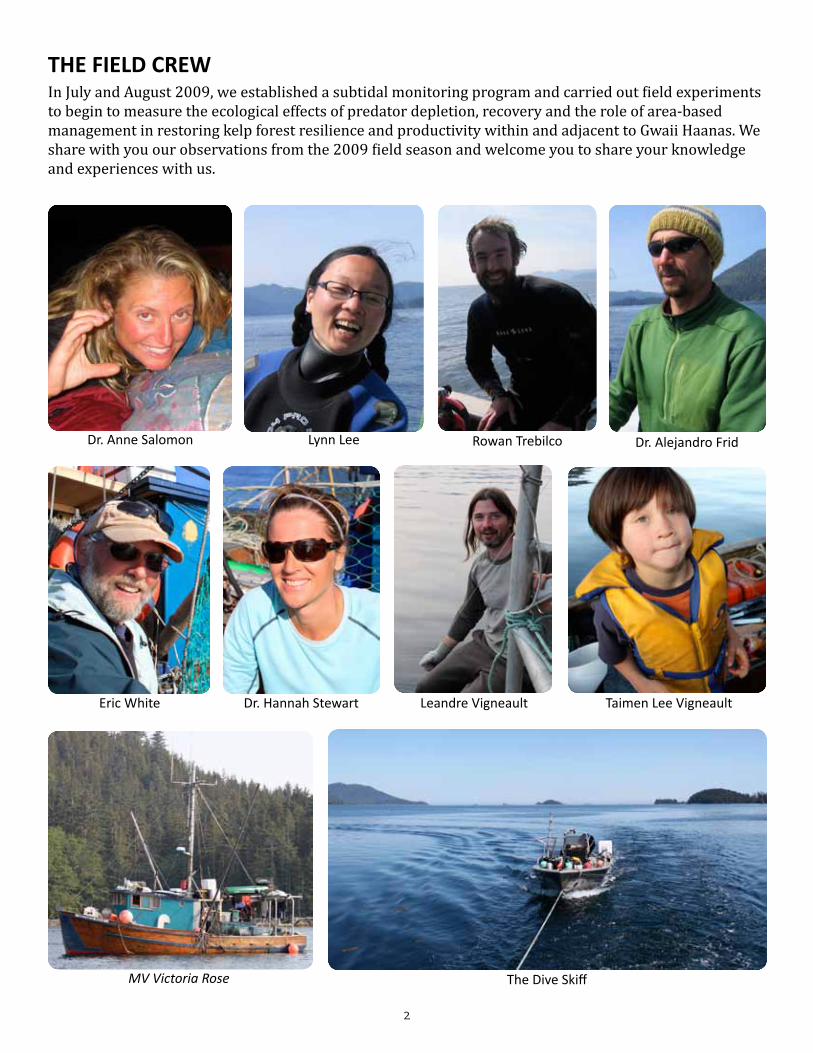
In July and August 2009, we established a subtidal monitoring program and carried out field experiments to begin to measure the ecological effects of predator depletion, recovery and the role of area-based management in restoring kelp forest resilience and productivity within and adjacent to Gwaii Haanas. We share with you our observations from the 2009 field season and welcome you to share your knowledge and experiences with us.
THE FIELD CREW
Dr. Anne Salomon Lynn Lee Rowan Trebilco Dr. Alejandro Frid
Eric White Dr. Hannah Stewart Leandre Vigneault Taimen Lee Vigneault
MV Victoria Rose The Dive Skiff
3
Photographs: Anne Salomon Rowan Trebilco Lynn Lee
TABLE OF CONTENTS
Acknowledgements | 4
Financial Support | 4
Introduction | 5
Overarching Research Goal | 5
Specific Project Objectives | 5
Study Sites | 6
Summary of Research & Preliminary Results | 7
Benthic Invertebrate Communities in Kelp Forests | 7
Field Methods
Statistical Analyses
Results
Fish Communities in Kelp Forests | 19
Field Methods
Statistical Analyses
Results
Primary Producers in Kelp Forests | 25
Field Methods
Statistical Analyses
Results
Predation & Grazing Rates in Kelp Forests | 28
Field Methods
Statistical Analyses
Results
Predation Rates on Red Sea Urchins
Grazing Rates on Kelp
Assimilation of Kelp-derived Organic Carbon in Kelp Forest Food Webs | 33
Intertidal Monitoring: Variation in Cross-system Trophic Cascades | 34
Literature Cited | 34
List of Appendices | 35
Appendix A. Health, Safety & Permits | 35
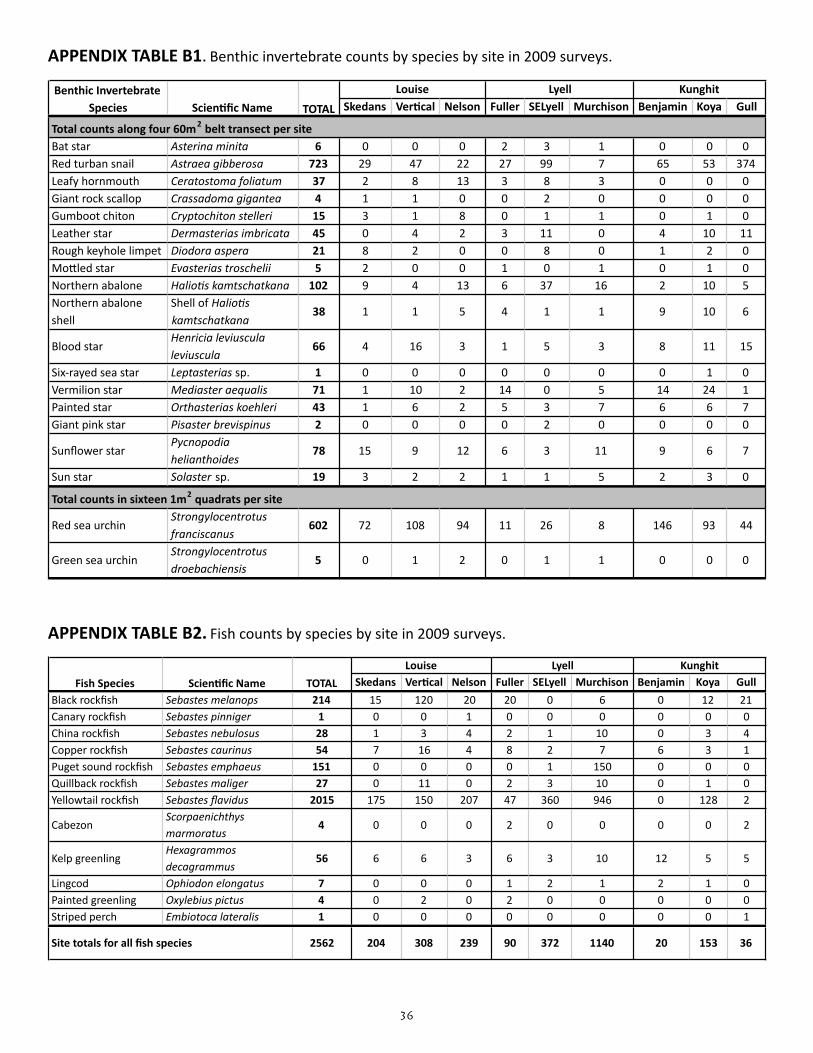
Appendix Table B1 & B2. Benthic Invertebrate & Fish Counts | 36
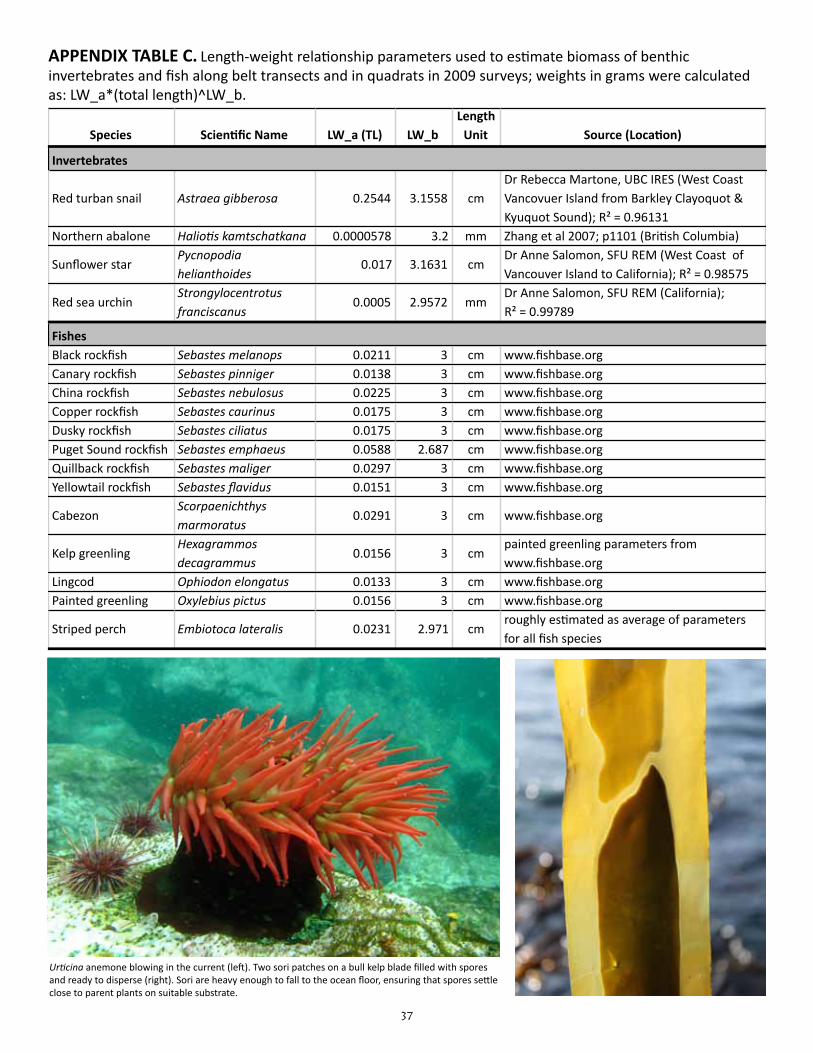
Appendix Table C. Length-weight Relationship Parameters | 37
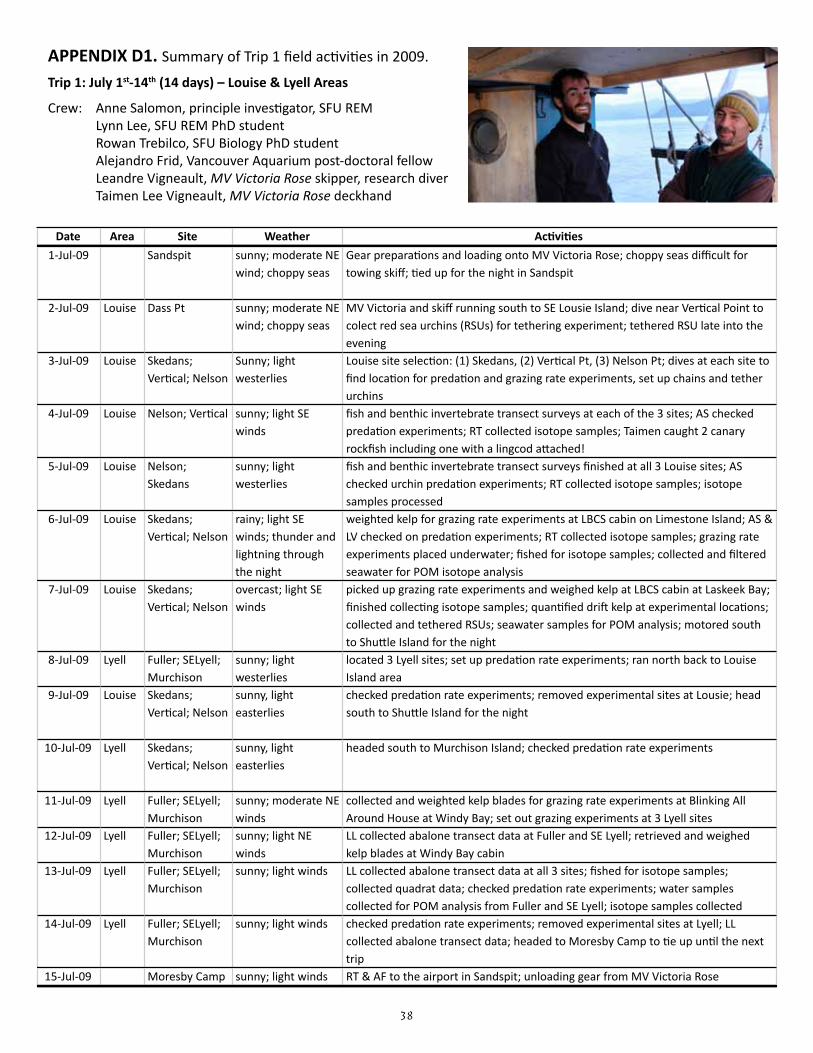
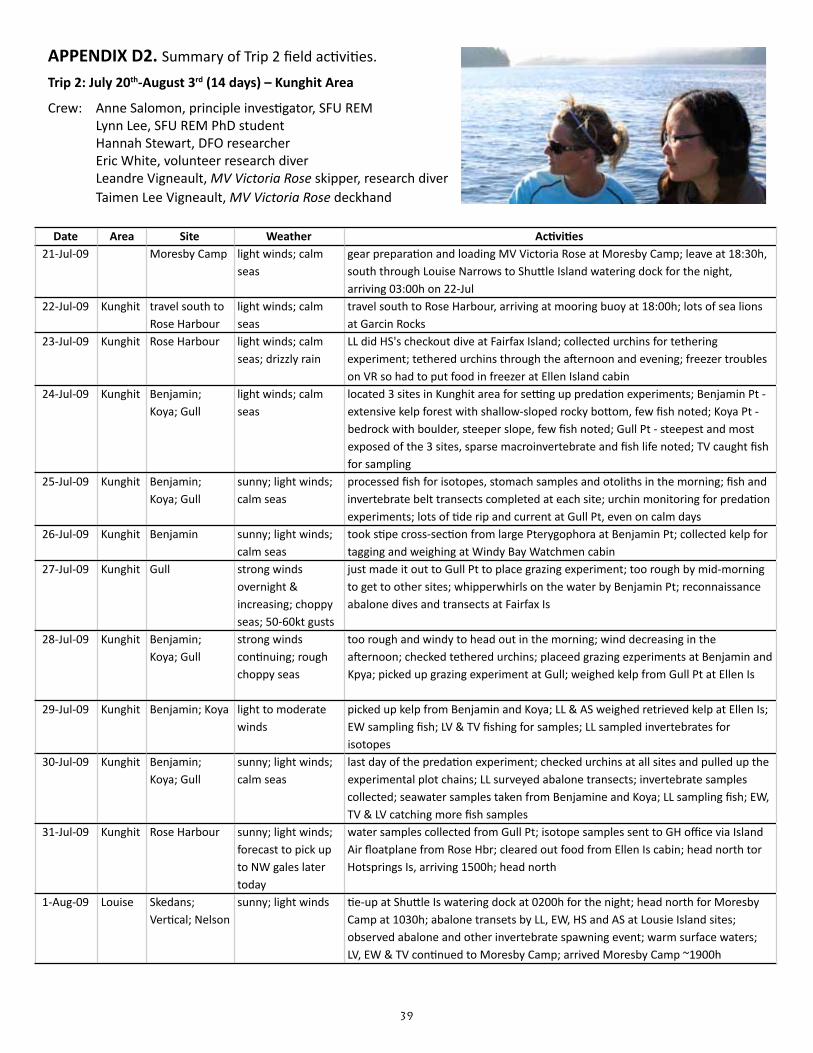
Appendix D1 & D2. Summary of Field Activities | 38
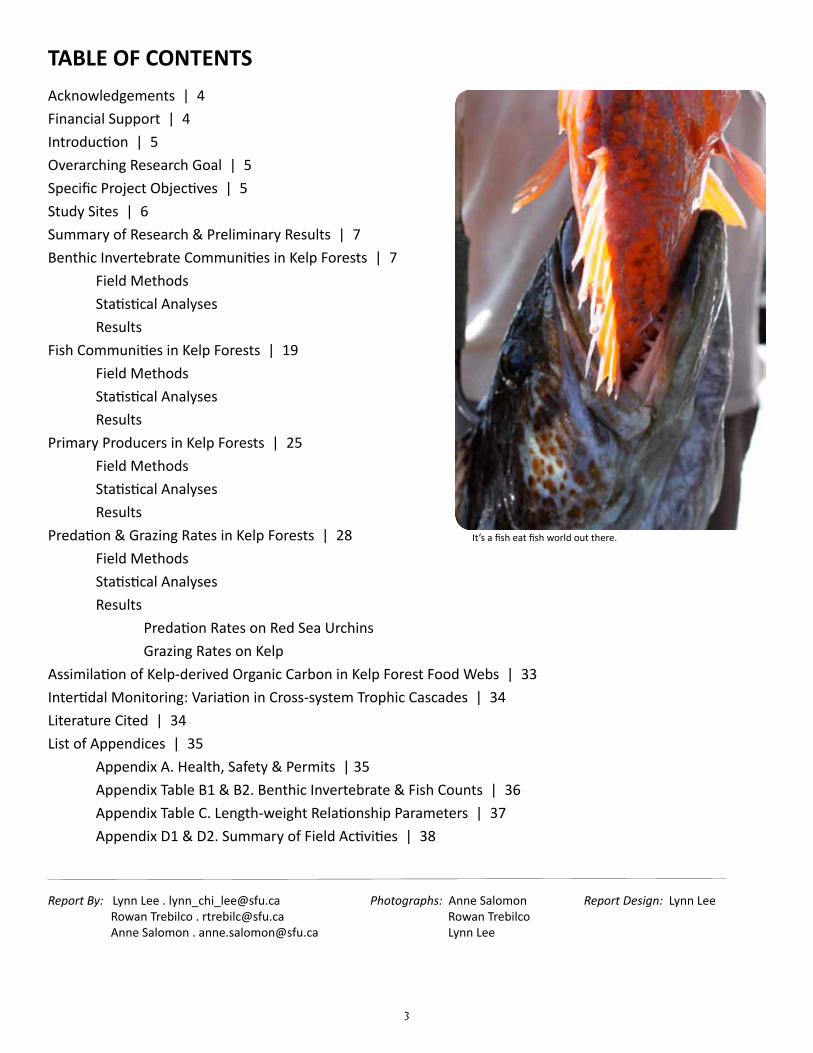
It’s a fish eat fish world out there.
Report By: Lynn Lee . [email protected] Rowan Trebilco . [email protected] Anne Salomon . [email protected]
Report Design: Lynn Lee
4
ACKNOWLEDGEMENTS
Particular thanks are extended to Gladys and Al Vandal, the Haida Gwaii Watchmen at Windy Bay, Christine Pansino and Jake Pattison with the Laskeek Bay Conservation Society, and Gwaii Haanas National Park Reserve and Haida Heritage Site, for use of their cabins to facilitate the weighing of kelp blades for the grazing rate experiments.
Special thanks to Rowan Trebilco, Alejandro Frid, Eric White and Taimen Lee Vigneault for volunteering their time and enthusiasm to the field research.
Haaw’a | How.aa to the Council of Haida Nation Haida Fisheries Committee for permission to conduct this research in Haida traditional territory and to the Haida Gwaii Abalone Stewards for their support.
FINANCIAL SUPPORT
Thanks to Parks Canada for their forthcoming contribution of $10,000 towards fuel and a research assistantship for Lynn Lee for the 2009 field season. Anne Salomon’s Coastal Marine Ecology & Conservation (CMEC) Lab funded $25,000, and in-kind contributions from the CMEC Lab, Fisheries and Oceans Canada and MTE Inc funded the remainder of the project, valued at an in-kind total of $43,000.
Going to see the famous giant spruce tree at Windy Bay with Haida Gwaii Watchman Al Vandal.
Council of the Haida Nation
Haida Gwaii Abalone Stewards
Gwaii Haanas National Park Reserve and Haida
Heritage Site
Fisheries and Oceans Canada
SFU School of Resource and Environmental
Management
5
INTRODUCTION Mounting evidence suggests that the depletion of predators can trigger a cascade of indirect effects throughout marine food webs, altering marine ecosystems and the social and economic systems that depend on them. Along the northeastern Pacific coast, from Alaska to California, the extirpation of sea otters (Enhydra lutris) has modified the structure, function and productivity of nearshore marine eco-systems (2-5). At the same time, recreation and commercial overfishing has lead to the depletion of reef predators such as lingcod (Ophiodon elongatus) (6, 7), and culturally valuable species such as northern abalone (Haliotis kamtschatkana) (8-10) across much of their range. These anthropogenic alterations to coastal food webs can drive profound changes in the biodiversity, resilience and productivity of marine ecosystems. Fortunately, ecosystem-based management tools such as marine reserves and zoning policies are increasingly being implemented with the goal of restoring marine ecosystem function. The proposed Gwaii Haanas National Marine Conservation Area Reserve and Haida Heritage Site and current Rockfish Conservation Areas represent an unprecedented opportunity to study the direct and indirect effects of predator depletion and recovery at ecologically relevant scales.
OVERARCHING RESEARCH GOALThe broad goal of this research program is to begin to assess the ecosystem-level effects of predator depletion and recovery on important fisheries (e.g., rockfish, red sea urchin), species-at-risk (e.g., quill-back rockfish, northern abalone), and ecological processes (e.g., predation and grazing rates) thought to drive kelp forest ecosystem dynamics, and the role of area-based management in restoring ecosystem resilience.
SPECIFIC PROJECT OBJECTIVESUsing the large-scale experimental framework provided by the proposed Gwaii Haanas National Marine Conservation Area Reserve (NMCAR) and Haida Heritage Site zoning policies and current Rockfish Conservation Areas (RCAs), this multi-year project will address three objectives:1. Assess the ecological effects of predator
depletion and the role of area-based manage-ment (e.g., marine zoning, RCAs) on impor-tant fisheries (e.g., rockfish, red sea urchin) and species-at-risk (e.g., quillback rockfish, northern abalone) with a strategic subtidal monitoring program.
2. Quantify how ecosystem processes (i.e., predation rates and grazing rates) vary as a function of predator and prey densities with targeted field experiments and assess if spa-tial protection alters these rates through time.
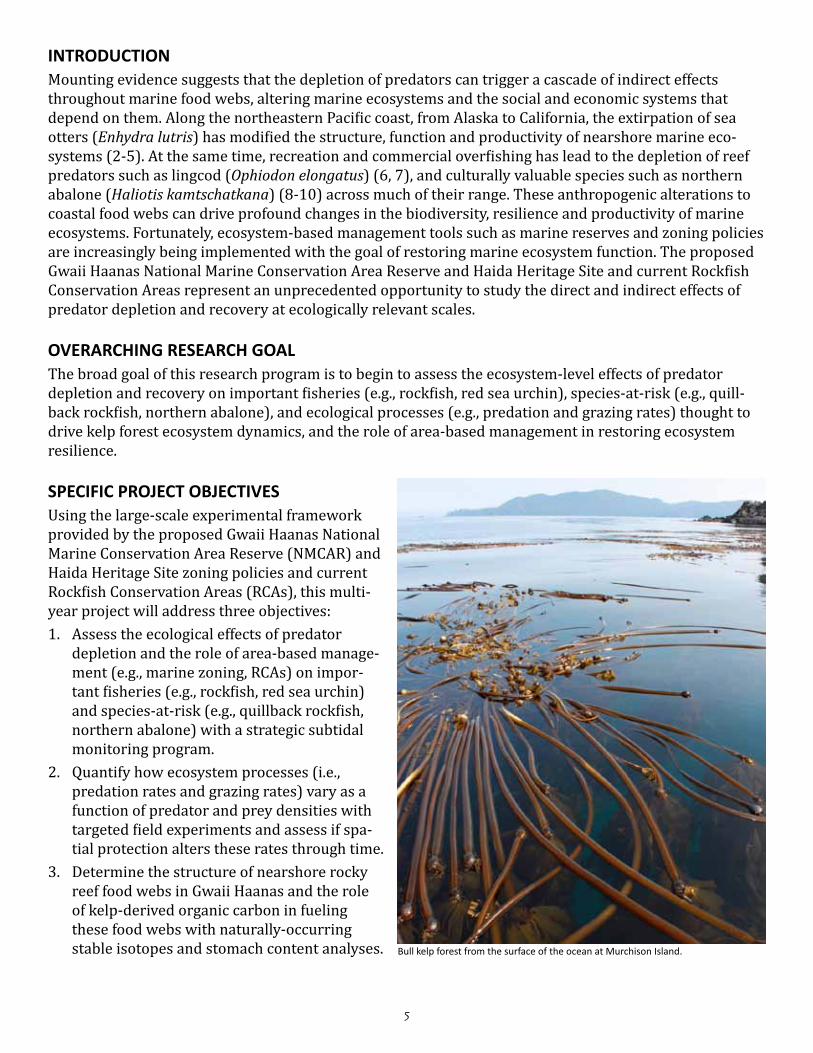
3. Determine the structure of nearshore rocky reef food webs in Gwaii Haanas and the role of kelp-derived organic carbon in fueling these food webs with naturally-occurring stable isotopes and stomach content analyses. Bull kelp forest from the surface of the ocean at Murchison Island.
6
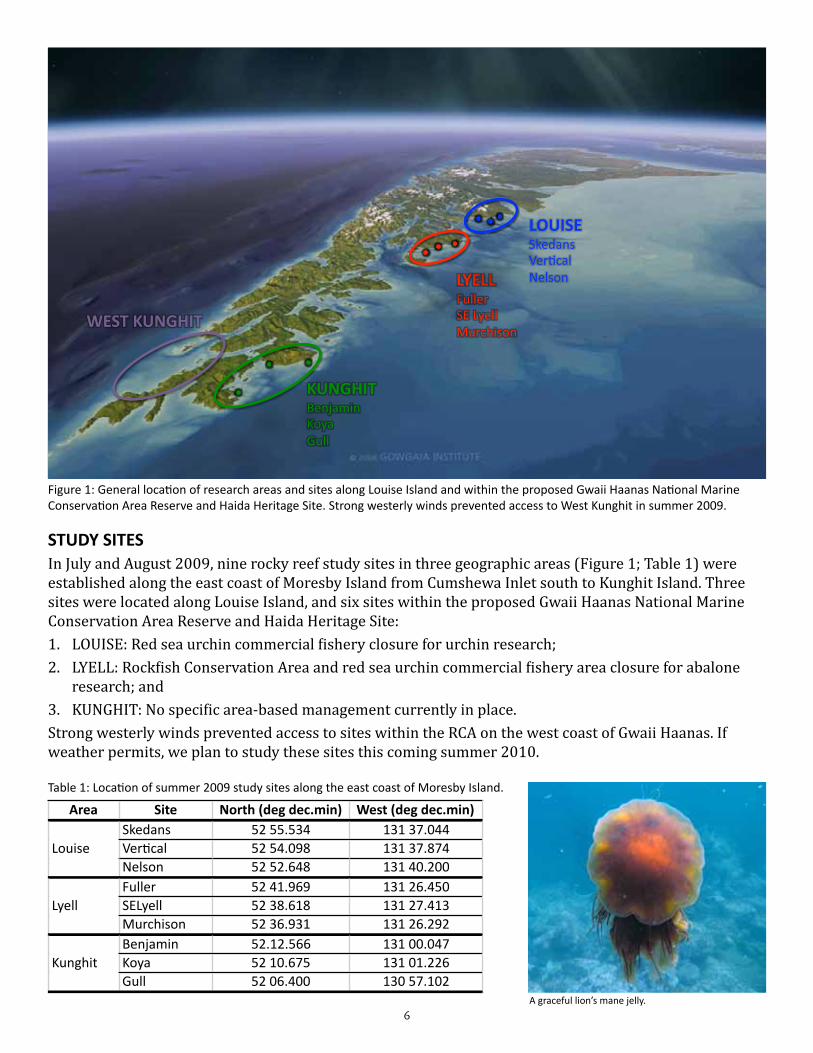
STUDY SITESIn July and August 2009, nine rocky reef study sites in three geographic areas (Figure 1; Table 1) were established along the east coast of Moresby Island from Cumshewa Inlet south to Kunghit Island. Three sites were located along Louise Island, and six sites within the proposed Gwaii Haanas National Marine Conservation Area Reserve and Haida Heritage Site:1. LOUISE: Red sea urchin commercial fishery closure for urchin research;2. LYELL: Rockfish Conservation Area and red sea urchin commercial fishery area closure for abalone
research; and3. KUNGHIT: No specific area-based management currently in place.Strong westerly winds prevented access to sites within the RCA on the west coast of Gwaii Haanas. If weather permits, we plan to study these sites this coming summer 2010.
Figure 1: General location of research areas and sites along Louise Island and within the proposed Gwaii Haanas National Marine Conservation Area Reserve and Haida Heritage Site. Strong westerly winds prevented access to West Kunghit in summer 2009.
Table 1: Location of summer 2009 study sites along the east coast of Moresby Island.
A graceful lion’s mane jelly.
Area Site North (deg dec.min) West (deg dec.min)Skedans 52 55.534 131 37.044Ver3cal 52 54.098 131 37.874Nelson 52 52.648 131 40.200Fuller 52 41.969 131 26.450SELyell 52 38.618 131 27.413Murchison 52 36.931 131 26.292Benjamin 52.12.566 131 00.047Koya 52 10.675 131 01.226Gull 52 06.400 130 57.102
Louise
Lyell
Kunghit
7
SUMMARY OF RESEARCH & PRELIMINARY RESULTS
Benthic Invertebrate Communities in Kelp Forests
Field Methods
At each site, four replicate 30m x 2m belt transects were surveyed on rocky reef habitat at 2 depth ranges (shallow: 5-8m & deep: 10-13m). Shallower transects were generally within kelp forest habitat, and deeper transects were generally just outside the extent of kelp. Selected key macroinvertebrates within the belt transects were counted and measured to the nearest centimetre or half-centimetre. Sea urchin species were counted and measured separately in sixteen 1m2 quadrats within experimental plots for the predation and grazing rate experiments at each site.
Statistical Analyses
To test for differences in density and biomass of benthic invertebrates among sites and areas, we used a generalized linear mixed effects model (GLMM) where the factor AREA (Louise, Lyell, Kunghit) was treat-ed as a fixed effect while the factor SITE was treated as a random effect nested within AREA. Response variables were fit using restricted residual maximum likelihood (REML) and a log-normal likelihood; data will be tested for effects of different transformations in future analyses. Differences in species-specific size frequency distributions among areas were compared visually for selected species (northern abalone, red turban snail, red sea urchin, and sunflower star); future analyses will test for statistical differences.
Results
Does the density and biomass of benthic invertebrate consumers vary among sites?
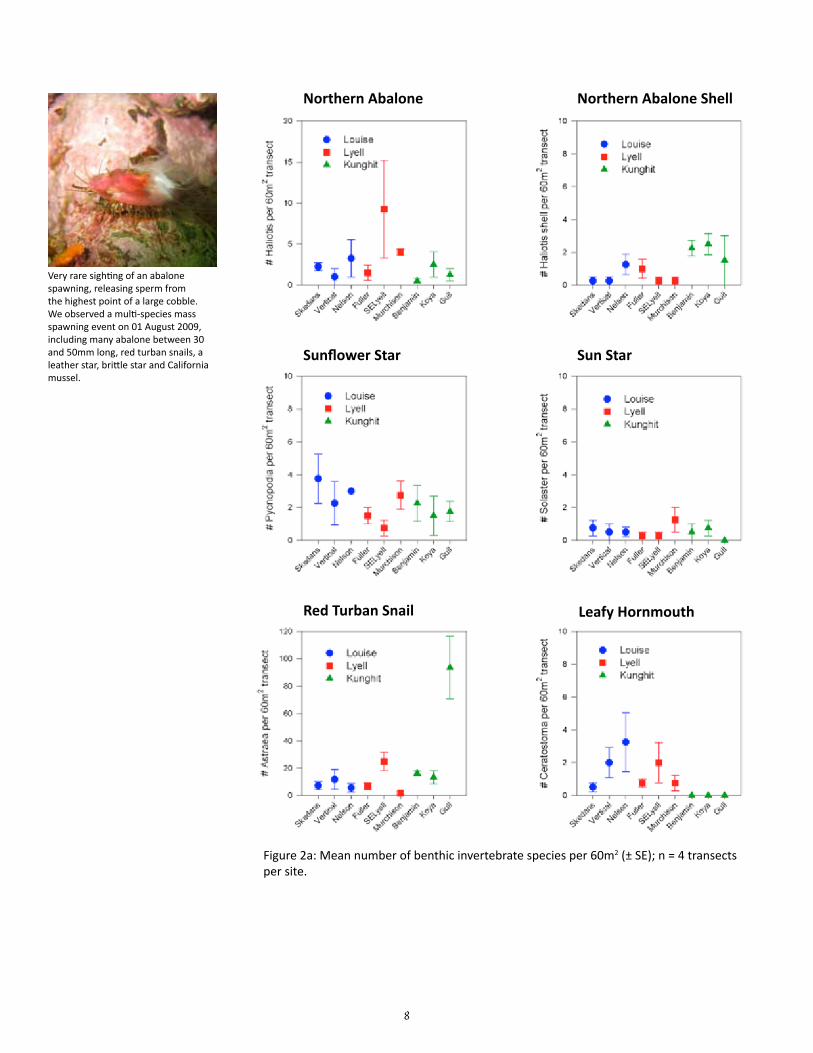
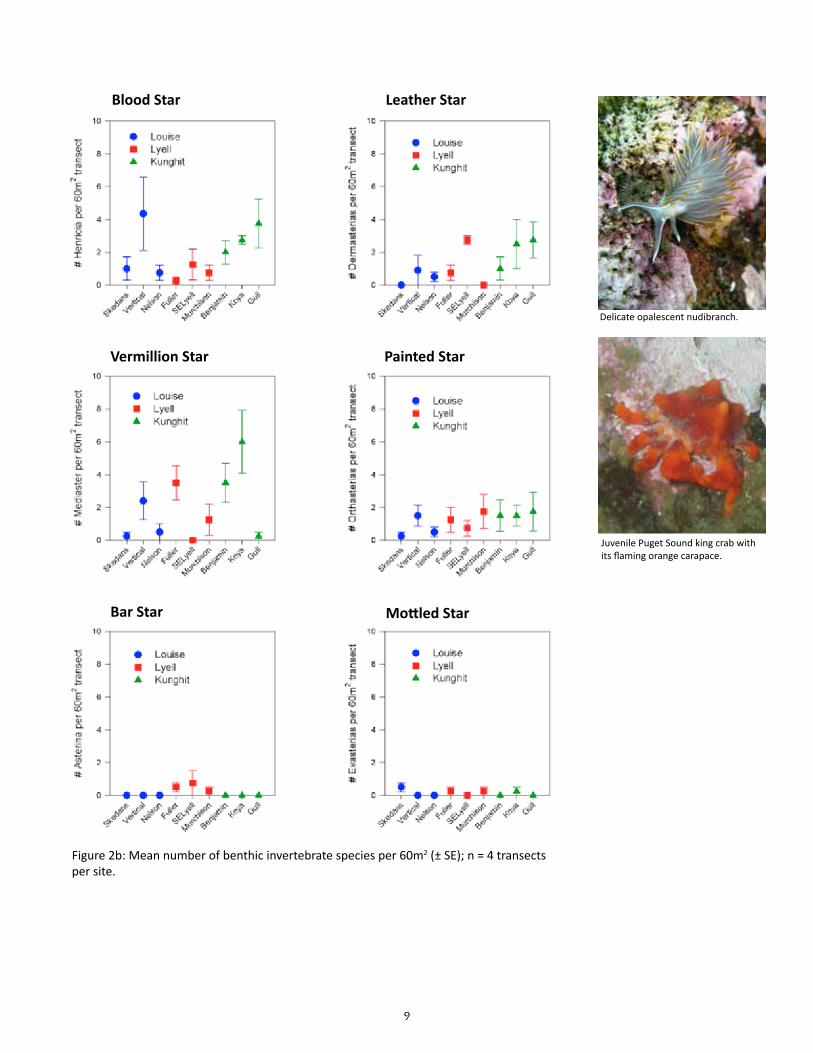
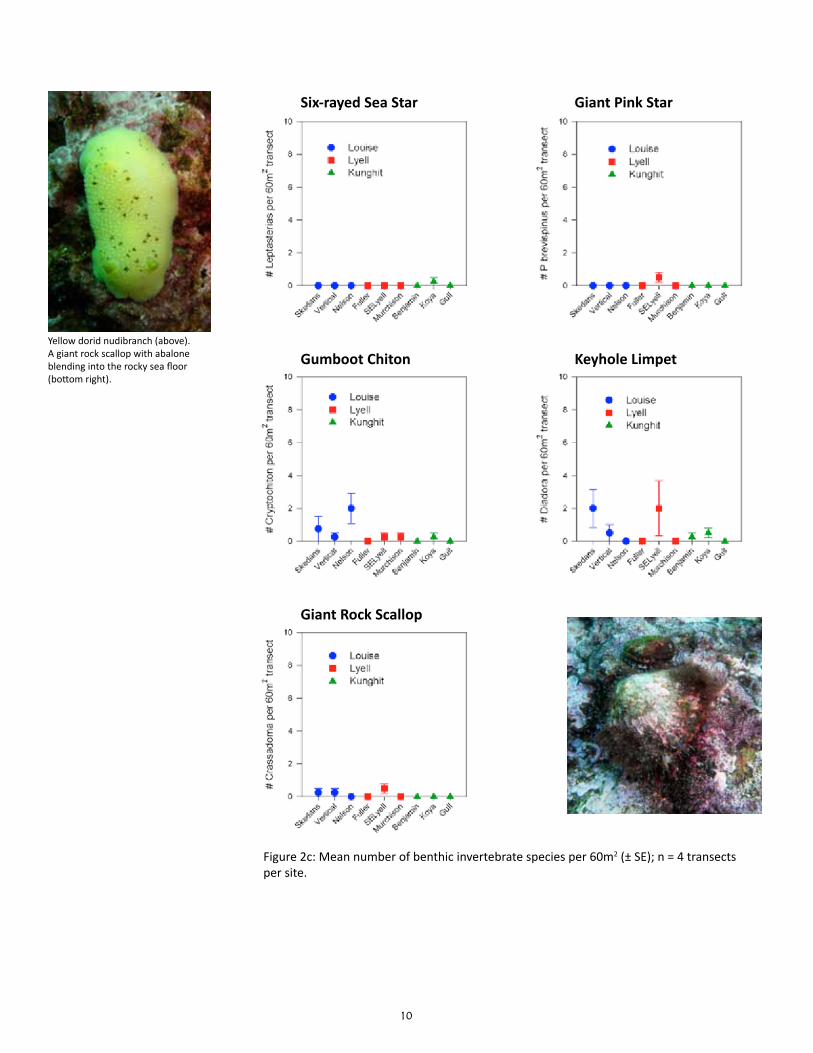
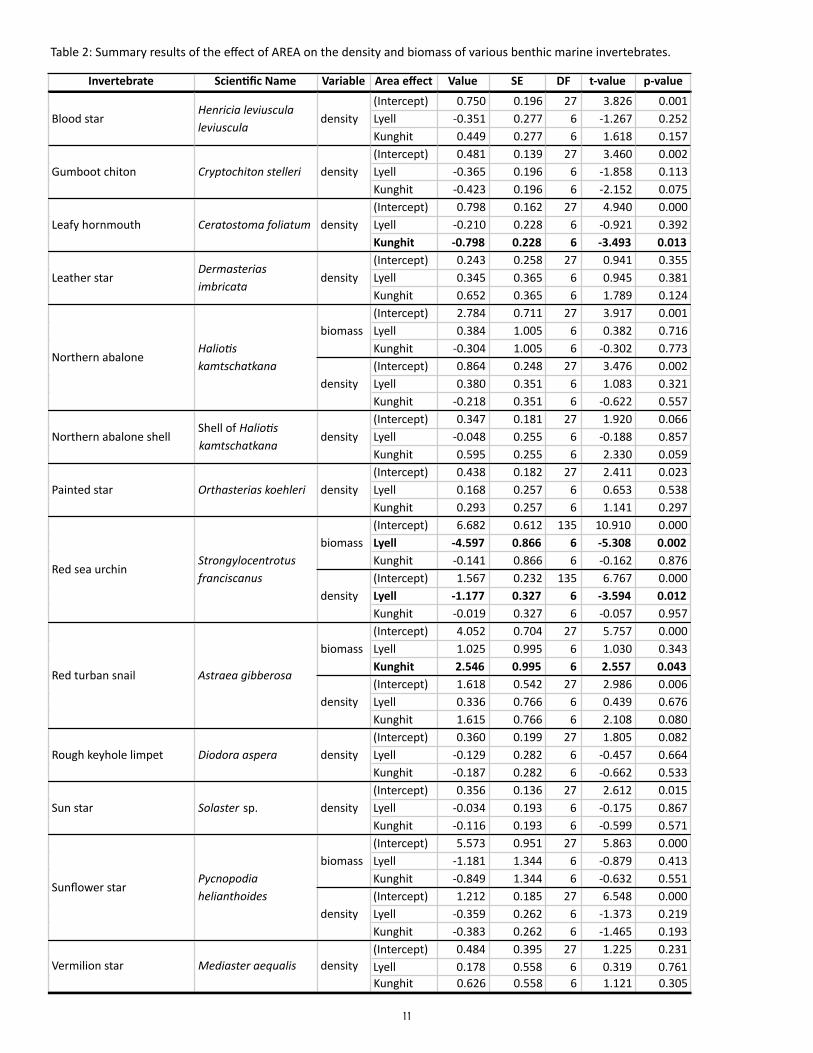
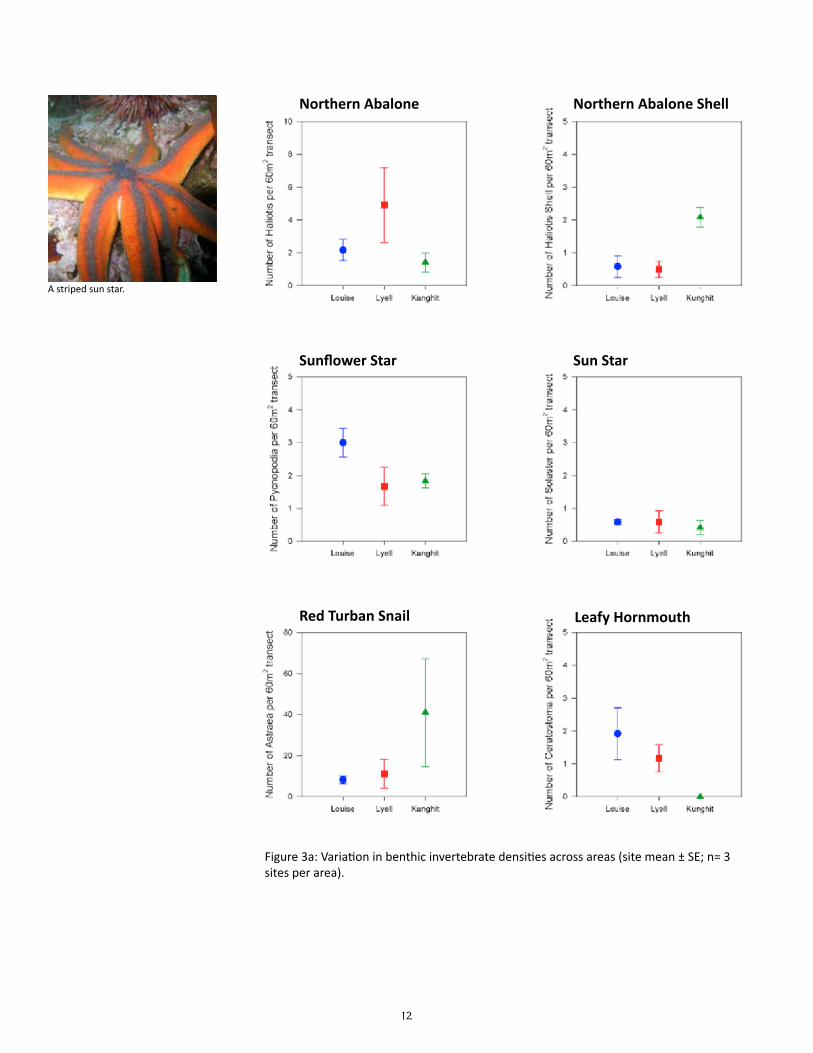
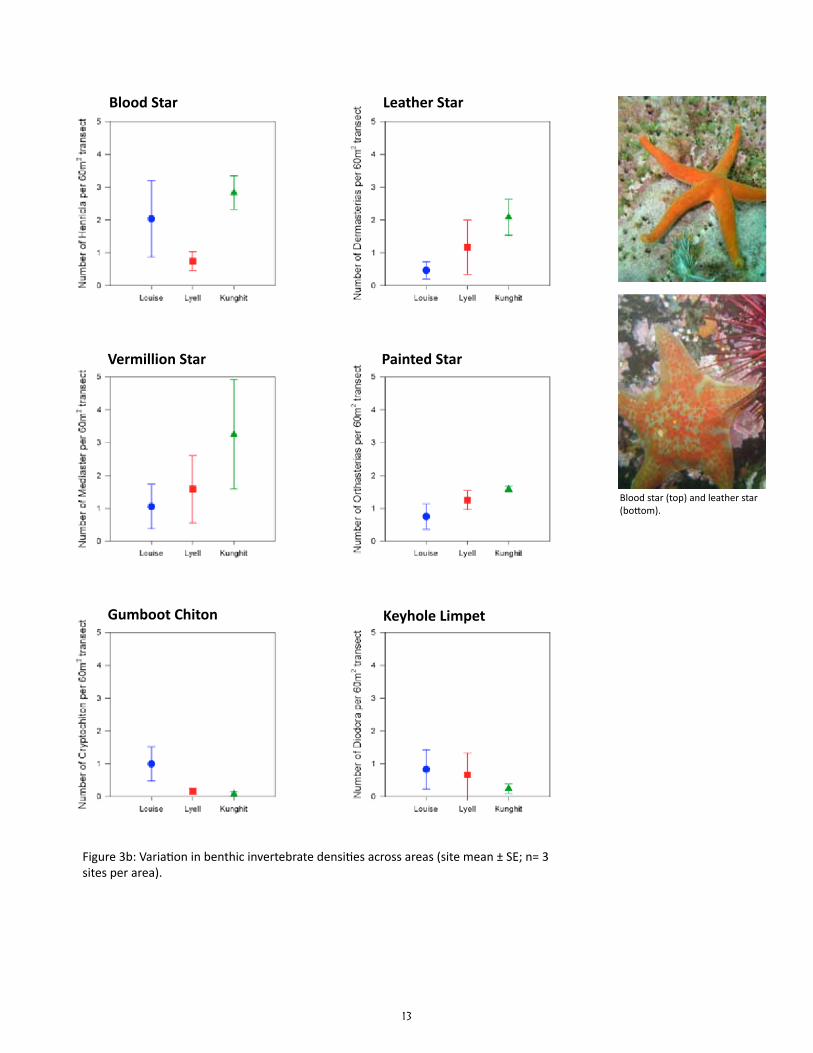
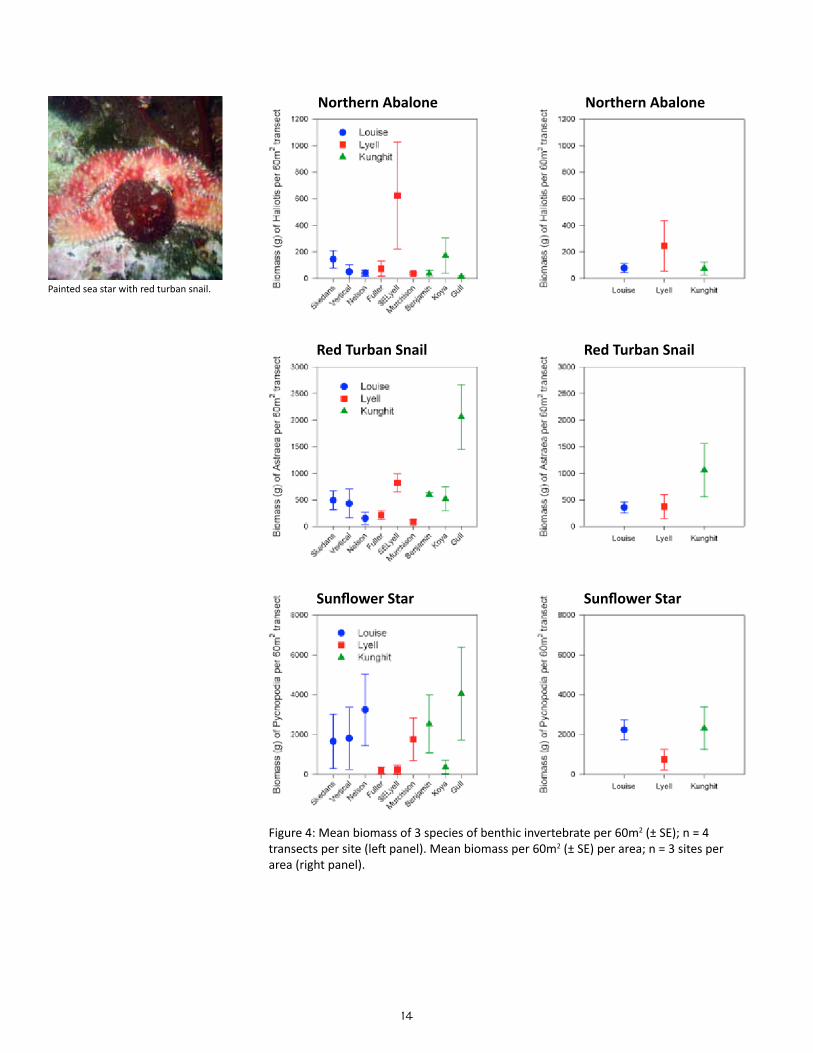
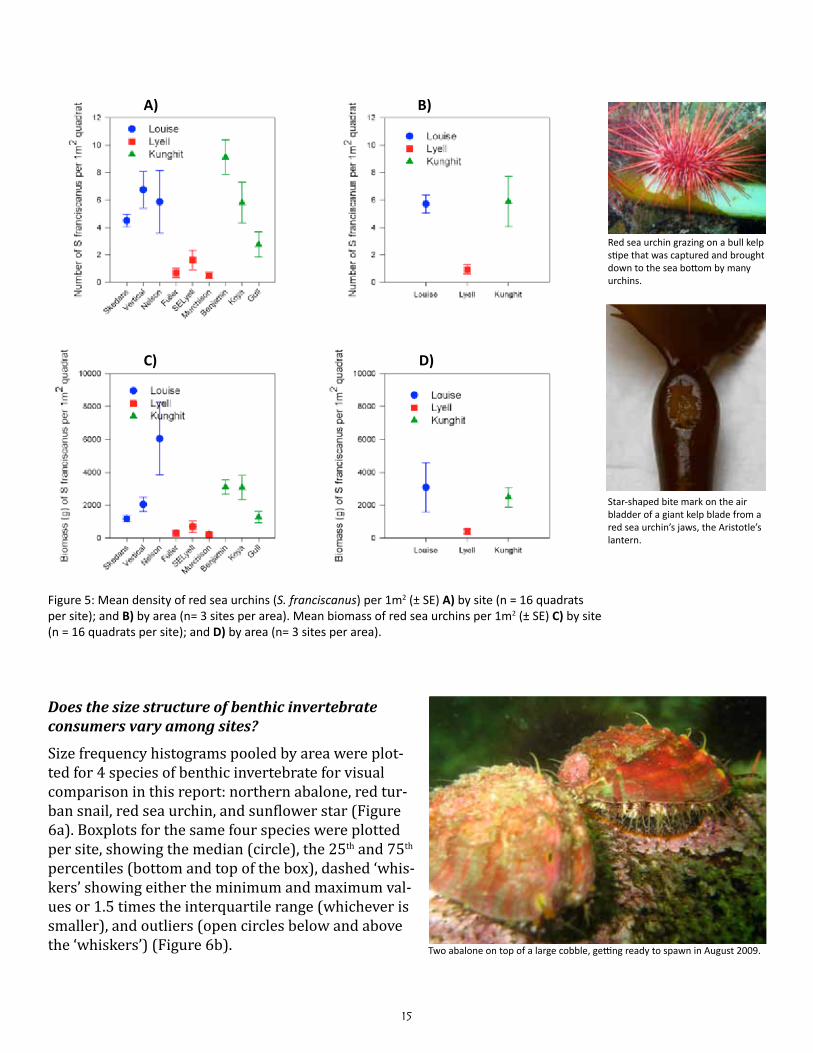
Preliminary results suggest that the density and biomass of most benthic invertebrate consumers var-ied as much among sites within areas as among area, and thus were not significantly different among the three areas for most species (Table 2). The exceptions were: (1) a significantly higher biomass of red turban snails at Kunghit than Louise and Lyell; (2) a significantly lower biomass and density of red sea ur-chins at Lyell than Louise and Kunghit; and (3) a significantly lower density of leafy hornmouths at Kung-hit than Louise and Lyell. Six species which had less than a total of 10 individuals in all sites combined were not tested for statistical differences in density: bat star (Asterina miniata), giant pink star (Pisaster brevispinus), giant rock scallop (Crassadoma gigantea), green sea urchin (Strongylocentrotus droebachien-sis), mottled star (Evasterias troschelii), and six-rayed sea star (Leptasterias species).
The means and standard errors for density of each benthic in-vertebrate species per belt transect were plotted for each site (n = 4; Figures 2a to 2c); the same was plotted for each area based on the site means and standard errors in the means (n = 3; Fig-ure 3a & 3b). The means and standard errors for biomass of red sea urchin (Strongylocentrotus franciscanus), northern abalone (H. kamtschatkana), sunflower star (Pycnopodia helianthoides) and red turban snail (Astraea gibberosa) per belt transect per site and area (Figure 4) were estimated using existing length-weight regressions from other studies (Appendix Table C). The density and biomass of red sea urchins was similarly plotted per quadrat by site (n = 16) and by area (n = 3; Figure 5). Mean urchin densities and biomass presented here may be more indicative of plot conditions than overall site conditions due to limited sampling of quadrats around experimental plot only.
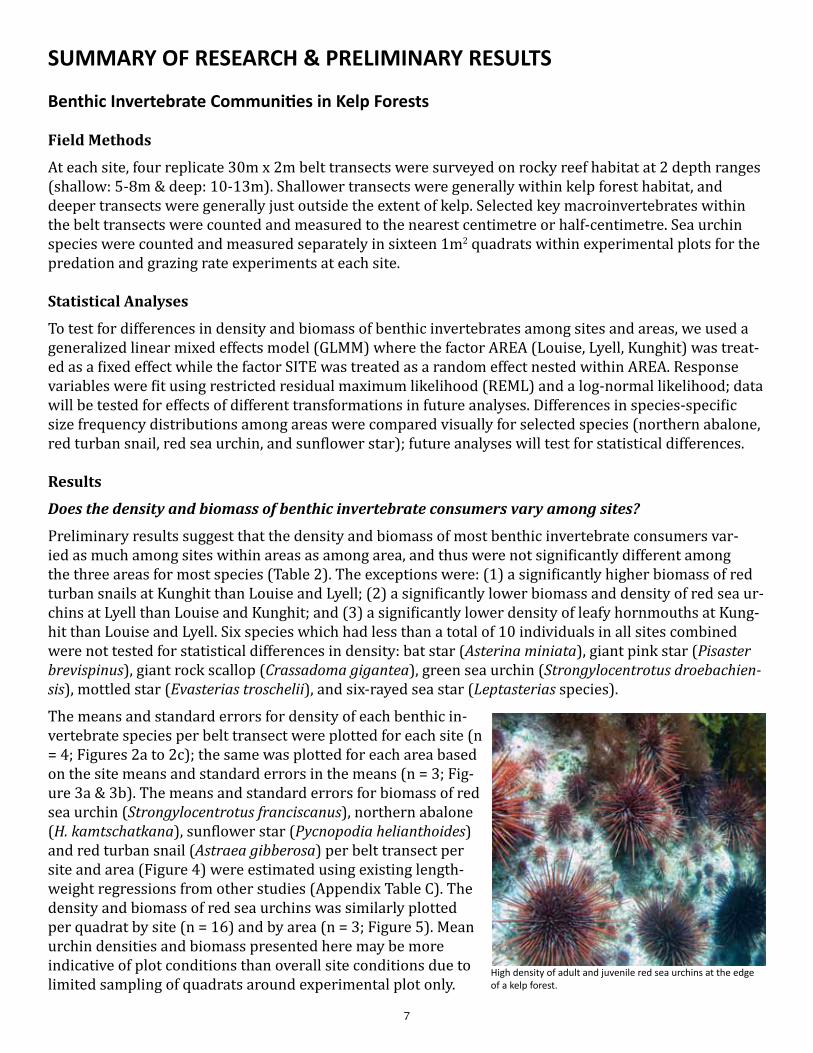
High density of adult and juvenile red sea urchins at the edge of a kelp forest.
8
Northern Abalone Northern Abalone Shell
Sunflower Star Sun Star
Red Turban Snail Leafy Hornmouth
Figure 2a: Mean number of benthic invertebrate species per 60m2 (± SE); n = 4 transects per site.
Very rare sighting of an abalone spawning, releasing sperm from the highest point of a large cobble. We observed a multi-species mass spawning event on 01 August 2009, including many abalone between 30 and 50mm long, red turban snails, a leather star, brittle star and California mussel.
9
Blood Star Leather Star
Vermillion Star Painted Star
Bar Star Mottled Star
Figure 2b: Mean number of benthic invertebrate species per 60m2 (± SE); n = 4 transects per site.
Juvenile Puget Sound king crab with its flaming orange carapace.
Delicate opalescent nudibranch.
10
Six-rayed Sea Star Giant Pink Star
Gumboot Chiton Keyhole Limpet
Giant Rock Scallop
Figure 2c: Mean number of benthic invertebrate species per 60m2 (± SE); n = 4 transects per site.
Yellow dorid nudibranch (above). A giant rock scallop with abalone blending into the rocky sea floor (bottom right).
11
Table 2: Summary results of the effect of AREA on the density and biomass of various benthic marine invertebrates.
Invertebrate Scien,fic Name Variable Area effect Value SE DF t-‐value p-‐value
(Intercept) 0.750 0.196 27 3.826 0.001Lyell -‐0.351 0.277 6 -‐1.267 0.252Kunghit 0.449 0.277 6 1.618 0.157(Intercept) 0.481 0.139 27 3.460 0.002Lyell -‐0.365 0.196 6 -‐1.858 0.113Kunghit -‐0.423 0.196 6 -‐2.152 0.075(Intercept) 0.798 0.162 27 4.940 0.000Lyell -‐0.210 0.228 6 -‐0.921 0.392Kunghit -‐0.798 0.228 6 -‐3.493 0.013(Intercept) 0.243 0.258 27 0.941 0.355Lyell 0.345 0.365 6 0.945 0.381Kunghit 0.652 0.365 6 1.789 0.124(Intercept) 2.784 0.711 27 3.917 0.001Lyell 0.384 1.005 6 0.382 0.716Kunghit -‐0.304 1.005 6 -‐0.302 0.773(Intercept) 0.864 0.248 27 3.476 0.002Lyell 0.380 0.351 6 1.083 0.321Kunghit -‐0.218 0.351 6 -‐0.622 0.557(Intercept) 0.347 0.181 27 1.920 0.066Lyell -‐0.048 0.255 6 -‐0.188 0.857Kunghit 0.595 0.255 6 2.330 0.059(Intercept) 0.438 0.182 27 2.411 0.023Lyell 0.168 0.257 6 0.653 0.538Kunghit 0.293 0.257 6 1.141 0.297(Intercept) 6.682 0.612 135 10.910 0.000Lyell -‐4.597 0.866 6 -‐5.308 0.002Kunghit -‐0.141 0.866 6 -‐0.162 0.876(Intercept) 1.567 0.232 135 6.767 0.000Lyell -‐1.177 0.327 6 -‐3.594 0.012Kunghit -‐0.019 0.327 6 -‐0.057 0.957(Intercept) 4.052 0.704 27 5.757 0.000Lyell 1.025 0.995 6 1.030 0.343Kunghit 2.546 0.995 6 2.557 0.043(Intercept) 1.618 0.542 27 2.986 0.006Lyell 0.336 0.766 6 0.439 0.676Kunghit 1.615 0.766 6 2.108 0.080(Intercept) 0.360 0.199 27 1.805 0.082Lyell -‐0.129 0.282 6 -‐0.457 0.664Kunghit -‐0.187 0.282 6 -‐0.662 0.533(Intercept) 0.356 0.136 27 2.612 0.015Lyell -‐0.034 0.193 6 -‐0.175 0.867Kunghit -‐0.116 0.193 6 -‐0.599 0.571(Intercept) 5.573 0.951 27 5.863 0.000Lyell -‐1.181 1.344 6 -‐0.879 0.413Kunghit -‐0.849 1.344 6 -‐0.632 0.551(Intercept) 1.212 0.185 27 6.548 0.000Lyell -‐0.359 0.262 6 -‐1.373 0.219Kunghit -‐0.383 0.262 6 -‐1.465 0.193(Intercept) 0.484 0.395 27 1.225 0.231Lyell 0.178 0.558 6 0.319 0.761Kunghit 0.626 0.558 6 1.121 0.305
Red sea urchinStrongylocentrotus franciscanus
biomass
density
Pycnopodia helianthoides
Sunflower star
density
biomass
Sun star Solaster sp. density
Vermilion star Mediaster aequalis density
Painted star Orthasterias koehleri density
Northern abalone shellShell of Halio:s kamtschatkana
density
Blood starHenricia leviuscula leviuscula
density
Rough keyhole limpet Diodora aspera density
Northern abaloneHalio:s kamtschatkana
biomass
density
Gumboot chiton Cryptochiton stelleri density
Leather starDermasterias imbricata
density
Red turban snail Astraea gibberosa
Leafy hornmouth Ceratostoma foliatum
biomass
density
density
12
Figure 3a: Variation in benthic invertebrate densities across areas (site mean ± SE; n= 3 sites per area).
Northern Abalone Northern Abalone Shell
Sunflower Star Sun Star
Red Turban Snail Leafy Hornmouth
A striped sun star.
13
Figure 3b: Variation in benthic invertebrate densities across areas (site mean ± SE; n= 3 sites per area).
Blood Star Leather Star
Vermillion Star Painted Star
Gumboot Chiton Keyhole Limpet
Blood star (top) and leather star (bottom).
14
Figure 4: Mean biomass of 3 species of benthic invertebrate per 60m2 (± SE); n = 4 transects per site (left panel). Mean biomass per 60m2 (± SE) per area; n = 3 sites per area (right panel).
Northern Abalone
Red Turban Snail
Sunflower Star
Northern Abalone
Red Turban Snail
Sunflower Star
Painted sea star with red turban snail.
15
Figure 5: Mean density of red sea urchins (S. franciscanus) per 1m2 (± SE) A) by site (n = 16 quadrats per site); and B) by area (n= 3 sites per area). Mean biomass of red sea urchins per 1m2 (± SE) C) by site (n = 16 quadrats per site); and D) by area (n= 3 sites per area).
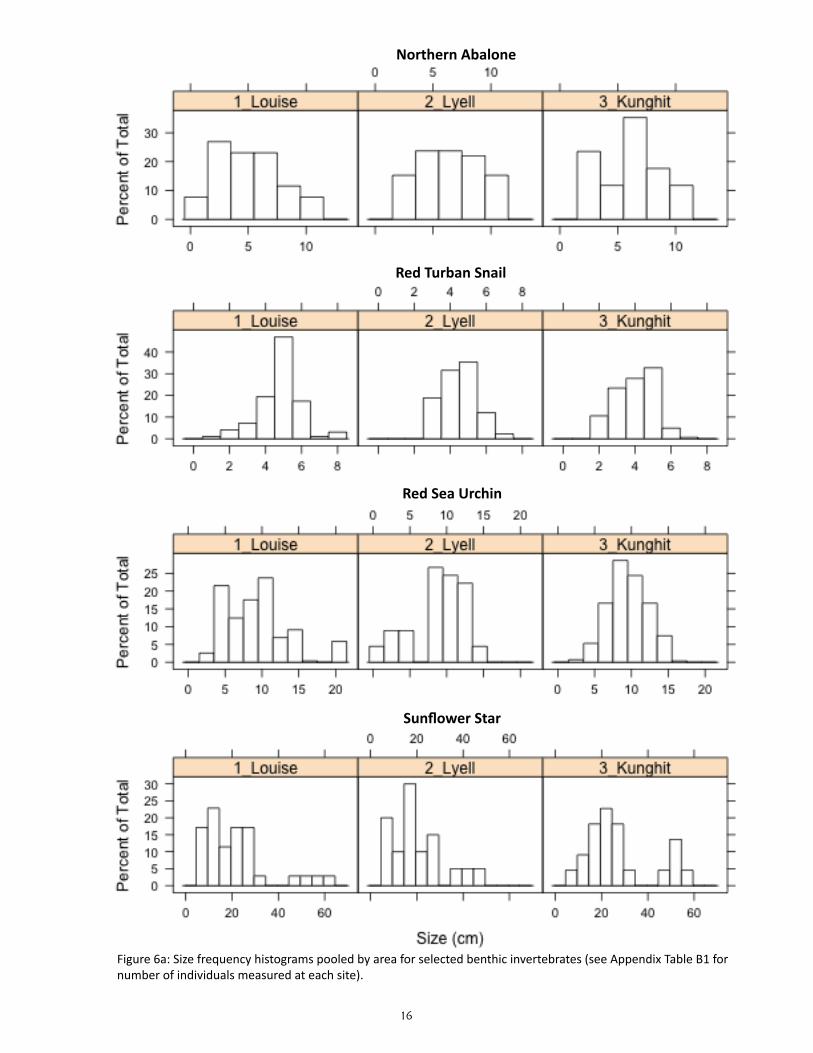
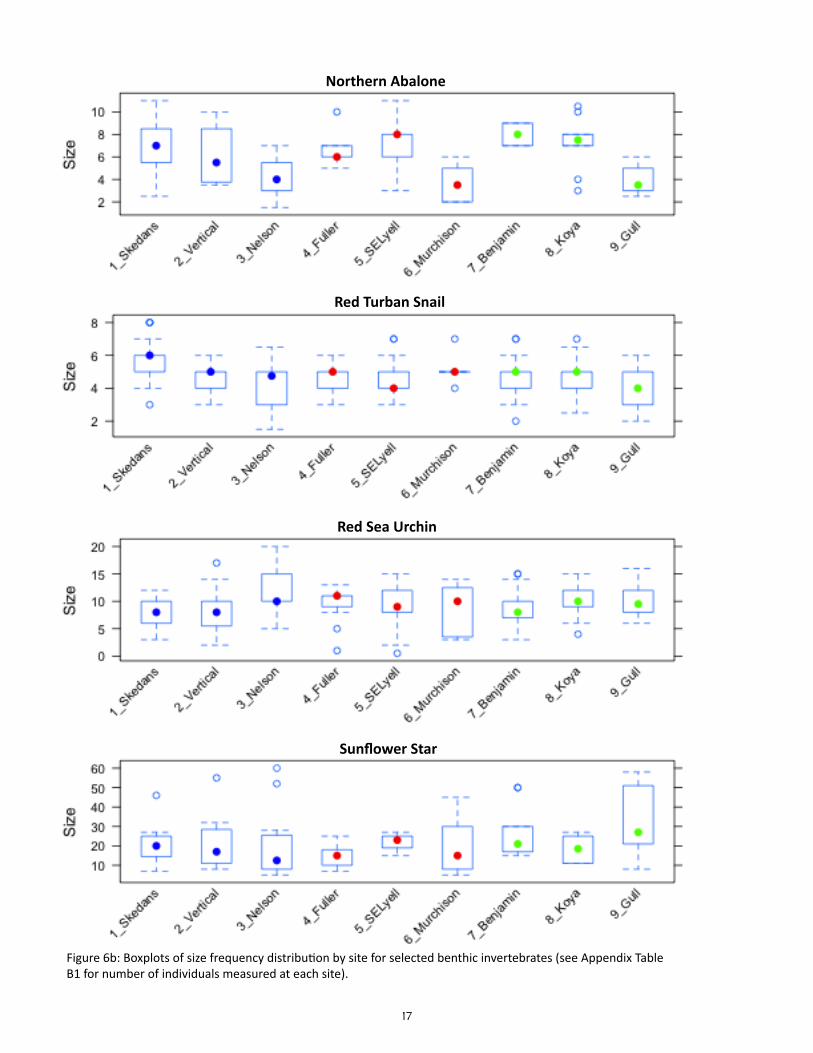
Does the size structure of benthic invertebrate consumers vary among sites?
Size frequency histograms pooled by area were plot-ted for 4 species of benthic invertebrate for visual comparison in this report: northern abalone, red tur-ban snail, red sea urchin, and sunflower star (Figure 6a). Boxplots for the same four species were plotted per site, showing the median (circle), the 25th and 75th percentiles (bottom and top of the box), dashed ‘whis-kers’ showing either the minimum and maximum val-ues or 1.5 times the interquartile range (whichever is smaller), and outliers (open circles below and above the ‘whiskers’) (Figure 6b).
A)
D)
B)
C)
Red sea urchin grazing on a bull kelp stipe that was captured and brought down to the sea bottom by many urchins.
Two abalone on top of a large cobble, getting ready to spawn in August 2009.
Star-shaped bite mark on the air bladder of a giant kelp blade from a red sea urchin’s jaws, the Aristotle’s lantern.
16
Northern Abalone
Red Turban Snail
Red Sea Urchin
Sunflower Star
Figure 6a: Size frequency histograms pooled by area for selected benthic invertebrates (see Appendix Table B1 for number of individuals measured at each site).
17
Northern Abalone
Red Turban Snail
Red Sea Urchin
Sunflower Star
Figure 6b: Boxplots of size frequency distribution by site for selected benthic invertebrates (see Appendix Table B1 for number of individuals measured at each site).
18
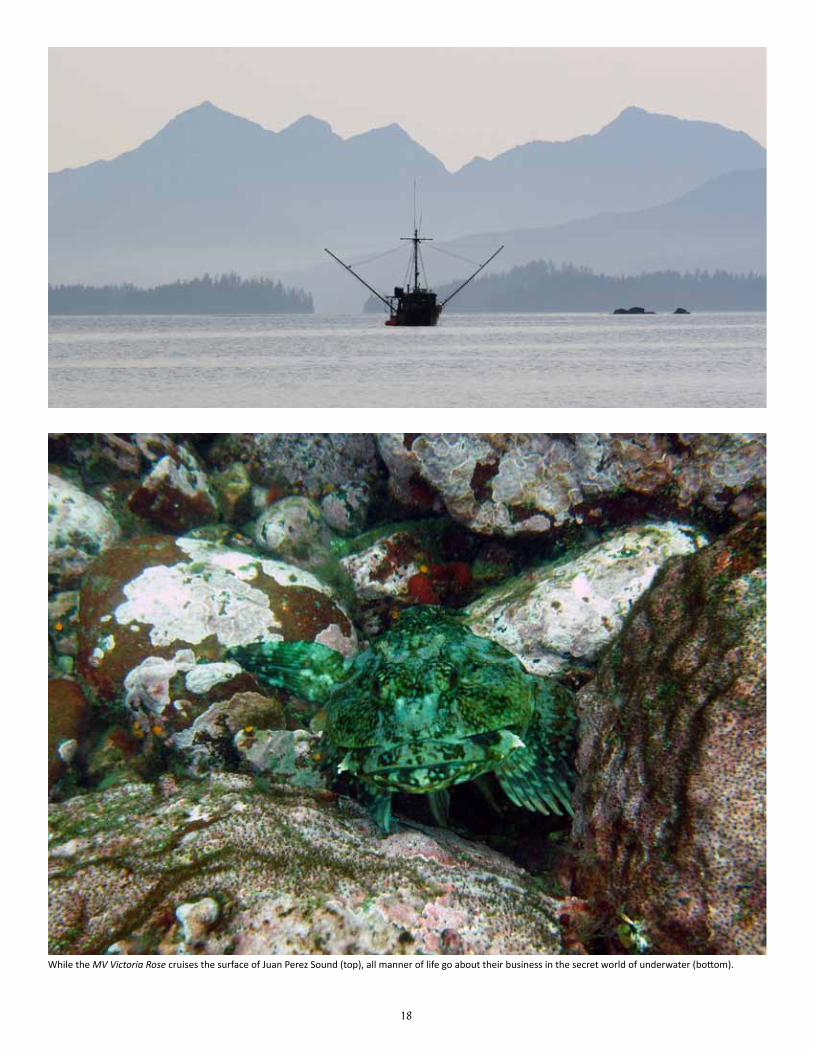
While the MV Victoria Rose cruises the surface of Juan Perez Sound (top), all manner of life go about their business in the secret world of underwater (bottom).
19
Fish Communities in Kelp Forests
Field Methods
Kelp forest fish communities were surveyed at each site using 4 replicate 30m x 4m x 4m high belt tran-sects per site at two depth ranges (shallow: 5-8m & deep: 10-13m). For fish, the size range in 10 cm size classes and behaviour (active, cryptic, or resting) of all individuals located 2m on either side of the line was recorded. Visibility along each transect was recorded to document potential bias in counts result-ing from poor visibility. In addition, at each site, timed hook and line fishing at 3 depth ranges (shallow = <20m, intermediate = 20-33m, deep = >33m) was used to: (1) estimate catch per unit effort (CPUE) as an independent estimate of fish densities, and (2) describe kelp forest food webs in Gwaii Haanas by collect-ing stomach contents, stable isotope samples, and otoliths for aging from a sample number of common fish species. Additional fish caught were measured and immediately released live.
Statistical Analyses
To test for differences in biomass among areas, we used generalized linear mixed effects models (GLMM) where the factor AREA (Louise, Lyell, Kunghit) was treated as a fixed effect while the factor SITE nested within AREA was treated as a random effect. We constructed models for all species combined, all rock-fish species, and individual species models for all species where >5 individual fish were counted in total (all species except striped perch, painted greenling, cabezon and Puget Sound rockfish). Biomass models (estimated g of wet weight/transect) were fit using restricted residual maximum likelihood (REML) and a log-normal or normal likelihood (selected by examining model diagnostic plots).
Results
Does the density and biomass of fish consumers vary among sites in Gwaii Haanas?
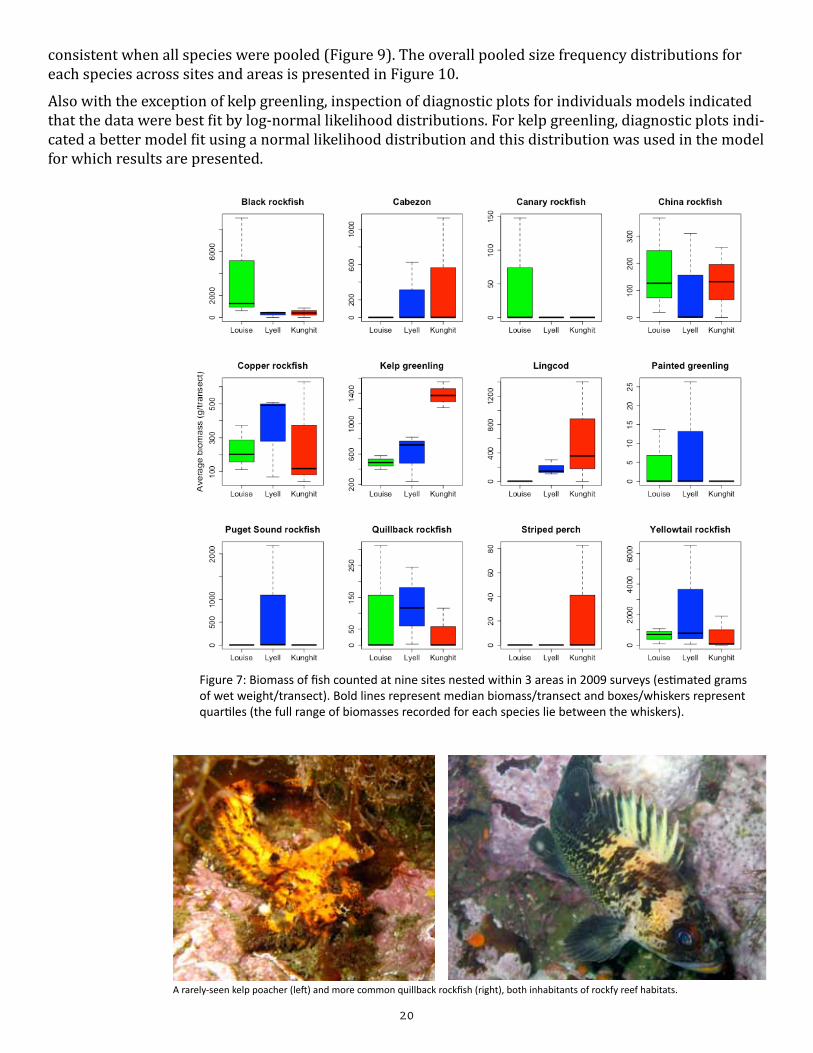
We counted 2,562 fish across the nine sites surveyed, including seven species of rockfish, two species of greenling, lingcod, cabezon and striped perch (Appendix Table B2). Yellowtail rockfish were the most abundant species and accounted for a large proportion of the total biomass at the majority of sites (Figure 7). Black rockfish, China rockfish, copper rockfish, kelp greenling and quillback rockfish were also com-mon at most sites, with other species being more patchily distributed (Figure 7; Appendix Table B2).
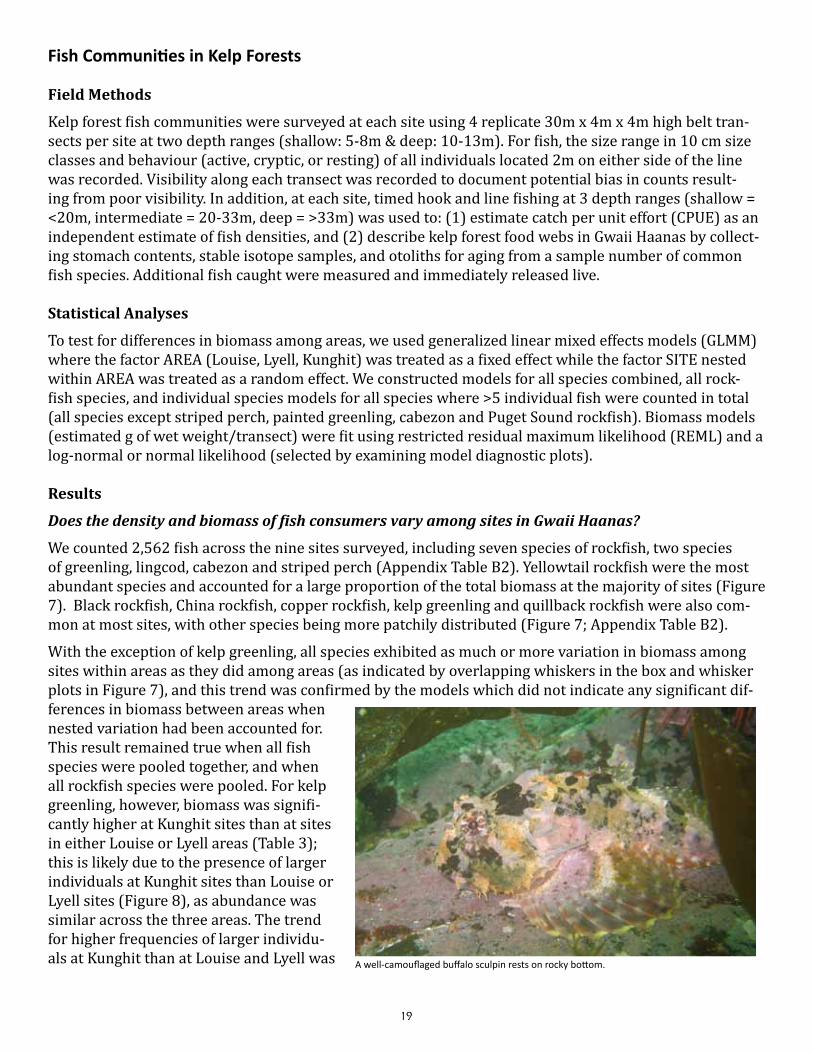
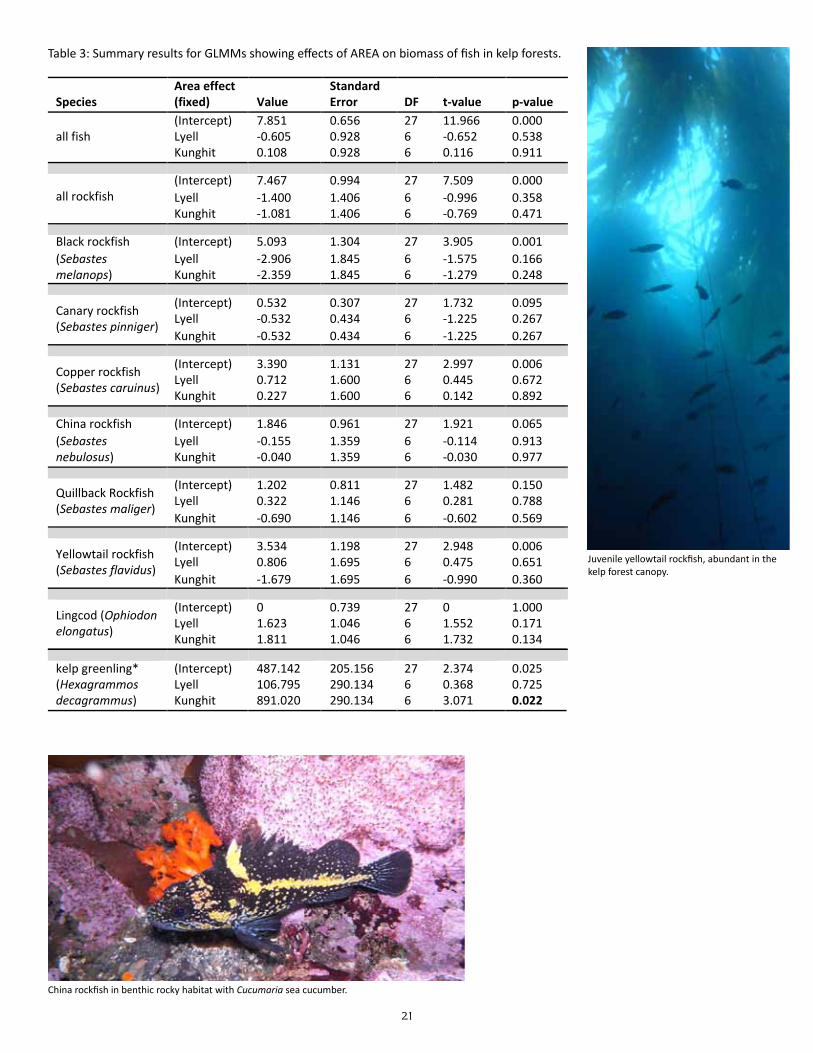
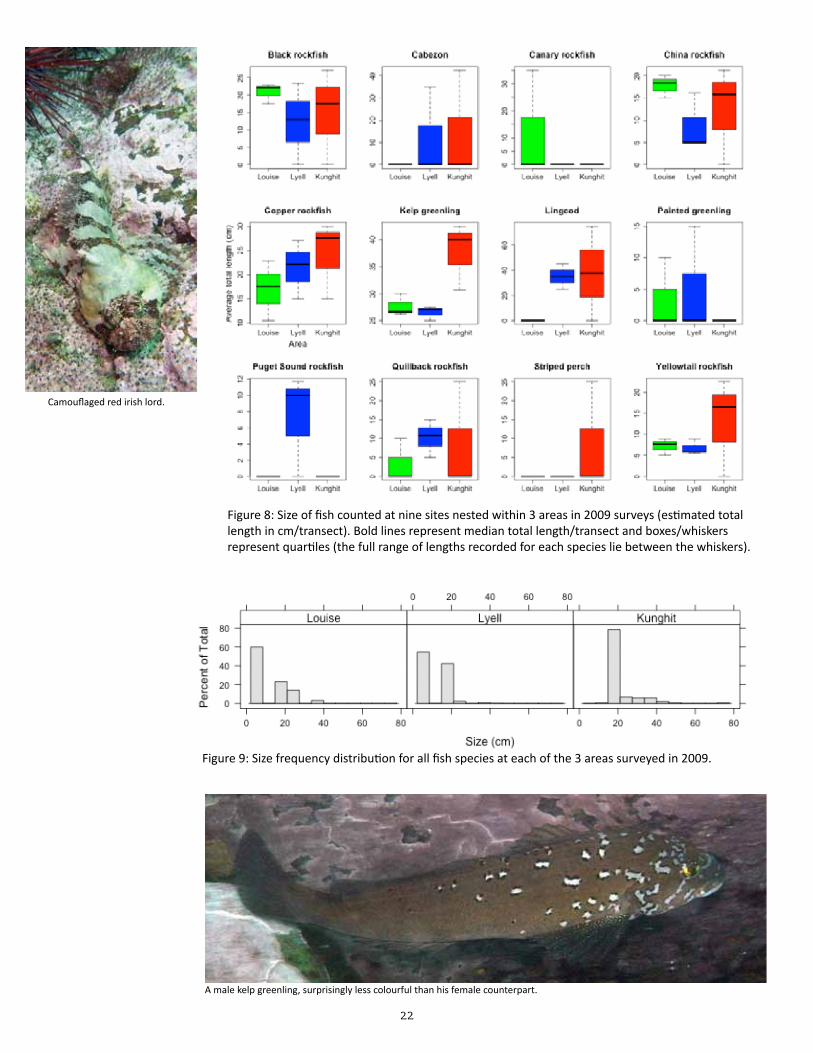
With the exception of kelp greenling, all species exhibited as much or more variation in biomass among sites within areas as they did among areas (as indicated by overlapping whiskers in the box and whisker plots in Figure 7), and this trend was confirmed by the models which did not indicate any significant dif-ferences in biomass between areas when nested variation had been accounted for. This result remained true when all fish species were pooled together, and when all rockfish species were pooled. For kelp greenling, however, biomass was signifi-cantly higher at Kunghit sites than at sites in either Louise or Lyell areas (Table 3); this is likely due to the presence of larger individuals at Kunghit sites than Louise or Lyell sites (Figure 8), as abundance was similar across the three areas. The trend for higher frequencies of larger individu-als at Kunghit than at Louise and Lyell was A well-camouflaged buffalo sculpin rests on rocky bottom.
20
Figure 7: Biomass of fish counted at nine sites nested within 3 areas in 2009 surveys (estimated grams of wet weight/transect). Bold lines represent median biomass/transect and boxes/whiskers represent quartiles (the full range of biomasses recorded for each species lie between the whiskers).
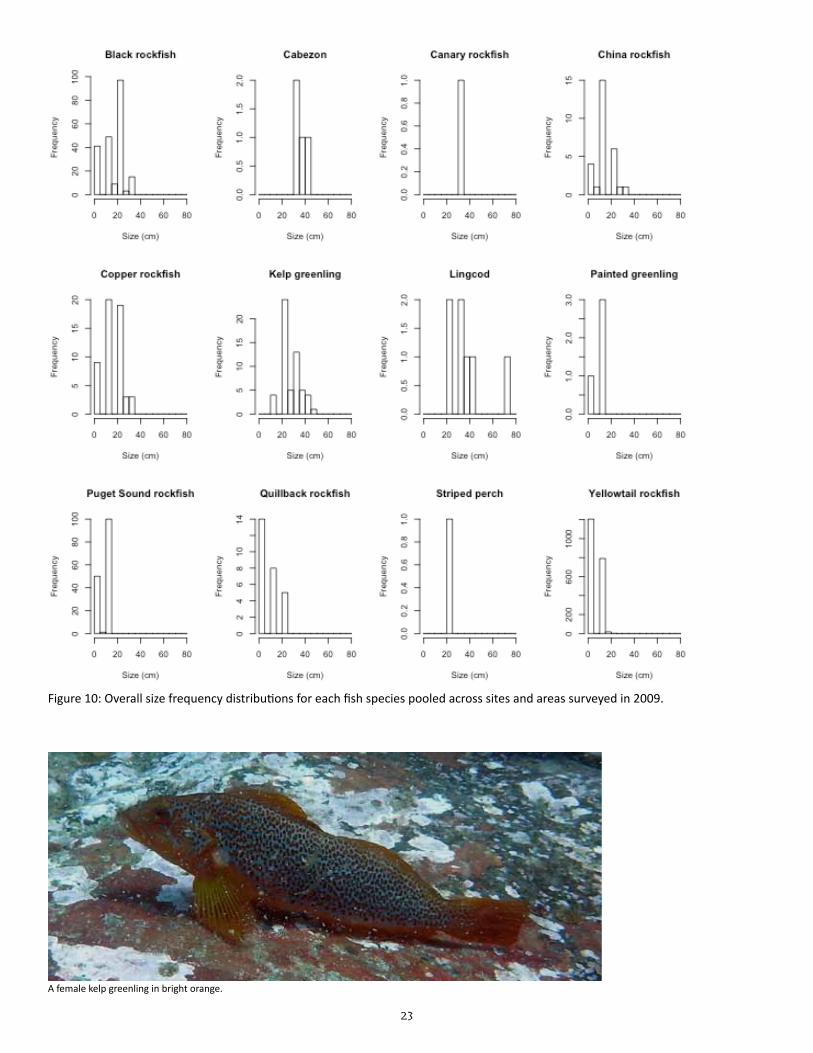
consistent when all species were pooled (Figure 9). The overall pooled size frequency distributions for each species across sites and areas is presented in Figure 10.
Also with the exception of kelp greenling, inspection of diagnostic plots for individuals models indicated that the data were best fit by log-normal likelihood distributions. For kelp greenling, diagnostic plots indi-cated a better model fit using a normal likelihood distribution and this distribution was used in the model for which results are presented.
A rarely-seen kelp poacher (left) and more common quillback rockfish (right), both inhabitants of rockfy reef habitats.
21
Table 3: Summary results for GLMMs showing effects of AREA on biomass of fish in kelp forests.
Species Area effect (fixed) Value
Standard Error DF t-‐value p-‐value
(Intercept) 7.851 0.656 27 11.966 0.000 Lyell -‐0.605 0.928 6 -‐0.652 0.538 all fish Kunghit 0.108 0.928 6 0.116 0.911
(Intercept) 7.467 0.994 27 7.509 0.000 Lyell -‐1.400 1.406 6 -‐0.996 0.358 all rockfish Kunghit -‐1.081 1.406 6 -‐0.769 0.471
(Intercept) 5.093 1.304 27 3.905 0.001 Lyell -‐2.906 1.845 6 -‐1.575 0.166
Black rockfish (Sebastes melanops) Kunghit -‐2.359 1.845 6 -‐1.279 0.248
(Intercept) 0.532 0.307 27 1.732 0.095 Lyell -‐0.532 0.434 6 -‐1.225 0.267
Canary rockfish (Sebastes pinniger)
Kunghit -‐0.532 0.434 6 -‐1.225 0.267
(Intercept) 3.390 1.131 27 2.997 0.006 Lyell 0.712 1.600 6 0.445 0.672
Copper rockfish (Sebastes caruinus)
Kunghit 0.227 1.600 6 0.142 0.892
(Intercept) 1.846 0.961 27 1.921 0.065 Lyell -‐0.155 1.359 6 -‐0.114 0.913
China rockfish (Sebastes nebulosus) Kunghit -‐0.040 1.359 6 -‐0.030 0.977
(Intercept) 1.202 0.811 27 1.482 0.150 Lyell 0.322 1.146 6 0.281 0.788
Quillback Rockfish (Sebastes maliger)
Kunghit -‐0.690 1.146 6 -‐0.602 0.569
(Intercept) 3.534 1.198 27 2.948 0.006 Lyell 0.806 1.695 6 0.475 0.651
Yellowtail rockfish (Sebastes flavidus)
Kunghit -‐1.679 1.695 6 -‐0.990 0.360
(Intercept) 0 0.739 27 0 1.000 Lyell 1.623 1.046 6 1.552 0.171
Lingcod (Ophiodon elongatus)
Kunghit 1.811 1.046 6 1.732 0.134
(Intercept) 487.142 205.156 27 2.374 0.025 Lyell 106.795 290.134 6 0.368 0.725
kelp greenling* (Hexagrammos decagrammus) Kunghit 891.020 290.134 6 3.071 0.022
China rockfish in benthic rocky habitat with Cucumaria sea cucumber.
Juvenile yellowtail rockfish, abundant in the kelp forest canopy.
22
Figure 8: Size of fish counted at nine sites nested within 3 areas in 2009 surveys (estimated total length in cm/transect). Bold lines represent median total length/transect and boxes/whiskers represent quartiles (the full range of lengths recorded for each species lie between the whiskers).
Figure 9: Size frequency distribution for all fish species at each of the 3 areas surveyed in 2009.
Camouflaged red irish lord.
A male kelp greenling, surprisingly less colourful than his female counterpart.
23
Figure 10: Overall size frequency distributions for each fish species pooled across sites and areas surveyed in 2009.
A female kelp greenling in bright orange.
24
Species Total caught
Isotope Sample Taken
Gut contents retained
Black rockfish (Sebastes melanops) 35 24 15 Canary rockfish (Sebastes pinniger) 5 5 0 China rockfish (Sebastes nebulosus) 17 17 15 Copper rockfish (Sebastes caurinus) 37 26 21 Kelp greenling (Hexagrammos decagrammus) 12 12 10 Lingcod (Ophiodon elongatus) 9 9 7 Quillback rockfish (Sebastes maliger) 29 16 11 Yellowtail rockfish (Sebastes flavidus) 2 2 1 Totals 146 111 80
Table 4: Fish caught by hook and line for stable isotope, otolith and stomach content analysis in 2009 survey.
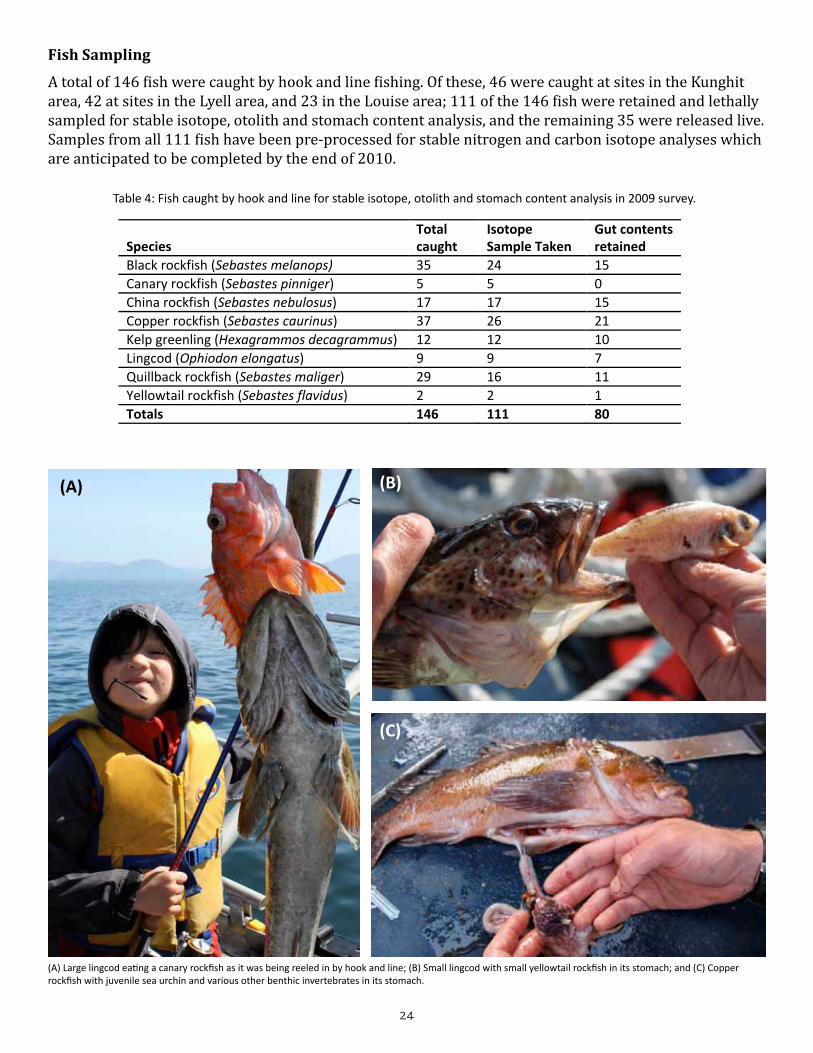
Fish Sampling
A total of 146 fish were caught by hook and line fishing. Of these, 46 were caught at sites in the Kunghit area, 42 at sites in the Lyell area, and 23 in the Louise area; 111 of the 146 fish were retained and lethally sampled for stable isotope, otolith and stomach content analysis, and the remaining 35 were released live. Samples from all 111 fish have been pre-processed for stable nitrogen and carbon isotope analyses which are anticipated to be completed by the end of 2010.
(A) (B)
(C)
(A) Large lingcod eating a canary rockfish as it was being reeled in by hook and line; (B) Small lingcod with small yellowtail rockfish in its stomach; and (C) Copper rockfish with juvenile sea urchin and various other benthic invertebrates in its stomach.
25
Primary Producers in Kelp Forests
Field Methods
At each site, total percent kelp cover and percent drift kelp cover was recorded, and kelp stipes by species for Nereocystis, Laminariales species, and Macrocystis, were counted within sixteen 1m2 quadrats associ-ated with experimental plots for predation and grazing rate studies. For each plot, a measure of substrate rugosity was recorded, determined by measuring the horizontal distance across the length of the chain in the field, divided by the actual chain length of 3m. The higher the rugosity of the substrate, the more the 3m length of chain dips and folds to conform to the bottom, resulting in a shorter measured horizontal length; therefore, the higher the rugosity, the lower the ratio value for rugosity.
Statistical Analyses
To test for differences in density and percent cover of kelps among sites and areas, we used generalized linear mixed effects models (GLMMs) where the factor AREA (Louise, Lyell, Kunghit) was treated as a fixed effect while the factor SITE was treated as a random effect nested within AREA. Response variables were fit using restricted residual maximum likelihood (REML) and a log-normal likelihood; data will be tested for effects of different transformations in future analyses. The model for rugosity was similarly fit.
Results
Does the density and percent cover of dominant primary producers (kelp of the order Laminariales) vary among sites?
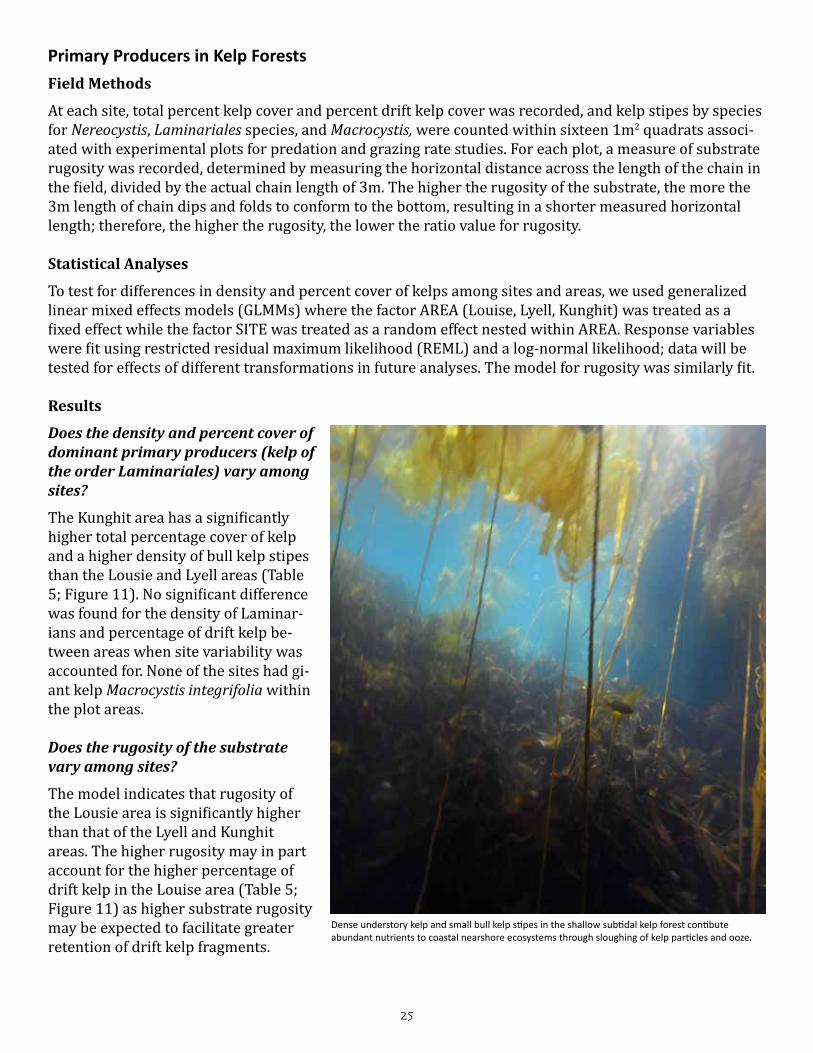
The Kunghit area has a significantly higher total percentage cover of kelp and a higher density of bull kelp stipes than the Lousie and Lyell areas (Table 5; Figure 11). No significant difference was found for the density of Laminar-ians and percentage of drift kelp be-tween areas when site variability was accounted for. None of the sites had gi-ant kelp Macrocystis integrifolia within the plot areas.
Does the rugosity of the substrate vary among sites?
The model indicates that rugosity of the Lousie area is significantly higher than that of the Lyell and Kunghit areas. The higher rugosity may in part account for the higher percentage of drift kelp in the Louise area (Table 5; Figure 11) as higher substrate rugosity may be expected to facilitate greater retention of drift kelp fragments.
Dense understory kelp and small bull kelp stipes in the shallow subtidal kelp forest contibute abundant nutrients to coastal nearshore ecosystems through sloughing of kelp particles and ooze.
26
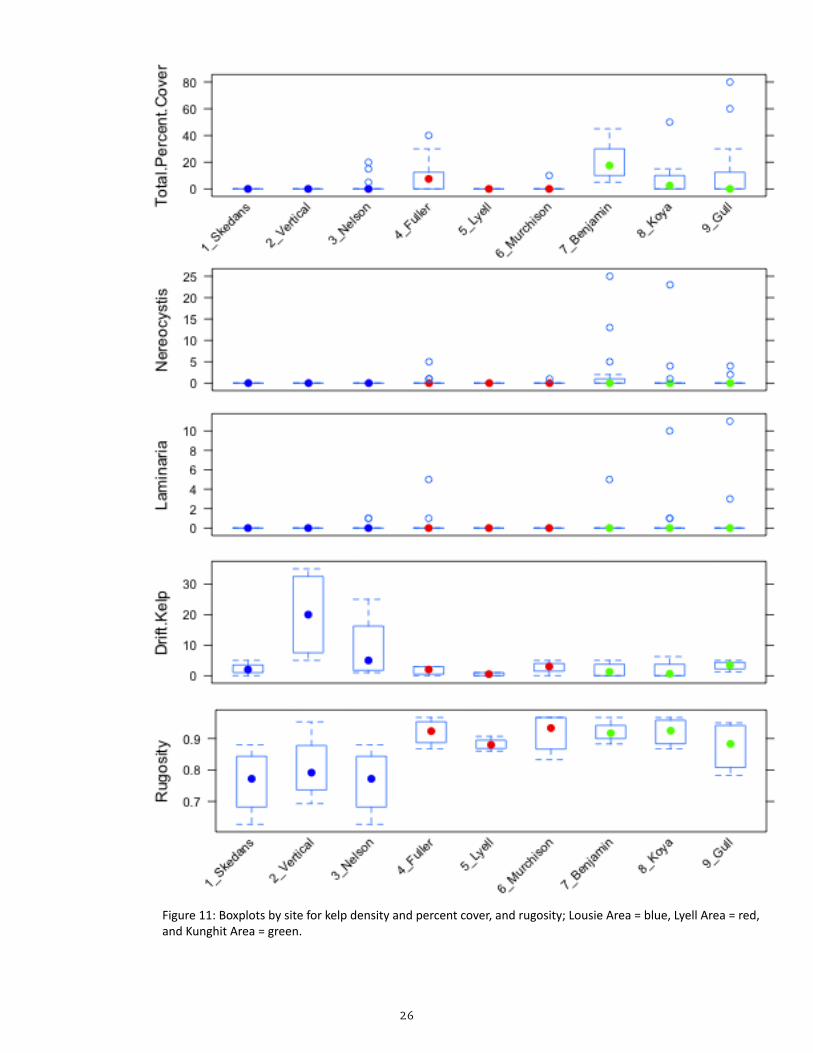
Figure 11: Boxplots by site for kelp density and percent cover, and rugosity; Lousie Area = blue, Lyell Area = red, and Kunghit Area = green.
27
Kelp & Rugosity Scien2fic Name Variable Area effect Value SE DF t-‐value p-‐value
(Intercept) 0.159 0.456 135 0.347 0.729Lyell 0.465 0.645 6 0.720 0.499Kunghit 1.598 0.645 6 2.477 0.048(Intercept) 0.000 0.074 135 0.000 1.000Lyell 0.081 0.105 6 0.768 0.472Kunghit 0.354 0.105 6 3.369 0.015(Intercept) 0.029 0.055 135 0.523 0.602Lyell 0.023 0.078 6 0.293 0.779Kunghit 0.168 0.078 6 2.150 0.075(Intercept) 1.878 0.354 27 5.309 0.000Lyell -‐1.094 0.500 6 -‐2.186 0.072Kunghit -‐0.927 0.500 6 -‐1.853 0.113
(Intercept) 0.574 0.011 27 50.541 0.000Lyell 0.071 0.016 6 4.427 0.004Kunghit 0.071 0.016 6 4.396 0.005
Total % kelp cover all kelp species % cover
Rugosity n/a n/a
DriI Kelp all kelp species % cover
Bull kelp Nereocys(s luetkeana density
Laminarians Laminariales sp density
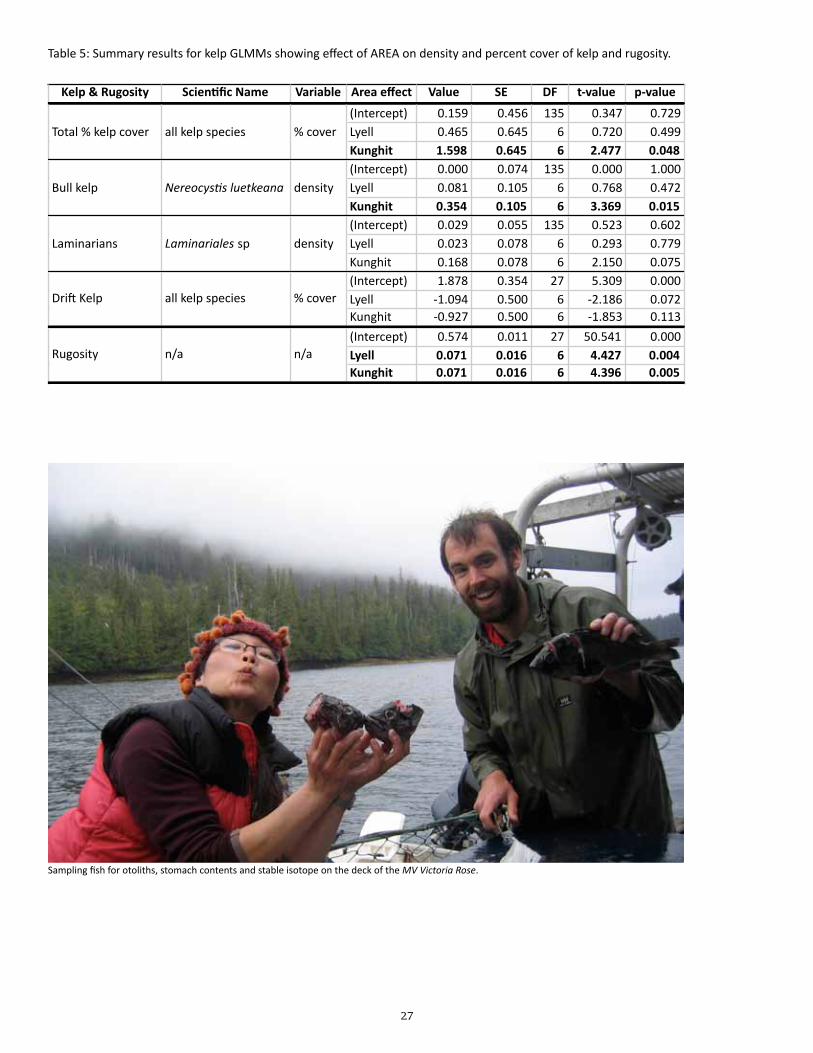
Table 5: Summary results for kelp GLMMs showing effect of AREA on density and percent cover of kelp and rugosity.
Sampling fish for otoliths, stomach contents and stable isotope on the deck of the MV Victoria Rose.
28
Predation & Grazing Rates in Kelp Forests
Field Methods
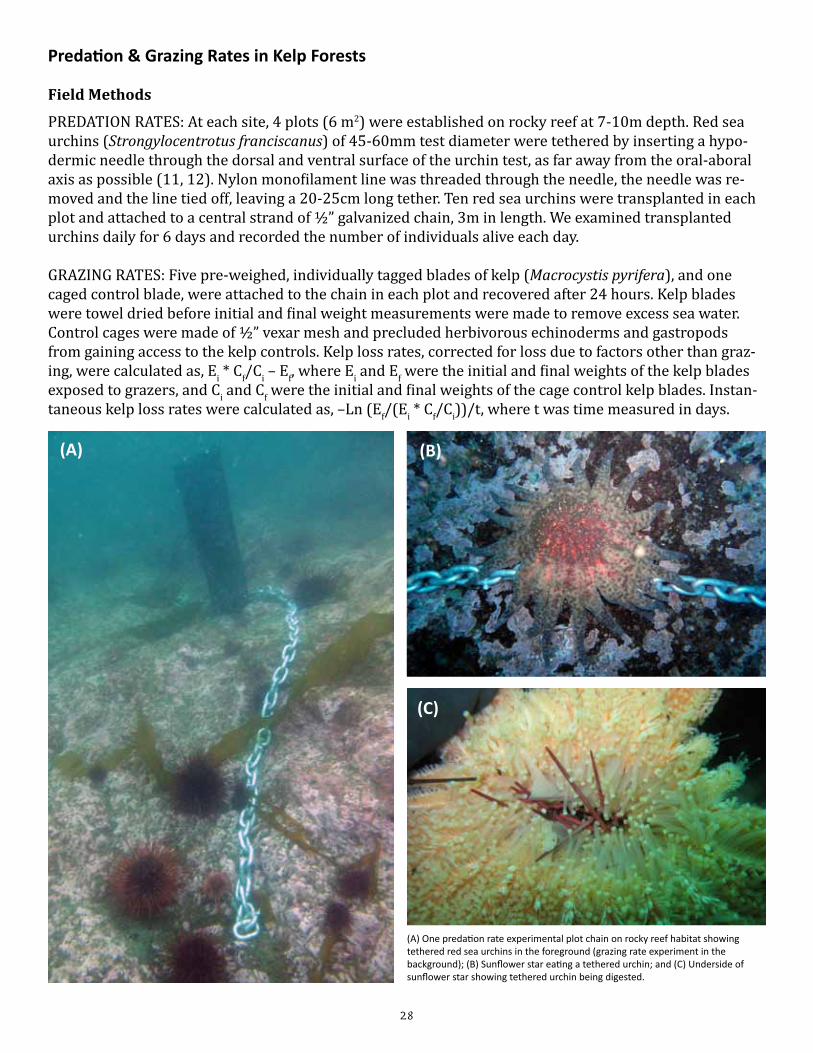
PREDATION RATES: At each site, 4 plots (6 m2) were established on rocky reef at 7-10m depth. Red sea urchins (Strongylocentrotus franciscanus) of 45-60mm test diameter were tethered by inserting a hypo-dermic needle through the dorsal and ventral surface of the urchin test, as far away from the oral-aboral axis as possible (11, 12). Nylon monofilament line was threaded through the needle, the needle was re-moved and the line tied off, leaving a 20-25cm long tether. Ten red sea urchins were transplanted in each plot and attached to a central strand of ½” galvanized chain, 3m in length. We examined transplanted urchins daily for 6 days and recorded the number of individuals alive each day.
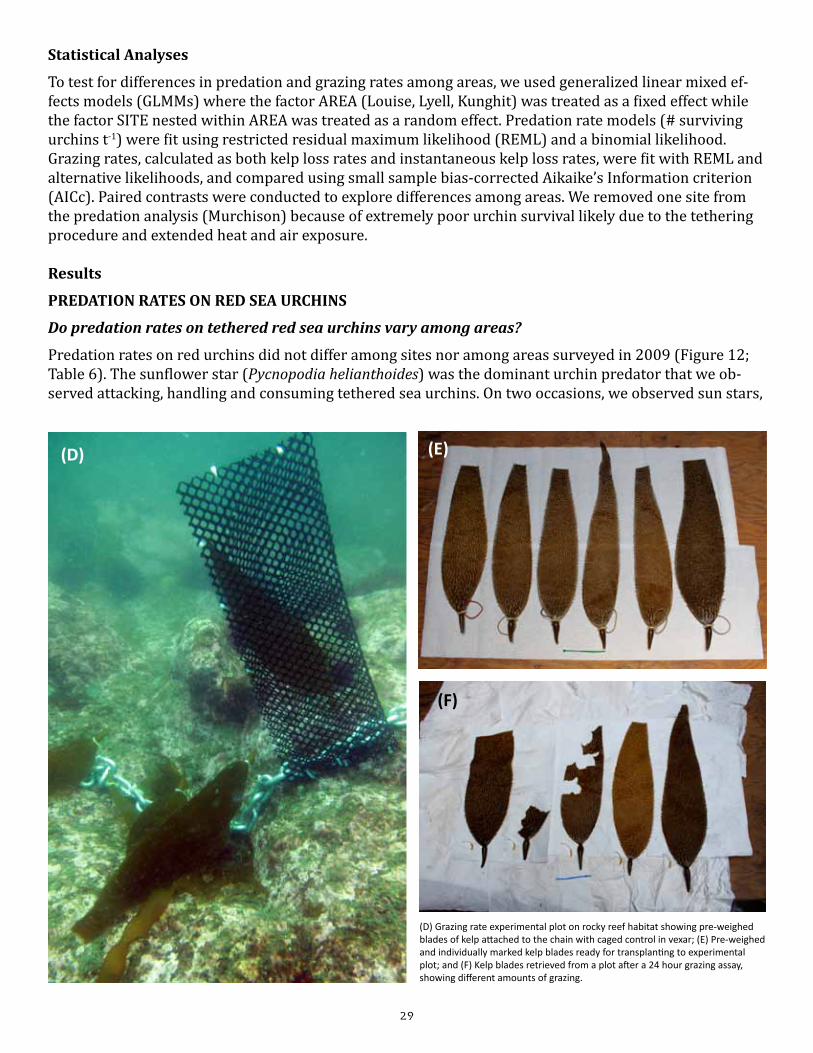
GRAZING RATES: Five pre-weighed, individually tagged blades of kelp (Macrocystis pyrifera), and one caged control blade, were attached to the chain in each plot and recovered after 24 hours. Kelp blades were towel dried before initial and final weight measurements were made to remove excess sea water. Control cages were made of ½” vexar mesh and precluded herbivorous echinoderms and gastropods from gaining access to the kelp controls. Kelp loss rates, corrected for loss due to factors other than graz-ing, were calculated as, Ei * Cf/Ci – Ef, where Ei and Ef were the initial and final weights of the kelp blades exposed to grazers, and Ci and Cf were the initial and final weights of the cage control kelp blades. Instan-taneous kelp loss rates were calculated as, –Ln (Ef/(Ei * Cf/Ci))/t, where t was time measured in days.
(A) One predation rate experimental plot chain on rocky reef habitat showing tethered red sea urchins in the foreground (grazing rate experiment in the background); (B) Sunflower star eating a tethered urchin; and (C) Underside of sunflower star showing tethered urchin being digested.
(B)
(C)
(A)
29
Statistical Analyses
To test for differences in predation and grazing rates among areas, we used generalized linear mixed ef-fects models (GLMMs) where the factor AREA (Louise, Lyell, Kunghit) was treated as a fixed effect while the factor SITE nested within AREA was treated as a random effect. Predation rate models (# surviving urchins t-1) were fit using restricted residual maximum likelihood (REML) and a binomial likelihood. Grazing rates, calculated as both kelp loss rates and instantaneous kelp loss rates, were fit with REML and alternative likelihoods, and compared using small sample bias-corrected Aikaike’s Information criterion (AICc). Paired contrasts were conducted to explore differences among areas. We removed one site from the predation analysis (Murchison) because of extremely poor urchin survival likely due to the tethering procedure and extended heat and air exposure.
Results
PREDATION RATES ON RED SEA URCHINS
Do predation rates on tethered red sea urchins vary among areas?
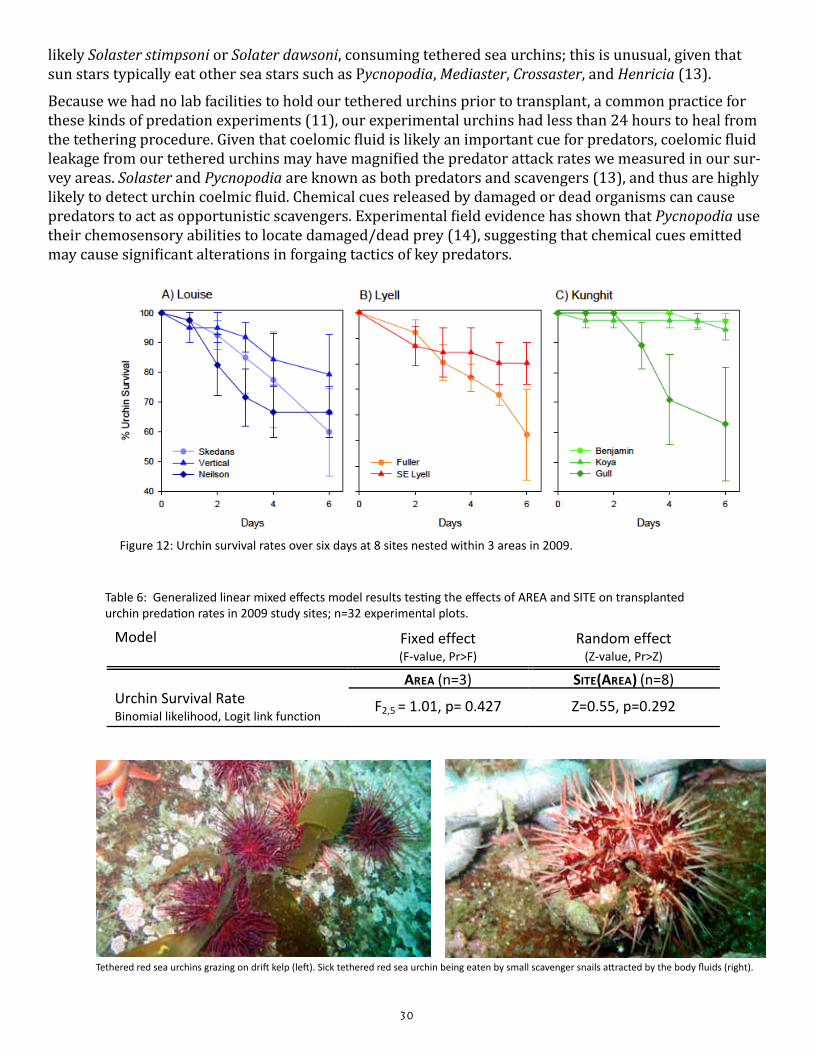
Predation rates on red urchins did not differ among sites nor among areas surveyed in 2009 (Figure 12; Table 6). The sunflower star (Pycnopodia helianthoides) was the dominant urchin predator that we ob-served attacking, handling and consuming tethered sea urchins. On two occasions, we observed sun stars,
(D) Grazing rate experimental plot on rocky reef habitat showing pre-weighed blades of kelp attached to the chain with caged control in vexar; (E) Pre-weighed and individually marked kelp blades ready for transplanting to experimental plot; and (F) Kelp blades retrieved from a plot after a 24 hour grazing assay, showing different amounts of grazing.
(D)
(F)
(E)
30
likely Solaster stimpsoni or Solater dawsoni, consuming tethered sea urchins; this is unusual, given that sun stars typically eat other sea stars such as Pycnopodia, Mediaster, Crossaster, and Henricia (13).
Because we had no lab facilities to hold our tethered urchins prior to transplant, a common practice for these kinds of predation experiments (11), our experimental urchins had less than 24 hours to heal from the tethering procedure. Given that coelomic fluid is likely an important cue for predators, coelomic fluid leakage from our tethered urchins may have magnified the predator attack rates we measured in our sur-vey areas. Solaster and Pycnopodia are known as both predators and scavengers (13), and thus are highly likely to detect urchin coelmic fluid. Chemical cues released by damaged or dead organisms can cause predators to act as opportunistic scavengers. Experimental field evidence has shown that Pycnopodia use their chemosensory abilities to locate damaged/dead prey (14), suggesting that chemical cues emitted may cause significant alterations in forgaing tactics of key predators.
Figure 12: Urchin survival rates over six days at 8 sites nested within 3 areas in 2009.
Model
Fixed effect (F-‐value, Pr>F)
Random effect (Z-‐value, Pr>Z)
AREA (n=3) SITE(AREA) (n=8) Urchin Survival Rate Binomial likelihood, Logit link function
F2,5 = 1.01, p= 0.427 Z=0.55, p=0.292
Table 6: Generalized linear mixed effects model results testing the effects of AREA and SITE on transplanted urchin predation rates in 2009 study sites; n=32 experimental plots.
Tethered red sea urchins grazing on drift kelp (left). Sick tethered red sea urchin being eaten by small scavenger snails attracted by the body fluids (right).
31
GRAZING RATES ON KELP
Do grazing rates on kelp vary among sites and areas?
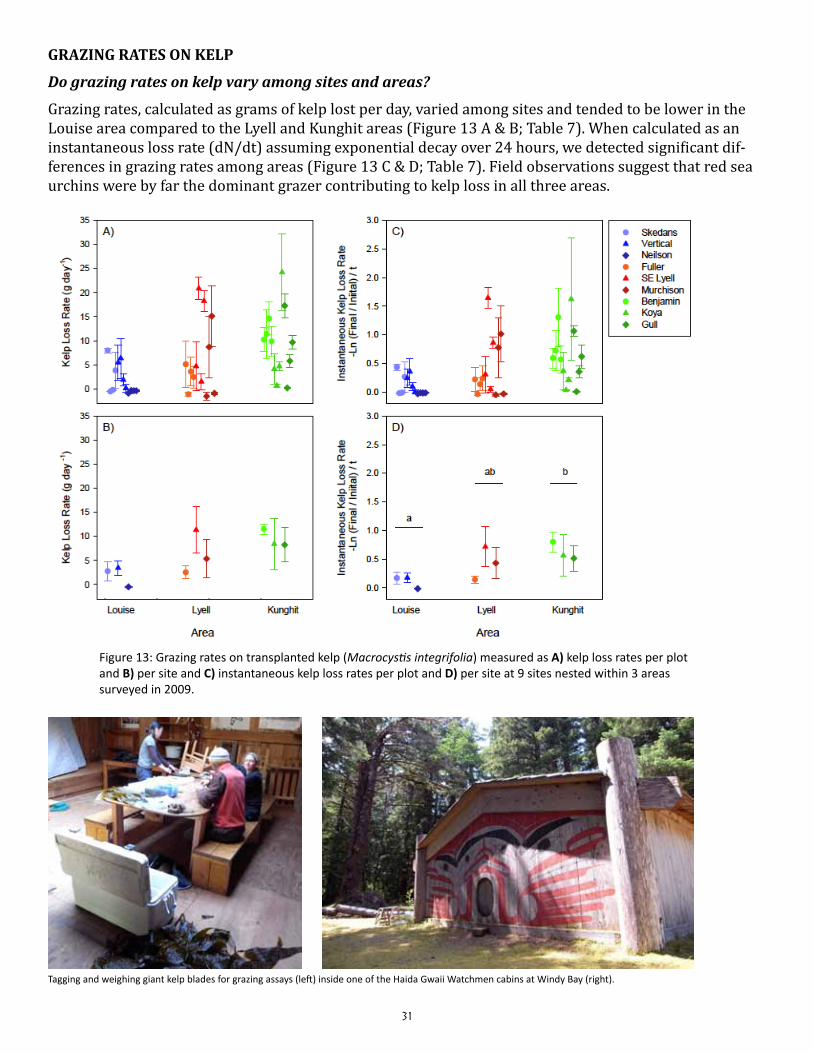
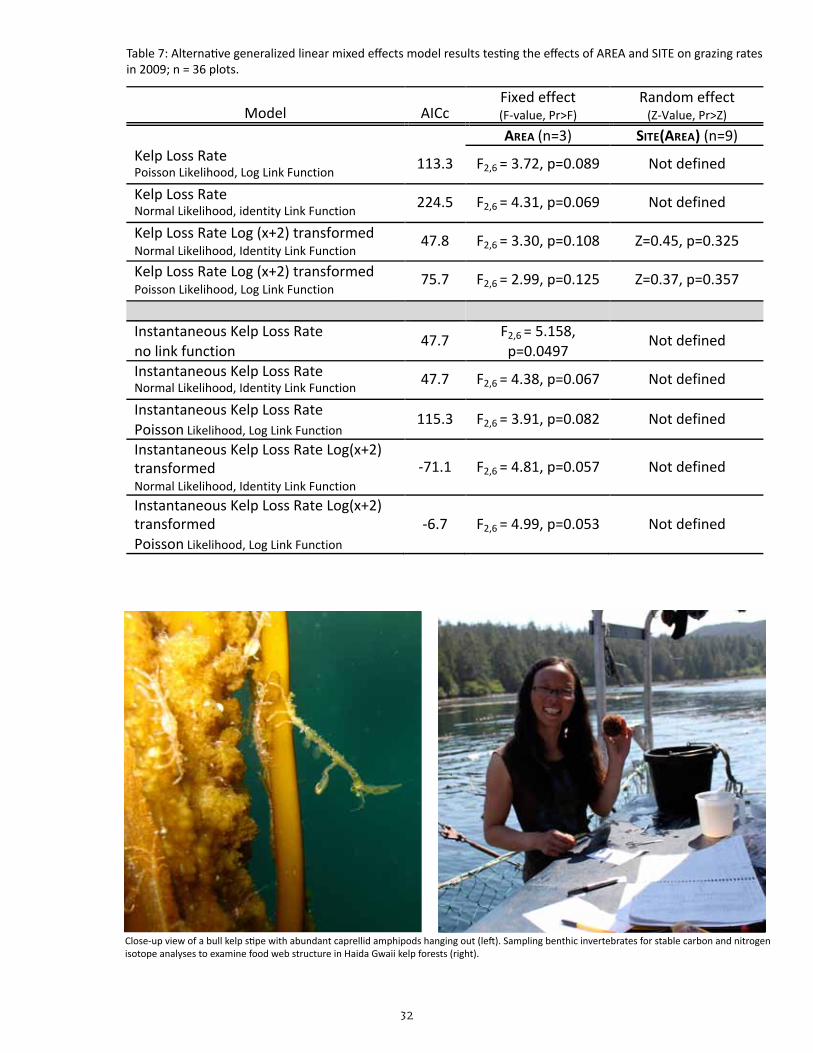
Grazing rates, calculated as grams of kelp lost per day, varied among sites and tended to be lower in the Louise area compared to the Lyell and Kunghit areas (Figure 13 A & B; Table 7). When calculated as an instantaneous loss rate (dN/dt) assuming exponential decay over 24 hours, we detected significant dif-ferences in grazing rates among areas (Figure 13 C & D; Table 7). Field observations suggest that red sea urchins were by far the dominant grazer contributing to kelp loss in all three areas.
Figure 13: Grazing rates on transplanted kelp (Macrocystis integrifolia) measured as A) kelp loss rates per plot and B) per site and C) instantaneous kelp loss rates per plot and D) per site at 9 sites nested within 3 areas surveyed in 2009.
Tagging and weighing giant kelp blades for grazing assays (left) inside one of the Haida Gwaii Watchmen cabins at Windy Bay (right).
32
Model AICc Fixed effect (F-‐value, Pr>F)
Random effect
(Z-‐Value, Pr>Z) AREA (n=3) SITE(AREA) (n=9) Kelp Loss Rate Poisson Likelihood, Log Link Function 113.3 F2,6 = 3.72, p=0.089 Not defined
Kelp Loss Rate Normal Likelihood, identity Link Function 224.5 F2,6 = 4.31, p=0.069 Not defined
Kelp Loss Rate Log (x+2) transformed Normal Likelihood, Identity Link Function
47.8 F2,6 = 3.30, p=0.108 Z=0.45, p=0.325
Kelp Loss Rate Log (x+2) transformed Poisson Likelihood, Log Link Function
75.7 F2,6 = 2.99, p=0.125 Z=0.37, p=0.357
Instantaneous Kelp Loss Rate no link function
47.7 F2,6 = 5.158, p=0.0497
Not defined
Instantaneous Kelp Loss Rate Normal Likelihood, Identity Link Function 47.7 F2,6 = 4.38, p=0.067 Not defined
Instantaneous Kelp Loss Rate Poisson Likelihood, Log Link Function
115.3 F2,6 = 3.91, p=0.082 Not defined
Instantaneous Kelp Loss Rate Log(x+2) transformed Normal Likelihood, Identity Link Function
-‐71.1 F2,6 = 4.81, p=0.057 Not defined
Instantaneous Kelp Loss Rate Log(x+2) transformed Poisson Likelihood, Log Link Function
-‐6.7 F2,6 = 4.99, p=0.053 Not defined
Table 7: Alternative generalized linear mixed effects model results testing the effects of AREA and SITE on grazing rates in 2009; n = 36 plots.
Close-up view of a bull kelp stipe with abundant caprellid amphipods hanging out (left). Sampling benthic invertebrates for stable carbon and nitrogen isotope analyses to examine food web structure in Haida Gwaii kelp forests (right).
33
Assimilation of Kelp-derived Organic Carbon in Kelp Forest Food Webs
What is the structure of kelp forest food webs in Gwaii Haanas? Do consumers that inhabit kelp for-ests (i.e. purple and red sea urchins, sunflower sea stars, lingcod, copper rockfish) assimilate more kelp-derived organic carbon than those that inhabit urchin barrens?
To determine the structure of kelp forest food webs in Gwaii Haanas and the extent to which kelp-derived organic carbon is assimilated by upper trophic level consumers, we will quantify variation in the isotopic signatures (del 13C and del 15N) of the two major carbon sources, kelp (predominantly Nereocystis) and phytoplankton, known to enter rocky reef food webs either directly via grazing or indirectly via particu-late organic matter or dissolved organic matter. These carbon sources are known to have distinct isotopic signatures separated by ≥ 6‰.
At each of the nine sample sites, we collected replicate samples of each carbon source (kelp, phyto-plankton) and rocky reef consumers: red sea urchin (Strongylocentrotus franciscanus), purple sea urchin (Strongylocentrotus purpuratus), green sea urchin (Strongylocentrotus droebachiensis), sunflower sea star (Pycnopodia helianthoides), sun star (Solaster species), red turban snail (Astraea gibberosa), lingcod (Ophiodon elongatus), copper rockfish (Sebastes caurinus), quillback rockfish (Sebastes maliger), China rockfish (Sebastes nebulosus), black rockfish (Sebastes melanops), canary rockfish (Sebastes pinniger), kelp greenling (Hexagrammos decagrammus), and a selection of small benthic invertebrates. We will estimate the proportion of secondary production derived from carbon fixed by kelp versus phytoplankton with a hierarchical Bayesian isotopic mixing-model.
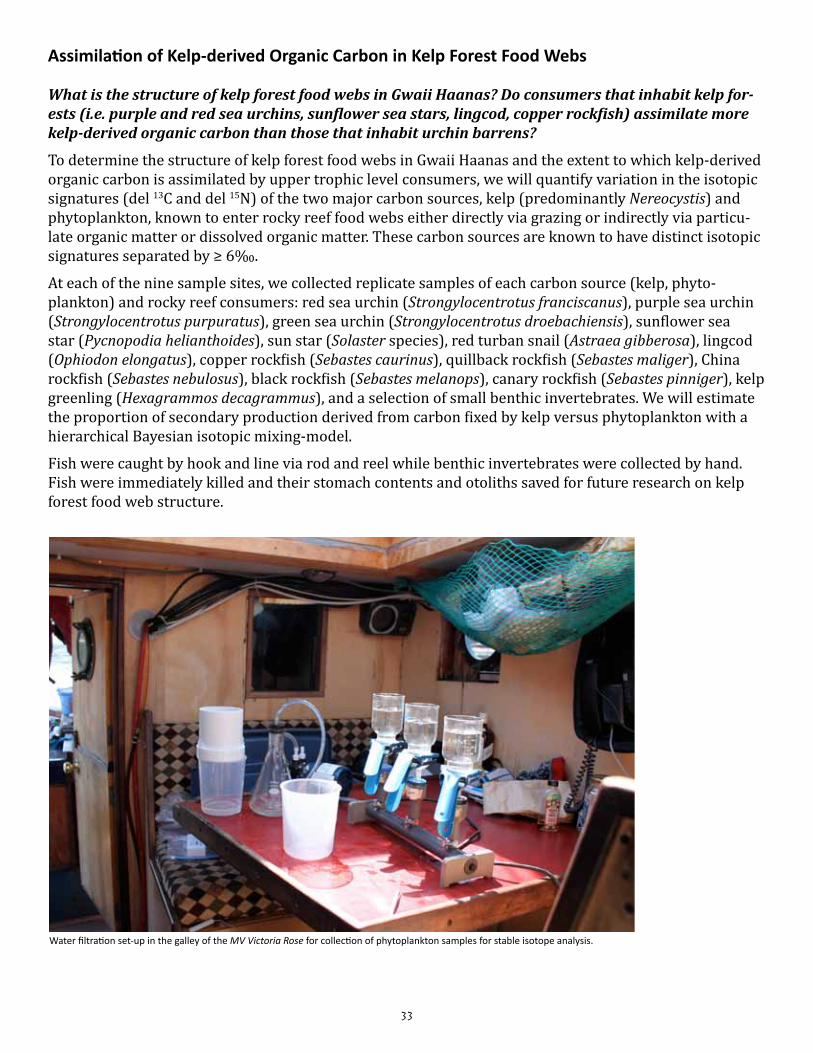
Fish were caught by hook and line via rod and reel while benthic invertebrates were collected by hand. Fish were immediately killed and their stomach contents and otoliths saved for future research on kelp forest food web structure.
Water filtration set-up in the galley of the MV Victoria Rose for collection of phytoplankton samples for stable isotope analysis.
34
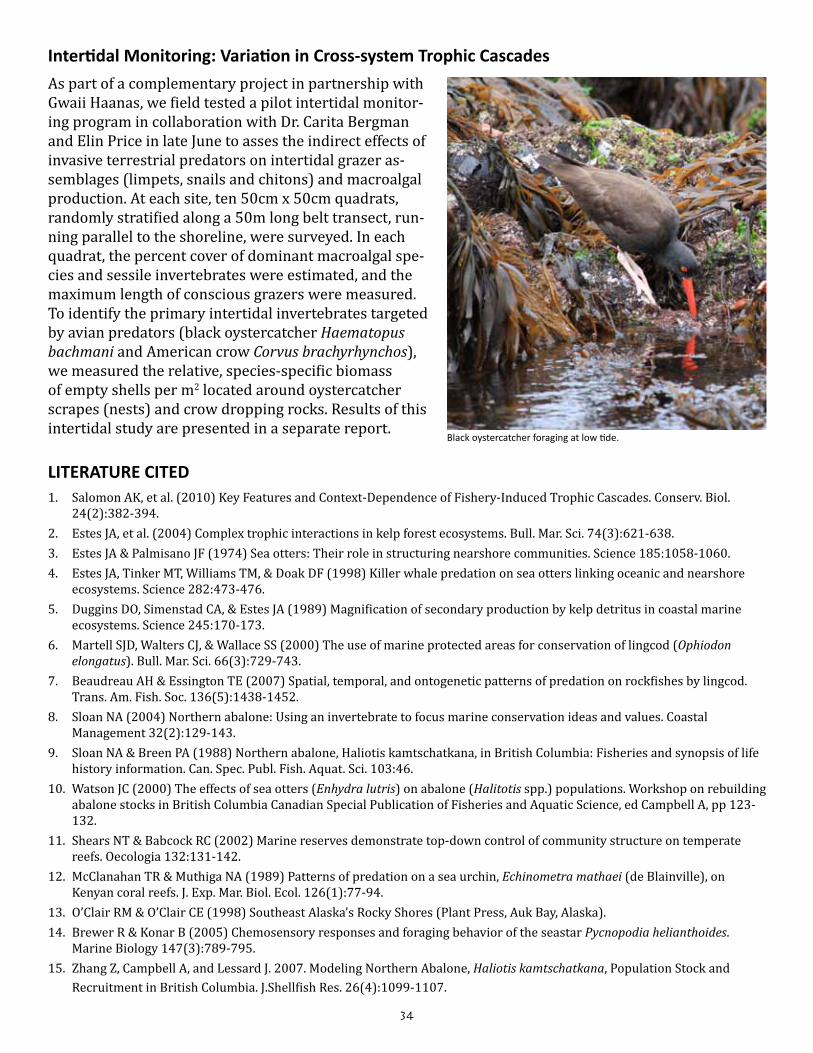
Intertidal Monitoring: Variation in Cross-system Trophic Cascades
As part of a complementary project in partnership with Gwaii Haanas, we field tested a pilot intertidal monitor-ing program in collaboration with Dr. Carita Bergman and Elin Price in late June to asses the indirect effects of invasive terrestrial predators on intertidal grazer as-semblages (limpets, snails and chitons) and macroalgal production. At each site, ten 50cm x 50cm quadrats, randomly stratified along a 50m long belt transect, run-ning parallel to the shoreline, were surveyed. In each quadrat, the percent cover of dominant macroalgal spe-cies and sessile invertebrates were estimated, and the maximum length of conscious grazers were measured. To identify the primary intertidal invertebrates targeted by avian predators (black oystercatcher Haematopus bachmani and American crow Corvus brachyrhynchos), we measured the relative, species-specific biomass of empty shells per m2 located around oystercatcher scrapes (nests) and crow dropping rocks. Results of this intertidal study are presented in a separate report.
LITERATURE CITED1. Salomon AK, et al. (2010) Key Features and Context-Dependence of Fishery-Induced Trophic Cascades. Conserv. Biol.
24(2):382-394.2. Estes JA, et al. (2004) Complex trophic interactions in kelp forest ecosystems. Bull. Mar. Sci. 74(3):621-638.3. Estes JA & Palmisano JF (1974) Sea otters: Their role in structuring nearshore communities. Science 185:1058-1060.4. Estes JA, Tinker MT, Williams TM, & Doak DF (1998) Killer whale predation on sea otters linking oceanic and nearshore
ecosystems. Science 282:473-476.5. Duggins DO, Simenstad CA, & Estes JA (1989) Magnification of secondary production by kelp detritus in coastal marine
ecosystems. Science 245:170-173.6. Martell SJD, Walters CJ, & Wallace SS (2000) The use of marine protected areas for conservation of lingcod (Ophiodon
elongatus). Bull. Mar. Sci. 66(3):729-743.7. Beaudreau AH & Essington TE (2007) Spatial, temporal, and ontogenetic patterns of predation on rockfishes by lingcod.
Trans. Am. Fish. Soc. 136(5):1438-1452.8. Sloan NA (2004) Northern abalone: Using an invertebrate to focus marine conservation ideas and values. Coastal
Management 32(2):129-143.9. Sloan NA & Breen PA (1988) Northern abalone, Haliotis kamtschatkana, in British Columbia: Fisheries and synopsis of life
history information. Can. Spec. Publ. Fish. Aquat. Sci. 103:46.10. Watson JC (2000) The effects of sea otters (Enhydra lutris) on abalone (Halitotis spp.) populations. Workshop on rebuilding
abalone stocks in British Columbia Canadian Special Publication of Fisheries and Aquatic Science, ed Campbell A, pp 123-132.
11. Shears NT & Babcock RC (2002) Marine reserves demonstrate top-down control of community structure on temperate reefs. Oecologia 132:131-142.
12. McClanahan TR & Muthiga NA (1989) Patterns of predation on a sea urchin, Echinometra mathaei (de Blainville), on Kenyan coral reefs. J. Exp. Mar. Biol. Ecol. 126(1):77-94.
13. O’Clair RM & O’Clair CE (1998) Southeast Alaska’s Rocky Shores (Plant Press, Auk Bay, Alaska).14. Brewer R & Konar B (2005) Chemosensory responses and foraging behavior of the seastar Pycnopodia helianthoides.
Marine Biology 147(3):789-795.15. Zhang Z, Campbell A, and Lessard J. 2007. Modeling Northern Abalone, Haliotis kamtschatkana, Population Stock and
Recruitment in British Columbia. J.Shellfish Res. 26(4):1099-1107.
Black oystercatcher foraging at low tide.
35
LIST OF APPENDICES
APPENDIX A. Health, Safety & Permits
APPENDIX TABLE B1. Benthic invertebrate counts by species by site in 2009 surveys
APPENDIX TABLE B2. Fish counts by species by site in 2009 surveys
APPENDIX TABLE C. Length-weight relationship parameters used to estimate biomass of benthic invertebrates and fish along belt transects and in quadrats in 2009 surveys
APPENDIX D1. Summary of Trip 1 field activites in 2009
APPENDIX D2. Summary of Trip 2 field activites in 2009
APPENDIX A. Health, Safety & Permits
AUTHORIZATIONS, PERMITS AND LICENSESCHN permission via the Haida Fisheries Committee, a DFO Scientific Collection Permit, Parks Canada Research Permit, and SFU Ani-mal Care Permit were obtained for the research prior to initiating field work.
COLLECTIONS MANAGEMENTIn the field, isotope samples during Trip 1 were kept in the freezer onboard the MV Victoria Rose: during Trip 2, samples were kept in the freezer at the wardens’ cabin on Ellen Island. Isotope samples are currently being housed and processed at the School of Re-source and Environmental Management, Simon Fraser University, by Dr. Anne Salomon, 778-782-8739, [email protected].
SITE CONSERVATION METHODSAll dive and experimental equipment was removed from each sample site at the end of survey activities. Remaining in the subtidal are site markers made up of salvaged net and rocks with a short float on a line for facilitating time-series monitoring of sites through future years.
SECURITYDuring the field work, all active sites were identified with a buoy marked RESEARCH with a contact phone number. All researchers adhered to the Canada Labour Code – Part II Occupational Health and Safety and Parks Canada Occupational Health and Safety Policy while conducting field work.
HEALTH AND SAFETYAll divers were certified science divers with recognized certifications (Canadian / American Association of Underwater Science Divers or Worksafe BC (Workman’s Compensation Board) certification). All divers had up to date first aid and O2 certifications. The dive plan was approved with the Diving and Safety Officer at SFU, Dr. Isabelle Cote, [email protected], 778-782-3705. The MV Victoria Rose, our research vessel, was equipped with a standard first aid and O2 kit.
POTENTIAL ADVERSE EFFECTS OF PROJECT ACTIVITIESAdverse effects of project activities were minimal:• Monitoring activities and targeted experiments did not negatively impact benthic invertebrates and habitats;• To our knowledge, no public concerns were expressed about our monitoring, experimental and fish sampling work;• In the field, we spoke to and informed charter operators from Rose Harbour, the Gwaii Haanas Watchmen, charter sailboats, and
independent vessels, about our activities and research work when they were present in the area; and• We additionally spoke to a group of inquisitive visitors about kelp forests and our research work when they visited Windy Bay
while we were weighing kelp for the grazing rate experiments.
A boy and his treasure trove of shore crab moults and those unfortunate enough to be caught in the heat of summer.
36
Skedans Ver*cal Nelson Fuller SELyell Murchison Benjamin Koya Gull
Bat star Asterina minita 6 0 0 0 2 3 1 0 0 0Red turban snail Astraea gibberosa 723 29 47 22 27 99 7 65 53 374Leafy hornmouth Ceratostoma foliatum 37 2 8 13 3 8 3 0 0 0Giant rock scallop Crassadoma gigantea 4 1 1 0 0 2 0 0 0 0Gumboot chiton Cryptochiton stelleri 15 3 1 8 0 1 1 0 1 0Leather star Dermasterias imbricata 45 0 4 2 3 11 0 4 10 11Rough keyhole limpet Diodora aspera 21 8 2 0 0 8 0 1 2 0MoEled star Evasterias troschelii 5 2 0 0 1 0 1 0 1 0Northern abalone Halio;s kamtschatkana 102 9 4 13 6 37 16 2 10 5Northern abalone shell
Shell of Halio;s kamtschatkana
38 1 1 5 4 1 1 9 10 6
Blood starHenricia leviuscula leviuscula
66 4 16 3 1 5 3 8 11 15
Six-‐rayed sea star Leptasterias sp. 1 0 0 0 0 0 0 0 1 0Vermilion star Mediaster aequalis 71 1 10 2 14 0 5 14 24 1Painted star Orthasterias koehleri 43 1 6 2 5 3 7 6 6 7Giant pink star Pisaster brevispinus 2 0 0 0 0 2 0 0 0 0
Sunflower starPycnopodia helianthoides
78 15 9 12 6 3 11 9 6 7
Sun star Solaster sp. 19 3 2 2 1 1 5 2 3 0
Red sea urchinStrongylocentrotus franciscanus
602 72 108 94 11 26 8 146 93 44
Green sea urchinStrongylocentrotus droebachiensis
5 0 1 2 0 1 1 0 0 0
Total counts along four 60m2 belt transect per site
Total counts in sixteen 1m2 quadrats per site
Louise Lyell KunghitBenthic Invertebrate Species Scien*fic Name TOTAL
Skedans Ver*cal Nelson Fuller SELyell Murchison Benjamin Koya Gull
Black rockfish Sebastes melanops 214 15 120 20 20 0 6 0 12 21Canary rockfish Sebastes pinniger 1 0 0 1 0 0 0 0 0 0China rockfish Sebastes nebulosus 28 1 3 4 2 1 10 0 3 4Copper rockfish Sebastes caurinus 54 7 16 4 8 2 7 6 3 1Puget sound rockfish Sebastes emphaeus 151 0 0 0 0 1 150 0 0 0Quillback rockfish Sebastes maliger 27 0 11 0 2 3 10 0 1 0Yellowtail rockfish Sebastes flavidus 2015 175 150 207 47 360 946 0 128 2
Cabezon Scorpaenichthys marmoratus
4 0 0 0 2 0 0 0 0 2
Kelp greenlingHexagrammos decagrammus
56 6 6 3 6 3 10 12 5 5
Lingcod Ophiodon elongatus 7 0 0 0 1 2 1 2 1 0Painted greenling Oxylebius pictus 4 0 2 0 2 0 0 0 0 0Striped perch Embiotoca lateralis 1 0 0 0 0 0 0 0 0 1
2562 204 308 239 90 372 1140 20 153 36
Fish Species Scien*fic Name TOTAL
Site totals for all fish species
Louise Lyell Kunghit
APPENDIX TABLE B1. Benthic invertebrate counts by species by site in 2009 surveys.
APPENDIX TABLE B2. Fish counts by species by site in 2009 surveys.
37
APPENDIX TABLE C. Length-weight relationship parameters used to estimate biomass of benthic invertebrates and fish along belt transects and in quadrats in 2009 surveys; weights in grams were calculated as: LW_a*(total length)^LW_b.
Urticina anemone blowing in the current (left). Two sori patches on a bull kelp blade filled with spores and ready to disperse (right). Sori are heavy enough to fall to the ocean floor, ensuring that spores settle close to parent plants on suitable substrate.
Species Scien(fic Name LW_a (TL) LW_bLength Unit Source (Loca(on)Benthic
Invertebrates
Red turban snail Astraea gibberosa 0.2544 3.1558 cmDr Rebecca Martone, UBC IRES (West Coast Vancovuer Island from Barkley Clayoquot & Kyuquot Sound); R² = 0.96131
Northern abalone Halio.s kamtschatkana 0.0000578 3.2 mm Zhang et al 2007; p1101 (BriXsh Columbia)
Sunflower star Pycnopodia helianthoides
0.017 3.1631 cmDr Anne Salomon, SFU REM (West Coast of Vancouver Island to California); R² = 0.98575
Red sea urchin Strongylocentrotus franciscanus
0.0005 2.9572 mmDr Anne Salomon, SFU REM (California); R² = 0.99789
FishesBlack rockfish Sebastes melanops 0.0211 3 cm www.fishbase.orgCanary rockfish Sebastes pinniger 0.0138 3 cm www.fishbase.orgChina rockfish Sebastes nebulosus 0.0225 3 cm www.fishbase.orgCopper rockfish Sebastes caurinus 0.0175 3 cm www.fishbase.orgDusky rockfish Sebastes ciliatus 0.0175 3 cm www.fishbase.orgPuget Sound rockfish Sebastes emphaeus 0.0588 2.687 cm www.fishbase.orgQuillback rockfish Sebastes maliger 0.0297 3 cm www.fishbase.orgYellowtail rockfish Sebastes flavidus 0.0151 3 cm www.fishbase.org
CabezonScorpaenichthys marmoratus
0.0291 3 cm www.fishbase.org
Kelp greenlingHexagrammos decagrammus
0.0156 3 cmpainted greenling parameters from www.fishbase.org
Lingcod Ophiodon elongatus 0.0133 3 cm www.fishbase.orgPainted greenling Oxylebius pictus 0.0156 3 cm www.fishbase.org
Striped perch Embiotoca lateralis 0.0231 2.971 cmroughly esXmated as average of parameters for all fish species
38
APPENDIX D1. Summary of Trip 1 field activities in 2009.
Trip 1: July 1st-14th (14 days) – Louise & Lyell Areas
Crew: Anne Salomon, principle investigator, SFU REM Lynn Lee, SFU REM PhD student Rowan Trebilco, SFU Biology PhD student Alejandro Frid, Vancouver Aquarium post-doctoral fellow Leandre Vigneault, MV Victoria Rose skipper, research diver Taimen Lee Vigneault, MV Victoria Rose deckhand
Date Area Site Weather Ac,vi,es
1-‐Jul-‐09 Sandspit sunny; moderate NE wind; choppy seas
Gear prepara=ons and loading onto MV Victoria Rose; choppy seas difficult for towing skiff; =ed up for the night in Sandspit
2-‐Jul-‐09 Louise Dass Pt sunny; moderate NE wind; choppy seas
MV Victoria and skiff running south to SE Lousie Island; dive near Ver=cal Point to colect red sea urchins (RSUs) for tethering experiment; tethered RSU late into the evening
3-‐Jul-‐09 Louise Skedans; Ver=cal; Nelson
Sunny; light westerlies
Louise site selec=on: (1) Skedans, (2) Ver=cal Pt, (3) Nelson Pt; dives at each site to find loca=on for preda=on and grazing rate experiments, set up chains and tether urchins
4-‐Jul-‐09 Louise Nelson; Ver=cal sunny; light SE winds
fish and benthic invertebrate transect surveys at each of the 3 sites; AS checked preda=on experiments; RT collected isotope samples; Taimen caught 2 canary rockfish including one with a lingcod aYached!
5-‐Jul-‐09 Louise Nelson; Skedans
sunny; light westerlies
fish and benthic invertebrate transect surveys finished at all 3 Louise sites; AS checked urchin preda=on experiments; RT collected isotope samples; isotope samples processed
6-‐Jul-‐09 Louise Skedans; Ver=cal; Nelson
rainy; light SE winds; thunder and lightning through the night
weighted kelp for grazing rate experiments at LBCS cabin on Limestone Island; AS & LV checked on preda=on experiments; RT collected isotope samples; grazing rate experiments placed underwater; fished for isotope samples; collected and filtered seawater for POM isotope analysis
7-‐Jul-‐09 Louise Skedans; Ver=cal; Nelson
overcast; light SE winds
picked up grazing rate experiments and weighed kelp at LBCS cabin at Laskeek Bay; finished collec=ng isotope samples; quan=fied dric kelp at experimental loca=ons; collected and tethered RSUs; seawater samples for POM analysis; motored south to ShuYle Island for the night
8-‐Jul-‐09 Lyell Fuller; SELyell; Murchison
sunny; light westerlies
located 3 Lyell sites; set up preda=on rate experiments; ran north back to Louise Island area
9-‐Jul-‐09 Louise Skedans; Ver=cal; Nelson
sunny, light easterlies
checked preda=on rate experiments; removed experimental sites at Lousie; head south to ShuYle Island for the night
10-‐Jul-‐09 Lyell Skedans; Ver=cal; Nelson
sunny, light easterlies
headed south to Murchison Island; checked preda=on rate experiments
11-‐Jul-‐09 Lyell Fuller; SELyell; Murchison
sunny; moderate NE winds
collected and weighted kelp blades for grazing rate experiments at Blinking All Around House at Windy Bay; set out grazing experiments at 3 Lyell sites
12-‐Jul-‐09 Lyell Fuller; SELyell; Murchison
sunny; light NE winds
LL collected abalone transect data at Fuller and SE Lyell; retrieved and weighed kelp blades at Windy Bay cabin
13-‐Jul-‐09 Lyell Fuller; SELyell; Murchison
sunny; light winds LL collected abalone transect data at all 3 sites; fished for isotope samples; collected quadrat data; checked preda=on rate experiments; water samples collected for POM analysis from Fuller and SE Lyell; isotope samples collected
14-‐Jul-‐09 Lyell Fuller; SELyell; Murchison
sunny; light winds checked preda=on rate experiments; removed experimental sites at Lyell; LL collected abalone transect data; headed to Moresby Camp to =e up un=l the next trip
15-‐Jul-‐09 Moresby Camp sunny; light winds RT & AF to the airport in Sandspit; unloading gear from MV Victoria Rose
39
APPENDIX D2. Summary of Trip 2 field activities.
Trip 2: July 20th-August 3rd (14 days) – Kunghit Area
Crew: Anne Salomon, principle investigator, SFU REM Lynn Lee, SFU REM PhD student Hannah Stewart, DFO researcher Eric White, volunteer research diver Leandre Vigneault, MV Victoria Rose skipper, research diver Taimen Lee Vigneault, MV Victoria Rose deckhand
Date Area Site Weather Ac,vi,es21-‐Jul-‐09 Moresby Camp light winds; calm
seasgear prepara>on and loading MV Victoria Rose at Moresby Camp; leave at 18:30h, south through Louise Narrows to ShuIle Island watering dock for the night, arriving 03:00h on 22-‐Jul
22-‐Jul-‐09 Kunghit travel south to Rose Harbour
light winds; calm seas
travel south to Rose Harbour, arriving at mooring buoy at 18:00h; lots of sea lions at Garcin Rocks
23-‐Jul-‐09 Kunghit Rose Harbour light winds; calm seas; drizzly rain
LL did HS's checkout dive at Fairfax Island; collected urchins for tethering experiment; tethered urchins through the aTernoon and evening; freezer troubles on VR so had to put food in freezer at Ellen Island cabin
24-‐Jul-‐09 Kunghit Benjamin; Koya; Gull
light winds; calm seas
located 3 sites in Kunghit area for seYng up preda>on experiments; Benjamin Pt -‐ extensive kelp forest with shallow-‐sloped rocky boIom, few fish noted; Koya Pt -‐ bedrock with boulder, steeper slope, few fish noted; Gull Pt -‐ steepest and most exposed of the 3 sites, sparse macroinvertebrate and fish life noted; TV caught fish for sampling
25-‐Jul-‐09 Kunghit Benjamin; Koya; Gull
sunny; light winds; calm seas
processed fish for isotopes, stomach samples and otoliths in the morning; fish and invertebrate belt transects completed at each site; urchin monitoring for preda>on experiments; lots of >de rip and current at Gull Pt, even on calm days
26-‐Jul-‐09 Kunghit Benjamin sunny; light winds; calm seas
took s>pe cross-‐sec>on from large Pterygophora at Benjamin Pt; collected kelp for tagging and weighing at Windy Bay Watchmen cabin
27-‐Jul-‐09 Kunghit Gull strong winds overnight & increasing; choppy seas; 50-‐60kt gusts
just made it out to Gull Pt to place grazing experiment; too rough by mid-‐morning to get to other sites; whipperwhirls on the water by Benjamin Pt; reconnaissance abalone dives and transects at Fairfax Is
28-‐Jul-‐09 Kunghit Benjamin; Koya; Gull
strong winds con>nuing; rough choppy seas
too rough and windy to head out in the morning; wind decreasing in the aTernoon; checked tethered urchins; placeed grazing ezperiments at Benjamin and Kpya; picked up grazing experiment at Gull; weighed kelp from Gull Pt at Ellen Is
29-‐Jul-‐09 Kunghit Benjamin; Koya light to moderate winds
picked up kelp from Benjamin and Koya; LL & AS weighed retrieved kelp at Ellen Is; EW sampling fish; LV & TV fishing for samples; LL sampled invertebrates for isotopes
30-‐Jul-‐09 Kunghit Benjamin; Koya; Gull
sunny; light winds; calm seas
last day of the preda>on experiment; checked urchins at all sites and pulled up the experimental plot chains; LL surveyed abalone transects; invertebrate samples collected; seawater samples taken from Benjamine and Koya; LL sampling fish; EW, TV & LV catching more fish samples
31-‐Jul-‐09 Kunghit Rose Harbour sunny; light winds; forecast to pick up to NW gales later today
water samples collected from Gull Pt; isotope samples sent to GH office via Island Air floatplane from Rose Hbr; cleared out food from Ellen Is cabin; head north tor Hotsprings Is, arriving 1500h; head north
1-‐Aug-‐09 Louise Skedans; Ver>cal; Nelson
sunny; light winds >e-‐up at ShuIle Is watering dock at 0200h for the night; head north for Moresby Camp at 1030h; abalone transets by LL, EW, HS and AS at Lousie Island sites; observed abalone and other invertebrate spawning event; warm surface waters; LV, EW & TV con>nued to Moresby Camp; arrived Moresby Camp ~1900h
HAAW’A | How.aaour appreciation to the many
wonderful helping hands who made this research happen!
with respect
yahgudang | yakguudang