Kellogg Companyinvestor.kelloggs.com/~/media/Files/K/Kellogg-IR/reports-and...Kellogg Company Page 2...
21
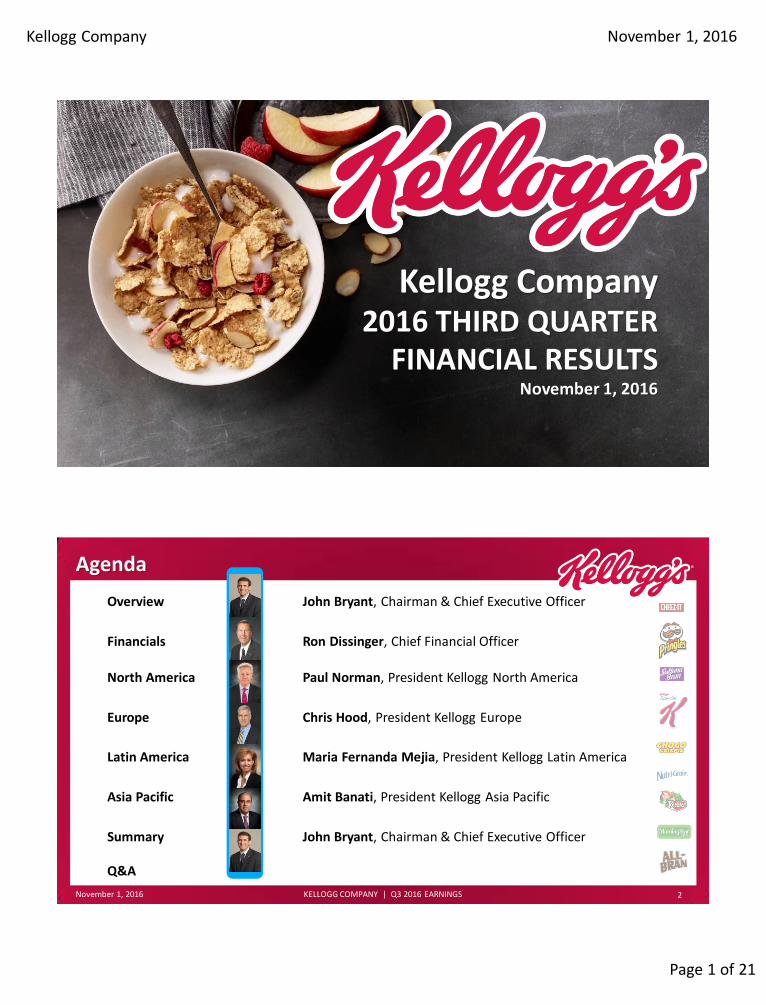
Kellogg Company Page 1 of 21 November 1, 2016 Kellogg Company 2016 THIRD QUARTER FINANCIAL RESULTS November 1, 2016 Agenda November 1, 2016 KELLOGG COMPANY | Q3 2016 EARNINGS Overview John Bryant, Chairman & Chief Executive Officer Financials Ron Dissinger, Chief Financial Officer North America Paul Norman, President Kellogg North America Europe Chris Hood, President Kellogg Europe Latin America Maria Fernanda Mejia, President Kellogg Latin America Asia Pacific Amit Banati, President Kellogg Asia Pacific Summary John Bryant, Chairman & Chief Executive Officer Q&A 2
-
Upload
truongcong -
Category
Documents
-
view
217 -
download
2
Transcript of Kellogg Companyinvestor.kelloggs.com/~/media/Files/K/Kellogg-IR/reports-and...Kellogg Company Page 2...
Kellogg Company
Page 1 of 21
November 1, 2016
Kellogg Company 2016 THIRD QUARTER
FINANCIAL RESULTS November 1, 2016
Agenda
November 1, 2016 KELLOGG COMPANY | Q3 2016 EARNINGS
Overview John Bryant, Chairman & Chief Executive Officer
Financials Ron Dissinger, Chief Financial Officer
North America Paul Norman, President Kellogg North America
Europe Chris Hood, President Kellogg Europe
Latin America Maria Fernanda Mejia, President Kellogg Latin America
Asia Pacific Amit Banati, President Kellogg Asia Pacific
Summary John Bryant, Chairman & Chief Executive Officer
Q&A
2
Kellogg Company
Page 2 of 21
November 1, 2016
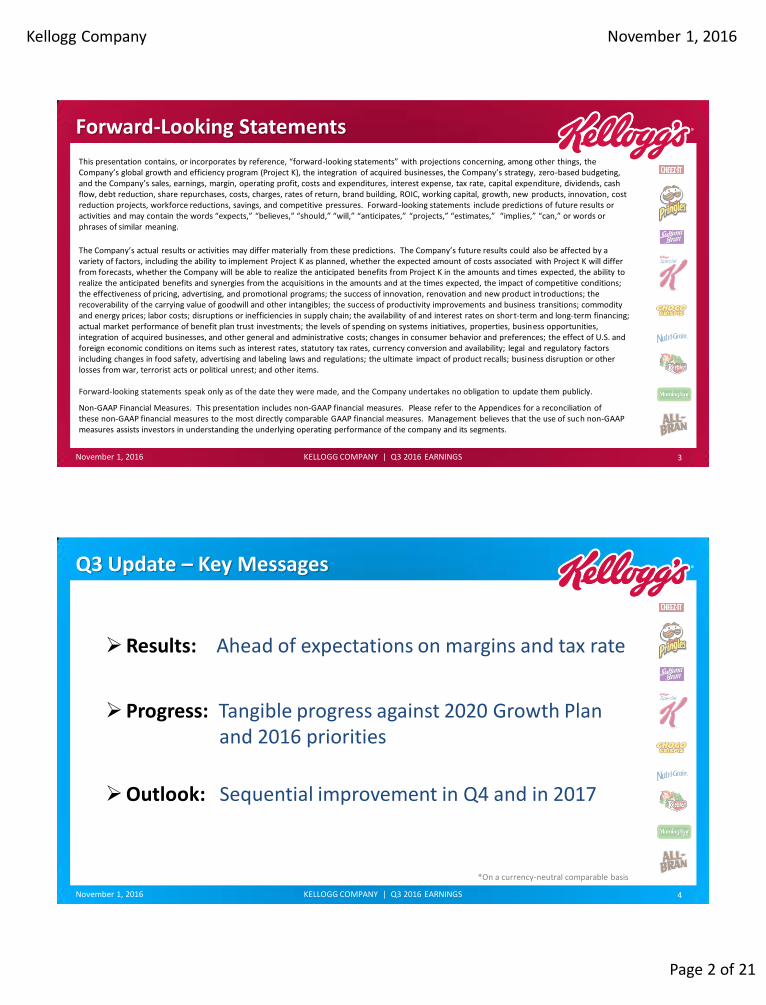
Forward-Looking Statements
This presentation contains, or incorporates by reference, “forward-looking statements” with projections concerning, among other things, the Company’s global growth and efficiency program (Project K), the integration of acquired businesses, the Company’s strategy, zero-based budgeting, and the Company’s sales, earnings, margin, operating profit, costs and expenditures, interest expense, tax rate, capital expenditure, dividends, cash flow, debt reduction, share repurchases, costs, charges, rates of return, brand building, ROIC, working capital, growth, new products, innovation, cost reduction projects, workforce reductions, savings, and competitive pressures. Forward-looking statements include predictions of future results or activities and may contain the words “expects,” “believes,” “should,” “will,” “anticipates,” “projects,” “estimates,” “implies,” “can,” or words or phrases of similar meaning.
The Company’s actual results or activities may differ materially from these predictions. The Company’s future results could also be affected by a variety of factors, including the ability to implement Project K as planned, whether the expected amount of costs associated with Project K will differ from forecasts, whether the Company will be able to realize the anticipated benefits from Project K in the amounts and times expected, the ability to realize the anticipated benefits and synergies from the acquisitions in the amounts and at the times expected, the impact of competitive conditions; the effectiveness of pricing, advertising, and promotional programs; the success of innovation, renovation and new product introductions; the recoverability of the carrying value of goodwill and other intangibles; the success of productivity improvements and business transitions; commodity and energy prices; labor costs; disruptions or inefficiencies in supply chain; the availability of and interest rates on short-term and long-term financing; actual market performance of benefit plan trust investments; the levels of spending on systems initiatives, properties, business opportunities, integration of acquired businesses, and other general and administrative costs; changes in consumer behavior and preferences; the effect of U.S. and foreign economic conditions on items such as interest rates, statutory tax rates, currency conversion and availability; legal and regulatory factors including changes in food safety, advertising and labeling laws and regulations; the ultimate impact of product recalls; business disruption or other losses from war, terrorist acts or political unrest; and other items. Forward-looking statements speak only as of the date they were made, and the Company undertakes no obligation to update them publicly.
Non-GAAP Financial Measures. This presentation includes non‐GAAP financial measures. Please refer to the Appendices for a reconciliation of these non‐GAAP financial measures to the most directly comparable GAAP financial measures. Management believes that the use of such non-GAAP measures assists investors in understanding the underlying operating performance of the company and its segments.
November 1, 2016 KELLOGG COMPANY | Q3 2016 EARNINGS 3
Q3 Update – Key Messages
*On a currency-neutral comparable basis
November 1, 2016 KELLOGG COMPANY | Q3 2016 EARNINGS
Results: Ahead of expectations on margins and tax rate
Progress: Tangible progress against 2020 Growth Plan and 2016 priorities
Outlook: Sequential improvement in Q4 and in 2017
4
Kellogg Company
Page 3 of 21
November 1, 2016
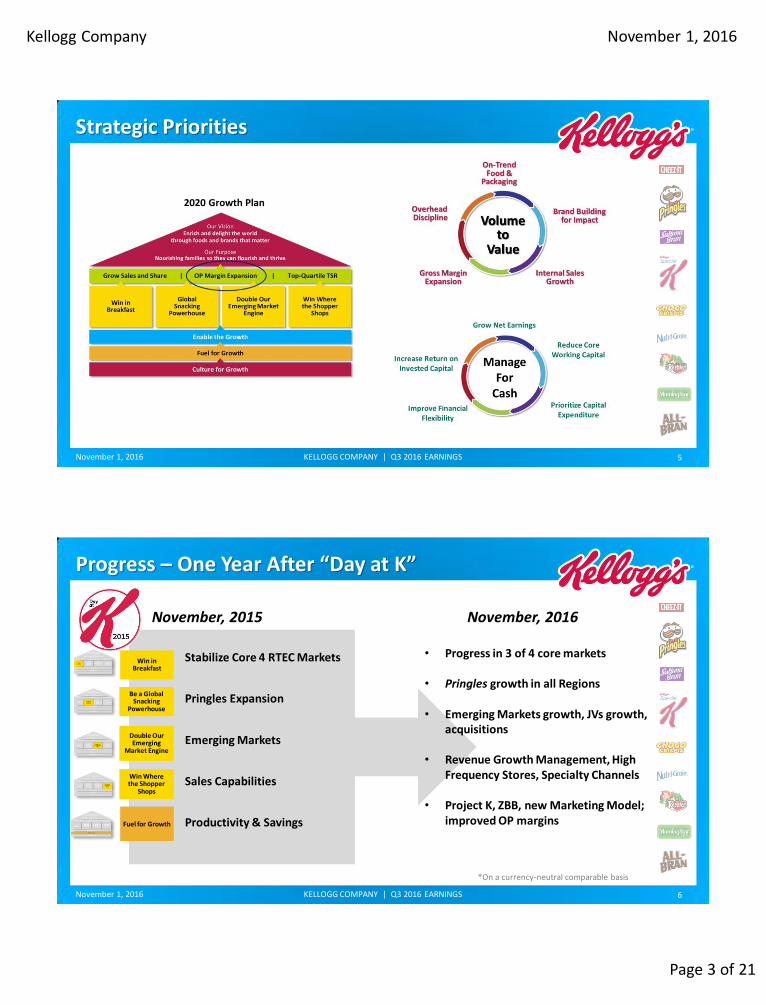
Strategic Priorities
November 1, 2016 KELLOGG COMPANY | Q3 2016 EARNINGS
2020 Growth Plan
5
Progress – One Year After “Day at K”
*On a currency-neutral comparable basis
November 1, 2016 KELLOGG COMPANY | Q3 2016 EARNINGS
November, 2015 November, 2016
• Stabilize Core 4 RTEC Markets
• Pringles Expansion
• Emerging Markets
• Sales Capabilities
• Productivity & Savings
• Progress in 3 of 4 core markets
• Pringles growth in all Regions
• Emerging Markets growth, JVs growth, acquisitions
• Revenue Growth Management, High Frequency Stores, Specialty Channels
• Project K, ZBB, new Marketing Model; improved OP margins
Be a Global Snacking
Powerhouse
Double Our Emerging
Market Engine
Win Where the Shopper
Shops
6
Win in Breakfast
Fuel for Growth
Kellogg Company
Page 4 of 21
November 1, 2016
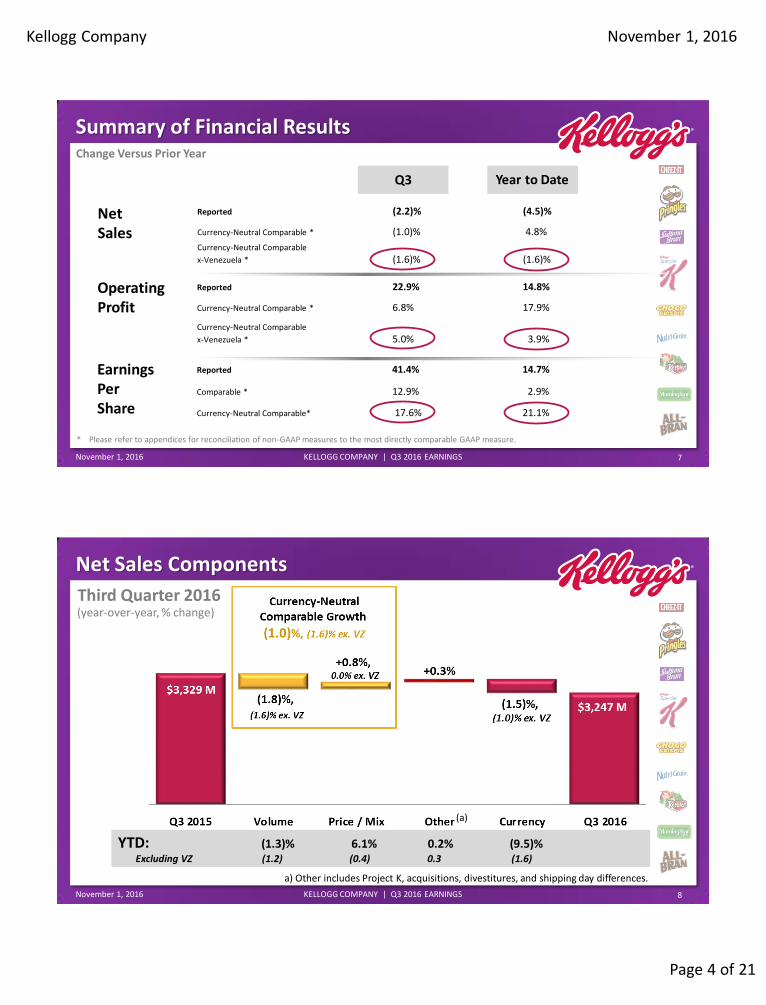
Summary of Financial Results
* Please refer to appendices for reconciliation of non-GAAP measures to the most directly comparable GAAP measure.
Change Versus Prior Year
November 1, 2016 KELLOGG COMPANY | Q3 2016 EARNINGS
Net Sales
Reported (2.2)% (4.5)%
Currency-Neutral Comparable * (1.0)% 4.8%
Currency-Neutral Comparable
x-Venezuela * (1.6)% (1.6)%
Operating Profit
Reported 22.9% 14.8%
Earnings Per Share
Reported 41.4% 14.7%
Comparable * 12.9% 2.9% Currency-Neutral Comparable* 17.6% 21.1%
Currency-Neutral Comparable * 6.8% 17.9%
Currency-Neutral Comparable
x-Venezuela * 5.0% 3.9%
Year to Date Q3
7
Net Sales Components
Third Quarter 2016
November 1, 2016 KELLOGG COMPANY | Q3 2016 EARNINGS
YTD: (1.3)% 6.1% 0.2% (9.5)% Excluding VZ (1.2) (0.4) 0.3 (1.6)
(year-over-year, % change)
a) Other includes Project K, acquisitions, divestitures, and shipping day differences.
(a)
8
Kellogg Company
Page 5 of 21
November 1, 2016
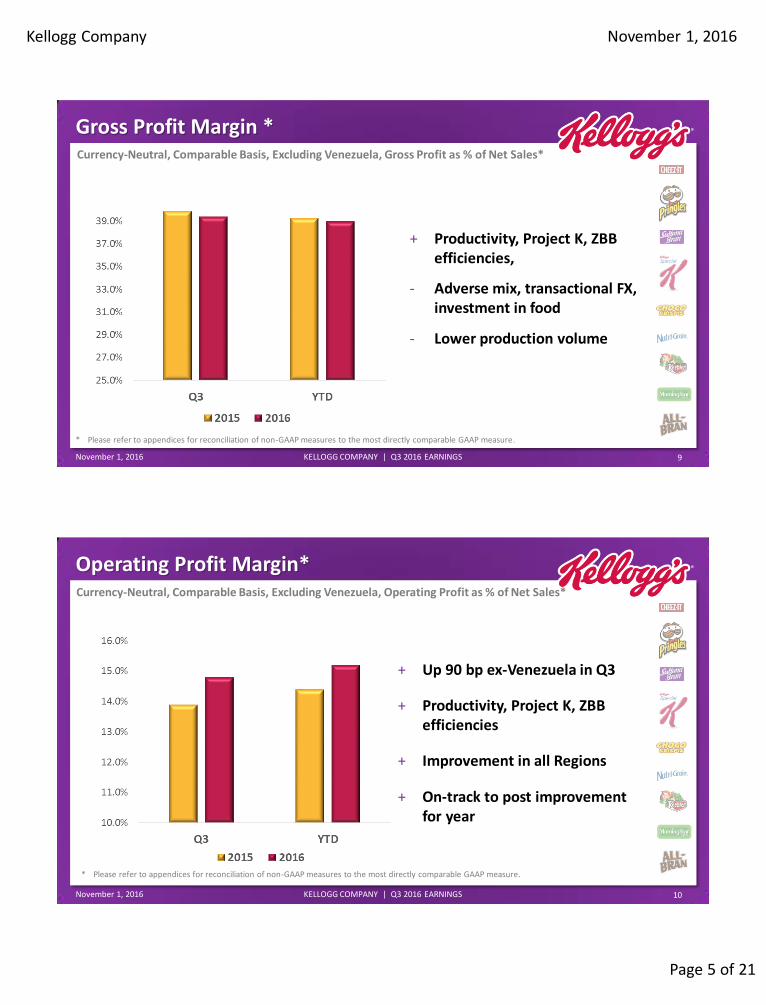
Gross Profit Margin *
* Please refer to appendices for reconciliation of non-GAAP measures to the most directly comparable GAAP measure.
November 1, 2016 KELLOGG COMPANY | Q3 2016 EARNINGS
Currency-Neutral, Comparable Basis, Excluding Venezuela, Gross Profit as % of Net Sales*
+ Productivity, Project K, ZBB efficiencies,
- Adverse mix, transactional FX, investment in food
- Lower production volume
9
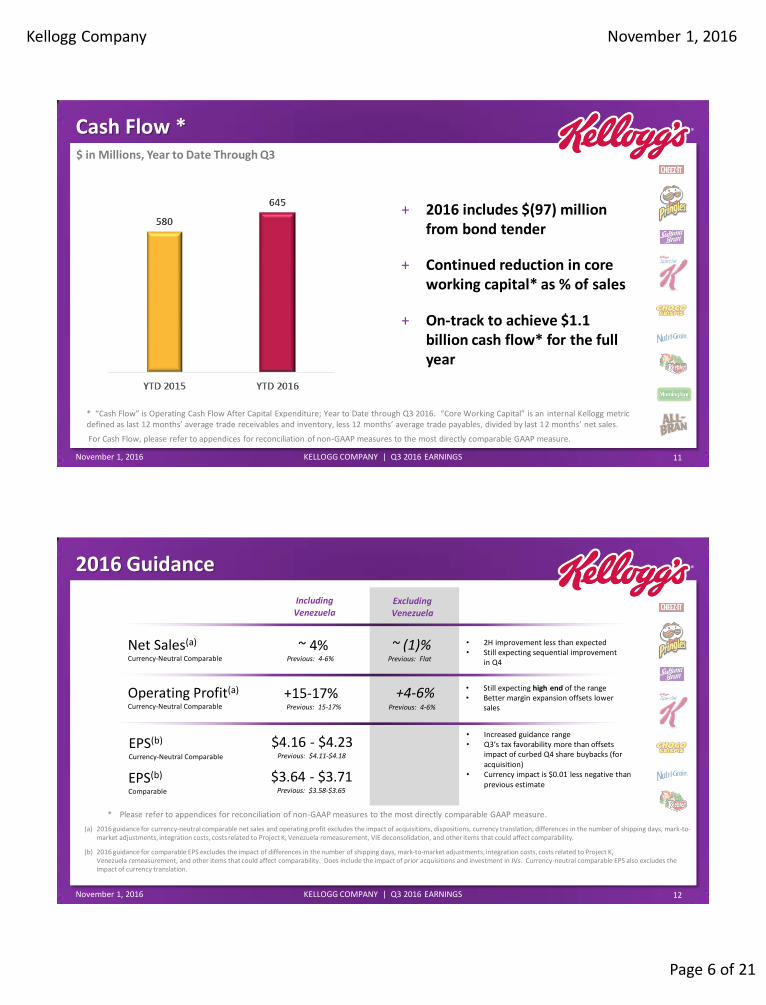
Operating Profit Margin*
* Please refer to appendices for reconciliation of non-GAAP measures to the most directly comparable GAAP measure.
+ Up 90 bp ex-Venezuela in Q3
+ Productivity, Project K, ZBB efficiencies
+ Improvement in all Regions
+ On-track to post improvement for year
November 1, 2016 KELLOGG COMPANY | Q3 2016 EARNINGS
Currency-Neutral, Comparable Basis, Excluding Venezuela, Operating Profit as % of Net Sales*
10
Kellogg Company
Page 6 of 21
November 1, 2016
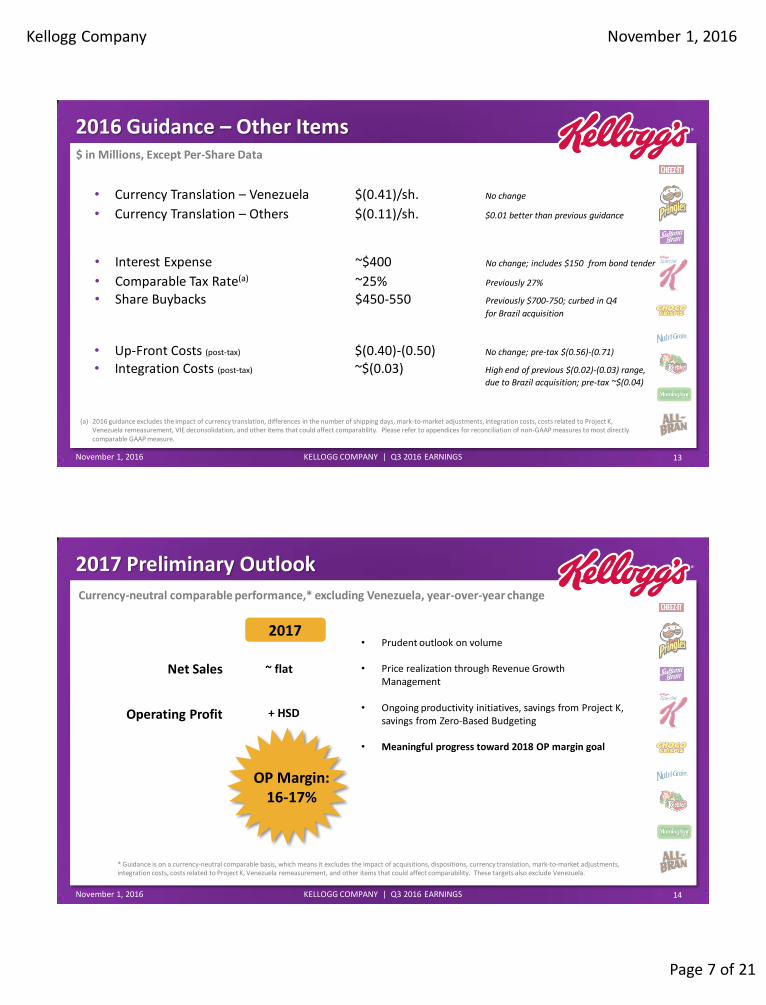
Cash Flow *
For Cash Flow, please refer to appendices for reconciliation of non-GAAP measures to the most directly comparable GAAP measure.
November 1, 2016 KELLOGG COMPANY | Q3 2016 EARNINGS
* “Cash Flow” is Operating Cash Flow After Capital Expenditure; Year to Date through Q3 2016. “Core Working Capital” is an internal Kellogg metric defined as last 12 months’ average trade receivables and inventory, less 12 months’ average trade payables, divided by last 12 months’ net sales.
$ in Millions, Year to Date Through Q3
+ 2016 includes $(97) million from bond tender
+ Continued reduction in core working capital* as % of sales
+ On-track to achieve $1.1 billion cash flow* for the full year
11
2016 Guidance
(a) 2016 guidance for currency-neutral comparable net sales and operating profit excludes the impact of acquisitions, dispositions, currency translation, differences in the number of shipping days, mark-to-market adjustments, integration costs, costs related to Project K, Venezuela remeasurement, VIE deconsolidation, and other items that could affect comparability.
(b) 2016 guidance for comparable EPS excludes the impact of differences in the number of shipping days, mark-to-market adjustments, integration costs, costs related to Project K, Venezuela remeasurement, and other items that could affect comparability. Does include the impact of prior acquisitions and investment in JVs. Currency-neutral comparable EPS also excludes the impact of currency translation.
November 1, 2016 KELLOGG COMPANY | Q3 2016 EARNINGS
EPS(b)
Currency-Neutral Comparable
Operating Profit(a)
Currency-Neutral Comparable
Net Sales(a)
Currency-Neutral Comparable
~ 4%
+15-17%
$4.16 - $4.23
~ (1)%
+4-6%
• 2H improvement less than expected • Still expecting sequential improvement
in Q4
• Still expecting high end of the range • Better margin expansion offsets lower
sales
Previous: Flat Previous: 4-6%
Previous: 4-6%
• Increased guidance range • Q3’s tax favorability more than offsets
impact of curbed Q4 share buybacks (for acquisition)
• Currency impact is $0.01 less negative than previous estimate
Previous: $4.11-$4.18
Previous: 15-17%
* Please refer to appendices for reconciliation of non-GAAP measures to the most directly comparable GAAP measure.
Excluding Venezuela
Including Venezuela
EPS(b)
Comparable
$3.64 - $3.71 Previous: $3.58-$3.65
12
Kellogg Company
Page 7 of 21
November 1, 2016
2016 Guidance – Other Items
(a) 2016 guidance excludes the impact of currency translation, differences in the number of shipping days, mark-to-market adjustments, integration costs, costs related to Project K, Venezuela remeasurement, VIE deconsolidation, and other items that could affect comparability. Please refer to appendices for reconciliation of non-GAAP measures to most directly comparable GAAP measure.
November 1, 2016 KELLOGG COMPANY | Q3 2016 EARNINGS
$ in Millions, Except Per-Share Data
• Currency Translation – Venezuela $(0.41)/sh. No change
• Currency Translation – Others $(0.11)/sh. $0.01 better than previous guidance
• Interest Expense ~$400 No change; includes $150 from bond tender
• Comparable Tax Rate(a) ~25% Previously 27%
• Share Buybacks $450-550 Previously $700-750; curbed in Q4
for Brazil acquisition
• Up-Front Costs (post-tax) $(0.40)-(0.50) No change; pre-tax $(0.56)-(0.71)
• Integration Costs (post-tax) ~$(0.03) High end of previous $(0.02)-(0.03) range,
due to Brazil acquisition; pre-tax ~$(0.04)
13
2017 Preliminary Outlook
November 1, 2016 KELLOGG COMPANY | Q3 2016 EARNINGS
Currency-neutral comparable performance,* excluding Venezuela, year-over-year change
Net Sales
Operating Profit
~ flat
+ HSD
2017
OP Margin: 16-17%
* Guidance is on a currency-neutral comparable basis, which means it excludes the impact of acquisitions, dispositions, currency translation, mark-to-market adjustments, integration costs, costs related to Project K, Venezuela remeasurement, and other items that could affect comparability. These targets also exclude Venezuela.
• Prudent outlook on volume
• Price realization through Revenue Growth Management
• Ongoing productivity initiatives, savings from Project K, savings from Zero-Based Budgeting
• Meaningful progress toward 2018 OP margin goal
14
Kellogg Company
Page 8 of 21
November 1, 2016
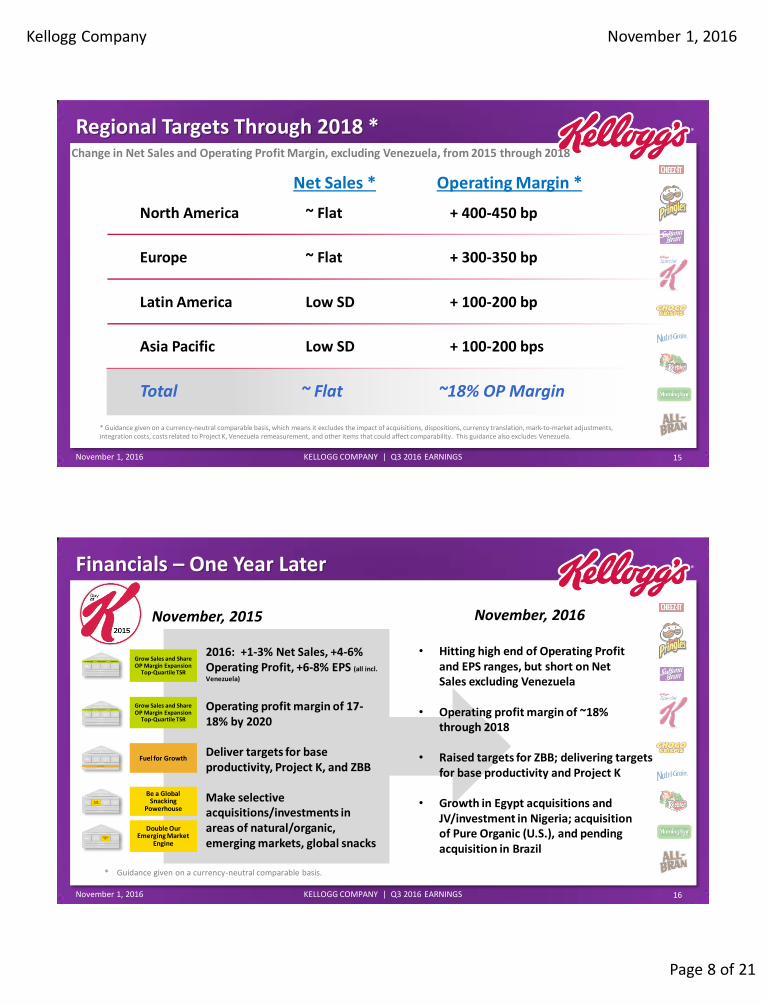
Regional Targets Through 2018 *
November 1, 2016 KELLOGG COMPANY | Q3 2016 EARNINGS
Change in Net Sales and Operating Profit Margin, excluding Venezuela, from 2015 through 2018
* Guidance given on a currency-neutral comparable basis, which means it excludes the impact of acquisitions, dispositions, currency translation, mark-to-market adjustments, integration costs, costs related to Project K, Venezuela remeasurement, and other items that could affect comparability. This guidance also excludes Venezuela.
15
North America
Europe
Latin America
Asia Pacific
~ Flat
~ Flat
Low SD
Low SD
+ 400-450 bp
+ 300-350 bp
+ 100-200 bp
+ 100-200 bps
Net Sales * Operating Margin *
Total ~ Flat ~18% OP Margin
Financials – One Year Later
* Guidance given on a currency-neutral comparable basis.
November 1, 2016 KELLOGG COMPANY | Q3 2016 EARNINGS
November, 2015 November, 2016
• 2016: +1-3% Net Sales, +4-6% Operating Profit, +6-8% EPS (all incl.
Venezuela)
• Operating profit margin of 17-
18% by 2020
• Deliver targets for base productivity, Project K, and ZBB
• Make selective acquisitions/investments in areas of natural/organic, emerging markets, global snacks
• Hitting high end of Operating Profit and EPS ranges, but short on Net Sales excluding Venezuela
• Operating profit margin of ~18% through 2018
• Raised targets for ZBB; delivering targets for base productivity and Project K
• Growth in Egypt acquisitions and JV/investment in Nigeria; acquisition of Pure Organic (U.S.), and pending acquisition in Brazil
Grow Sales and Share OP Margin Expansion
Top-Quartile TSR
Grow Sales and Share OP Margin Expansion
Top-Quartile TSR
Fuel for Growth
Be a Global Snacking
Powerhouse
Double Our Emerging Market
Engine
16
Kellogg Company
Page 9 of 21
November 1, 2016
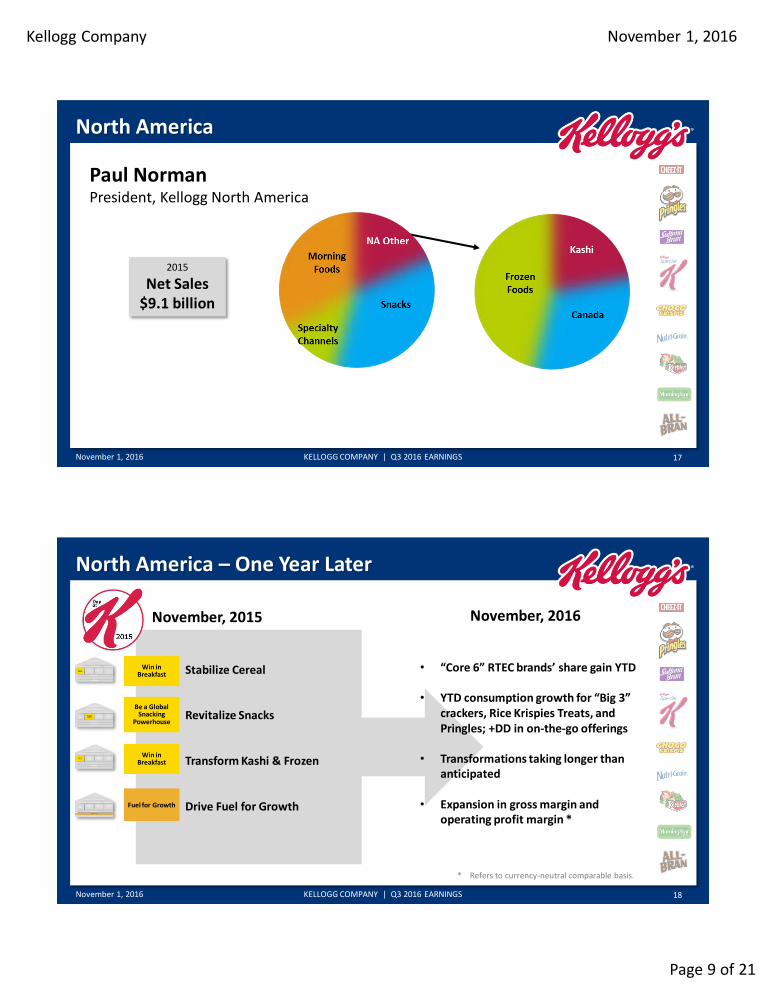
North America
November 1, 2016 KELLOGG COMPANY | Q3 2016 EARNINGS
Paul Norman President, Kellogg North America
2015
Net Sales $9.1 billion
17
North America – One Year Later
November 1, 2016 KELLOGG COMPANY | Q3 2016 EARNINGS
November, 2015 November, 2016
• Stabilize Cereal
• Revitalize Snacks
• Transform Kashi & Frozen
• Drive Fuel for Growth
• “Core 6” RTEC brands’ share gain YTD
• YTD consumption growth for “Big 3” crackers, Rice Krispies Treats, and Pringles; +DD in on-the-go offerings
• Transformations taking longer than anticipated
• Expansion in gross margin and operating profit margin *
Fuel for Growth
Win in Breakfast
Be a Global Snacking
Powerhouse
Win in Breakfast
18
* Refers to currency-neutral comparable basis.
Kellogg Company
Page 10 of 21
November 1, 2016
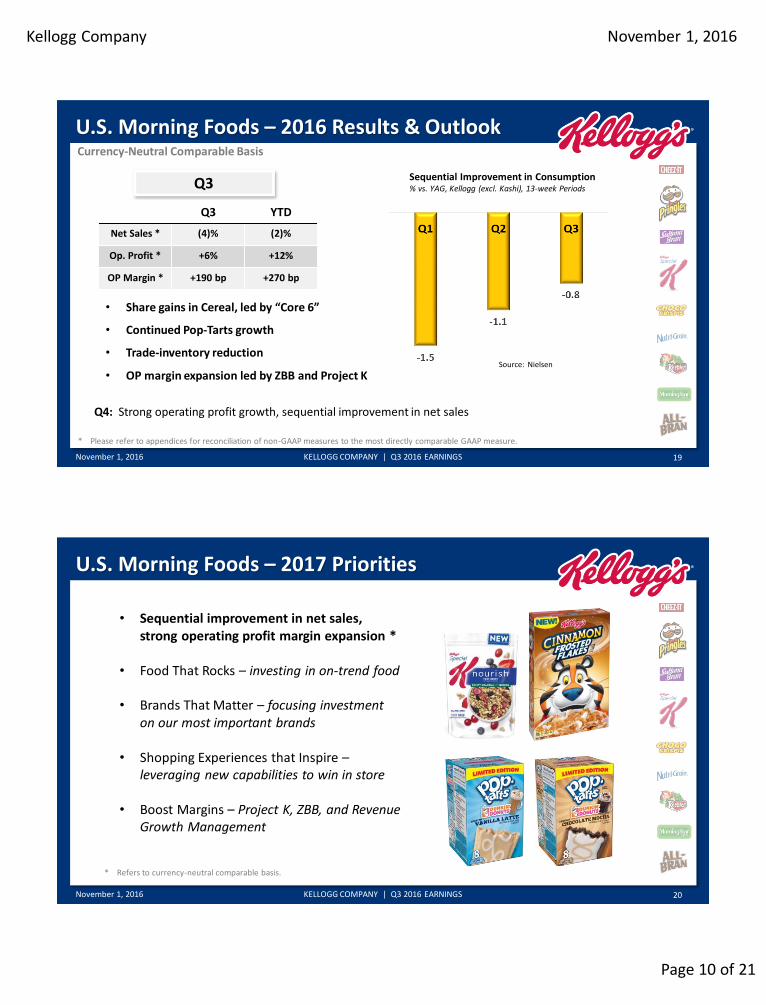
U.S. Morning Foods – 2016 Results & Outlook
November 1, 2016 KELLOGG COMPANY | Q3 2016 EARNINGS
Q3
• Share gains in Cereal, led by “Core 6”
• Continued Pop-Tarts growth
• Trade-inventory reduction
• OP margin expansion led by ZBB and Project K
Q3 YTD
Net Sales * (4)% (2)%
Op. Profit * +6% +12%
OP Margin * +190 bp +270 bp
* Please refer to appendices for reconciliation of non-GAAP measures to the most directly comparable GAAP measure.
Q4: Strong operating profit growth, sequential improvement in net sales
Source: Nielsen
Sequential Improvement in Consumption % vs. YAG, Kellogg (excl. Kashi), 13-week Periods
19
Currency-Neutral Comparable Basis
U.S. Morning Foods – 2017 Priorities
November 1, 2016 KELLOGG COMPANY | Q3 2016 EARNINGS
• Sequential improvement in net sales, strong operating profit margin expansion *
• Food That Rocks – investing in on-trend food
• Brands That Matter – focusing investment on our most important brands
• Shopping Experiences that Inspire –
leveraging new capabilities to win in store
• Boost Margins – Project K, ZBB, and Revenue Growth Management
20
* Refers to currency-neutral comparable basis.
Kellogg Company
Page 11 of 21
November 1, 2016
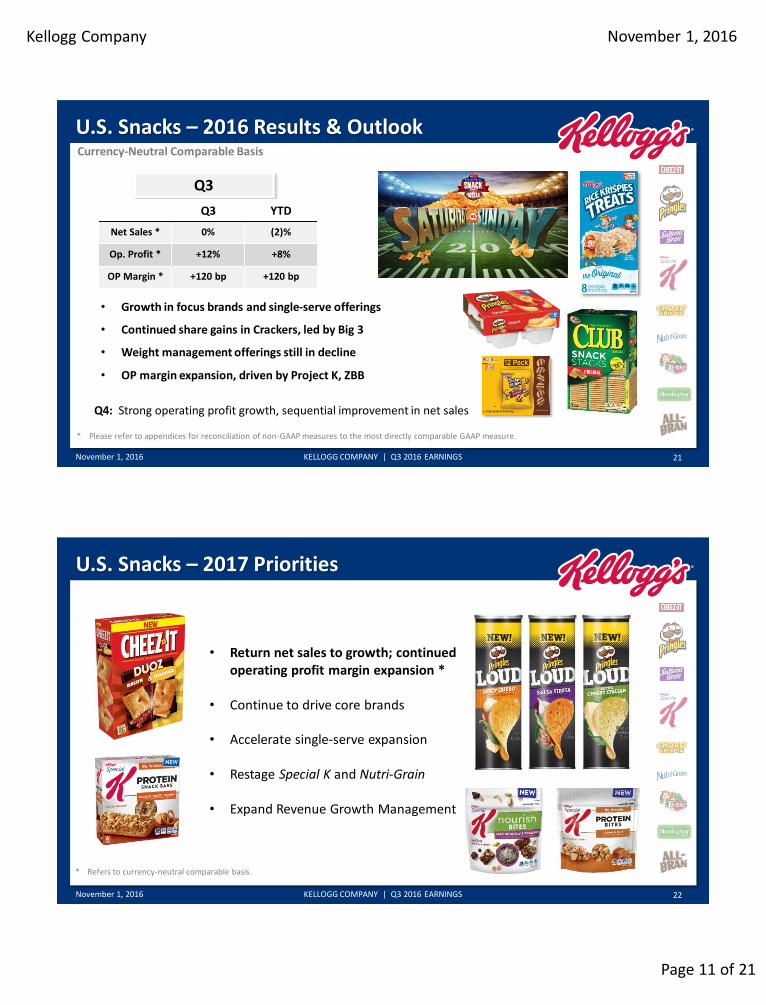
U.S. Snacks – 2016 Results & Outlook
November 1, 2016 KELLOGG COMPANY | Q3 2016 EARNINGS
Q3
• Growth in focus brands and single-serve offerings
• Continued share gains in Crackers, led by Big 3
• Weight management offerings still in decline
• OP margin expansion, driven by Project K, ZBB
Q3 YTD
Net Sales * 0% (2)%
Op. Profit * +12% +8%
OP Margin * +120 bp +120 bp
* Please refer to appendices for reconciliation of non-GAAP measures to the most directly comparable GAAP measure.
Q4: Strong operating profit growth, sequential improvement in net sales
21
Currency-Neutral Comparable Basis
U.S. Snacks – 2017 Priorities
November 1, 2016 KELLOGG COMPANY | Q3 2016 EARNINGS
• Return net sales to growth; continued operating profit margin expansion *
• Continue to drive core brands
• Accelerate single-serve expansion
• Restage Special K and Nutri-Grain
• Expand Revenue Growth Management
22
* Refers to currency-neutral comparable basis.
Kellogg Company
Page 12 of 21
November 1, 2016
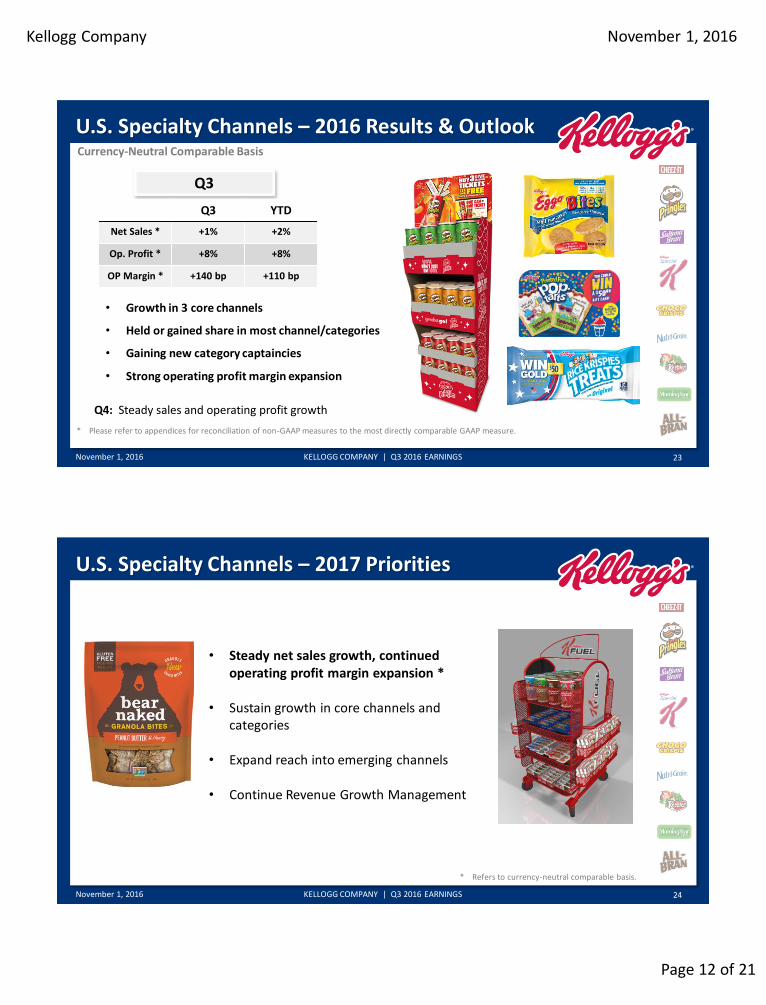
U.S. Specialty Channels – 2016 Results & Outlook
November 1, 2016 KELLOGG COMPANY | Q3 2016 EARNINGS
Q3
Q3 YTD
Net Sales * +1% +2%
Op. Profit * +8% +8%
OP Margin * +140 bp +110 bp
* Please refer to appendices for reconciliation of non-GAAP measures to the most directly comparable GAAP measure.
• Growth in 3 core channels
• Held or gained share in most channel/categories
• Gaining new category captaincies
• Strong operating profit margin expansion
Q4: Steady sales and operating profit growth
23
Currency-Neutral Comparable Basis
U.S. Specialty Channels – 2017 Priorities
November 1, 2016 KELLOGG COMPANY | Q3 2016 EARNINGS
• Steady net sales growth, continued operating profit margin expansion *
• Sustain growth in core channels and categories
• Expand reach into emerging channels
• Continue Revenue Growth Management
24
* Refers to currency-neutral comparable basis.
Kellogg Company
Page 13 of 21
November 1, 2016
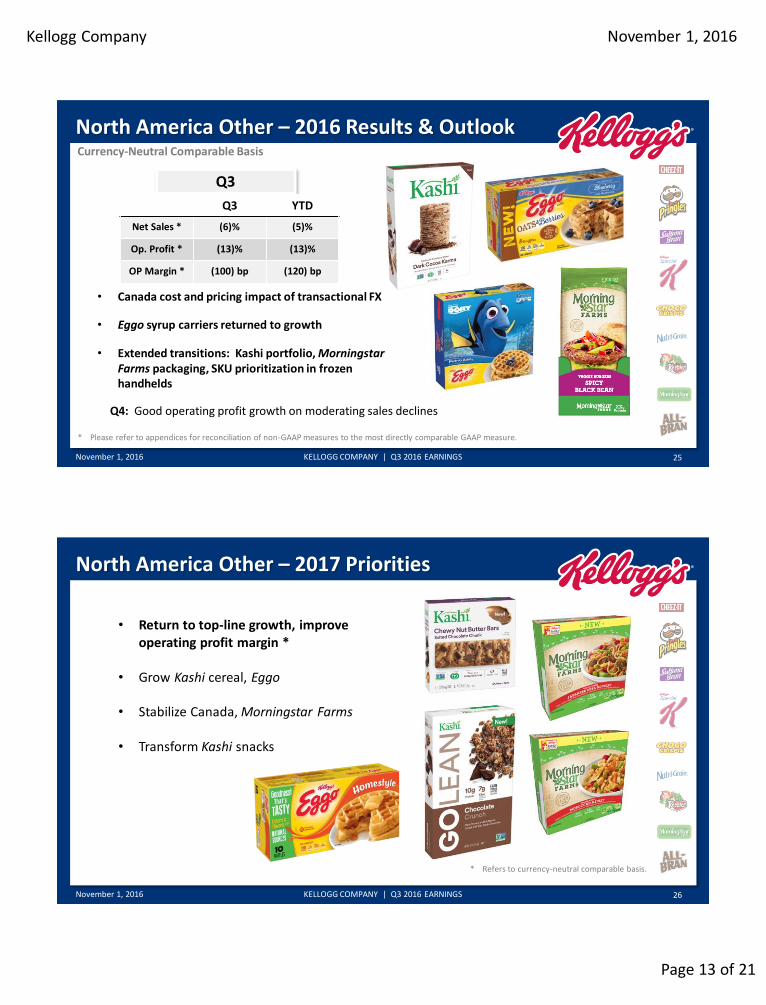
North America Other – 2016 Results & Outlook
November 1, 2016 KELLOGG COMPANY | Q3 2016 EARNINGS
Q3
• Canada cost and pricing impact of transactional FX
• Eggo syrup carriers returned to growth
• Extended transitions: Kashi portfolio, Morningstar Farms packaging, SKU prioritization in frozen handhelds
Q3 YTD
Net Sales * (6)% (5)%
Op. Profit * (13)% (13)%
OP Margin * (100) bp (120) bp
* Please refer to appendices for reconciliation of non-GAAP measures to the most directly comparable GAAP measure.
Q4: Good operating profit growth on moderating sales declines
25
Currency-Neutral Comparable Basis
North America Other – 2017 Priorities
November 1, 2016 KELLOGG COMPANY | Q3 2016 EARNINGS
• Return to top-line growth, improve operating profit margin *
• Grow Kashi cereal, Eggo
• Stabilize Canada, Morningstar Farms
• Transform Kashi snacks
26
* Refers to currency-neutral comparable basis.
Kellogg Company
Page 14 of 21
November 1, 2016
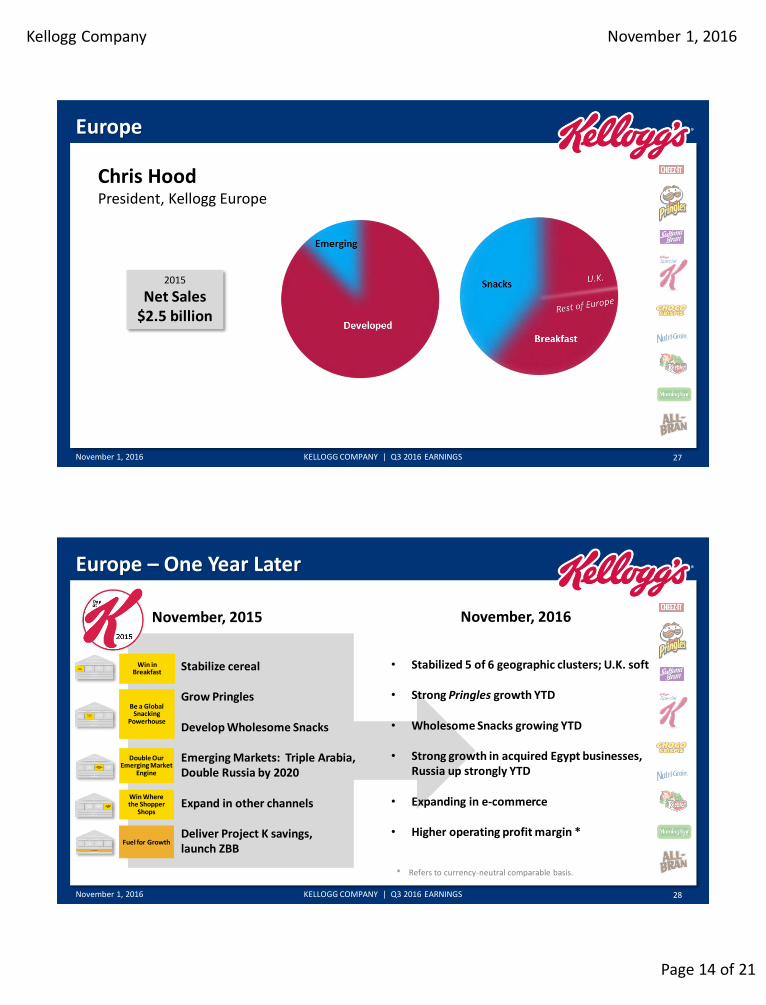
Europe
November 1, 2016 KELLOGG COMPANY | Q3 2016 EARNINGS
Chris Hood President, Kellogg Europe
2015
Net Sales $2.5 billion
27
Europe – One Year Later
November 1, 2016 KELLOGG COMPANY | Q3 2016 EARNINGS
November, 2015 November, 2016
• Stabilize cereal
• Grow Pringles
• Develop Wholesome Snacks
• Emerging Markets: Triple Arabia, Double Russia by 2020
• Expand in other channels
• Deliver Project K savings, launch ZBB
• Stabilized 5 of 6 geographic clusters; U.K. soft
• Strong Pringles growth YTD
• Wholesome Snacks growing YTD
• Strong growth in acquired Egypt businesses, Russia up strongly YTD
• Expanding in e-commerce
• Higher operating profit margin * Fuel for Growth
Be a Global Snacking
Powerhouse
Win in Breakfast
Double Our Emerging Market
Engine
Win Where the Shopper
Shops
28
* Refers to currency-neutral comparable basis.
Kellogg Company
Page 15 of 21
November 1, 2016
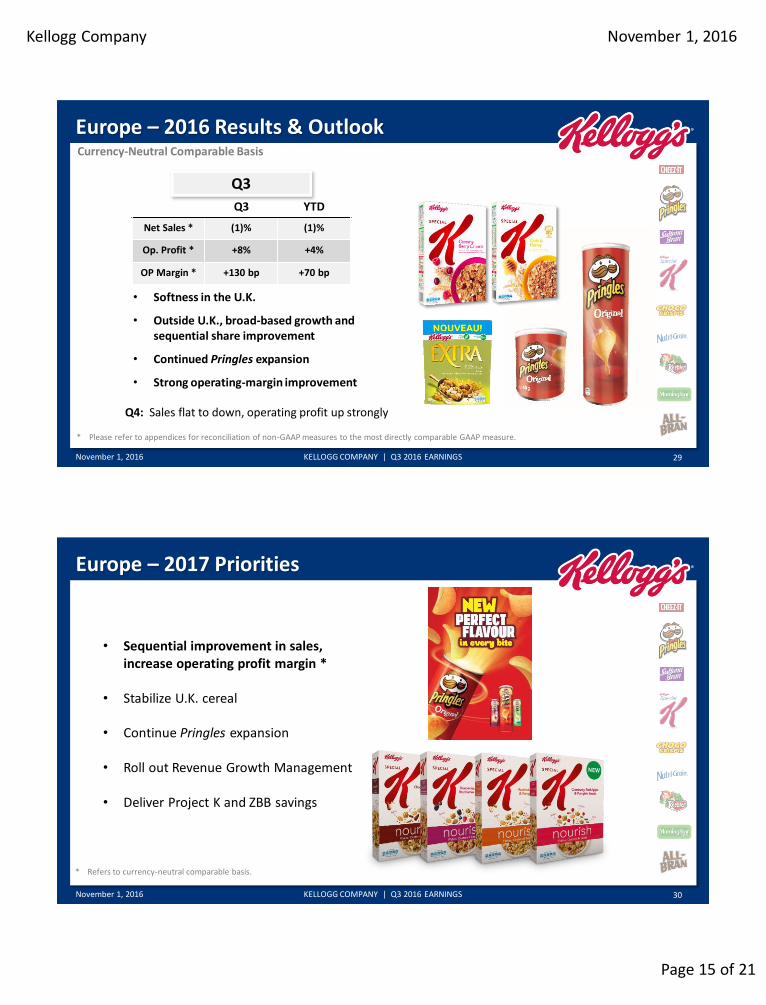
Europe – 2016 Results & Outlook
November 1, 2016 KELLOGG COMPANY | Q3 2016 EARNINGS
• Softness in the U.K.
• Outside U.K., broad-based growth and sequential share improvement
• Continued Pringles expansion
• Strong operating-margin improvement
Q3 YTD
Net Sales * (1)% (1)%
Op. Profit * +8% +4%
OP Margin * +130 bp +70 bp
* Please refer to appendices for reconciliation of non-GAAP measures to the most directly comparable GAAP measure.
Q4: Sales flat to down, operating profit up strongly
29
Currency-Neutral Comparable Basis
Q3
Europe – 2017 Priorities
November 1, 2016 KELLOGG COMPANY | Q3 2016 EARNINGS
• Sequential improvement in sales, increase operating profit margin *
• Stabilize U.K. cereal
• Continue Pringles expansion
• Roll out Revenue Growth Management
• Deliver Project K and ZBB savings
30
* Refers to currency-neutral comparable basis.
Kellogg Company
Page 16 of 21
November 1, 2016
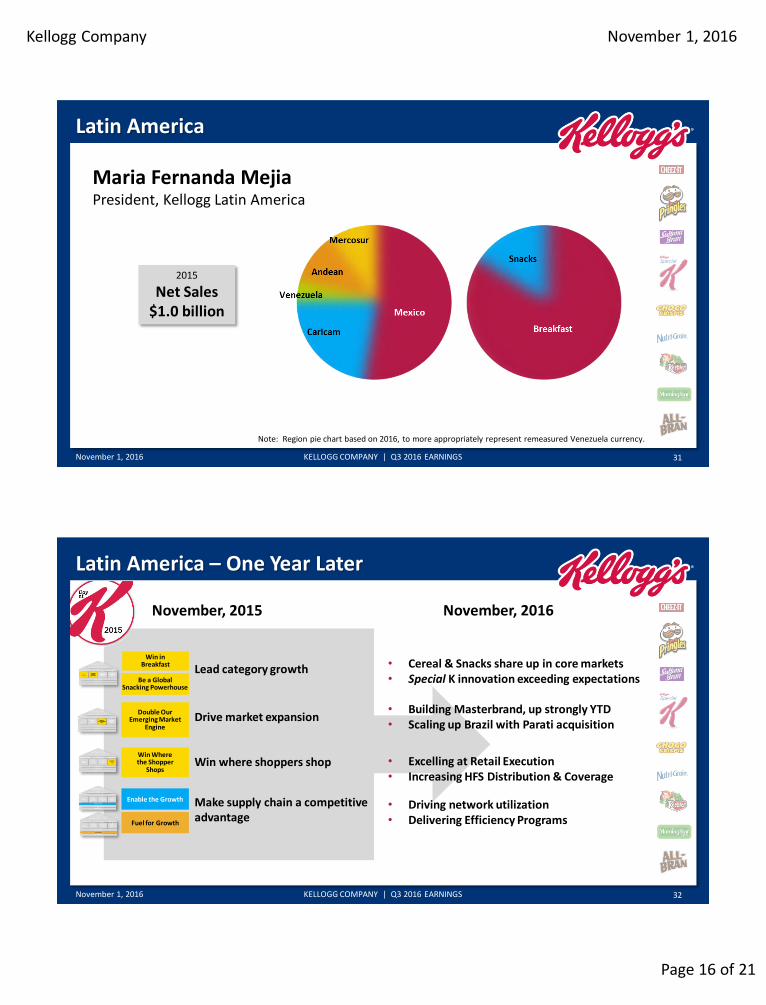
Latin America
November 1, 2016 KELLOGG COMPANY | Q3 2016 EARNINGS
Maria Fernanda Mejia President, Kellogg Latin America
2015
Net Sales $1.0 billion
Note: Region pie chart based on 2016, to more appropriately represent remeasured Venezuela currency.
31
Latin America – One Year Later
November 1, 2016 KELLOGG COMPANY | Q3 2016 EARNINGS
November, 2015 November, 2016
• Lead category growth
• Drive market expansion
• Win where shoppers shop
• Make supply chain a competitive advantage
• Cereal & Snacks share up in core markets • Special K innovation exceeding expectations
• Building Masterbrand, up strongly YTD • Scaling up Brazil with Parati acquisition
• Excelling at Retail Execution • Increasing HFS Distribution & Coverage
• Driving network utilization • Delivering Efficiency Programs
Win in Breakfast
Be a Global Snacking Powerhouse
Double Our Emerging Market
Engine
Win Where the Shopper
Shops
Enable the Growth
Fuel for Growth
32
Kellogg Company
Page 17 of 21
November 1, 2016
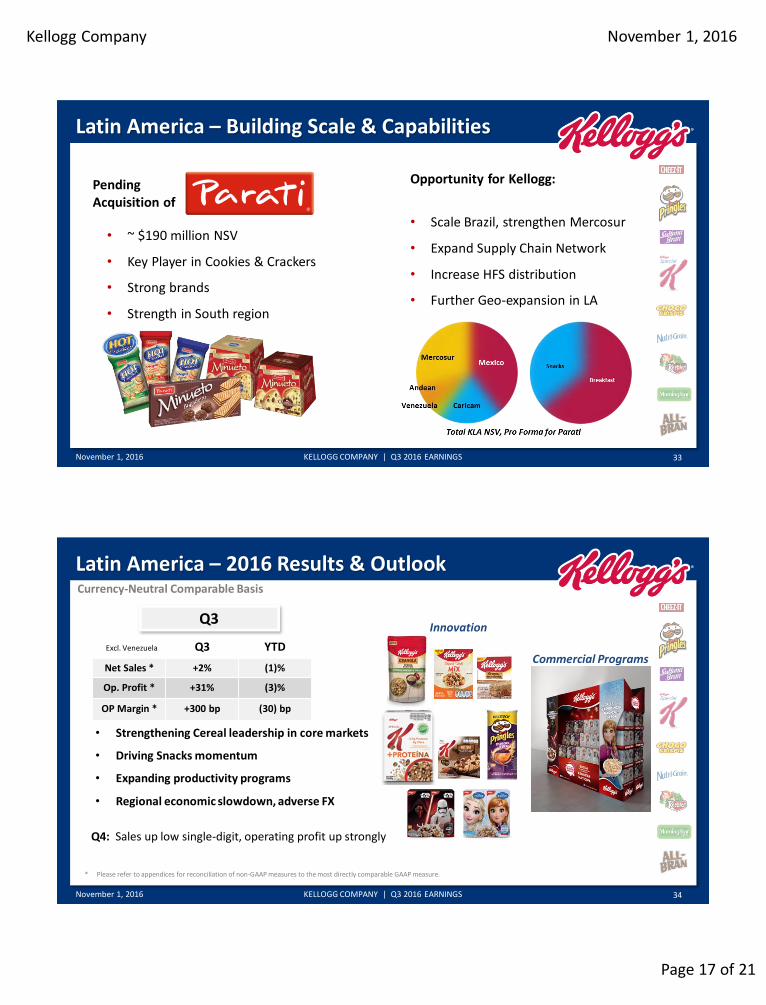
Latin America – Building Scale & Capabilities
November 1, 2016 KELLOGG COMPANY | Q3 2016 EARNINGS
Pending Acquisition of
Opportunity for Kellogg:
• Scale Brazil, strengthen Mercosur
• Expand Supply Chain Network
• Increase HFS distribution
• Further Geo-expansion in LA
• ~ $190 million NSV
• Key Player in Cookies & Crackers
• Strong brands
• Strength in South region
33
Latin America – 2016 Results & Outlook
November 1, 2016 KELLOGG COMPANY | Q3 2016 EARNINGS
• Strengthening Cereal leadership in core markets
• Driving Snacks momentum
• Expanding productivity programs
• Regional economic slowdown, adverse FX
Q3
Q3 YTD
Net Sales * +2% (1)%
Op. Profit * +31% (3)%
OP Margin * +300 bp (30) bp
Excl. Venezuela
Innovation
Commercial Programs
* Please refer to appendices for reconciliation of non-GAAP measures to the most directly comparable GAAP measure.
Q4: Sales up low single-digit, operating profit up strongly
34
Currency-Neutral Comparable Basis
Kellogg Company
Page 18 of 21
November 1, 2016
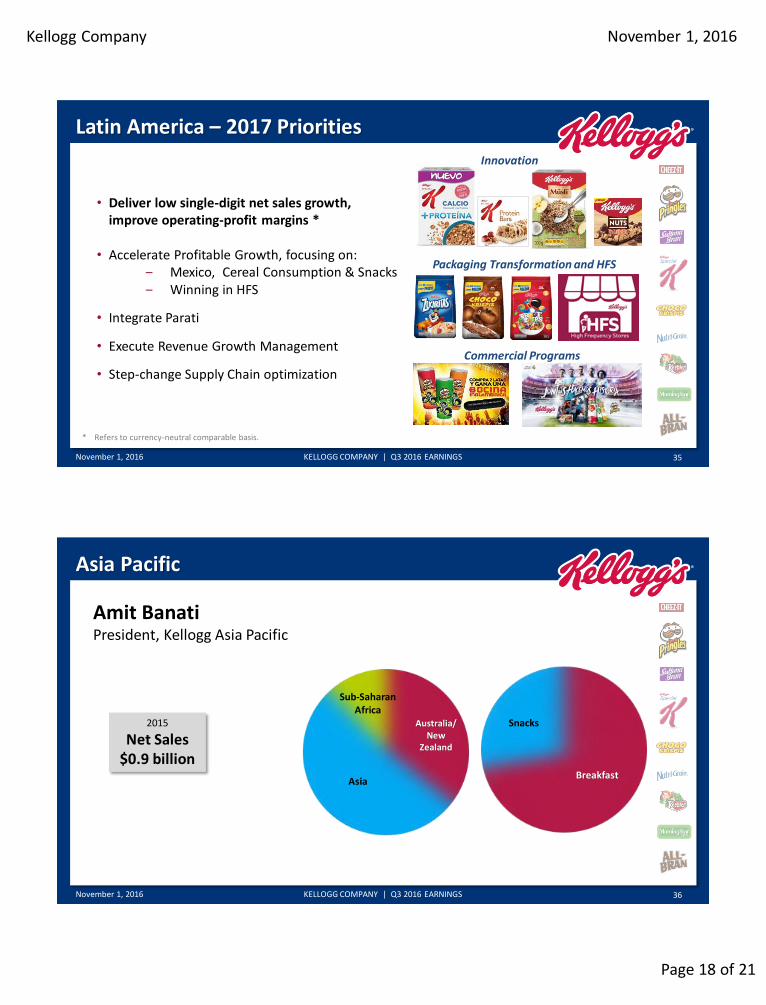
Latin America – 2017 Priorities
November 1, 2016 KELLOGG COMPANY | Q3 2016 EARNINGS
• Deliver low single-digit net sales growth, improve operating-profit margins *
• Accelerate Profitable Growth, focusing on: ‒ Mexico, Cereal Consumption & Snacks ‒ Winning in HFS
• Integrate Parati
• Execute Revenue Growth Management
• Step-change Supply Chain optimization
35
Innovation
Commercial Programs
Packaging Transformation and HFS
* Refers to currency-neutral comparable basis.
Asia Pacific
November 1, 2016 KELLOGG COMPANY | Q3 2016 EARNINGS
Amit Banati President, Kellogg Asia Pacific
2015
Net Sales $0.9 billion
36
Snacks
Breakfast
Australia/ New
Zealand
Asia
Sub-Saharan Africa
Kellogg Company
Page 19 of 21
November 1, 2016
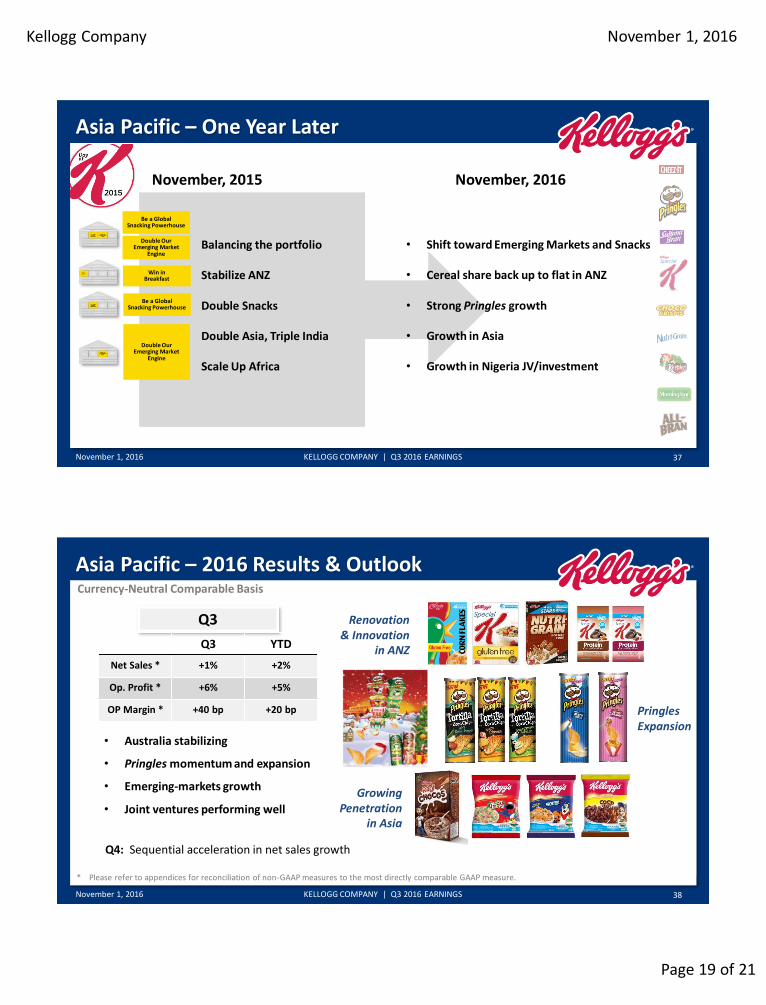
Asia Pacific – One Year Later
November 1, 2016 KELLOGG COMPANY | Q3 2016 EARNINGS
November, 2015 November, 2016
• Balancing the portfolio
• Stabilize ANZ
• Double Snacks
• Double Asia, Triple India
• Scale Up Africa
• Shift toward Emerging Markets and Snacks
• Cereal share back up to flat in ANZ
• Strong Pringles growth
• Growth in Asia
• Growth in Nigeria JV/investment
Double Our Emerging Market
Engine
Be a Global Snacking Powerhouse
Win in Breakfast
Double Our Emerging Market
Engine
Be a Global Snacking Powerhouse
37
Asia Pacific – 2016 Results & Outlook
November 1, 2016 KELLOGG COMPANY | Q3 2016 EARNINGS
Q3
Q3 YTD
Net Sales * +1% +2%
Op. Profit * +6% +5%
OP Margin * +40 bp +20 bp
• Australia stabilizing
• Pringles momentum and expansion
• Emerging-markets growth
• Joint ventures performing well
Q4: Sequential acceleration in net sales growth
Renovation & Innovation
in ANZ
Pringles Expansion
38
* Please refer to appendices for reconciliation of non-GAAP measures to the most directly comparable GAAP measure.
Currency-Neutral Comparable Basis
Growing Penetration
in Asia
Kellogg Company
Page 20 of 21
November 1, 2016
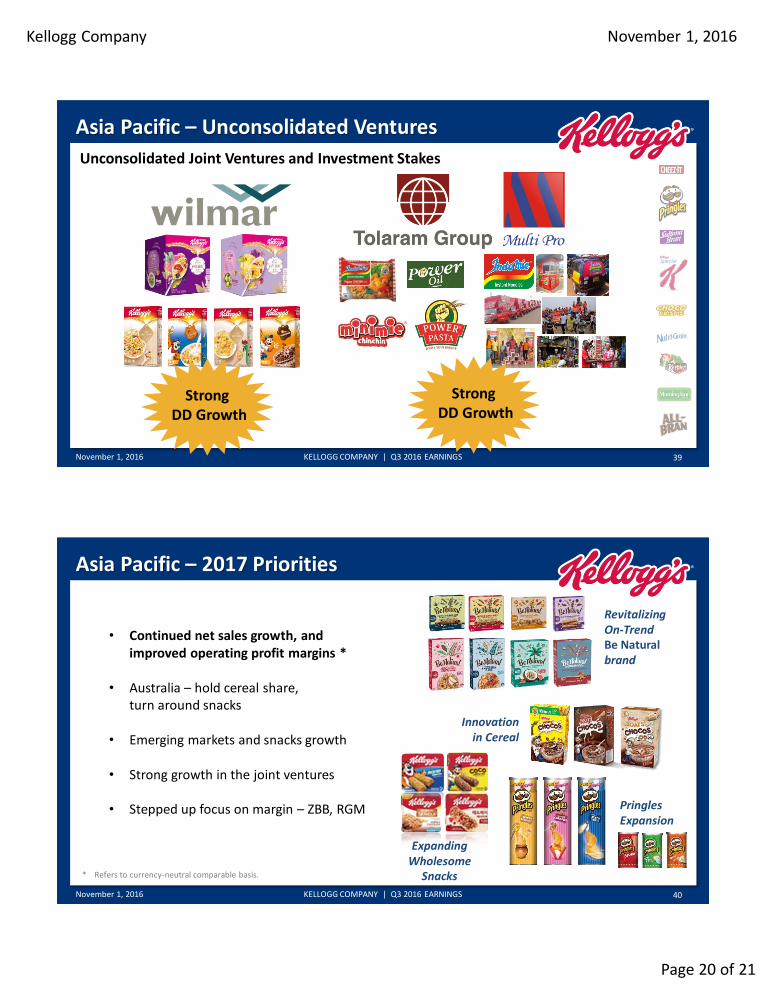
Asia Pacific – Unconsolidated Ventures
November 1, 2016 KELLOGG COMPANY | Q3 2016 EARNINGS
Unconsolidated Joint Ventures and Investment Stakes
39
Strong DD Growth
Strong DD Growth
Asia Pacific – 2017 Priorities
November 1, 2016 KELLOGG COMPANY | Q3 2016 EARNINGS
• Continued net sales growth, and improved operating profit margins *
• Australia – hold cereal share, turn around snacks
• Emerging markets and snacks growth
• Strong growth in the joint ventures
• Stepped up focus on margin – ZBB, RGM
Revitalizing On-Trend Be Natural brand
Innovation in Cereal
Expanding Wholesome
Snacks
40
Pringles Expansion
* Refers to currency-neutral comparable basis.
Kellogg Company
Page 21 of 21
November 1, 2016
Summary
November 1, 2016 KELLOGG COMPANY | Q3 2016 EARNINGS
Good progress on 2020 Growth Plan priorities
Sequential sales improvement
Unprecedented earnings visibility
Confidence in 2018 profit margin goals
41
* Guidance is on a currency-neutral comparable basis, excluding Venezuela
November 1, 2016
Kellogg Company THIRD QUARTER 2016 FINANCIAL RESULTS
Q&A