Kaushansky-Data Driven Marketing
23
Automotive Marketing Mix Model – Case Study Moving to Results-Driven Investment! August 4 th 2011
-
Upload
bolo-conference -
Category
Business
-
view
280 -
download
0
Transcript of Kaushansky-Data Driven Marketing
Automotive Marketing Mix Model – Case Study
Moving to Results-Driven Investment!
August 4th 2011
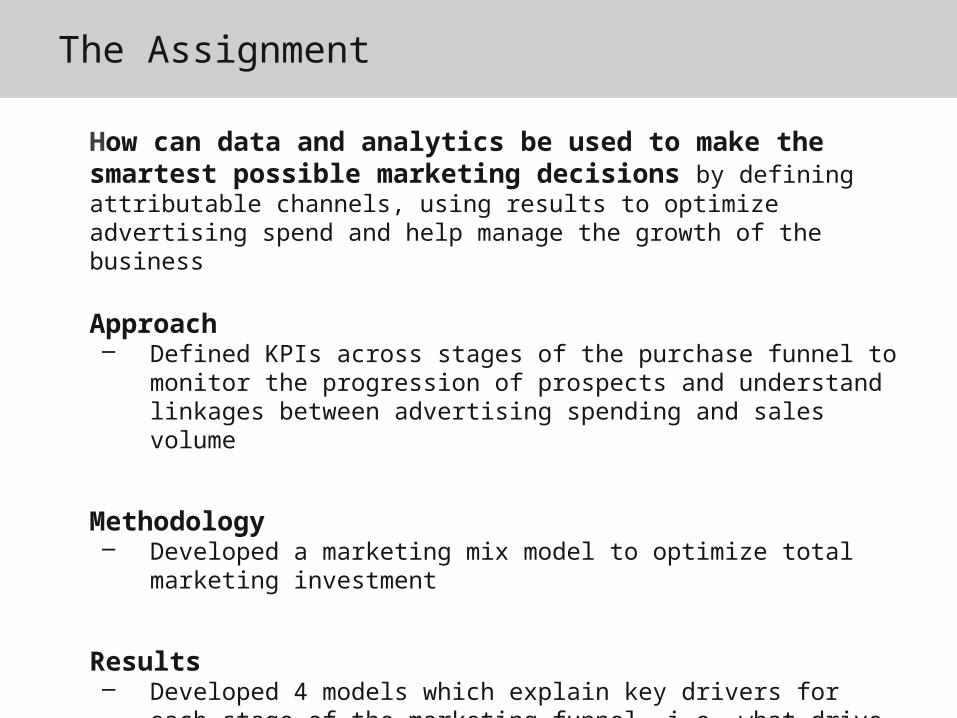
The Assignment
How can data and analytics be used to make the smartest possible marketing decisions by defining attributable channels, using results to optimize advertising spend and help manage the growth of the business
Approach – Defined KPIs across stages of the purchase funnel to monitor the
progression of prospects and understand linkages between advertising spending and sales volume
Methodology– Developed a marketing mix model to optimize total marketing
investment
Results– Developed 4 models which explain key drivers for each stage of the
marketing funnel, i.e. what drive search, leads, sales…
Discussion Overview
• Objective
• Recommended approach
• Detailed Findings & Implications
• Future Enhancements
• Discussion
3
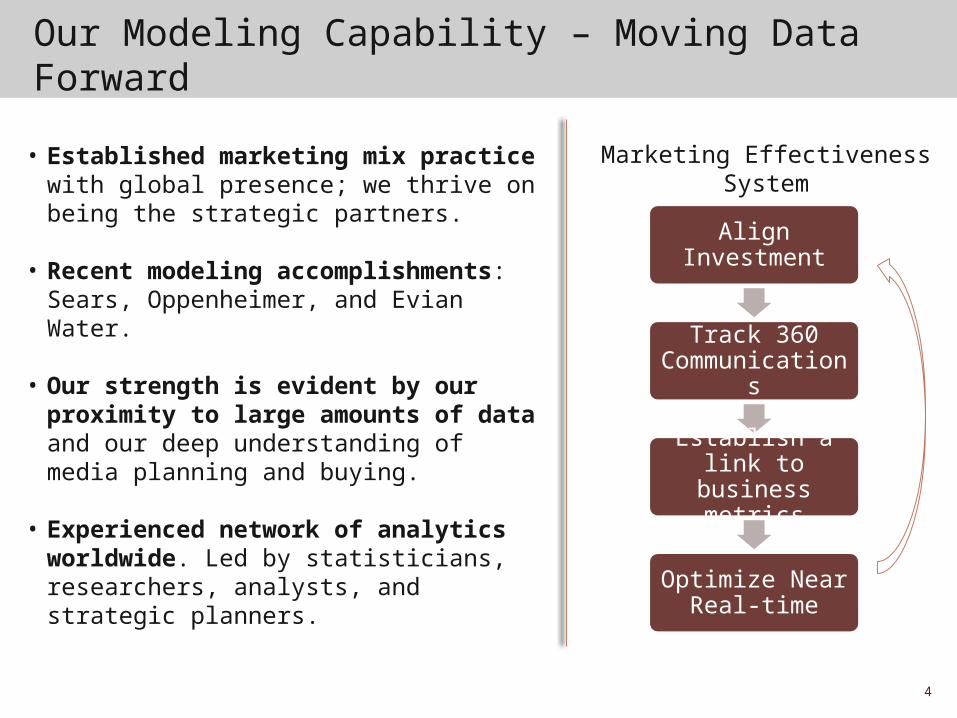
Our Modeling Capability – Moving Data Forward
• Established marketing mix practice with global presence; we thrive on being the strategic partners.
• Recent modeling accomplishments: Sears, Oppenheimer, and Evian Water.
• Our strength is evident by our proximity to large amounts of data and our deep understanding of media planning and buying.
• Experienced network of analytics worldwide. Led by statisticians, researchers, analysts, and strategic planners.
Align Investment
Track 360 Communications
Establish a link to business metrics
Optimize Near Real-time
Marketing Effectiveness System
4
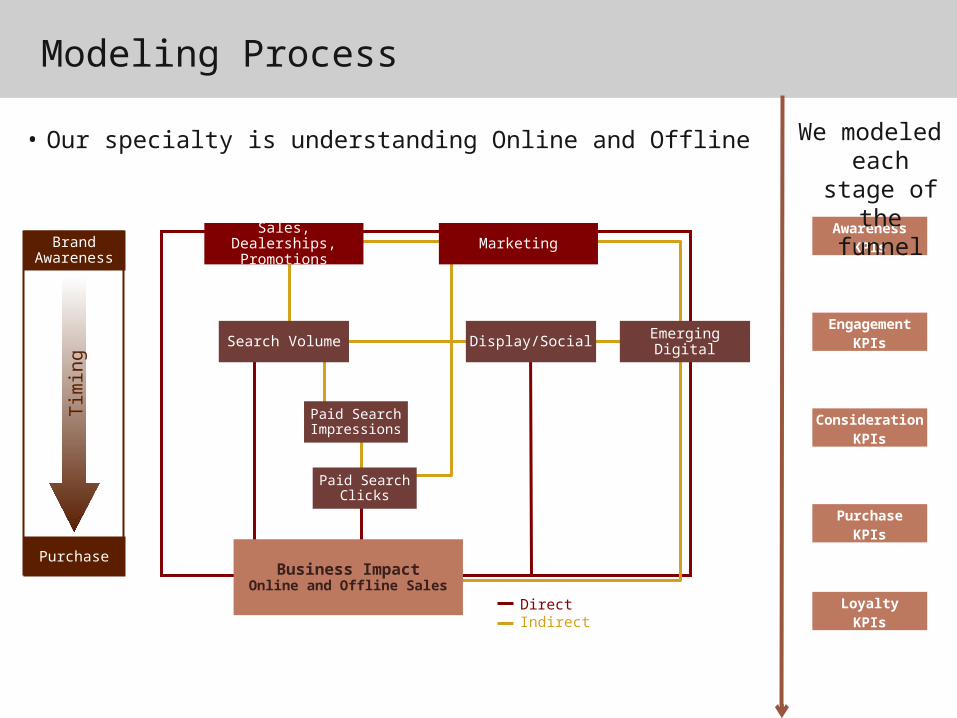
Modeling Process
DirectIndirect
Business ImpactOnline and Offline Sales
Sales, Dealerships, Promotions Marketing
Search Volume Display/Social EmergingDigital
Paid Search Impressions
Paid Search Clicks
Brand Awareness
Purchase
Tim
ing
• Our specialty is understanding Online and Offline
AwarenessKPIs
ConsiderationKPIs
PurchaseKPIs
LoyaltyKPIs
EngagementKPIs
We modeled each stage
of the funnel

Analysis Path
Modeling Approach
• We modeled one mid-sized model, since most of our US media was focused on the re-launch
• Aggregated weekly data from multiple online/offline sources
• We used 2009/2010 performance to ensure the learnings are recent and representative
• Total showroom traffic was our main primary performance indicator (KPI)
• To account for each stage of the conversion funnel we developed four econometric models to accommodate US and eventually global communication efforts
7
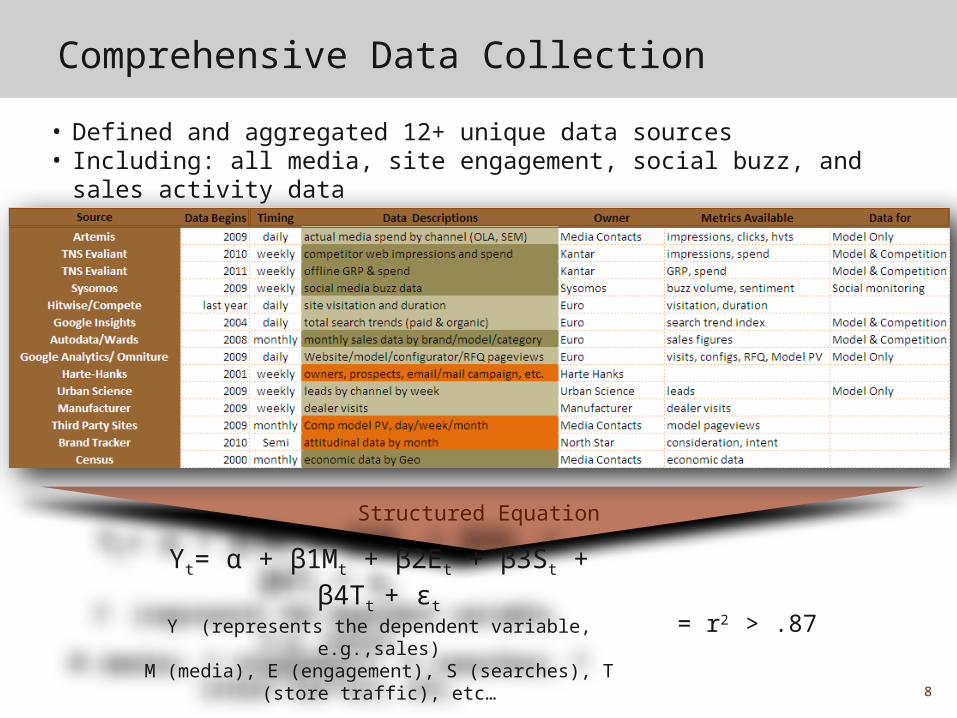
Comprehensive Data Collection
• Defined and aggregated 12+ unique data sources • Including: all media, site engagement, social buzz, and sales activity data
Structured Equation
8
= r2 > .87
Yt= α + β1Mt + β2Et + β3St + β4Tt
+ εtY (represents the dependent variable, e.g.,sales)M (media), E (engagement), S (searches), T (store
traffic), etc…
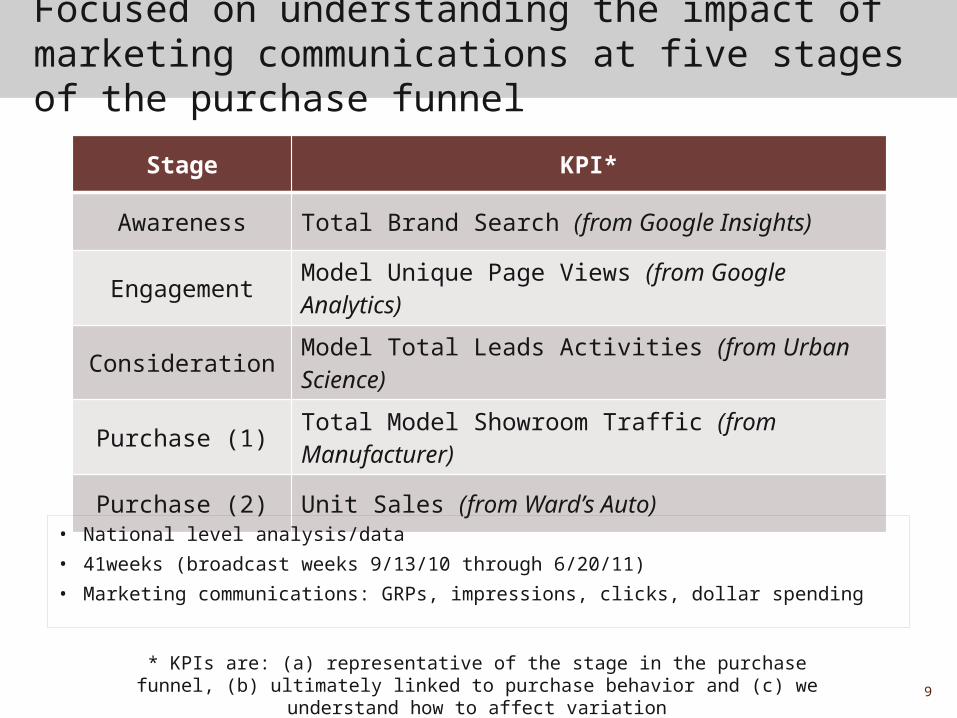
Focused on understanding the impact of marketing communications at five stages of the purchase funnel
Stage KPI*
Awareness Total Brand Search (from Google Insights)
Engagement Model Unique Page Views (from Google Analytics)
Consideration Model Total Leads Activities (from Urban Science)
Purchase (1) Total Model Showroom Traffic (from Manufacturer)
Purchase (2) Unit Sales (from Ward’s Auto)
• National level analysis/data• 41weeks (broadcast weeks 9/13/10 through 6/20/11)• Marketing communications: GRPs, impressions, clicks, dollar spending
* KPIs are: (a) representative of the stage in the purchase funnel, (b) ultimately linked to purchase behavior and (c) we understand how to affect
variation9
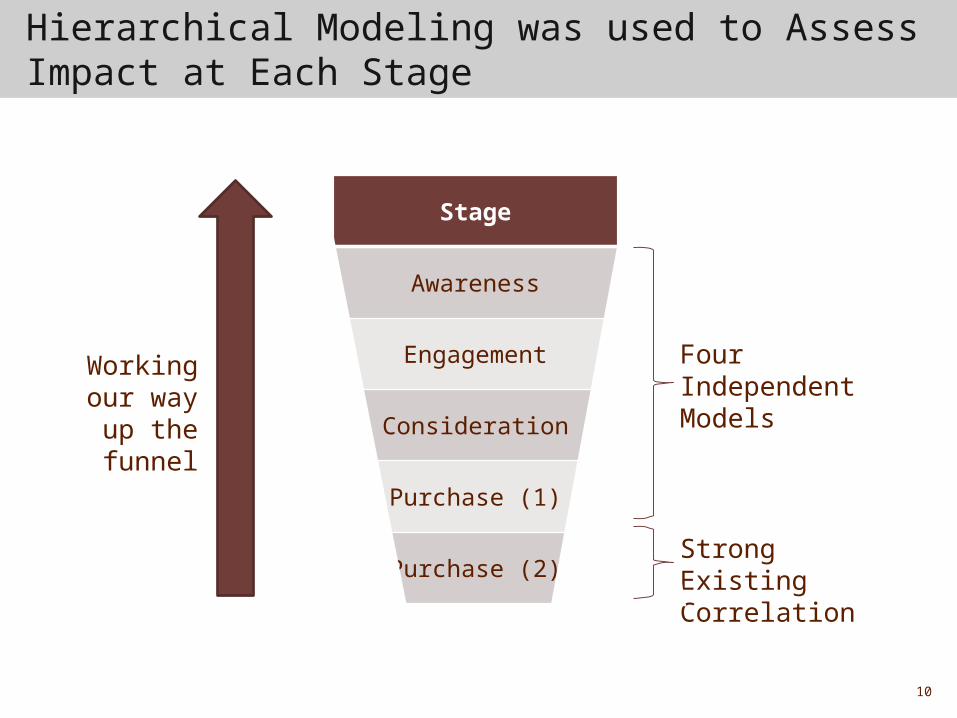
Stage
Awareness
Engagement
Consideration
Purchase (1)
Purchase (2)
Working our way up the funnel
Hierarchical Modeling was used to Assess Impact at Each Stage
Four Independent Models
Strong Existing Correlation
10

Detailed Findings & Implications
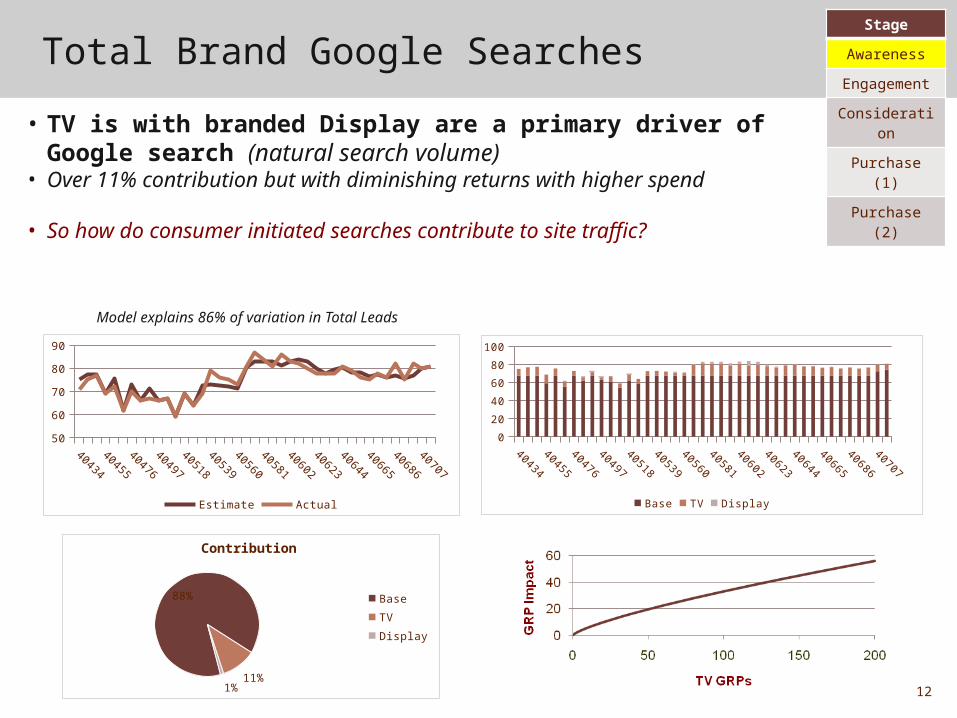
Total Brand Google Searches
• TV is with branded Display are a primary driver of Google search (natural search volume)
• Over 11% contribution but with diminishing returns with higher spend
• So how do consumer initiated searches contribute to site traffic?
Stage
Awareness
Engagement
Consideration
Purchase (1)
Purchase (2)
40434
40448
40462
40476
40490
40504
40518
40532
40546
40560
40574
40588
40602
40616
40630
40644
40658
40672
40686
40700
40714
505560657075808590
Estimate Actual
40434
40448
40462
40476
40490
40504
40518
40532
40546
40560
40574
40588
40602
40616
40630
40644
40658
40672
40686
40700
40714
0
20
40
60
80
100
Base TV Display
88%
11%1%
Contribution
Base
TV
Display
12
Model explains 86% of variation in Total Leads
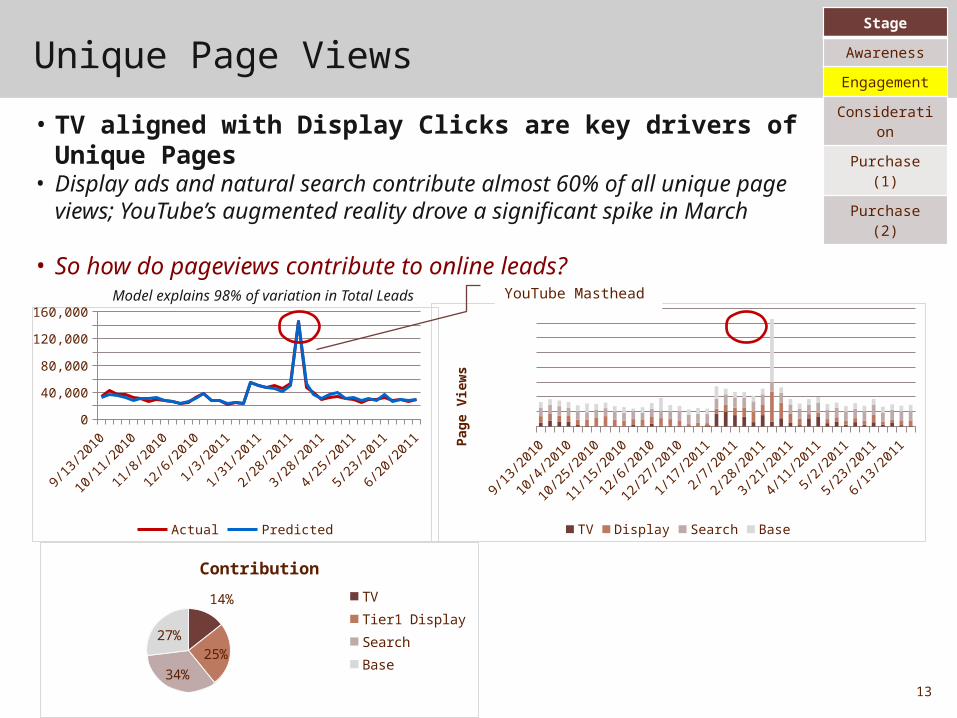
Unique Page Views
• TV aligned with Display Clicks are key drivers of Unique Pages
• Display ads and natural search contribute almost 60% of all unique page views; YouTube’s augmented reality drove a significant spike in March
• So how do pageviews contribute to online leads?
Stage
Awareness
Engagement
Consideration
Purchase (1)
Purchase (2)
9/13
/201
0
10/3
/201
0
10/2
3/20
10
11/1
2/20
10
12/2
/201
0
12/2
2/20
10
1/11
/201
1
1/31
/201
1
2/20
/201
1
3/12
/201
1
4/1/
2011
4/21
/201
1
5/11
/201
1
5/31
/201
1
6/20
/201
10
20,00040,00060,00080,000
100,000120,000140,000160,000
Actual Predicted
14%
25%
34%
27%
Contribution
TV
Tier1 Display
Search
Base
9/13
/201
0
10/4
/201
0
10/2
5/20
10
11/1
5/20
10
12/6
/201
0
12/2
7/20
10
1/17
/201
1
2/7/
2011
2/28
/201
1
3/21
/201
1
4/11
/201
1
5/2/
2011
5/23
/201
1
6/13
/201
1
TV Display Search Base
Pag
e V
iew
s
YouTube Masthead
13
Model explains 98% of variation in Total Leads
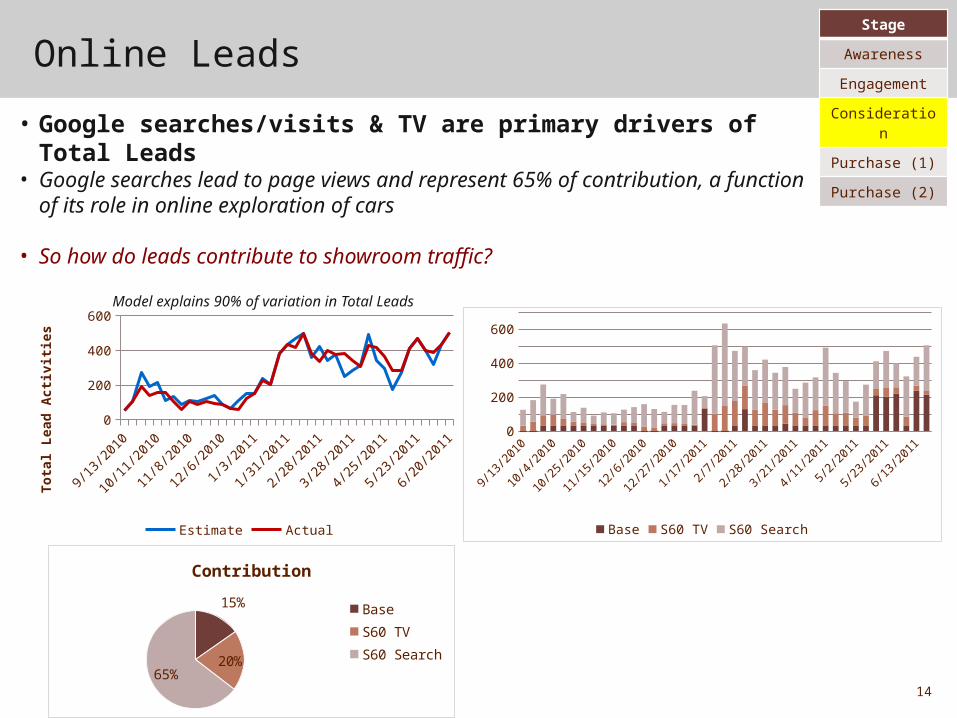
Online Leads
• Google searches/visits & TV are primary drivers of Total Leads• Google searches lead to page views and represent 65% of contribution, a function
of its role in online exploration of cars
• So how do leads contribute to showroom traffic?
Stage
Awareness
Engagement
Consideration
Purchase (1)
Purchase (2)
9/13
/201
0
10/2
/201
0
10/2
1/20
10
11/9
/201
0
11/2
8/20
10
12/1
7/20
10
1/5/
2011
1/24
/201
1
2/12
/201
1
3/3/
2011
3/22
/201
1
4/10
/201
1
4/29
/201
1
5/18
/201
1
6/6/
2011
0
200
400
600
Estimate Actual
To
tal
Lea
d A
ctiv
itie
s
15%
20%65%
Contribution
Base
S60 TV
S60 Search
9/13
/201
0
9/27
/201
0
10/1
1/20
10
10/2
5/20
10
11/8
/201
0
11/2
2/20
10
12/6
/201
0
12/2
0/20
10
1/3/
2011
1/17
/201
1
1/31
/201
1
2/14
/201
1
2/28
/201
1
3/14
/201
1
3/28
/201
1
4/11
/201
1
4/25
/201
1
5/9/
2011
5/23
/201
1
6/6/
2011
6/20
/201
10
100
200
300
400
500
600
700
Base S60 TV S60 Search
14
Model explains 90% of variation in Total Leads
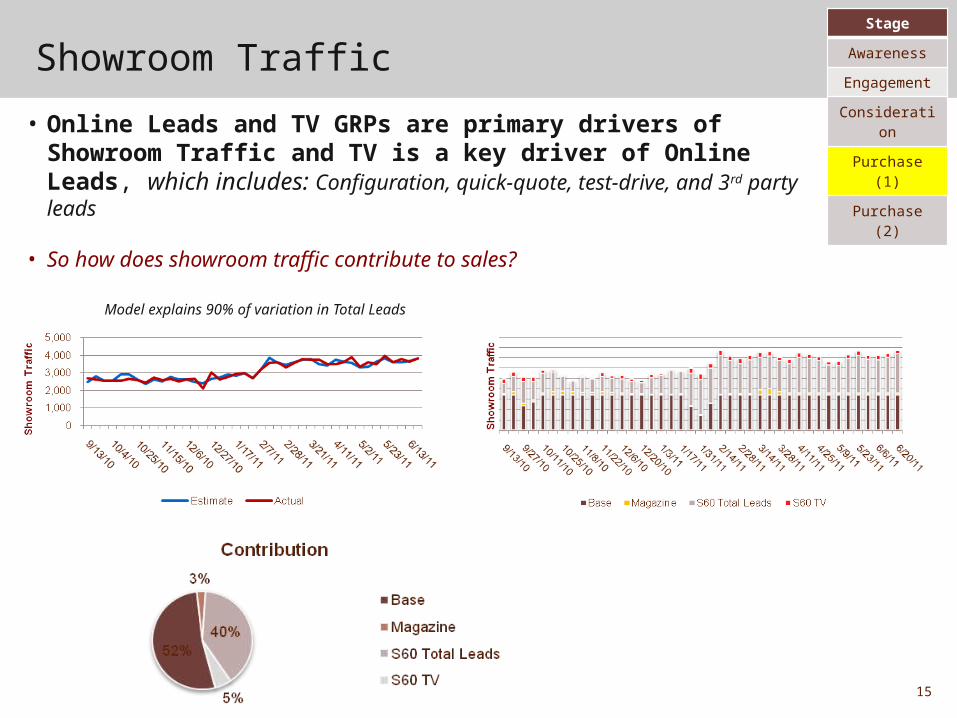
Showroom Traffic
• Online Leads and TV GRPs are primary drivers of Showroom Traffic and TV is a key driver of Online Leads, which includes: Configuration, quick-quote, test-drive, and 3rd party leads
• So how does showroom traffic contribute to sales?
Stage
Awareness
Engagement
Consideration
Purchase (1)
Purchase (2)
15
Model explains 90% of variation in Total Leads
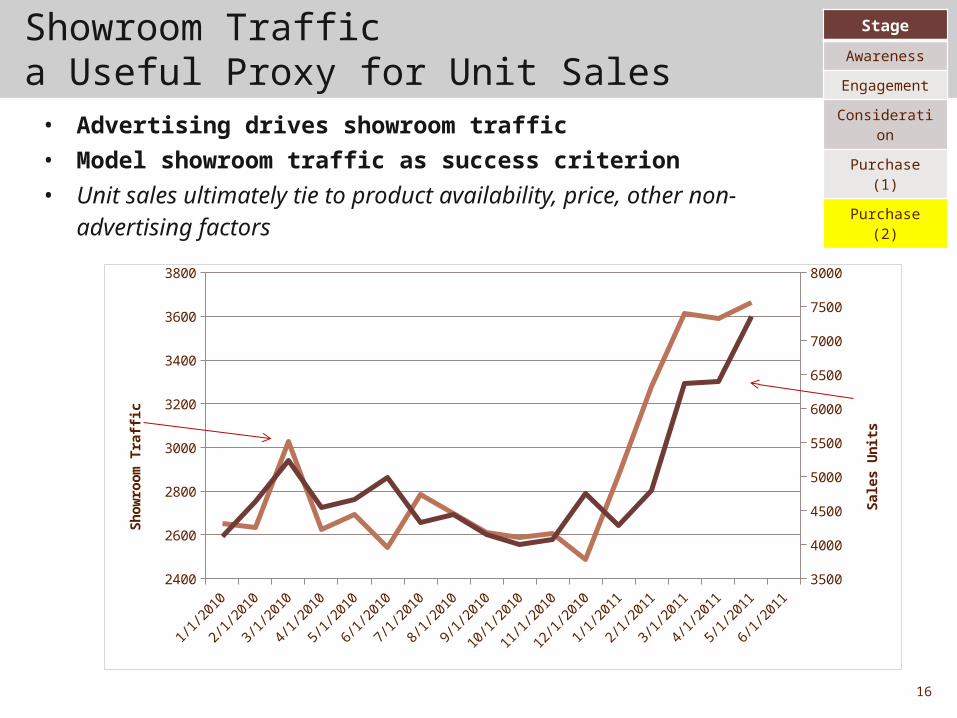
Showroom Traffica Useful Proxy for Unit Sales
Stage
Awareness
Engagement
Consideration
Purchase (1)
Purchase (2)
• Advertising drives showroom traffic• Model showroom traffic as success criterion• Unit sales ultimately tie to product availability, price, other
non-advertising factors
1/1/
2010
2/1/
2010
3/1/
2010
4/1/
2010
5/1/
2010
6/1/
2010
7/1/
2010
8/1/
2010
9/1/
2010
10/1
/201
0
11/1
/201
0
12/1
/201
0
1/1/
2011
2/1/
2011
3/1/
2011
4/1/
2011
5/1/
2011
6/1/
2011
2400
2600
2800
3000
3200
3400
3600
3800
3500
4000
4500
5000
5500
6000
6500
7000
7500
8000
Sh
ow
roo
m T
raff
ic
Sa
les
Un
its
16
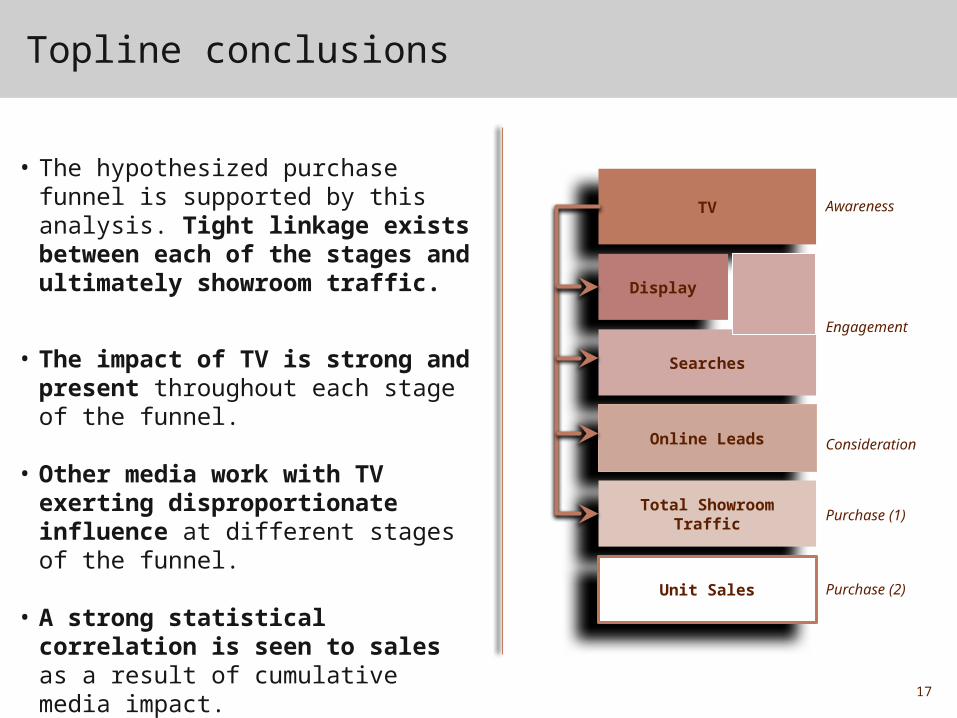
Topline conclusions
• The hypothesized purchase funnel is supported by this analysis. Tight linkage exists between each of the stages and ultimately showroom traffic.
• The impact of TV is strong and present throughout each stage of the funnel.
• Other media work with TV exerting disproportionate influence at different stages of the funnel.
• A strong statistical correlation is seen to sales as a result of cumulative media impact.
Awareness
Engagement
Consideration
Purchase (1)
Purchase (2)
TV
Display
Searches
Online Leads
Total Showroom Traffic
Unit Sales
17
Implications for Investment
• TV is a consistent driver of search volume, due to search’s important impact on total online leads – continue to invest
• Online Display is a proven awareness driver and influencer of search activity resulting in site traffic activity, most effective when in conjunction with TV is most effective – invest and align with TV
• Media’s impact lasts 3-4 weeks before it loses most of its effect – going dark with media may cost more to recapture share
• Online leads supported by TV and searches, leads drive showroom traffic – ensure search budgets are proportional to TV investment and align creative as needed
• Planning implication: maintaining a continuous mix of TV & online display remains essential for a steady flow of showroom traffic
18
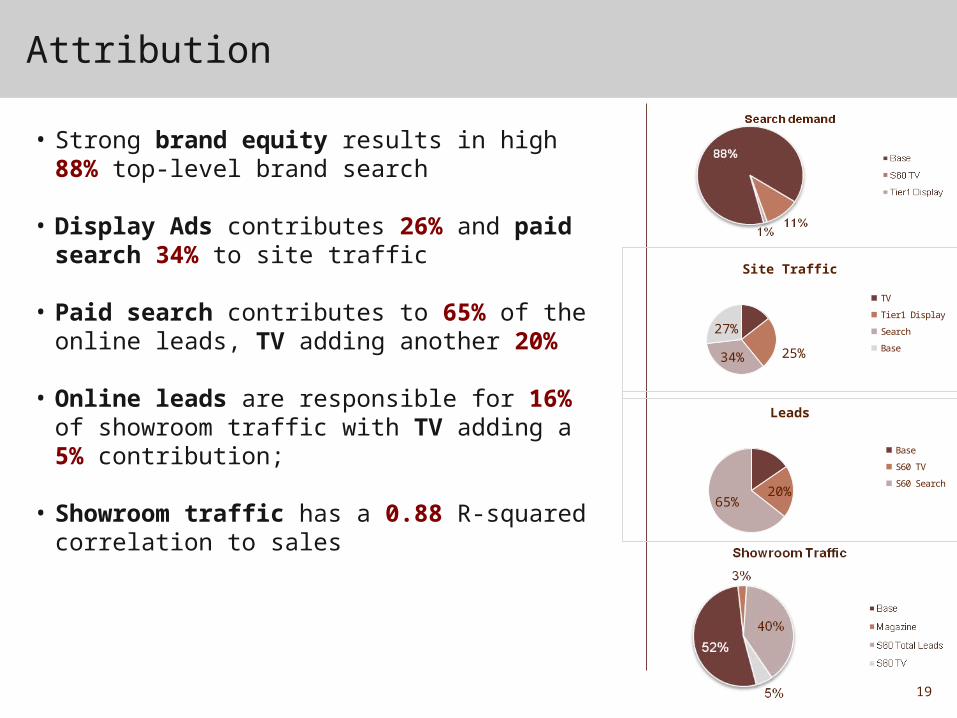
Attribution
• Strong brand equity results in high 88% top-level brand search
• Display Ads contributes 26% and paid search 34% to site traffic
• Paid search contributes to 65% of the online leads, TV adding another 20%
• Online leads are responsible for 16% of showroom traffic with TV adding a 5% contribution;
• Showroom traffic has a 0.88 R-squared correlation to sales
19
14%
25%
34%
27%
Site Traffic
TV
Tier1 Display
Search
Base
15%
20%65%
Leads
Base
S60 TV
S60 Search
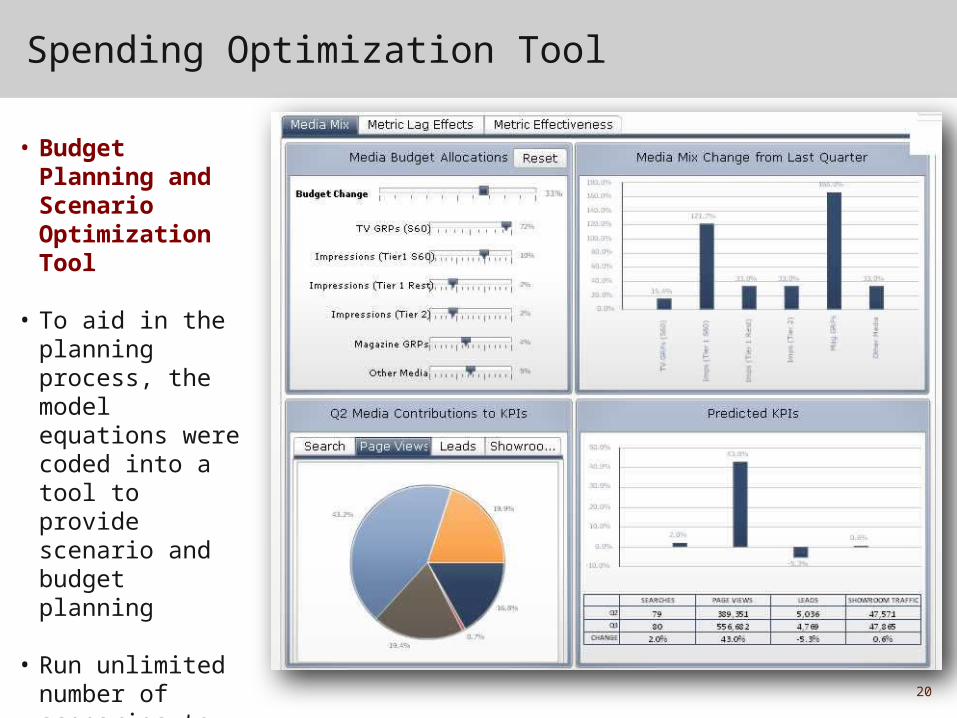
Spending Optimization Tool
20
• Budget Planning and Scenario Optimization Tool
• To aid in the planning process, the model equations were coded into a tool to provide scenario and budget planning
• Run unlimited number of scenarios to set budgets by channel
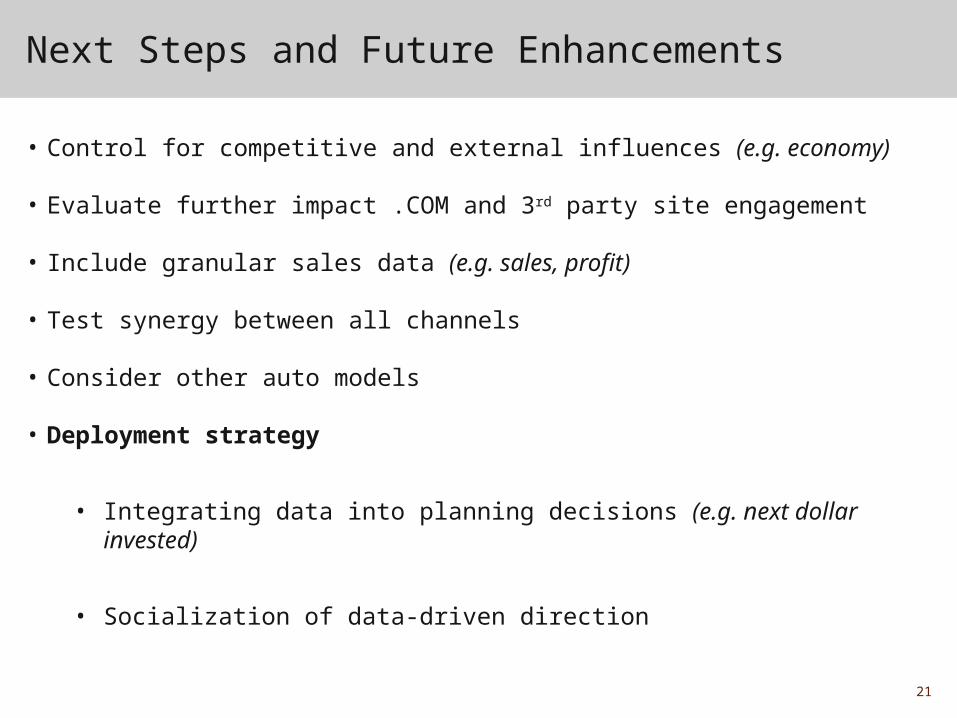
Next Steps and Future Enhancements
• Control for competitive and external influences (e.g. economy)
• Evaluate further impact .COM and 3rd party site engagement
• Include granular sales data (e.g. sales, profit)
• Test synergy between all channels
• Consider other auto models
• Deployment strategy
• Integrating data into planning decisions (e.g. next dollar invested)
• Socialization of data-driven direction
21

Thank you
22
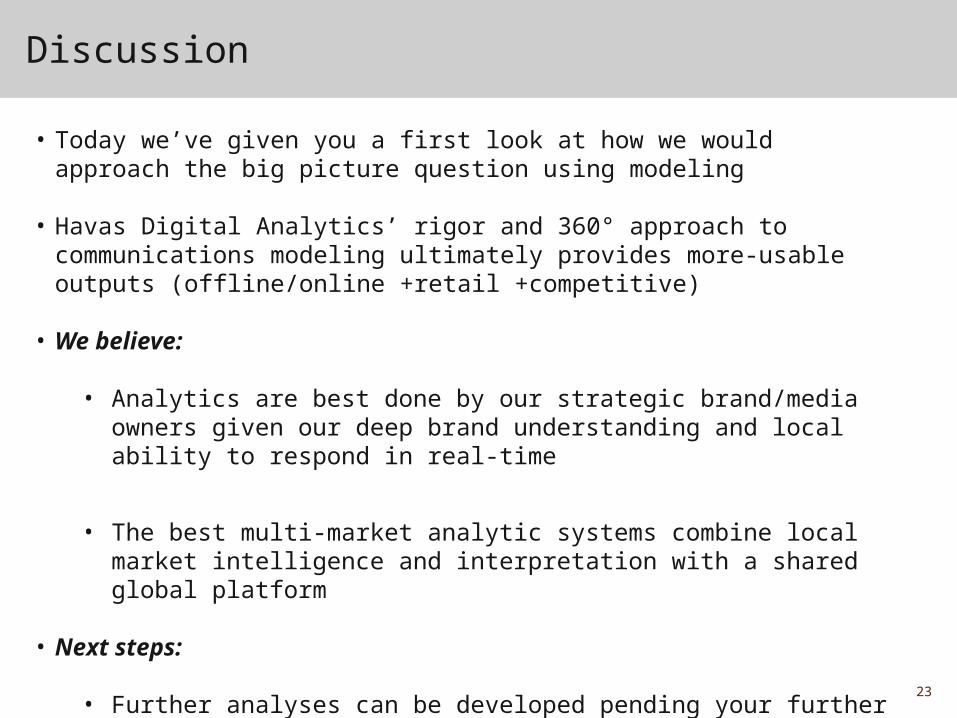
Discussion
• Today we’ve given you a first look at how we would approach the big picture question using modeling
• Havas Digital Analytics’ rigor and 360° approach to communications modeling ultimately provides more-usable outputs (offline/online +retail +competitive)
• We believe:
• Analytics are best done by our strategic brand/media owners given our deep brand understanding and local ability to respond in real-time
• The best multi-market analytic systems combine local market intelligence and interpretation with a shared global platform
• Next steps:
• Further analyses can be developed pending your further direction
23