KAOLIN, BALL CLAY, OTHER CLAYS AND SHALE Indian Minerals...
23
29-1 KAOLIN, BALL CLAY, OTHER CLAYS AND SHALE Indian Minerals Yearbook 2015 (Part- III : Mineral Reviews) 54 th Edition KAOLIN, BALL CLAY, OTHER CLAYS AND SHALE (ADVANCE RELEASE) GOVERNMENT OF INDIA MINISTRY OF MINES INDIAN BUREAU OF MINES Indira Bhavan, Civil Lines, NAGPUR – 440 001 PHONE/FAX NO. (0712) 2565471 PBX : (0712) 2562649, 2560544, 2560648 E-MAIL : [email protected] Website: www.ibm.gov.in February, 2017
Transcript of KAOLIN, BALL CLAY, OTHER CLAYS AND SHALE Indian Minerals...

29-1
KAOLIN, BALL CLAY, OTHER CLAYS AND SHALE
Indian Minerals Yearbook 2015 (Part- III : Mineral Reviews)
54th Edition
KAOLIN, BALL CLAY, OTHER CLAYS AND SHALE
(ADVANCE RELEASE)
GOVERNMENT OF INDIA
MINISTRY OF MINES INDIAN BUREAU OF MINES
Indira Bhavan, Civil Lines,
NAGPUR – 440 001
PHONE/FAX NO. (0712) 2565471
PBX : (0712) 2562649, 2560544, 2560648
E-MAIL : [email protected] Website: www.ibm.gov.in
February, 2017

29-2
KAOLIN, BALL CLAY, OTHER CLAYS AND SHALE
29 Kaolin, Ball Clay, Other Clays and Shale
1. Kaolin (China Clay)
Kaolin, also known as china clay, is a natural clay
formed by chemical weathering of aluminium
silicate minerals like felspars through a complex
sequence of events. It is relatively pure clay
predominantly consisting of kaolinite (Al2Si
2O
5(OH)
4),
associated with other clay minerals like dickite,
halloysite, nacrite and anauxite. Kaolin is commercially
valued for its whiteness and fine particle size which
distinguish it from other clays, such as, ball clay and
fireclay. Other physical characteristics that influence
commercial utility include brightness, glossiness,
abrasiveness and viscosity. It often contains small
amounts of impurities in the form of rock fragments,
hydrous oxides and colloidal materials. Kaolin is
produced and consumed in the country in crude &
processed forms. The major use of crude china clay is
in Cement Industry and of processed china clay is
Ceramic Industry. The insitu clay deposits in India are
often soft and easily extracted with no blasting required.
RESOURCESChina clay resources in the country as per
UNFC system as on 1.4.2010 have been placed at
2,705.21 million tonnes. The reserves constitute only
about 7% of the resources at 177.16 million tonnes. Out
of the total reserves, 70% (about 124 million tonnes)
reserves are under proved category whereas 30% (about
53 million tonnes) reserves fall under probable category.
The resources are spread over in a number of
states of which Kerala holds about 25%, followed
by West Bengal and Rajasthan (16% each) and
Odisha and Karnataka (10% each).
Out of total resources, about 22% or
607.78 million tonnes fall under ceramic/pottery
grade, 4% are classified under chemical, paper filler
and cement grades and about 73% or 1,980 million
tonnes resources fall under mixed grade, others,
unclassified & not-known categories. The details
of reserves/resources are given in Table- 1.
EXPLORATION & DEVELOPMENTDMG, Kerala carried out exploration for kaolin
in the districts of Kannur and Kollam,Kerala state.
The details of exploration carried out during
2014-15 are furnished in Table-2.
PRODUCTION, STOCKS &PRICES
The production of kaolin at 3861 thousand tonnes
in 2014-15 (up to January 2015) decreased by 20% as
compared to previous full year.
There were 135 reporting mines during 2014-15 as
against 160 mines in the previous year. Besides, the
production of kaolin was also reported as an associ-
ated mineral by five mines in the year 2014-15 and ten
mines in the previous year. Nine principal producers
accounted for about 69% of the total output of kaolin
in 2014-15. The private sector mines reported almost
the entire production of Kaolin. Nominal production
was reported by 5 public sector mines. The proportion
of natural and processed kaolin in 2014-15 was 98%
and 2% respectively.
During 2014-15, 52 mines including 2 associated
mines each producing more than 10,000 tonnes annu-
ally accounted for 96% of the total production of ka-
olin (natural) while 15 mines each in the annual produc-
tion range of 5,001 to10,000 tonnes accounted for about
3 % and the remaining production of kaolin (natural)
was shared by 58 mines including 3 associated mines
producing up to 5,000 tonnes annually.
Contribution of 5 kaolin mines producing more
than 5000 tonnes of kaolin (processed) was about 75%
and remaining 25% production of kaolin (processed)
was shared by 10 kaolin mines.
Gujarat was the leading producing state of kaolin
accounting for 64% of the total production in 2014-15
followed by Rajasthan (16%), Kerala (15%) and West
Bengal (2%). The remaining 3% was shared by Andhra
Pradesh, Jharkhand, Karnataka and Madhya Prades
(Tables - 3 to 7)
Mine-head closing stocks of kaolin for the year
2014-15 (up to January 2015) were 1,267 thousand
tonnes as against 1,210 thousand tonnes for the
previous year (Table - 8)
The average daily employment of labour during
2014-15 was 2787 as against 2939 in the preceding year.
Domestic prices of kaolin are furnished in the
General Review on 'Prices".

29-3
KAOLIN, BALL CLAY, OTHER CLAYS AND SHALE
Ta
ble
–1
: R
ese
rv
es/
Reso
urces
of
Ch
ina
Cla
y a
s o
n 1
.4.2
01
0
(By
Gra
des/
Sta
tes)
(In
'0
00
to
nn
es)
Rese
rves
Rem
ain
ing
re
sou
rces
To
tal
Pro
ved
Pro
bab
leT
ota
lF
easi
bil
ity
Pre
-feasi
bil
ity
Measu
red
Ind
icate
dIn
ferr
ed
Reco
nn
ais
san
ce
To
tal
reso
urc
es
ST
D1
11
(A)
ST
D2
11
ST
D3
31
ST
D3
32
ST
D3
33
ST
D3
34
(B)
(A+
B)
ST
D1
21
ST
D1
22
ST
D2
21
ST
D2
22
All
In
dia
: T
ota
l1
24
11
81
10
34
42
00
61
77
15
82
45
43
22
98
07
12
70
28
47
81
41
28
52
16
51
28
66
03
38
25
28
05
02
70
52
08
By
Gra
des
Ch
em
ical
--
--
-6
00
--
-3
39
45
-3
45
45
34
54
5
Cera
mic
/Po
ttery
48
02
82
94
81
95
64
70
54
05
95
71
08
37
34
69
51
00
84
62
12
83
33
78
34
25
78
85
37
24
06
07
78
0
Mix
ed G
rad
e7
92
65
25
13
30
97
81
25
61
78
42
72
58
84
60
71
99
35
51
83
73
22
39
84
23
37
65
Fil
ler
57
93
18
12
89
28
86
62
69
99
92
36
71
11
66
53
00
35
28
04
40
87
74
97
43
Cem
en
t1
42
75
43
24
29
81
21
58
01
21
13
21
46
37
73
01
28
62
56
54
09
11
15
93
27
39
Oth
ers
17
79
61
56
31
02
34
29
59
39
46
46
60
61
36
51
18
01
95
27
58
41
70
96
76
25
50
59
28
46
52
Un
cla
ssif
ied
22
92
45
06
18
01
25
23
13
88
81
16
13
82
08
50
68
33
83
06
44
12
89
10
99
90
13
52
21
No
t-k
no
wn
73
76
98
73
20
51
15
68
10
68
67
78
07
11
26
43
17
91
59
75
19
91
10
00
13
15
19
41
32
67
62
By
Sta
tes
An
dh
ra P
rad
esh
25
24
33
92
20
54
82
82
86
79
09
96
12
66
69
51
37
83
08
85
73
33
62
16
1
Ass
am
--
--
-1
31
-3
92
-3
52
0-
40
43
40
43
Bih
ar
--
--
--
-1
04
39
12
96
-1
43
91
43
9
Ch
hatt
isg
arh
83
4-
34
41
17
84
80
76
51
07
6-
-1
15
12
-1
38
33
15
01
1
Delh
i-
--
--
--
85
76
30
38
02
-5
28
95
28
9
Go
a-
--
--
-1
6-
--
-1
61
6
Gu
jara
t3
42
90
24
06
23
24
07
62
46
54
85
62
41
35
-8
78
40
90
4-
71
42
71
12
18
9
Hary
an
a-
--
-2
36
77
89
33
77
13
34
54
85
-1
20
65
12
06
5
Jam
mu
& K
ash
mir
--
--
--
--
-2
81
22
-2
81
22
28
12
2
Jhark
han
d8
55
43
25
87
31
17
61
02
09
20
31
15
65
19
36
73
63
14
99
57
18
01
91
81
08
01
98
69
0
Karn
ata
ka
94
38
35
28
02
05
88
19
73
83
39
02
20
36
04
43
24
68
56
03
02
56
46
52
58
52
3
Kera
la3
35
27
92
-4
14
42
44
74
63
29
85
43
93
02
04
39
56
92
26
20
20
06
59
69
06
63
83
4
Mad
hy
a P
rad
esh
--
--
94
2-
61
-4
15
11
74
1-
13
15
91
31
59
Mah
ara
shtr
a-
--
-4
18
25
68
56
11
18
45
52
3-
72
48
72
48
Man
ipu
r-
--
--
--
25
20
--
-2
52
02
52
0
Meg
hala
ya
--
--
--
-1
41
06
26
67
60
32
51
67
88
87
58
88
75
Od
ish
a2
37
67
15
81
13
90
2-
12
52
24
76
22
33
53
93
23
64
21
12
59
27
70
24
28
09
26
Pu
du
ch
err
y-
--
--
--
--
29
40
-2
94
02
94
0
Raja
sth
an
70
01
27
60
32
24
97
10
01
12
11
52
41
40
08
29
48
31
26
04
06
72
71
31
47
49
33
24
05
43
25
17
Tam
il N
ad
u-
--
--
--
-3
27
56
57
0-
56
89
75
68
97
Tela
ng
an
a2
40
--
24
03
97
70
01
52
-2
21
05
05
-1
17
75
12
01
5
Utt
ar
Pra
desh
--
--
--
-1
16
00
34
47
10
01
8-
25
06
52
50
65
West
Ben
gal
12
32
18
59
06
23
23
-2
02
70
33
83
32
23
68
03
35
58
26
41
93
40
42
16
63
Fig
ure
s ro
un
de
d o
ff.
Gra
de
/ S
tate

29-4
KAOLIN, BALL CLAY, OTHER CLAYS AND SHALE
Agency/ Location Mapping Drilling
State/ Area/ Sampling Remarks
District Block Scale Area No. of Meterage (No.) Reserves/Resources estimated
(sq km) boreholes
Table – 2 : Details of Exploration Activities for Kaolin and other Clays, 2014-15
DMG
China Clay
Kerala
Kannur Kannadipoyil area - - 04 97 -
Taluka: Taliparamba
Objective of exploration was investi-gation for china clay by core drilling.The average thickness of overburdenwas found ou t to be abou t 4 mfollowed by later i t ic clay, greyishyellowish, yellowish white variegatedc lay. The ave rage th ickness wasfound out to be about 7 m. Resourceswill be estimated after completionofinvest igat ion.
Koram area - - 09 354 -
Taluka: Taliparamba
Karinthadaom area - - 05 140.5 -
Taluka: Taliparamba
Kollam Kalapoika- - - 12 447 -
Punnathadaom area
Taluka: Kollam
Vaipiriyam, Kankol - - 07 250 -
Taluka: Taliparamba
China clay occurs as sedimentary aswell as residual deposits. The averageth ickness o f overburden was 5 mfol lowed by la ter i t ic c lay, greyishyellowish, yellowish white variegatedclay. The average thickness of claywas found out to be 15 m. About 10mi l l ion tonnes resources wereestmated.
The average a lumnious l a t e r i t ethickness was found out to be 3.5 mand that of low grade clay is 14 m.About 16 million tonnes ressourceswere estimated.
The thickness of lateritic overburdenwas found out to be 5 m and that oflow grade ch ina c l ay was 17 m.Es t ima t ion o f r e s sources wi l l becomputed af t r rece ip t of chemicalanalysis report.
I t was observed that alternate bedsof pale white to greyish clay, palep ink i sh c l ayey sand & b lackca rbonaceous c l ay ex i s t s . Theaverage thickness of overburden wasfound out to be about 7 m and that ofdull white to greyish sandy clay is20m. About 9 .6 mi l l ion tonnestentative resources of dull white togreyish sandy clay were estimated.
Kasargod Nileswaram area - - 05 113.5 - The average of 6 .5 m la ter i tc soi loverburden was present and the claythickness varies from 10-16 m. Theaverage thickness of clay deposit wasfound out to be about 13 m. About52 ,000 tones r e sources wereestimated.
Directorate of Mines & Minerals
West Bengal
Bankura Beliatore area, 1:12500 35 - - 36
Bajora block
Alluvial/lateritic soil which acts as acapping of the underlying clay beds.The overburden have va r i ab lethickness of 1-4 m and the thicknessof clay beds ranges from 2-3 m uptomaximum dep th o f 7 m f rom thesur face . Resources were no testimated.
Dhunara, 1:12500 37.0 - 447 38
Ainagobindapur
Mukundapur,
Bhalaibagan
Alluvial/lateritic soil which acts as acapping of the underlying clay beds.The overburden have va r i ab lethickness of 1.2 - 10.66 m and thethickness of clay deposits varies from3.35 - 6.40 m from the surface.Thechina clay was found to occur withan in te rmi t t en t l aye r o f l a t r i t e inbe tween . Resources were no testimated.

29-5
KAOLIN, BALL CLAY, OTHER CLAYS AND SHALE
Table – 3 : Principal Producers of Kaolin, 2014-15
Location of mineName & address of producer
State District
Shree Ram Minechem Gujarat Kachchh
International,
G.I.D.C Area, Madhapar,
Bhuj-370 020, Distt. Kachchh
Gujarat
EICL Ltd, Kerala Thiruvanantha-
TC- 79/04, Veli, puram
Thiruvananthapuram-695 021,
Kerala.
Manoj P. Solanki, Gujarat Kachchh
Near Thakar Mandir,
Junavas, Madhapar,
Bhuj- 370 020,
Distt. Kachchh
Gujarat.
Satish Valji Chhanga & Gujarat Kachchh
Harilal Hira Jatiya,
Vill. Mamuara,
Taluka. Bhuj, Distt. Kachchh
Gujarat.
Gopal Savabhai Dangar, Gujarat Kachchh
Near Ramdevpir Temple,
Nadapa,
Distt. Kachchh -370 020,
Gujarat.
(Table - 3 Concld.)
Location of mine
Name & address of producer
State District
HD Enterprises Pvt. Ltd, Gujarat Kachchh
101, HD House,
Pooja Complex ‘A’,
Station Road,
P.O. Bhuj,
Distt. Kachchh -370 001,
Gujarat.
Mohd. Sher Khan, Rajasthan Chittorgarh
Khawaja Bagh,
P.O. Sawa,
Distt. Chittorgarh-312 613,
Rajasthan.
Rajmahal Quartz Sand & Jharkhand Sahebganj
Kaolin Co.
Mangalhat Hills, Rajmahal,
Distt. Sahebganj-816 108,
Jharkhand.
R.B. Mining & Company, Rajasthan Bhilwara
25/531, Neelkanth Colony,
Vill. Gudda, P.O. Mandal,
Distt. Bhilwara-311 403,
Rajasthan.
(Contd.)
Table – 4 : Production of Kaolin (Total) 2012-13 to 2014-15*
(By States)(Qty in tonnes; Value in ` '000)
2012-13 2013-14 2014-15* (P)
State
Quantity Value Quantity Value Quantity Value
India 4258697 1157392 4853420 1240484 3861380 1100154
Andhra Pradesh # 53057 8945 58516 11183 45857 8487
Gujarat 2656099 496079 3074737 613017 2456977 490988
Jharkhand 66235 31363 600 119 70623 17655
Karnataka 2836 7657 2540 7112 1984 6271
Kerala 708257 187628 743138 166817 561565 131480
Madhya Pradesh 11790 1114 13000 1044 10200 1377
Rajasthan 662362 355559 870307 372005 633175 385663
West Bengal 98061 69047 90582 69187 80999 58233
* Data up to January, 2015
# Figures mentioned against 2012-13 and 2013-14 are of districts which are part of present Andhra Pradesh and Telangana
States.

29-6
KAOLIN, BALL CLAY, OTHER CLAYS AND SHALE
Ta
ble
– 5
: P
ro
du
cti
on
of
Ka
oli
n,
20
13
-14
an
d 2
01
4-1
5
(By
Secto
rs/
Sta
tes/
Dis
tric
ts/G
ra
des)
(Qty
. in
to
nn
es;
Valu
e i
n `
’00
0)
20
13
-14
20
14
-15
* (
P)
Sta
te/D
istr
ict
No
. o
fN
atu
ral
Pro
cess
ed
To
tal
No
. o
fN
atu
ral
Pro
cess
ed
To
tal
min
es
min
es
Qty
Val
ue
Qty
Val
ue
Qty
Val
ue
Qty
Val
ue
Qty
Val
ue
Qty
Val
ue
Ind
ia1
60
(10
)4
78
15
19
1
03
55
16
71
90
12
04
96
84
85
34
20
12
40
48
41
35
(5)
37
87
17
38
40
51
47
42
07
25
96
40
38
61
38
01
10
01
54
Pu
bli
c S
ecto
r6
49
97
57
33
33
35
52
78
32
33
62
75
--
49
13
25
69
44
91
32
56
94
Pri
vate
Secto
r1
54
(10
)4
78
10
20
10
35
44
16
45
68
17
14
16
48
45
58
81
20
68
57
13
0(5
)3
78
71
73
84
05
14
69
29
42
33
94
63
85
64
67
10
74
46
0
An
dh
ra
Pra
desh
#8
58
51
61
11
83
--
58
51
61
11
83
64
58
57
84
87
--
45
85
78
48
7
Cu
dd
ap
ah
24
34
30
76
16
--
43
43
07
61
62
37
35
76
46
9-
-3
73
57
64
69
East
Go
dav
ari
51
50
86
35
67
--
15
08
63
56
74
85
00
20
18
--
85
00
20
18
West
Go
dav
ari
**
1-
--
--
-
-
--
--
--
Gu
jar
at
57
(3)
30
41
35
55
62
34
13
33
82
50
67
63
07
47
37
61
30
17
44
(1)
24
27
14
04
48
40
62
98
37
42
58
22
45
69
77
49
09
88
Ka
ch
ch
h4
2(3
)2
93
13
75
53
67
55
--
29
31
37
55
36
75
53
1(1
)2
31
37
30
42
29
40
--
23
13
73
04
22
94
0
Mah
esa
na
41
24
46
31
11
15
03
32
24
40
27
47
92
55
51
43
66
89
68
15
47
72
36
53
19
14
52
46
21
Pa
tan
57
92
90
18
00
7-
-7
92
90
18
00
75
99
01
22
18
09
--
99
01
22
18
09
Sab
ark
an
tha
61
82
44
44
68
18
34
92
82
36
36
59
33
27
04
41
07
30
26
89
14
36
01
89
29
25
09
02
16
18
Jh
ar
kh
an
d2
60
01
19
--
60
01
19
1
70
62
31
76
55
--
70
62
31
76
55
Sah
eb
gan
j1
60
01
19
--
60
01
19
17
06
23
17
65
5-
-7
06
23
17
65
5
Sin
gh
bh
um
(West
)**
1-
--
--
--
--
--
--
Ka
rn
ata
ka
2-
-2
54
07
11
22
54
07
11
21
--
19
84
62
71
19
84
62
71
Hass
an
1-
-2
54
07
11
22
54
07
11
21
--
19
84
62
71
19
84
62
71
Sh
ivam
og
ga *
*1
--
--
--
--
--
--
-
(Co
ntd
.)

29-7
KAOLIN, BALL CLAY, OTHER CLAYS AND SHALET
ab
le -
5 :
(C
on
cld
.)
20
13
-14
20
14
-15
*(P
)
Sta
te/D
istr
ict
No
. o
fN
atu
ral
Pro
cess
ed
To
tal
No
. o
fN
atu
ral
Pro
cess
ed
To
tal
min
es
min
es
Qty
Val
ue
Qty
Val
ue
Qty
Val
ue
Qty
Val
ue
Qty
Val
ue
Qty
Val
ue
Ke
ra
la2
0(1
)7
37
69
51
40
10
45
44
32
67
13
74
31
38
16
68
17
22
55
86
36
11
20
56
29
29
19
42
45
61
56
51
31
48
0
Kan
nu
r2
--
35
00
20
52
23
50
02
05
22
2-
-1
92
71
32
65
19
27
13
26
5
Kasa
rag
od
1-
-1
29
35
91
81
29
35
91
81
--
10
02
61
59
10
02
61
59
Ko
llam
14
99
75
--
49
97
51
--
--
--
Th
iru
va
na
nth
ap
ura
m1
6(1
)7
37
19
61
40
02
96
50
27
37
37
84
61
40
30
21
85
58
63
61
12
05
6-
-5
58
63
61
12
05
6
Ma
dh
ya
Pr
ad
esh
2(1
)1
30
00
10
44
--
13
00
01
04
42
10
20
01
37
7-
-1
02
00
13
77
Katn
i1
(1)
13
00
01
04
4-
-1
30
00
10
44
21
02
00
13
77
--
10
20
01
37
7
Sa
tna
**
1-
--
--
-
-
--
--
--
Ra
jasth
an
60
(4)
84
49
20
26
30
05
25
38
71
09
00
08
70
30
73
72
00
55
1(3
)5
98
99
92
05
73
33
41
76
17
99
30
63
31
75
38
56
63
Bh
ilw
ara
9(1
)2
23
78
06
77
13
--
22
37
80
67
71
31
1(2
)1
93
29
75
72
16
--
19
32
97
57
21
6
Bik
an
er
(1)
19
37
59
86
2-
-1
93
75
98
62
(1)
22
44
87
30
3-
-2
24
48
73
03
Bundi
21
14
10
32
78
--
11
41
03
27
82
49
40
13
32
--
49
40
13
32
Ch
itto
rgarh
82
22
71
07
92
88
--
22
27
10
79
28
81
02
03
01
18
76
15
--
20
30
11
87
61
5
Jaip
ur
2-
-2
36
50
10
46
04
23
65
01
04
60
41
--
28
87
41
67
39
72
88
74
16
73
97
Kara
uli
**
1-
--
--
-1
--
--
--
Nag
au
r3
0(2
)3
10
29
08
72
64
17
37
43
96
31
20
27
91
66
01
81
18
68
23
49
55
53
02
12
53
31
23
98
44
74
88
Pali
65
59
45
15
31
4-
-5
59
45
15
31
46
53
89
11
67
74
--
53
89
11
67
74
Ud
aip
ur
21
41
02
86
--
14
10
28
62
27
30
53
8-
-2
73
05
38
Te
lan
ga
na
#1
--
--
--
--
--
--
-
Ad
ilab
ad
**
1-
--
--
--
--
--
--
We
st
Be
ng
al
8(1
)8
54
33
57
72
05
14
91
14
67
90
58
26
91
87
8(1
)7
57
18
46
80
05
28
11
14
33
80
99
95
82
33
Ban
ku
ra2
(1)
31
00
48
1-
-3
10
04
81
(1)
11
70
13
6-
-1
17
01
36
Bir
bh
um
68
23
33
57
23
95
14
9
1
14
67
87
48
26
87
06
87
45
48
46
66
45
28
11
14
33
79
82
95
80
97
*D
ata
u
p t
o J
an
ua
ry 2
01
5.
(
):
Fig
ure
s in
pa
ren
thesi
s in
dic
ate
s n
o.
of
ass
ocia
ted
min
es.
**
:
Min
e r
ep
ort
ing
pro
du
cti
on
of
ass
ocia
ted
min
era
ls o
r la
bo
urs
on
ly.
# :
F
igu
res
men
tio
ned
ag
ain
st 2
01
3-1
4
are
of
dis
tric
ts w
hic
h a
re p
art
of
pre
sen
t A
nd
hra
Pra
desh
an
d T
ela
ng
an
a s
tate
s.
29-8
KAOLIN, BALL CLAY, OTHER CLAYS AND SHALE
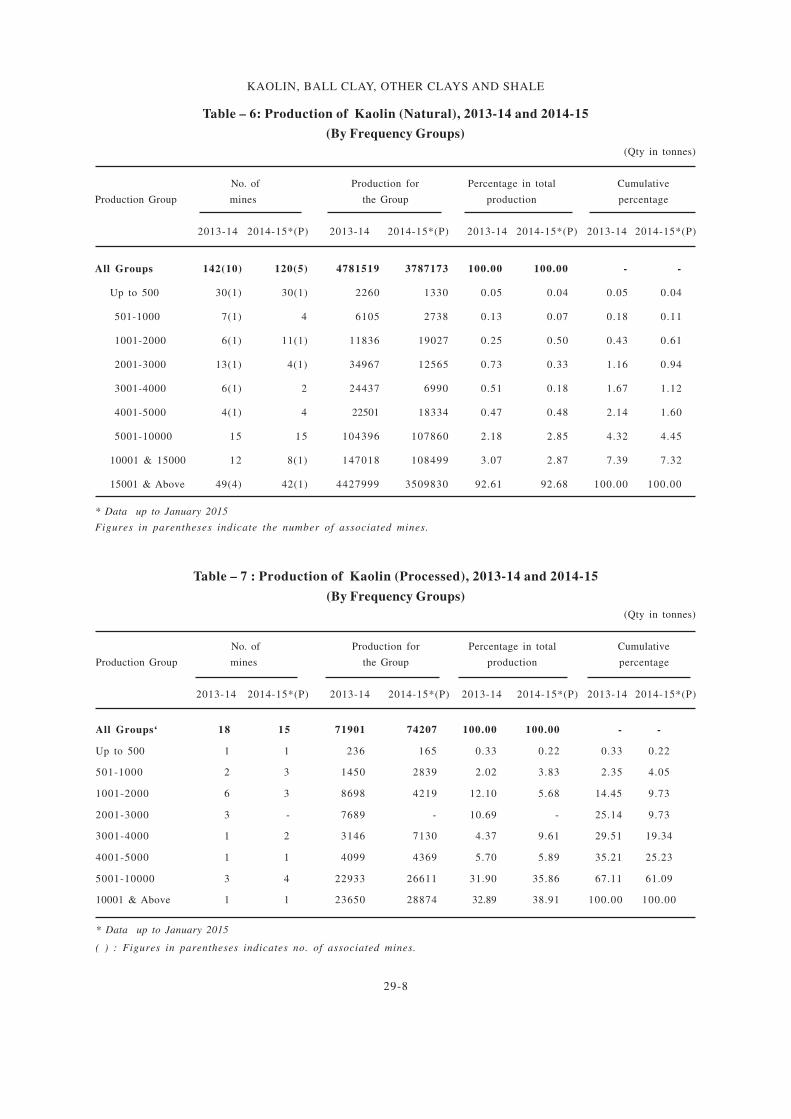
Table – 6: Production of Kaolin (Natural), 2013-14 and 2014-15
(By Frequency Groups)
(Qty in tonnes)
No. of Production for Percentage in total Cumulative
Production Group mines the Group production percentage
2013-14 2014-15*(P) 2013-14 2014-15*(P) 2013-14 2014-15*(P) 2013-14 2014-15*(P)
All Groups 142(10) 120(5) 4781519 3787173 100.00 100.00 - -
Up to 500 30(1) 30(1) 2260 1330 0.05 0.04 0.05 0.04
501-1000 7(1) 4 6105 2738 0.13 0.07 0.18 0.11
1001-2000 6(1) 11(1) 11836 19027 0.25 0.50 0.43 0.61
2001-3000 13(1) 4(1) 34967 12565 0.73 0.33 1.16 0.94
3001-4000 6(1) 2 24437 6990 0.51 0.18 1.67 1.12
4001-5000 4(1) 4 22501 18334 0.47 0.48 2.14 1.60
5001-10000 15 15 104396 107860 2.18 2.85 4.32 4.45
10001 & 15000 12 8(1) 147018 108499 3.07 2.87 7.39 7.32
15001 & Above 49(4) 42(1) 4427999 3509830 92.61 92.68 100.00 100.00
* Data up to January 2015
Figures in parentheses indicate the number of associated mines.
Table – 7 : Production of Kaolin (Processed), 2013-14 and 2014-15
(By Frequency Groups)
(Qty in tonnes)
No. of Production for Percentage in total Cumulative
Production Group mines the Group production percentage
2013-14 2014-15*(P) 2013-14 2014-15*(P) 2013-14 2014-15*(P) 2013-14 2014-15*(P)
All Groups‘ 18 15 71901 74207 100.00 100.00 - -
Up to 500 1 1 236 165 0.33 0.22 0.33 0.22
501-1000 2 3 1450 2839 2.02 3.83 2.35 4.05
1001-2000 6 3 8698 4219 12.10 5.68 14.45 9.73
2001-3000 3 - 7689 - 10.69 - 25.14 9.73
3001-4000 1 2 3146 7130 4.37 9.61 29.51 19.34
4001-5000 1 1 4099 4369 5.70 5.89 35.21 25.23
5001-10000 3 4 22933 26611 31.90 35.86 67.11 61.09
10001 & Above 1 1 23650 28874 32.89 38.91 100.00 100.00
* Data up to January 2015
( ) : Figures in parentheses indicates no. of associated mines.

29-9
KAOLIN, BALL CLAY, OTHER CLAYS AND SHALE
MINING, PROCESSING &
MARKETINGChina clay deposits worked in India are mostly
of pocket-type. Opencast manual mining is
followed in most kaolin mines. The most common
practice is to dig trial pits for locating clay pockets
or beds which are gradually enlarged into pits of
various dimensions. China clay is often soft and
easily extracted with no blasting required. Clay
and overburden are quarried in benches. In few
mines, bulldozers and excavators are used to
remove the overburden which is then transported
through trucks/tractors/trailers.
Crude china clay is normally processed.
Almost, all the china clay user industries except
cement, insecticide and refractory units consume
processed china clay. The natural china clay is
processed in the country mostly by conventional
method of levigation/washing. In addition, hi-tech
processes , such as , Mozeley hydrocyclone
separator, high-intensity magnetic separator,
bleaching (chemical decolourisation), spray
drying and calcination are in practice. There is a
need to use more sophis t ica ted process ing
techniques like ultra froth-flotation, cryo-filter,
etc.
The recovery percentage of processed china
clay from raw china clay ranges from as low as
14% to as high as 56%, depending upon the
quality of china clay available in different states.
Large number of levigation plants are installed in
the country mostly in Kerala, Gujarat, Jharkhand,
West Bengal and Rajasthan. Kerala has become a
hub for India's processed kaolin production. The
important plants in the country are English Indian
Clays Ltd (EICL) (240,000 tpy capacity), Veli,
Thiruvananthapuram, Kerala; Kerala Clays and
Ceramic Products Ltd, (10,000 tpy capacity)
Payangadi, Kannur district, Kerala; 20 Microns
Ltd, Mamuara, Bhuj district Kachchh, Gujarat
(80,500 tpy capacity; a new plant of 33,600 tpy is
also installed); Amrapali China Clay Washing
Plant, Nadapa, Bhuj, district Kachchh, Gujarat;
Mokdumnagar China Clay Processing Plant of
West Bengal Projects Ltd, Mohammad Bazar,
Birbhum district, West Bengal and Hindalco's
Beneficiation Plant at Bagru Plateau in Lohardaga
district, Jharkhand. EICL has capacity to
produce 240,000 tpy paper coating and filler
grades of processed china clay (hydrous), besides
60,000 tpy of calcined clays. Popular Minerals
are reported to be developing its mine and plant
in Chittorgarh, Rajasthan. Ashapura is also
establishing new production unit in Thiruv-
ananthapuram, Kerala with a 180,000 tpa kaolin
capacity of various grades - air floated, lumps,
hydrous and hydrous calcined kaolin reserves
with 96% kaolinite content. It also has china clay
processing plant at Bhujodi taluka, district Bhuj,
Gujarat.The new facility is the company's second
facility after the one operational in Kerala, and
make Ashapura one of the largest producer of
kaolin in Asia. Ashapura has already acquired
new mines having reserves of about 2.5 to
3.0 million tonnes in Kerala to meet high demand
for kaol in . Sat ish Minerals is a lso leading
manufacturer and processor of china clay with
18,000 tpy capacity plant at Kachchh, Gujarat. Uma
group of kaolin located in district, Gujarat is
engaged in mining, processing & trading of china
c lay. I t possess min ing a rea in Dagara &
Mamuara . Koat manufac tur ing company i s
engaged in processing of hydrous kaolin, calcined
kaolin & metakaolin, having plant of capacity
1000 mtpm at Kachchh, Gujarat. Hydrous Kaolin,
Vadodara manufac ture rs Leviga ted /Wate r
Washed/Deaminated/spray dried kaolin products
available from 75% to 84%(ISO) brightness.
Particle size 2 Micron-49% to 93% (packing
options available - 25 kg/50 kg/500 kg jumbo bags).
China clay powder manufacturers: Shree Umia
Sales Corpn. in GIDC Ahmedabad are exporters,
suppliers Indian china clay powder, ball clay.
Processed kaol in is present ly marketed
under various trade names mostly in levigated
Table – 8 : Mine-head Closing Stocks of Kaolin (Total)
2013-14 & 2014-15
(By States)(In tonnes)
State 2 0 1 3 - 1 4 2014-15*(P)
India 1209570 1267276
Andhra Pradesh # 18967 19050
Gujarat 287805 334575
Jharkhand 23702 13528
Karnataka 13270 15631
Kerala 30379 61494
Madhya Pradesh 8640 9570
Odisha 23304 17208
Rajasthan 780414 782860
Telangana # 1330 1330
West Bengal 21759 12030
*Data up to January 2015.
# Figures ment ioned agains t 2013-14 are o f d i s t r ic t
which are part of present Andhra Pradesh and Telangana
States.

29-10
KAOLIN, BALL CLAY, OTHER CLAYS AND SHALE
and spray dried forms. A small quantity of
crude kaolin is also marketed. The various trade
names under which the levigated kaol in is
marketed are Highest brightness calcined clays
for coated paper, excellent partial replacement for
TiO2. Zeta- balanced kaolin, highest brigntness
calcined clays for architectural decorative and
industrial coatings/inks. High brightness finer
hydrous clays for all kinds of acqueous paints,
exce l len t func t iona l c lays fo r a l l pa in t s
formulations. Calcined lumps for refractory grade
materials non-calcined lumps for refractories.
Highly reactive pozzolan, Meta kaolin for RMC
and cement application; kaolin for Agrochemicals,
Rubber & Plastics, soaps & detergents, Fibre glass
& ceramics. Improved processing techniques
could increase further the prospects of Indian
kaolin in the international markets.
USES AND SPECIFICATIONSChina clay (kaolin) is used in a number
of industries in both crude and processed forms.
The major use for crude china clay in India is
in the Cement Indus t ry, whereas Ceramic
Industry accounts for consumption of a major
share of processed form of china clay. Besides
ceramics, processed china clay finds use in other
industries in the country, such as sealants, paper
coatings, as extender in fibre glass, paint and as a
fil ler for paper, rubber, plastic, cosmetics,
pharmaceuticals and textiles. Crude china clay
also finds use in Insecticide and Refractory
Industries. Other uses of china clay are in ink,
ultramarine, synthetic zeolite, catalyst, water
filter candles, soaps & detergents and explosives
& pyrotechnic industries. Some of the areas
where use of china clay is gaining importance are
in the manufacture of plastic film, video and
audio tapes where clays are used as anti-blocking
agents , and in the f ie ld of biotechnology,
where ceramics are widely in use for its light
weight & high strength properties. EICL has been
producing Metakaolin for the concrete industry
for over a decade and now exporting regularly
to the UAE, Kuwait and Germany for the
durability of concrete by lime fixation and arresting
of deteriorat ion of concrete by weathering.
Himacem has high chemical resistance which
makes the product suitable for construction of
high span bridges, under-water structures and
chemical plants.
The Bureau of Ind ian S tandards (BIS)
has prescribed specifications for china clay to be
used in different industries. They are IS:505-1995
(Third Revision, Reaffirmed 2011) for paper
coating and f i l ler for paper, rubber, text i le
indus t r i es , IS :1463-1983 (Thi rd Revis ion ,
Reaffirmed 2000) for cosmetics and IS:7589-1974
(Reaffirmed 2011) for Explosive & Pyrotechnic
Industry. BIS has revised the specifications for
china clay for Ceramic Industry to IS:2840-2002
(Second Revision, Reaffirmed 2008) and for
paint industry to IS:68-2006. The whiteness,
particle size, plasticity, contents of alumina, iron
and titanium are some important factors which
control the specif icat ions of china clay for
different end-uses. China clay for ceramic and
refractory applications is analysed for gri t ,
b r igh tness , g reen and dry s t reng th , f ixed
colour, iron and alumina contents. For filler and
extender applications, it must meet very rigid
specifications, such as, particle size, colour,
b r igh tness and v i scos i ty (Tab le -9) . The
replacement of kaolin as a filler with precipitated
calcium carbonate (PCC) and ground calcium
carbonate (GCC), results in lowering consumption
of kaolin in paper industry.Now they are using
GCC due to a switch over by paper makers from
an acid-based processing route to an alkali-based
route for production. (Table - 9)
CONSUMPTIONThe main consuming indust ry for raw
china clay is the china clay processing/refining
plants . The china clay processed by these
plants in turn is consumed by various industries
excep t cement , r e f rac tory and pes t ic ide
indus t r i es . The da ta on raw ch ina c lay
consumption by various china clay processing
plants are not readily available. However, the
consumption of china clay by various industries
is given in Table-10.
Consumption of china clay decreased slightly
to 1,423 thousand tonnes in 2014-15, from
1,429 thousand tonnes in 2013-14. Cement
Indus t ry accounted for 47% consumpt ion
followed by ceramic (39%), the major consumer of
raw china clay. Pesticide, paint, refractory, paper,
cosmetic, rubber, abrasive, asbestos products,
chemical, dry cell batteries, textile, electrical,
electrode and glass industries together accounted
for the remaining 14%.

29-11
KAOLIN, BALL CLAY, OTHER CLAYS AND SHALE
Table – 9 : Specifications of China Clay Required in Different Industries
Filler inPaper paper,
Sl. Characteristics coating rubber, Cosmetics ExplosivesNo. Grade I textile
Grade II
1. Bureau of Indian Standard Specification No. 505 505 1463 7589(1995) (1995) (1983) (1974)
2. Fineness (by weight % material retained on:)45 microns sieve – – 2.0 –53 microns sieve 0.8 1.0 – –63 microns sieve – – – 1.090 microns sieve – – 0.1 –
3. Larger than 10 microns in diameter (% by mass, max) 5.0 15.0 – –
4. Smaller than 10 microns in diameter (% by mass, min) 75.0 60.0 – –
5. Grit (% by mass, max) – – – 0.001
6. Loss on Drying (% max) 2.0 2.0 1.5 1.5
7. Loss on Ignition (% max) 14-15.5 14-15.5 15 14.0
8. Water Plasticity (%) 14.0 – – –
9. Shrinkage lineara) Dry shrinking – – – –b) Fired shrinking – – – –
10. Relative/Bulk density 2.5-2.9 2.5-2.9 * 0.65-0.90(BD)
11. Colour reflectance to blue light (%) 80-85 * – –
12. Chemical (% by mass, max) – – @ –Fe
2O
30.6 0.75 0.5 –
Matter soluble in HCl 0.5-1 1.5-2.5 2.0 1.5CuO – 0.007 – –MnO – 0.013 – –Heavy metals (as Pb) – – 5 ppm –As
2O
3– 10 ppm 2 ppm –
pH value of aqueous extract 4.5-7.5 4.5-7.5 7.5 6.0-7.5
13. Oil absorption (ml/100 g) – 50 (min) – 35-45
14. Water soluble matter (%, max) – 0.5 – 0.5
* As agreed.@ To pass test for iron and carbonate as well.
Table - 10 : Consumption of Kaolin (China clay)*, 2012-13 to 2014-15(By Industries)
(In tonnes)
Industry 2 0 1 2 - 1 3 2013-14(R) 2014-15(P)
All Industr ies 1 4 3 0 1 0 0 1 4 2 9 4 0 0 1 4 2 3 1 0 0
Cement 664500(8 ) 662900(8 ) 662000(8 )
Ceramic 561500(237) 561500(237) 561700(237)
Cosmetic 2 3 0 0 ( 6 ) 2 3 0 0 ( 6 ) 2 3 0 0 ( 6 )
Glass 700(3 ) 700(3 ) 700(3 )
Pa in t 111100(26) 111100(26) 111100(26)
Paper 27700(23 ) 27700(23 ) 27700(23 )
Pesticide 24800(21 ) 24800(21 ) 24800(21 )
Refractory 32800(31 ) 33800(32 ) 28200(32 )
Rubber 2400(31) 2400(31) 2400(31)
Others 2300(42) 2200(43) 2300(43)(abrasives, asbestos-products, chemical, dry cellbattery, electrical, electrode and textile).
Figures rounded off.Figures in parentheses denote the number of units in organised sector reporting consumption.*: Paucity of data hence coverage may not be complete.

29-12
KAOLIN, BALL CLAY, OTHER CLAYS AND SHALE
TRADE POLICYAs per the Foreign Trade Policy (FTP)
2009-2014, there are no restrictions on exports and
imports of china clay (kaolin).
WORLD REVIEWThe world production of kaolin remained steady
at 26.9 million tonnes in 2014 as compared to
26.7 million tonne in the previous year. Seven countries,
namely, USA, Germany, China, Brazil, Ukraine, Iran and
Turkey accounted for about 68% world production.
The share of USA in total world production was about
22%, followed by Germany (16%), China (12%), Brazil
(6%), Ukraine (5%), Iran (4%) and Turkey (3%)
(Table-11).
Table – 12 : Exports of Kaolin(By Countries)
2013-14 2014-15 (P)Country
Qty Value Qty Value(t) (` '000) (t) (` '000)
All Countries 276165 1053487 258330 941752
UAE 205898 313147 198089 262280
Bangladesh 29010 134187 25392 135305
Iran 6349 68271 5799 89052
Germany 4753 78775 3174 55302
Sri Lanka 1896 31877 2448 38613
Indonesia 1244 27220 1518 35763
UK 1446 23426 1711 28745
Malaysia 1356 26409 1013 20958
South Africa 1430 22077 2043 20055
Turkey 791 16120 873 17036
Other countries 21992 311978 16270 238643
Table – 11 : World Production of Kaolin(By Principal Countries)
(In '000 tonnes)
Count ry 2 0 1 2 2 0 1 3 2 0 1 4
World: Total 27600 26700 26900
Belgium(e)
3 0 0 3 0 0 3 0 0
Brazil 2 3 8 8 2 1 3 9 1 7 0 6
China(e)
3 2 0 0 3 2 0 0 3 2 0 0
Czech Republic 6 2 4 6 0 9 6 1 7
Egypt(e)
3 0 0 300 (e ) 300
France 3 0 8 3 0 0 3 1 1
Germany 4 3 9 9 4 3 4 9 4 2 7 5
I r an 1 5 0 3 1000 (e ) 1000 (e )
Korea, Rep. of 7 9 7 8 4 7 6 8 3
Malaysia 4 3 9 2 9 3 2 0 8
Mexico 5 1 5 6 7 0 600 (e )
Portugal 3 2 2 2 4 8 2 6 5
Spain 4 0 2 4 1 1 3 5 0
Turkey 9 8 8 1 0 2 7 7 3 4
Ukraine 1 2 1 8 1 1 7 9 1 4 2 6
USA 5 9 8 0 5 9 5 0 5 8 3 0
Vietnam(e)
6 5 0 6 5 0 6 5 0
Other countries 3 2 6 7 3 2 2 8 4 4 4 5
Source: World Mineral Production, 2010-2014.
USAKaMin LLC is to buy Imerys US based global
ultraline paperhydrous kaolin (UPHK) business
to bolster its expertise in kaolin & boost its
product offering. The UPHK business is par of
Imery's recent acquisi t ion of BASF's paper
hadrous kaolin business (PHK). Under the term
of agrement, Imerys will retain all of the non-UPHK
business from the BASF transaction.
The Germany-headquarter and Chemical CompanyBASF has completed the divestment of its global PHKbusiness to Imerys under the term of agreement, BASFwll continue to produce and supply PHK products toImerys for a perod of time determined by the FrenchCompany to ensure a smooth transtion of customersBASF continues to be a leading global supplier to thepaper industry and offers a wide range of products forpaper manufacturing & coating.
AustraliaTellu Holdings Ltd is developing the Sandy Ridge
facility 140km NW of Kalgoordie, Western Australiaprimarily for waste disposal in voids created by themining and for processing of the removed kaolin.
In Western Australia, the kaolinised ganitedeposits were evaluated in great detail by CRA/RioTinto in Wickepin area, 180 km SE of Perth. These wereacquired some years ago by WA kaolin HoldngsPvt.Ltd. (WAK).
FOREIGN TRADEExports
Exports of kaolin decreased marginallyto 258,330 tonnes in 2014-15 from 276,165 tonnes in2013-14. UAE (77%) and Bangladesh (10%)were the major importing countries in 2014-15 (Table-12).
Imports
Imports of kaolin increased to 93,322 tonnes in2014-15 from 80,204 tonnes in 2013-14. Major supplierswere USA (61%) Ukraine (12%),China (7%) and UK(4%) (Table- 13).

29-13
KAOLIN, BALL CLAY, OTHER CLAYS AND SHALE
FUTURE OUTLOOKIndia has abundant resources of kaolin which
can easily meet both the internal and the external
demands. The processing of kaolin in the country
is done mostly by conventional methods like
levigation and washing. New capacities for High-
tech processing have to be establ ished and
existing capacities in the country have to be
augmented to meet the demand of processed
kaolin in the future.
In the Indian kaolin market, good growth is
expected both for hydrous and calcined clay
particularly in paint, cables, plastics, rubber and
ceramics. The apparent demand of china clay is
estimated at 4.61 million tonnes by 2016-17 and that
of ball clay at 1.82 million tonnes by 2016-17 at 9%
growth rate by the Planning Commission of India.
2. Ball ClayBall clay commonly consists of 20-80%
kaolinite, 10-25% mica & 6-65% quartz. Ball clay
and china clay differ only in the degree of
plasticity. China clay is less plastic than ball clay.
Ball clay is a highly plastic variety of kaolin having
high b ind ing power, t ens i l e s t reng th and
shrinkage. It is utilised generally after mixing
Table – 13 : Imports of Kaolin(By Countries)
2013-14 2014-15(P)Country
Qty Value Qty Value(t) (` '000) (t) (` '000)
All Countries 80204 1420872 93322 1662634
USA 44271 878669 56759 1135291
Ukraine 8863 91287 10818 117987
China 10955 158652 6136 92907
France 4740 91538 3332 62199
UK 2093 38112 3409 52895
Spain 96 1648 1474 42099
Germany 1058 18785 2154 36618
Czech Republic 203 3641 2215 27946
New Zealand 399 15289 504 19526
Iran 1918 12142 2330 18303
Other countries 5608 111109 4191 56863
with non-plast ic clay to impart the desired
plasticity in pottery, porcelain and refractory
materials. It also helps in the preparation of glaze,
enamels and for imparting a dense vitrified body.
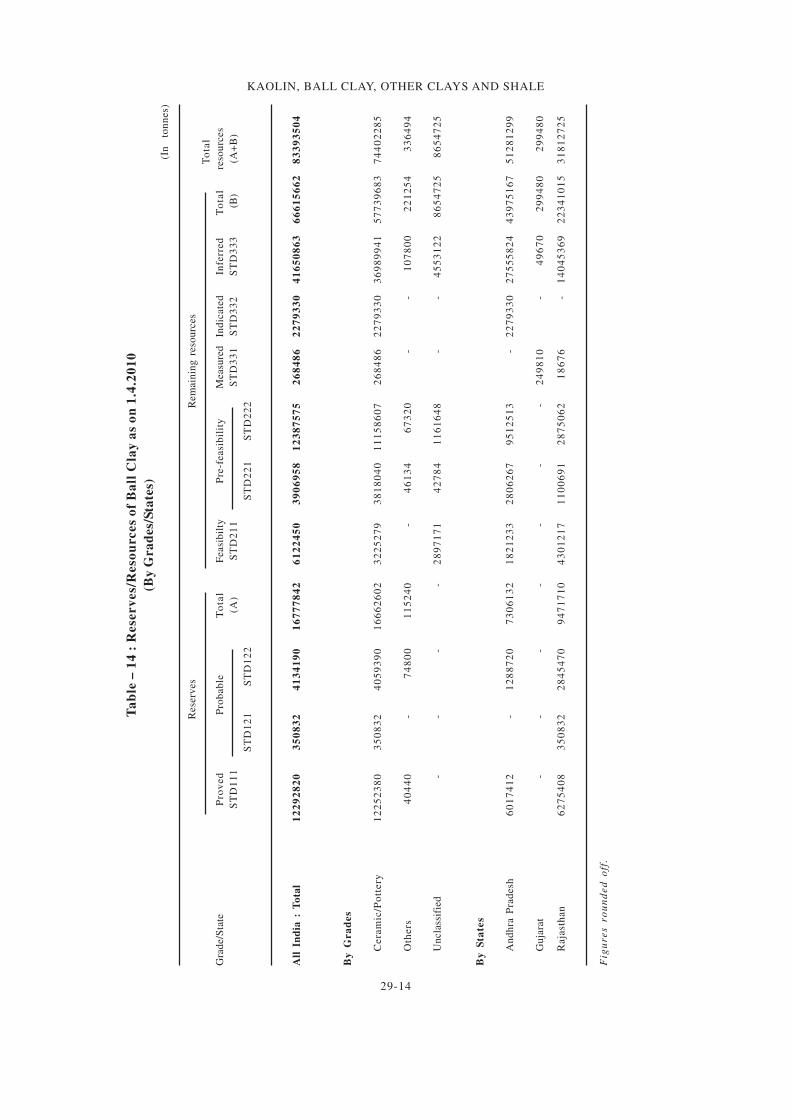
RESOURCESDeposits of ball clays are relatively scarce
due to the combination of geological factors
needed for their formation.The total resources of
ball clay as on 1.4.2010 in the country are placed
at 83.39 million tonnes. Out of these resources,
the reserves are about 16.78 million tonnes and
the remaining resources are 66.61 million tonnes.
More than 62% resources are in Andhra Pradesh,
followed by Rajasthan with 38%. Resources in
Gujarat are nominal. Out of the total resources,
ceramic/pottery grade constitutes 89%. All India
reserves/resources of ball clay are given in
Table-14.
PRODUCTION, STOCKS &
PRICES
The production of ball clay at 1,910 thousand
tonnes in 2014-15 (upto January 2015) increased
by 10% as compared to that in the previous year.
During the year under review, there were
54 reporting mines as against 48 in 2013-14.
Besides, production of ball clay was reported
as an assoc ia ted minera l by twelve mines
during 2014-15 as against 13 in 2013-14. Ten
principal producers accounted for about 64% of
total production. The share of public sector mines
in the total production was nominal as compared
to about 1% in the preceding year.
Rajasthan continued to be the leading state
in ball clay production accounting for 92% of the
total production followed by Andhra Pradesh with
8%. Nominal production was reported from Tamil
Nadu. (Tables -15 to 17 )
Mine-head closing stock of ball clay for the
year 2014-15 (upto January 2015) was 1,147
thousand tonnes as against 1 ,147 thousand
tonnes in the previous year. (Table-18)
The average daily employment of labour in
2014-15 was 625 as against 750 in the previous
year.
Domestic prices of ballclay are furnished in
the General Review on 'Prices'.
29-14
KAOLIN, BALL CLAY, OTHER CLAYS AND SHALE
Ta
ble
– 1
4 :
Rese
rv
es/
Reso
urces
of
Ba
ll C
lay
as
on
1.4
.20
10
(By
Gra
des/
Sta
tes)
(In
to
nn
es)
Rese
rves
Rem
ain
ing
reso
urc
es
To
tal
Gra
de/S
tate
Pro
ved
Pro
bab
leT
ota
lF
easi
bil
tyP
re-f
easi
bil
ity
Measu
red
Ind
icate
dIn
ferr
ed
To
tal
reso
urc
es
ST
D1
11
(A)
ST
D2
11
ST
D3
31
ST
D3
32
ST
D3
33
(B
)(A
+B
)
ST
D1
21
ST
D1
22
ST
D2
21
ST
D2
22
All
In
dia
: T
ota
l1
22
92
82
03
50
83
24
13
41
90
16
77
78
42
61
22
45
03
90
69
58
12
38
75
75
26
84
86
22
79
33
04
16
50
86
36
66
15
66
28
33
93
50
4
By
Gra
des
Cera
mic
/Po
ttery
12
25
23
80
35
08
32
40
59
39
01
66
62
60
23
22
52
79
38
18
04
01
11
58
60
72
68
48
62
27
93
30
36
98
99
41
57
73
96
83
74
40
22
85
Oth
ers
40
44
0-
74
80
01
15
24
0-
46
13
46
73
20
--
10
78
00
22
12
54
33
64
94
Un
cla
ssif
ied
--
--
28
97
17
14
27
84
11
61
64
8-
-4
55
31
22
86
54
72
58
65
47
25
By
Sta
tes
An
dh
ra P
rad
esh
60
17
41
2-
12
88
72
07
30
61
32
18
21
23
32
80
62
67
95
12
51
3-
22
79
33
02
75
55
82
44
39
75
16
75
12
81
29
9
Gu
jara
t-
--
--
--
24
98
10
-4
96
70
29
94
80
29
94
80
Raja
sth
an
62
75
40
83
50
83
22
84
54
70
94
71
71
04
30
12
17
11
00
69
12
87
50
62
18
67
6-
14
04
53
69
22
34
10
15
31
81
27
25
Fig
ure
s ro
un
de
d o
ff.

29-15
KAOLIN, BALL CLAY, OTHER CLAYS AND SHALE
Table – 15 : Principal Producers of Ball Clay2014-15
Location of mineName & address of producer
State District
* Shanta Sales Corporation, Rajasthan Bikaner
H/o Mohanlal Mathur,
Behind Rajasthan Pan Bhandar,
Rani Bazar,
Bikaner-334 001,
Rajasthan.
Jaichand Lal Daga, Rajasthan Bikaner
1st Floor,
Labhuji Ka Katla,
Kotegate,
Bikaner - 334 001,
Rajasthan.
Anirudh Mines & Minerals, Rajasthan Bikaner
Near Ramdev Park,
Outside Nathusar Gate,
Bikaner – 334 004,
Rajasthan.
Sunder Lal Daga, Rajasthan Bikaner
Bagree Mohalla,
Bikaner-334 001,
Rajasthan.
* Sampat Lal Daga, Rajasthan Bikaner
1st Floor,
Labhu Ji Ka Katla,
Bikaner-334 001,
Rajasthan.
Location of mine
Name & address of producer
State District
(Table - 15 Concld.)
(Contd.)
Sandeep Chandna, Rajasthan Bikaner
Ramnath Sadan,
Near Arya Samaj Mandir,
Rathkhana Colony,
Bikaner-334 001,
Rajasthan.
* Narendra Kumar Devra, Rajasthan Bikaner
Ward No. 51,
Near Ratan Sagar Well,
Bikaner-334 001,
Rajasthan.
* Smt Rama Devi Sharma, Rajasthan Bikaner
99-100, Industrial Area,
Road No.-9, Rani Bazar,
Bikaner-334 001,
Rajasthan.
Vijayabharti Corporation, Andhra- West-
Door No. 22 D-3-30/1, Pradesh Godawari
Ramalayam Street,
Ramkrishnapuram,
Eluru, West Godawari-534 002,
Andhra Pradesh.
Surendra Singh Baid, Rajasthan Bikaner
1-B-10, Pawanpuri,
Bikaner-334 001,
Rajasthan.
Table – 16 : Production of Ball clay, 2012-13 to 2014-15(By States)
(Qty in tonnes; Value in `'000)
2012-13 2013-14 2014-15* (P)State
Quantity Value Quantity Value Quantity Value
India 1750559 780732 2130995 1055362 1910060 920542
Andhra Pradesh 184345 99828 143430 75352 148774 77414
Gujarat 10900 1853 8600 1462 - -
Rajasthan 1541981 665585 1974501 975423 1760526 842596
Tamil Nadu 13333 13466 4464 3125 760 532
* Data up to January, 2015
* Associated mines of ball clay with clay (others) and fireclay.

29-16
KAOLIN, BALL CLAY, OTHER CLAYS AND SHALE
Table – 17 : Production of Ball clay, 2013-14 and 2014-15(By Sectors/States/Districts)
(Qty in tonnes; Value in `’000)
2 0 1 3 - 1 4 2014-15* (P)State/Distr ict
No. of Quant i ty Value No. of Quant i ty Valuemines mines
India 58(13) 2130995 1055362 54(12) 1910060 920542
Public Sector 1 4464 3125 1 760 532Private Sector 57(13) 2126531 1052237 53(12) 1909300 920010
Andhra Pradesh 13(1) 143430 75352 9 148774 77414 Chittor 1 360 199 - - - West Godavari 12(1) 143070 75153 9 148774 77414Gujarat 2 8600 1462 - - -
Kutch 1 200 34 - - - Patan 1 8400 1428 - - -
Rajasthan 42(12) 1974501 975423 44(12) 1760526 842596Bikaner 41(12) 1970176 973438 42(12) 1742536 833962Pali 1 4325 1985 2 17990 8634
Tamil Nadu 1 4464 3125 1 760 532
Cuddalore 1 4464 3125 1 760 532
* Data up to January, 2015
( ) Figures in parentheses indicate associated mines of ball
clay (others), fireclay and kaolin.
Table – 18 : Mine-head Closing Stocks of Ball Clay
2013-14 & 2014-15
(By States)
(In tonnes)
State 2 0 1 3 - 1 4 2014-15*(P) :
India 1146657 1048205
Andhra Pradesh 156849 156727
Gujarat 267711 147923
Rajasthan 714674 741530
Tamil Nadu 7423 2025
Table – 19 : Consumption* of Ball clay
2012-13 to 2014-15
(By Industries)
(In tonnes)
Industry 2012-13 2013-14 (R) 2014-15(P)
All Industries 585000 582500 583800
Ceramic(e)
565200(222) 565200(222) 565200(222)
Refractory 19700(30) 17200(30) 18500(30)
Others (Abrasive) 100(3) 100(3) 100(3)
Figures rounded off.Figures in parentheses denote the number of units in the
organised sector.* Paucity of data hence coverage may not be completed.SPECIFICATIONS
The specifications for plastic clay and washedplastic clay for use in Ceramic Industry areprescribed vide IS:4589-2002 (Third Revision,reaffirmed 2008 ).
CONSUMPTIONConsumption of ball clay decreased slightly
from 582,000 tonnes in 2013-14 to 583,800 tonnesin 2014-15 . About 97% consumpt ion wasaccounted for by the Ceramic Industry. Theremaining consumption was reported by theRefractory and Abrasive Industries (Table- 19).
FOREIGN TRADEExports
Exports of ball clay increased substantiallyto 57,557 tonnes in 2014-15 from 35,694 tonnesin the previous year. Exports were mainly toBangladesh (46%) and Oman (21%) (Table- 20).
ImportsImports of ball clay decreased considerably
to 125,384 tonnes in 2014-15 as compared to130,804 tonnes in the previous year. Imports weremainly from Ukraine (49%), Malaysia (18%),UK (17%) and China (11%) (Table- 21).
Table – 20 : Exports of Ball Clay
(By Countries)
2013-14 2014-15(P)
Country
Qty Value Qty Value
(t) (` '000) (t) (` '000)
All Countries 35694 158847 57557 194269
Bangladesh 27248 125715 26620 110583
Oman 6902 23088 12150 29976
UAE 380 1183 7097 18138
Saudi Arabia 26 171 8875 17977
Iran 27 158 749 5461
Malaysia 420 3555 1000 5365
Kuwait 252 1452 714 4708
Kenya 240 1597 264 1408
Sri Lanka 26 222 57 465
China - - 1 54
Other countries 173 1705 30 134
* Data up to January, 2015

29-17
KAOLIN, BALL CLAY, OTHER CLAYS AND SHALE
3. Clay (others)Clay under this category includes aluminous,
ferruginous and tile & brick making clays.
PRODUCTION, STOCKS &
PRICESThe production of clay (others) at 2,248 thousand
tonnes in 2014-15 (up to January 2015) decreased byabout 10% as compared to 2,507 thousand tonnes inthe previous year.
There were 43 reporting mines in 2014-15 asagainst 55 mines in the previous year. Besidesproduction of clay (others) was reported by28 mines as associated mineral in 2014-15 and 33for the previous year. About, 37% of the totalproduction of clay (others) was reported as anassociated mineral. Entire production of clay(others ) was contributed by private sector. About69% of the total production was contributed byeight principal producers.
Gujarat, the major producing state, accountedfor about 67% of the total production during theperiod under review, followed by Madhya Pradesh(16%), Kerala (6%), Rajasthan (5%) and theremaining 6% was reported from Andhra Pradesh& Telangana.
Nineteen mines and twelve associated mines
having annual production more than 10,000 tonnescontributed about 97% of the total production
(Tables- 22 to 25)
Mine-head closing stock of clay (others)for the year 2014-15 was 205 thousand tonnesas against 202 thousand tonnes in the previousyear (Table - 26)
The average daily employment of labour
was 405 during 2014-15 as against 603 in the
previous year.
Domestic prices of clay are furnished in the
General Review on 'Prices'.
Table – 21 : Imports of Ball Clay(By Countries)
2013-14 2014-15 (P)Country
Qty Value Qty Value(t) (` '000) (t) (` '000)
All Countries 130804 915231 125384 957636
Ukraine 52554 400319 61021 453872
UK 18267 226682 21224 242144
China 9995 80512 14223 110337
Malaysia 45363 145379 22853 65585
USA 518 11548 983 22178
Thailand 1960 20440 2130 22125
Portugal 1508 16887 1300 13719
Spain - - 702 9235
France 236 3081 446 5412
Japan 100 2565 180 5325
Other countries 303 7818 322 7704
Table – 22 : Principal Producers of Clay(Others), 2014-15
Location of mineName and address of producer
State District
Bhupendra Reva Sankar Gor, Gujarat Kachchh
66, Devkrupa, Limbda Street,
Bhuj, Kachchh - 370 001,
Gujarat.
* ACC Ltd., Madhya- Katni
‘Cement House’, Pradesh
121, Maharshi Karve Road,
Mumbai – 400 020,
Maharashtra.
English India Clays Ltd., Kerala Thiruvanan-
TC-79/04, Veli, thapuram
Thiruvananthapuram–695 021,
Kerala.
Ishvarlal Nanjibhai Bhavani, Gujarat Kachchh
113-114, Pooja-B,
Behind ICICI Bank,
Station Road, Bhuj - 370 001,
Distt. Kachchh,
Gujarat.
Kissan Minerals, Gujarat Kachchh
Shop No. 4, Mate Buiding,
Salari Naka Road,
Rapar-370 165,
Distt. Kachchh,
Gujarat.
Ratanbhai Dalabhai Gohil, Gujarat Kachchh
Goyalvas, Bhimasar (Bhuj),
Rapar-370 160,
Distt. Kachchh,
Gujarat.
*Shankarlal Gangaram Thakkar, Gujarat Patan
DBZ South-157, Zanda Chowk,
Gandhidham-370 201,
Distt. Kachchh,
Gujarat.
Satyam Minerals, Gujarat Kachchh
Survey No.947, Paiki,
Hamirpar Moti, Rapar–370 165,
Distt. Kachchh,
Gujarat.
* Producing clay (others) as an associated mineral.

29-18
KAOLIN, BALL CLAY, OTHER CLAYS AND SHALE
Table – 23 : Production of Clay (Others), 2012-13 to 2014-15(By States)
(Qty in tonnes; value in `’000)
2012-13 2013-14 2014-15*(P)State
Quantity Value Quantity Value Quantity Value
India 2680726 353628 2506662 382002 2248184 384286
Andhra Pradesh # 76574 9648 63622 7806 50920 7264
Gujarat 1928419 256099 1612566 253614 1515449 253461
Kerala - - 78703 10571 141843 17346
Madhya Pradesh 436329 44447 437150 56800 365273 50420
Rajasthan 152534 34361 241396 45627 122784 50447
Tamil Nadu 4770 692 - - - -
Telangana # 82100 8381 73225 7584 51915 5348
Table – 24: Production of Clay (Others), 2013-14 and 2014-15(By Sectors/States/Districts)
(Qty in tonnes; Value in `’000)
2013-14 2014-15*(P)
State/District No. of Quantity Value No. of Quantity Valuemines mines
India 55(33) 2506662 382002 43(28) 2248184 384286 Private Sector 55(33) 2506662 382002 43(28) 2248184 384286
Andhra Pradesh # 9(6) 63622 7806 5(5) 50920 7264 Anantapur (3) 9893 1131 (3) 9097 1098 Cuddapah 3 4892 732 2 3281 571 Godavari East 1 673 135 - - - Krishna (1) 14100 1692 (1) 10600 1535 Kurnool 5(2) 34064 4116 3(1) 27942 4060
Gujarat 29(16) 1612566 253614 26(12) 1515449 253461
Amreli 1 40143 5981 1 33659 5246
Bhavnagar 1* - - 1* - - Kutch 27(13) 1447773 229002 24(9) 1388105 232743 Patan (3) 124650 18631 (3) 93685 15472
Kerala 2 78703 10571 2 141843 17346 Thiruvananthapuram 2 78703 10571 2 141843 17346
Madhya Pradesh 1(8) 437150 56800 (9) 365273 50420
Jabalpur (2) 13600 3164 (2) 8520 2073Katni (3) 412809 51592 (3) 343771 45910Sagar - - - (2) 2160 270
Satna 1(3) 10741 2044 (2) 10822 2167
Rajasthan 10(2) 241396 45627 6(2) 122784 50447
Bikaner 7(1) 234009 42303 6(1) 109034 44340
Jaisalmer 1* - - - - -
Karauli (1) 7387 3324 (1) 13750 6107
Nagaur 2* - - - - -
Tamil Nadu 2* - - 2* - -
Tiruchirapalli 2* - - 2* - -
Telangana # 2(1) 73225 7584 2 51915 5348
Adilabad 2(1) 73225 7584 2 51915 5348
Figures in parentheses indicate number of associated mines of Clay (others) with ball clay, dolomite, kaolin/chnaclay, laterite, limestone, ochre & steatite.Data up to January 2015* only labour or production of associated mineral reported.# : Figures mentioned against 2013-14 are of distiricts which are part of present Andhra Pradesh and TelanganaStates.
*Data up to January 2015# : Figures mentioned against 2013-14 are of districts which are part of present Andhra Pradesh and Telanganastates.

29-19
KAOLIN, BALL CLAY, OTHER CLAYS AND SHALE
Table – 25 : Production of Clay (Others), 2013-14 and 2014-15*
(By Frequency Groups)(Qty in tonnes)
No. of mines Production for Percentage in total Cumulative
Production the group production percentage
group
2013-14 2014-15*(P) 2013-14 2014-15*(P) 2013-14 2014-15*(P) 2013-14 2014-15*(P)
All Groups 55(33) 43(28) 2506662 2248184 100.00 100.00 - -
Upto 5000 29(15) 22(13) 38874 28266 1.55 1.26 1.55 1.26
5001 to 10000 5(5) 2(3) 70217 35231 2.80 1.56 4.35 2.82
10001 to 20000 3(3) (4) 85202 47420 3.40 2.11 7.75 4.93
20001 to 30000 4(3) 8 179950 186783 7.18 8.31 14.93 13.24
30001 & above 14(7) 11(8) 2132419 1950484 85.07 86.76 100.00 100.00
* Data up to January, 2015( ): Figures in parentheses indicate number of Associated mines of Clay (Others) with ball clay, dolomite, kaolin/ china clay, laterite, limestone, ochre & Talc/soapstone/steatite.
Table – 26 : Mine-head Closing Stocks of Clay (Others), 2013-14 & 2014-15
(By States)
(In tonnes)
State 2 0 1 3 - 1 4 2014-15(P)
India 201520 204871
Andhra Pradesh # 21444 9643
Gujarat 80857 91801
Karnataka 6000 829
Madhya Pradesh 70682 73544
Rajasthan 19344 24441
Telangana # 1560 2980
West Bengal 1633 1633
FOREIGN TRADE
Exports
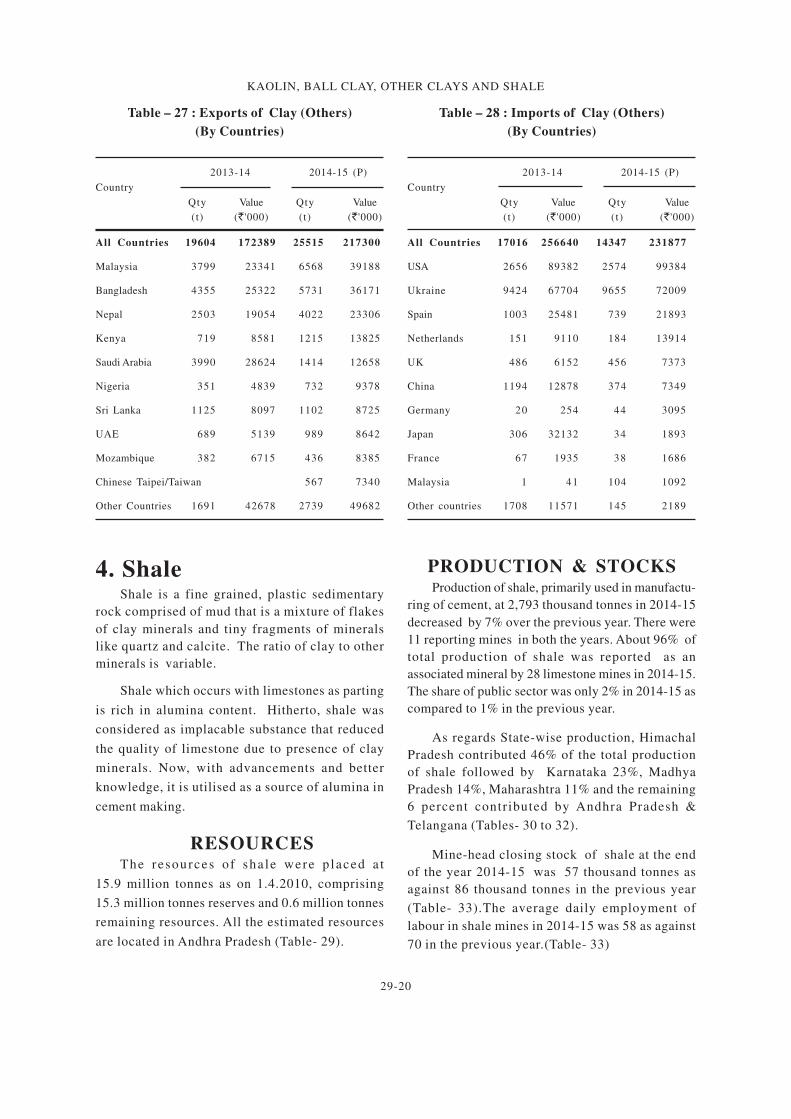
Expor t s o f c lay (o thers ) inc reased to
25 ,515 tonnes in 2014-15 f rom 19 ,604
tonnes in 2013-14 . Expor t s were main ly
to Malaysia (26%), Bangladesh (22%) and Nepal
(16%) (Table- 27).
* Data up to January 2015# : Figures mentioned against 2013-14 are of districts which are part of present Andhra Pradesh and Telanganastates.
Imports
Impor t s o f c lay (o thers ) decreased to
14,347 tonnes in 2014-15 from 17,016 tonnes in
2013-14. Ukraine (67%), USA (18%) were the main
suppliers (Table- 28).
29-20
KAOLIN, BALL CLAY, OTHER CLAYS AND SHALE
4. ShaleShale is a fine grained, plastic sedimentary
rock comprised of mud that is a mixture of flakes
of clay minerals and tiny fragments of minerals
like quartz and calcite. The ratio of clay to other
minerals is variable.
Shale which occurs with limestones as parting
is rich in alumina content. Hitherto, shale was
considered as implacable substance that reduced
the quality of limestone due to presence of clay
minerals. Now, with advancements and better
knowledge, it is utilised as a source of alumina in
cement making.
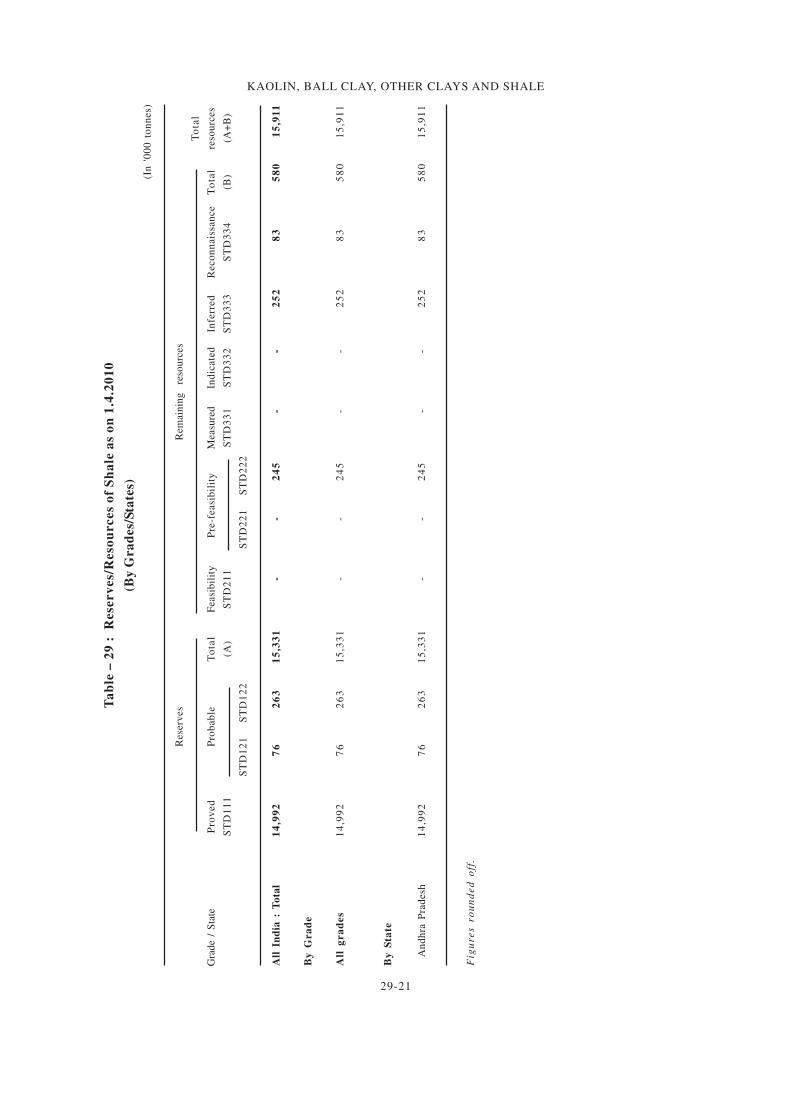
RESOURCESThe resources o f sha le were p laced a t
15.9 million tonnes as on 1.4.2010, comprising
15.3 million tonnes reserves and 0.6 million tonnes
remaining resources. All the estimated resources
are located in Andhra Pradesh (Table- 29).
Table – 27 : Exports of Clay (Others)
(By Countries)
2013-14 2014-15 (P)
Country
Qty Value Qty Value
(t) (` '000) (t) (` '000)
All Countries 19604 172389 25515 217300
Malaysia 3799 23341 6568 39188
Bangladesh 4355 25322 5731 36171
Nepal 2503 19054 4022 23306
Kenya 719 8581 1215 13825
Saudi Arabia 3990 28624 1414 12658
Nigeria 351 4839 732 9378
Sri Lanka 1125 8097 1102 8725
UAE 689 5139 989 8642
Mozambique 382 6715 436 8385
Chinese Taipei/Taiwan 567 7340
Other Countries 1691 42678 2739 49682
Table – 28 : Imports of Clay (Others)
(By Countries)
2013-14 2014-15 (P)
Country
Qty Value Qty Value
(t) (` '000) (t) (` '000)
All Countries 17016 256640 14347 231877
USA 2656 89382 2574 99384
Ukraine 9424 67704 9655 72009
Spain 1003 25481 739 21893
Netherlands 151 9110 184 13914
UK 486 6152 456 7373
China 1194 12878 374 7349
Germany 20 254 44 3095
Japan 306 32132 34 1893
France 67 1935 38 1686
Malaysia 1 41 104 1092
Other countries 1708 11571 145 2189
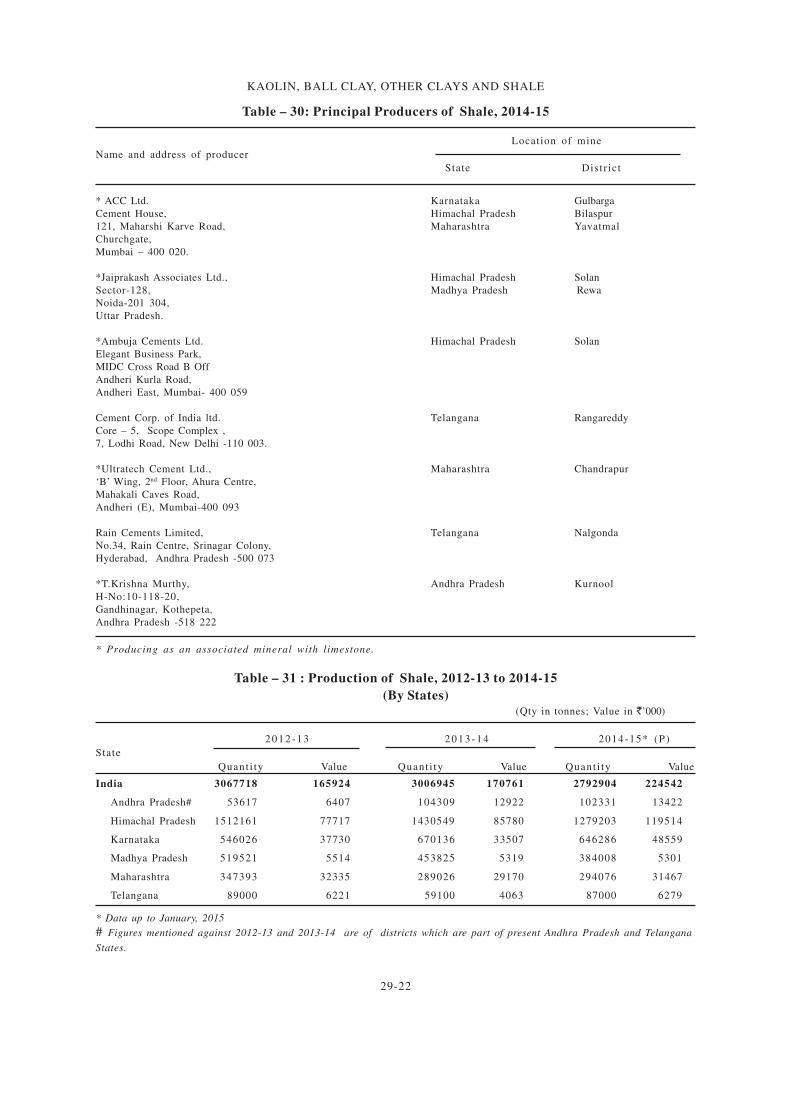
PRODUCTION & STOCKSProduction of shale, primarily used in manufactu-
ring of cement, at 2,793 thousand tonnes in 2014-15
decreased by 7% over the previous year. There were
11 reporting mines in both the years. About 96% of
total production of shale was reported as an
associated mineral by 28 limestone mines in 2014-15.
The share of public sector was only 2% in 2014-15 as
compared to 1% in the previous year.
As regards State-wise production, Himachal
Pradesh contributed 46% of the total production
of shale followed by Karnataka 23%, Madhya
Pradesh 14%, Maharashtra 11% and the remaining
6 percent contributed by Andhra Pradesh &
Telangana (Tables- 30 to 32).
Mine-head closing stock of shale at the end
of the year 2014-15 was 57 thousand tonnes as
against 86 thousand tonnes in the previous year
(Table- 33).The average daily employment of
labour in shale mines in 2014-15 was 58 as against
70 in the previous year.(Table- 33)
29-21
KAOLIN, BALL CLAY, OTHER CLAYS AND SHALE
Ta
ble
– 2
9 :
R
ese
rv
es/
Reso
urces
of
Sh
ale
as
on
1.4
.20
10
(By
Gra
des/
Sta
tes)
(In
'0
00
to
nn
es)
Rese
rves
Rem
ain
ing
re
sou
rces
To
tal
Gra
de
/ S
tate
Pro
ved
Pro
bab
leT
ota
lF
easi
bil
ity
Pre
-feasi
bil
ity
Measu
red
Ind
icate
dIn
ferr
ed
Reco
nn
ais
san
ce
To
tal
reso
urc
es
ST
D1
11
(A)
ST
D2
11
ST
D3
31
ST
D3
32
ST
D3
33
ST
D3
34
(B)
(A+
B)
ST
D1
21
ST
D1
22
ST
D2
21
ST
D2
22
All
In
dia
: T
ota
l1
4,9
92
76
26
31
5,3
31
--
24
5-
-2
52
83
58
01
5,9
11
By
Gra
de
All
gra
des
14
,99
27
62
63
15
,33
1-
-2
45
--
25
28
35
80
15
,91
1
By
Sta
te
An
dh
ra P
rad
esh
14
,99
27
62
63
15
,33
1-
-2
45
--
25
28
35
80
15
,91
1
Fig
ure
s ro
un
de
d o
ff.
29-22
KAOLIN, BALL CLAY, OTHER CLAYS AND SHALE
Table – 30: Principal Producers of Shale, 2014-15
Location of mine
Name and address of producer
State Distr ict
* ACC Ltd. Karnataka Gulbarga
Cement House, Himachal Pradesh Bilaspur
121, Maharshi Karve Road, Maharashtra Yavatmal
Churchgate,
Mumbai – 400 020.
*Jaiprakash Associates Ltd., Himachal Pradesh Solan
Sector-128, Madhya Pradesh Rewa
Noida-201 304,
Uttar Pradesh.
*Ambuja Cements Ltd. Himachal Pradesh Solan
Elegant Business Park,
MIDC Cross Road B Off
Andheri Kurla Road,
Andheri East, Mumbai- 400 059
Cement Corp. of India ltd. Telangana Rangareddy
Core – 5, Scope Complex ,
7, Lodhi Road, New Delhi -110 003.
*Ultratech Cement Ltd., Maharashtra Chandrapur
‘B’ Wing, 2nd Floor, Ahura Centre,
Mahakali Caves Road,
Andheri (E), Mumbai-400 093
Rain Cements Limited, Telangana Nalgonda
No.34, Rain Centre, Srinagar Colony,
Hyderabad, Andhra Pradesh -500 073
*T.Krishna Murthy, Andhra Pradesh Kurnool
H-No:10-118-20,
Gandhinagar, Kothepeta,
Andhra Pradesh -518 222
* Producing as an associated mineral with limestone.
Table – 31 : Production of Shale, 2012-13 to 2014-15
(By States) (Qty in tonnes; Value in `’000)
2 0 1 2 - 1 3 2 0 1 3 - 1 4 2014-15* (P)
State
Quant i ty Value Quant i ty Value Quant i ty Value
India 3067718 165924 3006945 170761 2792904 224542
Andhra Pradesh# 53617 6407 104309 12922 102331 13422
Himachal Pradesh 1512161 77717 1430549 85780 1279203 119514
Karnataka 546026 37730 670136 33507 646286 48559
Madhya Pradesh 519521 5514 453825 5319 384008 5301
Maharashtra 347393 32335 289026 29170 294076 31467
Telangana 89000 6221 59100 4063 87000 6279
* Data up to January, 2015
# Figures mentioned against 2012-13 and 2013-14 are of districts which are part of present Andhra Pradesh and Telangana
States.

29-23
KAOLIN, BALL CLAY, OTHER CLAYS AND SHALE
Table – 32 : Production of Shale, 2013-14 & 2014-15
(By Sectors/States/Districts)
(Qty in tonnes; Value in ` ’000)
2 0 1 3 - 1 4 2014-15*(P)State/Distr ict
No. of mines Quant i ty Value No. of mines Quant i ty Value
India 11(31) 3006945 170761 11(28) 2792904 224542
Public Sector 1 24100 2217 1 45500 4147
Private Sector 10(31) 2982845 168544 10(28) 2747404 220395
Andhra Pradesh# 4(20) 104309 12922 4(18) 102331 13422
Anantpur 1(10) 30320 4328 1(8) 36990 5374
Guntur 1 700 140 1 3941 785
Kurnool 2(10) 73289 8454 2(10) 61400 7263
Himachal Pradesh (3) 1430549 85780 (3) 1279203 119514
Bilaspur (1) 488050 28795 (1) 446100 41325
Solan (2) 942499 56985 (2) 833103 78189
Karnataka ( 1 ) 670136 33507 ( 1 ) 646286 48559
Gulbarga (1) 670136 33507 (1) 646286 48559
Madhya Pradesh 4(5) 453825 5319 4(4) 384008 5301
Mandsaur 4 2625 1259 4 3880 1880
Rewa (5) 451200 4060 (4) 380128 3421
Maharashtra (2) 289026 29170 (2) 294076 31467
Chandrapur (1) 33930 4152 (1) 37290 4762
Yavatmal (1) 255096 25018 (1) 256786 26705
Telangana 3 59100 4063 3 87000 6279
Nalgonda 2 35000 1846 2 41500 2132
Rangareddy 1 24100 2217 1 45500 4147
Table – 33 : Mine-head Closing Stocks of Shale, 2013-14 & 2014-15(P)
(By States)
(In tonnes)
State 2 0 1 3 - 1 4 2014-15*(P)
India 85666 57241
Andhra Pradesh 29703 26926
Karnataka 25668 -
Madhya pradesh 100 120
Telangana 30195 30195
# Figures mentioned against 2013-14 are of districts which are part of present Andhra Pradesh and Telangana States.
* Data up to January, 2015
* Data up to January, 2015


![Development of Ethanol conversion catalysts from various clays...olefins such as ethylene and diethyl ether [6, 7]. Bentonite and kaolin are the most common known clays used industrially](https://static.fdocuments.in/doc/165x107/60c7bc41ef3aae5eee7647b8/development-of-ethanol-conversion-catalysts-from-various-clays-olefins-such.jpg)