Kantian fractionalization predicts the conflict propensity...
24
Kantian fractionalization predicts the conflict propensity of the international system Skyler J. Cranmer a,b,1 , Elizabeth J. Menninga c , and Peter J. Mucha d a Department of Political Science, The Ohio State University, Columbus, OH 43210; b Alexander von Humboldt Fellow, Department of Politics and Public Administration, University of Konstanz, 78457 Konstanz, Germany; c Department of Political Science, University of Iowa, Iowa City, IA 52242; and d Department of Mathematics, University of North Carolina at Chapel Hill, Chapel Hill, NC 27599 Edited by Michael D. Ward, Duke University, Durham, NC, and accepted by the Editorial Board August 5, 2015 (received for review May 18, 2015) Network science has spurred a reexamination of relational phenom- ena in political science, including the study of international conflict. We introduce a new direction to the study of conflict by showing that the multiplex fractionalization of the international system along three key dimensions is a powerful predictor of the propensity for violent interstate conflict. Even after controlling for well-established conflict indicators, our new measure contributes more to model fit for interstate conflict than all of the previously established measures combined. Moreover, joint democracy plays little, if any, role in pre- dicting system stability, thus challenging perhaps the major empirical finding of the international relations literature. Lastly, the temporal variability of our measure with conflict is consistent with a causal relationship. Our results have real-world policy implications as changes in our fractionalization measure substantially aid the pre- diction of conflict up to 10 years into the future, allowing it to serve as an early warning sign of international instability. networks | community detection | multiplex | international conflict I mmanuel Kant proposed a recipe for international peace in 1795 (1) that has proven remarkably insightful: the diffusion of democracy, economic interdependence, and the establishment of international institutions. Kant’s fundamental idea is that the more interconnected the international system becomes, the less likely conflict is to occur. As democracy spreads, states become more economically interdependent, and international governmen- tal organizations (IGOs) grow in scope and power, war becomes more costly, and alternatives to war become both more abundant and more appealing. Democracy checks executive power and promotes norms of compromise and negotiation. Trade increases the stakes of the conflict and provides incentives to resolve disputes without damaging mutually beneficial relationships. IGOs present forums, norms, and procedures for peaceful conflict resolution. Likewise, when these factors become less prevalent and the con- nectivity among states weakens, credible alternatives to war be- come harder to find and thus the potential for violent conflict increases. In many ways, Kant’s logic is foundational for the idea that increasing contact between groups mitigates conflict (2, 3). Many studies have explored the impacts of the components of the Kantian tripod individually (4, 5) as well as collectively (6, 7) on peaceful relations. However, these studies model the elements of the tripod as independent effects on dyadic (between two states) conflict. This approach is limited insofar as each relational com- ponent is part of a much larger network and thus has implications for the entire system. Some scholars have considered the effects of system-level measures of the Kantian tripod (8, 9), but the outcome of interest is still dyadic. A few studies do consider conflict at the system level (10, 11), but these studies look at the effect of de- mocracy alone, ignoring the other components of the Kantian tripod. Recently, some have challenged these studies’ focus on joint democracy, suggesting that the effects attributed to joint de- mocracy may be due to other factors, such as capitalism (12). We propose that to evaluate the effect of Kant’s prescription for peace on international conflict, the three components must be considered collectively. Moreover, as dyadic relations are influenced by, and influence, the other relationships in the system, Kant’s prescription should not merely be applied to dyadic con- flict; it should have implications for conflict at the system level. We improve upon existing studies by quantifying the nature of interconnectedness of the international system by combining the elements of the Kantian tripod at the system level in a multiplex measure we call “Kantian fractionalization” and by considering the effect of Kantian fractionalization on systemic conflict. Measuring Kantian Fractionalization The level and organization of interconnectivity in the interna- tional system is indicative of the level of stress exerted on re- lationships between states. When a dispute arises between states, relationships both within and beyond the dyad are relevant. Connections that encompass more states with lower levels of fractionalization induce less stress on the international system. States will still find themselves in disagreements with one an- other, but these disputes are less likely to escalate to violence in a system with low fractionalization. When fractionalization in the international system is high, however, greater tension is exerted on the international system. Conflicts that arise in highly tense systems are more likely to escalate to violence as the networked effects of democracy, trade, and IGOs are too weak to mitigate this tension. We refer to the level of division in the trade, de- mocracy, and IGO networks as the system’s Kantian fractional- ization, and we expect higher levels of Kantian fractionalization will result in higher incidence of interstate conflicts. To measure the system’s Kantian fractionalization, we use the tools of community detection in networks (13, 14). A community in a network is a group of vertices (countries in our case) that are Significance Many studies in international relations have investigated relation- ships between pairs of countries and the likelihood of conflict, yet none have connected the overall structure of the network of re- lationships between countries with the total level of international conflict. Here, we blaze a new path in the study of international conflict by introducing a measure of the overall fractionalization in the network of international relationships which we call Kantian fractionalization and demonstrating that this measure has been closely correlated with the number of new international conflicts in the following year. Moreover, we show that jointly democratic pairs of countries contribute negligibly to Kantian fractionaliza- tion, casting doubt on one of the most prominent concepts in in- ternational relations and policy prescriptions in Washington. Author contributions: S.J.C., E.J.M., and P.J.M. designed research, performed research, contributed analytic tools, analyzed data, and wrote the paper. The authors declare no conflict of interest. This article is a PNAS Direct Submission. M.D.W. is a guest editor invited by the Editorial Board. 1 To whom correspondence should be addressed. Email: [email protected]. This article contains supporting information online at www.pnas.org/lookup/suppl/doi:10. 1073/pnas.1509423112/-/DCSupplemental. www.pnas.org/cgi/doi/10.1073/pnas.1509423112 PNAS Early Edition | 1 of 5 POLITICAL SCIENCES
-
Upload
nguyenkien -
Category
Documents
-
view
214 -
download
1
Transcript of Kantian fractionalization predicts the conflict propensity...

Kantian fractionalization predicts the conflictpropensity of the international systemSkyler J. Cranmera,b,1, Elizabeth J. Menningac, and Peter J. Muchad
aDepartment of Political Science, The Ohio State University, Columbus, OH 43210; bAlexander von Humboldt Fellow, Department of Politics and PublicAdministration, University of Konstanz, 78457 Konstanz, Germany; cDepartment of Political Science, University of Iowa, Iowa City, IA 52242; anddDepartment of Mathematics, University of North Carolina at Chapel Hill, Chapel Hill, NC 27599
Edited by Michael D. Ward, Duke University, Durham, NC, and accepted by the Editorial Board August 5, 2015 (received for review May 18, 2015)
Network science has spurred a reexamination of relational phenom-ena in political science, including the study of international conflict.We introduce a new direction to the study of conflict by showingthat the multiplex fractionalization of the international system alongthree key dimensions is a powerful predictor of the propensity forviolent interstate conflict. Even after controlling for well-establishedconflict indicators, our new measure contributes more to model fitfor interstate conflict than all of the previously established measurescombined. Moreover, joint democracy plays little, if any, role in pre-dicting system stability, thus challenging perhaps the major empiricalfinding of the international relations literature. Lastly, the temporalvariability of our measure with conflict is consistent with a causalrelationship. Our results have real-world policy implications aschanges in our fractionalization measure substantially aid the pre-diction of conflict up to 10 years into the future, allowing it to serveas an early warning sign of international instability.
networks | community detection | multiplex | international conflict
Immanuel Kant proposed a recipe for international peace in1795 (1) that has proven remarkably insightful: the diffusion of
democracy, economic interdependence, and the establishment ofinternational institutions. Kant’s fundamental idea is that themore interconnected the international system becomes, the lesslikely conflict is to occur. As democracy spreads, states becomemore economically interdependent, and international governmen-tal organizations (IGOs) grow in scope and power, war becomesmore costly, and alternatives to war become both more abundantand more appealing. Democracy checks executive power andpromotes norms of compromise and negotiation. Trade increasesthe stakes of the conflict and provides incentives to resolve disputeswithout damaging mutually beneficial relationships. IGOs presentforums, norms, and procedures for peaceful conflict resolution.Likewise, when these factors become less prevalent and the con-nectivity among states weakens, credible alternatives to war be-come harder to find and thus the potential for violent conflictincreases. In many ways, Kant’s logic is foundational for the ideathat increasing contact between groups mitigates conflict (2, 3).Many studies have explored the impacts of the components of
the Kantian tripod individually (4, 5) as well as collectively (6, 7) onpeaceful relations. However, these studies model the elements ofthe tripod as independent effects on dyadic (between two states)conflict. This approach is limited insofar as each relational com-ponent is part of a much larger network and thus has implicationsfor the entire system. Some scholars have considered the effects ofsystem-level measures of the Kantian tripod (8, 9), but the outcomeof interest is still dyadic. A few studies do consider conflict at thesystem level (10, 11), but these studies look at the effect of de-mocracy alone, ignoring the other components of the Kantiantripod. Recently, some have challenged these studies’ focus on jointdemocracy, suggesting that the effects attributed to joint de-mocracy may be due to other factors, such as capitalism (12).We propose that to evaluate the effect of Kant’s prescription
for peace on international conflict, the three components mustbe considered collectively. Moreover, as dyadic relations are
influenced by, and influence, the other relationships in the system,Kant’s prescription should not merely be applied to dyadic con-flict; it should have implications for conflict at the system level.We improve upon existing studies by quantifying the nature ofinterconnectedness of the international system by combining theelements of the Kantian tripod at the system level in a multiplexmeasure we call “Kantian fractionalization” and by consideringthe effect of Kantian fractionalization on systemic conflict.
Measuring Kantian FractionalizationThe level and organization of interconnectivity in the interna-tional system is indicative of the level of stress exerted on re-lationships between states. When a dispute arises between states,relationships both within and beyond the dyad are relevant.Connections that encompass more states with lower levels offractionalization induce less stress on the international system.States will still find themselves in disagreements with one an-other, but these disputes are less likely to escalate to violence ina system with low fractionalization. When fractionalization in theinternational system is high, however, greater tension is exertedon the international system. Conflicts that arise in highly tensesystems are more likely to escalate to violence as the networkedeffects of democracy, trade, and IGOs are too weak to mitigatethis tension. We refer to the level of division in the trade, de-mocracy, and IGO networks as the system’s Kantian fractional-ization, and we expect higher levels of Kantian fractionalizationwill result in higher incidence of interstate conflicts.To measure the system’s Kantian fractionalization, we use the
tools of community detection in networks (13, 14). A communityin a network is a group of vertices (countries in our case) that are
Significance
Many studies in international relations have investigated relation-ships between pairs of countries and the likelihood of conflict, yetnone have connected the overall structure of the network of re-lationships between countries with the total level of internationalconflict. Here, we blaze a new path in the study of internationalconflict by introducing a measure of the overall fractionalization inthe network of international relationships which we call Kantianfractionalization and demonstrating that this measure has beenclosely correlated with the number of new international conflictsin the following year. Moreover, we show that jointly democraticpairs of countries contribute negligibly to Kantian fractionaliza-tion, casting doubt on one of the most prominent concepts in in-ternational relations and policy prescriptions in Washington.
Author contributions: S.J.C., E.J.M., and P.J.M. designed research, performed research,contributed analytic tools, analyzed data, and wrote the paper.
The authors declare no conflict of interest.
This article is a PNAS Direct Submission. M.D.W. is a guest editor invited by the EditorialBoard.1To whom correspondence should be addressed. Email: [email protected].
This article contains supporting information online at www.pnas.org/lookup/suppl/doi:10.1073/pnas.1509423112/-/DCSupplemental.
www.pnas.org/cgi/doi/10.1073/pnas.1509423112 PNAS Early Edition | 1 of 5
POLITICA
LSC
IENCE
S

more strongly connected to one another than they are to the restof the network. One of the dominant methods of communitydetection, the computational optimization of modularity (15), is adirect quantification of this notion and is calculated as the dif-ference between the total weight of intragroup edges and theexpected strength under an appropriate null model. Larger mod-ularity values signal denser, stronger connections between verticesin the same community relative to the network as a whole, withrelatively sparser, weaker connections between communities.Because the network of Kantian ties is multiplex, we use multi-
layer modularity in its multiplex network form (16), treating each ofthe three kinds of connections as a layer of the multiplex network.We consider each year of data separately. In this formulation, eachstate is represented as three (multilayer) vertices that are connectedto one another by identity arcs of weight specified by an interlayercoupling parameter. The joint democracy layer is a clique (of unitedge weight) connecting all democracies [states with a Polity IV(17) score greater than or equal to 6, standard in the literature],leaving nondemocracies isolated within the layer. The trade layer isa directed network with nonzero edge weights linearly related tothe logarithm of trade value from one country to another. The IGOnetwork layer is an undirected single-mode weighted network withedge weights proportional to the number of common IGO mem-berships. So that the three layers have similar weights, we scaled thetrade and IGO layers to have median present edge weight overtime equal to 1. The Kantian fractionalization of the system in agiven year is then defined as the maximum obtained value of
QK =12μ
Xijlr
��Aijl − γPijl
�δlr + δijð1− δlrÞω
�δ�gil, gjr
� ,
where Aijl is the edge weight connecting states i and j in layer l,Pijl is the corresponding null model in layer l [Newman–Girvan
(15) for IGO and joint democracy, Leicht-Newman (18) fortrade], γ is a resolution parameter, ω is the specified interlayeridentity coupling, μ is the total edge weight, gil is the communityassignment of vertex i in layer l, gjr is the community assignmentof vertex j in layer r, and Kronecker δ indicators equal 1 whentheir two arguments are identical (0 otherwise). For our principalQK specification, we use the default values γ =ω= 1. To haveconfidence in the obtained QK values, we run the computationalheuristic 100 times with pseudorandom vertex orders and selectthe maximum observed value, as described in the SI Appendixwith further details of the measure. We investigated the effectsof our parameter and measurement choices on the robustness ofour results, as also detailed in the SI Appendix.Measured as such, multilayer modularity captures the level of
fractionalization in the system and allows us to consider all com-ponents of the Kantian tripod simultaneously. To our knowledge,this is the first use in practical application of multilayer modularityin a multiplex network [that is, separate from the limited dem-onstration of principle that accompanied the original developmentof multilayer modularity (16)].
Data and AnalysisWe turn now to the relationship between Kantian fractional-ization and the prevalence of violent international conflict. Tocapture decisions to use military force, we examine the number ofonsets in a calendar year when violent military force is “explicitlydirected towards the government, official representatives, officialforces, property, or territory of another state” (ref. 19, p. 163). Weinclude disputes marked by violence ranging in intensity fromsmall skirmishes to full-scale war. We adjust our analyses for thefact that during our period of observation, 1948–2000, the numberof states in the system increases from 72 to 191, providing moreopportunities for dyadic interstate conflict. We consider the sameanalyses on only “politically relevant” dyads in the SI Appendix.
Pearson's r = 0.69 [0.51, 0.81]
0.002
0.004
0.006
0.008
0.08 0.10 0.12
Kantian Fractionalization (lag)
Den
sity
of V
iole
nt M
ID O
nset
195019601970198019902000
year
Fig. 1. Kantian fractionalization, lagged by 1 year, and conflict rate, 1948–2000. The line and confidence bands reflect those fit by a bivariate linear model.
2 of 5 | www.pnas.org/cgi/doi/10.1073/pnas.1509423112 Cranmer et al.
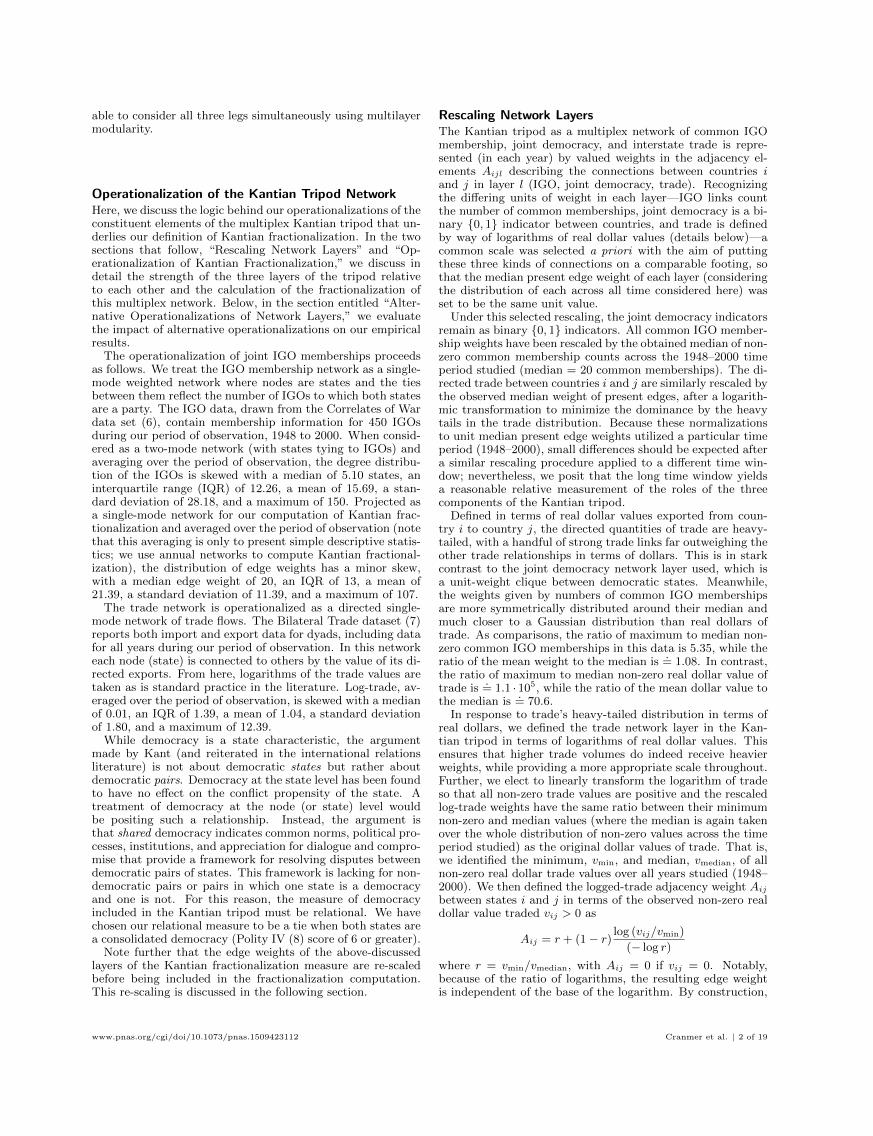
In our statistical analyses, we lag the modularity measures oneyear to ensure temporal precedence of the hypothesized cause tothe effect. We also control for several variables common in theinternational conflict literature (20). First, we include Moul’smeasure of system polarity (20). This measure divides the numberof major power alliance groups by the number of major powers,thus producing a ratio to capture the polarity of the internationalsystem. We also include a one-year lagged defensive alliance in-terdependence (21). To account for the role that the distribution ofmaterial capabilities are traditionally thought to play in systemstability, we include a five-year rolling average of movement incapability concentration using Ray and Singer’s measure (22). Fi-nally, we include a one-year lagged outcome variable to account forthe first-order autocorrelation observed in the outcome variables(details in the SI Appendix).
ResultsThe bivariate relationship between Kantian fractionalization andconflict rate is strong and apparently linear (Fig. 1). As Kantianfractionalization increases, so does the rate of conflict. The visualrelationship is also borne out statistically (r = 0.690, P< 0.001).Poisson regressions of the number of new conflicts per year—
offset by the opportunities for conflict (logarithm of the numberof dyads in the system year) and including a dispersion parameterto adjust the SEs for the overdispersion present in the annualcount of violent conflicts—capture the rate of conflict (Table 1).Comparing a basic model with only our fractionalization measureand a lagged outcome variable to a model that includes all of thecontrols and a third model with only the controls, Kantian frac-tionalization consistently maintains a statistically significant andsubstantively large positive effect on the onset of conflict. Themodels with Kantian fractionalization also display consistentlysuperior in-sample fit as judged by the Akaike information cri-terion (AIC). Likelihood ratio tests reveal that restricting themodel with controls to exclude Kantian fractionalization is an
invalid restriction (χ2 = 44.495, P= 2.55× 10⁻¹¹). These results arerobust to substantial permutations in the measurement of mod-ularity, the model specification, and statistical structure of themodel (SI Appendix).Our measure and model also strongly aid the forecasting of
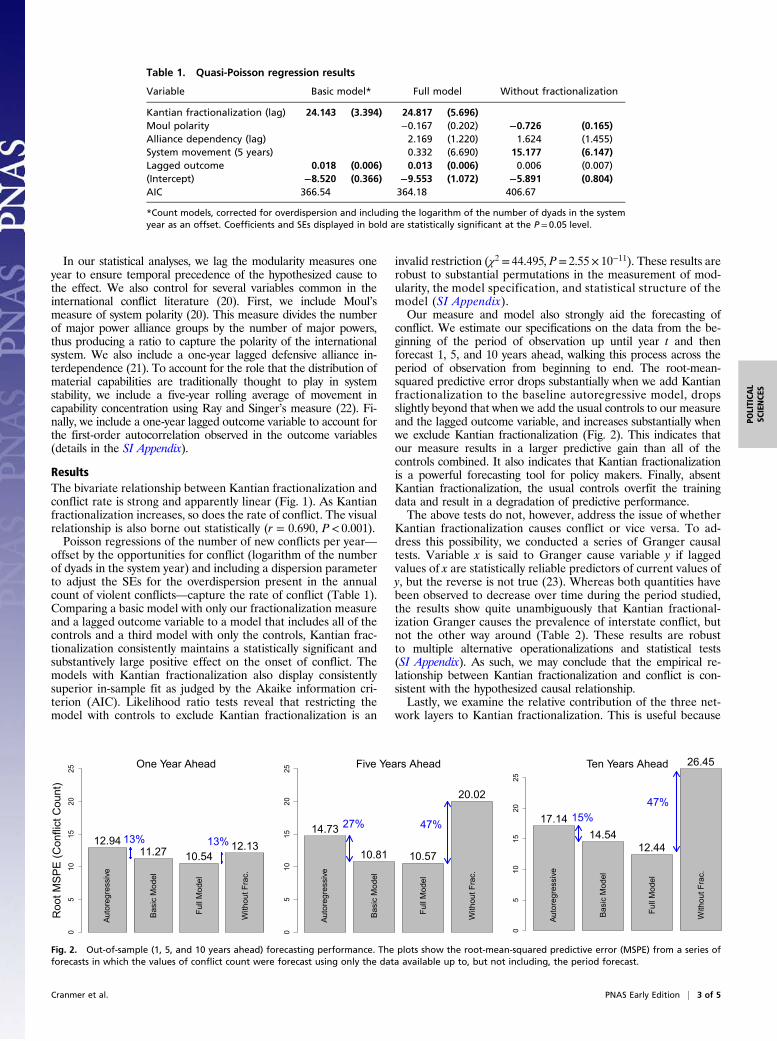
conflict. We estimate our specifications on the data from the be-ginning of the period of observation up until year t and thenforecast 1, 5, and 10 years ahead, walking this process across theperiod of observation from beginning to end. The root-mean-squared predictive error drops substantially when we add Kantianfractionalization to the baseline autoregressive model, dropsslightly beyond that when we add the usual controls to our measureand the lagged outcome variable, and increases substantially whenwe exclude Kantian fractionalization (Fig. 2). This indicates thatour measure results in a larger predictive gain than all of thecontrols combined. It also indicates that Kantian fractionalizationis a powerful forecasting tool for policy makers. Finally, absentKantian fractionalization, the usual controls overfit the trainingdata and result in a degradation of predictive performance.The above tests do not, however, address the issue of whether
Kantian fractionalization causes conflict or vice versa. To ad-dress this possibility, we conducted a series of Granger causaltests. Variable x is said to Granger cause variable y if laggedvalues of x are statistically reliable predictors of current values ofy, but the reverse is not true (23). Whereas both quantities havebeen observed to decrease over time during the period studied,the results show quite unambiguously that Kantian fractional-ization Granger causes the prevalence of interstate conflict, butnot the other way around (Table 2). These results are robustto multiple alternative operationalizations and statistical tests(SI Appendix). As such, we may conclude that the empirical re-lationship between Kantian fractionalization and conflict is con-sistent with the hypothesized causal relationship.Lastly, we examine the relative contribution of the three net-
work layers to Kantian fractionalization. This is useful because
Table 1. Quasi-Poisson regression results
Variable Basic model* Full model Without fractionalization
Kantian fractionalization (lag) 24.143 (3.394) 24.817 (5.696)Moul polarity −0.167 (0.202) −0.726 (0.165)Alliance dependency (lag) 2.169 (1.220) 1.624 (1.455)System movement (5 years) 0.332 (6.690) 15.177 (6.147)Lagged outcome 0.018 (0.006) 0.013 (0.006) 0.006 (0.007)(Intercept) −8.520 (0.366) −9.553 (1.072) −5.891 (0.804)AIC 366.54 364.18 406.67
*Count models, corrected for overdispersion and including the logarithm of the number of dyads in the systemyear as an offset. Coefficients and SEs displayed in bold are statistically significant at the P = 0.05 level.
05
1015
2025
Auto
regr
essi
ve
Bas
ic M
odel
Full
Mod
el
With
out F
rac.
Roo
t MS
PE
(Con
flict
Cou
nt)
12.9411.27 10.54
12.1313%
One Year Ahead
13%
05
1015
2025
Auto
regr
essi
ve
Bas
ic M
odel
Full
Mod
el
With
out F
rac.
14.73
10.81 10.57
20.02
Five Years Ahead
47%27%
05
1015
2025
Auto
regr
essi
ve
Bas
ic M
odel
Full
Mod
el
With
out F
rac.
17.1414.54
12.44
26.45Ten Years Ahead
47%15%
Fig. 2. Out-of-sample (1, 5, and 10 years ahead) forecasting performance. The plots show the root-mean-squared predictive error (MSPE) from a series offorecasts in which the values of conflict count were forecast using only the data available up to, but not including, the period forecast.
Cranmer et al. PNAS Early Edition | 3 of 5
POLITICA
LSC
IENCE
S

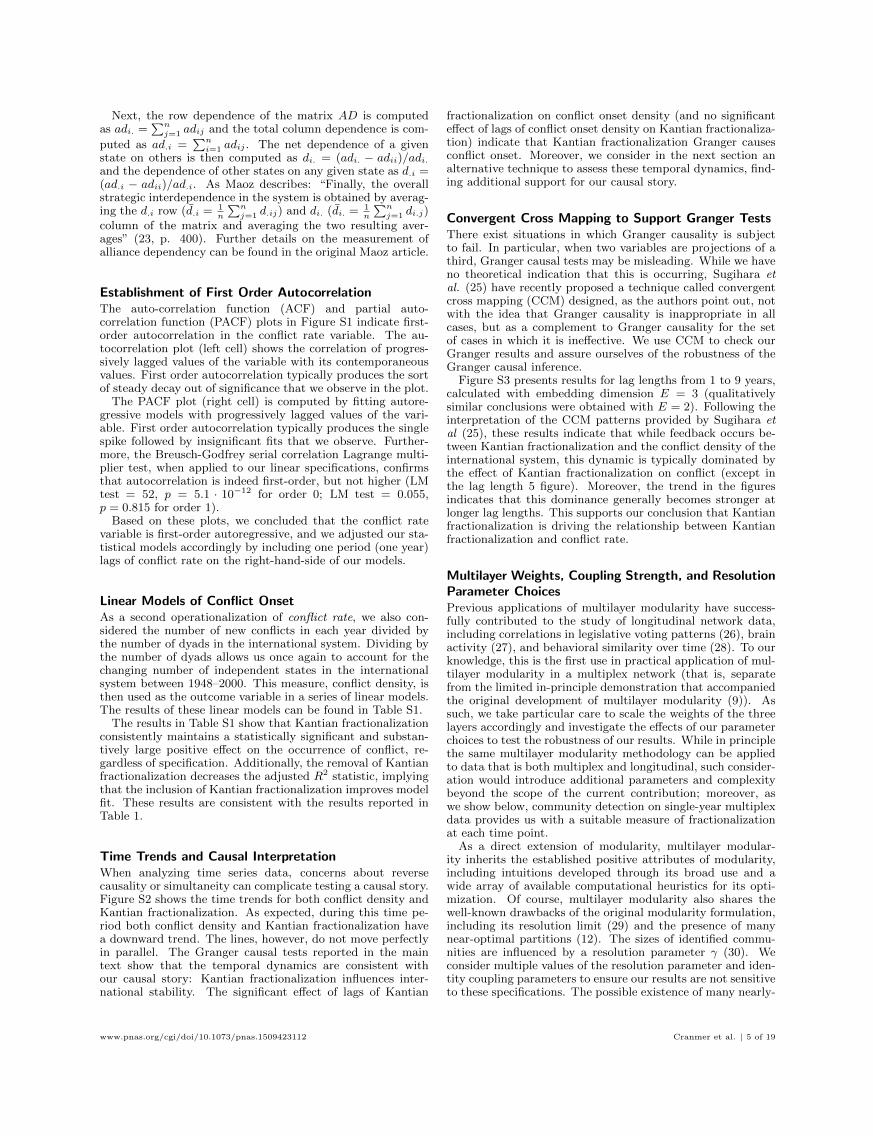
theory does not stipulate whether all three are equally importantin their contributions to the Kantian peace. In the political sci-ence literature, joint democracy enjoys a place of prominence, somuch so that the Kantian peace is often reduced to only thedemocratic peace. This democratic peace has been lauded as thenearest thing to a law of international politics (7), has permeatedinto the media, and has been cited by multiple Presidents of theUnited States when discussing foreign policy.We quantify the contribution from each network layer through a
series of tests permuting country identities, calculating the differ-ence between Kantian fractionalization from each layer relative tothe mean over permutations. Fig. 3 shows that the large majority ofthe measure is driven by trade and IGO connections, whereas jointdemocracy plays little role at all. (As shown in the SI Appendix, ourresults do not change meaningfully if we drop joint democracy;indeed, the predictive models actually perform better.)Our results suggest, at minimum, that the idea of a democratic
peace, although generally thought credible at the dyadic level,does not scale up to become a meaningful predictor of systemstability. This is problematic for the claim of a democratic peacebecause states, their relationships, and broader systemic char-acteristics are all attributes of the same system; a coherent ex-planation for conflict requires empirical agreement regardless ofthe resolution with which we measure the process of interest.
DiscussionNetwork science has led to many recent advancements (24–26),including in political science (27, 28) and more specifically the
study of international conflict (21, 29, 30). We have introduced adifferent way of thinking about the systemic manifestations ofdyadic phenomena and a new way of measuring the cohesion of theinternational system. Taken together, our results suggest that (i) arelationship between Kantian fractionalization and conflict exists,(ii) the correlation seems not to be spurious, (iii) Kantian frac-tionalization does more to improve the out-of-sample predictiveperformance than all controls combined, (iv) our measure is usefulfor forecasting system stability up to 10 years into the future, (v) thetemporal dynamics of the relationship are consistent with a causaleffect, and (vi) the composition of our measure casts doubt on thesystem-level influence of a democratic peace. These results are ro-bust across multiple operationalizations of Kantian fractionalization,multiple model specifications, and multiple statistical models.
ACKNOWLEDGMENTS. The authors acknowledge a seed grant provided by theHoward W. Odum Institute for Research in Social Science at the University ofNorth Carolina at Chapel Hill. S.J.C. acknowledges support from the NationalScience Foundation (NSF) (SES-1357622 and SES-1461493) and the Alexandervon Humboldt Foundation. P.J.M. acknowledges support from the NSF (DMS-0645369) and the James S. McDonnell Foundation 21st Century ScienceInitiative (Complex Systems Scholar Award Grant 220020315).
1. Kant I (1795) To Perpetual Peace: A Philosophical Sketch. Perpetual Peace and Other
Essays, ed Humphrey T (Hackett, Indianapolis), pp 107–143.2. Allport GW (1954) The Nature of Prejudice (Perseus Books, Cambridge, MA).3. Pinker S (2011) The Better Angels of Our Nature: Why Violence has Declined (Penguin
Group, New York).4. Maoz Z, Russett B (1993) Normative and structural causes of democratic peace, 1946-
1986. Am Polit Sci Rev 87(3):624–638.5. Russett BM (1990) Politics and Alternative Security: Toward a More Democratic, There-
fore More Peaceful, World. Alternative Security: Living Without Nuclear Deterrence,
ed Weston BH (Westview, Boulder, CO), pp 107–136.6. Bennett DS, Stam AC (2003) The Behavioral Origins of War (Univ of Michigan Press,
Ann Arbor, MI).7. Russett BM, O’Neal JR (2001) Triangulating Peace: Democracy, Interdependence and
International Organizations (W. W. Norton & Company, New York).8. Maoz Z (2011) Networks of Nations: The Evolution, Structure, and Impact of
International Networks: 1816-2001 (Cambridge Univ Press, New York).9. O’Neal JR, Russett B (1999) The Kantian peace: The pacific benefits of democracy,
interdependence, and international organizations, 1885-1992. World Polit 52(1):
1–37.10. Gleditsch NP, Hegre H (1997) Peace and democracy: Three levels of analysis. J Conflict
Resolut 41(2):283–310.
11. Crescenzi MJC, Enterline AJ (1999) Ripples from the waves? A systemic, time-series
analysis of democracy, democratization, and interstate war. J Peace Res 36(1):75–94.12. Gartzke E (2007) The Capitalist Peace. Am J Pol Sci 51(1):166–191.13. Porter MA, Onnela JP, Mucha PJ (2009) Communities in networks. Not Am Math Soc
56(9):1082–1097; 1164–1166.14. Fortunato S (2010) Community detection in graphs. Phys Rep 486(3):75–174.15. Newman MEJ, Girvan M (2004) Finding and evaluating community structure in net-
works. Phys Rev E 69(2):026113.16. Mucha PJ, Richardson T, Macon K, Porter MA, Onnela JP (2010) Community structure
in time-dependent, multiscale, and multiplex networks. Science 328(5980):876–878.17. Marshall MG, Jaggers K (2002) Polity IV Project: Political Regime Characteristics and
Transitions, 1800–2002 (Center for International Development and Conflict Man-
agement, University of Maryland, College Park, MD), Version p4v2002e edition.18. Leicht EA, Newman MEJ (2008) Community structure in directed networks. Phys Rev
Lett 100(11):118703.19. Jones DM, Bremer SA, Singer JD (1996) Militarized interstate disputes, 1916-1992:
Rationale, coding rules, and empirical patterns. Confl Manage Peace Sci 15(2):
163–213.20. Moul WB (1993) Polarization, polynomials, and war. J Conflict Resolut 37(4):735–748.21. Maoz Z (2006) Network polarization, network interdependence, and international
conflict, 1816–2002. J Peace Res 43(4):391–411.
Table 2. Granger causal analysis of violent conflict onsetdensity and Kantian fractionalization, 1948–2000
Conflict dens. →Kantian frac.
Kantian frac. →Conflict dens.
Lags F statistic* P value F statistic P value
1 0.024 0.877 12.123 0.0012 0.101 0.904 4.449 0.0173 0.229 0.876 3.863 0.0164 0.901 0.473 4.375 0.0055 0.677 0.644 3.547 0.0106 0.428 0.855 2.409 0.0487 0.700 0.672 3.044 0.0158 0.898 0.531 2.036 0.0799 0.610 0.777 1.260 0.30610 0.608 0.790 1.046 0.440
*F statistics and P values in bold are statistically significant at or below theP = 0.05 level.
1950 1960 1970 1980 1990 20000
20
40
60
80
100
% C
ontri
butio
n
IGOJDTrade
Fig. 3. Relative contribution of the three network layers to our Kantianfractionalization measure. We note in particular that the three layers of theKantian tripod used here [IGO, joint democracy (JD), trade] have been scaled sothat themedian present edge weights are the same in each (see SI Appendix fordetails). Nevertheless, the numbers, relative weights, and patterns of connec-tions are such that the relative contributions to Kantian fractionalization aredominated by IGO and trade, with little contribution from JD.
4 of 5 | www.pnas.org/cgi/doi/10.1073/pnas.1509423112 Cranmer et al.

22. Ray JL, Singer JD (1973) Measuring the concentration of power in the internationalsystem. Sociol Methods Res 1(4):403–437.
23. Granger CW (1968) Investigating causal relations by econometric models and cross-spectral methods. Econometrica 37(3):424–438.
24. Kossinets G, Watts DJ (2006) Empirical analysis of an evolving social network. Science311(5757):88–90.
25. Lazer D, et al. (2009) Social science. Computational social science. Science 323(5915):721–723.26. Centola D (2010) The spread of behavior in an online social network experiment.
Science 329(5996):1194–1197.
27. Porter MA, Mucha PJ, Newman MEJ, Warmbrand CM (2005) A network analysis ofcommittees in the U.S. House of Representatives. Proc Natl Acad Sci USA 102(20):7057–7062.
28. Fowler JH, Christakis NA (2010) Cooperative behavior cascades in human social net-works. Proc Natl Acad Sci USA 107(12):5334–5338.
29. Cranmer SJ, Desmarais BA (2011) Inferential network analysis with exponential ran-dom graph models. Polit Anal 19(1):66–86.
30. Ward MD, Siverson RM, Cao X (2007) Disputes, democracies, and dependencies: A re-examination of the Kantian peace. Am J Pol Sci 51(3):583–601.
Cranmer et al. PNAS Early Edition | 5 of 5
POLITICA
LSC
IENCE
S

Supporting InformationKantian fractionalization predicts the conflict propensity of the
international systemSkyler J. Cranmer ∗, Elizabeth J. Menninga, and Peter J. Mucha10.1073/pnas.1509423112∗To whom correspondence should be addressed. Email: [email protected]
Elaboration Upon Causal MechanismKant’s classic idea, which we test with modern methods, con-cerned the prevalence of war, especially among developed so-cieties. Kant’s theory of “perpetual peace” was not a dyadictheory, focusing on how a pair of states could achieve peace,but a systemic theory addressing how peace could be achievedthe world over. As such, we focus on the systemic prevalence ofconflict. Further, Kant’s “tripod” of joint democracy, trade,and international organization membership represents a sin-gle concept. The legs of this tripod were not meant to standon their own as independently sufficient conditions for peace,but rather together as mutually necessary conditions. Thoughmany in the literature (1, 2) have examined elements of theKantian tripod independently, we hold that an operational-ization of this concept is necessarily multiplex, and to trulyevaluate this theory we must consider all three legs of the tri-pod in unison. For this reason, multilayer modularity presentsitself as the ideal operationalization of Kant’s concept: stressin the multiplex network created by trade, IGO connections,and joint democracy should indeed be directly and causallyrelated to the prevalence of militarized conflict in the interna-tional community. It also follows directly that the multilayermodularity, and not the individual communities to which thestates are assigned, is naturally the quantity of interest.
Kantian fractionalization captures the level of stress at thesystem level. When fractionalization is low, there is less stresson the system. As Kantian fractionalization increases, thelevel of stress in the system increases; trade, democracy, andIGOs provide avenues through which states can relate to eachother. These relationships connect states not only dyadically,but also through a complex network of connections. Moreextensive and deeper connections (indicated by lower levelsof modularity) signify an extended system of relationshipsthrough which states can resolve their conflicts non-violently.Moreover, more extensive connections across the system in-crease the costs of fighting. Conflict damages trade relation-ships and undermines the institutions designed to producebenefits for its members. When the system is strongly in-terconnected, the consequences of conflict escalation are feltmore strongly throughout the system. By providing alterna-tive avenues of recourse when a dispute arises and increasingthe costs of escalating that dispute to war, a more connectedinternational system makes states less likely to pursue violentoptions. Lower levels of modularity thus indicate more ex-tensive connections throughout the international system, lessstress on the system, and thus less room for conflict. Higherlevels of modularity indicate greater divisions in the interna-tional system. These divisions decrease the effectiveness oftrade, democracy, and IGOs in mitigating the escalation ofconflict, therefore also decreasing the incentives of states topursue non-violent solutions when disputes arise.
In many ways, Kant’s logic is foundational for later theo-ries that posit a somewhat more specific causal mechanism.
For example, the hypothesis that increased contact betweengroups mitigates inter-group conflict (3, 4) has strong paral-lels to Kant’s argument about the how greater levels of inter-connectedness in the international system influence violenceamong and within states: as people from different societiesinteract more frequently, their “circle of sympathy” expands.We see Kant’s tripod and Pinker’s theory as inherently com-patible. Democracy, IGOs, and trade provide three avenuesthrough which countries (and thereby the individuals withinthose countries) can interact.
The Role of Joint Democracy: Extended DiscussionSeveral points regarding the role of joint democracy, the scal-ability of its dyadic effect, and its place in our analysis bearfurther discussion.
First, war is an inherently relational process in which two ormore states make intentional decisions to target one anotherwith political violence. Joining IGOs also represents an in-tentional decision to join with other states, thus constitutinga truly relational attribute. Trade functions much the sameway: diplomatic devices – from sanctions, to tariffs, to prefer-ential trade agreements – have pronounced effects on dyadictrade and are intentional decisions. Furthermore, trade, re-gardless of diplomatic devices, is truly relational. Conversely,democracy is not a relational attribute, it is an attribute of asingle state. We believe the literature that has focused on therole of joint democracy is somewhat misguided because jointdemocracy is not truly relational in nature: when a given statetransitions to democracy, it is not that the state is intention-ally forming a set of relationships with every other democracyin the “democratic club.” What joint democracy is meant tocapture is common values and interests. During Kant’s time,IGOs were few and far enough between that they did not suf-fice to capture the common values and interests of states, butmuch has changed in the last two hundred years. Today, webelieve, states opt into IGOs precisely because they have com-mon values and interests. IGO membership sends an informa-tional signal today in the way that democracy likely sent atthe time of Kant’s writing.
Given that democracy is not a truly relational attribute andany informational effects it carries may be confounded withIGO membership and trade, it is perhaps not surprising thatjoint democracy does not scale up the way IGO membershipand trade do. Second, we are not alone in thinking that therole of joint democracy has changed substantially since Kant’sinitial insight. For example, Gartzke (5) argues that what weactually observe is a capitalist peace rather than a democraticpeace. As joint democracy is often correlated with the otherlegs of the tripod (trade relationships and common IGO mem-bership) it can be difficult to identify which leg of the tripodis driving the effect. This has led to debate in the literature asto which leg is most relevant and highlights the value of being
www.pnas.org/cgi/doi/10.1073/pnas.1509423112 Cranmer et al. | 1 of 19
able to consider all three legs simultaneously using multilayermodularity.
Operationalization of the Kantian Tripod NetworkHere, we discuss the logic behind our operationalizations of theconstituent elements of the multiplex Kantian tripod that un-derlies our definition of Kantian fractionalization. In the twosections that follow, “Rescaling Network Layers” and “Op-erationalization of Kantian Fractionalization,” we discuss indetail the strength of the three layers of the tripod relativeto each other and the calculation of the fractionalization ofthis multiplex network. Below, in the section entitled “Alter-native Operationalizations of Network Layers,” we evaluatethe impact of alternative operationalizations on our empiricalresults.
The operationalization of joint IGO memberships proceedsas follows. We treat the IGO membership network as a single-mode weighted network where nodes are states and the tiesbetween them reflect the number of IGOs to which both statesare a party. The IGO data, drawn from the Correlates of Wardata set (6), contain membership information for 450 IGOsduring our period of observation, 1948 to 2000. When consid-ered as a two-mode network (with states tying to IGOs) andaveraging over the period of observation, the degree distribu-tion of the IGOs is skewed with a median of 5.10 states, aninterquartile range (IQR) of 12.26, a mean of 15.69, a stan-dard deviation of 28.18, and a maximum of 150. Projected asa single-mode network for our computation of Kantian frac-tionalization and averaged over the period of observation (notethat this averaging is only to present simple descriptive statis-tics; we use annual networks to compute Kantian fractional-ization), the distribution of edge weights has a minor skew,with a median edge weight of 20, an IQR of 13, a mean of21.39, a standard deviation of 11.39, and a maximum of 107.
The trade network is operationalized as a directed single-mode network of trade flows. The Bilateral Trade dataset (7)reports both import and export data for dyads, including datafor all years during our period of observation. In this networkeach node (state) is connected to others by the value of its di-rected exports. From here, logarithms of the trade values aretaken as is standard practice in the literature. Log-trade, av-eraged over the period of observation, is skewed with a medianof 0.01, an IQR of 1.39, a mean of 1.04, a standard deviationof 1.80, and a maximum of 12.39.
While democracy is a state characteristic, the argumentmade by Kant (and reiterated in the international relationsliterature) is not about democratic states but rather aboutdemocratic pairs. Democracy at the state level has been foundto have no effect on the conflict propensity of the state. Atreatment of democracy at the node (or state) level wouldbe positing such a relationship. Instead, the argument isthat shared democracy indicates common norms, political pro-cesses, institutions, and appreciation for dialogue and compro-mise that provide a framework for resolving disputes betweendemocratic pairs of states. This framework is lacking for non-democratic pairs or pairs in which one state is a democracyand one is not. For this reason, the measure of democracyincluded in the Kantian tripod must be relational. We havechosen our relational measure to be a tie when both states area consolidated democracy (Polity IV (8) score of 6 or greater).
Note further that the edge weights of the above-discussedlayers of the Kantian fractionalization measure are re-scaledbefore being included in the fractionalization computation.This re-scaling is discussed in the following section.
Rescaling Network LayersThe Kantian tripod as a multiplex network of common IGOmembership, joint democracy, and interstate trade is repre-sented (in each year) by valued weights in the adjacency el-ements Aijl describing the connections between countries iand j in layer l (IGO, joint democracy, trade). Recognizingthe differing units of weight in each layer—IGO links countthe number of common memberships, joint democracy is a bi-nary {0, 1} indicator between countries, and trade is definedby way of logarithms of real dollar values (details below)—acommon scale was selected a priori with the aim of puttingthese three kinds of connections on a comparable footing, sothat the median present edge weight of each layer (consideringthe distribution of each across all time considered here) wasset to be the same unit value.
Under this selected rescaling, the joint democracy indicatorsremain as binary {0, 1} indicators. All common IGO member-ship weights have been rescaled by the obtained median of non-zero common membership counts across the 1948–2000 timeperiod studied (median = 20 common memberships). The di-rected trade between countries i and j are similarly rescaled bythe observed median weight of present edges, after a logarith-mic transformation to minimize the dominance by the heavytails in the trade distribution. Because these normalizationsto unit median present edge weights utilized a particular timeperiod (1948–2000), small differences should be expected aftera similar rescaling procedure applied to a different time win-dow; nevertheless, we posit that the long time window yieldsa reasonable relative measurement of the roles of the threecomponents of the Kantian tripod.
Defined in terms of real dollar values exported from coun-try i to country j, the directed quantities of trade are heavy-tailed, with a handful of strong trade links far outweighing theother trade relationships in terms of dollars. This is in starkcontrast to the joint democracy network layer used, which isa unit-weight clique between democratic states. Meanwhile,the weights given by numbers of common IGO membershipsare more symmetrically distributed around their median andmuch closer to a Gaussian distribution than real dollars oftrade. As comparisons, the ratio of maximum to median non-zero common IGO memberships in this data is 5.35, while theratio of the mean weight to the median is
.= 1.08. In contrast,
the ratio of maximum to median non-zero real dollar value oftrade is
.= 1.1 · 105, while the ratio of the mean dollar value to
the median is.= 70.6.
In response to trade’s heavy-tailed distribution in terms ofreal dollars, we defined the trade network layer in the Kan-tian tripod in terms of logarithms of real dollar values. Thisensures that higher trade volumes do indeed receive heavierweights, while providing a more appropriate scale throughout.Further, we elect to linearly transform the logarithm of tradeso that all non-zero trade values are positive and the rescaledlog-trade weights have the same ratio between their minimumnon-zero and median values (where the median is again takenover the whole distribution of non-zero values across the timeperiod studied) as the original dollar values of trade. That is,we identified the minimum, vmin, and median, vmedian, of allnon-zero real dollar trade values over all years studied (1948–2000). We then defined the logged-trade adjacency weight Aij
between states i and j in terms of the observed non-zero realdollar value traded vij > 0 as
Aij = r + (1− r) log (vij/vmin)
(− log r)
where r = vmin/vmedian, with Aij = 0 if vij = 0. Notably,because of the ratio of logarithms, the resulting edge weightis independent of the base of the logarithm. By construction,
www.pnas.org/cgi/doi/10.1073/pnas.1509423112 Cranmer et al. | 2 of 19

the rescaled edge weights have median 1. The observed mean.= 1.01, and the maximum
.= 2.52.
Operationalization of Kantian FractionalizationThe fractionalization of the multiplex Kantian tripod network,with layers rescaled as described above, is measured by a cal-culation of multilayer modularity (9), the details of which arepresented in this section. The full specification of the calcu-lation includes the selection of the null models for each layer,thereby defining the community detection optimization prob-lem to be solved, and the computational heuristic used to ob-tain optimal assignments of node-layers into communities. Asin the main text, we define Kantian fractionalization, QK , us-ing default values γ = ω = 1 for the identity coupling strengthω and resolution parameter γ. Alternative parameter choicesare discussed in the section entitled “Multilayer Weights, Cou-pling Strength, and Resolution Parameter Choices.”
Because the network of Kantian ties is multiplex, we usemultilayer modularity in its multiplex network form, treatingeach of the three kinds of connections as a layer of the multi-plex network, with interlayer identity arc connections betweena country in a layer and each of that same country’s represen-tations in the other two layers. That is, each state is repre-sented as three (multilayer) vertices that are connected to oneanother by identity arcs of weight specified by an interlayercoupling parameter, ω. We consider each year of data sepa-rately. The Kantian fractionalization of the system in a givenyear is then defined as the maximum obtained value of
QK =1
2µ
∑ijlr
{(Aijl − γPijl) δlr + δij(1− δlr)ω} δ(gil, gjr) ,
[1]where Aijl is the edge weight connecting states i and j in layerl, Pijl is the corresponding null model in layer l, γ is a resolu-tion parameter, ω is the specified interlayer identity coupling,µ is the total edge weight including both intra- and inter-layeredges, gil is the community assignment of vertex i in layer l,gjr is the community assignment of vertex j in layer r, andKronecker δ indicators equal 1 when their two arguments areidentical (0 otherwise).
Because the trade network layer is directed, the corre-sponding Pijl is specified by the Leicht-Newman null model(10). That is, for in- and out- strengths (weighted degree)dil =
∑j Aijl and kjl =
∑iAijl, we set Pijl = dilkjl/(
∑i dil),
where we note∑
i dil =∑
j kjl. We additionally note thatthe symmetry in the joint sum over i and j in modularity andmodularity-like quality functions equivalently selects out onlythe symmetric (in i and j) parts of Aijl and this Pijl. In orderto implement this symmetry in practice, and in deference tothe double-counting of undirected edges implicit in the for-mula, we calculate the contribution to QK from this directedlayer replacing Aijl and Pijl in equation [1] with Aijl + Ajil
and Pijl + Pjil, respectively.Because of the undirected nature of the IGO and the joint
democracy layers, we use the null model originally specified byNewman and Girvan (11). That is, for these two layers, be-cause of the symmetry Aijl = Ajil, the Pijl null model is givenby kilkjl/(
∑i kil), where kil =
∑j Aijl. We note that both the
Newman-Girvan (undirected) and Leicht-Newman (directed)null models explicitly account for heterogeneities in weighteddegrees across the vertices. That is, both models compare theobserved network layer data, specifically, the total strength ofwithin-communities links, relative to the expected weight of
independently distributed edges conditional on the expecteddegree sequences.
For our present purposes, we are primarily interested inthe maximum obtainable values of QK , while the specific as-signments of countries-in-layers into communities being of sec-ondary importance to us here. In this setting, the potentialpresence of many near-optimal partitions (12) makes it easierfor a computational heuristic to identify values close to thetrue maximum modularity (even if there may be large dif-ferences between some of those near-optimal partitions). Weoptimize the Kantian fractionalization formulation of multi-layer modularity starting first with a generalized implementa-tion (13) of the Louvain algorithm (14). This generalized im-plementation allows us to explicitly specify the different nullmodels for each layer (described in the previous paragraph).Using the results output by the generalized implementation ofLouvain, we then apply Kernighan-Lin node-swapping steps(as described in (15, 16, 17)) that attempt to further increasemodularity. In order to have confidence in the obtained QK
values, we run this combined procedure 100 times with pseudo-random vertex orders and select the maximum observed value.
Operationalization of the Outcome VariableAs indicated in the main text, we operationalized our out-come variable as the count, and occasionally the density, ofnew violent military conflicts in a system year. This data wastaken from the Correlates of War Militarized Interstate Dis-putes Dataset. Several aspects of this choice warrant furtherdiscussion as there are many possible ways to operationalizethe concept of conflict.
First, we used the raw count of new violent conflicts inthe system year whenever possible. This has an advantagein terms of simplicity: it is intuitive to scientists and policymakers alike, while also avoiding complicated measurementschemes that can introduce measurement error and sometimesobscure interpretation of the results in terms of real-world phe-nomena. For the bivariate scatter plot with Pearson’s r pre-sented in Figure 1 and the Granger causal analysis presentedin Table 2, we used the density of new violent conflicts in thesystem year. The density is computed as the number of newviolent conflicts in the given year divided by the total num-ber of bilateral dyads that existed in that same year. Thenumber of dyads in the system year reflects the total potentialfor military conflict (e.g. the total set of conflicts that couldhave occurred). This adjustment is necessary when employingbivariate statistical techniques that do not allow for an offsetwith the number of dyads in the system year. The number ofstates in the system increases during our period of observationand the raw count of conflicts would be misleading because theopportunity for conflict varies over time. Thus, when not ableto use the raw count and include an offset, we used the densityof conflicts.
One may worry that our simple measure of the numberof conflicts does not reflect all of the available informationabout where in the system conflicts occur during times ofhigh Kantian fractionalization. However, our theory does notspeak to where in the system conflicts are expected to brew.Kant’s original proposition was for how global peace mightbe achieved, rather than a specific proposition for securingthe peace between a pair of states, and our overall system-level conflict count operationalizes that idea directly. Scholarssince Kant have scaled his idea down to the dyadic level andfound a number of factors that are correlated with peaceablerelations if we consider dyads in isolation. However, incor-poration of some of these correlates of war into our outcomemeasure would (a) be difficult to do systematically because
www.pnas.org/cgi/doi/10.1073/pnas.1509423112 Cranmer et al. | 3 of 19

it would involve the selection of a fixed set of factors from avast literature and the setting of specific weights for them, (b)likely induce considerable measurement error and sensitivityinto an otherwise simple and robust measure and, (c) obscurethe interpretation of our results.
Furthermore, we use only new violent conflicts in order forour models to capture the decision processes of states. Thereare two general classes of conflict operationalizations: deci-sions to use force and the intensity of force used. Our opera-tionalization, the number of new serious conflicts in a systemyear, is of the first class. This measure focuses on the choiceby governments to use lethal military force. The militarizedinterstate dispute (MID) component of the Correlates of Wardataset includes a five-level hostility measure to capture theintensity of the conflict. Scores below four include shows ofmilitary force, but not the employment of force. We considerconflicts to be disputes of levels four or five, four being a lim-ited use of force and five being a full war (as defined by theconflict involving more than 1,000 battle deaths). As such, weconsider only cases in which at least one party to a conflictchose to employ military violence.
We prefer focusing on decisions to use force because theintensity of a looming conflict may not be clear to decisionmakers at the time that the decision to use force is made. Forexample, German decision makers in the lead up to the FirstWorld War thought that invading France would be a simplematter; they did not foresee the years of bitter trench warfarethat lie ahead. Indeed, most decision makers during the FirstWorld War did not foresee how the chain of events followingthe assassination of a minor noble would result in what, atthat time, was the bloodiest war in history. The intensity of aconflict (e.g. the total number of casualties) is massively het-erogeneous and can be affected dramatically by non-politicalfactors ranging from the will and tactics of one’s opponentto the terrain and weather on the battlefield. Because largevariations in intensity may be caused by factors that leaderscannot foresee or control, we believe that focusing our analy-sis on an operationalization designed to capture the politicalprocess that results in the decision to use force is most appro-priate.
Computation of Control VariablesWe included three control variables established in the litera-ture to our models of conflict rate. Details on the computationof these variables are as follows.
Moul PolarityWhat we call Moul’s polarity measure in the text is a modi-fication of an earlier measure developed by Wayman (18, 19).The Wayman measure is a proportion: the number of un-alliedgreat powers plus the great power blocks formed by defensivealliances over the total number of great powers. So, in a givenyear t, Wayman’s measure is computed as follows:
Un-allied Great Powerst + Great Power Alliance BlockstTotal Number of Great Powerst
.
Moul gives the example that in 1950, the international sys-tem had five great powers divided into two groups, so Way-man’s measure for 1950 is 2/5 = 0.40 (20, p. 742). Moulthen alters Wayman’s measure by dividing each year’s polar-ity by its minimum potential value. This makes values morecomparable year-to-year. This measure sets 1 as perfect bipo-larization, and anything above 1 as increasingly multipolar.In our data, we have one year of perfect bipolarity (value 1),
one year at 1.5, forty-one years at 2, and ten years at 3.
System MovementThis measure captures changes in the international system’scapabilities distribution. The specific measure we use is afive-year moving average of the system movement variable es-tablished by Singer, Bremer, and Stuckey (21). Movement iscalculated as follows:
MOV E =
∑Ni=1 |s
t−1i − sti|
2(1− stm)
where N is the number of states in the system in a given yeart, si is state i’s share of the international system’s capabilities,sm indicates the capability share of the state with the lowestshare of capabilities, and the t and t− 1 superscripts indicatethe time period in which the measure s is taken.
The share of a state’s material capabilities is computedbased on the Correlates of War National Material Capabilitiesdata set (21, 22). Specifically, si is state i’s share of the com-posite index of national capabilities (CINC), the most com-mon operationalization of a state’s power in the internationalrelations literature. This index includes state i’s total popula-tion of country ratio (TPR), urban population of country ratio(UPR), iron and steel production of country ratio (ISPR), pri-mary energy consumption ratio (ECR), military expenditureratio (MER), and military personnel ratio (MPR). All ratiosare taken as country over world. CINC is computed for statei as:
CINCi =TPRi + UPRi + ISPRi + ECRi +MERi +MPRi
6.
Alliance DependencyWe use, directly and without alteration, Maoz’s measure ofalliance interdependence (23). This measure uses the AllianceTreaty Obligations and Provisions Project data to identify al-liances (24). Using this data, the measure is computed inseveral steps.
First, the strength of commitment to the defense of a stateis coded. Self-defense is seen as paramount, thus a state’s re-lationship to itself is coded as 1. Defense pacts are coded as0.75, non-aggression pacts are coded as 0.5, ententes are codedas 0.25, and a value of 0 is recorded if no alliance exists be-tween two states. Based on these values, an n×n sociomatrixof alliance strength is created, where n is the number of statesin a given year.
The values in the alliance strength matrix are then ad-justed by the capabilities of the states involved in any givenalliance. This is done because alliances are often seen as mech-anisms for the aggregation of military capabilities. For exam-ple, suppose states i and j have a non-aggression pact (valuedat 0.5), state i has capabilities (measured as state i’s CINCscore as described above) valued at 0.2, and state j has ca-pabilities valued at 0.007. State i depends on state j at level0.007× 0.5 = 0.0035, while state j depends on state i at level0.2 × 0.5 = 0.1. This adjusted alliance dependency matrix,denoted AD, captures the direct (first-order) dependencies inthe alliance network weighted by capabilities.
Because AD only captures direct dependencies, Maoz raisesthis matrix to the power of the number of degrees of depen-dence he wishes to capture. The alliance dependency of agiven year’s system of N states is AD =
∑n−1i=1 A
i +M , wheren is the number of degrees of dependence and M is the diag-onal capability matrix such that the diagonal element mii isthe CINC score of state i and non-diagonal entries are set to0.
www.pnas.org/cgi/doi/10.1073/pnas.1509423112 Cranmer et al. | 4 of 19
Next, the row dependence of the matrix AD is computedas adi. =
∑nj=1 adij and the total column dependence is com-
puted as ad.i =∑n
i=1 adij . The net dependence of a givenstate on others is then computed as di. = (adi. − adii)/adi.and the dependence of other states on any given state as d.i =(ad.i − adii)/ad.i. As Maoz describes: “Finally, the overallstrategic interdependence in the system is obtained by averag-ing the d.i row (d.i = 1
n
∑nj=1 d.ij) and di. (di. = 1
n
∑nj=1 di.j)
column of the matrix and averaging the two resulting aver-ages” (23, p. 400). Further details on the measurement ofalliance dependency can be found in the original Maoz article.
Establishment of First Order AutocorrelationThe auto-correlation function (ACF) and partial auto-correlation function (PACF) plots in Figure S1 indicate first-order autocorrelation in the conflict rate variable. The au-tocorrelation plot (left cell) shows the correlation of progres-sively lagged values of the variable with its contemporaneousvalues. First order autocorrelation typically produces the sortof steady decay out of significance that we observe in the plot.
The PACF plot (right cell) is computed by fitting autore-gressive models with progressively lagged values of the vari-able. First order autocorrelation typically produces the singlespike followed by insignificant fits that we observe. Further-more, the Breusch-Godfrey serial correlation Lagrange multi-plier test, when applied to our linear specifications, confirmsthat autocorrelation is indeed first-order, but not higher (LMtest = 52, p = 5.1 · 10−12 for order 0; LM test = 0.055,p = 0.815 for order 1).
Based on these plots, we concluded that the conflict ratevariable is first-order autoregressive, and we adjusted our sta-tistical models accordingly by including one period (one year)lags of conflict rate on the right-hand-side of our models.
Linear Models of Conflict OnsetAs a second operationalization of conflict rate, we also con-sidered the number of new conflicts in each year divided bythe number of dyads in the international system. Dividing bythe number of dyads allows us once again to account for thechanging number of independent states in the internationalsystem between 1948–2000. This measure, conflict density, isthen used as the outcome variable in a series of linear models.The results of these linear models can be found in Table S1.
The results in Table S1 show that Kantian fractionalizationconsistently maintains a statistically significant and substan-tively large positive effect on the occurrence of conflict, re-gardless of specification. Additionally, the removal of Kantianfractionalization decreases the adjusted R2 statistic, implyingthat the inclusion of Kantian fractionalization improves modelfit. These results are consistent with the results reported inTable 1.
Time Trends and Causal InterpretationWhen analyzing time series data, concerns about reversecausality or simultaneity can complicate testing a causal story.Figure S2 shows the time trends for both conflict density andKantian fractionalization. As expected, during this time pe-riod both conflict density and Kantian fractionalization havea downward trend. The lines, however, do not move perfectlyin parallel. The Granger causal tests reported in the maintext show that the temporal dynamics are consistent withour causal story: Kantian fractionalization influences inter-national stability. The significant effect of lags of Kantian
fractionalization on conflict onset density (and no significanteffect of lags of conflict onset density on Kantian fractionaliza-tion) indicate that Kantian fractionalization Granger causesconflict onset. Moreover, we consider in the next section analternative technique to assess these temporal dynamics, find-ing additional support for our causal story.
Convergent Cross Mapping to Support Granger TestsThere exist situations in which Granger causality is subjectto fail. In particular, when two variables are projections of athird, Granger causal tests may be misleading. While we haveno theoretical indication that this is occurring, Sugihara etal. (25) have recently proposed a technique called convergentcross mapping (CCM) designed, as the authors point out, notwith the idea that Granger causality is inappropriate in allcases, but as a complement to Granger causality for the setof cases in which it is ineffective. We use CCM to check ourGranger results and assure ourselves of the robustness of theGranger causal inference.
Figure S3 presents results for lag lengths from 1 to 9 years,calculated with embedding dimension E = 3 (qualitativelysimilar conclusions were obtained with E = 2). Following theinterpretation of the CCM patterns provided by Sugihara etal (25), these results indicate that while feedback occurs be-tween Kantian fractionalization and the conflict density of theinternational system, this dynamic is typically dominated bythe effect of Kantian fractionalization on conflict (except inthe lag length 5 figure). Moreover, the trend in the figuresindicates that this dominance generally becomes stronger atlonger lag lengths. This supports our conclusion that Kantianfractionalization is driving the relationship between Kantianfractionalization and conflict rate.
Multilayer Weights, Coupling Strength, and ResolutionParameter ChoicesPrevious applications of multilayer modularity have success-fully contributed to the study of longitudinal network data,including correlations in legislative voting patterns (26), brainactivity (27), and behavioral similarity over time (28). To ourknowledge, this is the first use in practical application of mul-tilayer modularity in a multiplex network (that is, separatefrom the limited in-principle demonstration that accompaniedthe original development of multilayer modularity (9)). Assuch, we take particular care to scale the weights of the threelayers accordingly and investigate the effects of our parameterchoices to test the robustness of our results. While in principlethe same multilayer modularity methodology can be appliedto data that is both multiplex and longitudinal, such consider-ation would introduce additional parameters and complexitybeyond the scope of the current contribution; moreover, aswe show below, community detection on single-year multiplexdata provides us with a suitable measure of fractionalizationat each time point.
As a direct extension of modularity, multilayer modular-ity inherits the established positive attributes of modularity,including intuitions developed through its broad use and awide array of available computational heuristics for its opti-mization. Of course, multilayer modularity also shares thewell-known drawbacks of the original modularity formulation,including its resolution limit (29) and the presence of manynear-optimal partitions (12). The sizes of identified commu-nities are influenced by a resolution parameter γ (30). Weconsider multiple values of the resolution parameter and iden-tity coupling parameters to ensure our results are not sensitiveto these specifications. The possible existence of many nearly-
www.pnas.org/cgi/doi/10.1073/pnas.1509423112 Cranmer et al. | 5 of 19

optimal partitions of the network into communities does notaffect our results in the present work, as we do not considerthe particular assignments of vertices into communities in ouranalysis, except for example visualization purposes below. In-deed, in utilizing only the value of Kantian fractionalization,the possible presence of many nearly-optimal partitions of thenetwork gives greater confidence in the computationally ob-tained QK values. For extra confidence, we consider manyrealized outputs from the selected heuristic (13) and variousparameter specifications.
In the main text, we define Kantian fractionalization, QK ,using default values γ = ω = 1 for the identity couplingstrength ω and resolution parameter γ. We optimize modular-ity using a generalized implementation (13) of the Louvain al-gorithm (14) followed by Kernighan-Lin node-swapping steps(15, 16, 17). At these parameters, the method identifies be-tween 2 and 6 communities in the Kantian tripod representa-tion of the international system. When faced with such resolu-tion parameter choices, we are cautious about the possible im-pact of making different choices. Strategies for letting the dataguide resolution parameter selection include seeking roughlyconstant numbers of communities along some plateau in theparameter plane (31, 32) or post-optimization null model test-ing for the statistical significance of the identified modularityat each parameter selection point (33). Given both the com-putational intensity and the need for a suitable random graphmodel for comparison in the latter approach, we concentrateour attention on the simplicity of the former approach, con-sidering γ and ω separately. One could additionally considerdifferent values of ω for individual states or different valuesof γ for each multiplex network layer. However, in the ab-sence of additional information that we might use to guidesuch choices, we restrict our attention here to the simplestuniform choices for these parameters.
In running the community detection for different ω ∈ [0, 4](with γ = 1), we did not identify any dominant effect otherthan the expected significant difference between non-zero ωand the degenerate ω = 0 results (where the multilayer repre-sentation of the multiplex Kantian tripod is not connected). Inthe absence of a data-led value for ω, we compared our modelspecification for Kantian fractionalization at default resolu-tions in the main text with an alternative model based interms of a Q value obtained as an average over multilayermodularities calculated in ω ∈ [0, 4] (with γ = 1), in steps of0.1. The results are presented in Tables S2 and S3.
Varying γ has a strongly pronounced effect on the com-munities obtained, in that at γ = 0 there is no partitioninginto communities, with the numbers of communities increasingwith γ until by γ = 4 almost every nation has been placed ina community by itself (with all three multilayer nodes of thatcountry in the multilayer representation assigned to a grouptogether). For ω = 1, we do not identify any plateau in thenumber of communities as γ varies, so that this simple testdoes not identify a particular γ resolution of interest for thissystem. As a means of identifying some special value of γ,we consider the number of communities in a given year thathave more than three multilayer nodes assigned (that is, morethan one country). While results vary from year-to-year, weidentify a broad peak in the number of such communities nearγ = 2. Motivated by this weak indicator of a scale of interest,we additionally consider an alternative model in terms of Q atγ = 2 and ω = 1. The results are presented in Tables S4 andS5.
Importantly, neither model based on alternative resolutionparameter choices alters the qualitative result that the mul-tilayer modularity of the Kantian tripod captures the frac-
tionalization of the international system in a way that modelsthe onset of new conflicts. Nevertheless, it certainly remainspossible that statistical significance testing may yet uncoverdistinguished (γ, ω) parameter value regions that best uncovercommunities of nations (and of their Kantian tripod behav-iors). Any future work investigating the specific assignmentsof such community detection in the Kantian tripod would dowell to further explore the resolution parameter space for suchregions. For the purposes of the present work, however, wehave established QK as a measure of fractionalization (at thedefault γ = ω = 1) providing a useful quantity for modelingthe rate of violent interstate conflict.
Identified CommunitiesWhile we are not focused on any country’s specific communityassignments, we did visualize community assignments gener-ated by our computation of Kantian fractionalization. FigureS4 illustrates the community assignments in the internationalsystem in 1950, 1975, and 2000, as generated by a single re-alization of the selected computational heuristic. (Interpre-tations of such assignments should be considered cautiously,however, since other realizations and heuristics can providedifferent assignments.) These maps outline all independentcountries in the international system in the given year andthen illustrate to which communities each country belongs.As each country is represented by three vertices (one for eachlayer of the Kantian tripod) each country could be in onlyone community (all three vertices placed together in the samecommunity) or as many as three communities (each vertexplaced differently). The years chosen represent the beginning,middle, and end of our time series. Overall, these maps in-dicate that the community assignments used in our analysisreflect known patterns of connectivity in the international sys-tem. This provides confidence that our community detectionprocedure did in fact identify meaningful communities basedupon the Kantian tripod.
In 1950, this partition divides the international system intothree communities. These communities predominantly fallinto three geographic areas: the Americas, Europe and Asia,and countries bordering the Indian Ocean. Most countrieshad all three of its vertices assigned to the same community.(Canada is a notable exception, with strong IGO ties to theIndian Ocean rim.) In 1975 the picture is more complicated:the observed communities still break the international systeminto the Americas, Europe, and countries bordering the In-dian Ocean, while identifying a fourth community that con-sists predominantly of countries in Africa, but the breaks fromthese geographic divisions are more numerous. Community 2includes China with Africa. Some countries in Europe areno longer assigned to only one community, and the UnitedStates shares a community with the Soviet Union in the in-ternational organizations layer. These shifts reflect importantchanges to the international system as postwar organizationsbecame important connections between the East and the West.Europe maintained some connections with the Soviet Union,but many countries, as would be expected, shifted trade tiesto the Americas or their newly independent colonies in Africa.In 2000, many countries have divided community associations.Notably the United States is still connected to Europe throughIGO membership, but maintains its strong connection to therest of the Americas through trade. China has moved fromthe IGO community dominated by African countries to jointhe US, Europe, and Russia. This reflects the strengtheningof regional institutions in post-independence Africa as wellas mainland China’s increased participation in organizationssuch as the International Monetary Fund.
www.pnas.org/cgi/doi/10.1073/pnas.1509423112 Cranmer et al. | 6 of 19

These maps also highlight some well-known insights aboutchanges in the international system during our time period ofstudy. In 1950, many African countries have not yet obtainedindependence from their colonial rulers. By 1975, most of thecontinent has become independent, with a few more countriesobtaining independence by 2000. Between 1975 and 2000 wealso see an increase in the number of countries in Eastern Eu-rope, reflecting the states that emerged from the dissolutionof the Soviet Union, illustrating the growth in the number ofcountries in the international system during our time seriesand highlighting the importance of accounting for the numberof dyads in our analyses.
Alternative Operationalizations of Network LayersIn order to ensure that our results are not a function of howthe network layers were measured, we repeated the analysesconducted in the main text with alternative operationaliza-tions of trade, IGO membership, and joint democracy.
Trade LayerFor trade, we considered an alternative specification in
which the weight of the edge from country i to country jis proportional to the value of country i’s exports to coun-try j normalized by country i’s total exports. Countries thatshare higher proportions of trade will have heavier weightswhile those that share lower proportions of trade will havelower weights. Once again, the trade layer of the network wasrescaled such that the median present edge weight of the tradelayer is 1, following the same process as discussed above. Theresults of the regressions with this operationalization of tradecan be found in Table S6. The effect of Kantian fractional-ization remains positive and significant across model specifi-cations. The results of Table S6 produce the same qualita-tive conclusions as Table 1. Furthermore, the results of theGranger causal tests (Table S7) continue to imply that laggedvalues of Kantian fractionalization predict current values ofconflict rate, but lagged values of conflict rate do not predictcurrent values of Kantian fractionalization.
IGO LayerFor the IGO layer, we also operationalized the relationship
between two states as the proportion of IGOs they share. Thedirected edge weight from country i to country j is definedby the number of IGOs in which both i and j are a memberdivided by the total number of IGOs in which country i is amember. Again, the edge weights of this layer are rescaled sothat the median present edge weight is 1, following the pro-cess discussed above. The results of the regressions when theIGO layer is redefined in this way are shown in Table S8. Theresults of these analyses are qualitatively the same as those inTable 1. The results for the Granger causal tests with this al-ternative operationalization of IGO membership can be foundin Table S9.
It is worth noting that while this alternative specificationmight be the more appropriate measure for some researchquestions in international relations, we selected our measureof the IGO relationship carefully and intentionally. Not onlyis our original specification consistent with how common IGOmembership is measured in other studies (1, 2), but it also di-rectly measures our quantity of interest: in how many organi-zations are this pair of countries interacting, sharing commonnorms, and benefiting from non-violent avenues for conflictresolution? We have no theoretical reason to expect that thebenefit of being part of 5 shared organizations is greater for acountry that is only a member of 6 total organizations than
for a country that is a member of 20. Both countries have 5shared international forums in which they can generate com-mon standards and air their grievances with each other.
Indeed, scaling the number of common IGOs by the totalnumber of IGOs the country is a member of potentially under-represents the strength of the IGO relationship between coun-tries (such as the United States) that are members of manyorganizations but also maintain a large diplomatic staff inorder to actively participate in each of these organizations.Moreover, this rescaling removes important variance from themeasure of common IGO membership and over-represents thestrength of some relationships. For example, the rescaled mea-sure would give an edge between a country that shares all 10of its IGO memberships with another country and an edgebetween a country that shares all 3 of its IGO membershipswith another country the same weight of 1. Both relation-ships would have the strongest possible tie, but the countriessharing 10 common memberships are more strongly connectedthan those sharing only 3. For these reasons, we believe thatour original operationalization of the IGO layer is the mostappropriate measure for our theory.
Democracy LayerFinally, we considered alternative measures of the relation-
ship between country i and country j’s domestic politicalregimes, replacing the joint democracy clique layer with anundirected network of polity similarity between countries. Byconsidering the difference in polity scores between country iand country j, this alternative specification identifies countrypairs that have similar political regimes. Jointly democraticand jointly autocratic pairs are both captured using this mea-sure. Specifically, we set the polity similarity weight betweencountry i and country j to be the unit-peak-height zero-meanGaussian of the difference between polity scores of countriesi and j. Four different values of the standard deviation ofthis Gaussian were considered, yielding different democracylayer specifications. The correlations between the multilayermodularity score as computed originally compared to thesealternative computations are shown in Table S10.
From this table we see that computing multilayer modular-ity with these differences in Polity IV scores results in val-ues very similar to the original Kantian fractionalization mea-sure. This observation further supports the assertion that thedemocracy layer is playing little role in the computation ofthe multilayer modularity score of the international systemand that this finding is robust to our operationalization of thedemocracy layer.
Conflict Rate with Politically Relevant DyadsIn addition to ensuring our results were robust to the oper-ationalization of the layers of our multiplex network, we alsoensured that our results were robust to our operationalizationof the outcome variable, conflict rate. For our Poisson models,we include an offset for the log number of dyads in the inter-national system. For our linear models we divide the numberof new conflicts in each year by the total number of dyadsin the international system. Not all of these dyads, however,are at risk of conflict in a given year. Therefore, while weneed to consider the changing number of states in the interna-tional system from 1948–2000, perhaps not all dyads shouldbe included in these adjustments. To consider this possibility,we repeated our analyses considering only politically relevantdyads as defined by Maoz and Russett (23).
Studies of dyadic conflict identify major power status andcontiguity as strong indicators of potential for dyadic conflict(34). Maoz and Russett define politically relevant dyads to be
www.pnas.org/cgi/doi/10.1073/pnas.1509423112 Cranmer et al. | 7 of 19

those in which the countries are directly or indirectly contigu-ous or in which one member is a major power (23, p. 627).While trying to limit the set of dyads to those in which thereis potential for conflict (excluding dyads for which the pos-sibility of conflict is negligible) has appeal, using politicallyrelevant dyads also has downsides; in particular, conflict hasoccurred between countries that are not captured in this def-inition of political relevance. Nevertheless, we repeated theanalysis with the outcome variable defined as the number ofconflicts begun between politically relevant dyads. For thecount models, we then include an offset of the log number ofpolitically relevant dyads in the system each year. For thelinear models, we divide the number of new conflicts by thenumber of politically relevant dyads in order to account for thechanging number of politically relevant dyads in each year.
As shown in Tables S11 and S12, our results are strongerwhen limiting our analysis to politically relevant dyads. Therelationship between Kantian fractionalization and conflictrate is statistically significant and substantively large acrossall statistical specifications. Additionally, the Granger causalresults show that lagged values of Kantian fractionalizationpredict current values of conflict density while lagged valuesof conflict density do not predict current values of Kantianfractionalization.
Additional Robustness ChecksWe conducted additional sets of robustness checks in order toverify that our variable of interest, Kantian fractionalization,is in fact driving the results of our statistical models.
Single-Layer ModularitiesWe considered linear and count models of conflict density
and conflict count using lagged values of the single-layer mod-ularities of the trade and IGO networks. Table S13 displaysthe result of this analysis, including trade and IGO modu-larities separately. In Table S14 we consider the modularityof the IGO and trade networks together with the density ofdemocracies in the international system as well.
Layer DensitiesTable S15 displays the results of linear and count models
that use the densities of the IGO, joint democracy, and tradenetworks (all lagged by one year) as predictors of conflict den-sity and conflict count (once again including a lagged depen-dent variable). Importantly, these model results further assure
us that the results in Table 1 are not merely a function of thechanges in these densities over time.
Without Democracy LayerLastly, to verify the intuition from Figure 3 in the main text,
we recomputed Kantian modularity omitting joint democracyentirely. In other words, we computed the multilayer mod-ularity in the same way as before, but considering only thetrade and IGO networks. We then repeated the entire empir-ical analysis: regressions and Granger tests. The results fromthese analyses are presented in Tables S16 and S17. The re-sults are very similar to those presented in the main text andnone of the qualitative conclusions we would draw from eitherset of results differ.
Comparing Predictive PerformanceWhile the above tests provide support that our measure,
Kantian fractionalization, provides something beyond includ-ing single-layer modularity scores or single-layer densities, Fig-ure S5 shows that Kantian fractionalization also performs bet-ter out-of-sample than these alternatives. Once again, we es-timate our specifications on the data from the beginning ofthe period of observation up until year t and then forecastone and five years ahead, walking this process across the pe-riod of observation from beginning to end. The first bar ineach figure represents the Root MSPE from a simple autore-gressive model. The second bar is the Root MSPE from thebasic model in Table 1. The third bar shows the Root MSPEfrom the basic count model in Table S14 in which single-layermodularities are included as regressors instead of Kantian frac-tionalization. The fourth bar represents the Root MSPE fromthe count model in Table S15 in which densities for each layerwere included as regressors without Kantian fractionalization.And the last bar represents the Root MSPE from the basiccount model in Table S16 where multilayer modularity wascalculated without the joint democracy layer.
Multilayer modularity outperforms all other measures inpredictive performance. When predicting five years ahead,multilayer modularity substantially outperforms models usingsingle-layer modularities or densities. The model in whichmultilayer modularity was computed without joint democracyperforms better out-of-sample than the single-layer modular-ities and densities. Indeed, when joint democracy is removedfrom the multilayer modularity calculation, the model per-forms slightly better than when all three layers of the Kantiantripod are included.
1. Russett B, O’Neal JR, Davis DR (1998) The third leg of the Kantian tripod for peace: Inter-
national organizations and militarized disputes, 1950-85. International Organization 52(3):441-
467.
2. Ward MD, Siverson RM, Cao X (2007) Disputes, democracies, and dependencies: A re-
examination of the Kantian peace. American Journal of Political Science 51(3):583-601.
3. Allport GW (1954) The Nature of Prejudice (Perseus Books, Cambridge, MA).
4. Pinker S (2011) The Better Angels of Our Nature: Why Violence has Declined (Penguin
Group, New York, NY).
5. Gartzke E (2007) The capitalist peace. American Journal of Political Science 51(1):166-191.
6. Pevehouse JC, Nordstrom T, Warnke K (2004) The correlates of war 2 international govern-
mental organizations data version 2.0. Conflict Management and Peace Science 21(2):101-119.
7. Barbieri K, Keshk OMG, Pollins B (2009) Trading data: Evaluating our assumptions and coding
rules. Conflict Management and Peace Science 26(5): 471-491.
8. Marshall MG, Jaggers K (2002) Polity IV Project: Political Regime Characteristics and Transi-
tions, 1800-2002 (Center for International Development and Conflict Management, University
of Maryland, College Park, MD), Version p4v2002e.
9. Mucha PJ, Richardson T, Macon K, Porter MA, Onnela JP (2010) Community structure in
time-dependent, multiscale, and multiplex networks. Science 328(5980):876-878.
10. Leicht EA, Newman MEJ (2008) Community structure in directed networks. Physical Review
Letters 100(11):118703.
11. Newman MEJ, Girvan M (2004) Finding and evaluating community structure in networks.
Physical Review E 69(2):026113.
12. Good BH, de Montjoye YA, Clauset A (2010) Performance of modularity maximization in
practical contexts. Physical Review E 81(4):046106.
13. Jutla IS, Jeub LGS, Mucha PJ (2011–2012) A generalized Louvain method for community
detection implemented in MATLAB [http://netwiki.amath.unc.edu/genlouvain].
14. Blondel VD, Guillaume JL, Lambiotte R, Lefebvre E (2008) Fast unfolding of communities in
large networks. Journal of Statistical Mechanics: Theory and Experiment 2008(10):P10008.
15. Kernighan BW, Lin S (1970) An efficient heuristic procedure for partitioning graphs. The Bell
System Technical Journal 49(2):291-307.
16. Newman MEJ (2006) Finding community structure in networks using the eigenvectors of ma-
trices. Physical Review E 74(3):036104.
17. Richardson T, Mucha PJ, Porter MA (2009) Spectral tripartitioning of networks. Physical
Review E 80(3):036111.
18. Wayman FW (1985) Bipolarity, multipolarity and the threat of war. In Polarity and War:
The Changing Structure of International Conflict, ed Sabrosky AN (Westview, Boulder, CO),
115-144.
19. Wayman FW, Morgan TC (1991) Evolution and direction for improvement in correlates of war
project methodologies. In Measuring the Correlates of War, eds Diehl PF, Singer JD (University
of Michigan Press, Ann Arbor, MI), 139-158.
20. Moul WB (1993) Polarization, polynomials, and war. Journal of Conflict Resolution 37(4):735-
748.
21. Singer JD, Bremer S, Stuckey J (1972) Capabilities distribution, uncertainty, and major power
war, 1820-1965. In Peace, War, and Numbers, ed Russett B (Sage, Beverly Hills, CA), 19-48.
www.pnas.org/cgi/doi/10.1073/pnas.1509423112 Cranmer et al. | 8 of 19

22. Singer JD (1987) Reconstructing the correlates of war dataset on material capabilities of states,
1816-1985. International Interactions 14(2):115-132.
23. Maoz Z, Russett B (1993) Normative and structural causes of democratic peace, 1946-1986.
American Political Science Review 87(3):624-638.
24. Leeds BA, Ritter JM, Mitchell SM, Long AG (2002) Alliance treaty obligations and provisions,
1815-1944. International Interactions 28(3): 237-260.
25. Sugihara G, May R, Ye H, Hsieh C, Deyle E, Fogarty M, Munch S (2012) Detecting causality
in complex ecosystems. Science 338(6106):496-500.
26. Mucha PJ, Porter MA (2010) Communities in multislice voting networks. Chaos 20(4):041108.
27. Bassett DS, Wymbs NF, Porter MA, Mucha PJ, Carlson JM, Grafton ST (2011) Dynamic
reconfiguration of human brain networks during learning. Proceedings of the National Academy
of Sciences 108(18):7641-7646.
28. Wymbs NF, Bassett DS, Mucha PJ, Porter MA, Grafton ST (2012) Differential recruitment of
the sensorimotor putamen and frontoparietal cortex during motor chunking in humans. Neuron
74(5):936-946.
29. Fortunato S, Barthelemy M (2007) Resolution limit in community detection. Proceedings of
the National Academy of Sciences 104(1):36-41.
30. Reichardt J, Bornholdt S (2006) Statistical mechanics of community detection. Physical Review
E (Statistical, Nonlinear, and Soft Matter Physics) 74(1):016110.
31. Fenn DJ, Porter MA, McDonald M, Williams S, Johnson NF, Jones NS (2009) Dynamic
communities in multichannel data: An application to the foreign exchange market during the
2007-2008 credit crisis. Chaos 19(3):033119.
32. Macon KT, Mucha PJ, Porter MA (2012) Community structure in the United Nations general
assembly. Physica A 391:343-361.
33. Bassett DS, Porter MA, Wymbs NF, Grafton ST, Carlson JM, Mucha PJ (2013) Robust
detection of dynamic community structure in networks. Chaos 23(1):013142.
34. Bremer SA (1992) Dangerous dyads: Conditions affecting the likelihood of interstate war,
1816-1965. Journal of Conflict Resolution 36(2):309-341.
0 5 10 15
-0.2
0.0
0.2
0.4
0.6
0.8
1.0
Lag
ACF
Autocorrelation Function: Density of Violent MID Onset
5 10 15
-0.2
0.0
0.2
0.4
0.6
Lag
Par
tial A
CF
Partial Autocorrelation Function: Density of Violent MID Onset
Fig. S1. Auto-Correlation Function and Partial Auto-Correlation Function Plots. 95% confidence intervals are shown in blue.
Table S1. Linear models of violent conflict onset density.
Basic Model Full Model Without Frac.Kantian Frac. (lag) 0.041∗ (0.012) 0.055 (0.019)
Moul Polarity -0.000 (0.001) -0.001 (0.001)Alliance Dep. (lag) 0.007 (0.004) 0.003 (0.004)
Sys. Movement (5 year) 0.004 (0.018) 0.029 (0.017)Lagged Outcome 0.347 (0.131) 0.220 (0.146) 0.464 (0.129)
(Intercept) -0.002 (0.001) -0.007 (0.003) 0.001 (0.002)Adjusted R2 0.523 0.531 0.455
∗Coefficients and standard errors displayed in bold are statistically significant at or below the p = 0.05 level.
www.pnas.org/cgi/doi/10.1073/pnas.1509423112 Cranmer et al. | 9 of 19
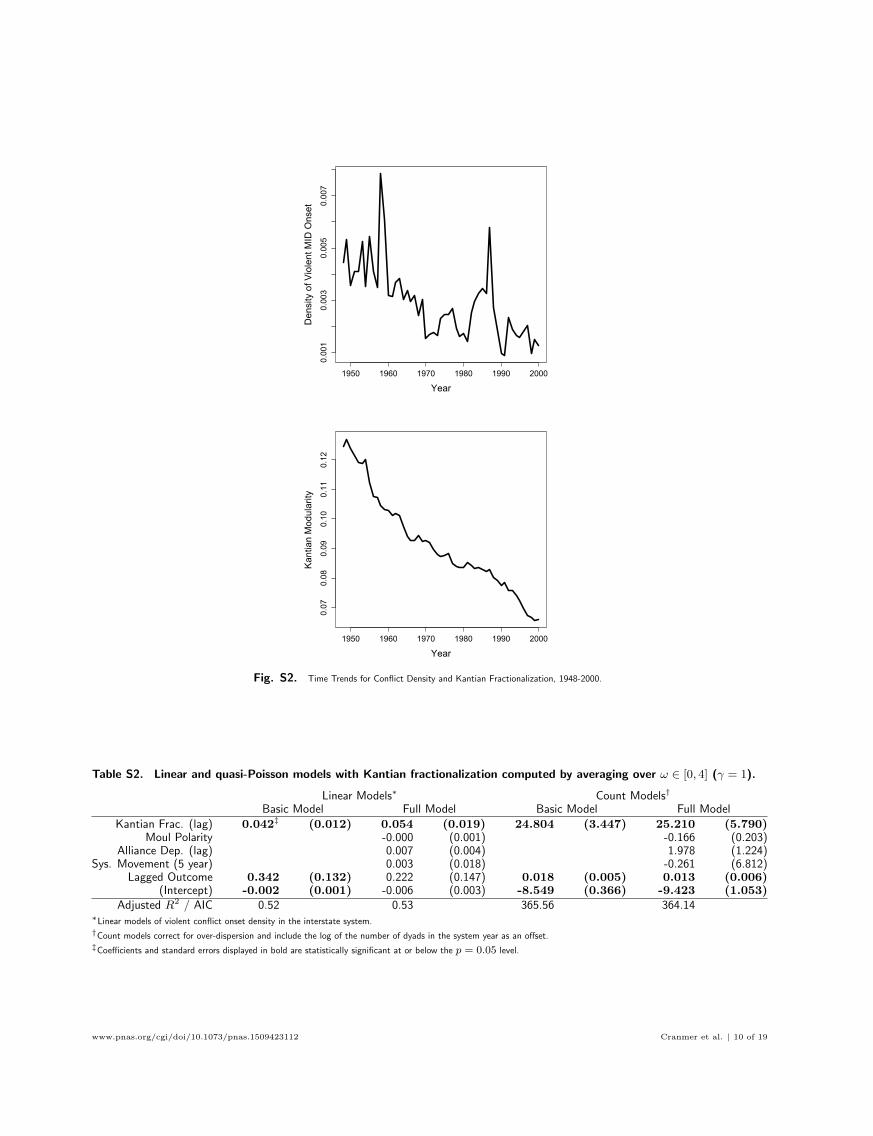
1950 1960 1970 1980 1990 2000
0.001
0.003
0.005
0.007
Year
Den
sity
of V
iole
nt M
ID O
nset
1950 1960 1970 1980 1990 2000
0.07
0.08
0.09
0.10
0.11
0.12
Year
Kan
tian
Mod
ular
ity
Fig. S2. Time Trends for Conflict Density and Kantian Fractionalization, 1948-2000.
Table S2. Linear and quasi-Poisson models with Kantian fractionalization computed by averaging over ω ∈ [0, 4] (γ = 1).
Linear Models∗ Count Models†
Basic Model Full Model Basic Model Full Model
Kantian Frac. (lag) 0.042‡ (0.012) 0.054 (0.019) 24.804 (3.447) 25.210 (5.790)Moul Polarity -0.000 (0.001) -0.166 (0.203)
Alliance Dep. (lag) 0.007 (0.004) 1.978 (1.224)Sys. Movement (5 year) 0.003 (0.018) -0.261 (6.812)
Lagged Outcome 0.342 (0.132) 0.222 (0.147) 0.018 (0.005) 0.013 (0.006)(Intercept) -0.002 (0.001) -0.006 (0.003) -8.549 (0.366) -9.423 (1.053)
Adjusted R2 / AIC 0.52 0.53 365.56 364.14∗Linear models of violent conflict onset density in the interstate system.†Count models correct for over-dispersion and include the log of the number of dyads in the system year as an offset.‡Coefficients and standard errors displayed in bold are statistically significant at or below the p = 0.05 level.
www.pnas.org/cgi/doi/10.1073/pnas.1509423112 Cranmer et al. | 10 of 19
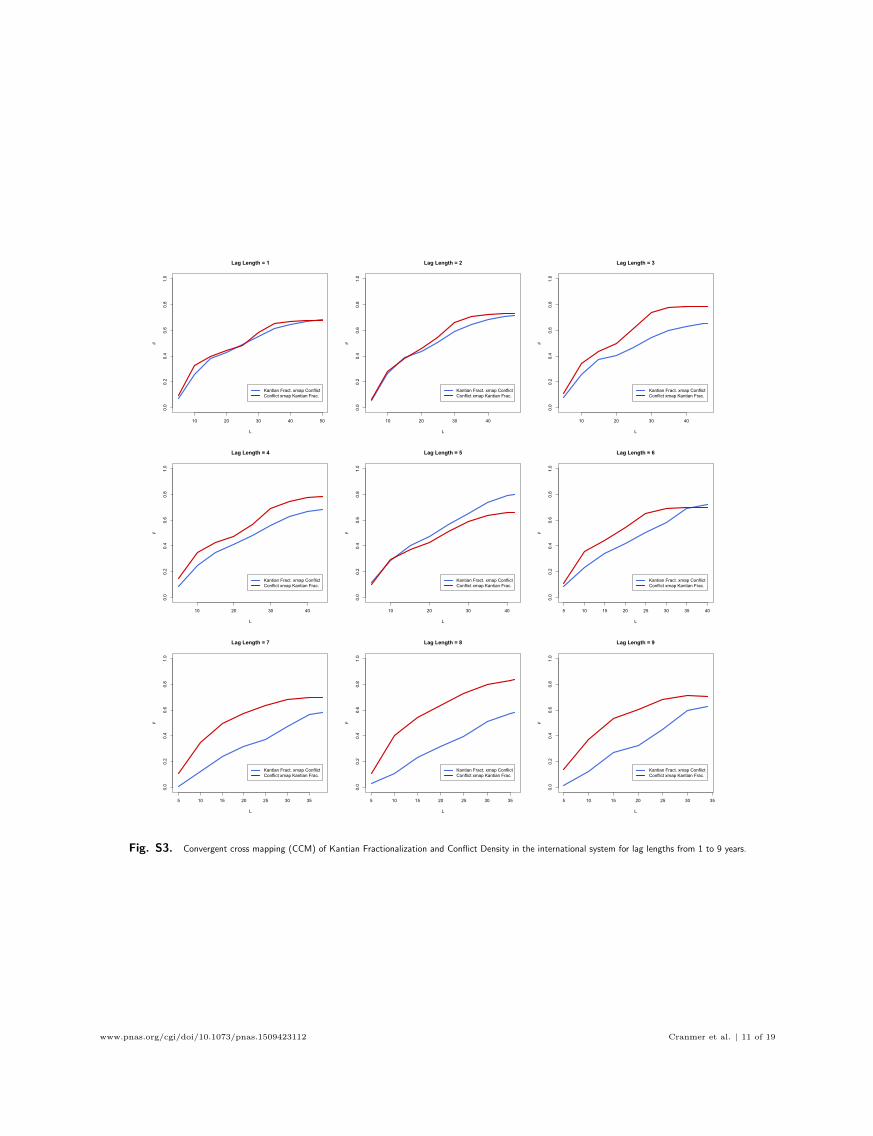
10 20 30 40 50
0.0
0.2
0.4
0.6
0.8
1.0
Lag Length = 1
L
ρ
Kantian Fract. xmap ConflictConflict xmap Kantian Frac.
10 20 30 40
0.0
0.2
0.4
0.6
0.8
1.0
Lag Length = 2
L
ρ
Kantian Fract. xmap ConflictConflict xmap Kantian Frac.
10 20 30 40
0.0
0.2
0.4
0.6
0.8
1.0
Lag Length = 3
L
ρ
Kantian Fract. xmap ConflictConflict xmap Kantian Frac.
10 20 30 40
0.0
0.2
0.4
0.6
0.8
1.0
Lag Length = 4
L
ρ
Kantian Fract. xmap ConflictConflict xmap Kantian Frac.
10 20 30 40
0.0
0.2
0.4
0.6
0.8
1.0
Lag Length = 5
L
ρ
Kantian Fract. xmap ConflictConflict xmap Kantian Frac.
5 10 15 20 25 30 35 40
0.0
0.2
0.4
0.6
0.8
1.0
Lag Length = 6
L
ρ
Kantian Fract. xmap ConflictConflict xmap Kantian Frac.
5 10 15 20 25 30 35
0.0
0.2
0.4
0.6
0.8
1.0
Lag Length = 7
L
ρ
Kantian Fract. xmap ConflictConflict xmap Kantian Frac.
5 10 15 20 25 30 35
0.0
0.2
0.4
0.6
0.8
1.0
Lag Length = 8
L
ρ
Kantian Fract. xmap ConflictConflict xmap Kantian Frac.
5 10 15 20 25 30 35
0.0
0.2
0.4
0.6
0.8
1.0
Lag Length = 9
L
ρ
Kantian Fract. xmap ConflictConflict xmap Kantian Frac.
Fig. S3. Convergent cross mapping (CCM) of Kantian Fractionalization and Conflict Density in the international system for lag lengths from 1 to 9 years.
www.pnas.org/cgi/doi/10.1073/pnas.1509423112 Cranmer et al. | 11 of 19

Table S3. Granger causal analysis with Kantianfractionalization computed by averaging over ω ∈[0, 4] (γ = 1).
Conflict Dens. → Kantian Frac. →Kantian Frac. Conflict Dens.
Lags F -Statistic∗ p-Value F -Statistic p-Value
1 0.037 0.848 12.136 0.001
2 0.088 0.916 4.213 0.021
3 0.219 0.882 3.710 0.018
4 0.856 0.498 3.811 0.010
5 0.711 0.619 2.829 0.029
6 0.545 0.770 1.906 0.108
7 0.751 0.631 2.618 0.030
8 0.735 0.660 1.668 0.151
9 0.597 0.787 1.037 0.439
10 0.732 0.687 0.977 0.490∗F -statistics and p-values shown in bold are statistically significant at
or below the p = 0.05 level.
Table S4. Linear and quasi-Poisson models with Kantian fractionalization computed with γ = 2 and ω = 1.
Linear Models∗ Count Models†
Basic Model Full Model Basic Model Full Model
Kantian Frac. (lag) 0.027‡ (0.008) 0.037 (0.013) 16.288 (2.315) 16.590 (3.835)Moul Polarity -0.001 (0.001) -0.201 (0.197)
Alliance Dep. (lag) 0.008 (0.004) 2.260 (1.230)Sys. Movement (5 year) 0.003 (0.018) -0.198 (6.757)
Lagged Outcome 0.355 (0.132) 0.213 (0.148) 0.019 (0.006) 0.013 (0.006)(Intercept) -0.001 (0.001) -0.006 (0.003) -8.096 (0.314) -9.061 (0.995)
Adjusted R2 / AIC 0.52 0.53 368.42 364.63∗Linear models of violent conflict onset density in the interstate system.†Count models correct for over-dispersion and include the log of the number of dyads in the system year as an offset.‡Coefficients and standard errors displayed in bold are statistically significant at or below the p = 0.05 level.
www.pnas.org/cgi/doi/10.1073/pnas.1509423112 Cranmer et al. | 12 of 19

Table S5. Granger causal analysis with Kantianfractionalization computed with γ = 2 and ω = 1.
Conflict Dens. → Kantian Frac. →Kantian Frac. Conflict Dens.
Lags F -Statistic∗ p-Value F -Statistic p-Value
1 0.007 0.934 11.441 0.001
2 0.052 0.949 3.922 0.027
3 0.254 0.858 3.755 0.018
4 0.827 0.516 4.657 0.004
5 0.643 0.669 3.711 0.008
6 0.387 0.882 2.692 0.030
7 0.807 0.588 3.521 0.007
8 0.687 0.700 2.385 0.042
9 0.646 0.748 1.607 0.167
10 0.687 0.725 1.357 0.263∗F -statistics and p-values shown in bold are statistically significant at
or below the p = 0.05 level.
Table S6. Linear and quasi-Poisson models with Kantian fractionalization computed with trade measured in terms of theproportion of total trade volumes.
Linear Models∗ Count Models†
Basic Model Full Model Basic Model Full Model
Kantian Frac. (lag) 0.043‡ (0.013) 0.053 (0.019) 24.827 (3.607) 23.764 (5.618)Moul Polarity -0.001 (0.001) -0.220 (0.197)
Alliance Dep. (lag) 0.007 (0.004) 2.212 (1.224)Sys. Movement (5 year) 0.012 (0.017) 3.834 (6.306)
Lagged Outcome 0.346 (0.134) 0.227 (0.149) 0.015 (0.006) 0.011 (0.006)(Intercept) -0.002 (0.001) -0.006 (0.003) -8.411 (0.361) -9.276 (1.043)
Adjusted R2 / AIC 0.52 0.52 368.12 365.65∗Linear models of violent conflict onset density in the interstate system.†Count models correct for over-dispersion and include the log of the number of dyads in the system year as an offset.‡Coefficients and standard errors displayed in bold are statistically significant at or below the p = 0.05 level.
www.pnas.org/cgi/doi/10.1073/pnas.1509423112 Cranmer et al. | 13 of 19

Community AssignmentCommunity 1Community 2Community 3Community 4
NetworkIGOJoint DemocracyTrade
Fig. S4. Maps of the international system in 1950, 1975, and 2000 (top to bottom), with community assignments generated by a single realization of the computational
heuristic (13) at default resolution parameters (γ = ω = 1).
www.pnas.org/cgi/doi/10.1073/pnas.1509423112 Cranmer et al. | 14 of 19

Table S7. Granger causal analysis with Kantianfractionalization computed with trade measured interms of the proportion of total trade volumes.
Conflict Dens. → Kantian Frac. →Kantian Frac. Conflict Dens.
Lags F -Statistic∗ p-Value F -Statistic p-Value
1 0.038 0.846 11.300 0.002
2 0.081 0.922 4.010 0.025
3 0.160 0.922 2.779 0.052
4 0.676 0.612 3.508 0.015
5 0.586 0.711 2.987 0.023
6 0.641 0.696 2.052 0.085
7 0.739 0.641 2.026 0.083
8 0.648 0.731 1.288 0.289
9 0.553 0.822 0.759 0.653
10 0.515 0.861 0.872 0.571∗F -statistics and p-values shown in bold are statistically significant at
or below the p = 0.05 level.
Table S8. Linear and quasi-Poisson models with Kantian fractionalization computed with common IGO memberships mea-sured in terms of the proportion of total IGO memberships.
Linear Models∗ Count Models†
Basic Model Full Model Basic Model Full Model
Kantian Frac. (lag) 0.071‡ (0.021) 0.081 (0.031) 41.181 (6.358) 36.323 (9.691)Moul Polarity -0.001 (0.001) -0.314 (0.187)
Alliance Dep. (lag) 0.004 (0.004) 0.862 (1.295)Sys. Movement (5 year) -0.006 (0.021) -3.049 (7.545)
Lagged Outcome 0.362 (0.131) 0.259 (0.144) 0.017 (0.006) 0.012 (0.006)(Intercept) -0.003 (0.001) -0.004 (0.002) -9.047 (0.473) -8.433 (0.990)
Adjusted R2 / AIC 0.52 0.52 368.43 374.50∗Linear models of violent conflict onset density in the interstate system.†Count models correct for over-dispersion and include the log of the number of dyads in the system year as an offset.‡Coefficients and standard errors displayed in bold are statistically significant at or below the p = 0.05 level.
www.pnas.org/cgi/doi/10.1073/pnas.1509423112 Cranmer et al. | 15 of 19

Table S9. Granger causal analysis with Kan-tian fractionalization computed with common IGOmemberships measured in terms of the proportionof total IGO memberships.
Conflict Dens. → Kantian Frac. →Kantian Frac. Conflict Dens.
Lags F -Statistic∗ p-Value F -Statistic p-Value
1 2.742 0.104 11.357 0.001
2 2.202 0.122 3.816 0.029
3 4.003 0.013 2.655 0.060
4 3.188 0.023 2.078 0.102
5 2.576 0.043 1.714 0.156
6 2.146 0.073 1.162 0.349
7 1.667 0.154 1.697 0.146
8 1.757 0.129 1.073 0.409
9 1.861 0.106 1.421 0.232
10 1.577 0.179 1.275 0.302∗F -statistics and p-values shown in bold are statistically significant at
or below the p = 0.05 level.
Table S10. Correlations of multilayer modularity scores calculated with democracy layeredges weighted by the unit-peak-height Gaussian of the difference in Polity scores(“Diff.”) with standard deviations (s.d.) of 1, 2, 3, and 4, as well as the original jointdemocracy clique.
Diff. (s.d.=1) Diff. (s.d.=2) Diff. (s.d.=3) Diff. (s.d.=4) Kant. Frac.
Diff. (s.d.=1) 1.00 0.96 0.94 0.92 0.98
Diff. (s.d.=2) 0.96 1.00 0.99 0.99 0.97
Diff. (s.d.=3) 0.94 0.99 1.00 1.00 0.95
Diff. (s.d.=4) 0.92 0.99 1.00 1.00 0.93
Kant. Frac. 0.98 0.97 0.95 0.93 1.00
Table S11. Linear and quasi-Poisson models among politically relevant dyads in the interstate system.
Linear Models∗ Count Models†
Basic Model Full Model Basic Model Full Model
Kantian Frac. (lag) 0.346‡ (0.084) 0.487 (0.136) 23.632 (2.630) 21.871 (5.784)Moul Polarity -0.003 (0.004) -0.220 (0.158)
Alliance Dep. (lag) 0.050 (0.025) 1.730 (1.072)Sys. Movement (5 year) -0.055 (0.124) -4.650 (5.577)
Lagged Outcome 0.258 (0.135) 0.101 (0.150) 0.019 (0.008) 4.229 (6.270)(Intercept) -0.016 (0.006) -0.051 (0.023) -6.416 (0.302) -6.578 (0.974)
Adjusted R2 / AIC 0.55 0.57 319.36 316.04∗Linear models of violent conflict onset density in the interstate system.†Count models correct for over-dispersion and include the log of the number of politically relevant dyads in the system year as an offset.‡Coefficients and standard errors displayed in bold are statistically significant at or below the p = 0.05 level.
www.pnas.org/cgi/doi/10.1073/pnas.1509423112 Cranmer et al. | 16 of 19

Table S12. Granger causal analysis with conflictdensity among politically relevant dyads.
Conflict Dens. → Kantian Frac. →Kantian Frac. Conflict Dens.
Lags F -Statistic∗ p-Value F -Statistic p-Value
1 0.000 0.999 16.838 0.000
2 0.079 0.924 6.863 0.002
3 0.099 0.960 4.086 0.012
4 1.285 0.292 5.755 0.001
5 0.918 0.480 3.960 0.006
6 0.945 0.476 3.984 0.004
7 1.248 0.307 3.891 0.004
8 0.637 0.740 3.540 0.006
9 0.992 0.471 2.690 0.024
10 0.835 0.602 2.405 0.041∗F -statistics and p-values shown in bold are statistically significant at
or below the p = 0.05 level.
Table S13. Linear and quasi-Poisson models using single-layer modularities of the Trade and IGO networks.
Linear Models∗
IGO Basic Model Trade Basic Model IGO Full Model Trade Full Model
IGO Modularity (lag) 0.071† (0.021) 0.081 (0.031)Trade Modularity (lag) 0.046 (0.018) 0.050 (0.025)
Moul Polarity -0.001 (0.001) -0.001 (0.001)Alliance Dep. (lag) 0.003 (0.004) 0.006 (0.004)
Sys. Movement (5 year) -0.006 (0.021) 0.032 (0.017)Lagged Outcome 0.368 (0.131) 0.500 (0.119) 0.265 (0.144) 0.376 (0.132)
(Intercept) -0.003 (0.001) -0.003 (0.002) -0.004 (0.003) -0.006 (0.004)Adjusted R2 0.515 0.475 0.516 0.489
Count Models‡
IGO Basic Model Trade Basic Model IGO Full Model Trade Full ModelIGO Modularity (lag) 41.749 (6.567) 36.285 (9.879)
Trade Modularity (lag) 30.378 (6.074) 26.013 (8.075)Moul Polarity -0.327 (0.187) -0.419 (0.184)
Alliance Dep. (lag) 0.818 (1.303) 2.641 (1.320)Sys. Movement (5 year) -2.833 (7.574) 15.331 (5.804)
Lagged Outcome 0.017 (0.006) 0.011 (0.006) 0.011 (0.006) 0.007 (0.007)(Intercept) -9.054 (0.482) -8.982 (0.588) -8.349 (0.987) -9.634 (1.355)
AIC 385.62 400.77 375.59 380.27∗Linear models of violent conflict onset density in the interstate system.†Coefficients and standard errors displayed in bold are statistically significant at or below the p = 0.05 level.‡Count models correct for over-dispersion and include the log of the number of dyads in the system year as an offset.
www.pnas.org/cgi/doi/10.1073/pnas.1509423112 Cranmer et al. | 17 of 19

Table S14. Linear and quasi-Poisson models using single-layer modularities of the Trade and IGO networks.
Linear Models∗ Count Models†
Basic Model Full Model Basic Model Full Model
Trade Modularity (lag) 0.039 (0.025) 0.052‡ (0.025) 20.195 (8.156) 21.593 (8.103)IGO Modularity (lag) 0.058 (0.023) 0.068 (0.031) 29.530 (7.172) 26.741 (10.276)
Democracy Density (lag) 0.002 (0.005) 0.015 (0.011) 0.138 (1.730) 3.235 (3.896)Moul Polarity -0.001 (0.001) -0.364 (0.329)
Alliance Dep. (lag) 0.004 (0.004) 1.205 (1.337)Sys. Movement (5 year) -0.013 (0.023) -2.966 (8.376)
Lagged Outcome 0.304 (0.133) 0.158 (0.150) 0.016 (0.005) 0.011 (0.006)(Intercept) -0.006 (0.002) -0.008 (0.004) -10.087 (0.810) -10.152 (1.407)
Adjusted R2 / AIC 0.529 0.541 363.53 363.15∗Linear models of violent conflict onset density in the interstate system.†Count models correct for over-dispersion and include the log of the number of dyads in the system year as an offset.‡Coefficients and standard errors displayed in bold are statistically significant at or below the p = 0.05 level.
Table S15. Linear and quasi-Poison models using densities rather than modularities as regressors.
Linear Models∗ Count Models†
Densities With Frac. Densities With Frac.
Kantian Frac. (lag) 0.074‡ (0.027) 35.284 (8.251)IGO Density (lag) -0.004 (0.002) 0.003 (0.003) -2.269 (0.796) 1.504 (1.104)
Democracy Density (lag) 0.004 (0.006) -0.005 (0.006) 2.368 (2.313) -2.429 (2.230)Trade Density (lag) 0.003 (0.003) 0.000 (0.003) 1.308 (1.233) -0.775 (1.140)
Lagged Outcome 0.490 (0.126) 0.299 (0.137) 0.020 (0.007) 0.014 (0.006)(Intercept) 0.002 (0.002) -0.007 (0.004) -5.645 (0.736) -9.961 (1.189)
Adjusted R2 / AIC 0.449 0.515 408.86 366.94∗Linear models of violent conflict onset density in the interstate system.†Count models correct for over-dispersion and include the log of the number of dyads in the system year as an offset.‡Coefficients and standard errors displayed in bold are statistically significant at or below the p = 0.05 level.
Table S16. Linear and quasi-Poisson models with Kantian fractionalization computed without Joint Democracy.
Linear Models∗
Basic Model Full Model Without Frac.
Kantian Frac. (No-JD, lag) 0.064† (0.017) 0.082 (0.026)Moul Polarity 0.000 (0.001) -0.001 (0.001)
Alliance Dep. (lag) 0.007 (0.004) 0.003 (0.004)Sys. Movement (5 year) 0.005 (0.017) 0.029 (0.017)
Lagged Outcome 0.327 (0.130) 0.210 (0.142) 0.464 (0.129)(Intercept) -0.003 (0.001) -0.008 (0.004) 0.001 (0.002)
Adjusted R2 0.537 0.545 0.455Count Models‡
Basic Model Full Model Without Frac.Kantian Frac. (No-JD, lag) 35.644 (4.874) 35.415 (7.761)
Moul Polarity -0.177 (0.195) -0.726 (0.165)Alliance Dep. (lag) 2.007 (1.194) 1.624 (1.455)
Sys. Movement (5 year) 0.996 (6.455) 15.177 (6.147)Lagged Outcome 0.017 (0.005) 0.013 (0.006) 0.006 (0.007)
(Intercept) -9.285 (0.455) -10.124 (1.131) -5.891 (0.804)AIC 362.48 361.27 406.67
∗Linear models of violent conflict onset density in the interstate system.†Coefficients and standard errors displayed in bold are statistically significant at or below the p = 0.05 level.‡Count models correct for over-dispersion and include the log of the number of dyads in the system year as an offset.
www.pnas.org/cgi/doi/10.1073/pnas.1509423112 Cranmer et al. | 18 of 19

Table S17. Granger causal analysis with Kantianfractionalization computed without Joint Democ-racy.
Conflict Dens. → Kantian Frac. →Kantian Frac. Conflict Dens.
Lags F -Statistic∗ p-Value F -Statistic p-Value
1 0.085 0.772 13.974 0.000
2 0.059 0.943 6.620 0.003
3 0.271 0.846 5.165 0.004
4 1.885 0.132 4.268 0.006
5 1.075 0.390 3.506 0.011
6 0.668 0.676 2.587 0.036
7 0.957 0.479 3.278 0.010
8 1.096 0.395 2.110 0.069
9 1.225 0.324 1.323 0.275
10 1.421 0.235 1.167 0.362
9 1.151 0.366 1.778 0.123
10 1.377 0.254 1.562 0.184∗F -statistics and p-values shown in bold are statistically significant at
or below the p = 0.05 level.
05
1015
2025
Aut
oreg
ress
ive
Onl
y
Mul
tilay
er M
odul
arity
Sin
gle−
Laye
r M
od.
Den
sitie
s
No
Dem
ocra
cy
Roo
t MS
PE
(C
onfli
ct C
ount
)
12.9411.27 11.57
13.76
10.79
One Year Ahead
020
4060
80
Aut
oreg
ress
ive
Onl
y
Mul
tilay
er M
odul
arity
Sin
gle−
Laye
r M
od.
Den
sitie
s
No
Dem
ocra
cy
Roo
t MS
PE
(C
onfli
ct C
ount
)
14.7310.81
24.86
75.61
10.16
Five Years Ahead
Fig. S5. Out-of-sample (one and five years ahead) predictive performance comparing the models from Tables 1, S14, S15, and S16. The values of conflict count were
forecast using only the data available up to, but not including, the year forecast.
www.pnas.org/cgi/doi/10.1073/pnas.1509423112 Cranmer et al. | 19 of 19