Demographic Fractionalization and the Municipal Bond Market
39
1 Demographic Fractionalization and the Municipal Bond Market Daniel Bergstresser, Randolph Cohen, and Siddharth Shenai* This paper studies the impact of ethnic and religious fractionalization on the U.S. mu- nicipal debt market and finds that issuers from more ethnically and religiously fractional- ized counties pay higher yields on their municipal debt. A two standard deviation increase in religious fractionalization is associated with a six basis point increase in bond yields, and a two standard deviation increase in ethnic fractionalization is associated with a 10 basis point increase. To provide a scale for these results, a four-notch rating change, from AAA to AA–, is associated with an eight basis point increase in yields. Additional analysis suggests that at least some of this effect is not driven by the risk of the bonds but reflects, instead, inefficiency in the underwriting process. A variety of researchers have explored the impact of ethnolinguis- tic diversity on economic outcomes. Easterly and Levine (1997) propose that ethnolinguistic fractionalization can explain the poor growth observed in post-colonial Africa: borders left by the former colo- nial powers have resulted in ethnically divided countries that make for *Daniel Bergstresser is an associate professor of finance at the Brandeis International Business School (IBS). Randolph Cohen is a senior lecturer at the Massachusetts Institute of Technology Sloan School of Management. Both are also active in consulting and other activities in the investment management industry. Siddharth Shenai works at Bracebridge Capital. The authors are grateful for support from Harvard Business School.They are also grateful for comments from Bart Mosley, Alexander Whalley, Andrei Shleifer, and Alberto Alesina, and from seminar participants at the Brandeis University 2012 Municipal Finance Conference, the U.S. Securities and Exchange Commission, Harvard Business School, Boston College, the University of Southern California, and the University of California, Merced. Finally, they are grateful for excellent research assistance from Mei Zuo. This paper was delivered at the Brandeis International Business School’s 2012 Municipal Finance Conference in Boston, Massachusetts, on August 3, 2012. Daniel Bergstresser can be reached by email at [email protected].
Transcript of Demographic Fractionalization and the Municipal Bond Market

1
Demographic Fractionalization and the Municipal Bond Market Daniel Bergstresser, Randolph Cohen, and Siddharth Shenai*
This paper studies the impact of ethnic and religious fractionalization on the U.S. mu-nicipal debt market and fi nds that issuers from more ethnically and religiously fractional-ized counties pay higher yields on their municipal debt. A two standard deviation increase in religious fractionalization is associated with a six basis point increase in bond yields, and a two standard deviation increase in ethnic fractionalization is associated with a 10 basis point increase. To provide a scale for these results, a four-notch rating change, from AAA to AA–, is associated with an eight basis point increase in yields. Additional analysis suggests that at least some of this effect is not driven by the risk of the bonds but refl ects, instead, ineffi ciency in the underwriting process.
A variety of researchers have explored the impact of ethnolinguis- tic diversity on economic outcomes. Easterly and Levine (1997) propose that ethnolinguistic fractionalization can explain the poor
growth observed in post-colonial Africa: borders left by the former colo-nial powers have resulted in ethnically divided countries that make for
*Daniel Bergstresser is an associate professor of fi nance at the Brandeis International Business School (IBS). Randolph Cohen is a senior lecturer at the Massachusetts Institute of Technology Sloan School of Management. Both are also active in consulting and other activities in the investment management industry. Siddharth Shenai works at Bracebridge Capital.
The authors are grateful for support from Harvard Business School. They are also grateful for comments from Bart Mosley, Alexander Whalley, Andrei Shleifer, and Alberto Alesina, and from seminar participants at the Brandeis University 2012 Municipal Finance Conference, the U.S. Securities and Exchange Commission, Harvard Business School, Boston College, the University of Southern California, and the University of California, Merced. Finally, they are grateful for excellent research assistance from Mei Zuo.
This paper was delivered at the Brandeis International Business School’s 2012 Municipal Finance Conference in Boston, Massachusetts, on August 3, 2012. Daniel Bergstresser can be reached by email at [email protected] .

2 MUNICIPAL FINANCE JOURNAL
1 Gettleman (2011): “More than any other continent, Africa is wracked by separatists. There are rebels on the Atlantic and on the Red Sea. There are clearly defi ned liberation movements and rudderless, murderous groups known principally for their cruelty or greed. But these rebels share at least one thing: they direct their fi re against weak states struggling to hold together disparate populations within boundaries drawn by 19th-century white colonialists.”
2 We access these data through the American Religion Data Archive and refer to them throughout the paper as the ARDA data.
challenging governance. 1 In the American context, Glaeser, Scheinkman, and Shleifer (1995) fi nd no effect of racial fragmentation on the growth rates of cities, but Alesina and La Ferrara (2000) fi nd that more ethnically fragmented communities have lower participation in civic associations such as church groups, fraternities, and service groups. These social insti-tutions contribute to social capital and can have positive economic effects, as discussed by Putnam (1993, 1995). Similar research on religious diver-sity, however, is lacking, although McCleary and Barro (2006b) examine the relationship between religious observance and economic growth.
In this paper, we use American counties as a laboratory for studying the impact of fractionalization. This approach has at least two advantages. First, using American counties holds constant a variety of underlying factors that cannot be kept constant in cross-country analysis. Second, because local authorities borrow in credit markets, the yield that they pay on their debt is a natural index for comparing their performance. Higher yields on municipal debt must refl ect either higher risk (if capital markets are working effi ciently) or cross-locality differences in the effi ciency with which the municipal underwriting process works.
We construct fractionalization measures of ethnic diversity using data from the 2000 Census, and of religious diversity using the 2000 Religious Congregations and Membership Study, a survey of the major religious denominations conducted by the Association of Statisticians of American Religious Bodies. 2 In this context, fractionalization represents the probabil-ity that two randomly selected members of a group will share a particular attribute. For example, in a society that is half white and half Hispanic, the ethnic fractionalization measure would be 0.5; there would be a 50% chance that any two randomly selected people would be of the same ethnicity. Fractionalization is the most common measure used to capture the extent to which a particular society is divided across a particular characteristic.
We focus on ethnic and religious fractionalization because these charac-teristics are both salient and relatively fi xed. Wealth, income, and education are not directly observable, and like age they vary mechanically over the life cycle. Ethnic and religious affi liations are generally more static. These mea-sures capture the underlying concept that we focus on, namely the strength of social ties across citizens and between citizens and offi cials in a local area.

DEMOGRAPHIC FRACTIONALIZATION AND THE MUNICIPAL BOND MARKET 3
3 The only exception is a handful of counties in south Texas that are homogeneous and Hispanic.
We fi nd evidence that municipal issuers in religiously fractionalized coun-ties pay more to borrow than those in other counties. The point estimates suggest that a one standard deviation increase in fractionalization (0.091) is associated with a three basis point (= 0.3025 * 0.091) increase in the offering yield of debt issued by jurisdictions in the county. A change in religious frac-tionalization from the level observed in highly fractionalized Juneau, Alaska (where our fractionalization index is 0.1746, indicating a 17% chance that two randomly selected people reporting a religion are of the same religion) to highly homogeneous Rich County, Utah (where the fractionalization index is 0.8365) would be associated with a 20 basis point reduction in municipal bond yield at offering. This effect is robust to the inclusion of controls for the overall level of religious observance in a county.
Ethnic fractionalization is also associated with higher bond yields. In contrast to the religion result, the pure effect of ethnic fractionalization is somewhat diffi cult to disentangle from the phenomenon whereby more homogeneously white counties pay less to borrow. While the existence of religiously homogeneous communities of a variety of religious back-grounds allows separate identifi cation of the fractionalization effect, the ethnically homogeneous counties are almost uniformly ethnically white counties. 3 In a specifi cation including just ethnic fractionalization, a one standard deviation increase in ethnic fractionalization is associated with a fi ve basis point increase in bond yields. However, in a specifi cation includ-ing both ethnic fractionalization and the share of the county population that is white, the fractionalization variable is statistically insignifi cant. The result for the white share of population variable suggests that going from 100% white to 100% nonwhite would be associated with a 24 basis point increase in bond yields. Although disentangling an ethnic fractionalization effect from a “share white” effect is diffi cult at the county level, analysis of richer data at the sub-county level suggests that both effects are at work.
Finding a relationship between ethnoreligious fractionalization and municipal bond yields, we investigate potential causes of this relation-ship. By defi nition, one can divide the mechanisms at work into those that refl ect risk and those that are not related to the risk of the municipal bonds. One hypothesis is that more fractionalized localities pay more to borrow because their bonds are riskier; in that sense, higher yields refl ect effi cient operation of municipal capital markets. Alternatively, higher yields could refl ect less effi cient monitoring of the bond underwriting process, meaning that more fractionalized places pay more to borrow but that those higher costs do not refl ect higher risk. We use the shorthand of “risk” versus “monitoring” in describing these two competing hypotheses.

4 MUNICIPAL FINANCE JOURNAL
4 The Herfi ndahl index is the sum of the squares of the different groups’ shares. So, for example, a population that was 80% Hispanic and 20% Asian would have a Herfi ndahl index of (0.8 x 0.8 + 0.2 x 0.2), or 0.68. There would be a 68% chance that two randomly selected individuals were from the same group, and also a 32% chance that they were from different groups. This Herfi ndahl-based measure is not the only measure of diversity that one could choose: Alesina et al. (2003) explore “polarization” measures of diversity. These measures, however, involve explicitly or implicitly specifying a distance between different groups. Although this is natural for measures of diversity in income or wealth, we do not know of any unambiguous one-dimensional measure of religious or ethnic identity and thus use only the fractionalization measure that is more common in the literature.
Our analyses suggest that at least part of the fractionalization effect refl ects monitoring rather than risk. When we use credit ratings as a proxy to control for risk, we fi nd that more fractionalized places pay more to borrow, even controlling for the risk of their bonds. We also fi nd some evi-dence that the prices of bonds issued by fractionalized localities increase in the fi rst 120 days post-issuance, suggesting that the yields at issuance are higher (and prices at issuance are lower) than the eventual market equilibrium. We also fi nd that the fractionalization effect is driven by the smaller issues rather than the larger ones. If the fractionalization effect refl ected risk, there is no reason to expect that the effect would be different across issue size. In our view, the fact that the fractionalization effect is strongest for the smallest issues—bonds that are often issued with minimal oversight and attention—is more consistent with the hypothesis that our observed yield differences refl ect differential failures in monitoring than that they refl ect differences in risk. Taken as a whole, our results suggest that religious and ethnic composition have an impact on municipal bor-rowing costs in the United States, and that at least some of this effect is unrelated to the risks of the bonds that localities issue.
The remainder of this paper is organized as follows: The fi rst section presents a brief review of the relevant literature on the economic effects of ethnoreligious fractionalization. The second section describes the empiri-cal tests applied in this paper. The third section describes, in detail, the dataset and econometric methodology that we employ. The fourth section presents and interprets the results of our econometric analysis. A brief fi nal section concludes.
THE EXISTING LITERATURE The index of fractionalization we use in this paper is the ethnolinguistic
fractionalization (ELF) measure developed by Soviet anthropologists in the 1960s and defi ned as one minus the Herfi ndahl index of ethnolinguistic shares. 4 This measure represents the likelihood that two randomly cho-sen individuals in a given population belong to different subgroups. In an empirical paper, Easterly and Levine (1997) show that the high ELFs in
DEMOGRAPHIC FRACTIONALIZATION AND THE MUNICIPAL BOND MARKET 5
Sub-Saharan Africa explain characteristics associated with low economic growth, including political instability, underdeveloped fi nancial systems, high government defi cits, and distorted currencies. The authors conclude that ethnolinguistic fractionalization, caused in particular by the ad hoc nature of the national boundaries drawn by colonial powers, explains much of Africa’s post-colonial failure to generate sustained economic growth.
Collier and Gunning (1999) also demonstrate the explanatory power of ELF with respect to economic growth in African nations. Collier (2000) further fi nds that the impact of diversity on economic growth in a sample of countries between 1960 and 1990 was a function of the political context—diverse dictatorships saw slow growth, while diverse democracies did not. La Porta et al. (1999) look at the determinants of the quality of government across countries. Among their fi ndings are that nations that are ethnolinguistically heterogeneous have inferior gov-ernment performance. The dimensions of government performance that they investigate include measures of corruption, bureaucratic delays, tax compliance, and property rights. Alesina et al. (2003) extend this work to include measures of linguistic and religious fractionalization. Their mea-sure of religious diversity is the same as ours, and they point out that, at least in the international context, religious identity is often more reliably measured than linguistic or ethic membership, making the religious frac-tionalization measure particularly useful for empirical research.
Several studies have focused on the economic and fi scal impacts of eth-nolinguistic and racial fractionalization at the city, county, and state levels in the United States. Glaeser, Scheinkman, and Shleifer (1995) investi-gate the socioeconomic determinants of economic growth of U.S. cities between 1960 and 1990. City growth is one reasonable measure of the suc-cess of different areas; if people are free to move across cities, then achiev-ing city growth represents at least relative success. The authors fi nd that the non-white share exerts a minimal impact on subsequent city growth. Among cities with large non-white shares, they fi nd that increased segre-gation is positively related to subsequent growth. One interpretation that they offer is consistent with costs of fractionalization: they suggest that segregation in heavily non-white cities lessens ethnic confl ict. Alesina, Baqir, and Easterly (1999) develop a model connecting heterogeneity of preferences across ethnic groups in a political unit to the amount and type of public goods that the political unit supplies, and they test the model on U.S. cities, urban counties, and states. They fi nd that the provision of pro-ductive public goods (roads, hospitals, schools, etc.) in cities and counties is inversely related to ethnic fragmentation, and they suggest two reasons, which they refl ect in the model: (1) different ethnic groups can have dif-ferent preferences over which public goods should be produced, and (2) different ethnic groups can have their marginal utility of the public

6 MUNICIPAL FINANCE JOURNAL
good reduced by other groups’ consumption. They fi nd some empirical evidence that the fi scal balance before intergovernmental transfers tends to be worse in more ethnically fragmented cities.
A study by Vigdor (2004) looks at response rates to the 2000 Census questionnaire. Responding to the Census refl ects individual provision of a local public good. Because federal grants to local areas are determined by Census counts, an uncounted individual costs his locality as much as $500 per year. Vigdor shows that Census response rates are lower among counties that are more racially, generationally, and socioeconomically het-erogeneous—the provision of this important local public good appears to be lower in more fractionalized localities.
Theoretical work by Alesina and Drazen (1991) explores the relation-ship between fractionalization and the economic outcomes. Both papers present models where sociopolitical fragmentation may lead to confl icts over the allocation of the tax burden and to the consequent delay of defi cit reduction policies. In these models, delayed stabilization is the result of a war of attrition game, where different groups try to force the other to bear the cost of the stabilization. In the context of our research on municipal debt, this effect would make debt issued by fractionalized localities more risky than debt issued by more homogeneous localities because the more fractionalized localities would tend to delay (and possibly fail to enact) budget stabilization packages in the face of persistent defi cits.
McCleary and Barro (2003, 2006a, 2006b) have recently brought ana-lytical rigor to inquiry exploring the relationship between religion and economic outcomes. They present cross-country examination of the two-way interaction between economic growth and religion. With religion as the dependent variable, McCleary and Barro (2006b) fi nd that per capita GDP has a signifi cant negative relationship with all religiosity indicators (e.g., monthly church attendance, belief in hell, etc.). With religion as an independent variable, they fi nd that belief in hell has a strongly positive effect on economic growth, whereas monthly religious service attendance has a strongly negative effect. Hilary and Hui (2009) use one of the same data sources as we use here to investigate the effect of individual religios-ity on the risk-taking behavior of fi rms. Using the rate of religious adher-ence at the county level from the Association of Religion Data Archives (the same ARDA data used in this paper), they fi nd that corporations located in highly religious counties take on less risk, measured by vari-ance in returns on equity and assets, and have higher returns on assets and lower rates of investment.
HYPOTHESES AND EMPIRICAL ANALYSIS We investigate the relationship between religious and ethnic diversity
and municipal bond yields. Municipal bond yields refl ect the costs that
DEMOGRAPHIC FRACTIONALIZATION AND THE MUNICIPAL BOND MARKET 7
5 A common assumption in capital markets is that rational arbitrageurs enforce price effi ciency. In the municipal context, an issuer who issued bonds cheap (at high yield) rela-tive to the eventual market equilibrium would cost taxpayers money. In private capital markets, the assumption is that such ineffi cient behavior will rapidly be competed away. In municipal capital markets, the same forces may be at play, but with municipal authorities enjoying (at least in the short run) something like a monopoly, this equilibrating process may take a very long time.
6 See note 4 regarding use of the Herfi ndahl index.
localities face when they borrow. In effi cient credit markets, yields refl ect a time premium, a risk premium, and a premium for the credit quality of the underlying issuer. Our empirical analysis controls for the time pre-mium using fi xed effects for the maturity of the instrument; because the risk-free yield curve fl uctuates over time, we allow these fi xed effects to be time-varying. With the time effect controlled for, and with an addi-tional control for the liquidity of the bond, in an effi cient capital market the resulting coeffi cients will refl ect the combined premium for risk and default charged to the municipal borrowers. Any part of this spread that is uncorrelated with the risk of the instrument will refl ect some ineffi ciency in the underlying issuance process. 5
Our main null hypothesis is that neither religious nor ethnic diversity (fractionalization), as measured by the Herfi ndahl index, has an impact on this premium charged; the alternative hypotheses are that either religious or ethnic diversity could affect the premium. The Herfi ndahl index is just one minus the ELF fractionalization measure, so our results can be thought of interchangeably in terms of concentration or diversity/fractionalization. 6
Establishing a relationship between ethnoreligious fractionalization and bond spreads, we continue by investigating the extent to which the relation-ship refl ects risk. Because our spread measures are based on regressions that have controlled for the yield curve and bond liquidity, we view the part that is orthogonal to risk (however measured) as being consistent with some ineffi ciency in the bond issuance process. As a shorthand, we refer to this as “monitoring,” but this monitoring is a residual that may refl ect many underlying sources. It may refl ect ineffi cient monitoring of the local offi cials—often treasurers—charged with issuing municipal debt. Whal-ley (2011) shows empirically that the background of local treasurers has a signifi cant impact on municipal borrowing costs—in particular, localities in California with appointed treasurers (who are often fi nance profession-als) have lower borrowing costs than localities that elect their treasurers. Any model in which local treasurers trade off effort versus job effective-ness, and where the local offi cials internalize only benefi ts that accrue to constituents of their own type, will deliver a relationship between frac-tionalization and municipal effectiveness—in this case, the spreads that municipalities pay on their bonds.

8 MUNICIPAL FINANCE JOURNAL
7 Splitting the Protestant denominations into Evangelical Protestant groups and Main-line Protestant groups follows general practice in working with the ARDA data. There are very important differences between these groups. For example, the belief in the literal inerrancy of the Bible is much more common among Evangelical Protestants than among Mainline Protestant Christians.
DATA AND ECONOMETRIC METHODOLOGY Data on religious observance and fractionalization come from the 2000
Religious Congregations and Membership Study, a survey conducted by the Association of Statisticians of American Religious bodies (ASARB). These data have also been used in Hilary and Hui (2009) and are available through the Association of Religion Data Archives (ARDA). The survey covered 149 Christian denominations, as well as Jewish and Islamic total adherents, by county. The survey also counted temples for six Eastern reli-gions, but not members. A number of churches, disproportionately his-torically African-American religious bodies, declined to participate in the survey in 2000; estimates of county-level membership counts described in Finke and Sheitle (2005) are used for these congregations.
The fractionalization measure (1—the Herfi ndahl index) is based on a division of religious bodies into eight groups. These groups are Mainline Protestant, Evangelical Protestant, Catholic, Eastern Orthodox, Other par-ticipating Christian groups (predominantly LDS [Mormon] congregations), and Jewish and Muslim congregations. The “Other non-participating” category captures the Finke and Sheitle (2005) county-level estimate of the count of adherents of denominations that did not participate. Table 1 describes the different denomination measures. The table presents results both on a bond-weighted and a county-weighted basis. Based on the sur-vey, religious membership amounts to 63% of the mean county population, with a standard deviation of 21%. The Mainline Protestant denominations have now been eclipsed in membership by the Evangelical Protestant denominations and Catholic churches. 7
Our goal with this eight-category religion division is to capture the strength or weakness of social ties within a locality.
Table 2 describes the adherent and dispersion measures for a hand-ful of counties. The counties presented are the largest counties, the most concentrated and fractionalized counties, and the most concentrated and fractionalized large counties. The most religiously homogeneous large county is Salt Lake County, Utah, where more than half of the popula-tion is in the “Other participating Christian” category, largely LDS con-gregations. El Paso, Texas; Bristol, Massachusetts; and Hidalgo, Texas, are also highly homogeneous in terms of religion and are predominantly Catholic. Highly religiously fractionalized counties include Montgomery

DEMOGRAPHIC FRACTIONALIZATION AND THE MUNICIPAL BOND MARKET 9
Table 1: Descriptive Statistics for County Religion Data
Count Mean 25th %ile.
50th %ile.
75th %ile. SD
Total members/1000 population
Bond 1207399 621.2 502.1 619.9 723.3 165
County 2023 628.3 477.3 621.8 772.5 207.2
Mainline ProtestantBond 1207399 112.5 60.8 88.9 136.6 83.8
County 2023 145.1 67.6 109.2 187.9 118.4
Evangelical Protestant
Bond 1207399 151.9 61.8 108.3 204.8 128.8
County 2023 228.6 95.6 175.7 346.2 168.7
CatholicBond 1207399 221.6 102.5 201.1 317.5 147.9
County 2023 138.7 22.6 92.5 205.6 146.6
OrthodoxBond 1207399 2.5 0.0 0.9 3.3 3.8
County 2023 0.7 0.0 0.0 0.0 2.7
Other participating Christiana
Bond 1207399 33.5 7.4 18.2 40.7 58.9
County 2023 20.5 0.1 5.9 14.8 75.2
Jewish Bond 1207399 16.4 0.0 2.9 18.2 32.5
County 2023 2.8 0.0 0.0 0.0 13.2
MuslimBond 1207399 4.3 0.0 1.4 6.2 6.3
County 2023 0.8 0.0 0.0 0.0 3.0
Other non-participating Christianb
Bond 1207399 99.2 59.2 78.2 116.4 64.5
County 2023 94.7 51.5 71.3 100.7 77.5
Religion Herfi ndahl (x 10000)c
Bond 1207399 3304 2650 3133 3685 912
County 2023 3880 3028 3584 4482 1161
Note: Table shows descriptive statistics based on 2000 Religious Congregations and Membership Study by the Association of Statisticians of American Religious Bodies (ASARB). Survey covered 149 religious bodies. Data were accessed from the Association of Religion Data Archives (ARDA) and are described at http://www.thearda.com/Archive/Files/Descriptions/RCMSCY.asp.a Other participating congregations are predominantly LDS (Mormon) congregations.b Other non-participating congregations include religious congregations that did not choose to participate in the 2000 survey. Count based on adjustments described in Finke and Sheitle, 2005 (“Accounting for the Uncounted: Computing Correctives for the 2000 RCMS Data”) to correct for non-participation of religious bodies that did not participate in the 2000 Survey. The bulk of the non-participating bodies (estimated at 25.10 million out of the 29.05 million non-participants are historically African-American congregations. The remainder include the Baptist Bible Fellowship (1.2 million estimated members), the Jehovah’s Witnesses (1.04 million estimated members), and other smaller groups.c Herfi ndahl = 1 – ELF. We use the Herfi ndahl and ELF measures interchangeably; a higher Herfi ndahl = less fractionalization.

10 MUNICIPAL FINANCE JOURNALTa
ble
2: R
elig
ious
Fra
ctio
naliz
atio
n fo
r Par
ticul
ar C
ount
ies
Cong
rega
nts/
1000
Pop
ulat
ion
Popu
la-
tion
Tota
lM
ainl
ine
Prot
es-
tant
Evan
g.
Prot
es-
tant
Cath
olic
Orth
odox
Othe
r (P
artic
i-pa
ting)
Jew
ish
Mus
lim
Othe
r (N
ot
Part
ici-
patin
g)
Herf
. In
dex
(x 1
0000
)
Larg
e cou
nties
Los A
ngele
s, CA
9519
338
771.
535
.661
.839
9.9
3.3
80.3
59.3
9.8
121.
531
90
Cook
, IL
5376
741
852.
253
.450
.239
9.3
9.4
64.0
43.6
17.8
214.
529
91
Harri
s, TX
3400
578
672.
681
.920
4.8
181.
92.
432
.810
.614
.014
4.2
2298
Mar
icopa
, AZ
3072
149
475.
748
.399
.917
2.6
2.3
74.4
19.5
3.3
55.4
2259
Oran
ge, C
A28
4628
954
1.1
38.7
79.6
273.
92.
553
.121
.113
.958
.340
26
Conc
entra
ted co
untie
s
Rich
, UT
1961
932.
90.
00.
00.
00.
084
9.1
0.0
0.0
83.8
8365
Arth
ur, N
E44
479
5.0
723.
00.
00.
00.
00.
00.
00.
072
.083
52
Bann
er, N
E81
913
9.8
127.
00.
00.
00.
00.
00.
00.
012
.883
35
Van
Bure
n, T
N55
0837
6.1
0.0
341.
50.
70.
00.
00.
00.
033
.983
23
Conc
entra
ted co
untie
s > 5
0000
0 po
pulat
ion
Salt
Lake
, UT
8983
8776
0.1
20.6
20.6
59.6
4.1
570.
24.
73.
976
.458
07
Brist
ol, M
A53
4678
696.
040
.425
.850
2.0
2.6
29.1
21.7
3.5
70.9
5381
El P
aso,
TX
6796
2272
8.9
25.6
75.3
514.
81.
317
.37.
40.
986
.352
54

DEMOGRAPHIC FRACTIONALIZATION AND THE MUNICIPAL BOND MARKET 11
Hida
lgo,
TX
5694
6356
3.1
28.2
73.4
390.
10.
211
.90.
91.
157
.351
05
Frac
tiona
lized
coun
ties
Mon
tgom
ery,
MD
8733
4177
4.6
100.
878
.821
2.0
6.1
128.
996
.021
.113
0.9
1746
Alex
andr
ia, V
A12
8283
730.
312
7.3
85.4
188.
316
.378
.542
.129
.516
2.9
1773
June
au, A
K30
711
345.
171
.781
.971
.631
.743
.59.
30.
035
.417
81
Was
hten
aw, M
I32
2895
442.
192
.364
.912
9.3
2.7
44.9
21.7
15.1
71.2
1905
Frac
tiona
lized
coun
ties >
500
000
popu
latio
n
Mon
tgom
ery,
MD
8733
4177
4.6
100.
878
.821
2.0
6.1
128.
996
.021
.113
0.9
1746
Pine
llas,
FL92
1482
445.
586
.399
.112
1.6
10.5
34.5
26.3
4.6
62.6
1914
Brow
ard,
FL
1623
018
730.
727
.077
.921
0.6
3.9
139.
113
1.2
4.1
136.
919
94
Palm
Bea
ch, F
L11
3118
483
3.8
47.1
91.5
265.
61.
715
3.3
147.
60.
712
6.3
2048
Note:
Tabl
e sho
ws d
escr
iptiv
e stat
istics
bas
ed o
n 20
00 R
eligi
ous C
ongr
egati
ons a
nd M
embe
rshi
p St
udy.
See n
otes
to Ta
ble 1
for d
escr
iptio
n of
the A
RDA
Relig
ious
Con
greg
ation
s and
Mem
bers
hip
Surv
ey o
n wh
ich th
is tab
le is
base
d.

12 MUNICIPAL FINANCE JOURNAL
County, Maryland, which has a relatively even split across Mainline Protestant, Evangelical Protestant, Catholic, LDS, Jewish, and other non-participating denominations.
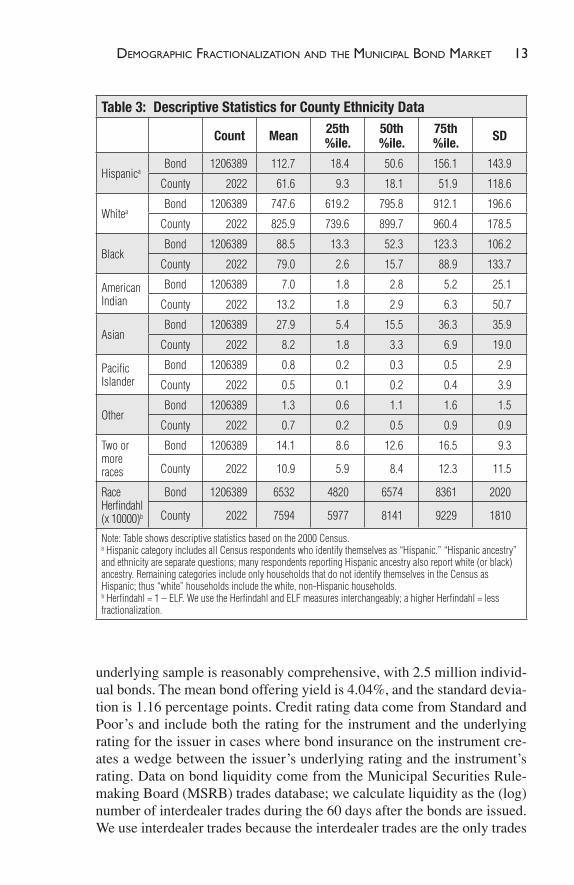
Data on ethnicity come from the 2000 Census. Ethnicity and Hispanic identity are overlapping: households can report being Hispanic alongside any ethnicity. For the purposes of our analysis, we create a non-overlapping “Hispanic” category including all households that report Hispanic identity. Other categories, including black, white, American Indian, Asian, and Pacifi c Islander, are based on households that do not also report being Hispanic.
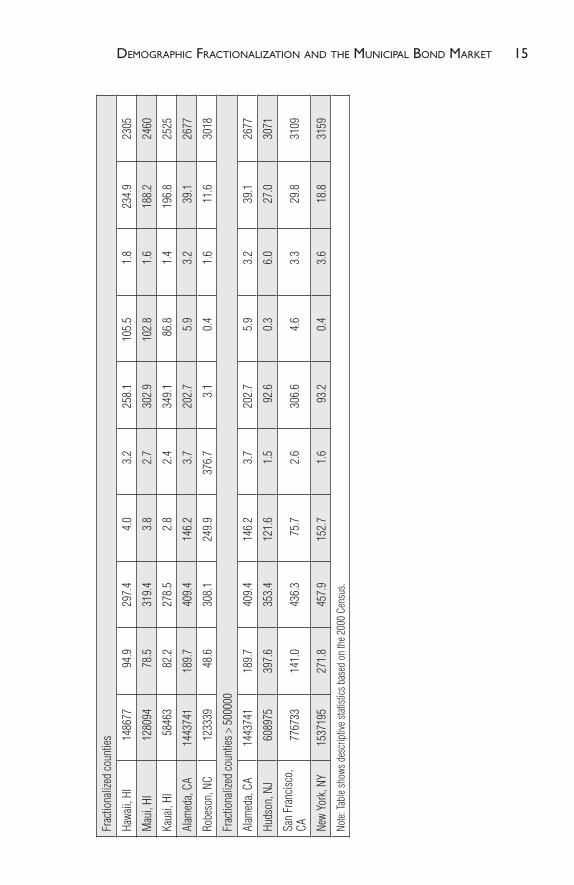
Table 3 presents descriptive statistics for county ethnicity data, again weighted by bond and weighted by county. The difference between the bond-weighted and county-weighted results refl ects the large number of sparsely populated, heavily white counties and the large share of the population that lives in some very large counties with large Hispanic pop-ulations. Table 4 presents ethnicity data and ethnic fractionalization for a handful of counties. The most ethnically fractionalized large counties include Alameda, California; Hudson, New Jersey; and San Francisco, California, which have Herfi ndahl indices below 3,159. This measure refl ects the fact that the odds that any two randomly selected citizens would be of the same ethnicity are less than one-third. There are a num-ber of highly concentrated small counties, in particular very white rural counties in Montana, North Dakota, South Dakota, and West Virginia. The ethnically homogeneous large counties include the heavily white Macomb, Michigan, and Bucks, Pennsylvania. Hidalgo County in Texas is relatively unusual in being a large and highly concentrated county with a predominantly Hispanic population.
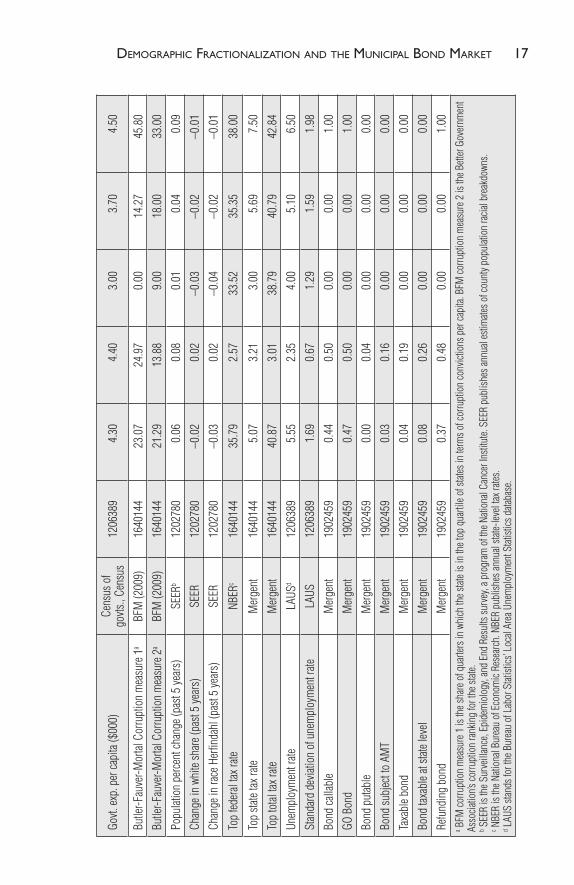
We also use additional demographic data from the Census (see Table 5). We control for wealth and income using the median house value and median income in the county. Weighted by bond, the mean of the median county household income measures is $44,000; the mean of the median county home value measures is $123,000. Data on government debt and spend-ing come from the Census of Governments, 1992–2007. The Census of Governments is conducted every fi ve years by the U.S. Census and covers municipal revenues, expenditures, debt, assets, and numbers of employ-ees. These data include annual data on spending and receipts, at the county level, for all subunits within each county. We include total expenditure and total municipal indebtedness taken from the Census of Governments as controls in many of our empirical specifi cations. The average debt per capita is $3,873; the average expenditure per capita is $4,273.
Data on the municipal bond characteristics, issue date, and yield come from Mergent. Our sample includes all municipal bonds listed in Mer-gent that were issued between 1995 and 2010. Mergent also provides data capturing whether the municipal bonds are insured or uninsured. The
DEMOGRAPHIC FRACTIONALIZATION AND THE MUNICIPAL BOND MARKET 13
Table 3: Descriptive Statistics for County Ethnicity Data
Count Mean 25th %ile.
50th %ile.
75th %ile. SD
HispanicaBond 1206389 112.7 18.4 50.6 156.1 143.9
County 2022 61.6 9.3 18.1 51.9 118.6
WhiteaBond 1206389 747.6 619.2 795.8 912.1 196.6
County 2022 825.9 739.6 899.7 960.4 178.5
BlackBond 1206389 88.5 13.3 52.3 123.3 106.2
County 2022 79.0 2.6 15.7 88.9 133.7
American Indian
Bond 1206389 7.0 1.8 2.8 5.2 25.1
County 2022 13.2 1.8 2.9 6.3 50.7
AsianBond 1206389 27.9 5.4 15.5 36.3 35.9
County 2022 8.2 1.8 3.3 6.9 19.0
Pacifi c Islander
Bond 1206389 0.8 0.2 0.3 0.5 2.9
County 2022 0.5 0.1 0.2 0.4 3.9
OtherBond 1206389 1.3 0.6 1.1 1.6 1.5
County 2022 0.7 0.2 0.5 0.9 0.9
Two or more races
Bond 1206389 14.1 8.6 12.6 16.5 9.3
County 2022 10.9 5.9 8.4 12.3 11.5
Race Herfi ndahl (x 10000)b
Bond 1206389 6532 4820 6574 8361 2020
County 2022 7594 5977 8141 9229 1810
Note: Table shows descriptive statistics based on the 2000 Census.a Hispanic category includes all Census respondents who identify themselves as “Hispanic.” “Hispanic ancestry” and ethnicity are separate questions; many respondents reporting Hispanic ancestry also report white (or black) ancestry. Remaining categories include only households that do not identify themselves in the Census as Hispanic; thus “white” households include the white, non-Hispanic households.b Herfi ndahl = 1 – ELF. We use the Herfi ndahl and ELF measures interchangeably; a higher Herfi ndahl = less fractionalization.
underlying sample is reasonably comprehensive, with 2.5 million individ-ual bonds. The mean bond offering yield is 4.04%, and the standard devia-tion is 1.16 percentage points. Credit rating data come from Standard and Poor’s and include both the rating for the instrument and the underlying rating for the issuer in cases where bond insurance on the instrument cre-ates a wedge between the issuer’s underlying rating and the instrument’s rating. Data on bond liquidity come from the Municipal Securities Rule-making Board (MSRB) trades database; we calculate liquidity as the (log) number of interdealer trades during the 60 days after the bonds are issued. We use interdealer trades because the interdealer trades are the only trades

14 MUNICIPAL FINANCE JOURNALTa
ble
4: E
thni
city
Mix
for L
arge
Cou
ntie
s
Popu
latio
nHi
span
icW
hite
Blac
kAm
eric
an
Indi
anAs
ian
Paci
fi c
Isla
nder
Othe
rTw
o or
M
ore
Race
s
Herf
. In
dex
(x 1
0000
)
Larg
e cou
nties
Los A
ngele
s, CA
9519
338
445.
631
0.9
94.7
2.7
118.
12.
42.
123
.431
87
Cook
, IL
5376
741
199.
347
5.9
258.
61.
348
.00.
31.
415
.333
56
Harri
s, TX
3400
578
329.
342
1.2
182.
22.
150
.90.
41.
312
.632
18
Mar
icopa
, AZ
3072
149
248.
566
2.2
35.3
14.9
21.0
1.2
1.3
15.5
5025
Conc
entra
ted co
untie
s
Hand
, SD
3741
2.9
991.
40.
31.
30.
80.
00.
03.
298
30
Grig
gs, N
D27
544.
099
0.9
0.0
2.2
1.5
0.0
0.0
1.5
9820
Libe
rty, M
T21
581.
999
0.7
0.0
0.9
3.2
0.0
0.5
2.8
9816
Burk
e, ND
2242
3.6
990.
21.
32.
21.
30.
00.
01.
398
05
Conc
entra
ted co
untie
s > 5
0000
0
Mac
omb,
MI
7881
4915
.891
5.9
26.8
2.9
21.2
0.2
0.9
16.3
8406
Buck
s, PA
5976
3523
.491
1.5
31.7
1.0
22.7
0.1
0.8
8.4
8329
Ocea
n, N
J51
0916
50.0
898.
728
.21.
012
.60.
10.
88.
481
13
Brist
ol, M
A53
4678
36.0
893.
918
.31.
912
.50.
217
.020
.280
15
Hida
lgo,
TX
5694
6388
3.5
104.
33.
40.
85.
60.
00.
32.
079
14
DEMOGRAPHIC FRACTIONALIZATION AND THE MUNICIPAL BOND MARKET 15
Frac
tiona
lized
coun
ties
Hawa
ii, H
I14
8677
94.9
297.
44.
03.
225
8.1
105.
51.
823
4.9
2305
Mau
i, HI
1280
9478
.531
9.4
3.8
2.7
302.
910
2.8
1.6
188.
224
60
Kaua
i, HI
5846
382
.227
8.5
2.8
2.4
349.
186
.81.
419
6.8
2525
Alam
eda,
CA14
4374
118
9.7
409.
414
6.2
3.7
202.
75.
93.
239
.126
77
Robe
son,
NC
1233
3948
.630
8.1
249.
937
6.7
3.1
0.4
1.6
11.6
3018
Frac
tiona
lized
coun
ties >
500
000
Alam
eda,
CA14
4374
118
9.7
409.
414
6.2
3.7
202.
75.
93.
239
.126
77
Huds
on, N
J60
8975
397.
635
3.4
121.
61.
592
.60.
36.
027
.030
71
San
Fran
cisco
, CA
7767
3314
1.0
436.
375
.72.
630
6.6
4.6
3.3
29.8
3109
New
York
, NY
1537
195
271.
845
7.9
152.
71.
693
.20.
43.
618
.831
59
Note:
Tabl
e sho
ws d
escr
iptiv
e stat
istics
bas
ed o
n th
e 200
0 Ce
nsus
.

16 MUNICIPAL FINANCE JOURNALTa
ble
5: S
umm
ary
Stat
istic
s, A
ll Va
riabl
es (W
eigh
ted
by b
ond)
Perc
entil
e
Varia
ble
Sour
ceCo
unt
Mea
nSt
anda
rd
Devi
atio
n25
th50
th75
th
Bond
offe
ring
yield
Mer
gent
1902
459
4.04
1.16
3.50
4.15
4.79
Bond
insu
ranc
e dum
my
Mer
gent
1902
459
0.51
0.50
0.00
1.00
1.00
Com
petit
ive b
iddi
ngM
erge
nt19
0245
90.
220.
420.
000.
000.
00
Nego
tiated
offe
rM
erge
nt19
0245
90.
270.
440.
000.
001.
00
Bond
size
($00
0)M
erge
nt18
7197
624
03.3
725
907.
0016
5.00
425.
0012
65.0
0
Issue
size
($00
0)M
erge
nt19
0245
943
385.
0019
0270
.00
3435
.00
8915
.00
2693
0.00
Coun
t of i
nter
deale
r tra
des i
n fi r
st 60
day
sM
SRB
1902
459
2.97
11.9
20.
001.
002.
00
LTCR
S&P
9880
633.
622.
331.
003.
005.
00
SPUR
S&P
8015
644.
252.
233.
004.
006.
00
Relig
ion
Herfi
ndah
lAR
DA12
0739
933
0491
226
5031
3336
85
Relig
ion:
Mem
ber h
ouse
hold
s/10
00AR
DA12
0739
964
218
051
563
475
3
Ethn
icity
Herfi
ndah
lCe
nsus
1206
389
6532
2020
4820
6574
8361
Ethn
icity:
Whi
te ho
useh
olds
/100
0Ce
nsus
1206
389
748
197
619
796
912
Med
. hou
se va
l. ($
000)
Cens
us12
0638
912
265
8210
214
7
Med
ian in
com
e ($0
00)
Cens
us12
0638
944
1137
4349
Log
total
pop
ulati
onCe
nsus
1206
389
12.3
11.
6511
.07
12.3
813
.53
LTD
per c
apita
($00
0)Ce
nsus
of
govts
., Ce
nsus
1206
389
3.90
5.30
1.90
2.90
4.50
DEMOGRAPHIC FRACTIONALIZATION AND THE MUNICIPAL BOND MARKET 17
Govt.
exp.
per
capi
ta ($
000)
Cens
us o
f go
vts.,
Cens
us12
0638
94.
304.
403.
003.
704.
50
Butle
r-Fau
ver-M
ortal
Cor
rupt
ion
mea
sure
1a
BFM
(200
9)16
4014
423
.07
24.9
70.
0014
.27
45.8
0
Butle
r-Fau
ver-M
ortal
Cor
rupt
ion
mea
sure
2a
BFM
(200
9)16
4014
421
.29
13.8
89.
0018
.00
33.0
0
Popu
latio
n pe
rcen
t cha
nge (
past
5 ye
ars)
SEER
b12
0278
00.
060.
080.
010.
040.
09
Chan
ge in
whi
te sh
are (
past
5 ye
ars)
SEER
12
0278
0–0
.02
0.02
–0.0
3–0
.02
–0.0
1
Chan
ge in
race
Her
fi nda
hl (p
ast 5
year
s)SE
ER
1202
780
–0.0
30.
02–0
.04
–0.0
2–0
.01
Top
feder
al tax
rate
NBER
c16
4014
435
.79
2.57
33.5
235
.35
38.0
0
Top
state
tax ra
teM
erge
nt16
4014
45.
073.
213.
005.
697.
50
Top
total
tax r
ateM
erge
nt16
4014
440
.87
3.01
38.7
940
.79
42.8
4
Unem
ploy
men
t rate
LA
USd
1206
389
5.55
2.35
4.00
5.10
6.50
Stan
dard
dev
iatio
n of
une
mpl
oym
ent r
ateLA
US12
0638
91.
690.
671.
291.
591.
98
Bond
calla
ble
Mer
gent
1902
459
0.44
0.50
0.00
0.00
1.00
GO B
ond
Mer
gent
1902
459
0.47
0.50
0.00
0.00
1.00
Bond
put
able
Mer
gent
1902
459
0.00
0.04
0.00
0.00
0.00
Bond
subj
ect t
o AM
TM
erge
nt19
0245
90.
030.
160.
000.
000.
00
Taxa
ble b
ond
Mer
gent
1902
459
0.04
0.19
0.00
0.00
0.00
Bond
taxa
ble a
t stat
e lev
elM
erge
nt19
0245
90.
080.
260.
000.
000.
00
Refu
ndin
g bo
ndM
erge
nt19
0245
90.
370.
480.
000.
001.
00a B
FM co
rrupt
ion
mea
sure
1 is
the s
hare
of q
uarte
rs in
whi
ch th
e stat
e is i
n th
e top
qua
rtile
of st
ates i
n ter
ms o
f cor
rupt
ion
conv
ictio
ns p
er ca
pita.
BFM
corru
ptio
n m
easu
re 2
is th
e Bett
er G
over
nmen
t As
socia
tion’s
corru
ptio
n ra
nkin
g fo
r the
state
.b S
EER
is th
e Sur
veill
ance
, Epi
dem
iolo
gy, a
nd E
nd R
esul
ts su
rvey
, a p
rogr
am o
f the
Nati
onal
Canc
er In
stitu
te. S
EER
publ
ishes
annu
al es
timate
s of c
ount
y pop
ulati
on ra
cial b
reak
down
s.c N
BER
is th
e Nati
onal
Bure
au o
f Eco
nom
ic Re
sear
ch. N
BER
publ
ishes
annu
al sta
te-lev
el tax
rates
.d L
AUS
stand
s for
the B
urea
u of
Lab
or S
tatist
ics’ L
ocal
Area
Une
mpl
oym
ent S
tatist
ics d
ataba
se.

18 MUNICIPAL FINANCE JOURNAL
8 As noted in footnote 4, the ethnolinguistic fractionalization (ELF) measure is just 1 – the Herfi ndahl index, so we use the Herfi ndahl measure in our analysis and interpret the coeffi cient estimates as refl ecting the impact of a declining degree of fractionalization.
available in the 1995–1997 subperiod, and we use the fi rst 60 days post-issuance in order to have a consistent window for all of the bonds issued in our sample. In our sample, the mean number of interdealer trades is 1, and the mean is 2.98. In calculating the log, we fi rst add 1 to the count of trades.
We also use data on state-level corruption from Butler, Fauver, and Mortal (2009). We use two corruption measures: the fi rst is the share of calendar quarters in which the state was in the top quartile of states in terms of corruption convictions per capita. The second measure is the Better Government Association’s corruption ranking for the state. We also use time-varying ethnic diversity measures taken from the Surveillance, Epidemiology, and End Results (SEER) survey, which has annual mea-sures back to 1990. Instrumental variables analysis uses 1980 Census data to create instruments for the 2000 fractionalization and white share mea-sures; 1980 is the earliest Census that allows for construction of ethnicity measures including Hispanic origin.
We also construct measures of county population growth from the SEER data, and tax rate measures come from the National Bureau of Economic Research (NBER). Finally, measures of county-level unemployment and unemployment volatility come from the Bureau of Labor Statistics, through their local area unemployment statistics (LAUS) program.
RESULTS OF THE ANALYSIS This section presents the empirical results of our analysis of both ethnic
and religious fractionalization, as measured by the respective Herfi ndahl indices, 8 and their effects on municipal credit markets. The fi rst subsec-tion looks at the relationship between municipal bond yields and mea-sures of fractionalization. The second subsection addresses the question of whether the higher bond yields in more fractionalized counties refl ect risk or monitoring.
Fractionalization and Municipal Bond Yields Our fi rst specifi cation (Table 6) fi ts the bond offering yield on measures
of ethnic and religious fractionalization using a minimal set of controls. These controls include log county size, log issue size, log bond size, and maturity-by-month dummy variables. The maturity-by-month dummy variables allow for a nonparametric time-varying yield curve effect and allow us to interpret the resulting coeffi cients in terms of spreads over a

DEMOGRAPHIC FRACTIONALIZATION AND THE MUNICIPAL BOND MARKET 19
benchmark yield curve. The main independent variable in column (1) is the religion Herfi ndahl index, which has a coeffi cient of –0.3025. This result is highly signifi cant in both statistical and economic terms: a two standard deviation increase in fractionalization would be associated with a six basis point increase in bond spreads. To put this increase into con-text, Figure 1 shows the relationship between credit ratings and spreads during our sample period: moving from an AAA-rated instrument to an AA–instrument, a move of four ratings notches, is associated with an eight basis point increase in yields.
Column (2) controls for total religious observance, using the members per capita variable. The variable is not statistically signifi cant in this speci-fi cation, although it becomes signifi cant with the broader set of controls used in Table 7. Column (3) uses the ethnicity Herfi ndahl index. The coef-fi cient of –0.2435 suggests that a two standard deviation increase in frac-tionalization is associated with a 10 basis point increase in bond yields. Column (4) uses the “share white” and fi nds an effect of similar economic and statistical magnitude.
Column (5) controls for the religious variables together, column (6) for the ethnicity variables together, and column (7) for all four variables in the same regression. The religious Herfi ndahl measure is consistently sig-nifi cant, as is the share of county population that is white. In regressions where ethnic fractionalization is measured at the county level, including
Figure 1: Coeffi cients from Regression of Bond Yield on Rating

20 MUNICIPAL FINANCE JOURNALTa
ble
6: R
egre
ssio
ns o
f Bon
d Of
ferin
g Yi
eld
on F
ract
iona
lizat
ion,
All
Mun
icip
al B
onds
, Min
imal
Con
trol
s
Inde
pend
ent
Varia
ble
Mea
n/S
DBo
nd O
fferin
g Yi
eld
(1)
(2)
(3)
(4)
(5)
(6)
(7)
(8)
(9)
(10)
Relig
ion
Herfi
ndah
l, co
unty
0.33
0/0
.091
–0.3
025*
**–0
.284
4***
–0.3
279*
**
(0.0
713)
(0.0
815)
(0.0
783)
Relig
ion
mem
bers
per
ca
pita,
coun
ty
0.62
1/0
.165
–0.0
687
–0.0
343
–0.0
723
(0.0
561)
(0.0
576)
(0.0
545)
Race
Her
fi nda
hl,
coun
ty0.
653
/0.2
02–0
.243
5***
–0.0
370
0.05
60
(0.0
395)
(0.0
609)
(0.0
626)
Race
shar
e whi
te,
coun
ty0.
748
/0.1
97–0
.266
7***
–0.2
390*
**–0
.337
7***
(0.0
376)
(0.0
575)
(0.0
615)
Race
Her
fi nda
hl,
city
0.69
1/0
.212
–0.1
656*
**
(0.0
442)
Race
shar
e whi
te,
city
0.74
5/0
.239
–0.1
929*
**
(0.0
343)
Race
Her
fi nda
hl,
1990
, cou
nty
0.72
3/0
.196
–0.2
467*
**
(0.0
382)
Race
Her
fi nda
hl,
chan
ge o
ver p
ast
5 ye
ars,
coun
ty
–0.0
27/0
.021
0.47
71*
(0.2
447)

DEMOGRAPHIC FRACTIONALIZATION AND THE MUNICIPAL BOND MARKET 21
Race
shar
e whi
te,
1990
, cou
nty
0.80
7/0
.175
–0.2
678*
**
(0.0
408)
Race
shar
e whi
te,
chan
ge p
ast 5
yrs
–0.0
24/0
.018
–0.5
072
(0.4
962)
Addi
tiona
l con
trol v
ariab
les: L
og co
unty
size,
log
issue
size
, log
bon
d siz
e, m
aturit
y-by
-mon
th d
umm
ies
Obse
rvati
ons
1189
975
1189
975
1189
995
1189
995
1189
975
1189
995
1189
975
7038
8311
8496
911
8496
9
R-sq
uare
d0.
8126
0.81
220.
8130
0.81
340.
8126
0.81
340.
8141
0.81
650.
8133
0.81
32
Robu
st sta
ndar
d er
rors
in p
aren
thes
es
Note:
Dep
ende
nt va
riabl
e is b
ond
offer
ing
yield
. Sam
ple i
nclu
des a
ll m
unici
pal d
ebt i
ssue
s tha
t can
be m
appe
d to
coun
ty da
ta. E
xclu
ded
woul
d be
state
and
supr
a-co
unty
bond
s. Ci
ties t
hat c
ross
co
unty
boun
darie
s are
assig
ned
to th
e cou
nty w
ith th
e lar
gest
num
ber o
f zip
code
s. St
anda
rd er
rors
are c
luste
red
by co
unty.
* Sig
nifi c
ant a
t 10%
; ** s
igni
fi can
t at 5
%; *
** si
gnifi
cant
at 1
%.

22 MUNICIPAL FINANCE JOURNAL
both ethnic fractionalization and the share white delivers a signifi cant coeffi cient on the share white variable and an insignifi cant coeffi cient on the fractionalization variable.
Column (8) uses city-level data. This approach leads to a smaller sample but also allows us to control for demographic characteristics at a fi ner level. In particular, although the ethnically homogeneous counties are almost exclusively white, there are ethnically homogeneous cities of each of several races. In the city-level specifi cation, both the fractionalization and share white measures are statistically signifi cant. Columns (9) and (10) use the SEER annual data to calculate measures of ethnic diversity from 1990, fi ve years before the start of the sample. The results suggest that the preexisting fractionalization and share white measures are corre-lated with bond yields. Although predetermination does not automatically imply causation, the fact that the 1990 ethnicity measures are correlated with bond yields does allow us to rule out potential competing stories where bond yields in the 1995–2010 sample are causing the differences in ethnic diversity measures.
Table 7 uses a richer set of control variables, including detailed control for the characteristics of the bond and also the county. While the magnitude of the results is attenuated somewhat with this richer set of controls, the broad picture of the results is not affected. In column (1), which includes the full set of controls but only the religion Herfi ndahl index among the measures of fractionalization, the coeffi cient of –0.1460 implies that a two standard deviation change in religious fractionalization is associated with a three basis point change in bond yields. The coeffi cient on the ethnic Herfi ndahl index in column (3) suggests that a two standard deviation change in fractionalization is associated with a fi ve basis point change in bond yields.
Table 8 shows the coeffi cients on the controls. These coeffi cients are interesting in their own right and also allow us to place the magnitude of the coeffi cients of our diversity measures into context. The coeffi cient of –0.5948 on median county house values suggests that a two standard devi-ation change in house values is associated with a 7.7 basis point change in bond yields. With controls for both county debt and expenditures, an interesting pattern emerges. The coeffi cient on county debt per capita is signifi cant at the 10% confi dence level and has a negative sign, suggesting that a two standard deviation change in debt outstanding is associated with a two basis point change in bond yields. A two standard deviation increase in county expenditures is associated with a nine basis point increase in bond yields. This pattern of results suggests that county borrowing costs are more highly correlated with expenditure levels than with the debt outstanding.

DEMOGRAPHIC FRACTIONALIZATION AND THE MUNICIPAL BOND MARKET 23
Tabl
e 7:
Reg
ress
ions
of B
ond
Offe
ring
Yiel
d on
Fra
ctio
naliz
atio
n, A
ll M
unic
ipal
Bon
ds, M
axim
al C
ontr
ols
Inde
pend
ent
Varia
ble
Mea
n/S
DBo
nd O
fferin
g Yi
eld
(1)
(2)
(3)
(4)
(5)
(6)
(7)
(8)
(9)
(10)
Relig
ion
Herfi
ndah
l, co
unty
0.33
0/0
.091
–0.1
460*
**–0
.120
9***
–0.0
693*
(0.0
379)
(0.0
384)
(0.0
386)
Relig
ion
mem
bers
per
ca
pita,
coun
ty
0.62
1/0
.165
–0.0
580*
*–0
.034
9–0
.085
3***
(0.0
250)
(0.0
257)
(0.0
282)
Race
Her
fi nda
hl,
coun
ty0.
653
/0.2
02–0
.136
1***
–0.0
867*
*–0
.055
8
(0.0
334)
(0.0
431)
(0.0
442)
Race
shar
e wh
ite, c
ount
y0.
748
/0.1
97–0
.132
3***
–0.0
634
–0.1
189*
*
(0.0
352)
(0.0
449)
(0.0
488)
Race
Her
fi nda
hl,
city
0.69
1/0
.212
–0.0
533*
(0.0
319)
Race
shar
e wh
ite, c
ity0.
745
/0.2
39–0
.074
7***
(0.0
286)
Race
Her
fi nda
hl,
1990
0.72
3/0
.196
–0.1
528*
**
(0.0
331)
Race
Her
fi nda
hl,
chan
ge–0
.027
/0.0
210.
2330
(0.2
401)
(Con
tinu
ed)

24 MUNICIPAL FINANCE JOURNALTa
ble
7 (C
ontin
ued)
Inde
pend
ent
Varia
ble
Mea
n/S
DBo
nd O
fferin
g Yi
eld
(1)
(2)
(3)
(4)
(5)
(6)
(7)
(8)
(9)
(10)
Race
shar
e wh
ite, 1
990,
co
unty
0.80
7/0
.175
–0.1
261*
**
(0.0
397)
Race
shar
e wh
ite, c
hang
e pa
st 5
yrs
–0.0
24/0
.018
–0.4
811*
(0.2
895)
Addi
tiona
l con
trol v
ariab
les: C
ount
y size
, iss
ue si
ze, b
ond
size,
bond
trad
e cou
nt in
fi rs
t 60
days
(all
in lo
gs),
coun
ty m
edian
hou
se p
rice,
coun
ty m
edian
inco
me,
coun
ty go
vern
men
t deb
t and
expe
nditu
re p
er ca
p, B
FM co
rrupt
ion
mea
sure
s 1 an
d 2,
com
petit
ive is
sue,
nego
tiated
issu
e, bo
nd in
sura
nce d
umm
y, GO
dum
my,
calla
ble d
umm
y, pu
table
dum
my,
AMT
tax d
umm
y, tax
able
dum
my,
state-
tax d
umm
y, sta
te to
p tax
rate,
state
shar
e of h
ouse
hold
s with
inco
me >
200
k, co
unty
popu
latio
n gr
owth
(5 ye
ar),
coun
ty un
em-
ploy
men
t rate
, cou
nty s
tanda
rd d
eviat
ion
of u
nem
ploy
men
t rate
s, re
fund
ing
bond
dum
my,
matu
rity-
by-m
onth
dum
mies
.
Obse
rvati
ons
1186
441
1186
441
1186
461
1186
461
1186
441
1186
461
1186
441
7021
6711
8496
911
8496
9
R-sq
uare
d
0.87
990.
8799
0.88
000.
8800
0.87
990.
8801
0.88
020.
8851
0.88
010.
8800
Robu
st sta
ndar
d er
rors
in p
aren
thes
es
Note:
Dep
ende
nt va
riabl
e is b
ond
offer
ing
yield
. Sam
ple i
nclu
des a
ll m
unici
pal d
ebt i
ssue
s tha
t can
be m
appe
d to
coun
ty da
ta. E
xclu
ded
woul
d be
state
and
supr
a-co
unty
bond
s. Ci
ties t
hat c
ross
co
unty
boun
darie
s are
assig
ned
to th
e cou
nty w
ith th
e lar
gest
num
ber o
f zip
code
s. St
anda
rd er
rors
are c
luste
red
by co
unty.
* Sig
nifi c
ant a
t 10%
; ** s
igni
fi can
t at 5
%; *
** si
gnifi
cant
at 1
%.

DEMOGRAPHIC FRACTIONALIZATION AND THE MUNICIPAL BOND MARKET 25
Tabl
e 8:
Reg
ress
ions
of B
ond
Offe
ring
Yiel
d on
Fra
ctio
naliz
atio
n, A
ll M
unic
ipal
Bon
ds
Ind.
Var
. M
ean
/SD
Coef
.In
d. V
ar.
Mea
n/S
DCo
ef.
Ind.
Var
. M
ean
/SD
Coef
.
Relig
ion
Herfi
ndah
l, co
unty
0.33
0/0
.091
–0.0
693*
Com
petit
ive
issue
0.22
4/0
.417
–0.1
215*
**Re
fund
ing
bond
0.37
0/0
.483
–0.0
085
(0.0
386)
(0.0
090)
(0.0
054)
Relig
ion
mem
bers
per
ca
pita,
coun
ty0.
621
/0.1
65–0
.085
3***
Nego
tiated
issu
e0.
265
/0.4
410.
0598
***
Cons
tant
1.00
0/0
.000
4.
6654
***
(0.0
282)
(0.0
090)
(0.1
420)
Race
Her
fi nda
hl,
coun
ty0.
653
/0.2
02–0
.055
8Bo
nd in
sura
nce
dum
my
0.57
6/0
.494
–0.1
851*
**Ob
serv
ation
s11
8644
1
(0.0
442)
(0.0
124)
R-sq
uare
d0.
8802
Race
shar
e whi
te,
coun
ty0.
748
/0.1
97–0
.118
9**
Calla
ble b
ond
dum
my
0.44
2/0
.497
0.07
05**
*
(0.0
488)
(0.0
108)
Log
coun
ty po
pulat
ion
12.3
06/1
.650
0.00
71GO
bon
d du
mm
y0.
472
/0.4
99–0
.121
3***
(0.0
054)
(0.0
101)
Log
issue
size
16.0
90/1
.724
–0.0
221*
**Pu
table
bond
du
mm
y0.
001
/0.0
38–0
.733
0***
(0.0
028)
(0.1
217)
Log
bond
size
13
.081
/1.6
07–0
.019
6***
AMT
taxab
le 0.
028
/0.1
640.
2560
***
(0.0
039)
(0.0
174)
Log
bond
trad
e cou
nt0.
740
/0.9
22–0
.004
2**
Taxa
ble
0.03
8/0
.192
1.41
28**
*
(0.0
020)
(0.0
170)
(Con
tinu
ed)

26 MUNICIPAL FINANCE JOURNALTa
ble
8 (C
ontin
ued)
Ind.
Var
. M
ean
/SD
Coef
.In
d. V
ar.
Mea
n/S
DCo
ef.
Ind.
Var
. M
ean
/SD
Coef
.
Med
ian co
unty
hous
e va
lue
0.12
2/0
.065
–0.5
948*
**St
ate ta
xabl
e0.
076
/0.2
640.
0119
(0.1
511)
(0.0
104)
Med
ian co
unty
inco
me
0.04
4/0
.011
0.16
08St
ate to
p tax
rate
40.8
68/3
.011
0.00
24
(0.8
247)
(0.0
029)
Coun
ty go
vt. d
ebt/
capi
ta0.
004
/0.0
06
–1.9
207*
State
shar
e of
high
-inco
me
hous
ehol
ds
0.02
3/0
.009
0.57
05
(1.1
102)
(0.9
383)
Coun
ty go
vt. ex
p./
capi
ta0.
004
/0.0
058.
8465
***
Coun
ty po
pula-
tion
chan
ge0.
062
/0.0
800.
2475
***
(1.8
132)
(0.0
693)
BFM
corru
ptio
n m
easu
re 1
23.0
73/2
4.96
5–0
.000
6***
Coun
ty un
em-
ploy
men
t rate
5.55
2/2
.354
0.01
86**
*
(0.0
001)
(0.0
019)
BFM
corru
ptio
n m
easu
re 2
21.2
88/1
3.87
90.
0010
***
Coun
ty un
em-
ploy
men
t S.D
.1.
692
/0.6
66–0
.027
1***
(0.0
004)
(0.0
065)
Note:
Dep
ende
nt va
riabl
e is b
ond
offer
ing
yield
. Sam
ple i
nclu
des a
ll m
unici
pal d
ebt i
ssue
s tha
t can
be m
appe
d to
coun
ty da
ta. E
xclu
ded
woul
d be
state
and
supr
a-co
unty
bond
s. Ci
ties t
hat c
ross
co
unty
boun
darie
s are
assig
ned
to th
e cou
nty w
ith th
e lar
gest
num
ber o
f zip
code
s. St
anda
rd er
rors
are c
luste
red
by co
unty.
Matu
rity-
by-m
onth
dum
my v
ariab
les in
clude
d in
the r
egre
ssio
n.

DEMOGRAPHIC FRACTIONALIZATION AND THE MUNICIPAL BOND MARKET 27
Focusing on the corruption measures from the Butler, Fauver, and Mor-tal (2009) paper, the coeffi cients are statistically signifi cant and have the expected signs. With each coeffi cient, a two standard deviation change in the corruption measure is associated with a three basis point change in bond yields. The fact that our fractionalization measures continue to be signifi cant once the Butler et al. corruption measures are included suggests that the local fractionalization measures are capturing some effect that is orthogonal to those authors’ measures of corruption.
Counties with higher rates of population increase appear to borrow at higher rates, once we have controlled for county-level economic activity. Like our fractionalization measures, the rate of population increase can be viewed as a proxy for the strength of social networks within an area. If social networks take time to build, a population of recent arrivals will have weaker ties than a population that has been more static. County unemploy-ment rates are positively associated with borrowing costs.
Our results support the hypothesis that measures of religious and eth-nic fractionalization are correlated with municipalities’ borrowing costs. Table 9 shows the results of an effort to assign some causal interpretation to that correlation, or at least to go further toward ruling out alternative stories behind the correlations documented in Tables 6 and 7. Because fractionalization measures may change with economic growth, which may also infl uence municipal borrowing costs, the goal in Table 9 is to fi nd an instrumental variable that infl uences our fractionalization measures with-out exerting an independent effect on recent municipal borrowing costs. Our approach is to construct measures of the share white and ethnic frac-tionalization based on data from long before the sample period and use these measures constructed on the earlier period as instruments for the eth-nic fractionalization in the 2000 Census. If the ethnic diversity measures based on the 2000 Census are correlated with recent economic activity, using diversity from the 1980 Census as an instrument will cleanse the variable of this source of correlation. The 1980 Census is the earliest Cen-sus that allows us to construct measures of ethnic diversity that separate out white and black non-Hispanic respondents.
Columns (3), (4), and (5) in Table 9 are instrumental variable specifi ca-tions similar to the specifi cations in Table 6, with a minimal set of addi-tional control variables. Columns (8), (9), and (10) are IV specifi cations with controls that are analogous to the richer set of controls in Table 7. In all specifi cations, both ordinary least squares (OLS) and using pre-sample ethnic diversity measures as instruments in IV specifi cations, we fi nd a strong relationship between fractionalization and municipal bond yields. The magnitude of the coeffi cients is very similar across OLS and IV speci-fi cations, a result that refl ects the very slow evolution of empirical mea-sures of ethnic fractionalization and diversity. Taken together, the results in

28 MUNICIPAL FINANCE JOURNALTa
ble
9: I
nstr
umen
tal V
aria
ble
Regr
essi
ons
of B
ond
Offe
ring
Yiel
d on
Fra
ctio
naliz
atio
n, A
ll M
unic
ipal
Bon
ds
Inde
pend
ent
Varia
ble
Mea
n/SD
Bond
Offe
ring
Yiel
d
(1)
(2)
(3)
(4)
(5)
(6)
(7)
(8)
(9)
(10)
Tech
niqu
eOL
SOL
SIV
IVIV
OLS
OLS
IVIV
IV
Inst
rum
ent
NA19
80 R
ace
Shar
e W
hite
, 19
80 R
ace
Herfi
nda
hlNA
1980
Rac
e Sh
are
Whi
te,
1980
Rac
e He
rfi n
dahl
Cont
rols
Tabl
e 6
(Min
imal
)Ta
ble
7 (M
axim
al)
Race
Her
fi nda
hl,
coun
ty0.
653
/0.2
02–0
.2435
***
–0.3
285*
**–0
.203
7***
–0.1
361*
**–0
.193
6***
–0.2
247*
**
(0.0
395)
(0.0
478)
(0.0
532)
(0.0
334)
(0.0
378)
(0.0
458)
Race
shar
e whi
te,
coun
ty0.
748
/0.1
97–0
.266
7***
–0.2
890*
**–0
.138
5***
–0.1
323*
**–0
.136
8***
0.03
86
(0.0
376)
(0.0
432)
(0.0
403)
(0.0
352)
(0.0
392)
(0.0
419)
Cons
tant
4.97
25**
*4.
9946
***
5.13
61**
*5.
0376
***
5.14
87**
*4.
5380
***
4.52
40**
*4.
5926
***
4.52
34**
*4.
5867
***
(0
.090
3)(0
.088
2)(0
.094
4)(0
.081
5)(0
.093
7)(0
.135
7)(0
.141
9)(0
.136
5)(0
.146
6)(0
.138
4)
Obse
rvati
ons
1189
995
1189
995
1187
099
1187
099
1187
099
1186
461
1186
461
1183
611
1183
611
1183
611
R-sq
uare
d
0.81
300.
8134
0.81
380.
8137
0.81
390.
8800
0.88
000.
8803
0.88
020.
8803
Robu
st sta
ndar
d er
rors
in p
aren
thes
es
Note:
Dep
ende
nt va
riabl
e is b
ond
offer
ing
yield
. Sam
ple i
nclu
des a
ll m
unici
pal d
ebt i
ssue
s tha
t can
be m
appe
d to
coun
ty da
ta. E
xclu
ded
woul
d be
state
and
supr
a-co
unty
bond
s. Ci
ties t
hat c
ross
co
unty
boun
darie
s are
assig
ned
to th
e cou
nty w
ith th
e lar
gest
num
ber o
f zip
code
s. St
anda
rd er
rors
are c
luste
red
by co
unty.
* Sig
nifi c
ant a
t 10%
; ** s
igni
fi can
t at 5
%; *
** si
gnifi
cant
at 1
%.

DEMOGRAPHIC FRACTIONALIZATION AND THE MUNICIPAL BOND MARKET 29
Table 6 through Table 9 suggest that municipal bond yields are positively associated with measures of religious and ethnic diversity. Although not absolutely fi xed, the measures of diversity move slowly enough to suggest that our observed correlations do not refl ect some underlying exposure of both variables to short-term or medium-term variables such as economic growth.
Risk Versus Monitoring Having established a relationship between measures of religious and
ethnic diversity and municipal borrowing costs, we now investigate the cause of this observed relationship. One hypothesis is that bonds issued by more fractionalized places are riskier than bonds issued by other places, a hypothesis we call the “risk” hypothesis. Our “monitoring” hypothesis is a residual hypothesis—any part of our observed differences that do not appear to refl ect risk represents some ineffi ciency or failure of monitoring in the underwriting process for localities’ municipal debt.
We begin this analysis by investigating how the relationship between frac-tionalization and bond yields varies across issues of different size. Figures 2 and 3 present the coeffi cients on religious and ethnic fractionalization, esti-mated separately on each decile of issue size. Figure 2 is based on regressions
Figure 2: Coeffi cients on Fractionalization by Issue Size Decile, Minimal Controls
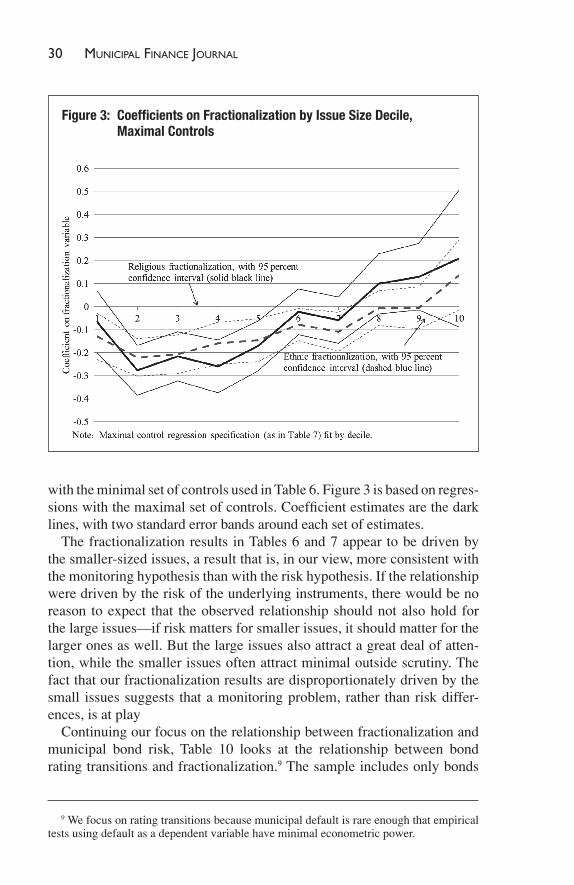
30 MUNICIPAL FINANCE JOURNAL
9 We focus on rating transitions because municipal default is rare enough that empirical tests using default as a dependent variable have minimal econometric power.
Figure 3: Coeffi cients on Fractionalization by Issue Size Decile, Maximal Controls
with the minimal set of controls used in Table 6. Figure 3 is based on regres-sions with the maximal set of controls. Coeffi cient estimates are the dark lines, with two standard error bands around each set of estimates.
The fractionalization results in Tables 6 and 7 appear to be driven by the smaller-sized issues, a result that is, in our view, more consistent with the monitoring hypothesis than with the risk hypothesis. If the relationship were driven by the risk of the underlying instruments, there would be no reason to expect that the observed relationship should not also hold for the large issues—if risk matters for smaller issues, it should matter for the larger ones as well. But the large issues also attract a great deal of atten-tion, while the smaller issues often attract minimal outside scrutiny. The fact that our fractionalization results are disproportionately driven by the small issues suggests that a monitoring problem, rather than risk differ-ences, is at play
Continuing our focus on the relationship between fractionalization and municipal bond risk, Table 10 looks at the relationship between bond rating transitions and fractionalization. 9 The sample includes only bonds

DEMOGRAPHIC FRACTIONALIZATION AND THE MUNICIPAL BOND MARKET 31
Tabl
e 10
: Re
gres
sion
s of
Bon
d Ra
ting
Tran
sitio
ns o
n Fr
actio
naliz
atio
nIn
depe
nden
t Va
riabl
eM
ean
/SD
Bond
Offe
ring
Yiel
d(1
)(2
)(3
)(4
)(5
)(6
)(7
)(8
)(9
)(1
0)Co
ntro
lsTa
ble
6 (M
inim
al)
Tabl
e 7
(Max
imal
)
Relig
ion
Herfi
ndah
l, co
unty
0.33
0/0
.091
0.00
60**
*0.
0024
**–0
.001
1–0
.000
2(0
.000
9)(0
.001
0)(0
.000
9)(0
.001
1)[0
.013
1][0
.005
2][–
0.00
24]
[–0.
0004
]
Relig
ion
mem
bers
per
ca
pita,
coun
ty
0.62
1/0
.165
0.00
36**
*0.
0036
***
–0.0
023*
**0.
0007
(0.0
004)
(0.0
005)
(0.0
005)
(0.0
006)
[0.0
143]
[0.0
143]
[–0.
0091
][0
.002
8]
Race
He
rfi nd
ahl,
coun
ty
0.65
3/0
.202
0.00
31**
*0.
0040
***
0.00
72**
*–0
.001
0(0
.000
5)(0
.000
8)(0
.000
6)(0
.000
9)[0
.015
0][0
.019
4][0
.034
9][–
0.00
49]
Race
shar
e wh
ite, c
ount
y 0.
748
/0.1
97
0.00
10**
*–0
.000
50.
0099
***
0.01
07**
*(0
.000
4)(0
.000
6)(0
.000
5)(0
.000
8)
[0.0
047]
[–0.
0024
]
[0.0
468]
[0.0
506]
Obse
rvati
ons
3.49
e+07
3.49
e+07
3.49
e+07
3.49
e+07
3.49
e+07
3.03
e+07
3.03
e+07
3.03
e+07
3.03
e+07
3.03
e+07
R-sq
uare
d
0.00
030.
0003
0.00
030.
0002
0.00
030.
0038
0.00
380.
0039
0.00
390.
0039
Robu
st sta
ndar
d er
rors
in p
aren
thes
esNo
te: M
onth
-by-
bond
obs
erva
tions
. Dep
ende
nt va
riabl
e is c
atego
rical
varia
ble c
oded
to 1
for b
ond
down
grad
es in
a gi
ven
mon
th, 0
for n
o ch
ange
, and
–1
for u
pgra
des.
Sam
ple i
nclu
des a
ll m
unici
pal
debt
issu
es th
at ca
n be
map
ped
to co
unty
data
and
for w
hich
ther
e are
S&P
cred
it ra
tings
assig
ned
to th
e und
erlyi
ng is
suer
(SPU
Rs).
Exclu
ded
woul
d be
state
and
supr
a-co
unty
bond
s. Ci
ties t
hat c
ross
co
unty
boun
darie
s are
assig
ned
to th
e cou
nty w
ith th
e lar
gest
num
ber o
f zip
code
s. St
anda
rd er
rors
clus
tered
by c
ount
y are
in p
aren
thes
es b
elow
the c
oeffi
cient
estim
ates.
In b
rack
ets b
elow
the c
oeffi
cient
es
timate
s and
stan
dard
erro
rs ar
e the
incr
emen
tal d
owng
rade
s per
year
for a
two
stand
ard
devia
tion
incr
ease
in th
e ind
epen
dent
varia
ble.
* Sig
nifi c
ant a
t 10%
; ** s
igni
fi can
t at 5
%; *
** si
gnifi
cant
at 1
%.

32 MUNICIPAL FINANCE JOURNAL
for which Standard and Poor’s assigns a rating to the underlying issuer, known as the “SPUR.” On net, there does not appear to be any evidence that the bonds issued by more fractionalized places are downgraded at a more rapid pace than bonds issued by less fractionalized places. If any-thing, the places that are whiter and the places that are more homogeneous appear to have somewhat worse performance in terms of ratings transi-tions, although the result depends on the set of other controls included in the regressions. In the specifi cation in column (10), which has a full set of controls and includes all of the diversity measures, the only signifi cant coeffi cient is on the population share that is white. The positive coeffi cient suggests that, controlling for other factors, the counties that are whiter get downgraded more frequently than other counties. In this specifi cation, the effect amounts to about 0.0506 rating notches (where the move from AA to AA–represents one notch) per year for a two standard deviation increase in the share white. In none of the other specifi cations is the effect large in economic magnitude.
Table 11 investigates the relationship between ratings at issuance and fractionalization. Because the long-term credit rating assigned to a bond at issuance is a function both of the credit quality of the underlying issuer (the SPUR), as well as the credit quality of a fi nancial guarantor (if the bond is sold with bond insurance), the table presents three different types of regressions. In columns (1) through (4), the dependent variable is the long-term credit rating of the bond, refl ecting both issuer credit quality and insurance. The dependent variable in columns (5) through (8) is the SPUR, and columns (9) through (12) use a dummy for bond insurance as the dependent variable. The results suggest that, even controlling for other observables, Standard & Poor’s assigns more favorable credit ratings to issuers in counties with higher levels of religious observance (column (6)). There are no statistically signifi cant relationships between measures of fractionalization or the share white and underlying issuer credit quality. The fact that bonds issued by more ethnically homogeneous counties are issued with higher credit ratings (column (3)) refl ects the fact that more ethnically homogeneous counties are more likely to purchase bond insur-ance policies for the debt that they issue; there is no statistically signifi cant difference in the S&P assessment of the bonds’ underlying credit quality (column (7)).
On net, the results in Tables 10 and 11 do not point to an unambiguous win for the risk hypothesis versus the monitoring hypothesis. Table 11 suggests that Standard & Poor’s views the bonds issued by more ethnically heterogeneous places as being slightly riskier than other bonds, but the sta-tistical signifi cance of this effect appears to be driven by bond insurance policies purchased by localities rather than the credit quality of the under-lying issuers themselves. Post-issuance, there do not appear to be major

DEMOGRAPHIC FRACTIONALIZATION AND THE MUNICIPAL BOND MARKET 33
Tabl
e 11
: Re
gres
sion
s of
Bon
d Lo
ng-T
erm
Cre
dit R
atin
g on
Fra
ctio
naliz
atio
n, A
ll M
unic
ipal
Bon
dsIn
depe
nden
t Va
riabl
eBo
nd L
ong-
Term
Cre
dit R
atin
gBo
nd S
PUR
Bond
Insu
ranc
e Du
mm
y
(1)
(2)
(3)
(4)
(5)
(6)
(7)
(8)
(9)
(10)
(11)
(12)
Relig
ion
Herfi
ndah
l, co
unty
–0.4
365
–0.5
225
0.16
58**
*
(0.3
813)
(0.5
388)
(0.0
572)
Relig
ion
mem
bers
pe
r cap
ita, c
ount
y–0
.551
6***
–0.9
452*
**–0
.115
5***
(0.2
086)
(0.2
743)
(0.0
412)
Race
Her
fi nda
hl,
coun
ty–0
.675
8**
–0.6
828
0.16
73**
*
(0.3
374)
(0.5
555)
(0.04
33)
Race
shar
e whi
te,
coun
ty–0
.4939
–0.2
711
0.18
69**
*
(0
.333
8)
(0.5
551)
(0
.0457
)
Addi
tiona
l con
trol v
ariab
les: C
ount
y size
, iss
ue si
ze, b
ond
size,
bond
trad
e cou
nt in
fi rs
t 60
days
(all
in lo
gs),
coun
ty m
edian
hou
se p
rice,
coun
ty m
edian
inco
me,
coun
ty go
vern
men
t deb
t and
expe
nditu
re p
er ca
pita,
BFM
corru
ptio
n m
easu
res 1
and
2, co
mpe
titive
issu
e, ne
gotia
ted is
sue,
bond
insu
ranc
e dum
my,
GO d
umm
y, ca
llabl
e dum
my,
putab
le du
mm
y, AM
T tax
dum
my,
taxab
le du
mm
y, sta
te-tax
dum
my,
state
top
tax ra
te, st
ate sh
are o
f hou
seho
lds w
ith in
com
e > 2
00k,
coun
ty po
pulat
ion
grow
th (5
year
), co
unty
unem
ploy
men
t rate
, cou
nty s
tanda
rd d
eviat
ion
of u
nem
ploy
men
t rate
s, re
fund
ing
bond
dum
my,
and
matu
rity-
by-m
onth
dum
mies
.
Obse
rvati
ons
5790
1857
9018
5790
1857
9018
4645
7746
4577
4645
7746
4577
1186
441
1186
441
1186
461
1186
461
R-sq
uare
d0.
0975
0.09
840.
0987
0.09
810.
1901
0.19
320.
1913
0.19
010.
2137
0.21
430.
2150
0.21
54
Robu
st sta
ndar
d er
rors
in p
aren
thes
es
Note:
Dep
ende
nt va
riabl
e in
colu
mns
(1) t
hrou
gh (4
) is b
ond
S&P
long
-term
cred
it ra
ting,
scale
d 1
(AAA
) to
20 (D
). De
pend
ent v
ariab
le in
colu
mns
(5) t
hrou
gh (8
) is b
ond
unde
rlyin
g ra
ting
(SPU
R),
not i
nclu
ding
effec
t of i
nsur
ance
. Dep
ende
nt va
riabl
e in
colu
mns
(9) t
hrou
gh (1
2) is
dum
my s
et to
1 fo
r bon
ds so
ld w
ith b
ond
insu
ranc
e. Sa
mpl
e inc
lude
s all
mun
icipa
l deb
t iss
ues t
hat c
an b
e map
ped
to co
unty
data.
Exc
lude
d wo
uld
be st
ate an
d su
pra-
coun
ty bo
nds.
Citie
s tha
t cro
ss co
unty
boun
darie
s are
assig
ned
to th
e cou
nty w
ith th
e lar
gest
num
ber o
f zip
code
s. St
anda
rd er
rors
are c
luste
red
by
coun
ty.* S
igni
fi can
t at 1
0%; *
* sig
nifi c
ant a
t 5%
; ***
sign
ifi ca
nt at
1%
.

34 MUNICIPAL FINANCE JOURNAL
differences in ratings transition experience for bonds across our measures of fractionalization. To the extent that there are differences, it appears that the ratings transition performance of more diverse places is better than the ratings transition performance of homogeneous places. This result as well is not consistent with the hypothesis that the bonds issued by the more diverse places are actually riskier than the bonds issued by the more homogeneous places.
Table 12 takes a different approach, using the S&P credit rating on the bond (as of the date of issuance) as a proxy for its risk and looking at dif-ferences in offering yield conditional on this proxy. The specifi cation is the same as in Tables 6 and 7, except that the maturity-by-month of issue interaction has an additional interaction with the credit rating at the date of issue. This allows for a time-varying yield/credit curve. The coeffi cients on our diversity variables in this regression thus refl ect offering yield dif-ferences conditional on the risk (as measured by S&P) of the instrument. The results suggest that, in particular for the measures of ethnic diversity, some of the observed differences in yields are not driven by the credit risk of the instruments. In columns (1) through (5), which use the minimal control set, the religion Herfi ndahl index, the race Herfi ndahl index, and the share white are all statistically signifi cant and large in economic mag-nitude. Adding the additional controls (columns (6) through (10)) leaves the religion Herfi ndahl statistically insignifi cant, but the signifi cance of the ethnic diversity measures remains in the specifi cations where they are included separately. In column (10), which includes all of the diversity measures together, no measure is individually signifi cant—a result we ascribe to the collinearity among these diversity measures.
The results in Table 12 suggest that some part of the relationship between diversity and bond yields that we fi nd in this paper is coming from moni-toring rather than risk. This result is more robust for the ethnic diversity measures than for the religious diversity measures.
Using credit ratings as proxies for risk, as in Table 12, is not absolutely uncontroversial. The approach in Table 13 is to look at the post-issuance trading prices of the municipal bonds in our sample. We compare the post-issuance transaction prices of bonds issued by more and less diverse places. If there are differences in offering yields across localities of differ-ent diversity, and if these differences do not refl ect risk, and if the markets in which these bonds trade are both effi cient and liquid enough to observe trades, then we will observe price increases post-issuance among the bonds issued by fractionalized places. Note that this test requires that mar-kets be both effi cient and liquid enough to observe trades: it could be that the bonds issued by diverse places are not riskier but that they never trade once placed with their initial investors. In that case, our observed yield dif-ferences would represent windfall loss to diverse issues and windfall gain to the investors who purchase them, but no trades would be observed.

DEMOGRAPHIC FRACTIONALIZATION AND THE MUNICIPAL BOND MARKET 35
Tabl
e 12
: Bo
nd O
fferin
g Yi
eld
on F
ract
iona
lizat
ion,
All
Mun
icip
al B
onds
, Con
trol
ling
for C
redi
t Rat
ing
Inde
pend
ent
Varia
ble
Mea
n/S
DBo
nd O
fferin
g Yi
eld
(1)
(2)
(3)
(4)
(5)
(6)
(7)
(8)
(9)
(10)
Cont
rols
Tabl
e 6
(Min
imal
)Ta
ble
7 (M
axim
al)
Relig
ion
Herfi
nd-
ahl,
coun
ty0.
331
/0.0
91–0
.128
1**
–0.1
927*
**–0
.035
8–0
.006
6
(0.0
510)
(0.0
490)
(0.0
296)
(0.0
315)
Relig
ion
mem
-be
rs p
er ca
pita,
co
unty
0.62
2/0
.166
–0.0
111
–0.0
030
–0.0
164
–0.0
284
(0.0
281)
(0.0
277)
(0.0
170)
(0.0
181)
Race
Her
fi nda
hl,
coun
ty0.
654
/0.2
02–0
.077
2***
0.07
62**
–0.0
511*
**–0
.030
0
(0.0
268)
(0.0
309)
(0.0
177)
(0.0
247)
Race
shar
e whi
te,
coun
ty0.
748
/0.1
97–0
.101
0***
–0.1
668*
**–0
.045
8***
–0.0
331
(0
.022
6)(0
.031
1)
(0.0
163)
(0.0
232)
Addi
tiona
l con
trol v
ariab
les: C
ount
y size
, iss
ue si
ze, b
ond
size,
bond
trad
e cou
nt in
fi rs
t 60
days
(all
in lo
gs),
coun
ty m
edian
hou
se p
rice,
coun
ty m
edian
inco
me,
coun
ty go
vern
men
t deb
t and
expe
nditu
re p
er ca
pita,
BFM
corru
ptio
n m
easu
res 1
and
2, co
mpe
titive
issu
e, ne
gotia
ted is
sue,
bond
insu
ranc
e dum
my,
GO d
umm
y, ca
llabl
e dum
my,
putab
le du
mm
y, AM
T tax
dum
my,
taxab
le du
mm
y, sta
te-tax
dum
my,
state
top
tax ra
te, st
ate sh
are o
f hou
seho
lds w
ith in
com
e > 2
00k,
coun
ty po
pulat
ion
grow
th (5
year
), co
unty
unem
ploy
men
t rate
, cou
nty s
tanda
rd d
eviat
ion
of u
nem
ploy
men
t rate
s, re
fund
ing
bond
dum
my,
matu
rity-
by-m
onth
dum
mies
, and
S&P
cred
it ra
ting
of b
ond
inter
acted
with
m
onth
of i
ssua
nce.
Obse
rvati
ons
5819
3258
1932
5819
3258
1932
5819
3257
9018
5790
1857
9018
5790
1857
9018
R-sq
uare
d
0.88
140.
8813
0.88
140.
8815
0.88
170.
9342
0.93
420.
9342
0.93
420.
9342
Robu
st sta
ndar
d er
rors
in p
aren
thes
es
Note:
Dep
ende
nt va
riabl
e is b
ond
offer
ing
yield
. Sam
ple i
nclu
des a
ll m
unici
pal d
ebt i
ssue
s tha
t can
be m
appe
d to
coun
ty da
ta. E
xclu
ded
woul
d be
state
and
supr
a-co
unty
bond
s. Ci
ties t
hat c
ross
co
unty
boun
darie
s are
assig
ned
to th
e cou
nty w
ith th
e lar
gest
num
ber o
f zip
code
s. St
anda
rd er
rors
are c
luste
red
by co
unty.
* Sig
nifi c
ant a
t 10%
; ** s
igni
fi can
t at 5
%; *
** si
gnifi
cant
at 1
%.

36 MUNICIPAL FINANCE JOURNALTa
ble
13:
Regr
essi
ons
of 1
20-D
ay P
ost-
Issu
ance
Pric
e Ch
ange
on
Frac
tiona
lizat
ion,
All
Mun
icip
al B
onds
Inde
pend
ent
Varia
ble
Mea
n/S
D12
0-Da
y Po
st-I
ssua
nce
Pric
e Ch
ange
(1)
(2)
(3)
(4)
(5)
(6)
(7)
(8)
(9)
(10)
Cont
rols
Tabl
e 6
(Min
imal
)Ta
ble
7 (M
axim
al)
Relig
ion
Herfi
nd-
ahl,
coun
ty0.
331
/0.0
91–0
.003
00.
0226
–0.0
901*
**–0
.072
7**
(0.0
373)
(0.0
402)
(0.0
304)
(0.0
344)
Relig
ion
mem
-be
rs p
er ca
pita,
co
unty
0.62
2/0
.166
–0.0
611*
**–0
.074
1***
–0.0
163
–0.0
071
(0.0
192)
(0.0
203)
(0.0
165)
(0.0
194)
Race
Her
fi nda
hl,
coun
ty0.
654
/0.2
02–0
.048
5**
0.00
71–0
.042
5**
–0.0
419
(0.0
227)
(0.0
334)
(0.0
173)
(0.0
345)
Race
shar
e whi
te,
coun
ty0.
748
/0.1
97–0
.061
9***
–0.0
792*
*–0
.023
60.
0070
(0
.022
2)(0
.033
7)
(0.0
189)
(0.0
368)
Addi
tiona
l con
trol v
ariab
les: C
ount
y size
, iss
ue si
ze, b
ond
size,
bond
trad
e cou
nt in
fi rs
t 60
days
(all
in lo
gs),
coun
ty m
edian
hou
se p
rice,
coun
ty m
edian
inco
me,
coun
ty go
v-er
nmen
t deb
t and
expe
nditu
re p
er ca
pita,
BFM
corru
ptio
n m
easu
res 1
and
2, co
mpe
titive
issu
e, ne
gotia
ted is
sue,
bond
insu
ranc
e dum
my,
GO d
umm
y, ca
llabl
e dum
my,
putab
le du
mm
y, AM
T tax
dum
my,
taxab
le du
mm
y, sta
te-tax
dum
my,
state
top
tax ra
te, st
ate sh
are o
f hou
seho
lds w
ith in
com
e > 2
00k,
coun
ty po
pulat
ion
grow
th (5
year
), co
unty
unem
-pl
oym
ent r
ate, c
ount
y stan
dard
dev
iatio
n of
une
mpl
oym
ent r
ates,
refu
ndin
g bo
nd d
umm
y, pe
rcen
t diff
eren
ce b
etwee
n of
ferin
g pr
ice an
d pa
r, an
d m
aturit
y-by
-mon
th d
umm
ies.
Obse
rvati
ons
9949
6299
4962
9949
6299
4962
9949
6299
1851
9918
5199
1851
9918
5199
1851
R-sq
uare
d
0.12
990.
1302
0.13
000.
1301
0.13
040.
1410
0.14
090.
1409
0.14
090.
1410
Robu
st sta
ndar
d er
rors
in p
aren
thes
es
Note:
Dep
ende
nt va
riabl
e is 1
20-d
ay p
ost-i
ssua
nce p
erce
nt p
rice c
hang
e. Sa
mpl
e inc
lude
s all
mun
icipa
l deb
t iss
ues t
hat c
an b
e map
ped
to co
unty
data.
Exc
lude
d wo
uld
be st
ate an
d su
pra-
coun
ty bo
nds.
Citie
s tha
t cro
ss co
unty
boun
darie
s are
assig
ned
to th
e cou
nty w
ith th
e lar
gest
num
ber o
f zip
code
s. St
anda
rd er
rors
clus
tered
by c
ount
y. * S
igni
fi can
t at 1
0%; *
* sig
nifi c
ant a
t 5%
; ***
sign
ifi ca
nt at
1%
.

DEMOGRAPHIC FRACTIONALIZATION AND THE MUNICIPAL BOND MARKET 37
10 We use the weighted-average transaction price over the fi rst 120 days post-issuance.
The results in Table 13, which uses as a dependent variable the price increase during the fi rst 120 days post-issuance, also suggest that part of our observed differences in yields refl ects monitoring rather than risk. 10 Although the set of control variables included has some impact on our esti-mates, there is strong evidence that the bonds issued by more ethnically fractionalized localities trade at higher prices once they are issued. The price increase is small in economic magnitude: the coeffi cient of –0.0425 in column (8) suggests that a two standard deviation increase in ethnic diversity would be associated with a 1.6 basis point increase in the post-issuance price change. Scaling these results against Tables 6 and 7, where the dependent variable is the bond offering yield rather than the prices, suggests that a small but statistically signifi cant part of the discount at offering is retraced in trades during the 120 days post-issuance.
This result can be viewed as strong evidence that at least some of the discount in the price of the bonds issued by more diverse places refl ects monitoring rather than risk. The residual here does not necessarily refl ect risk; as described above, this test relies both on windfall gains to the initial investors and a liquid market for the bonds once issued. It is possible that the monitoring effect is much larger, but unobserved because of a lack of trading. But taken as a whole, our results do suggest that at least part of the observed discount in municipal debt issued by diverse places refl ects something other than risk differences.
CONCLUSION Taken as a whole, these results suggest that ethnic and religious fraction-
alization play a role in determining municipal issuers’ borrowing costs. Issuers in more fractionalized counties appear to pay more to borrow. The effect is statistically signifi cant, robust across samples, and large in eco-nomic magnitude—comparable in magnitude to results in Butler, Fauver, and Mortal (2009) on corruption and municipal bond yields. We cannot place a precise bound around the share of the observed spread differences that refl ect higher risk in more diverse places, but a variety of tests all point toward the conclusion that at least part of the spread difference is not driven by risk, that it refl ects, instead, differential failures across localities in the effi ciency with which the bond underwriting process is working.
References Alesina, Alberto, Reza Baqir, and William Easterly (1999). “Public Goods and Ethnic
Divisions.” Quarterly Journal of Economics, 114(4), 1243–1283. Alesina, Alberto, Arnaud Devleeschwauwer, William Easterly, Sergio Kurlat, and Romain
Wacziarg (2003). “Fractionalization.” Journal of Economic Growth, 8(2), 155–194.
38 MUNICIPAL FINANCE JOURNAL
Alesina, Alberto, and Allan Drazen (1991). “Why Are Stabilizations Delayed?” American Economic Review, 81(5), 1170–1188.
Alesina, Alberto, and Eliana La Ferrara (2000). “Participation in Heterogeneous Commu-nities.” Quarterly Journal of Economics, 115(3), 847–904.
Butler, Alexander, Larry Fauver, and Sandra Mortal (2009). “Corruption, Political Connec-tions, and Municipal Finance.” Review of Financial Studies, 22(7), 2873–2905.
Collier, Paul (2000). “Ethnicity, Politics, and Economic Performance.” Economics and Politics, 12(3), 225–245.
Collier, Paul, and Jan Willem Gunning (1999). “Explaining African Economic Perfor-mance.” Journal of Economic Literature, 37(1), 64–111.
Easterly, William, and Ross Levine (1997). “Africa’s Growth Tragedy: Politics and Ethnic Divisions.” Quarterly Journal of Economics, 112(4), 1203–1250.
Finke, Roger, and Christopher Scheitle (2005). “Accounting for the Uncounted: Computing Correctives for the 2000 RCMS Data.” Review of Religious Research, 4(1), 5–22.
Gettleman, Jeffrey (2011). “In Sudan, a Colonial Curse Comes Up for a Vote.” New York Times , January 8, 2011.
Glaeser, Ed, Jose Scheinkman, and Andrei Shleifer (1995). “Economic Growth in a Cross-Section of Cities.” Journal of Monetary Economics, 36(1), 117–143.
Hilary, Gilles, and Kai Wai Hui (2009). “Does Religion Matter in Corporate Decision Mak-ing in America?” Journal of Financial Economics, 93(3), 455–473.
La Porta, Rafael, Florencio Lopez-de-Silanes, Andrei Shleifer, and Robert Vishny (1999). “The Quality of Government.” Journal of Law, Economics, and Organizations, 15(1), 222–279.
McCleary, Rachel, and Robert Barro (2003). “Religion and Economic Growth.” American Sociological Review, 68(5), 760–781.
McCleary, Rachel, and Robert Barro (2006a). “Religion and Political Economy in an Inter-national Panel.” Journal for the Scientifi c Study of Religion, 45(2), 149–175.
McCleary, Rachel, and Robert Barro (2006b). “Religion and Economy.” Journal of Eco-nomic Perspectives, 20(2), 49–72.
Putnam, Robert D. (1993). Making Democracy Work: Civic Traditions in Modern Italy . Princeton, NJ: Princeton University Press.
Putnam, Robert D. (1995). “Bowling Alone: America’s Declining Social Capital.” Journal of Democracy, 6(1), 65–78.
Vigdor, Jacob (2004). “Community Composition and Collective Action: Analyzing Ini-tial Mail Response to the 2000 Census.” Review of Economics and Statistics, 86(1), 303–312.
Whalley, Alexander (2011). Elected Versus Appointed Policymakers: Evidence from City Treasurers . NBER Working Paper 15643. Cambridge, MA: National Bureau of Eco-nomic Research.

©Authorized Electronic Copy
This electronic copy was prepared for and is authorized solely for the use of the purchaser/subscriber. This material may not be photocopied, e-mailed, or otherwise
reproduced or distributed without permission, and any such reproduction or redistribution is a violation of copyright law.
For permissions, contact the Copyright Clearance Center at http://www.copyright.com/
You may also fax your request to 1-978-646-8700 or contact CCC with your permission request via email at [email protected]. If you have any questions or concerns about
this process you can reach a customer relations representative at 1-978-646-2600 from the hours of 8:00 - 5:30 eastern time.