KANSAS LOWER REPUBLICAN BASIN TOTAL MAXIMUM …4 or algal by-products or nuisance growths of...
46
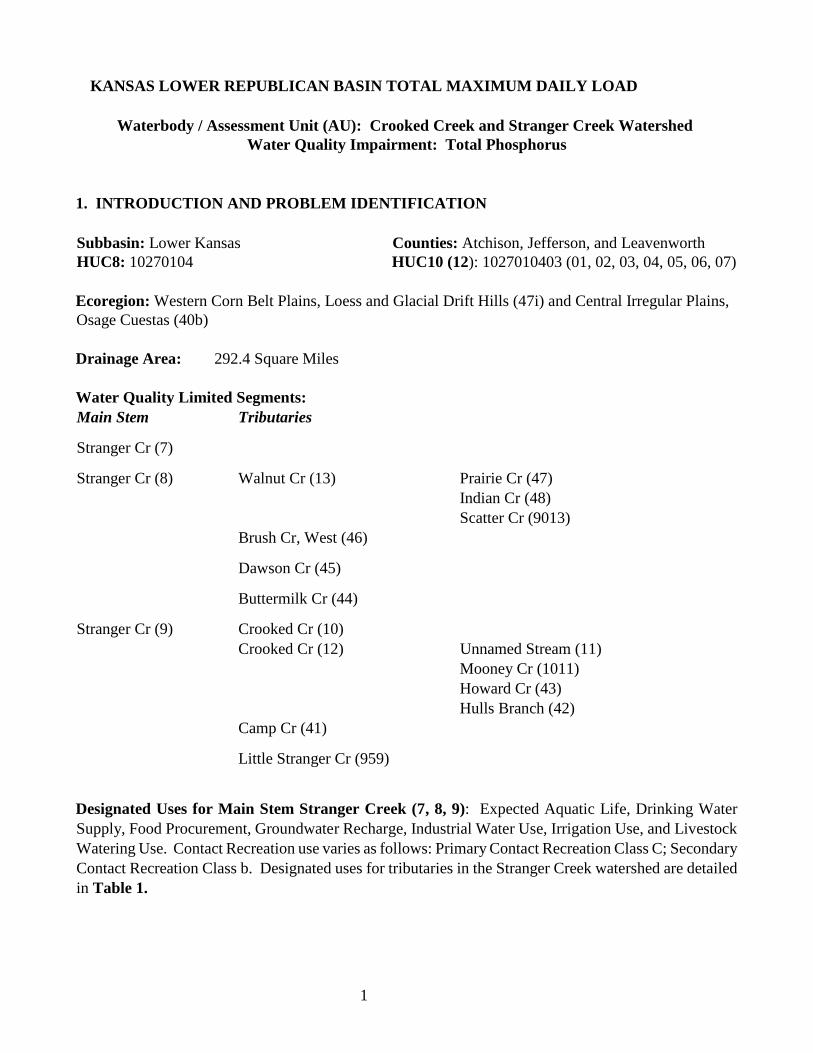
1 KANSAS LOWER REPUBLICAN BASIN TOTAL MAXIMUM DAILY LOAD Waterbody / Assessment Unit (AU): Crooked Creek and Stranger Creek Watershed Water Quality Impairment: Total Phosphorus 1. INTRODUCTION AND PROBLEM IDENTIFICATION Subbasin: Lower Kansas Counties: Atchison, Jefferson, and Leavenworth HUC8: 10270104 HUC10 (12): 1027010403 (01, 02, 03, 04, 05, 06, 07) Ecoregion: Western Corn Belt Plains, Loess and Glacial Drift Hills (47i) and Central Irregular Plains, Osage Cuestas (40b) Drainage Area: 292.4 Square Miles Water Quality Limited Segments: Main Stem Tributaries Stranger Cr (7) Stranger Cr (8) Walnut Cr (13) Prairie Cr (47) Indian Cr (48) Scatter Cr (9013) Brush Cr, West (46) Dawson Cr (45) Buttermilk Cr (44) Stranger Cr (9) Crooked Cr (10) Crooked Cr (12) Unnamed Stream (11) Mooney Cr (1011) Howard Cr (43) Hulls Branch (42) Camp Cr (41) Little Stranger Cr (959) Designated Uses for Main Stem Stranger Creek (7, 8, 9): Expected Aquatic Life, Drinking Water Supply, Food Procurement, Groundwater Recharge, Industrial Water Use, Irrigation Use, and Livestock Watering Use. Contact Recreation use varies as follows: Primary Contact Recreation Class C; Secondary Contact Recreation Class b. Designated uses for tributaries in the Stranger Creek watershed are detailed in Table 1.
Transcript of KANSAS LOWER REPUBLICAN BASIN TOTAL MAXIMUM …4 or algal by-products or nuisance growths of...
1
KANSAS LOWER REPUBLICAN BASIN TOTAL MAXIMUM DAILY LOAD
Waterbody / Assessment Unit (AU): Crooked Creek and Stranger Creek Watershed
Water Quality Impairment: Total Phosphorus
1. INTRODUCTION AND PROBLEM IDENTIFICATION
Subbasin: Lower Kansas Counties: Atchison, Jefferson, and Leavenworth
HUC8: 10270104 HUC10 (12): 1027010403 (01, 02, 03, 04, 05, 06, 07)
Ecoregion: Western Corn Belt Plains, Loess and Glacial Drift Hills (47i) and Central Irregular Plains,
Osage Cuestas (40b)
Drainage Area: 292.4 Square Miles
Water Quality Limited Segments:
Main Stem Tributaries
Stranger Cr (7)
Stranger Cr (8) Walnut Cr (13) Prairie Cr (47)
Indian Cr (48)
Scatter Cr (9013)
Brush Cr, West (46)
Dawson Cr (45)
Buttermilk Cr (44)
Stranger Cr (9) Crooked Cr (10)
Crooked Cr (12) Unnamed Stream (11)
Mooney Cr (1011)
Howard Cr (43)
Hulls Branch (42)
Camp Cr (41)
Little Stranger Cr (959)
Designated Uses for Main Stem Stranger Creek (7, 8, 9): Expected Aquatic Life, Drinking Water
Supply, Food Procurement, Groundwater Recharge, Industrial Water Use, Irrigation Use, and Livestock
Watering Use. Contact Recreation use varies as follows: Primary Contact Recreation Class C; Secondary
Contact Recreation Class b. Designated uses for tributaries in the Stranger Creek watershed are detailed
in Table 1.

2
Table 1. Designated Uses for Tributaries in the Crooked Creek and Stranger Creek Watersheds. Tributary Segment
# Expected
Aquatic
Life
Contact
Recreation Drinking
Supply Food
Procurement Ground Water
Recharge
Industrial Water Use
Irrigation
Use Livestock Watering
Use Walnut Cr 13 Y b Y Y Y Y Y Y Prairie Cr 47 Y b Y Y Y Y Y Y Indian Cr 48 Y b N N N N Y Y Scatter Cr 9013 Y b N Y N N Y Y Brush Cr, West 46 Y b N N N N Y Y Dawson Cr 45 Y b Y N Y Y Y Y Buttermilk Cr 44 Y b N N Y N Y Y Crooked Cr 10 Y C Y Y Y Y Y Y Crooked Cr 12 Y C Y Y Y Y Y Y Unnamed Stream 11 Y b N N N N Y Y Mooney Cr 1011 Y b Y Y Y Y Y Y Howard Cr 43 Y b N Y Y N N Y Hulls Branch 42 Y b N Y N N N N Camp Cr 41 Y b Y N Y Y Y Y Little Stranger Cr 959 Y C Y Y Y Y Y Y
Y = Yes (use is designated); N = No (use is not designated)
303(d) Listings:
Station SC683, Crooked Creek near Winchester Total Phosphorus (TP) Impairment: 2008,
2010, 2012 and 2016 Kansas/ Lower Republican River Basin Streams (Figure 1).
Station SC602, Stranger Creek near Easton, Total Phosphorus (TP) Impairment: 2008, 2010,
2012 and 2016 Kansas/ Lower Republican River Basin Streams (Figure 1).
Impaired Use: Aquatic Life, Contact Recreation, and Domestic Water Supply.

3
Figure 1. Crooked Creek and Stranger Creek Watersheds.
Water Quality Criteria:
Nutrients – Narratives: Taste-producing and odor-producing substances of artificial origin shall not
occur in surface waters at concentrations that interfere with the production of potable water by
conventional water treatment processes, that impart an unpalatable flavor to edible aquatic or
semiaquatic life or terrestrial wildlife, or that result in noticeable odors in the vicinity of surface waters
(KAR 28-16-28e(b)(7)).
The introduction of plant nutrients into surface waters designated for domestic water supply use shall be
controlled to prevent interference with the production of drinking water (K.A.R. 28-16-28e(d)(3)(D)).
The introduction of plant nutrients into streams, lakes, or wetlands from artificial sources shall be
controlled to prevent the accelerated succession or replacement of aquatic biota or the projection of
undesirable quantities or kinds of aquatic life (K.A.R. 28-16-28e(d)(2)(A)).
The introduction of plant nutrients into surface waters designated for primary or secondary contact
recreational use shall be controlled to prevent the development of objectionable concentrations of algae

4
or algal by-products or nuisance growths of submersed, floating, or emergent aquatic vegetation (K.A.R.
28-16-28e(d)(7)(A)).
The concentration of dissolved oxygen in surface waters shall not be lowered by the influence of artificial
sources of pollution. The Dissolved Oxygen criterion is 5.0 milligrams per liter (K.A.R. 28-16-28e(e),
Table 1g).
2.0 CURRENT WATER QUALITY CONDITION AND DESIRED ENDPOINT
Level of Support for Designated Uses under the 2016 303(d) List: Phosphorus levels in Crooked
Creek near Winchester (SC683) and Stranger Creek near Easton (SC602) are consistently high.
Excessive nutrients are not being controlled and are thus impairing aquatic life, domestic water supply,
and contact recreation.
Stream Chemistry Monitoring Sites and Periods of Record:
Active KDHE Rotational ambient Stream Chemistry sampling station SC683, located on Crooked Creek
¼ mile west, 2 ½ miles north, and ¾ mile west of Winchester.
Period of Record: Sampled bimonthly in 1995, 1999, 2003, 2007 and quarterly in 2011 and 2015.
Active KDHE Rotational ambient Stream Chemistry sampling station SC602, located on Stanger Creek
4¾ mile and ½ mile east of Easton.
Period of Record: Sampled bimonthly in 1991, 1995, 1999, 2003, 2007 and quarterly in 2011 and 2015.
Stream Biology Monitoring Sites and Periods of Record:
Station SB683: Crooked Creek at County road ¼ mile west, 2 ½ miles north, and ¾ mile west of
Winchester.
Period of Record: 1992- 2014. Two samples were taken in 1992 and 1993 and one sample was taken
from 1994-2014 except 1995, 2008, 2010, 2011, and 2012 where there was no data collected.
Flow Record: USGS Gage 06891810 on Stranger Creek near Potter (Period of Record:10/1/2003-
6/9/2015) and USGS Gage 06892000 on Stranger Creek near Tonganoxie (Period of Record: 1/1/1990-
12/31/2016) and were utilized to establish flow conditions in the watershed.
Flow Conditions: Flow conditions were established based on USGS gage 06891810, with adjustments
being made based on the watershed size at the sampling station. The flow record for the sampling years
when the USGS gage 06891810 was not active (01/1991-10/2003 and 07/2015-10/2015) is based on
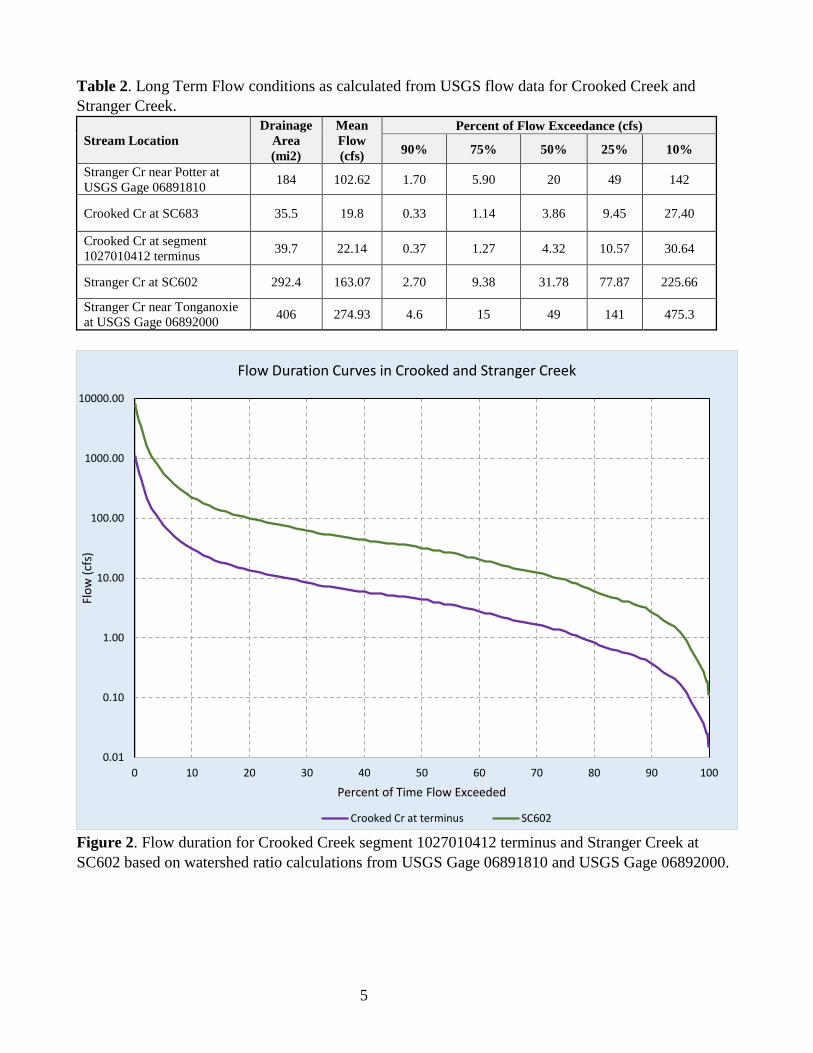
estimates from the USGS Gage 06892000. Long term flow conditions as calculated from USGS flow
data for the period of record from 06891810 (1991-2015) and USGS Gages 06892000 (1990-2016) on
Stranger Creek is shown in Table 2. The flow duration curve covering the period of record from 1990-
2016 are illustrated for Crooked Creek and Stranger Creek at KDHE sampling stations SC683 and
SC602, respectively, in Figure 2. Table 3 displays the USGS estimates of flow duration, mean flow, 2-
year peak discharge value for the main stem and tributary segments in the watershed (Perry et al., 2004).
5
Table 2. Long Term Flow conditions as calculated from USGS flow data for Crooked Creek and
Stranger Creek.
Stream Location
Drainage
Area
(mi2)
Mean
Flow
(cfs)
Percent of Flow Exceedance (cfs)
90% 75% 50% 25% 10%
Stranger Cr near Potter at
USGS Gage 06891810 184 102.62 1.70 5.90 20 49 142
Crooked Cr at SC683 35.5 19.8 0.33 1.14 3.86 9.45 27.40
Crooked Cr at segment
1027010412 terminus 39.7 22.14 0.37 1.27 4.32 10.57 30.64
Stranger Cr at SC602 292.4 163.07 2.70 9.38 31.78 77.87 225.66
Stranger Cr near Tonganoxie
at USGS Gage 06892000 406 274.93 4.6 15 49 141 475.3
Figure 2. Flow duration for Crooked Creek segment 1027010412 terminus and Stranger Creek at
SC602 based on watershed ratio calculations from USGS Gage 06891810 and USGS Gage 06892000.
0.01
0.10
1.00
10.00
100.00
1000.00
10000.00
0 10 20 30 40 50 60 70 80 90 100
Flo
w (
cfs)
Percent of Time Flow Exceeded
Flow Duration Curves in Crooked and Stranger Creek
Crooked Cr at terminus SC602
6
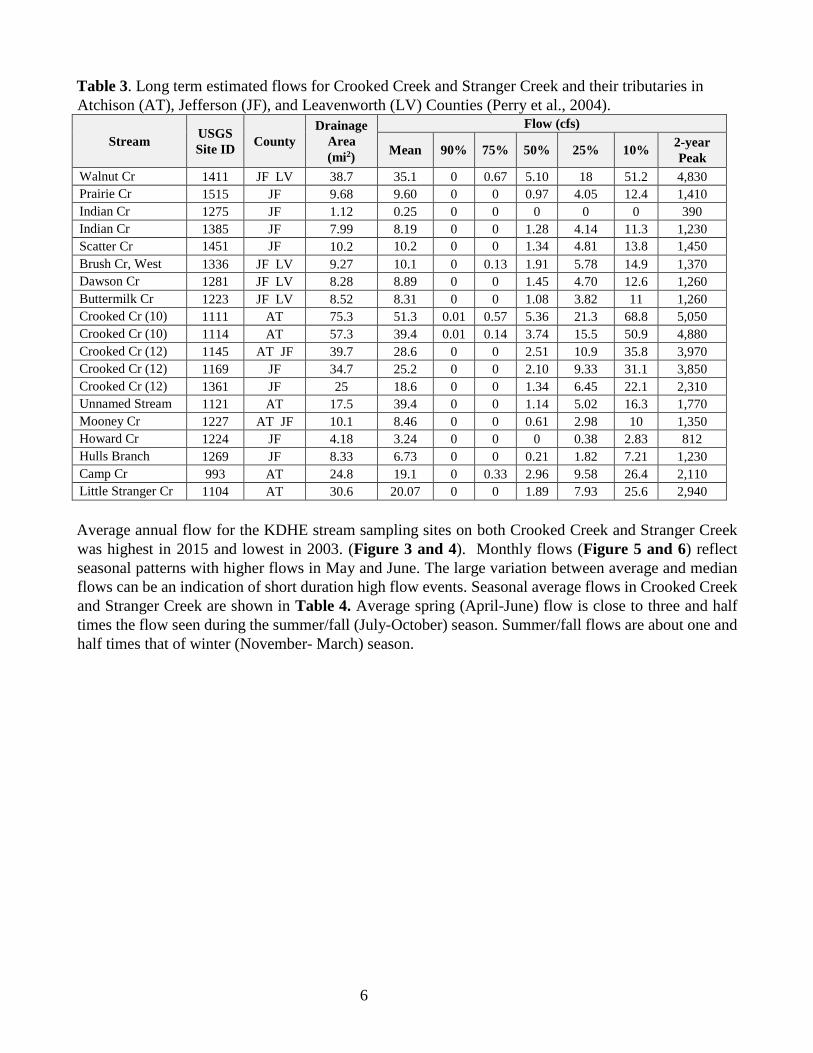
Table 3. Long term estimated flows for Crooked Creek and Stranger Creek and their tributaries in
Atchison (AT), Jefferson (JF), and Leavenworth (LV) Counties (Perry et al., 2004).
Stream USGS
Site ID County
Drainage
Area
(mi2)
Flow (cfs)
Mean 90% 75% 50% 25% 10% 2-year
Peak
Walnut Cr 1411 JF LV 38.7 35.1 0 0.67 5.10 18 51.2 4,830
Prairie Cr 1515 JF 9.68 9.60 0 0 0.97 4.05 12.4 1,410
Indian Cr 1275 JF 1.12 0.25 0 0 0 0 0 390
Indian Cr 1385 JF 7.99 8.19 0 0 1.28 4.14 11.3 1,230
Scatter Cr 1451 JF 10.2 10.2 0 0 1.34 4.81 13.8 1,450
Brush Cr, West 1336 JF LV 9.27 10.1 0 0.13 1.91 5.78 14.9 1,370
Dawson Cr 1281 JF LV 8.28 8.89 0 0 1.45 4.70 12.6 1,260
Buttermilk Cr 1223 JF LV 8.52 8.31 0 0 1.08 3.82 11 1,260
Crooked Cr (10) 1111 AT 75.3 51.3 0.01 0.57 5.36 21.3 68.8 5,050
Crooked Cr (10) 1114 AT 57.3 39.4 0.01 0.14 3.74 15.5 50.9 4,880
Crooked Cr (12) 1145 AT JF 39.7 28.6 0 0 2.51 10.9 35.8 3,970
Crooked Cr (12) 1169 JF 34.7 25.2 0 0 2.10 9.33 31.1 3,850
Crooked Cr (12) 1361 JF 25 18.6 0 0 1.34 6.45 22.1 2,310
Unnamed Stream 1121 AT 17.5 39.4 0 0 1.14 5.02 16.3 1,770
Mooney Cr 1227 AT JF 10.1 8.46 0 0 0.61 2.98 10 1,350
Howard Cr 1224 JF 4.18 3.24 0 0 0 0.38 2.83 812
Hulls Branch 1269 JF 8.33 6.73 0 0 0.21 1.82 7.21 1,230
Camp Cr 993 AT 24.8 19.1 0 0.33 2.96 9.58 26.4 2,110
Little Stranger Cr 1104 AT 30.6 20.07 0 0 1.89 7.93 25.6 2,940
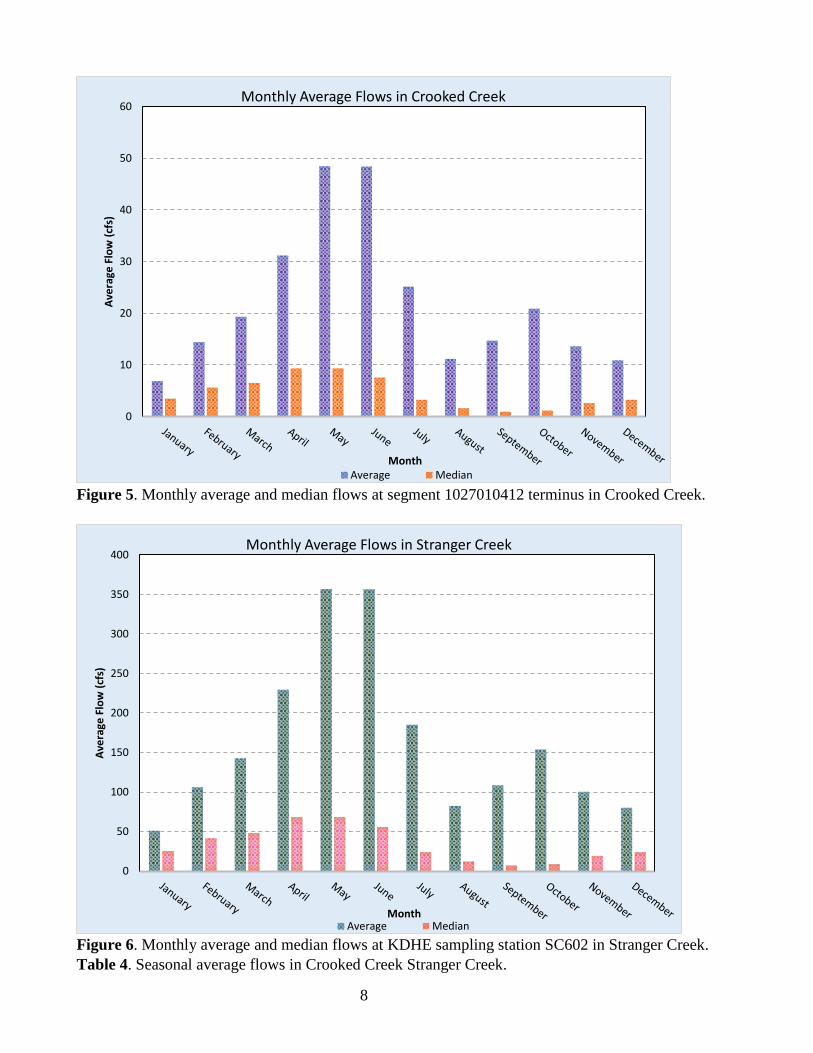
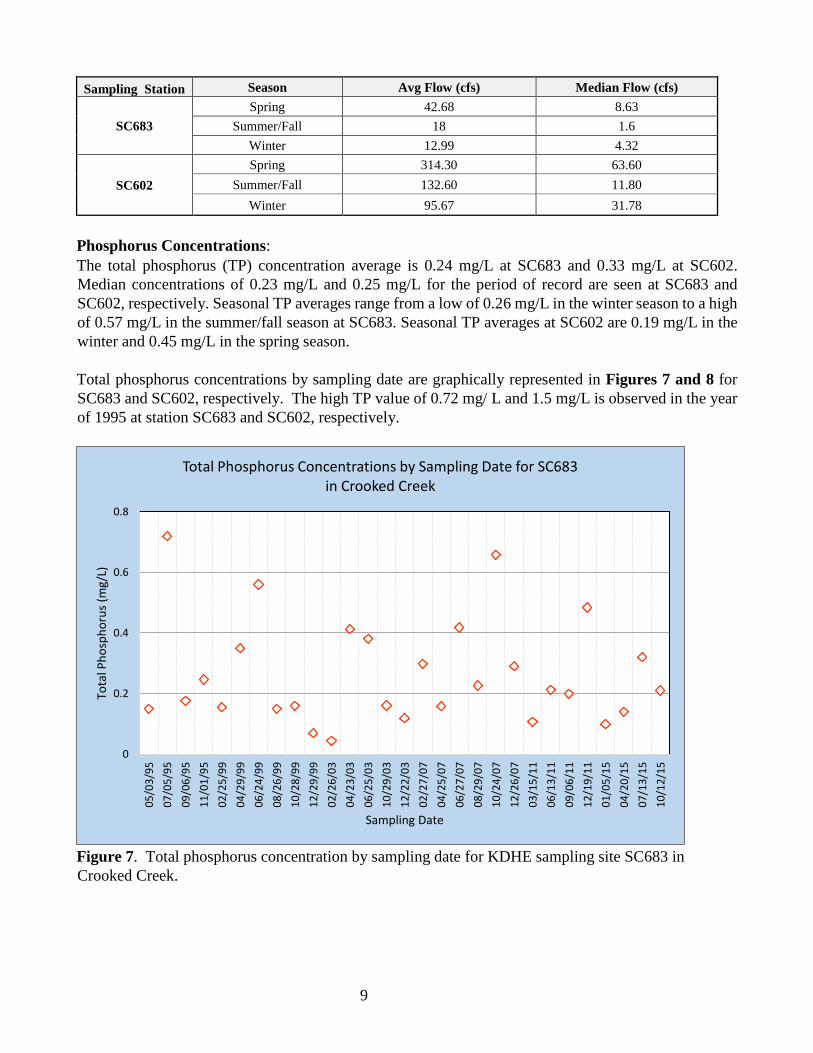
Average annual flow for the KDHE stream sampling sites on both Crooked Creek and Stranger Creek
was highest in 2015 and lowest in 2003. (Figure 3 and 4). Monthly flows (Figure 5 and 6) reflect
seasonal patterns with higher flows in May and June. The large variation between average and median
flows can be an indication of short duration high flow events. Seasonal average flows in Crooked Creek
and Stranger Creek are shown in Table 4. Average spring (April-June) flow is close to three and half
times the flow seen during the summer/fall (July-October) season. Summer/fall flows are about one and
half times that of winter (November- March) season.

7
Figure 3. Annual average and median flows at 1027010412 segment terminus in Crooked Creek.
Figure 4. Annual average and median flows at KDHE sampling station SC602 in Stranger Creek.
0
10
20
30
40
50
60A
vera
ge F
low
(cf
s)
Year
Annual Average Flows in Crooked Creek
Annual Average Annual Median Period of Record Average
0
50
100
150
200
250
300
350
400
450
Ave
rage
Flo
w (
cfs)
Year
Annual Average Flows in Stranger Creek
Annual Average Annual Median Period of Record Average
8
Figure 5. Monthly average and median flows at segment 1027010412 terminus in Crooked Creek.
Figure 6. Monthly average and median flows at KDHE sampling station SC602 in Stranger Creek.
Table 4. Seasonal average flows in Crooked Creek Stranger Creek.
0
10
20
30
40
50
60A
vera
ge F
low
(cf
s)
Month
Monthly Average Flows in Crooked Creek
Average Median
0
50
100
150
200
250
300
350
400
Ave
rage
Flo
w (
cfs)
Month
Monthly Average Flows in Stranger Creek
Average Median
9
Sampling Station Season Avg Flow (cfs) Median Flow (cfs)
SC683
Spring 42.68 8.63
Summer/Fall 18 1.6
Winter 12.99 4.32
SC602
Spring 314.30 63.60
Summer/Fall 132.60 11.80
Winter 95.67 31.78
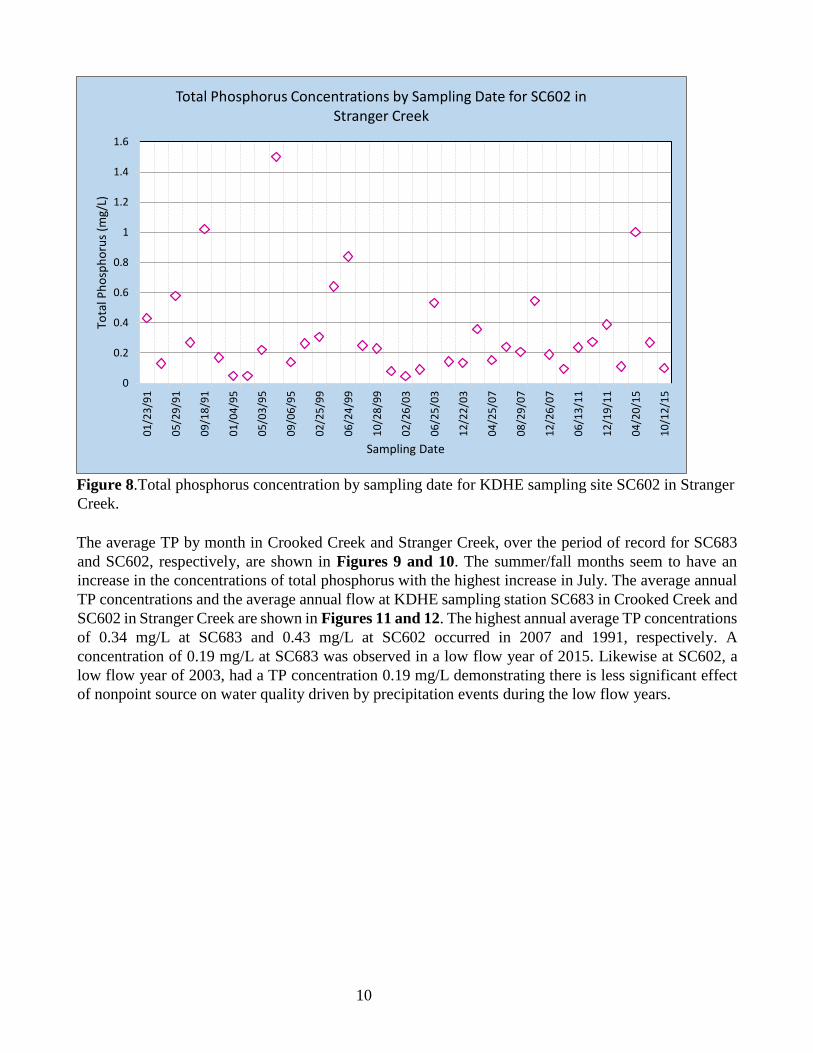
Phosphorus Concentrations:
The total phosphorus (TP) concentration average is 0.24 mg/L at SC683 and 0.33 mg/L at SC602.
Median concentrations of 0.23 mg/L and 0.25 mg/L for the period of record are seen at SC683 and
SC602, respectively. Seasonal TP averages range from a low of 0.26 mg/L in the winter season to a high
of 0.57 mg/L in the summer/fall season at SC683. Seasonal TP averages at SC602 are 0.19 mg/L in the
winter and 0.45 mg/L in the spring season.
Total phosphorus concentrations by sampling date are graphically represented in Figures 7 and 8 for
SC683 and SC602, respectively. The high TP value of 0.72 mg/ L and 1.5 mg/L is observed in the year
of 1995 at station SC683 and SC602, respectively.
Figure 7. Total phosphorus concentration by sampling date for KDHE sampling site SC683 in
Crooked Creek.
0
0.2
0.4
0.6
0.8
05
/03
/95
07
/05
/95
09
/06
/95
11
/01
/95
02
/25
/99
04
/29
/99
06
/24
/99
08
/26
/99
10
/28
/99
12
/29
/99
02
/26
/03
04
/23
/03
06
/25
/03
10
/29
/03
12
/22
/03
02
/27
/07
04
/25
/07
06
/27
/07
08
/29
/07
10
/24
/07
12
/26
/07
03
/15
/11
06
/13
/11
09
/06
/11
12
/19
/11
01
/05
/15
04
/20
/15
07
/13
/15
10
/12
/15
Tota
l Ph
osp
ho
rus
(mg/
L)
Sampling Date
Total Phosphorus Concentrations by Sampling Date for SC683 in Crooked Creek
10
Figure 8.Total phosphorus concentration by sampling date for KDHE sampling site SC602 in Stranger
Creek.
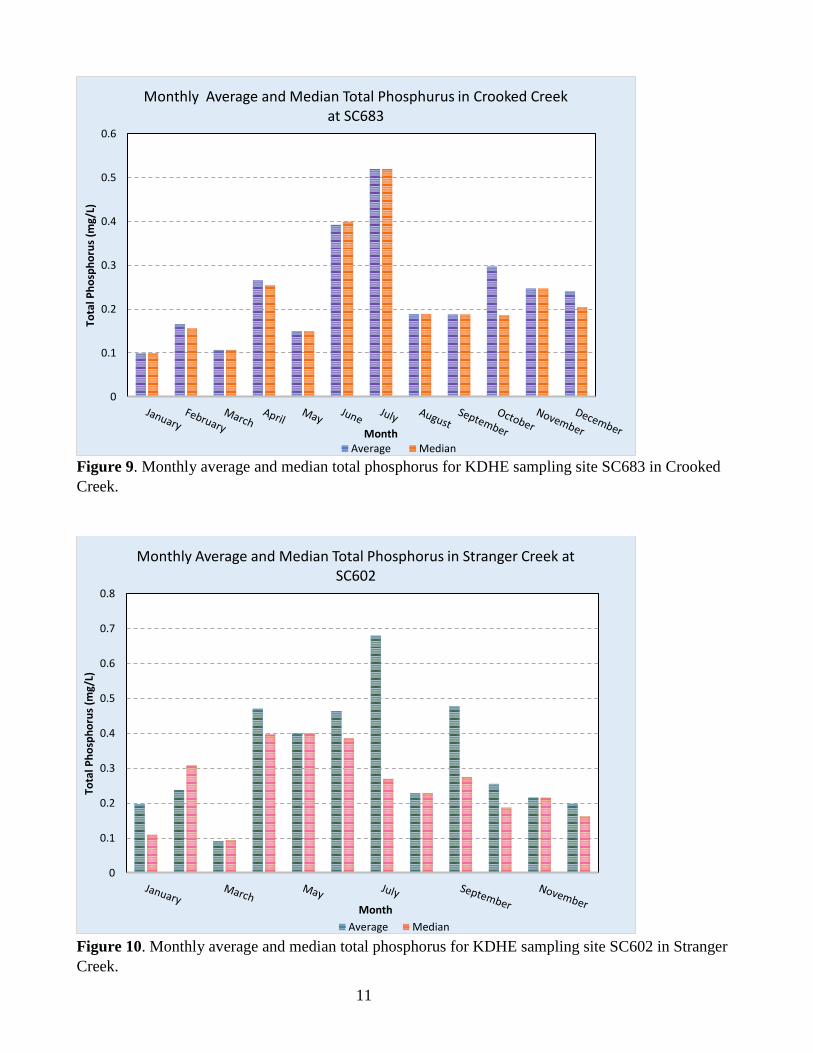
The average TP by month in Crooked Creek and Stranger Creek, over the period of record for SC683
and SC602, respectively, are shown in Figures 9 and 10. The summer/fall months seem to have an
increase in the concentrations of total phosphorus with the highest increase in July. The average annual
TP concentrations and the average annual flow at KDHE sampling station SC683 in Crooked Creek and
SC602 in Stranger Creek are shown in Figures 11 and 12. The highest annual average TP concentrations
of 0.34 mg/L at SC683 and 0.43 mg/L at SC602 occurred in 2007 and 1991, respectively. A
concentration of 0.19 mg/L at SC683 was observed in a low flow year of 2015. Likewise at SC602, a
low flow year of 2003, had a TP concentration 0.19 mg/L demonstrating there is less significant effect
of nonpoint source on water quality driven by precipitation events during the low flow years.
0
0.2
0.4
0.6
0.8
1
1.2
1.4
1.60
1/2
3/9
1
05
/29
/91
09
/18
/91
01
/04
/95
05
/03
/95
09
/06
/95
02
/25
/99
06
/24
/99
10
/28
/99
02
/26
/03
06
/25
/03
12
/22
/03
04
/25
/07
08
/29
/07
12
/26
/07
06
/13
/11
12
/19
/11
04
/20
/15
10
/12
/15
Tota
l Ph
osp
ho
rus
(mg/
L)
Sampling Date
Total Phosphorus Concentrations by Sampling Date for SC602 in Stranger Creek
11
Figure 9. Monthly average and median total phosphorus for KDHE sampling site SC683 in Crooked
Creek.
Figure 10. Monthly average and median total phosphorus for KDHE sampling site SC602 in Stranger
Creek.
0
0.1
0.2
0.3
0.4
0.5
0.6
Tota
l Ph
osp
ho
rus
(mg/
L)
Month
Monthly Average and Median Total Phosphurus in Crooked Creek at SC683
Average Median
0
0.1
0.2
0.3
0.4
0.5
0.6
0.7
0.8
Tota
l Ph
osp
ho
rus
(mg/
L)
Month
Monthly Average and Median Total Phosphorus in Stranger Creek at SC602
Average Median

12
Figure 11. Annual average and median total phosphorus for KDHE sampling site SC683 in Crooked
Creek.
Figure 12. Annual average and median total phosphorus for KDHE sampling site SC602 in Stranger
Creek.
0
5
10
15
20
25
30
35
40
45
50
1995 1999 2003 2007 2011 2015
0
0.05
0.1
0.15
0.2
0.25
0.3
0.35
0.4
Ave
rage
An
nu
al F
low
(cf
s)
Year
Tota
l Ph
osp
ho
rus
(mg/
L)Annual Average Total Phosphorus in Crooked Creek at SC683
Average TP Average Annual Flow
0
50
100
150
200
250
300
350
400
1991 1995 1999 2003 2007 2011 2015
0
0.05
0.1
0.15
0.2
0.25
0.3
0.35
0.4
0.45
0.5
Ave
rage
An
nu
al F
low
(cf
s)
Year
Tota
l Ph
osp
ho
rus
(mg/
L)
Annual Average Total Phosphorus in Stranger Creek at SC602
Average TP Average Annual Flow
13
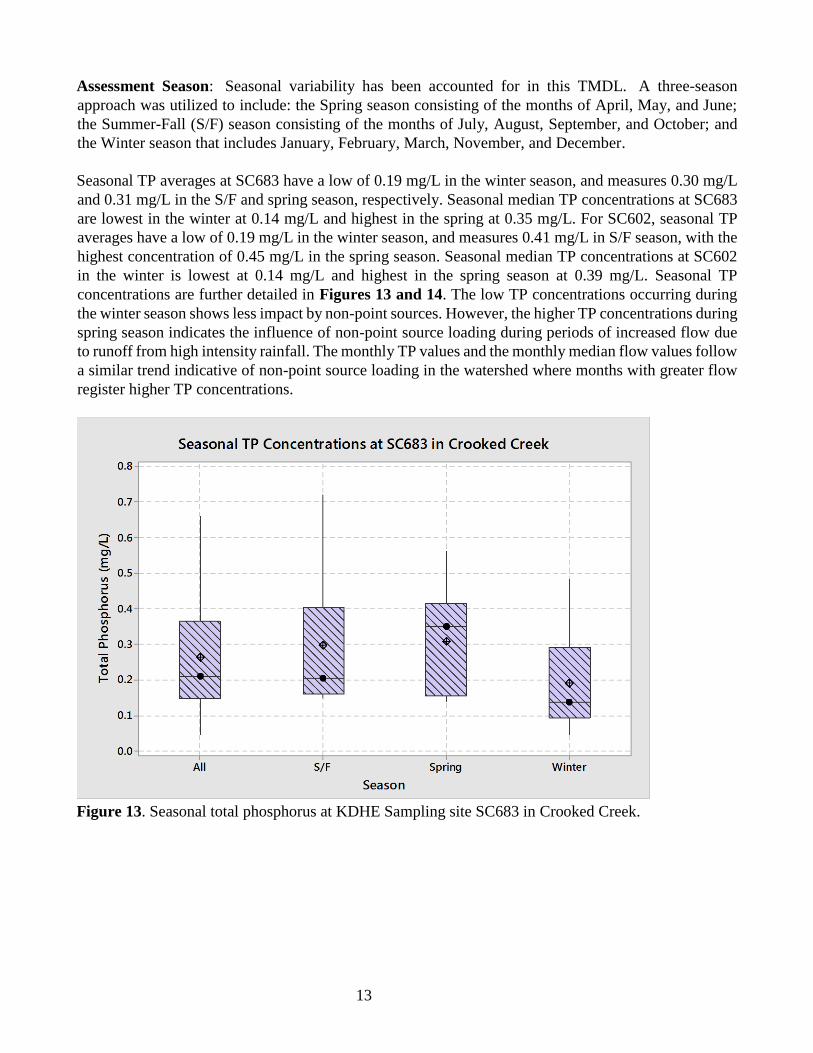
Assessment Season: Seasonal variability has been accounted for in this TMDL. A three-season
approach was utilized to include: the Spring season consisting of the months of April, May, and June;
the Summer-Fall (S/F) season consisting of the months of July, August, September, and October; and
the Winter season that includes January, February, March, November, and December.
Seasonal TP averages at SC683 have a low of 0.19 mg/L in the winter season, and measures 0.30 mg/L
and 0.31 mg/L in the S/F and spring season, respectively. Seasonal median TP concentrations at SC683
are lowest in the winter at 0.14 mg/L and highest in the spring at 0.35 mg/L. For SC602, seasonal TP
averages have a low of 0.19 mg/L in the winter season, and measures 0.41 mg/L in S/F season, with the
highest concentration of 0.45 mg/L in the spring season. Seasonal median TP concentrations at SC602
in the winter is lowest at 0.14 mg/L and highest in the spring season at 0.39 mg/L. Seasonal TP
concentrations are further detailed in Figures 13 and 14. The low TP concentrations occurring during
the winter season shows less impact by non-point sources. However, the higher TP concentrations during
spring season indicates the influence of non-point source loading during periods of increased flow due
to runoff from high intensity rainfall. The monthly TP values and the monthly median flow values follow
a similar trend indicative of non-point source loading in the watershed where months with greater flow
register higher TP concentrations.
Figure 13. Seasonal total phosphorus at KDHE Sampling site SC683 in Crooked Creek.

14
Figure 14. Seasonal total phosphorus at KDHE Sampling site SC602 in Stranger Creek.
Total phosphorus concentrations versus the percent flow exceedance for the KDHE stream-sampling
sites (SC683 and SC602) are shown in Figures 15 and 16. Phosphorus concentrations increase with
increasing flow. The spring season with high to moderate flows shows higher concentrations of TP.
Similarly, some of the high flows in S/F also yield high concentrations of TP. This indicates loading is
occurring during precipitation events when it is likely that runoff from grazing lands and fertilized
cropland in the watershed is reaching the creeks.

15
Figure 15. Total phosphorus concentration versus percent flow exceedance at SC683 on the day of
sampling.
Figure 16. Total phosphorus concentration versus percent flow exceedance at SC602 on the day of
sampling.
0
0.2
0.4
0.6
0.8
0 10 20 30 40 50 60 70 80 90 100
Tota
l Ph
osp
ho
rus
(mg/
L)
Percent Flow Exceedance
Total Phosphorus vs Percent Flow Exceedance in Crooked Creek at SC683
Spring S/F Winter
0
0.2
0.4
0.6
0.8
1
1.2
1.4
1.6
0 10 20 30 40 50 60 70 80 90 100
Tota
l Ph
osp
ho
rus
(mg/
L)
Percent Flow Exceedance
Total Phosphorus vs Percent Flow Exceedance in Stranger Creek at SC602
Spring S/F Winter

16
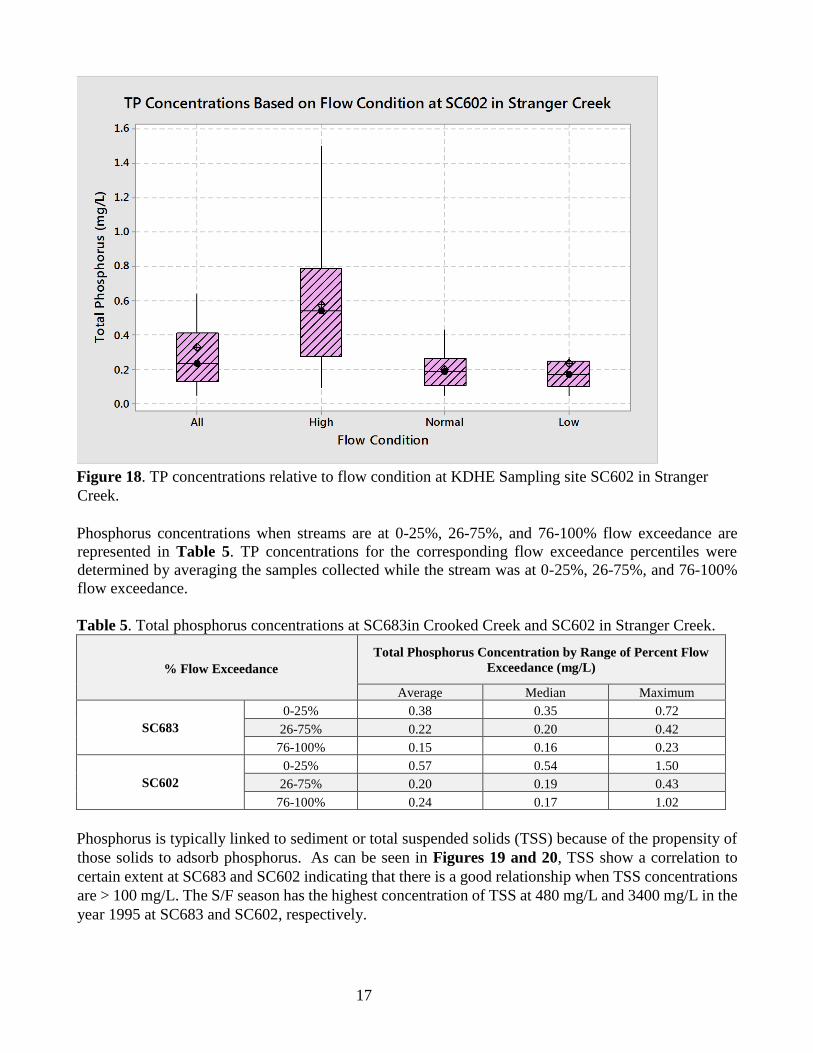
TP concentrations relative to the flow conditions were assessed and are detailed in Figures 17 and 18.
High flow samples were obtained when flow was 0-25% flow exceedance; normal flow samples
occurred when the stream was between 26-75% flow exceedance; and low flow samples included those
taken when the stream was at 76-100% flow exceedance. Phosphorus concentration averages based on
the three defined flow conditions are the highest during the high flow condition (0-25% flow exceedance)
with an average of 0.38 mg/L and 0.57 for SC683 and SC602, respectively. During normal flows (26-
75% flow exceedance) TP averages 0.22 mg/L (SC683) and 0.20 mg/L (SC602). During the low flow
condition (76-100% flow exceedance) TP averages 0.15 mg/L (SC683) and 0.24 mg/L (SC602). Median
TP concentrations for the normal and low flow conditions are 0.19 mg/L and 0.16 mg/L, and 0.19 mg/L
and 0.17 for SC683 and SC602, respectively. Median concentrations are the highest at 0.35 mg/L and
0.54 mg/L for SC683 and SC602, respectively, during the high flow condition.
Figure 17. TP concentrations relative to flow condition at KDHE Sampling site SC683 in Crooked
Creek
17
Figure 18. TP concentrations relative to flow condition at KDHE Sampling site SC602 in Stranger
Creek.
Phosphorus concentrations when streams are at 0-25%, 26-75%, and 76-100% flow exceedance are
represented in Table 5. TP concentrations for the corresponding flow exceedance percentiles were
determined by averaging the samples collected while the stream was at 0-25%, 26-75%, and 76-100%
flow exceedance.
Table 5. Total phosphorus concentrations at SC683in Crooked Creek and SC602 in Stranger Creek.
% Flow Exceedance
Total Phosphorus Concentration by Range of Percent Flow
Exceedance (mg/L)
Average Median Maximum
SC683
0-25% 0.38 0.35 0.72
26-75% 0.22 0.20 0.42
76-100% 0.15 0.16 0.23
SC602
0-25% 0.57 0.54 1.50
26-75% 0.20 0.19 0.43
76-100% 0.24 0.17 1.02
Phosphorus is typically linked to sediment or total suspended solids (TSS) because of the propensity of
those solids to adsorb phosphorus. As can be seen in Figures 19 and 20, TSS show a correlation to
certain extent at SC683 and SC602 indicating that there is a good relationship when TSS concentrations
are > 100 mg/L. The S/F season has the highest concentration of TSS at 480 mg/L and 3400 mg/L in the
year 1995 at SC683 and SC602, respectively.

18
Figure 19. Relationship of total suspended solids to total phosphorus in the sampling site SC683 in
Crooked Creek.
Figure 20. Relationship of total suspended solids to total phosphorus in the sampling site SC602 in
Stranger Creek.
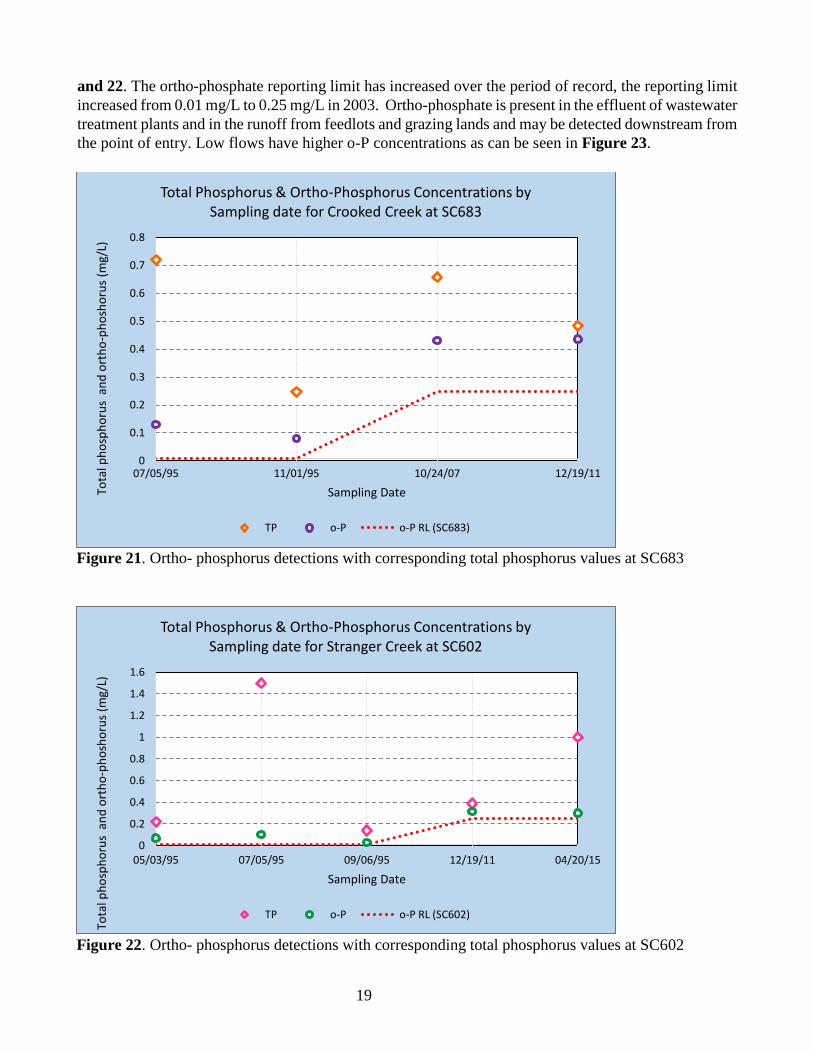
Levels of ortho-phosphate (o-P), the soluble portion of total phosphorus that is readily available for
biological uptake, together with the sample’s corresponding TP concentration can be seen in Figures 21
R² = 0.4684
0
0.1
0.2
0.3
0.4
0.5
0.6
0.7
0.8
1 10 100 1000
Tota
l Ph
osp
ho
rus
(mg/
L)
Total Suspended Solids (mg/L)
Total Suspended Solids vs Total Phosphorus in Crooked Creek at SC683
R² = 0.781
0
0.2
0.4
0.6
0.8
1
1.2
1.4
1.6
1.8
2
1 10 100 1000 10000
Tota
l Ph
osp
ho
rus
(mg/
L)
Total Suspended Solids (mg/L)
Total Suspended Solids vs Total Phosphorus in Stanger Creek at SC602
19
and 22. The ortho-phosphate reporting limit has increased over the period of record, the reporting limit
increased from 0.01 mg/L to 0.25 mg/L in 2003. Ortho-phosphate is present in the effluent of wastewater
treatment plants and in the runoff from feedlots and grazing lands and may be detected downstream from
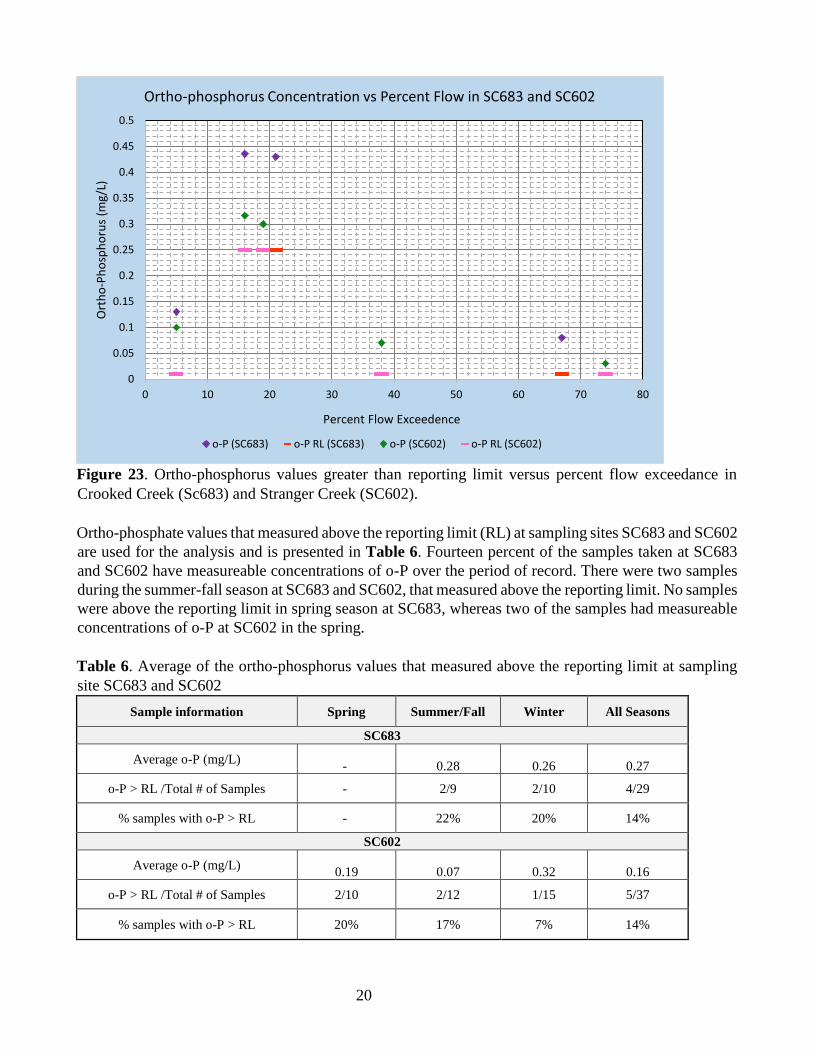
the point of entry. Low flows have higher o-P concentrations as can be seen in Figure 23.
Figure 21. Ortho- phosphorus detections with corresponding total phosphorus values at SC683
Figure 22. Ortho- phosphorus detections with corresponding total phosphorus values at SC602
0
0.1
0.2
0.3
0.4
0.5
0.6
0.7
0.8
07/05/95 11/01/95 10/24/07 12/19/11
Tota
l ph
osp
ho
rus
an
d o
rth
o-p
ho
sho
rus
(mg/
L)
Sampling Date
Total Phosphorus & Ortho-Phosphorus Concentrations by Sampling date for Crooked Creek at SC683
TP o-P o-P RL (SC683)
0
0.2
0.4
0.6
0.8
1
1.2
1.4
1.6
05/03/95 07/05/95 09/06/95 12/19/11 04/20/15
Tota
l ph
osp
ho
rus
an
d o
rth
o-p
ho
sho
rus
(mg/
L)
Sampling Date
Total Phosphorus & Ortho-Phosphorus Concentrations by Sampling date for Stranger Creek at SC602
TP o-P o-P RL (SC602)
20
Figure 23. Ortho-phosphorus values greater than reporting limit versus percent flow exceedance in
Crooked Creek (Sc683) and Stranger Creek (SC602).
Ortho-phosphate values that measured above the reporting limit (RL) at sampling sites SC683 and SC602
are used for the analysis and is presented in Table 6. Fourteen percent of the samples taken at SC683
and SC602 have measureable concentrations of o-P over the period of record. There were two samples
during the summer-fall season at SC683 and SC602, that measured above the reporting limit. No samples
were above the reporting limit in spring season at SC683, whereas two of the samples had measureable
concentrations of o-P at SC602 in the spring.
Table 6. Average of the ortho-phosphorus values that measured above the reporting limit at sampling
site SC683 and SC602
Sample information Spring Summer/Fall Winter All Seasons
SC683
Average o-P (mg/L) - 0.28 0.26 0.27
o-P > RL /Total # of Samples - 2/9 2/10 4/29
% samples with o-P > RL - 22% 20% 14%
SC602
Average o-P (mg/L) 0.19 0.07 0.32 0.16
o-P > RL /Total # of Samples 2/10 2/12 1/15 5/37
% samples with o-P > RL 20% 17% 7% 14%
0
0.05
0.1
0.15
0.2
0.25
0.3
0.35
0.4
0.45
0.5
0 10 20 30 40 50 60 70 80
Ort
ho
-Ph
osp
ho
rus
(mg/
L)
Percent Flow Exceedence
Ortho-phosphorus Concentration vs Percent Flow in SC683 and SC602
o-P (SC683) o-P RL (SC683) o-P (SC602) o-P RL (SC602)
21
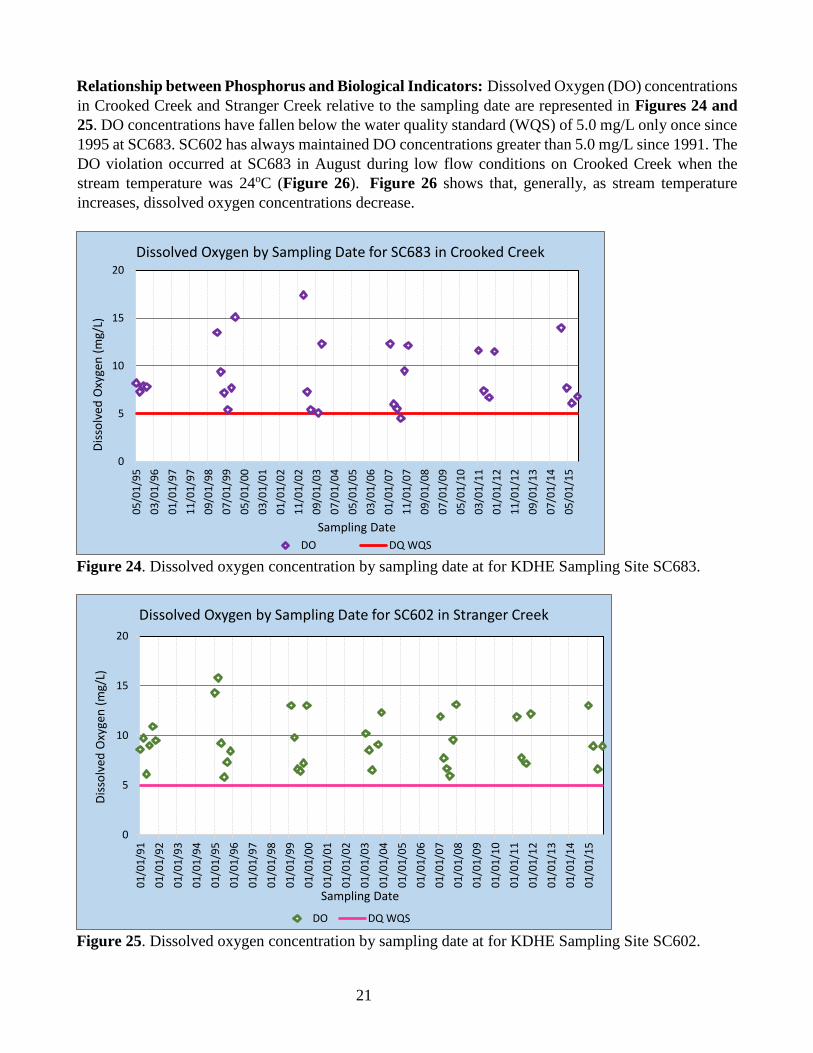
Relationship between Phosphorus and Biological Indicators: Dissolved Oxygen (DO) concentrations
in Crooked Creek and Stranger Creek relative to the sampling date are represented in Figures 24 and
25. DO concentrations have fallen below the water quality standard (WQS) of 5.0 mg/L only once since
1995 at SC683. SC602 has always maintained DO concentrations greater than 5.0 mg/L since 1991. The
DO violation occurred at SC683 in August during low flow conditions on Crooked Creek when the
stream temperature was 24oC (Figure 26). Figure 26 shows that, generally, as stream temperature
increases, dissolved oxygen concentrations decrease.
Figure 24. Dissolved oxygen concentration by sampling date at for KDHE Sampling Site SC683.
Figure 25. Dissolved oxygen concentration by sampling date at for KDHE Sampling Site SC602.
0
5
10
15
20
05
/01
/95
03
/01
/96
01
/01
/97
11
/01
/97
09
/01
/98
07
/01
/99
05
/01
/00
03
/01
/01
01
/01
/02
11
/01
/02
09
/01
/03
07
/01
/04
05
/01
/05
03
/01
/06
01
/01
/07
11
/01
/07
09
/01
/08
07
/01
/09
05
/01
/10
03
/01
/11
01
/01
/12
11
/01
/12
09
/01
/13
07
/01
/14
05
/01
/15
Dis
solv
ed O
xyge
n (
mg/
L)
Sampling Date
Dissolved Oxygen by Sampling Date for SC683 in Crooked Creek
DO DQ WQS
0
5
10
15
20
01
/01
/91
01
/01
/92
01
/01
/93
01
/01
/94
01
/01
/95
01
/01
/96
01
/01
/97
01
/01
/98
01
/01
/99
01
/01
/00
01
/01
/01
01
/01
/02
01
/01
/03
01
/01
/04
01
/01
/05
01
/01
/06
01
/01
/07
01
/01
/08
01
/01
/09
01
/01
/10
01
/01
/11
01
/01
/12
01
/01
/13
01
/01
/14
01
/01
/15
Dis
solv
ed O
xyge
n (
mg/
L)
Sampling Date
Dissolved Oxygen by Sampling Date for SC602 in Stranger Creek
DO DQ WQS

22
Figure 26. Stream temperature versus dissolved oxygen at SC683
The narrative criteria of the Kansas Surface Water Quality Standards are based on conditions of the
prevailing biological community. Excessive primary productivity may be indicated by extreme swings
in dissolved oxygen or pH as the chemical reaction of photosynthesis and respiration alter the ambient
levels of oxygen or acid-base balance of the stream. Dissolved oxygen is inversely related to the ambient
temperature in the stream at SC683 and SC602 as displayed in Figures 27 and 28. It should be noted
that samples collected prior to April 2003 were primarily collected in the afternoon hours, whereas
samples collected later are in the morning hours.
Figure 27. Dissolved Oxygen and Temperature by Sampling Date in Crooked Creek at SC683
0
2.5
5
7.5
10
12.5
15
17.5
20
0 5 10 15 20 25 30
Dis
solv
ed O
xyge
n (
mg/
L)
Temperature (Degree Celsius)
Dissolved Oxygen Concentrations vs Stream Temperature in Crooked Creek at SC683
Spring Summer-Fall Winter DO WQS
0
5
10
15
20
25
30
05
/03
/95
07
/05
/95
09
/06
/95
11
/01
/95
02
/25
/99
04
/29
/99
06
/24
/99
08
/26
/99
10
/28
/99
12
/29
/99
02
/26
/03
04
/23
/03
06
/25
/03
10
/29
/03
12
/22
/03
02
/27
/07
04
/25
/07
06
/27
/07
08
/29
/07
10
/24
/07
12
/26
/07
03
/15
/11
06
/13
/11
09
/06
/11
12
/19
/11
01
/05
/15
04
/20
/15
07
/13
/15
10
/12
/15
Dis
solv
ed O
xyge
n (
mg/
L) a
nd
Tem
per
atu
re (
OC
)
Sampling Date
Dissolved Oxygen and Temperature by Sampling Date in Crooked Creek at SC683
DO DO WQS Temp Linear (DO) Linear (Temp)

23
Figure 28. Dissolved Oxygen and Temperature by Sampling Date in Stranger Creek at SC602
To discount the impacts of temperature on the solubility of oxygen in the water column, the percent of
saturated dissolved oxygen was computed from the data collected at the stations in Crooked Creek and
Stranger Creek. A seasonal pattern remained with a high percentage of dissolved oxygen saturation seen
during cooler months while declines in percent saturation are associated with summer months. On
average, pH values are consistent over the seasons while DO, temperature and oxygen saturation show
an expected seasonal pattern with lowest average DO and oxygen saturation coinciding with the highest
average temperature of the summer-fall season in SC683. At SC602 both the lowest DO and the lowest
oxygen saturation are observed at the spring (Table 7). The relationship between temperature and
percent oxygen saturation for SC683 and SC602 under low flow conditions are represented in Figures
29 and 30. The positive relationship at low flow at SC602 may indicate increased primary productivity
stemming from increased contribution of nutrients during low flow.
Table 7. Average DO, temperature, % DO saturation, and pH samples at KDHE sampling site SC683
in Crooked Creek and SC602 in Stranger Creek. Parameter Spring Summer-Fall Winter All Seasons
SC683
Number of Samples 9.00 10.00 10.00 29.00
Dissolved Oxygen (mg/L) 7.12 6.71 12.77 8.93
Temperature (oC) 18.78 18.80 4.00 13.69
Oxygen Saturation (%) 76% 71% 97% 81%
pH 7.62 7.64 7.61 7.62
SC602
Number of Samples 10.00 12.00 15.00 37.00
Dissolved Oxygen (mg/L) 7.77 7.82 11.79 9.42
Temperature (oC) 19.30 20.82 4.07 13.42
Oxygen Saturation (%) 83% 85% 89% 86%
pH 7.67 7.86 7.80 7.78
0
5
10
15
20
25
30
350
1/2
3/9
1
05
/29
/91
09
/18
/91
01
/04
/95
05
/03
/95
09
/06
/95
02
/25
/99
06
/24
/99
10
/28
/99
02
/26
/03
06
/25
/03
12
/22
/03
04
/25
/07
08
/29
/07
12
/26
/07
06
/13
/11
12
/19
/11
04
/20
/15
10
/12
/15
Dis
solv
ed O
xyge
n (
mg/
L) a
nd
Tem
per
atu
re (
OC
)
Sampling Date
Dissolved Oxygen and Temperature by Sampling Date in Stranger Creek at SC602
DO DO WQS Temp Linear (DO) Linear (Temp)

24
Figure 29. Relationship between temperature and percent Saturation of Dissolved Oxygen at SC683
Figure 30. Relationship between temperature and percent Saturation of Dissolved Oxygen at SC602
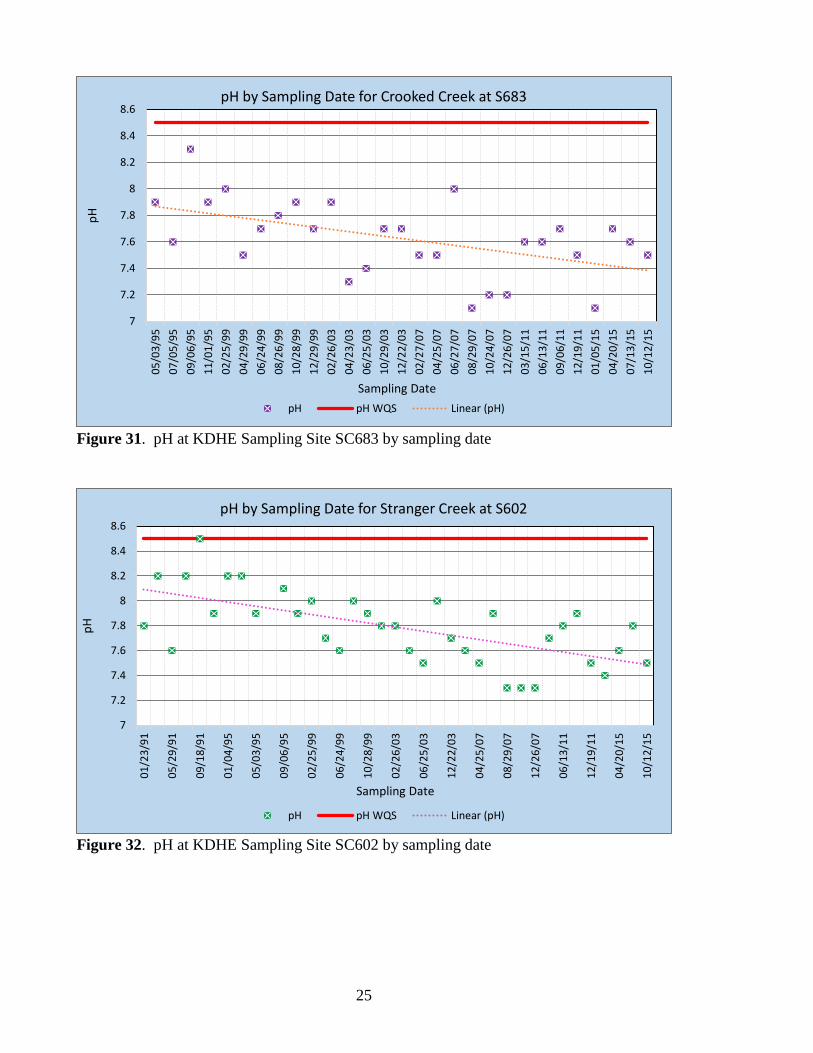
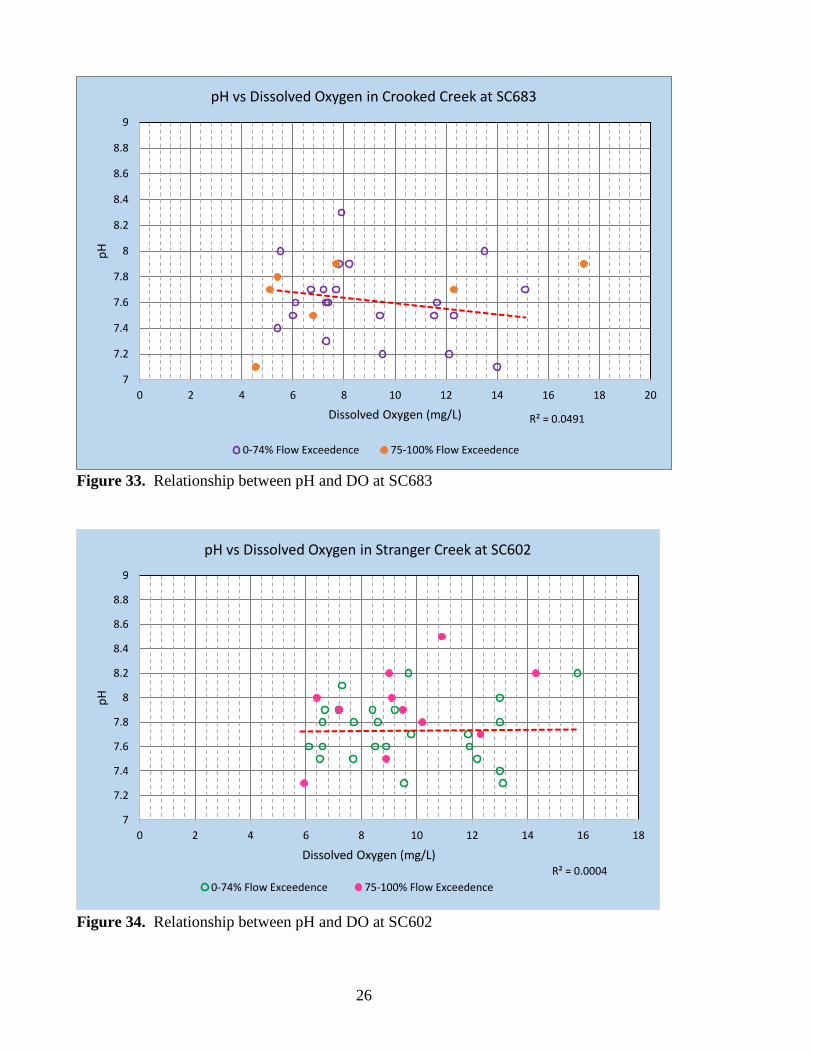
The pH observed at SC683 and SC602 by sampling date is graphically represented in Figures 31 and
32. pH has never exceeded the criterion of 8.5 at both the sampling stations and over the years the pH
has shown a decreasing trend. However, there is not a strong relationship between pH and dissolved
oxygen at SC683 and SC602 for the period of record (Figures 33 and 34). Higher pH values tend to
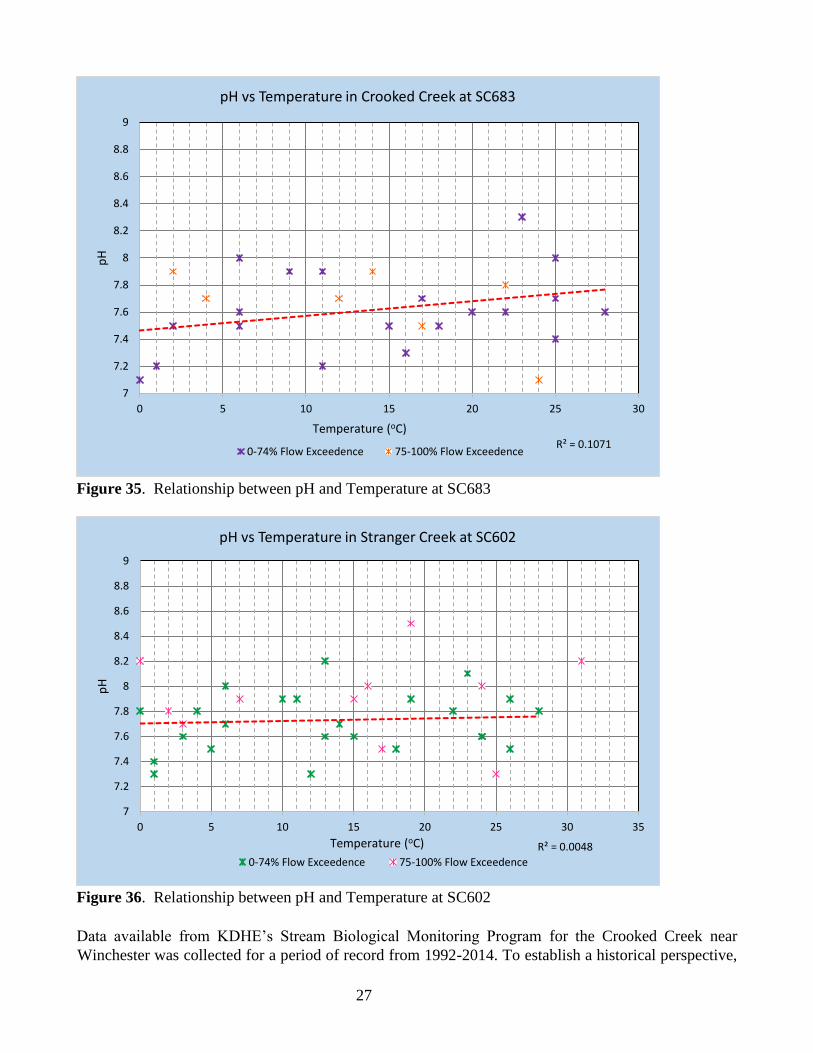
occur during periods when photosynthesis intensifies. Figures 35 and 36 shows the relationship between
pH and stream temperature at SC683 and SC602, respectively.
R² = 0.6303
0
5
10
15
20
25
30
0.00% 20.00% 40.00% 60.00% 80.00% 100.00% 120.00% 140.00%
Tem
per
atu
re (
OC
)
% Dissolved Oxygen (Saturation)
Temperature vs Dissolved Oxygen Saturation in Crooked Creek at SC683
0-74% Flow Exceedence 75-100% Flow Exceedence Linear (75-100% Flow Exceedence)
R² = 0.0694
0
5
10
15
20
25
30
35
0.00% 20.00% 40.00% 60.00% 80.00% 100.00% 120.00% 140.00%
Tem
per
atu
re (
OC
)
% Dissolved Oxygen (Saturation)
Temperature vs Dissolved Oxygen Saturation in Stranger Creek at SC602
0-74% Flow Exceedence 75-100% Flow Exceedence Linear (75-100% Flow Exceedence)
25
Figure 31. pH at KDHE Sampling Site SC683 by sampling date
Figure 32. pH at KDHE Sampling Site SC602 by sampling date
7
7.2
7.4
7.6
7.8
8
8.2
8.4
8.6
05
/03
/95
07
/05
/95
09
/06
/95
11
/01
/95
02
/25
/99
04
/29
/99
06
/24
/99
08
/26
/99
10
/28
/99
12
/29
/99
02
/26
/03
04
/23
/03
06
/25
/03
10
/29
/03
12
/22
/03
02
/27
/07
04
/25
/07
06
/27
/07
08
/29
/07
10
/24
/07
12
/26
/07
03
/15
/11
06
/13
/11
09
/06
/11
12
/19
/11
01
/05
/15
04
/20
/15
07
/13
/15
10
/12
/15
pH
Sampling Date
pH by Sampling Date for Crooked Creek at S683
pH pH WQS Linear (pH)
7
7.2
7.4
7.6
7.8
8
8.2
8.4
8.6
01
/23
/91
05
/29
/91
09
/18
/91
01
/04
/95
05
/03
/95
09
/06
/95
02
/25
/99
06
/24
/99
10
/28
/99
02
/26
/03
06
/25
/03
12
/22
/03
04
/25
/07
08
/29
/07
12
/26
/07
06
/13
/11
12
/19
/11
04
/20
/15
10
/12
/15
pH
Sampling Date
pH by Sampling Date for Stranger Creek at S602
pH pH WQS Linear (pH)
26
Figure 33. Relationship between pH and DO at SC683
Figure 34. Relationship between pH and DO at SC602
R² = 0.0491
7
7.2
7.4
7.6
7.8
8
8.2
8.4
8.6
8.8
9
0 2 4 6 8 10 12 14 16 18 20
pH
Dissolved Oxygen (mg/L)
pH vs Dissolved Oxygen in Crooked Creek at SC683
0-74% Flow Exceedence 75-100% Flow Exceedence
R² = 0.0004
7
7.2
7.4
7.6
7.8
8
8.2
8.4
8.6
8.8
9
0 2 4 6 8 10 12 14 16 18
pH
Dissolved Oxygen (mg/L)
pH vs Dissolved Oxygen in Stranger Creek at SC602
0-74% Flow Exceedence 75-100% Flow Exceedence
27
Figure 35. Relationship between pH and Temperature at SC683
Figure 36. Relationship between pH and Temperature at SC602
Data available from KDHE’s Stream Biological Monitoring Program for the Crooked Creek near
Winchester was collected for a period of record from 1992-2014. To establish a historical perspective,
R² = 0.1071
7
7.2
7.4
7.6
7.8
8
8.2
8.4
8.6
8.8
9
0 5 10 15 20 25 30
pH
Temperature (oC)
pH vs Temperature in Crooked Creek at SC683
0-74% Flow Exceedence 75-100% Flow Exceedence
R² = 0.0048
7
7.2
7.4
7.6
7.8
8
8.2
8.4
8.6
8.8
9
0 5 10 15 20 25 30 35
pH
Temperature (oC)
pH vs Temperature in Stranger Creek at SC602
0-74% Flow Exceedence 75-100% Flow Exceedence

28
the data was translated using the Aquatic Life Use Support Index (ALUS Index) as described in Kansas’
2016 303(d) Methodology. The ALUS Index consists of five categorizations of biotic condition that,
once measured, are assigned a score (Table 8). Scores are then tallied and a support category is assigned
according to Table 9.
1. Macroinvertebrate Biotic Index (MBI): A statistical measure that evaluates the effects of
nutrients and oxygen demanding substances on macroinvertebrates based on the relative
abundance of certain indicator taxa (orders and families).
2. Ephemeroptera, Plecoptera, and Trichoptera (EPT) abundance as a percentage of the total
abundance of macroinvertebrates.
3. Kansas Biotic Index for Nutrients (KBI-N): Mathematically equivalent to the MBI, however,
the tolerance values are species specific and restricted to aquatic insect orders.
4. EPT Percent of Count (EPT % CNT) – The percentage of organisms in a sample consisting
of individuals belonging to the EPT orders.
5. Shannon’s Evenness (SHN EVN) – A measure of diversity that describes how evenly
distributed the numbers of individuals are among the taxa in a sample.
Table 8. ALUS Index metrics with scoring ranges.
MBI KBI-N EPT EPT % CNT SHN EVN Score
<= 4.18 <= 2.52 >= 16 >= 65 >= 0.849 4
4.19-4.38 2.53-2.64 14-15 56-64 0.826-0.848 3
4.39-4.57 2.65-2.75 12-13 48-55 0.802-0.825 2
4.58-4.88 2.76-2.87 10-11 38-47 0.767-0.801 1
>= 4.89 >= 2.88 < = 9 <= 37 <= 0.766 0
Table 9. ALUS Index score range, interpretation of biotic condition, and supporting, partial, and no
supporting categories.
ALUS Index Score Biotic Condition Support Category
17-20 Very Good Supporting
14-16 Good
7-13 Fair Partially Supporting
4-6 Poor Non-supporting
1-3 Very Poor
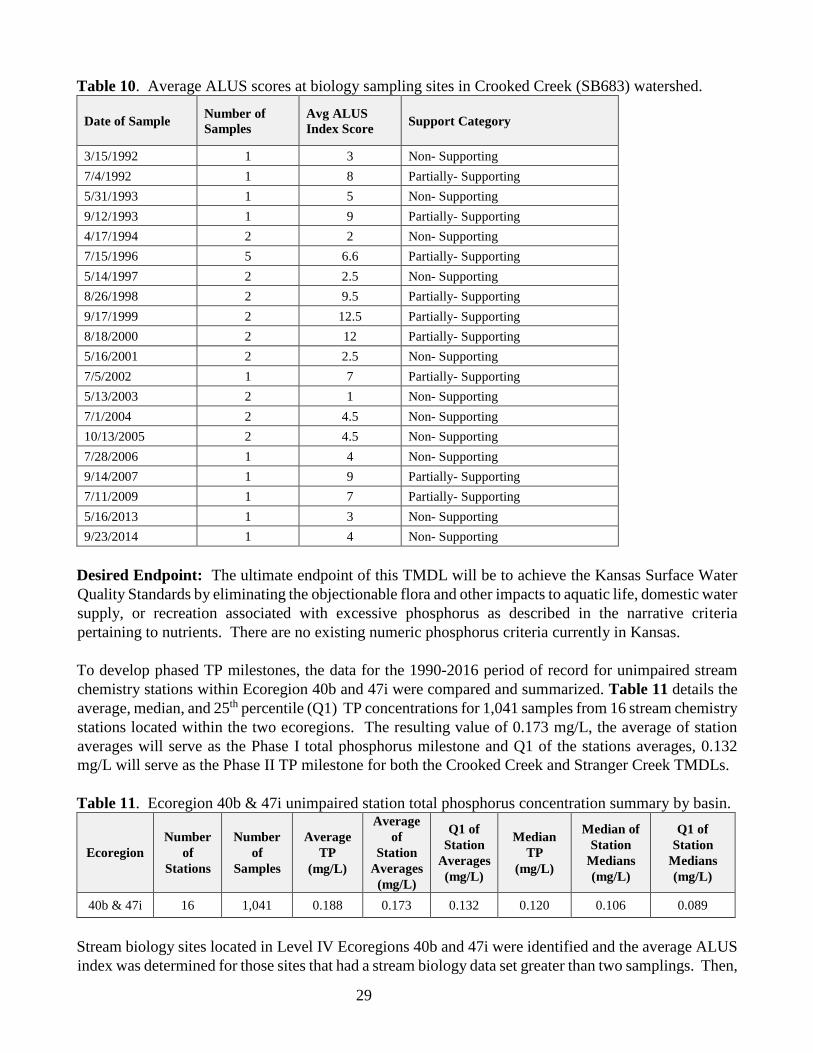
The data available is limited to two sampling events per year in most of the years during 1992-2005.
However, there is no data available for the year 1995 and 1996 has 5 samples. One sample per year was
collected in 2006, 2007, 2009, 2013 and 2014. The site SB683 is located on Crooked Creek near
Winchester. Biological data collected during 1992-2014 showed the biotic condition in Crooked Creek
was fair to very poor resulting in partially-supporting and non-supporting ALUS Index for the stream
(Table 10).
29
Table 10. Average ALUS scores at biology sampling sites in Crooked Creek (SB683) watershed.
Date of Sample Number of
Samples
Avg ALUS
Index Score Support Category
3/15/1992 1 3 Non- Supporting
7/4/1992 1 8 Partially- Supporting
5/31/1993 1 5 Non- Supporting
9/12/1993 1 9 Partially- Supporting
4/17/1994 2 2 Non- Supporting
7/15/1996 5 6.6 Partially- Supporting
5/14/1997 2 2.5 Non- Supporting
8/26/1998 2 9.5 Partially- Supporting
9/17/1999 2 12.5 Partially- Supporting
8/18/2000 2 12 Partially- Supporting
5/16/2001 2 2.5 Non- Supporting
7/5/2002 1 7 Partially- Supporting
5/13/2003 2 1 Non- Supporting
7/1/2004 2 4.5 Non- Supporting
10/13/2005 2 4.5 Non- Supporting
7/28/2006 1 4 Non- Supporting
9/14/2007 1 9 Partially- Supporting
7/11/2009 1 7 Partially- Supporting
5/16/2013 1 3 Non- Supporting
9/23/2014 1 4 Non- Supporting
Desired Endpoint: The ultimate endpoint of this TMDL will be to achieve the Kansas Surface Water
Quality Standards by eliminating the objectionable flora and other impacts to aquatic life, domestic water
supply, or recreation associated with excessive phosphorus as described in the narrative criteria
pertaining to nutrients. There are no existing numeric phosphorus criteria currently in Kansas.
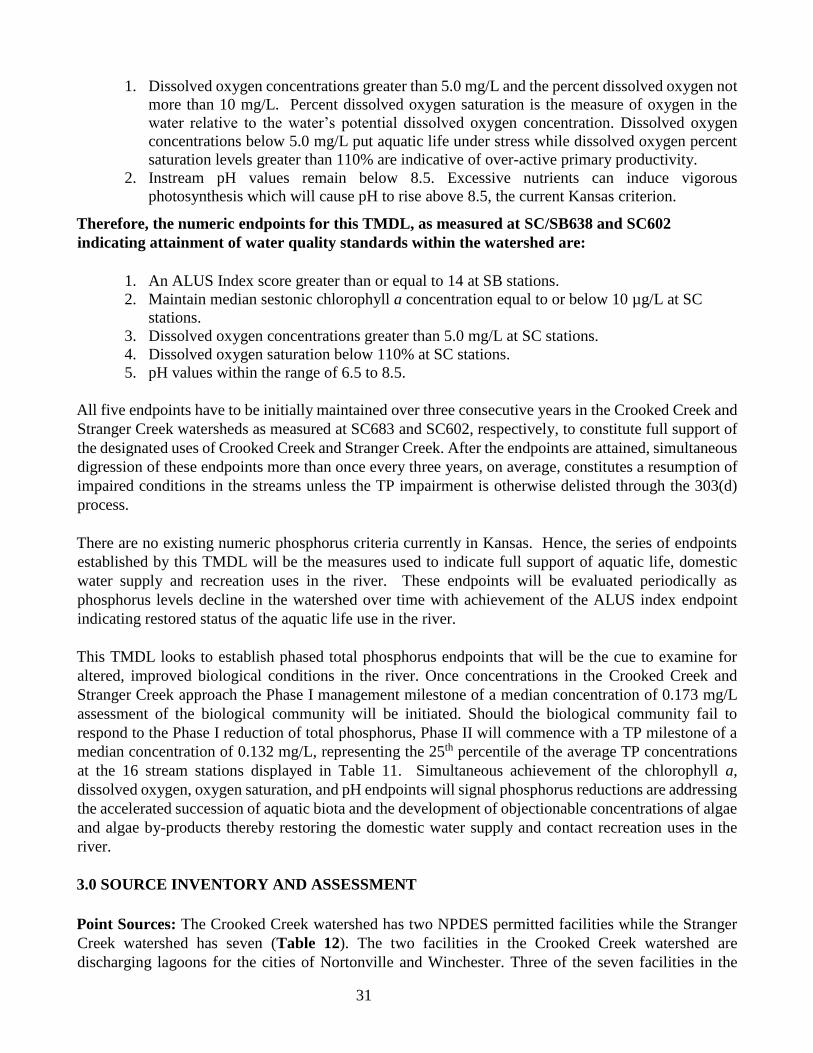
To develop phased TP milestones, the data for the 1990-2016 period of record for unimpaired stream
chemistry stations within Ecoregion 40b and 47i were compared and summarized. Table 11 details the
average, median, and 25th percentile (Q1) TP concentrations for 1,041 samples from 16 stream chemistry
stations located within the two ecoregions. The resulting value of 0.173 mg/L, the average of station
averages will serve as the Phase I total phosphorus milestone and Q1 of the stations averages, 0.132
mg/L will serve as the Phase II TP milestone for both the Crooked Creek and Stranger Creek TMDLs.
Table 11. Ecoregion 40b & 47i unimpaired station total phosphorus concentration summary by basin.
Ecoregion
Number
of
Stations
Number
of
Samples
Average
TP
(mg/L)
Average
of
Station
Averages
(mg/L)
Q1 of
Station
Averages
(mg/L)
Median
TP
(mg/L)
Median of
Station
Medians
(mg/L)
Q1 of
Station
Medians
(mg/L)
40b & 47i 16 1,041 0.188 0.173 0.132 0.120 0.106 0.089
Stream biology sites located in Level IV Ecoregions 40b and 47i were identified and the average ALUS
index was determined for those sites that had a stream biology data set greater than two samplings. Then,

30
the median total phosphorus concentration was determined for those biology sites that had a
corresponding total phosphorus data set at the stream biology site. The resulting plot (Figure 37) reveal
conditions of full support span total phosphorus levels of 0.04 to 0.19 mg/L. This data set comprises 253
biology sampling events and 1,714 total phosphorus values at 23 SB/SC stations. Figure 37 displays
that once total phosphorus concentrations are greater than about 0.2 mg/L, conditions of full support are
no longer observed.
Figure 37. Mean aquatic life use score (ALUS) versus the median total phosphorus for stream
chemistry/stream biology stations located in EPA Level IV Ecoregion 40b and 47i.
One of the complications in setting a total phosphorus milestone is establishing the linkage of phosphorus
levels to applicable biologic response variables. Although Figure 37 shows a somewhat noisy
relationship with phosphorus in the partially supporting range, there is a clear delineation below 0.2
mg/L total phosphorus where streams move into the fully supporting category. Hence, the Phase I total
phosphorus milestone for this TMDL will be a median value of 0.173 mg/L with the primary outcome
of reduced nutrient loading being improved ALUS Index scores. The primary outcome will be improved
ALUS Index scores resulting from reduced nutrient loading. The ALUS Index will serve to indicate if
the biological community in Crooked Creek and Stranger Creek reflects recovery, renewed diversity,
and minimal disruption by the impacts described in the narrative criteria for nutrients on aquatic life.
Additionally, the concentration of floating sestonic phytoplankton in the water column as determined by
measuring the sestonic chlorophyll a concentrations in the creeks will indicate if primary productivity
has moderated to reduce the impacts described in the narrative criteria for nutrients on aquatic life,
recreation, and domestic water supply along the reaches of Crooked Creek and Stranger Creek. Secondary indicators of the health of the in-stream biological community include:
31
1. Dissolved oxygen concentrations greater than 5.0 mg/L and the percent dissolved oxygen not
more than 10 mg/L. Percent dissolved oxygen saturation is the measure of oxygen in the
water relative to the water’s potential dissolved oxygen concentration. Dissolved oxygen
concentrations below 5.0 mg/L put aquatic life under stress while dissolved oxygen percent
saturation levels greater than 110% are indicative of over-active primary productivity.
2. Instream pH values remain below 8.5. Excessive nutrients can induce vigorous
photosynthesis which will cause pH to rise above 8.5, the current Kansas criterion. Therefore, the numeric endpoints for this TMDL, as measured at SC/SB638 and SC602
indicating attainment of water quality standards within the watershed are:
1. An ALUS Index score greater than or equal to 14 at SB stations.
2. Maintain median sestonic chlorophyll a concentration equal to or below 10 µg/L at SC
stations.
3. Dissolved oxygen concentrations greater than 5.0 mg/L at SC stations.
4. Dissolved oxygen saturation below 110% at SC stations.
5. pH values within the range of 6.5 to 8.5.
All five endpoints have to be initially maintained over three consecutive years in the Crooked Creek and
Stranger Creek watersheds as measured at SC683 and SC602, respectively, to constitute full support of
the designated uses of Crooked Creek and Stranger Creek. After the endpoints are attained, simultaneous
digression of these endpoints more than once every three years, on average, constitutes a resumption of
impaired conditions in the streams unless the TP impairment is otherwise delisted through the 303(d)
process.
There are no existing numeric phosphorus criteria currently in Kansas. Hence, the series of endpoints
established by this TMDL will be the measures used to indicate full support of aquatic life, domestic
water supply and recreation uses in the river. These endpoints will be evaluated periodically as
phosphorus levels decline in the watershed over time with achievement of the ALUS index endpoint
indicating restored status of the aquatic life use in the river.
This TMDL looks to establish phased total phosphorus endpoints that will be the cue to examine for
altered, improved biological conditions in the river. Once concentrations in the Crooked Creek and
Stranger Creek approach the Phase I management milestone of a median concentration of 0.173 mg/L
assessment of the biological community will be initiated. Should the biological community fail to
respond to the Phase I reduction of total phosphorus, Phase II will commence with a TP milestone of a
median concentration of 0.132 mg/L, representing the 25th percentile of the average TP concentrations
at the 16 stream stations displayed in Table 11. Simultaneous achievement of the chlorophyll a,
dissolved oxygen, oxygen saturation, and pH endpoints will signal phosphorus reductions are addressing
the accelerated succession of aquatic biota and the development of objectionable concentrations of algae
and algae by-products thereby restoring the domestic water supply and contact recreation uses in the
river.
3.0 SOURCE INVENTORY AND ASSESSMENT
Point Sources: The Crooked Creek watershed has two NPDES permitted facilities while the Stranger
Creek watershed has seven (Table 12). The two facilities in the Crooked Creek watershed are
discharging lagoons for the cities of Nortonville and Winchester. Three of the seven facilities in the

32
Stranger Creek watershed are discharging lagoons for the cities of Easton, Effingham and Lancaster.
Hilltop Market is prohibited from discharging and is not assigned a total phosphorus wasteload
allocation. The Pennington, Easton and Mooney/Schrick quarries are permitted to discharge to the
watershed but they are not expected to contribute to the phosphorus load and a wasteload allocation of
zero been established for the quarries. Total phosphorus is monitored quarterly at all of the discharging
lagoons except the city of Winchester (2008-2016) which is not required to monitor phosphorus in their
current permit.
Table 12. NPDES permitted facilities and current TP concentrations (where available) for facilities in
the Crooked Creek and Stranger Creek watersheds. NA = not applicable.
Kansas Permit
No.
NPDES
Permit No. Facility Name
Design
Flow
(MGD)
Receiving
Stream &
Basin
Facility
Type
Avg.TP
(mg/l) in
Effluent
Expiration
Date
Crooked Creek Watershed (SC683)
M-KS50-OO01 KS0047562
Nortonville
Wastewater
Treatment Facility
0.0735
Stranger Cr.
Via Crooked
Cr.
Lagoon 3.52 11/30/2021
M-KS84-OO01 KS0047511
Winchester
Wastewater
Treatment Facility
0.103
Stranger Cr.
Via Crooked
Cr.
Lagoon No Data 1/31/2022
Stranger Creek Watershed (SC602)
C-KS13-NO03 KSJ000623
Hilltop Market
Wastewater
Treatment Facility
NA N/A
Lagoon
Non-
Discharging
NA 12/31/2017
I-KS13-PO02 KS0118486 Pennington Quarry
# 66 NA Stranger Cr.
Rock
Quarry NA 12/31/2016
I-KS13-PO04 KS0099538 Easton Quarry NA
Stranger Creek
Via Unnamed
Tributary
Rock
Quarry NA 6/30/2017
I-KS50-PO01 KS0081604 Mooney/Schrick
Quarry #83 NA
Stranger Cr.
Via Crooked
Cr. Via
Mooney Cr.
Rock
Quarry NA 10/31/2021
M-KS13-OO01 KS0047261
Easton Municipal
Wastewater
Treatment Plant
0.0345 Stranger Cr. Lagoon 1.51 9/30/2017
M-KS15-OO01 KS0047279
Effingham
Wastewater
Treatment Facility
0.107
Stranger Cr.
Via Unnamed
Tributary
Lagoon 2.17 12/31/2017
M-KS29-OO01 KS0024864
Lancaster
Wastewater
Treatment Facility
0.043
Kansas River
Via N. Fork
Stranger Cr.
Lagoon 2.24 12/31/2021
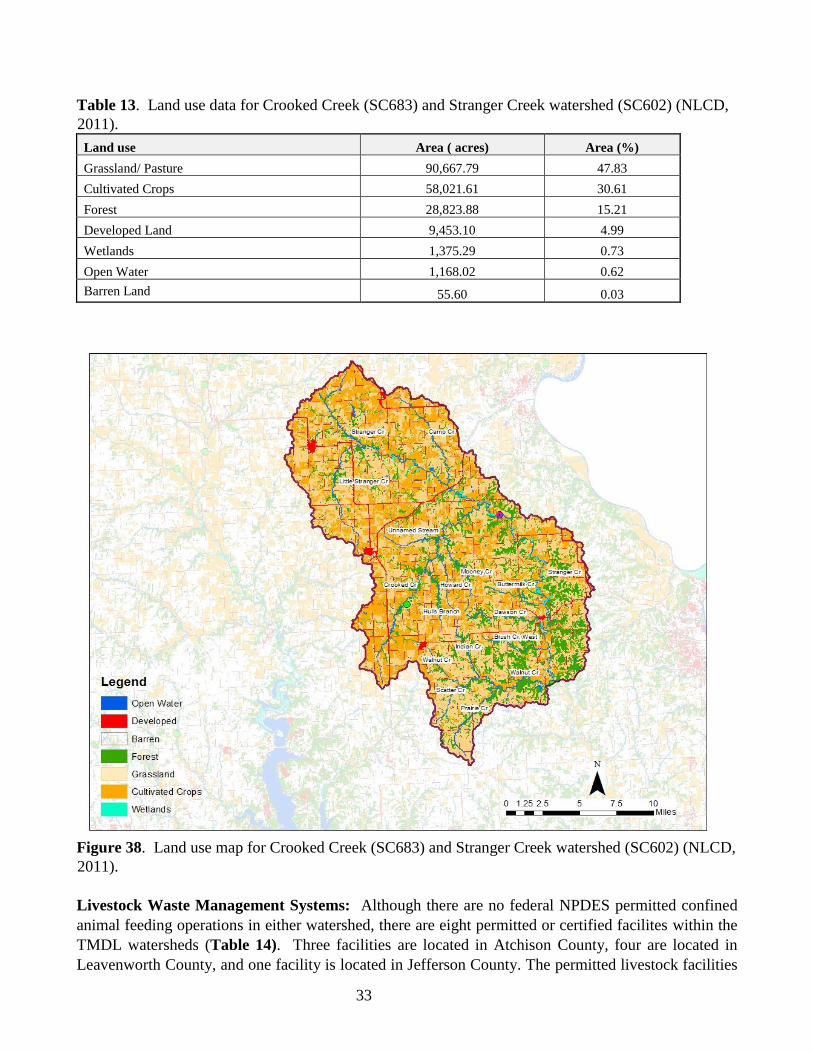
Land Use: The approximate land area of the combined SC683 and SC602 watersheds is 189,510 acres.
The land use percentages and acres within the watershed are in Table 13 and are further illustrated in
the land use map (Figure 38). Runoff from the cropland and developed areas could contribute
significantly to total phosphorus loading. Land use within the Crooked Creek and Stranger Creek
watershed is mostly pasture and grassland (47.83%) and cultivated crops (30.61%). The watershed has
forested lands comprising 15.21% of the watershed, while developed land only account for about 5%.
33
Table 13. Land use data for Crooked Creek (SC683) and Stranger Creek watershed (SC602) (NLCD,
2011).
Land use Area ( acres) Area (%)
Grassland/ Pasture 90,667.79 47.83
Cultivated Crops 58,021.61 30.61
Forest 28,823.88 15.21
Developed Land 9,453.10 4.99
Wetlands 1,375.29 0.73
Open Water 1,168.02 0.62
Barren Land 55.60 0.03
Figure 38. Land use map for Crooked Creek (SC683) and Stranger Creek watershed (SC602) (NLCD,
2011).
Livestock Waste Management Systems: Although there are no federal NPDES permitted confined
animal feeding operations in either watershed, there are eight permitted or certified facilites within the
TMDL watersheds (Table 14). Three facilities are located in Atchison County, four are located in
Leavenworth County, and one facility is located in Jefferson County. The permitted livestock facilities

34
have waste management systems designed to minimize runoff entering their operation and detain runoff
emanating from their facilities. These facilities are designed to retain a 25-year, 24-hour rainfall/runoff
event as well as an anticipated two weeks of normal wastewater from their operations. Typically, this
rainfall event coincides with streamflow that occurs less than 1-5% of the time. It is unlikely TP loading
would be attributable to properly operating permitted livestock facilities, though extensive loading may
occur if any of these facilities were in violation and discharged.
According to the USDA National Agricultural Statistics Service (NASS), on January 1, 2013 there was
a decline in animal production between 2007 and 2012 (Table 15). Although an increase in production
was seen for poultry and sheep when compared to 2007. The animal waste from both confined and
unconfined feeding sites is considered a potential source of total phosphorus loading in the streams in
the watershed.
Table 14. Permitted and certified confined feeding operations Stranger Creek watershed.
KS Permit # County Animal Total Permit Type Animal Type
A-KSAT-MA12 Atchison 50 Certification Dairy
A-KSAT-SA02 Atchison 572 Certification Swine
A-KSAT-BA01 Atchison 150 Certification Beef
A-KSLV-M008 Leavenworth 150 Permit Dairy
A-MOLV-M001 Leavenworth 240 Permit Dairy
A-KSLV-M005 Leavenworth 305 Renewal Dairy
A-KSLV-M007 Leavenworth 256 Renewal Dairy
A-KSJF-SA02 Jefferson 350 Certification Swine
Table 15. County inventory of livestock, on January 1, 2013 and of hogs on December 1, 2012,
USDA NASS.
County Year Cattle and
Calves Poultry Dairy Horses Sheep Swine
Atchison
2012 26,909 1,335 277 576 116 1,687
2007 35,656 622 415 607 D 4,442
Change in % -25 115 -33 -5 NA -62
Jefferson
2012 28,517 2,943 484 1,083 682 544
2007 49,569 1,005 533 1,374 612 2,128
Change in % -42 193 -9 -21 11 -74
Leavenworth
2012 21,185 3,299 710 1,468 888 1,516
2007 28,134 2,102 1,245 1,796 576 1919
Change in % -25 57 -43 -18 54 -21
D=Withheld to avoid disclosing data for individual farms.
On-Site Waste Systems: The Crooked Creek and Stranger Creek watersheds lies in rural where TP
contributions from septic systems is possible. According to the Spreadsheet Tool for Estimating Pollutant
Loads (STEPL), there are 2,089 septic systems in the combined Crooked Creek and Stranger Creek
watersheds. The estimated septic failure rate in Kansas is somewhere in the 10-15% range, according to the
survey performed by the Electric Power Research Institute. Failing on-site septic systems have the potential
to contribute to nutrient loading in the watershed. However, because of the relatively small number of
them, their small flows and because of phosphorus’ proclivity for adsorbing to soil, failing on-site septic

35
systems would be a minor source of phosphorus loading within the watershed and would not
significantly contribute to the phosphorus impairment in Crooked Creek and Stranger Creek.
Population Density: The population in the watershed is detailed in Table 16. A change in population
in the counties of the watershed is also listed. Atchison County shows a decline in population of 2.35 %
whereas, Jefferson and Leavenworth shows an increase of 2.56% and 16.76%, respectively from 2010
Census to 2016 estimates. According to the 2010 census data from the U.S. Census Bureau, the
population of the watershed is approximately 6,018 people, giving a population density of 20.43
people/square mile.
Table 16. U.S. 2000, 2010 Census results and a 2016 population estimate.
County/City 2000 Census 2010 Census 2016 Estimates % Change from 2000
Census to 2016 Estimate
Atchison 16,774 16,924 16,380 -2.35%
Jefferson 18,426 19,126 18,897 2.56%
Leavenworth 68,691 76,227 80,204 16.76%
Source: United States Census Bureau
Contributing Runoff: The Crooked Creek and Stranger Creek watersheds have a mean soil
permeability of 0.43 inches/hour, according to NRCS STATSGO database (Figure 39). Permeability in
the watershed ranges from 0.01 to 17.6 inches/hour with about 50% of the watershed having extremely
low permeability values of 0.57 inches/hour. According to a USGS open-file report (Juracek, 2000), the
threshold soil-permeability values are set at 3.43 inches/hour for very high, 2.86 inches/hour for high,
2.29 inches/hour for moderate, 1.71 inches/hour for low, 1.14 inches/hour for very low, and 0.57
inches/hour for extremely low soil-permeability. Runoff is primarily generated as infiltration excess
with rainfall intensities greater than soil permeability. As the watersheds’ soil profiles become saturated,
excess overland flow is produced. The majority of the nonpoint source nutrient runoff will be associated
with cropland areas throughout the watershed that are in close proximity to the stream corridors.

36
Figure 39. Soil permeability in Crooked Creek (SC683) and Stranger Creek (SC602) watersheds.
Background and Natural Sources: Phosphorus is present over the landscape, in the soil profile as well
as terrestrial and aquatic biota. Wildlife can contribute phosphorus loadings, particularly if they
congregate to a density that exceeds the assimilative capacity of the land or water.
4.0 ALLOCATION OF POLLUTION REDUCTION RESPONSIBLITY
The endpoints for these TMDLs are based on the biological condition, pH, sestonic chlorophyll a and
dissolved oxygen concentrations all of which should improve to a level of full attainment of designated
uses phosphorus concentrations decrease in the river. This TMDL is established as two phases to reduce
phosphorus loadings and total phosphorus concentrations with periodic assessment of the biological
condition in the river. The Phase I TMDL TP concentration is set at a median concentration of 0.173
mg/L. Because the facililities discharging to the TMDL watersheds are limited to municipal lagoons,
total phosphorus reductions will primarily be achieved by the application of riparian and livestock
agricultural best management practices. The TMDL for Crooked Creek extends to the terminus of
segment 1027010412. The TMDL for Stranger Creek extends to the termius of segment 102701048
where SC602 is located and includes all stream segments above SC602 excluding the segment covered
by the Crooked Creek TMDL.
Once TP concentrations in Crooked Creek and Stranger Creek, as measured at SC683 and SC602,
respectively, approaches the Phase I milestone of a median TP concentration of 0.173 mg/L an intensive
37
assessment of macroinvertebrate abundance and diversity will be performed to determine compliance
with the narrative nutrient criteria. Presuming one or more of the numeric endpoints are not met at the
end of Phase I, Phase II will commence with a TP milestone of a median TP concentration of 0.132 mg/L
with additional reductions in loads and phosphorus concentrations accomplished through enhanced
implementation of controls on nonpoint sources in the watersheds.
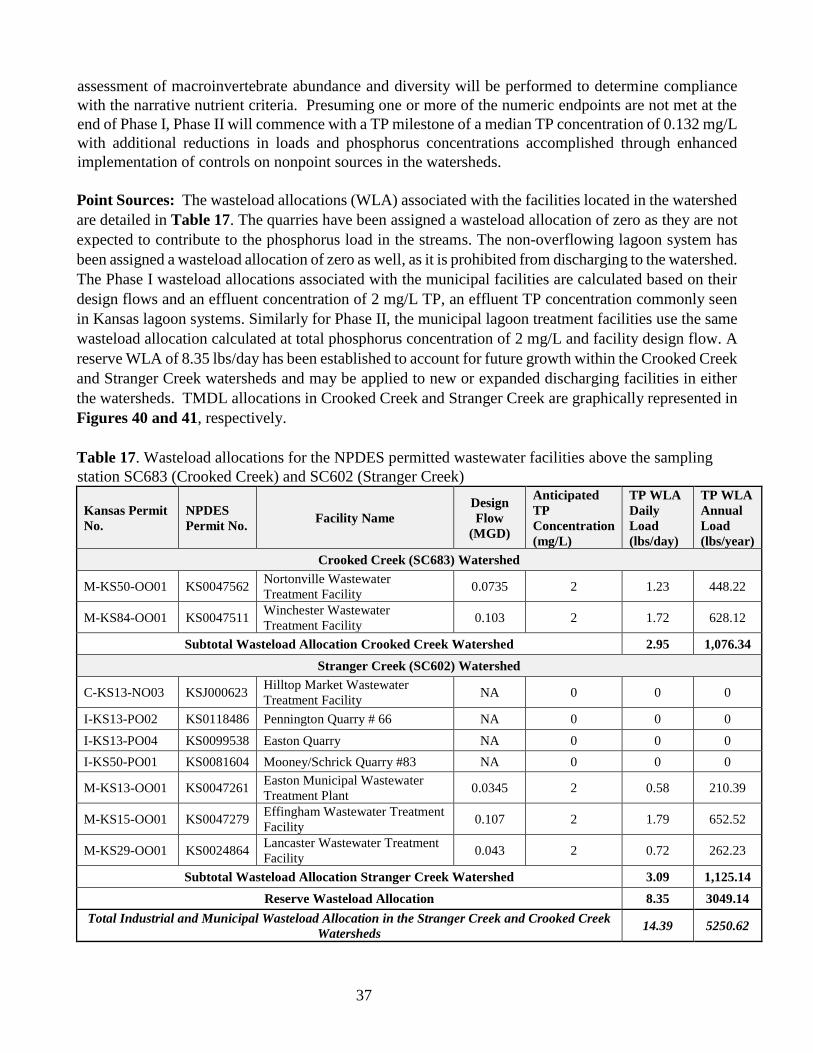
Point Sources: The wasteload allocations (WLA) associated with the facilities located in the watershed
are detailed in Table 17. The quarries have been assigned a wasteload allocation of zero as they are not
expected to contribute to the phosphorus load in the streams. The non-overflowing lagoon system has
been assigned a wasteload allocation of zero as well, as it is prohibited from discharging to the watershed.
The Phase I wasteload allocations associated with the municipal facilities are calculated based on their
design flows and an effluent concentration of 2 mg/L TP, an effluent TP concentration commonly seen
in Kansas lagoon systems. Similarly for Phase II, the municipal lagoon treatment facilities use the same
wasteload allocation calculated at total phosphorus concentration of 2 mg/L and facility design flow. A
reserve WLA of 8.35 lbs/day has been established to account for future growth within the Crooked Creek
and Stranger Creek watersheds and may be applied to new or expanded discharging facilities in either
the watersheds. TMDL allocations in Crooked Creek and Stranger Creek are graphically represented in
Figures 40 and 41, respectively.
Table 17. Wasteload allocations for the NPDES permitted wastewater facilities above the sampling
station SC683 (Crooked Creek) and SC602 (Stranger Creek)
Kansas Permit
No.
NPDES
Permit No. Facility Name
Design
Flow
(MGD)
Anticipated
TP
Concentration
(mg/L)
TP WLA
Daily
Load
(lbs/day)
TP WLA
Annual
Load
(lbs/year)
Crooked Creek (SC683) Watershed
M-KS50-OO01 KS0047562 Nortonville Wastewater
Treatment Facility 0.0735 2 1.23 448.22
M-KS84-OO01 KS0047511 Winchester Wastewater
Treatment Facility 0.103 2 1.72 628.12
Subtotal Wasteload Allocation Crooked Creek Watershed 2.95 1,076.34
Stranger Creek (SC602) Watershed
C-KS13-NO03 KSJ000623 Hilltop Market Wastewater
Treatment Facility NA 0 0 0
I-KS13-PO02 KS0118486 Pennington Quarry # 66 NA 0 0 0
I-KS13-PO04 KS0099538 Easton Quarry NA 0 0 0
I-KS50-PO01 KS0081604 Mooney/Schrick Quarry #83 NA 0 0 0
M-KS13-OO01 KS0047261 Easton Municipal Wastewater
Treatment Plant 0.0345 2 0.58 210.39
M-KS15-OO01 KS0047279 Effingham Wastewater Treatment
Facility 0.107 2 1.79 652.52
M-KS29-OO01 KS0024864 Lancaster Wastewater Treatment
Facility 0.043 2 0.72 262.23
Subtotal Wasteload Allocation Stranger Creek Watershed 3.09 1,125.14
Reserve Wasteload Allocation 8.35 3049.14
Total Industrial and Municipal Wasteload Allocation in the Stranger Creek and Crooked Creek
Watersheds 14.39 5250.62
38
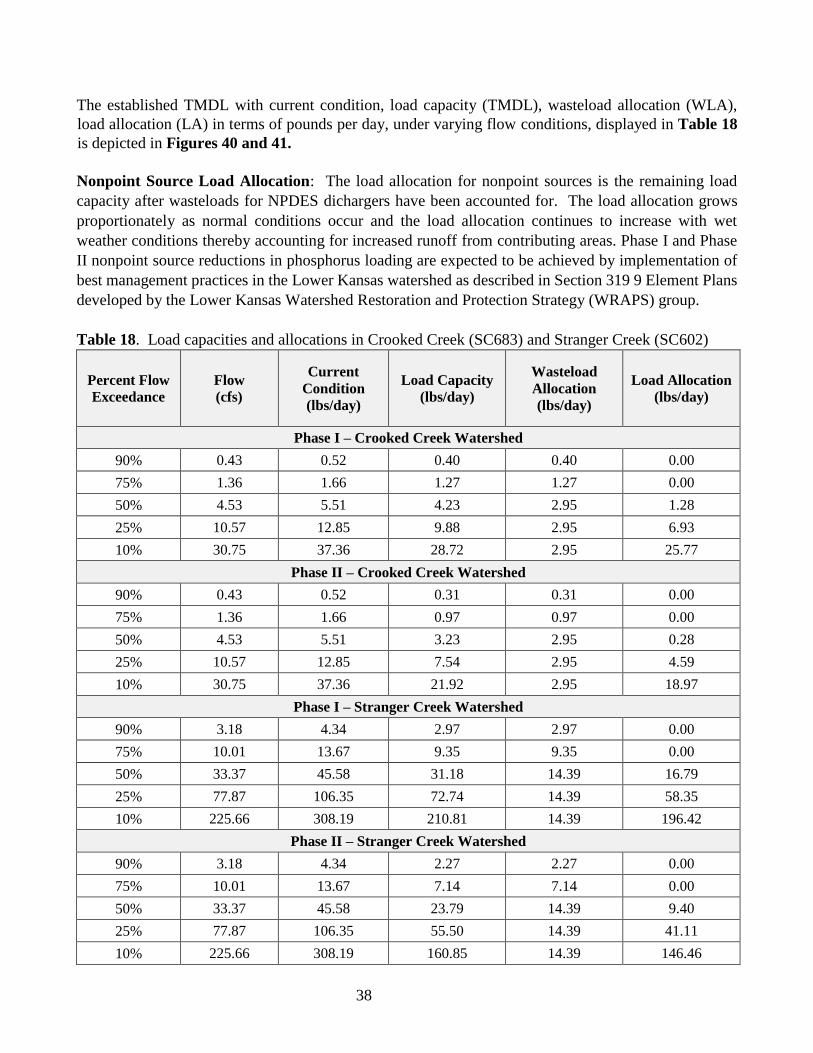
The established TMDL with current condition, load capacity (TMDL), wasteload allocation (WLA),
load allocation (LA) in terms of pounds per day, under varying flow conditions, displayed in Table 18
is depicted in Figures 40 and 41.
Nonpoint Source Load Allocation: The load allocation for nonpoint sources is the remaining load
capacity after wasteloads for NPDES dichargers have been accounted for. The load allocation grows
proportionately as normal conditions occur and the load allocation continues to increase with wet
weather conditions thereby accounting for increased runoff from contributing areas. Phase I and Phase
II nonpoint source reductions in phosphorus loading are expected to be achieved by implementation of
best management practices in the Lower Kansas watershed as described in Section 319 9 Element Plans
developed by the Lower Kansas Watershed Restoration and Protection Strategy (WRAPS) group.
Table 18. Load capacities and allocations in Crooked Creek (SC683) and Stranger Creek (SC602)
Percent Flow
Exceedance
Flow
(cfs)
Current
Condition
(lbs/day)
Load Capacity
(lbs/day)
Wasteload
Allocation
(lbs/day)
Load Allocation
(lbs/day)
Phase I – Crooked Creek Watershed
90% 0.43 0.52 0.40 0.40 0.00
75% 1.36 1.66 1.27 1.27 0.00
50% 4.53 5.51 4.23 2.95 1.28
25% 10.57 12.85 9.88 2.95 6.93
10% 30.75 37.36 28.72 2.95 25.77
Phase II – Crooked Creek Watershed
90% 0.43 0.52 0.31 0.31 0.00
75% 1.36 1.66 0.97 0.97 0.00
50% 4.53 5.51 3.23 2.95 0.28
25% 10.57 12.85 7.54 2.95 4.59
10% 30.75 37.36 21.92 2.95 18.97
Phase I – Stranger Creek Watershed
90% 3.18 4.34 2.97 2.97 0.00
75% 10.01 13.67 9.35 9.35 0.00
50% 33.37 45.58 31.18 14.39 16.79
25% 77.87 106.35 72.74 14.39 58.35
10% 225.66 308.19 210.81 14.39 196.42
Phase II – Stranger Creek Watershed
90% 3.18 4.34 2.27 2.27 0.00
75% 10.01 13.67 7.14 7.14 0.00
50% 33.37 45.58 23.79 14.39 9.40
25% 77.87 106.35 55.50 14.39 41.11
10% 225.66 308.19 160.85 14.39 146.46

39
Figure 40. TMDL for Crooked Creek watershed at segment 1027010412 terminus as measured at
SC683.
Figure 41. TMDL for the Stranger Creek watershed as measured at SC683 located at the terminus of
segment 102701048.
0.01
0.10
1.00
10.00
100.00
1000.00
10000.00
0 10 20 30 40 50 60 70 80 90 100
Tota
l Ph
osp
ho
rus
Lo
ad
(lb
s/d
ay)
Percent Flow Exeedence
Total Phosphorus TMDL for Crooked Creek Watershed
Phase I TMDL (0.171mg/L TP) Phase II TMDL (0.132 mg/L) Current Load (S/F) Current Load (Spring) Current Load (Winter)
0.01
0.10
1.00
10.00
100.00
1000.00
10000.00
0 10 20 30 40 50 60 70 80 90 100
Tota
l Ph
osp
ho
rus
Lo
ad
(lb
s/d
ay)
Percent Flow Exeedence
Total Phosphorus TMDL for the Stranger Creek Watershed
Phase I TMDL (0.172 mg/L TP) Phase II TMDL (0.132 mg/L) Current Load (S/F) Current Load (Spring) Current Load (Winter)
40
Defined Margin of Safety: The Margin of Safety provides some hedge against the uncertainty in
phosphorus loading into Crooked Creek and Stranger Creek. This TMDL uses an implicit margin of
safety, relying on conservative assumptions. Firstly, there are five endpoints that are established by this
TMDL. Secondly, the sestonic chlorophyll a and biological endpoints used to assess compliance with
the narrative criteria have to be maintained for three consecutive years before attainment of water quality
standards can be claimed. Third, because there is often a synergistic effect of phosphorus and nitrogen
on in-stream biological activity, concurrent efforts by municipal wastewater treatment facilities to reduce
nitrogen content of its wastewater should complement the effect of phosphorus load reduction in
improving the biological condition of Crooked Creek and Stranger Creek.
State Water Plan Implementation Priority: Early implementation of this TMDL will focus on riparian
management in agricultural areas. Because these are tributaries to the Kansas River, a drinking water
supply source, this TMDL will be High Priority for implementation.
Nutrient Reduction Framework Priority Ranking: This watershed lies within the Lower Kansas
Subbasin (HUC8: 10270104) with a priority ranking of 1 (Highest Priority for restoration work)/which
is among the top sixteen HUC8s targeted for state action to reduce nutrients.
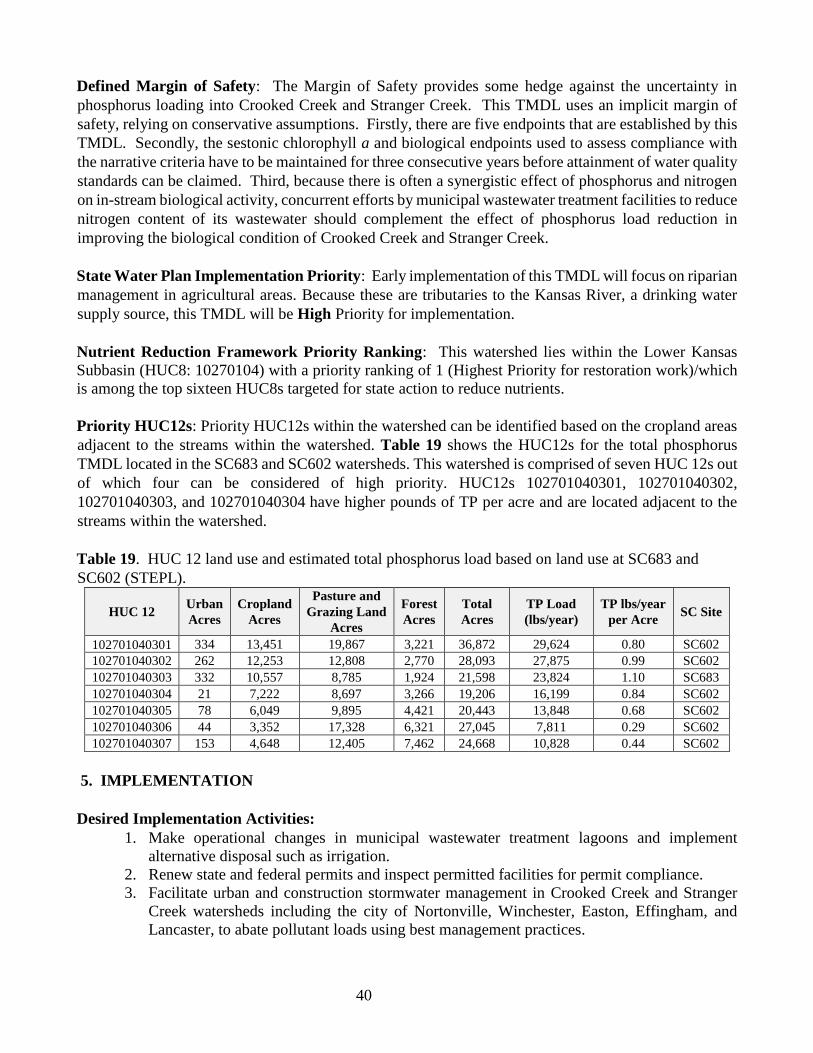
Priority HUC12s: Priority HUC12s within the watershed can be identified based on the cropland areas
adjacent to the streams within the watershed. Table 19 shows the HUC12s for the total phosphorus
TMDL located in the SC683 and SC602 watersheds. This watershed is comprised of seven HUC 12s out
of which four can be considered of high priority. HUC12s 102701040301, 102701040302,
102701040303, and 102701040304 have higher pounds of TP per acre and are located adjacent to the
streams within the watershed.
Table 19. HUC 12 land use and estimated total phosphorus load based on land use at SC683 and
SC602 (STEPL).
HUC 12 Urban
Acres
Cropland
Acres
Pasture and
Grazing Land
Acres
Forest
Acres
Total
Acres
TP Load
(lbs/year)
TP lbs/year
per Acre SC Site
102701040301 334 13,451 19,867 3,221 36,872 29,624 0.80 SC602
102701040302 262 12,253 12,808 2,770 28,093 27,875 0.99 SC602
102701040303 332 10,557 8,785 1,924 21,598 23,824 1.10 SC683
102701040304 21 7,222 8,697 3,266 19,206 16,199 0.84 SC602
102701040305 78 6,049 9,895 4,421 20,443 13,848 0.68 SC602
102701040306 44 3,352 17,328 6,321 27,045 7,811 0.29 SC602
102701040307 153 4,648 12,405 7,462 24,668 10,828 0.44 SC602
5. IMPLEMENTATION
Desired Implementation Activities:
1. Make operational changes in municipal wastewater treatment lagoons and implement
alternative disposal such as irrigation.
2. Renew state and federal permits and inspect permitted facilities for permit compliance.
3. Facilitate urban and construction stormwater management in Crooked Creek and Stranger
Creek watersheds including the city of Nortonville, Winchester, Easton, Effingham, and
Lancaster, to abate pollutant loads using best management practices.

41
4. Implement and maintain conservation farming, including conservation tilling, contour
farming, and no-till farming to reduce runoff and cropland erosion in agricultural areas of the
watershed.
5. Improve riparian conditions along stream systems by installing grass and/or forest buffer
strips along the stream and drainage channels in the watershed.
6. Perform extensive soil testing to ensure excess phosphorus is not applied.
7. Ensure land applied manure is being properly managed and is not susceptible to runoff by
implementing nutrient management plans.
8. Install pasture management practices, including proper stock density to reduce soil erosion
and storm runoff.
9. Ensure that labeled application rates of chemical fertilizers are being followed and implement
runoff control measures.
10. The stakeholder leadership team for the Lower Kansas watershed WRAPS will coordinate
BMPs to address:
a. Livestock: vegetative filter strips, relocate feeding sites, relocate pasture feeding sites
off-stream and alternate watering system.
b. Cropland: waterways, terraces, conservation crop rotations and water retention
structures.
NPDES and State Permits – KDHE
a. Monitor influent into and effluent from the discharging permitted wastewater treatment
facilities, continue to encourage wastewater reuse and irrigation disposal and ensure
compliance and proper operation to control phosphorus levels in wastewater discharges.
b. Inspect permitted livestock facilities to ensure compliance.
c. New livestock permitted facilities will be inspected for integrity of applied pollution
prevention technologies.
d. New registered livestock facilities with less than 300 animal units will apply pollution
prevention technologies.
e. Manure management plans will be implemented, to include proper land application rates and
practices that will prevent runoff of applied manure.
f. Reduce runoff in urban areas through stormwater management.
g. Establish nutrient reduction practices among urban homeowners to manage application on
lawns and gardens, through respective stormwater management programs.
Nonpoint Source Pollution Technical Assistance – KDHE
a. Support Section 319 implementation projects for reduction of phosphorus runoff from
agricultural activities as well as nutrient management.
b. Provide technical assistance on practices geared to the establishment of vegetative buffer
strips.
c. Provide technical assistance on nutrient management for livestock facilities in the watershed
and practices geared towards small livestock operations, which minimize impacts to stream
resources.
d. Support the implementation efforts of the Lower Kansas WRAPS and incorporate long-term
objectives of this TMDL into their 9-element watershed plan.
e. Engage the municipalities in the watershed to discuss stormwater load trading opportunities.
Water Resource Cost Share and Nonpoint Source Pollution Control Program – KDA-DOC
42
a. Apply conservation farming practices and/or erosion control structures, including no-till,
terraces, and contours, sediment control basins, and constructed wetlands.
b. Provide sediment control practices to minimize erosion and sediment transport from cropland
and grassland in the watershed.
c. Install livestock waste management systems for manure storage.
d. Implement manure management plans.
Riparian Protection Program – KDA-DOC
a. Establish or reestablish natural riparian systems, including vegetative filter strips and
streambank vegetation.
b. Develop riparian restoration projects along targeted stream segments, especially those areas
with baseflow.
c. Promote wetland construction to reduce runoff and assimilate sediment loadings.
d. Coordinate riparian management within the watershed and develop riparian restoration
projects.
Buffer Initiative Program – KDA-DOC
a. Install grass buffer strips near streams.
b. Leverage Conservation Reserve Enhancement Program to hold riparian land out of
production.
Extension Outreach and Technical Assistance – Kansas State University
a. Educate agricultural producers on sediment, nutrient, and pasture management.
b. Educate livestock producers on livestock waste management, land applied manure
applications, and nutrient management planning.
c. Provide technical assistance on livestock waste management systems and nutrient
management planning.
d. Provide technical assistance on buffer strip design and minimizing cropland runoff.
e. Encourage annual soil testing to determine capacity of field to hold phosphorus.
f. Educate residents, landowners, and watershed stakeholders about nonpoint source pollution.
g. Promote and utilize the WRAPS efforts for pollution prevention, runoff control and resource
management. The WRAPS coordinator is also an extension watershed specialist that will
provide technical assistance and outreach to producers for BMP implementation. Other
entities for this task include NRCS and local conservation districts.
Timeframe for Implementation: Reduction strategies for the wastewater treatment facilities should be
evaluated by 2019 with subsequent planning, design, and construction of any expanded treatment
initiated by the next permit starting in 2022. Urban stormwater and rural runoff management should be
expanded by 2019 to ensure nutrients are addressed. Pollutant reduction practices should be installed
within the priority subwatersheds before 2022 with follow-up implementation over 2022-2027. Phase I
of this TMDL will occur from 2019 to 2039. If biology in the Kansas River has not responded to Phase
I reductions by 2039 then Phase II will commence in 2040.
Targeted Participants: The primary participants for implementation will be municipal wastewater and
stormwater programs, and agricultural and livestock producers operating immediately adjacent to the
Crooked Creek and Stranger Creek and its tributaries. Watershed coordinators and technical staff of the
WRAPS, along with Conservation District personnel and county extension agents should assess possible
sources adjacent to streams. Implementation activities to address nonpoint sources should focus on those
areas with the greatest potential to impact nutrient concentrations adjacent to the river.
43
Targeted Activities to focus attention toward include:
1. High-density urban and residential development in proximity to streams and tributary areas.
2. Urban residents should be informed on fertilizer and waste management to reduce urban
runoff loads.
3. Overused grazing land adjacent to the streams.
4. Sites where drainage runs through or adjacent to livestock areas.
5. Sites where livestock have full access to the stream as a primary water supply.
6. Poor riparian area and denuded riparian vegetation along the stream.
7. Unbufferred cropland adjacent to the stream.
8. Conservation compliance on highly erodible areas.
9. Total row crop acreage and gully locations.
Milestone for 2023: By 2023, implementation of necessary and appropriate measures to decrease the
contribution of nonpoint source phosphours loading in the Crooked Creek and Stranger Creek
watersheds should be in progress. At that point in time, phosphorus data from the Crooked Creek and
Stranger Creek stream chemistry stations SC683 and SC602, respectively should show indication of
declining concentrations relative to the pre-2016 data.
Delivery Agents: The primary delivery agents for program participation will be municipalities within
the watershed, KDHE, and the conservation projects within and above the TMDL watershed.
Reasonable Assurances:
Authorities: The following authorities may be used to direct activities in the watershed to reduce
pollution:
1. K.S.A. 65-164 and 165 empowers the Secretary of KDHE to regulate the discharge of sewage
into the waters of the state.
2. K.S.A. 65-171d empowers the Secretary of KDHE to prevent water pollution and to protect
the beneficial uses of the waters of the state through required treatment of sewage and
established water quality standards and to require permits by persons having a potential to
discharge pollutants into the waters of the state.
3. K.S.A. 2002 Supp. 82a-2001 identifies the classes of recreation use and defines impairment
for streams.
4. K.A.R. 28-16-69 through 71 implements water quality protection by KDHE through the
establishment and administration of critical water quality management areas on a watershed
basis.
5. K.S.A. 2-1915 empowers the Kansas Department of Agriculture, Division of Conservation
to develop programs to assist the protection, conservation and management of soil and water
resources in the state, including riparian areas.
6. K.S.A. 75-5657 empowers the Kansas Department of Agriculture, Division of Conservation
to provide financial assistance for local project work plans developed to control nonpoint
source pollution.

44
7. K.S.A. 82a-901, et. seq. empowers the Kansas Water Office to develop a state water plan
directing the protection and maintenance of surface water quality for the waters of the state.
8. K.S.A. 82a-951 creates the State Water Plan Fund to finance the implementation of the
Kansas Water Plan, including selected Watershed Restoration and Protection Strategies.
9. The Kansas Water Plan and the Kansas Regional Planning Area plan provide the guidance
to state agencies to coordinate programs intent on protecting water quality and to target those
programs to geographic areas of the state for high priority implementation.
Funding: The State Water Plan annually generates $12-13 million and is the primary funding
mechanism for implementing water quality protection and pollution reduction activities in the state
through the Kansas Water Plan. The state water planning process, overseen by the Kansas Water Office,
coordinates and directs programs and funding toward watershed and water resources of highest priority.
Typically, the state allocates at least 50% of the fund to programs supporting water quality protection.
This watershed and its TMDL are located within a High Priority area and should receive support for
pollution abatement practices that lower the loading of sediment and nutrients.
Effectiveness: Nutrient control has been proven effective through conservation tillage, contour farming
and use of grass waterways and buffer strips. In addition, the proper implementation of comprehensive
livestock waste management plans has proven effective at reducing nutrient runoff associated with
livestock facilities.
6. MONITORING
Stream chemistry sampling should include sestonic chlorophyll a sampling at SC683 and SC602.
Monitoring of tributary levels of TP during runoff events will help direct abatement efforts toward
nonpoint sources.
Once TP concentrations approach 0.173 mg/L in Crooked Creek and Stranger Creek, macroinvertebrate
sampling at SB683 will be performed to assess the biotic integrity of the stream. Additional
macroinvertebrate sampling will occur in Stranger Creek. If the biological endpoints are achieved over
2023-2027 in Crooked Creek or Stranger Creek, the conditions descried by the narrative nutrient criteria
will be viewed as attained and Crooked Creek and/or Stranger Creek will be moved to Category 2 on
the 2028-303(d) list.
Once the water quality standards are attained, the adjusted ambient phosphorus concentrations in
Crooked Creek and Stranger Creek will be the basis for establishing numeric phosphorus criteria through
the triennial water quality standards process to protect the restored biological and chemical integrity of
the stream.
7. FEEDBACK
Public Notice: An active Internet Web site is established at
http://www.kdheks.gov/tmdl/planning_mgmt.htm to convey information to the public on the general
establishment of TMDLs and specific TMDLs for the Kansas-Lower Republican River Basin. This
TMDL was posted to this site on June 8, 2017 for public review.
45
Public Hearing: A Public Hearing on the Crooked Creek and Stranger Creek TP TMDLs was held in
Topeka, Kansas on June 28, 2017 to receive comments on this TMDL. No comments were received on
this TMDL>
Milestone Evaluation: In 2023, evaluation will be made as to the degree of implementation that
occurred within the TMDL watershed. Subsequent decisions will be made through the WRAPS
regarding the non-points source implementation approach and follow up of additional implementation
in the watershed.
Consideration for 303(d) Delisting: Crooked Creek and Stranger Creek will be evaluated for delisting
under Section 303(d), based on the monitoring data over the period 2017-2027. Therefore, the decision
for delisting will come about in the preparation of the 2028 303(d) list. Should modifications be made
to the applicable water quality criteria during the ten-year implementation period, consideration for
delisting, desired endpoints of this TMDL, and implementation activities may be adjusted accordingly.
Incorporation into the TMDL Vision Process, Water Quality Management Plan and the Kansas
Water Planning Process: Under the current version of the Kansas TMDL Vision Process, the next
anticipated revision would come in 2022, which will emphasize implementation of WRAPS activities
and reduction of nutrients in wastewater developed by NPDES facilities. At that time, incorporation of
this TMDL will be made into the WRAPS watershed plans. Recommendations of this TMDL will be
considered in the Kansas Water Plan implementation decisions under the State Water Planning Process
for Fiscal Years 2017-2025.
Developed 3/7/18
46
References
Juracek, K.E., 2000. Soils – Potential Runoff. U.S. Geological Survey Open-File Report 00-253.
Kansas Department of Health and Environment. 2010. Kansas Reference Streams: Selection of Suitable
Candidates, Impending threats To Reference Stature, And Recommendations For Long-Term
Conservation.
Kansas Department of Health and Environment. 2016. Methodology for the Evaluation and
Development of the 2016 Section 303(d) List of Impaired Water Bodies for Kansas.
http://www.kdheks.gov/tmdl/download/2014_303_d_Methodology.pdf
Kansas Surface Water Quality Standards and Supporting Material found at:
http://www.kdheks.gov/water/download/kwqs_plus_supporting.pdf
National Oceanic and Atmospheric Administration, National Centers for Environmental Information.
Accessed 10/6/2016: Custom Global Summary, Precipitation (PRCP), Station GHCND:
USC00142652. http://www.ncdc.noaa.gov/cdo-web/confirmation
National Land Cover Database, 2011. http://www.mrlc.gov/
Perry, C.A., D.M. Wolock and J.C. Artman. 2004. Estimates of Flow Duration, Mean
Flow, and Peak-Discharge Frequency Values for Kansas Stream Locations, USGS Scientific
Investigations Report 2004-5033.
STEPL Support and Septic System Failure Rate found at:
http://it.tetratech-ffx.com/steplweb/Faq.htm#Q4
United States Army Corps of Engineers. 2013. Annual Report of Reservoir Regulation Activities.
http://www.nwk.usace.army.mil/Portals/29/13AnnualRep.pdf
United States Army Corps of Engineers. 2014. Monthly Charts of Reservoir Data. http://www.swt-
wc.usace.army.mil/ELDRcharts.html
United States Census Bureau. 2010. http://www.census.gov/
United States Department of Agriculture. State of Kansas Quick Stats.
https://www.nass.usda.gov/Statistics_by_State/Kansas/index.php
Watershed Restoration and Protection Strategy 9 Element Plan, Lower Kansas River.
http://www.kswraps.org/files/attachments/lowerkansas_plansummary.pdf