Kaleidoscope to Common Sense David Lightfoot County Library Manager Lancashire County Library.
19
Kaleidoscope to Common Kaleidoscope to Common Sense Sense David Lightfoot David Lightfoot County Library County Library Manager Manager Lancashire County Lancashire County Library Library
-
date post
20-Dec-2015 -
Category
Documents
-
view
215 -
download
1
Transcript of Kaleidoscope to Common Sense David Lightfoot County Library Manager Lancashire County Library.

Kaleidoscope to Common SenseKaleidoscope to Common Sense
David LightfootDavid Lightfoot
County Library ManagerCounty Library Manager
Lancashire County LibraryLancashire County Library

Measurement and Metrics
PI’s CPA
Best Value
Public Library
Standards

Statistical Sources
LISU
CIPFA
University Research
Resource
PLUS

Essential Tools
Definitions
Methodologies
Mechanism for change CPLS
Service Improvements
Outputs Outcomes

Kaleidoscope

Value for effort
• Organise and presentOrganise and present
• Create a cultureCreate a culture
• Train and developTrain and develop
• Skills for decision makingSkills for decision making
Collection Application Outcome
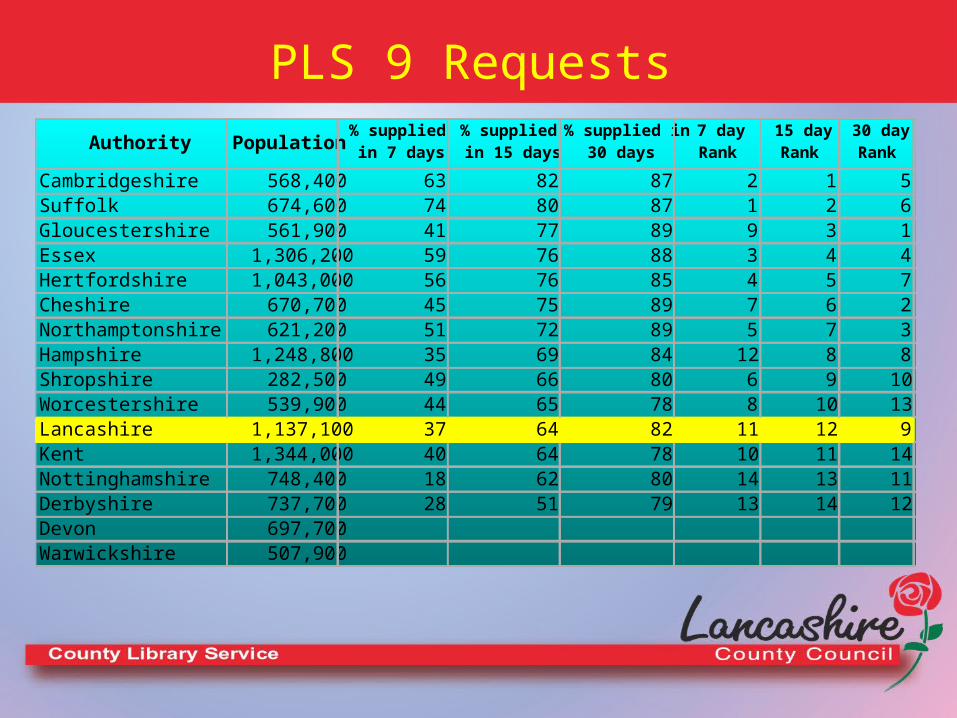
PLS 9 Requests
Cambridgeshire 568,400 63 82 87 2 1 5Suffolk 674,600 74 80 87 1 2 6Gloucestershire 561,900 41 77 89 9 3 1Essex 1,306,200 59 76 88 3 4 4Hertfordshire 1,043,000 56 76 85 4 5 7Cheshire 670,700 45 75 89 7 6 2Northamptonshire 621,200 51 72 89 5 7 3Hampshire 1,248,800 35 69 84 12 8 8Shropshire 282,500 49 66 80 6 9 10Worcestershire 539,900 44 65 78 8 10 13Lancashire 1,137,100 37 64 82 11 12 9Kent 1,344,000 40 64 78 10 11 14Nottinghamshire 748,400 18 62 80 14 13 11Derbyshire 737,700 28 51 79 13 14 12Devon 697,700Warwickshire 507,900
7 day Rank
15 day Rank
30 day RankAuthority Population
% supplied in 7 days
% supplied in 15 days
% supplied in 30 days

Request ComparisonsWarwickshire 80807080101103102112Worcestershire 10010010010071645862
Cambridgeshire 75 75 75 75 127 119 118 140Cheshire 70 70 70 70 107 122 113 111
Derbyshire 75 75 75 95 92 86Devon 60 75 75 75 153 148 147 165
Essex 60 70 70 60 313 259 183 185Gloucestershire 60 60 60 70 169 165 155 139
Hampshire 85 85 85 85 137 136 132 139Hertfordshire 70 94 75 100 137 115 112 64
Kent 50 50 75 75 95 103 76 75Lancashire 50 50 60 60 191 192 170 177
Northamptonshire 65 67 69 70 86 87 88 86Nottinghamshire 60 65 70 70 142 136 147 158
Shropshire 65 65 70 70 168 162 155 170Suffolk 45 45 45 45 312 282 347 335
Warwickshire 80 80 70 80 101 103 102 112Worcestershire 100 100 100 100 71 64 58 62
Authority ReqCharge
97
ReqCharge
98
ReqCharge
99
Reqsper
thous 00
ReqCharge
00
Reqsper
thous 97
Reqsper
thous 98
Reqsper
thous 99

Variables
• Charges 60p – £1.00
• Exemptions
• Differential charges £1.50 - £4.50
• Self Service lower charges
• 2000 Lancashire’s had 177 requests/00 pop per top end of the family group.
• Authorities with highest charges recorded lowest request rate at 62 and 64/000 pop.

Lancashire County Library Statistics
84 Libraries 13 mobiles 2 Trailers 550+ schools 600 homes 6 prisons
Population 1.1m Budget £18m 5 Divisions 12 – 23 libraries

Application

Response
• National Curriculum
• Books issuing despite evidence
• Promote as single entity
• Falling over years
• Improved School Libraries
• Homework Centres
• Suppliers range

Expectation
• Credible evidence
• Commentary
• Analyse and use
• Decisions and recommendations
• Evidence of consistency and fairness

Evidence Based Management in Action
• Lancashire – LISU – Resource
• Long Term programme 3 years
• Performance evaluation Tools
• Skills
• Theory and practice
• Research and Development

Getting started
• Key components• Management styles• Health checks• PI’s and Methods• Metrics• Library Plan• New methodologies
• Consultation• Administration• Analysis• Application• Decision outcomes• Dissemination• Training

Making it Happen
• Management and budget commitment
• Project Team
• Clear Aim – Service improvement
• Wide range of staff
• Training long term strategy
• Newsletter
• Ownership

The Process
• Desk Research
• Core briefing
• Staff colloquium
• Staff workshops
• Report
• Transferability

Measures of success
• Suggestions for Change with evidence
• Attitude change
• Confidence
• Elimination of dead data collection
• Health check
• National contribution

Change
Cultures Attitudes
Statistics and evidence