Jurnal Pasar Modal dan Perbankan -...
105
Jurnal Pasar Modal dan Perbankan Journal of Capital Market and Banking Volume 2, No. 2, May 2014 ISSN: 2301 - 4733 Contents ANALISIS KEMAMPUAN STOCK SELECTION DAN MARKET TIMING PADA REKSA DANA SAHAM DI INDONESIA PERIODE JANUARI 2008-JULI 2013 Pardomuan Sihombing dan Deasy Amalia ...............................................................1 – 11 VALUATION OF PT. ASTRA AGRO LESTARI SHARE PRICE USING DISCOUNTED CASH FLOW METHOD David Saputra dan Adler Haymans Manurung ....................................................... 12 – 39 FUNDAMENTAL VALUATION OF PT. INDOFOOD SUKSES MAKMUR, TBK USING DISCOUNTED CASH FLOW & RESIDUAL EARNING MODEL Stefanie Wijaya dan Adler Haymans Manurung ..................................................... 40 – 62 MEASURING INTRINSIC VALUE OF PT. BANK MANDIRI TBK. USING RESIDUAL INCOME APPROACH, DIVIDEND DISCOUNT MODEL AND PRICE TO BOOK VALUE Teuku Rusydi Khairi dan Adler Haymans Manurung ............................................ 63 – 87 ANALISIS PENGARUH SIZE, BUSINESS RISK, PROFITABILITY, LIQUIDITY, DAN ASSET STRUCTURE TERHADAP STRUKTUR MODAL PADA PERUSAHAAN MANUFAKTUR YANG TERDAFTAR DI BURSA EFEK INDONESIA PERIODE 2011-2013 Nurainun Bangun dan Hartanto Susilo ................................................................. 88 – 99 Jurnal ini Diterbitkan Atas Kerjasama PT. Adler Manurung Press & Asosiasi Analis Pasar Investasi dan Perbankan Journal of Capital Market and Banking ISSN: 2301 – 4733; Vol 2, No.2; May 2014
Transcript of Jurnal Pasar Modal dan Perbankan -...
Jurnal Pasar Modal dan Perbankan
Journal of Capital Market and Banking
Volume 2, No. 2, May 2014 ISSN: 2301 - 4733
Contents
ANALISIS KEMAMPUAN STOCK SELECTION DAN MARKET TIMING
PADA REKSA DANA SAHAM DI INDONESIA PERIODE JANUARI 2008-JULI 2013
Pardomuan Sihombing dan Deasy Amalia ...............................................................1 – 11
VALUATION OF PT. ASTRA AGRO LESTARI SHARE PRICE USING
DISCOUNTED CASH FLOW METHOD
David Saputra dan Adler Haymans Manurung .......................................................12 – 39
FUNDAMENTAL VALUATION OF PT. INDOFOOD SUKSES MAKMUR, TBK
USING DISCOUNTED CASH FLOW & RESIDUAL EARNING MODEL
Stefanie Wijaya dan Adler Haymans Manurung ..................................................... 40 – 62
MEASURING INTRINSIC VALUE OF PT. BANK MANDIRI TBK. USING
RESIDUAL INCOME APPROACH, DIVIDEND DISCOUNT MODEL AND PRICE
TO BOOK VALUE
Teuku Rusydi Khairi dan Adler Haymans Manurung ............................................ 63 – 87
ANALISIS PENGARUH SIZE, BUSINESS RISK, PROFITABILITY, LIQUIDITY,
DAN ASSET STRUCTURE TERHADAP STRUKTUR MODAL PADA
PERUSAHAAN MANUFAKTUR YANG TERDAFTAR DI BURSA EFEK
INDONESIA PERIODE 2011-2013
Nurainun Bangun dan Hartanto Susilo ................................................................. 88 – 99
Jurnal ini Diterbitkan Atas Kerjasama
PT. Adler Manurung Press
&
Asosiasi Analis Pasar Investasi dan Perbankan
Journal of Capital Market and Banking ISSN: 2301 – 4733; Vol 2, No.2; May 2014
ISSN : 2301 – 4733
Jurnal Pasar Modal dan Perbankan Journal of Capital Market and
Banking
Volume 2, Nomor 2, May 2014
Jurnal Pasar Modal dan perbankan diterbitkan atas kerjasama PT. Adler Manurung Press dan Asosiasi
Analis Pasar Investasi dan Perbankan, dengan frekuensi terbit empat kali setahun, pada bulan Februari, Mei, Agustus and November.
Editor In Chief Prof. Dr. Adler Haymans Manurung, Sampoerna School of Business, Jakarta
Managing Editor Dr. Pardomuan Sihombing, SE; MSM, PT Recapital Securities
Editorial Board Prof. Dr. Roy M. Sembel PT Bursa Berjangka, Jakarta
Prof. Dr. Ferdinand D. Saragih, MA University of Indonesia, Jakarta
Prof. Dr. Sukrisno Agoes, University of Tarumanagara, Jakarta Helson Siagian, SE. AK, MM, Ph. D Kementerian Negara Perumahan Rakyat
Prof. Noer Azam Achsani, Ph.D Institut Pertanian Bogor, Bogor
Parulian Sihotang, SE, Ak, Ph.D, CPMA, QIA, CPRM BP Migas
Tatang Ary Gumanti, Ph.D University of Jember Dr. Jonni Manurung, Universitas St Thomas, Medan
Dr. Koes Pranowo, SE., MSM PT Transocean Maritime
Dr. Andam Dewi, PT Bursa Berjangka, Jakarta Dr. Abdusalam Konstituanto, PT Perikanan Nusantara (Persero)
Batara Simatupang, Ph.D Bank Mandiri Tbk
Wilson Ruben L. Tobing, SE. Ak, M.Si, Ph. D ABFII Perbanas, Jakarta Dr. Pahala Nainggolan, SE. Ak, MM PT Finansial Bisnis Informasi
Dr. Tongam Sihol Nababan, University of HKBP Nomensen, Medan
Dr. Perdana Wahyu Santosa, University Yarsi, Jakarta
Dr. John.W.Situmorang, BKPM Prof. Dr. Apollo Daito M.Si, Ak., University of Tarumanagara, Jakarta
Dr. Ishak Ramli, University of Tarumanagara, Jakarta
Editorial Office
Redaksi Jurnal Pasar Modal dan Perbankan
PT. ADLER MANURUNG PRESS Komplek Mitra Matraman A1/17
JL.Matraman Raya No.148 Jakarta Timur 13130
Telp. (62-21) 70741182, 85918040 Ext.140
Fax. (62-21) 85918041
Email : [email protected]
Jurnal Pasar Modal dan Perbankan
Journal of Capital Market and Banking
Volume 2, Nomor 2, May 2014
ANALISIS KEMAMPUAN STOCK SELECTION DAN MARKET TIMING
PADA REKSA DANA SAHAM DI INDONESIA PERIODE JANUARI 2008-JULI 2013
Pardomuan Sihombing dan Deasy Amalia
VALUATION OF PT. ASTRA AGRO LESTARI SHARE PRICE USING DISCOUNTED
CASH FLOW METHOD
David Saputra dan Adler Haymans Manurung
Fundamental Valuation of PT. Indofood Sukses Makmur, Tbk Using Discounted Cash
Flow & Residual Earning Model
Stefanie Wijaya dan Adler Haymans Manurung
MEASURING INTRINSIC VALUE OF PT. BANK MANDIRI TBK. USING RESIDUAL
INCOME APPROACH, DIVIDEND DISCOUNT MODEL AND PRICE TO BOOK
VALUE
Teuku Rusydi Khairi dan Adler Haymans Manurung
ANALISIS PENGARUH SIZE, BUSINESS RISK, PROFITABILITY, LIQUIDITY,
DAN ASSET STRUCTURE TERHADAP STRUKTUR MODAL PADA PERUSAHAAN
MANUFAKTUR YANG TERDAFTAR DI BURSA EFEK INDONESIA PERIODE
2011-2013
Nurainun Bangun dan Hartanto Susilo
i
3
Dari Redaksi
Pertama-tama kami dari Redaksi mengucapkan terima kasih atas batuan dari teman-
teman yang telah mengirimkan tulisan untuk dimuat pada Jurnal ini. Kami terus menghimbau
dan meminta bantuan untuk teman-teman pengajar, peneliti dan praktisi untuk mengirimkan
tulisannya untuk dimuat pada Jurnal ini.
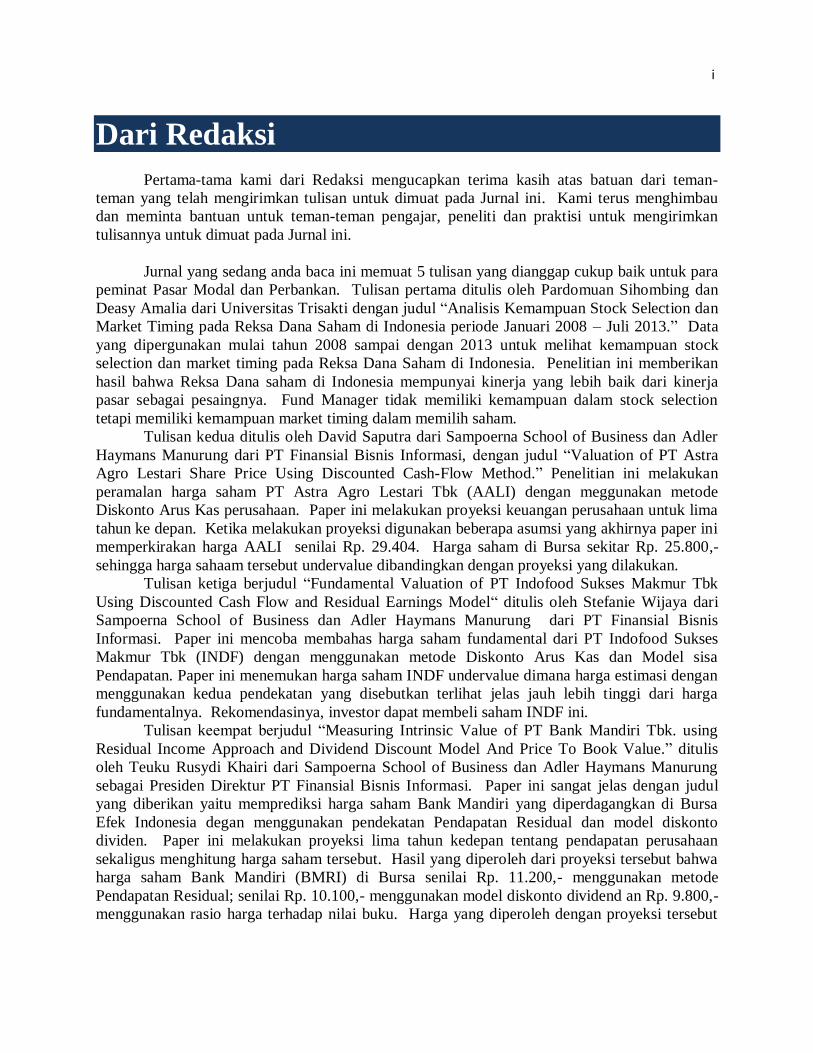
Jurnal yang sedang anda baca ini memuat 5 tulisan yang dianggap cukup baik untuk para
peminat Pasar Modal dan Perbankan. Tulisan pertama ditulis oleh Pardomuan Sihombing dan
Deasy Amalia dari Universitas Trisakti dengan judul “Analisis Kemampuan Stock Selection dan
Market Timing pada Reksa Dana Saham di Indonesia periode Januari 2008 – Juli 2013.” Data
yang dipergunakan mulai tahun 2008 sampai dengan 2013 untuk melihat kemampuan stock
selection dan market timing pada Reksa Dana Saham di Indonesia. Penelitian ini memberikan
hasil bahwa Reksa Dana saham di Indonesia mempunyai kinerja yang lebih baik dari kinerja
pasar sebagai pesaingnya. Fund Manager tidak memiliki kemampuan dalam stock selection
tetapi memiliki kemampuan market timing dalam memilih saham.
Tulisan kedua ditulis oleh David Saputra dari Sampoerna School of Business dan Adler
Haymans Manurung dari PT Finansial Bisnis Informasi, dengan judul “Valuation of PT Astra
Agro Lestari Share Price Using Discounted Cash-Flow Method.” Penelitian ini melakukan
peramalan harga saham PT Astra Agro Lestari Tbk (AALI) dengan meggunakan metode
Diskonto Arus Kas perusahaan. Paper ini melakukan proyeksi keuangan perusahaan untuk lima
tahun ke depan. Ketika melakukan proyeksi digunakan beberapa asumsi yang akhirnya paper ini
memperkirakan harga AALI senilai Rp. 29.404. Harga saham di Bursa sekitar Rp. 25.800,-
sehingga harga sahaam tersebut undervalue dibandingkan dengan proyeksi yang dilakukan.
Tulisan ketiga berjudul “Fundamental Valuation of PT Indofood Sukses Makmur Tbk
Using Discounted Cash Flow and Residual Earnings Model“ ditulis oleh Stefanie Wijaya dari
Sampoerna School of Business dan Adler Haymans Manurung dari PT Finansial Bisnis
Informasi. Paper ini mencoba membahas harga saham fundamental dari PT Indofood Sukses
Makmur Tbk (INDF) dengan menggunakan metode Diskonto Arus Kas dan Model sisa
Pendapatan. Paper ini menemukan harga saham INDF undervalue dimana harga estimasi dengan
menggunakan kedua pendekatan yang disebutkan terlihat jelas jauh lebih tinggi dari harga
fundamentalnya. Rekomendasinya, investor dapat membeli saham INDF ini.
Tulisan keempat berjudul “Measuring Intrinsic Value of PT Bank Mandiri Tbk. using
Residual Income Approach and Dividend Discount Model And Price To Book Value.” ditulis
oleh Teuku Rusydi Khairi dari Sampoerna School of Business dan Adler Haymans Manurung
sebagai Presiden Direktur PT Finansial Bisnis Informasi. Paper ini sangat jelas dengan judul
yang diberikan yaitu memprediksi harga saham Bank Mandiri yang diperdagangkan di Bursa
Efek Indonesia degan menggunakan pendekatan Pendapatan Residual dan model diskonto
dividen. Paper ini melakukan proyeksi lima tahun kedepan tentang pendapatan perusahaan
sekaligus menghitung harga saham tersebut. Hasil yang diperoleh dari proyeksi tersebut bahwa
harga saham Bank Mandiri (BMRI) di Bursa senilai Rp. 11.200,- menggunakan metode
Pendapatan Residual; senilai Rp. 10.100,- menggunakan model diskonto dividend an Rp. 9.800,-
menggunakan rasio harga terhadap nilai buku. Harga yang diperoleh dengan proyeksi tersebut
i
i
4
sangat jauh lebih tinggi dari harga saham di pasar sekitar Rp. 8.700,- dan harga tersebut
dinyatakan undervalue. Oleh karenanya, investor sangat layak membeli saham ini.
Tulisan kelima berjudul “Analisis Pengaruh Size, Business Risk, Profitability, Liquidity
dan Asset Structure terhadap struktur Modal pada Perusahaan Manufaktur yang terdaftar di
Bursa Efek Indonesia periode 2011 - 2013” yang ditulis oleh Nurainun Bangun saat ini sebagai
Dosen Fakultas Ekonomi Universitas Tarumanagara dan Hartanto Susilo, Alumni Fakultas
Ekonomi Universitas Tarumanagara. Penelitian ini menggunakan data perusahaan manufaktur
sebanyak 192 perusahaan untuk periode 2011 sampai 2013 yang terdaftar di Bursa Efek
Indonesia. Penelitian ini menggunakan regressi berganda untuk menganalisa pengaruh Size,
Business Risk, Profitabilitas, Liquidity dan struktur aset terhadap struktur modal perusahaan.
Penelitian ini memberikan hasil yaitu peubah risiko bisnis (business risk); profitabilitas dan
liquiditas secara statistik signifikan mempengruhi struktur modal. Size dan Struktur aset tidak
signifikan mempengaruhi struktur modal, dimana struktur modal diukur dengan rasio hutang
terhadap ekuitas.
Hadirnya Jurnal ini menjadi tambahan jurnal yang berisikan hasil penelitian yang akan dibaca oleh para akademisi dan Peneliti serta Praktisi yang sangat berminat dalam bidang Pasar Modal dan Perbankan.
Pada edisi berikutnya kami akan hadir lagi dengan tulisan yang lebih menarik pada para pembaca jurnal
ini. Selamat membaca !!!
Hormat kami,
Prof. Dr.Adler Haymans Manurung
Chief in Editor
iii
ii
i
5
Daftar Isi
DARI REDAKSI ……………………….………………………………………… i – ii
DAFTAR ISI …………………………………………………………………….. iii
ANALISIS KEMAMPUAN STOCK SELECTION DAN MARKET TIMING
PADA REKSA DANA SAHAM DI INDONESIA PERIODE JANUARI 2008-JULI 2013
Pardomuan Sihombing dan Deasy Amalia....................................................................1 – 10
VALUATION OF PT. ASTRA AGRO LESTARI SHARE PRICE USING DISCOUNTED
CASH FLOW METHOD
David Saputra dan Adler Haymans Manurung .......................................................... 11 - 39
Fundamental Valuation of PT. Indofood Sukses Makmur, Tbk Using Discounted Cash
Flow & Residual Earning Model
Stefanie Wijaya dan Adler Haymans Manurung ..................................................... 40 – 62
MEASURING INTRINSIC VALUE OF PT. BANK MANDIRI TBK. USING RESIDUAL
INCOME APPROACH, DIVIDEND DISCOUNT MODEL AND PRICE TO BOOK
VALUE
Teuku Rusydi Khairi dan Adler Haymans Manurung ..................................................63 – 87
ANALISIS PENGARUH SIZE, BUSINESS RISK, PROFITABILITY, LIQUIDITY,
DAN ASSET STRUCTURE TERHADAP STRUKTUR MODAL PADA PERUSAHAAN
MANUFAKTUR YANG TERDAFTAR DI BURSA EFEK INDONESIA PERIODE
2011-2013
Nurainun Bangun dan Hartanto Susilo.........................................................................88 – 99
iii
i
6
ANALISIS KEMAMPUAN STOCK SELECTION DAN MARKET TIMING
PADA REKSA DANA SAHAM DI INDONESIA
PERIODE JANUARI 2008-JULI 2013
Deasy Amalia
Universitas Trisakti
Pardomuan Sihombing
Universitas Trisakti
ABSTRACT
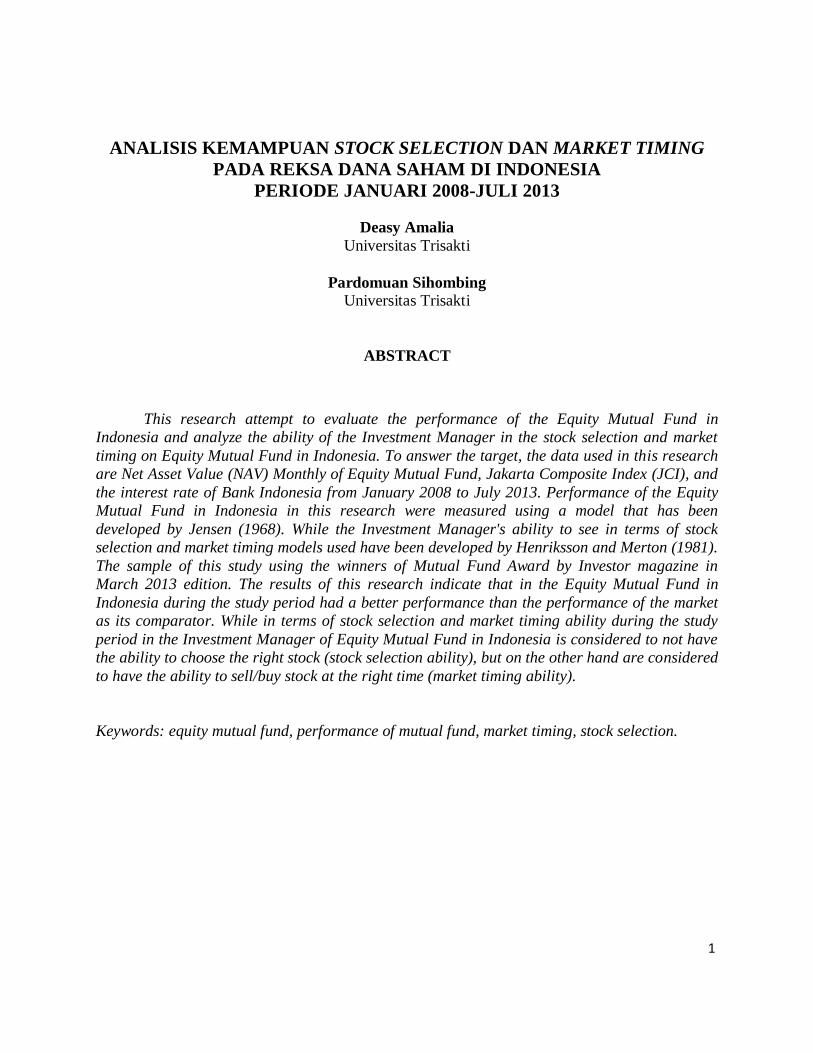
This research attempt to evaluate the performance of the Equity Mutual Fund in
Indonesia and analyze the ability of the Investment Manager in the stock selection and market
timing on Equity Mutual Fund in Indonesia. To answer the target, the data used in this research
are Net Asset Value (NAV) Monthly of Equity Mutual Fund, Jakarta Composite Index (JCI), and
the interest rate of Bank Indonesia from January 2008 to July 2013. Performance of the Equity
Mutual Fund in Indonesia in this research were measured using a model that has been
developed by Jensen (1968). While the Investment Manager's ability to see in terms of stock
selection and market timing models used have been developed by Henriksson and Merton (1981).
The sample of this study using the winners of Mutual Fund Award by Investor magazine in
March 2013 edition. The results of this research indicate that in the Equity Mutual Fund in
Indonesia during the study period had a better performance than the performance of the market
as its comparator. While in terms of stock selection and market timing ability during the study
period in the Investment Manager of Equity Mutual Fund in Indonesia is considered to not have
the ability to choose the right stock (stock selection ability), but on the other hand are considered
to have the ability to sell/buy stock at the right time (market timing ability).
Keywords: equity mutual fund, performance of mutual fund, market timing, stock selection.
1
i
7
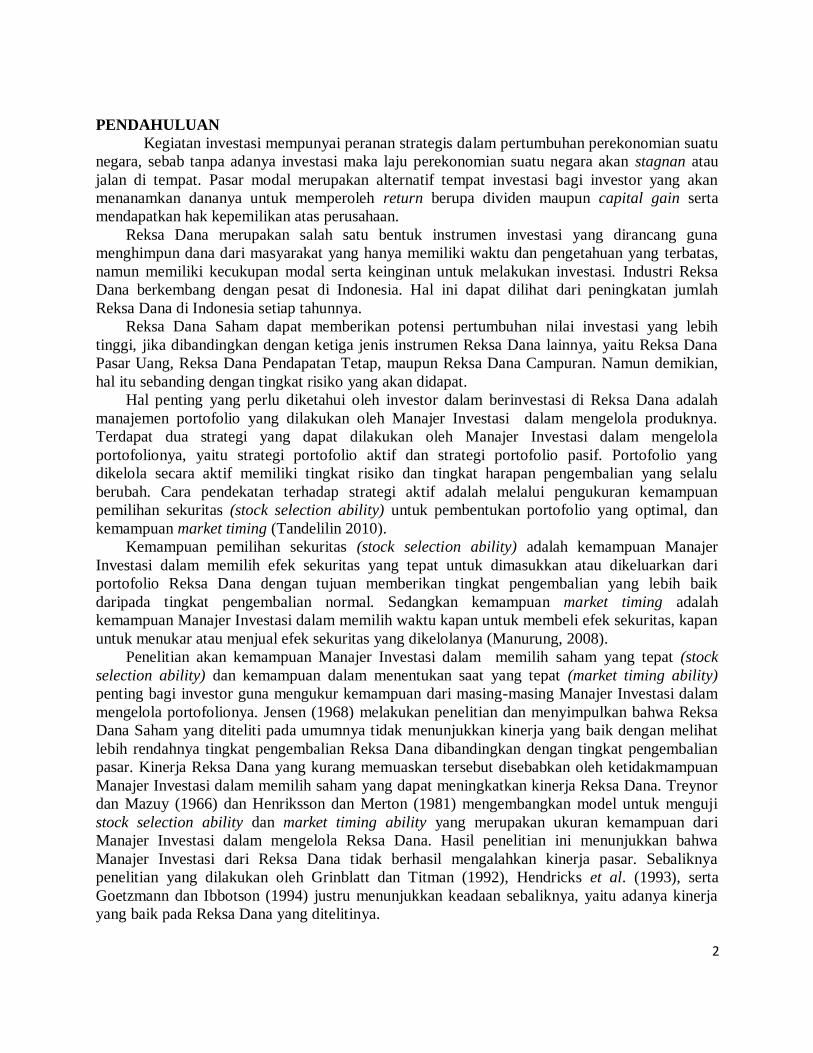
PENDAHULUAN
Kegiatan investasi mempunyai peranan strategis dalam pertumbuhan perekonomian suatu
negara, sebab tanpa adanya investasi maka laju perekonomian suatu negara akan stagnan atau
jalan di tempat. Pasar modal merupakan alternatif tempat investasi bagi investor yang akan
menanamkan dananya untuk memperoleh return berupa dividen maupun capital gain serta
mendapatkan hak kepemilikan atas perusahaan.
Reksa Dana merupakan salah satu bentuk instrumen investasi yang dirancang guna
menghimpun dana dari masyarakat yang hanya memiliki waktu dan pengetahuan yang terbatas,
namun memiliki kecukupan modal serta keinginan untuk melakukan investasi. Industri Reksa
Dana berkembang dengan pesat di Indonesia. Hal ini dapat dilihat dari peningkatan jumlah
Reksa Dana di Indonesia setiap tahunnya.
Reksa Dana Saham dapat memberikan potensi pertumbuhan nilai investasi yang lebih
tinggi, jika dibandingkan dengan ketiga jenis instrumen Reksa Dana lainnya, yaitu Reksa Dana
Pasar Uang, Reksa Dana Pendapatan Tetap, maupun Reksa Dana Campuran. Namun demikian,
hal itu sebanding dengan tingkat risiko yang akan didapat.
Hal penting yang perlu diketahui oleh investor dalam berinvestasi di Reksa Dana adalah
manajemen portofolio yang dilakukan oleh Manajer Investasi dalam mengelola produknya.
Terdapat dua strategi yang dapat dilakukan oleh Manajer Investasi dalam mengelola
portofolionya, yaitu strategi portofolio aktif dan strategi portofolio pasif. Portofolio yang
dikelola secara aktif memiliki tingkat risiko dan tingkat harapan pengembalian yang selalu
berubah. Cara pendekatan terhadap strategi aktif adalah melalui pengukuran kemampuan
pemilihan sekuritas (stock selection ability) untuk pembentukan portofolio yang optimal, dan
kemampuan market timing (Tandelilin 2010).
Kemampuan pemilihan sekuritas (stock selection ability) adalah kemampuan Manajer
Investasi dalam memilih efek sekuritas yang tepat untuk dimasukkan atau dikeluarkan dari
portofolio Reksa Dana dengan tujuan memberikan tingkat pengembalian yang lebih baik
daripada tingkat pengembalian normal. Sedangkan kemampuan market timing adalah
kemampuan Manajer Investasi dalam memilih waktu kapan untuk membeli efek sekuritas, kapan
untuk menukar atau menjual efek sekuritas yang dikelolanya (Manurung, 2008).
Penelitian akan kemampuan Manajer Investasi dalam memilih saham yang tepat (stock
selection ability) dan kemampuan dalam menentukan saat yang tepat (market timing ability)
penting bagi investor guna mengukur kemampuan dari masing-masing Manajer Investasi dalam
mengelola portofolionya. Jensen (1968) melakukan penelitian dan menyimpulkan bahwa Reksa
Dana Saham yang diteliti pada umumnya tidak menunjukkan kinerja yang baik dengan melihat
lebih rendahnya tingkat pengembalian Reksa Dana dibandingkan dengan tingkat pengembalian
pasar. Kinerja Reksa Dana yang kurang memuaskan tersebut disebabkan oleh ketidakmampuan
Manajer Investasi dalam memilih saham yang dapat meningkatkan kinerja Reksa Dana. Treynor
dan Mazuy (1966) dan Henriksson dan Merton (1981) mengembangkan model untuk menguji
stock selection ability dan market timing ability yang merupakan ukuran kemampuan dari
Manajer Investasi dalam mengelola Reksa Dana. Hasil penelitian ini menunjukkan bahwa
Manajer Investasi dari Reksa Dana tidak berhasil mengalahkan kinerja pasar. Sebaliknya
penelitian yang dilakukan oleh Grinblatt dan Titman (1992), Hendricks et al. (1993), serta
Goetzmann dan Ibbotson (1994) justru menunjukkan keadaan sebaliknya, yaitu adanya kinerja
yang baik pada Reksa Dana yang ditelitinya.
2
i
8
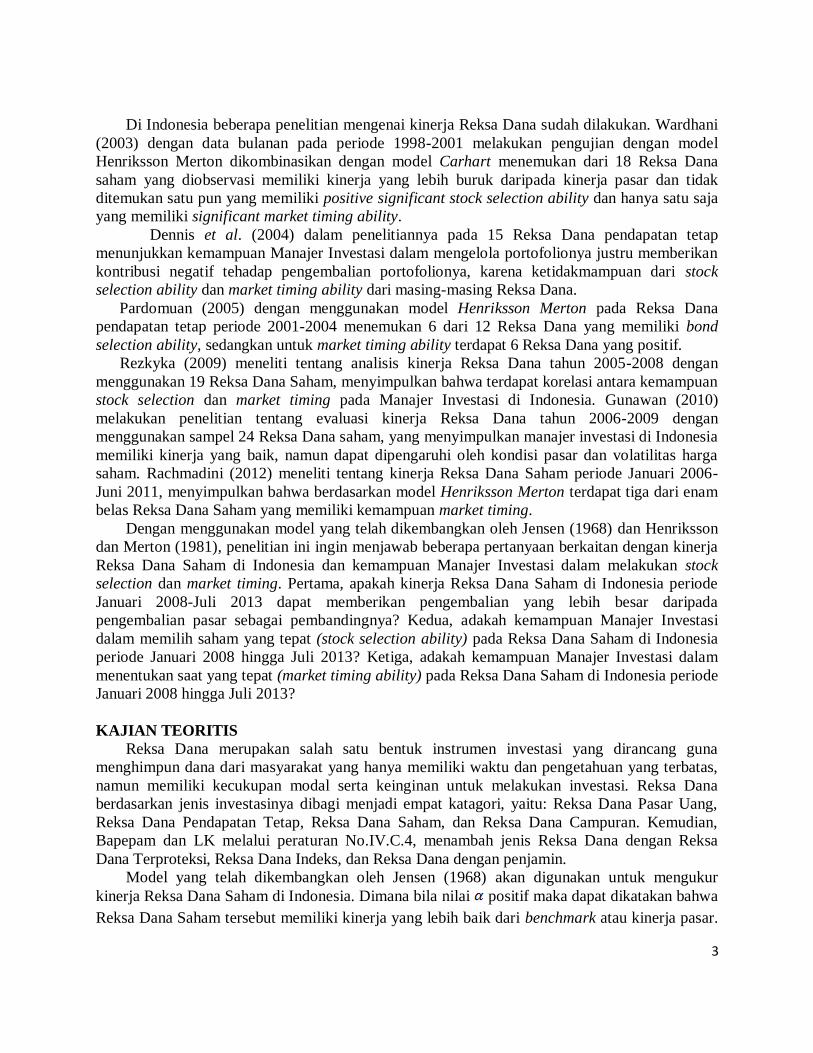
Di Indonesia beberapa penelitian mengenai kinerja Reksa Dana sudah dilakukan. Wardhani
(2003) dengan data bulanan pada periode 1998-2001 melakukan pengujian dengan model
Henriksson Merton dikombinasikan dengan model Carhart menemukan dari 18 Reksa Dana
saham yang diobservasi memiliki kinerja yang lebih buruk daripada kinerja pasar dan tidak
ditemukan satu pun yang memiliki positive significant stock selection ability dan hanya satu saja
yang memiliki significant market timing ability.
Dennis et al. (2004) dalam penelitiannya pada 15 Reksa Dana pendapatan tetap
menunjukkan kemampuan Manajer Investasi dalam mengelola portofolionya justru memberikan
kontribusi negatif tehadap pengembalian portofolionya, karena ketidakmampuan dari stock
selection ability dan market timing ability dari masing-masing Reksa Dana.
Pardomuan (2005) dengan menggunakan model Henriksson Merton pada Reksa Dana
pendapatan tetap periode 2001-2004 menemukan 6 dari 12 Reksa Dana yang memiliki bond
selection ability, sedangkan untuk market timing ability terdapat 6 Reksa Dana yang positif.
Rezkyka (2009) meneliti tentang analisis kinerja Reksa Dana tahun 2005-2008 dengan
menggunakan 19 Reksa Dana Saham, menyimpulkan bahwa terdapat korelasi antara kemampuan
stock selection dan market timing pada Manajer Investasi di Indonesia. Gunawan (2010)
melakukan penelitian tentang evaluasi kinerja Reksa Dana tahun 2006-2009 dengan
menggunakan sampel 24 Reksa Dana saham, yang menyimpulkan manajer investasi di Indonesia
memiliki kinerja yang baik, namun dapat dipengaruhi oleh kondisi pasar dan volatilitas harga
saham. Rachmadini (2012) meneliti tentang kinerja Reksa Dana Saham periode Januari 2006-
Juni 2011, menyimpulkan bahwa berdasarkan model Henriksson Merton terdapat tiga dari enam
belas Reksa Dana Saham yang memiliki kemampuan market timing.
Dengan menggunakan model yang telah dikembangkan oleh Jensen (1968) dan Henriksson
dan Merton (1981), penelitian ini ingin menjawab beberapa pertanyaan berkaitan dengan kinerja
Reksa Dana Saham di Indonesia dan kemampuan Manajer Investasi dalam melakukan stock
selection dan market timing. Pertama, apakah kinerja Reksa Dana Saham di Indonesia periode
Januari 2008-Juli 2013 dapat memberikan pengembalian yang lebih besar daripada
pengembalian pasar sebagai pembandingnya? Kedua, adakah kemampuan Manajer Investasi
dalam memilih saham yang tepat (stock selection ability) pada Reksa Dana Saham di Indonesia
periode Januari 2008 hingga Juli 2013? Ketiga, adakah kemampuan Manajer Investasi dalam
menentukan saat yang tepat (market timing ability) pada Reksa Dana Saham di Indonesia periode
Januari 2008 hingga Juli 2013?
KAJIAN TEORITIS
Reksa Dana merupakan salah satu bentuk instrumen investasi yang dirancang guna
menghimpun dana dari masyarakat yang hanya memiliki waktu dan pengetahuan yang terbatas,
namun memiliki kecukupan modal serta keinginan untuk melakukan investasi. Reksa Dana
berdasarkan jenis investasinya dibagi menjadi empat katagori, yaitu: Reksa Dana Pasar Uang,
Reksa Dana Pendapatan Tetap, Reksa Dana Saham, dan Reksa Dana Campuran. Kemudian,
Bapepam dan LK melalui peraturan No.IV.C.4, menambah jenis Reksa Dana dengan Reksa
Dana Terproteksi, Reksa Dana Indeks, dan Reksa Dana dengan penjamin.
Model yang telah dikembangkan oleh Jensen (1968) akan digunakan untuk mengukur
kinerja Reksa Dana Saham di Indonesia. Dimana bila nilai positif maka dapat dikatakan bahwa
Reksa Dana Saham tersebut memiliki kinerja yang lebih baik dari benchmark atau kinerja pasar.
3
i
9
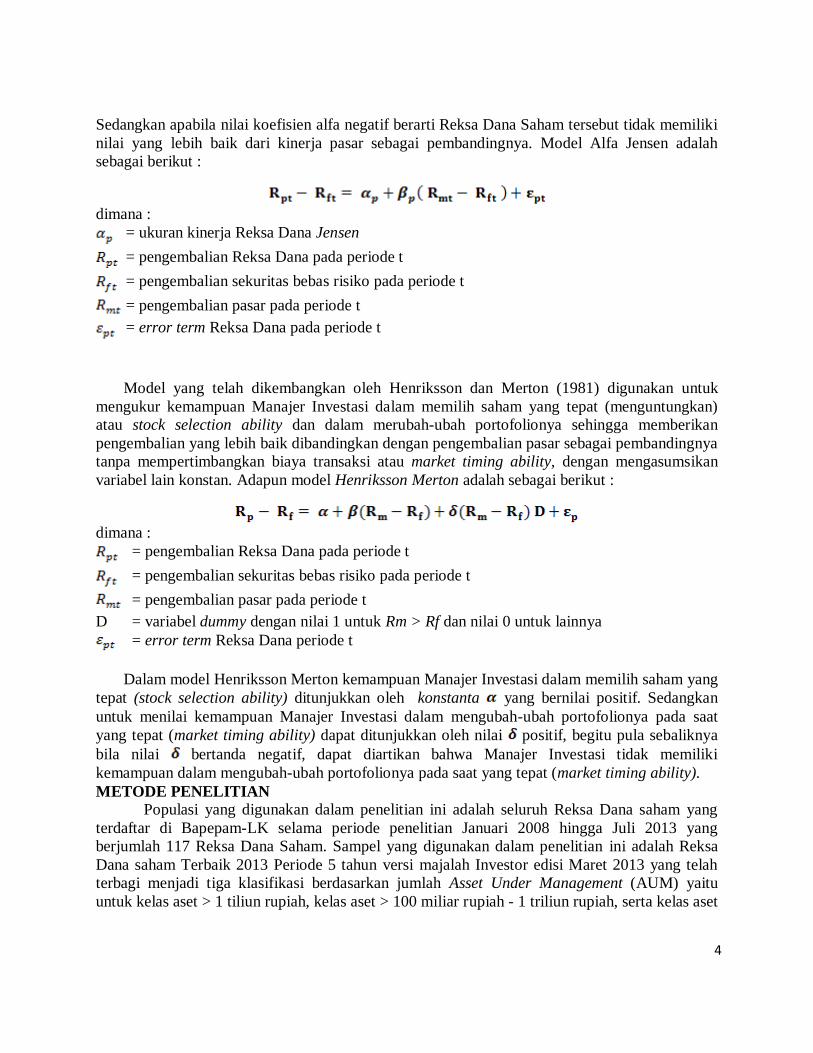
Sedangkan apabila nilai koefisien alfa negatif berarti Reksa Dana Saham tersebut tidak memiliki
nilai yang lebih baik dari kinerja pasar sebagai pembandingnya. Model Alfa Jensen adalah
sebagai berikut :
dimana :
= ukuran kinerja Reksa Dana Jensen
= pengembalian Reksa Dana pada periode t
= pengembalian sekuritas bebas risiko pada periode t
= pengembalian pasar pada periode t
= error term Reksa Dana pada periode t
Model yang telah dikembangkan oleh Henriksson dan Merton (1981) digunakan untuk
mengukur kemampuan Manajer Investasi dalam memilih saham yang tepat (menguntungkan)
atau stock selection ability dan dalam merubah-ubah portofolionya sehingga memberikan
pengembalian yang lebih baik dibandingkan dengan pengembalian pasar sebagai pembandingnya
tanpa mempertimbangkan biaya transaksi atau market timing ability, dengan mengasumsikan
variabel lain konstan. Adapun model Henriksson Merton adalah sebagai berikut :
dimana :
= pengembalian Reksa Dana pada periode t
= pengembalian sekuritas bebas risiko pada periode t
= pengembalian pasar pada periode t
D = variabel dummy dengan nilai 1 untuk Rm > Rf dan nilai 0 untuk lainnya
= error term Reksa Dana periode t
Dalam model Henriksson Merton kemampuan Manajer Investasi dalam memilih saham yang
tepat (stock selection ability) ditunjukkan oleh konstanta yang bernilai positif. Sedangkan
untuk menilai kemampuan Manajer Investasi dalam mengubah-ubah portofolionya pada saat
yang tepat (market timing ability) dapat ditunjukkan oleh nilai positif, begitu pula sebaliknya
bila nilai bertanda negatif, dapat diartikan bahwa Manajer Investasi tidak memiliki
kemampuan dalam mengubah-ubah portofolionya pada saat yang tepat (market timing ability).
METODE PENELITIAN
Populasi yang digunakan dalam penelitian ini adalah seluruh Reksa Dana saham yang
terdaftar di Bapepam-LK selama periode penelitian Januari 2008 hingga Juli 2013 yang
berjumlah 117 Reksa Dana Saham. Sampel yang digunakan dalam penelitian ini adalah Reksa
Dana saham Terbaik 2013 Periode 5 tahun versi majalah Investor edisi Maret 2013 yang telah
terbagi menjadi tiga klasifikasi berdasarkan jumlah Asset Under Management (AUM) yaitu
untuk kelas aset > 1 tiliun rupiah, kelas aset > 100 miliar rupiah - 1 triliun rupiah, serta kelas aset
4
i
10
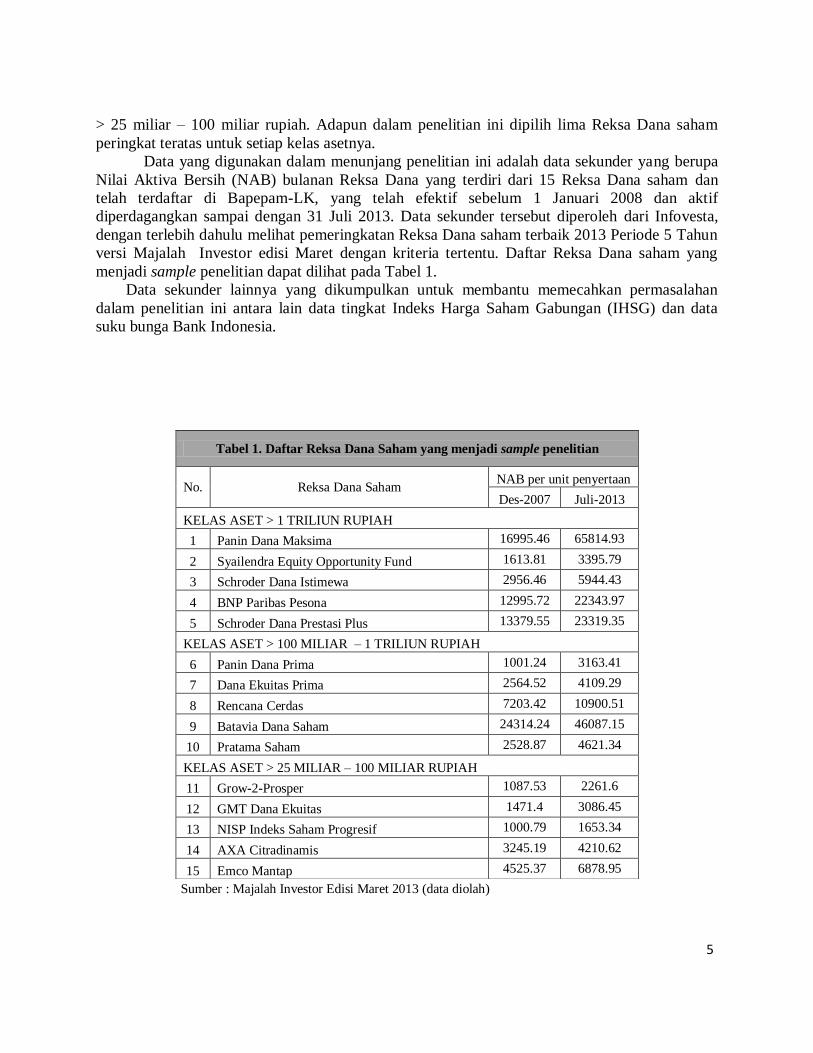
> 25 miliar – 100 miliar rupiah. Adapun dalam penelitian ini dipilih lima Reksa Dana saham
peringkat teratas untuk setiap kelas asetnya.
Data yang digunakan dalam menunjang penelitian ini adalah data sekunder yang berupa
Nilai Aktiva Bersih (NAB) bulanan Reksa Dana yang terdiri dari 15 Reksa Dana saham dan
telah terdaftar di Bapepam-LK, yang telah efektif sebelum 1 Januari 2008 dan aktif
diperdagangkan sampai dengan 31 Juli 2013. Data sekunder tersebut diperoleh dari Infovesta,
dengan terlebih dahulu melihat pemeringkatan Reksa Dana saham terbaik 2013 Periode 5 Tahun
versi Majalah Investor edisi Maret dengan kriteria tertentu. Daftar Reksa Dana saham yang
menjadi sample penelitian dapat dilihat pada Tabel 1.
Data sekunder lainnya yang dikumpulkan untuk membantu memecahkan permasalahan
dalam penelitian ini antara lain data tingkat Indeks Harga Saham Gabungan (IHSG) dan data
suku bunga Bank Indonesia.
Sumber : Majalah Investor Edisi Maret 2013 (data diolah)
Tabel 1. Daftar Reksa Dana Saham yang menjadi sample penelitian
No. Reksa Dana Saham NAB per unit penyertaan
Des-2007 Juli-2013
KELAS ASET > 1 TRILIUN RUPIAH
1 Panin Dana Maksima 16995.46 65814.93
2 Syailendra Equity Opportunity Fund 1613.81 3395.79
3 Schroder Dana Istimewa 2956.46 5944.43
4 BNP Paribas Pesona 12995.72 22343.97
5 Schroder Dana Prestasi Plus 13379.55 23319.35
KELAS ASET > 100 MILIAR – 1 TRILIUN RUPIAH
6 Panin Dana Prima 1001.24 3163.41
7 Dana Ekuitas Prima 2564.52 4109.29
8 Rencana Cerdas 7203.42 10900.51
9 Batavia Dana Saham 24314.24 46087.15
10 Pratama Saham 2528.87 4621.34
KELAS ASET > 25 MILIAR – 100 MILIAR RUPIAH
11 Grow-2-Prosper 1087.53 2261.6
12 GMT Dana Ekuitas 1471.4 3086.45
13 NISP Indeks Saham Progresif 1000.79 1653.34
14 AXA Citradinamis 3245.19 4210.62
15 Emco Mantap 4525.37 6878.95
5
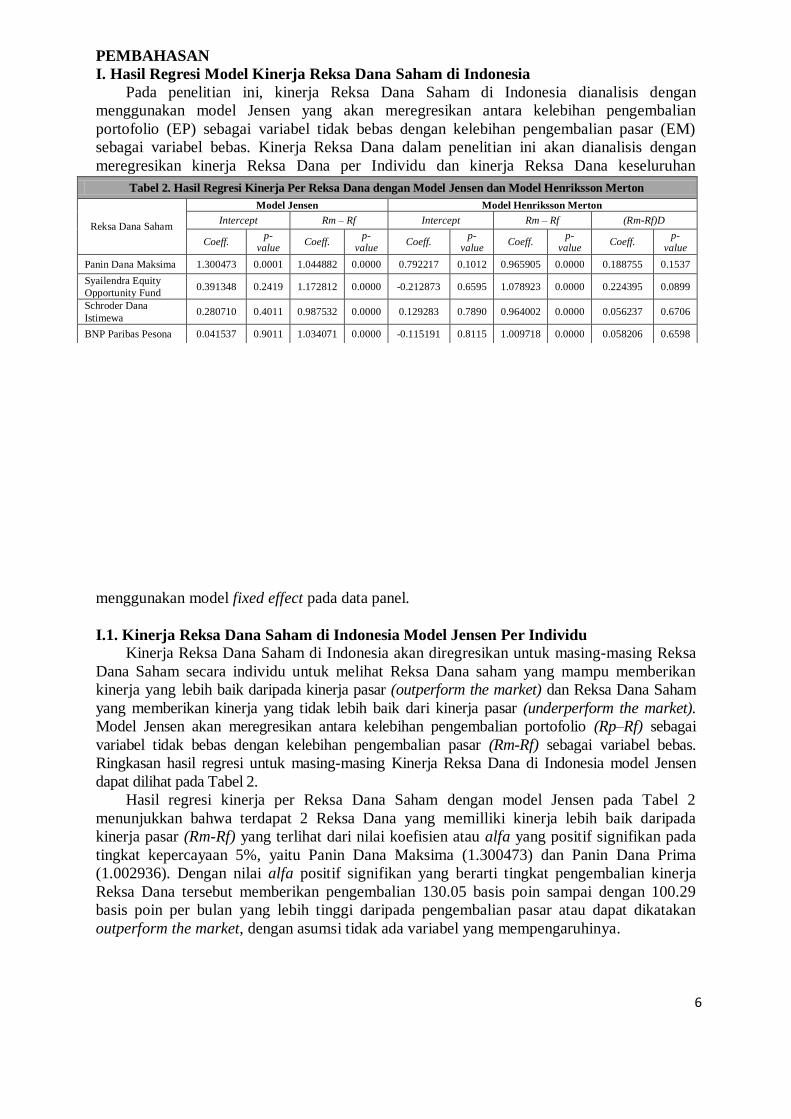
PEMBAHASAN
I. Hasil Regresi Model Kinerja Reksa Dana Saham di Indonesia
Pada penelitian ini, kinerja Reksa Dana Saham di Indonesia dianalisis dengan
menggunakan model Jensen yang akan meregresikan antara kelebihan pengembalian
portofolio (EP) sebagai variabel tidak bebas dengan kelebihan pengembalian pasar (EM)
sebagai variabel bebas. Kinerja Reksa Dana dalam penelitian ini akan dianalisis dengan
meregresikan kinerja Reksa Dana per Individu dan kinerja Reksa Dana keseluruhan
menggunakan model fixed effect pada data panel.
I.1. Kinerja Reksa Dana Saham di Indonesia Model Jensen Per Individu
Kinerja Reksa Dana Saham di Indonesia akan diregresikan untuk masing-masing Reksa
Dana Saham secara individu untuk melihat Reksa Dana saham yang mampu memberikan
kinerja yang lebih baik daripada kinerja pasar (outperform the market) dan Reksa Dana Saham
yang memberikan kinerja yang tidak lebih baik dari kinerja pasar (underperform the market).
Model Jensen akan meregresikan antara kelebihan pengembalian portofolio (Rp–Rf) sebagai
variabel tidak bebas dengan kelebihan pengembalian pasar (Rm-Rf) sebagai variabel bebas.
Ringkasan hasil regresi untuk masing-masing Kinerja Reksa Dana di Indonesia model Jensen
dapat dilihat pada Tabel 2.
Hasil regresi kinerja per Reksa Dana Saham dengan model Jensen pada Tabel 2
menunjukkan bahwa terdapat 2 Reksa Dana yang memilliki kinerja lebih baik daripada
kinerja pasar (Rm-Rf) yang terlihat dari nilai koefisien atau alfa yang positif signifikan pada
tingkat kepercayaan 5%, yaitu Panin Dana Maksima (1.300473) dan Panin Dana Prima
(1.002936). Dengan nilai alfa positif signifikan yang berarti tingkat pengembalian kinerja
Reksa Dana tersebut memberikan pengembalian 130.05 basis poin sampai dengan 100.29
basis poin per bulan yang lebih tinggi daripada pengembalian pasar atau dapat dikatakan
outperform the market, dengan asumsi tidak ada variabel yang mempengaruhinya.
Tabel 2. Hasil Regresi Kinerja Per Reksa Dana dengan Model Jensen dan Model Henriksson Merton
Reksa Dana Saham
Model Jensen Model Henriksson Merton
Intercept Rm – Rf Intercept Rm – Rf (Rm-Rf)D
Coeff. p-
value Coeff.
p-
value Coeff.
p-
value Coeff.
p-
value Coeff.
p-
value
Panin Dana Maksima 1.300473 0.0001 1.044882 0.0000 0.792217 0.1012 0.965905 0.0000 0.188755 0.1537
Syailendra Equity
Opportunity Fund 0.391348 0.2419 1.172812 0.0000 -0.212873 0.6595 1.078923 0.0000 0.224395 0.0899
Schroder Dana
Istimewa 0.280710 0.4011 0.987532 0.0000 0.129283 0.7890 0.964002 0.0000 0.056237 0.6706
BNP Paribas Pesona 0.041537 0.9011 1.034071 0.0000 -0.115191 0.8115 1.009718 0.0000 0.058206 0.6598
6
i
2
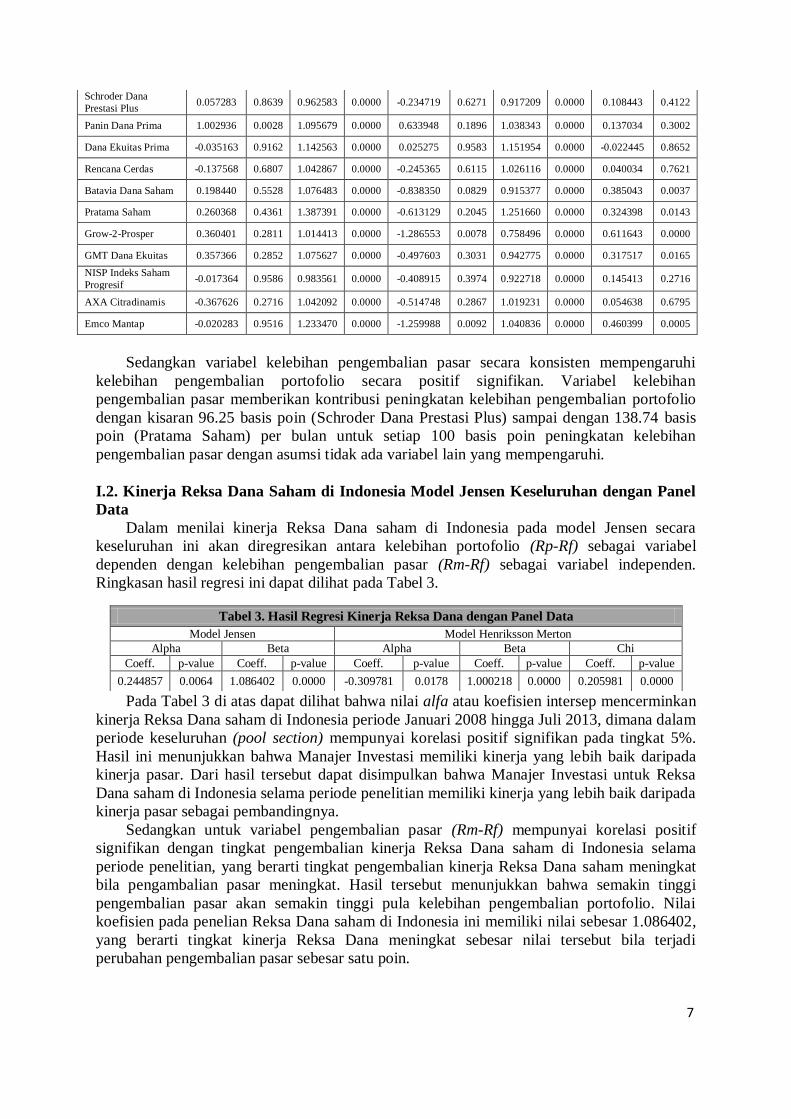
Sedangkan variabel kelebihan pengembalian pasar secara konsisten mempengaruhi
kelebihan pengembalian portofolio secara positif signifikan. Variabel kelebihan
pengembalian pasar memberikan kontribusi peningkatan kelebihan pengembalian portofolio
dengan kisaran 96.25 basis poin (Schroder Dana Prestasi Plus) sampai dengan 138.74 basis
poin (Pratama Saham) per bulan untuk setiap 100 basis poin peningkatan kelebihan
pengembalian pasar dengan asumsi tidak ada variabel lain yang mempengaruhi.
I.2. Kinerja Reksa Dana Saham di Indonesia Model Jensen Keseluruhan dengan Panel
Data
Dalam menilai kinerja Reksa Dana saham di Indonesia pada model Jensen secara
keseluruhan ini akan diregresikan antara kelebihan portofolio (Rp-Rf) sebagai variabel
dependen dengan kelebihan pengembalian pasar (Rm-Rf) sebagai variabel independen.
Ringkasan hasil regresi ini dapat dilihat pada Tabel 3.
Pada Tabel 3 di atas dapat dilihat bahwa nilai alfa atau koefisien intersep mencerminkan
kinerja Reksa Dana saham di Indonesia periode Januari 2008 hingga Juli 2013, dimana dalam
periode keseluruhan (pool section) mempunyai korelasi positif signifikan pada tingkat 5%.
Hasil ini menunjukkan bahwa Manajer Investasi memiliki kinerja yang lebih baik daripada
kinerja pasar. Dari hasil tersebut dapat disimpulkan bahwa Manajer Investasi untuk Reksa
Dana saham di Indonesia selama periode penelitian memiliki kinerja yang lebih baik daripada
kinerja pasar sebagai pembandingnya.
Sedangkan untuk variabel pengembalian pasar (Rm-Rf) mempunyai korelasi positif
signifikan dengan tingkat pengembalian kinerja Reksa Dana saham di Indonesia selama
periode penelitian, yang berarti tingkat pengembalian kinerja Reksa Dana saham meningkat
bila pengambalian pasar meningkat. Hasil tersebut menunjukkan bahwa semakin tinggi
pengembalian pasar akan semakin tinggi pula kelebihan pengembalian portofolio. Nilai
koefisien pada penelian Reksa Dana saham di Indonesia ini memiliki nilai sebesar 1.086402,
yang berarti tingkat kinerja Reksa Dana meningkat sebesar nilai tersebut bila terjadi
perubahan pengembalian pasar sebesar satu poin.
Schroder Dana
Prestasi Plus 0.057283 0.8639 0.962583 0.0000 -0.234719 0.6271 0.917209 0.0000 0.108443 0.4122
Panin Dana Prima 1.002936 0.0028 1.095679 0.0000 0.633948 0.1896 1.038343 0.0000 0.137034 0.3002
Dana Ekuitas Prima -0.035163 0.9162 1.142563 0.0000 0.025275 0.9583 1.151954 0.0000 -0.022445 0.8652
Rencana Cerdas -0.137568 0.6807 1.042867 0.0000 -0.245365 0.6115 1.026116 0.0000 0.040034 0.7621
Batavia Dana Saham 0.198440 0.5528 1.076483 0.0000 -0.838350 0.0829 0.915377 0.0000 0.385043 0.0037
Pratama Saham 0.260368 0.4361 1.387391 0.0000 -0.613129 0.2045 1.251660 0.0000 0.324398 0.0143
Grow-2-Prosper 0.360401 0.2811 1.014413 0.0000 -1.286553 0.0078 0.758496 0.0000 0.611643 0.0000
GMT Dana Ekuitas 0.357366 0.2852 1.075627 0.0000 -0.497603 0.3031 0.942775 0.0000 0.317517 0.0165
NISP Indeks Saham
Progresif -0.017364 0.9586 0.983561 0.0000 -0.408915 0.3974 0.922718 0.0000 0.145413 0.2716
AXA Citradinamis -0.367626 0.2716 1.042092 0.0000 -0.514748 0.2867 1.019231 0.0000 0.054638 0.6795
Emco Mantap -0.020283 0.9516 1.233470 0.0000 -1.259988 0.0092 1.040836 0.0000 0.460399 0.0005
Tabel 3. Hasil Regresi Kinerja Reksa Dana dengan Panel Data
Model Jensen Model Henriksson Merton
Alpha Beta Alpha Beta Chi
Coeff. p-value Coeff. p-value Coeff. p-value Coeff. p-value Coeff. p-value
0.244857 0.0064 1.086402 0.0000 -0.309781 0.0178 1.000218 0.0000 0.205981 0.0000
7
i
3
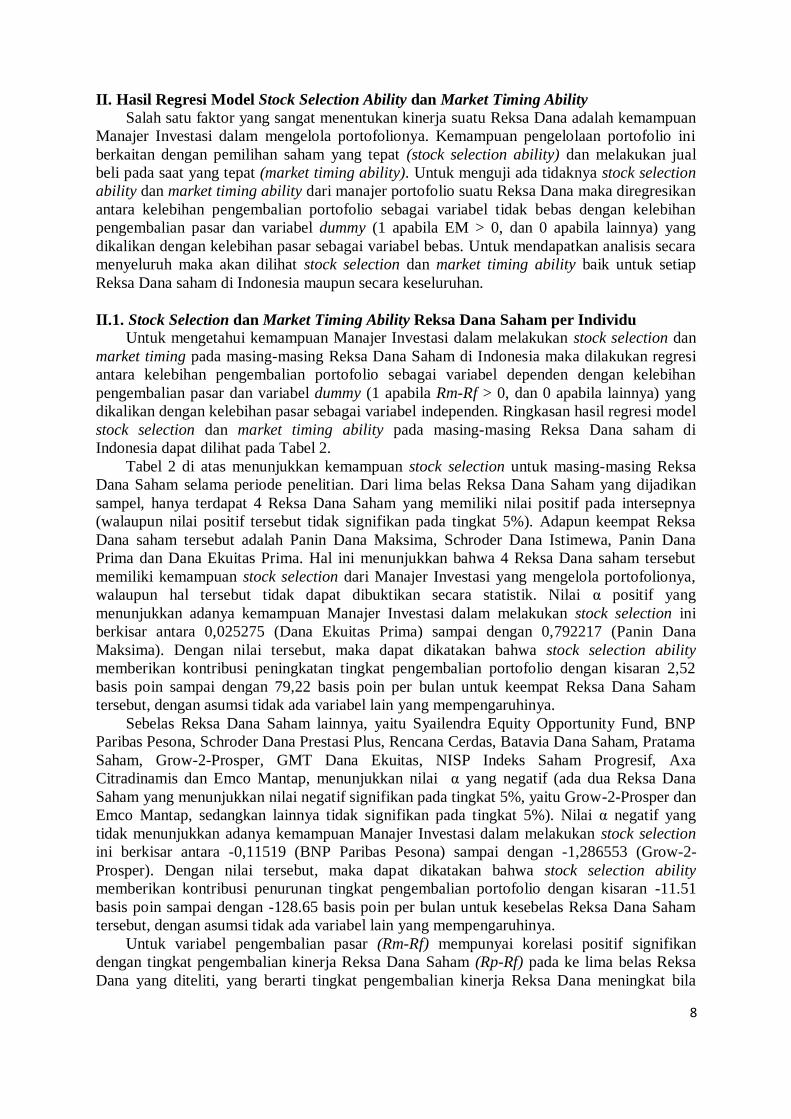
II. Hasil Regresi Model Stock Selection Ability dan Market Timing Ability
Salah satu faktor yang sangat menentukan kinerja suatu Reksa Dana adalah kemampuan
Manajer Investasi dalam mengelola portofolionya. Kemampuan pengelolaan portofolio ini
berkaitan dengan pemilihan saham yang tepat (stock selection ability) dan melakukan jual
beli pada saat yang tepat (market timing ability). Untuk menguji ada tidaknya stock selection
ability dan market timing ability dari manajer portofolio suatu Reksa Dana maka diregresikan
antara kelebihan pengembalian portofolio sebagai variabel tidak bebas dengan kelebihan
pengembalian pasar dan variabel dummy (1 apabila EM > 0, dan 0 apabila lainnya) yang
dikalikan dengan kelebihan pasar sebagai variabel bebas. Untuk mendapatkan analisis secara
menyeluruh maka akan dilihat stock selection dan market timing ability baik untuk setiap
Reksa Dana saham di Indonesia maupun secara keseluruhan.
II.1. Stock Selection dan Market Timing Ability Reksa Dana Saham per Individu
Untuk mengetahui kemampuan Manajer Investasi dalam melakukan stock selection dan
market timing pada masing-masing Reksa Dana Saham di Indonesia maka dilakukan regresi
antara kelebihan pengembalian portofolio sebagai variabel dependen dengan kelebihan
pengembalian pasar dan variabel dummy (1 apabila Rm-Rf > 0, dan 0 apabila lainnya) yang
dikalikan dengan kelebihan pasar sebagai variabel independen. Ringkasan hasil regresi model
stock selection dan market timing ability pada masing-masing Reksa Dana saham di
Indonesia dapat dilihat pada Tabel 2.
Tabel 2 di atas menunjukkan kemampuan stock selection untuk masing-masing Reksa
Dana Saham selama periode penelitian. Dari lima belas Reksa Dana Saham yang dijadikan
sampel, hanya terdapat 4 Reksa Dana Saham yang memiliki nilai positif pada intersepnya
(walaupun nilai positif tersebut tidak signifikan pada tingkat 5%). Adapun keempat Reksa
Dana saham tersebut adalah Panin Dana Maksima, Schroder Dana Istimewa, Panin Dana
Prima dan Dana Ekuitas Prima. Hal ini menunjukkan bahwa 4 Reksa Dana saham tersebut
memiliki kemampuan stock selection dari Manajer Investasi yang mengelola portofolionya,
walaupun hal tersebut tidak dapat dibuktikan secara statistik. Nilai α positif yang
menunjukkan adanya kemampuan Manajer Investasi dalam melakukan stock selection ini
berkisar antara 0,025275 (Dana Ekuitas Prima) sampai dengan 0,792217 (Panin Dana
Maksima). Dengan nilai tersebut, maka dapat dikatakan bahwa stock selection ability
memberikan kontribusi peningkatan tingkat pengembalian portofolio dengan kisaran 2,52
basis poin sampai dengan 79,22 basis poin per bulan untuk keempat Reksa Dana Saham
tersebut, dengan asumsi tidak ada variabel lain yang mempengaruhinya.
Sebelas Reksa Dana Saham lainnya, yaitu Syailendra Equity Opportunity Fund, BNP
Paribas Pesona, Schroder Dana Prestasi Plus, Rencana Cerdas, Batavia Dana Saham, Pratama
Saham, Grow-2-Prosper, GMT Dana Ekuitas, NISP Indeks Saham Progresif, Axa
Citradinamis dan Emco Mantap, menunjukkan nilai α yang negatif (ada dua Reksa Dana
Saham yang menunjukkan nilai negatif signifikan pada tingkat 5%, yaitu Grow-2-Prosper dan
Emco Mantap, sedangkan lainnya tidak signifikan pada tingkat 5%). Nilai α negatif yang
tidak menunjukkan adanya kemampuan Manajer Investasi dalam melakukan stock selection
ini berkisar antara -0,11519 (BNP Paribas Pesona) sampai dengan -1,286553 (Grow-2-
Prosper). Dengan nilai tersebut, maka dapat dikatakan bahwa stock selection ability
memberikan kontribusi penurunan tingkat pengembalian portofolio dengan kisaran -11.51
basis poin sampai dengan -128.65 basis poin per bulan untuk kesebelas Reksa Dana Saham
tersebut, dengan asumsi tidak ada variabel lain yang mempengaruhinya.
Untuk variabel pengembalian pasar (Rm-Rf) mempunyai korelasi positif signifikan
dengan tingkat pengembalian kinerja Reksa Dana Saham (Rp-Rf) pada ke lima belas Reksa
Dana yang diteliti, yang berarti tingkat pengembalian kinerja Reksa Dana meningkat bila
8
i
4
pengembalian pasar meningkat. Hasil ini menunjukkan semakin tinggi kelebihan
pengembalian pasar akan semakin tinggi pula pengembalian portofolio. Nilai koefisien pada
penelitian Reksa Dana Saham di Indonesia berkisar antara 0,915377 sampai 1,251660, yang
berarti tingkat pengembalian kinerja Reksa Dana Saham meningkat sebesar nilai tersebut bila
terjadi perubahan pengembalian pasar sebesar satu poin.
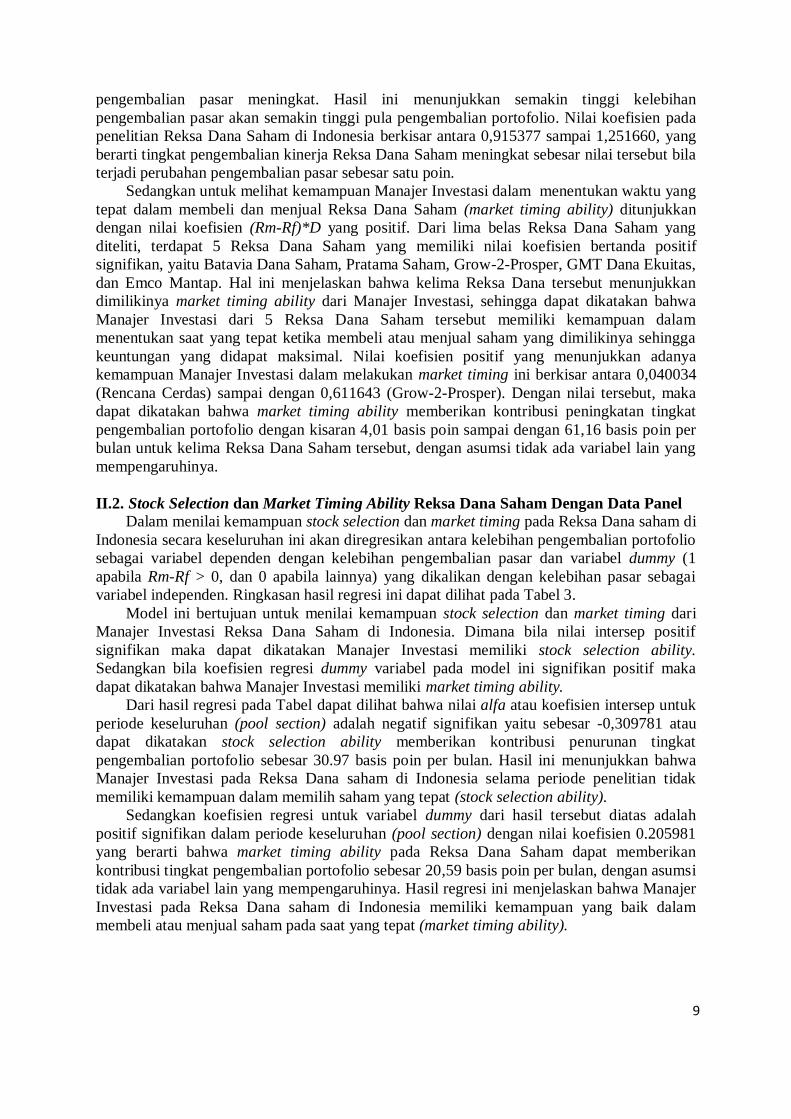
Sedangkan untuk melihat kemampuan Manajer Investasi dalam menentukan waktu yang
tepat dalam membeli dan menjual Reksa Dana Saham (market timing ability) ditunjukkan
dengan nilai koefisien (Rm-Rf)*D yang positif. Dari lima belas Reksa Dana Saham yang
diteliti, terdapat 5 Reksa Dana Saham yang memiliki nilai koefisien bertanda positif
signifikan, yaitu Batavia Dana Saham, Pratama Saham, Grow-2-Prosper, GMT Dana Ekuitas,
dan Emco Mantap. Hal ini menjelaskan bahwa kelima Reksa Dana tersebut menunjukkan
dimilikinya market timing ability dari Manajer Investasi, sehingga dapat dikatakan bahwa
Manajer Investasi dari 5 Reksa Dana Saham tersebut memiliki kemampuan dalam
menentukan saat yang tepat ketika membeli atau menjual saham yang dimilikinya sehingga
keuntungan yang didapat maksimal. Nilai koefisien positif yang menunjukkan adanya
kemampuan Manajer Investasi dalam melakukan market timing ini berkisar antara 0,040034
(Rencana Cerdas) sampai dengan 0,611643 (Grow-2-Prosper). Dengan nilai tersebut, maka
dapat dikatakan bahwa market timing ability memberikan kontribusi peningkatan tingkat
pengembalian portofolio dengan kisaran 4,01 basis poin sampai dengan 61,16 basis poin per
bulan untuk kelima Reksa Dana Saham tersebut, dengan asumsi tidak ada variabel lain yang
mempengaruhinya.
II.2. Stock Selection dan Market Timing Ability Reksa Dana Saham Dengan Data Panel
Dalam menilai kemampuan stock selection dan market timing pada Reksa Dana saham di
Indonesia secara keseluruhan ini akan diregresikan antara kelebihan pengembalian portofolio
sebagai variabel dependen dengan kelebihan pengembalian pasar dan variabel dummy (1
apabila Rm-Rf > 0, dan 0 apabila lainnya) yang dikalikan dengan kelebihan pasar sebagai
variabel independen. Ringkasan hasil regresi ini dapat dilihat pada Tabel 3.
Model ini bertujuan untuk menilai kemampuan stock selection dan market timing dari
Manajer Investasi Reksa Dana Saham di Indonesia. Dimana bila nilai intersep positif
signifikan maka dapat dikatakan Manajer Investasi memiliki stock selection ability.
Sedangkan bila koefisien regresi dummy variabel pada model ini signifikan positif maka
dapat dikatakan bahwa Manajer Investasi memiliki market timing ability.
Dari hasil regresi pada Tabel dapat dilihat bahwa nilai alfa atau koefisien intersep untuk
periode keseluruhan (pool section) adalah negatif signifikan yaitu sebesar -0,309781 atau
dapat dikatakan stock selection ability memberikan kontribusi penurunan tingkat
pengembalian portofolio sebesar 30.97 basis poin per bulan. Hasil ini menunjukkan bahwa
Manajer Investasi pada Reksa Dana saham di Indonesia selama periode penelitian tidak
memiliki kemampuan dalam memilih saham yang tepat (stock selection ability).
Sedangkan koefisien regresi untuk variabel dummy dari hasil tersebut diatas adalah
positif signifikan dalam periode keseluruhan (pool section) dengan nilai koefisien 0.205981
yang berarti bahwa market timing ability pada Reksa Dana Saham dapat memberikan
kontribusi tingkat pengembalian portofolio sebesar 20,59 basis poin per bulan, dengan asumsi
tidak ada variabel lain yang mempengaruhinya. Hasil regresi ini menjelaskan bahwa Manajer
Investasi pada Reksa Dana saham di Indonesia memiliki kemampuan yang baik dalam
membeli atau menjual saham pada saat yang tepat (market timing ability).
9
i
5
KESIMPULAN
Hasil penelitian kinerja Reksa Dana Saham di Indonesia periode Januari 2008-Juli 2013
dengan menggunakan model yang telah dikembangkan oleh Jensen (1968) dan Henriksson
dan Merton (1981), menemukan Reksa Dana Saham di Indonesia selama periode penelitian
memiliki kinerja yang lebih baik daripada kinerja pasar. Hal ini dapat dilihat dari nilai
koefisien alfa yang positif signifikan. Terdapat 10 Reksa Dana Saham yang memiliki nilai
alfa positif (2 diantaranya memiliki nilai positif signifikan). Tingkat pengembalian portofolio
Reksa Dana saham di Indonesia dipengaruhi oleh kinerja pasar.
Manajer Investasi pada Reksa Dana Saham di Indonesia tidak memiliki kemampuan
dalam memilih saham yang tepat (stock selection ability). Terdapat hanya 4 dari 15 Reksa
Dana saham selama periode penelitian yang memiliki stock selection ability (walaupun tidak
signifikan).
Manajer Investasi pada Reksa Dana Saham di Indonesia memiliki kemampuan dalam
menjual/membeli saham pada saat yang tepat (market timing ability). Terdapat 14 Reksa
Dana saham selama periode penelitian yang memiliki market timing ability (5 diantaranya
memiliki nilai signifikan).
IMPLIKASI MANAJERIAL
Bagi Investor yang ingin melakukan investasi di Reksa Dana hendaknya
mempertimbangkan terlebih dahulu kemampuan dari Manajer Investasi dalam mengelola
portofolionya. Karena sekalipun Manajer Investasi melakukan investasi yang mengikuti indeks
pasar (seperti Reksa Dana Indeks) yang menerapkan strategi portofolio pasif, tetap diperlukan
skill atau kemampuan dalam memilih saham yang tepat (stock selection ability) dan menentukan
saat yang tepat dalam mengeksekusi saham yang akan dibeli atau dijualnya (market timing
ability).
Bagi Manajer Investasi, untuk dapat lebih meningkatkan kemampuan saat menentukan
saham-saham dalam portofolio investasinya agar dapat meningkatkan kinerja Reksa Dana.
Saat dilakukan pemilihan terhadap saham-saham yang akan dimasukkan ke dalam portofolio
investasinya, sebaiknya Manajer Investasi melakukan analisis lebih mendalam mengenai
kinerja saham yang bersangkutan, tidak hanya menggunakan strategi momentum sederhana
atau hanya berdasarkan intuisi Manajer Investasi.
Peran regulator dalam hal ini Otoritas Jasa Keuangan (OJK) adalah dengan
menyelenggarakan pelatihan secara rutin bagi para Manajer Investasi, maupun dengan
menerbitkan sertifikasi baru khusus untuk para Manajer Investasi dengan meningkatkan standar
kompetensi dibanding sebelumnya. Dengan hal tersebut, diharapkan Manajer Investasi dapat
meningkatkan kemampuan dalan melakukan stock selection dan market timing dalam mengelola
Reksa Dana di Indonesia.
DAFTAR PUSTAKA
Dennis J, Manurung AH, Nachrowi DN. 2004. Analisis Determinasi Kinerja Reksa Dana
Pendapatan Tetap di Indonesia Periode 1999-2003 (Penggunaan Model Jensen dan
Model Gudikunst). The Indonesian Journal of Accounting Research, 7(2): 224-250.
Goetzmann WN, Ibbotson RG. 1994. Do Winners Repeat? Patterns In Mutual Fund
Behaviour. Journal of Portofolio Management, 20: 9-18.
Grinblatt M, Titman S. 1992. The Presistence of Mutual Fund Performance. Journal of
Finance, 47(5): 1977-1984.
10
i
6
Hendricks D, Pattel J, Zeckhauser R. 1993. Hot Hands in Mutual Funds: Short Run
Persistence of Performance. Journal of Finance, 48(1): 93-130.
Henriksson DR, Merton RC. 1981. On Market Timing and Investment Performance II,
Statistical Procedures for Evaluating Forcasting Skills. Journal of Business, 54(4): 513-
533.
Jensen MC. 1968. The Performance and Mutual Funds in the Period 1945-1964. Journal of
Finance, 23: 389-416.
Manurung AH. 2008. Reksa Dana Investasiku. Jakarta: Kompas.
Pardomuan. 2005. Pengaruh Makro dan Total Aktiva Bersih Terhadap Kinerja Reksa Dana
Pendapatan Tetap di Indonesia Periode 2001-2004. Tesis S2 yang Tidak
Dipublikasikan. Fakultas Pascasarjana Universitas Indonesia.
Putri RA. 2012. Pengukuran Kemampuan Stock Selection dan Market Timing Reksa Dana
Saham di Indonesia. Tesis S2 yang Tidak Dipublikasikan. Program Magister
Manajemen, Fakultas Ekonomi Universitas Indonesia.
Rezkyka N. 2009. Analisis Kinerja Reksa Dana Saham dan Hubungan Antara Kemampuan
Stock Selection dan Market Timing. Tesis S2 yang Tidak Dipublikasikan. Program
Magister Manajemen, Fakultas Ekonomi Universitas Indonesia.
Tandelilin E. 2010. Portofolio dan Investasi Teori. Ed ke-1. Yogyakarta (ID): Percetakan
Kanisius.
Treynor J, Mazuy K. 1966. Can Mutual Funds Outguess The Market?. Harvard Business
Review, 44: 131-136.
Wardhani R. 2003. Analisis Faktor-Faktor Determinasi Kinerja Reksa Dana Saham di
Indonesia Periode 1998-2001.Tesis S2 yang Tidak Dipublikasikan. Fakultas
Pascasarjana Universitas Indonesia.
11
i
7
VALUATION OF PT. ASTRA AGRO LESTARI SHARE PRICE USING DISCOUNTED
CASH FLOW METHOD
DAVID SAPUTRA
Sampoerna School of Business
dan
ADLER HAYMANS MANURUNG
PT Finansial Bisnis Informasi
ABSTRACT
This study was conducted to determine the intrinsic value of PT. Astra Agro Lestari
(AALI) share price by using Discounted Cash Flow Method. This study uses a top-down
analysis approach where the method starts with the macroeconomics analysis and proceed
with the analysis of the company, analysis of financial projections for the next five years and
finally analyzes the determination of the intrinsic value of company share price with different
basic assumptions. The results of calculations with the Discounted Earnings Approach
valuation indicates that the intrinsic value of stock AALI today is Rp. 29,404 in which by
comparing these results with the closing price of Rp 25,800 implies the current stock is
undervalued.
Keywords: Stock Valuation, Fundamental Analysis, Discounted Cash Flow Approach.
12
i
8
Introduction
According to Reuters during the past decade Indonesian economy shows a tremendous
performance with its robust and resilient GDP growth of more than 5 percent per annum. As
the economy consistently growing, this leads to massive improvement in every sector in the
country and finally provides businesses and enterprises to grow in the foreseeable future. The
economic progress is reflected with the positive trend in Indonesian Stock Exchange (IDX)
performance in the earlier January 2014. In accordance to Bloomberg, Indonesian Stock
Indices or Indeks Harga Saham Gabungan (IHSG) grows significantly to 4,454 from around
4,274 at the end of December 2013. This trend is expected to progress as many analysts
believe that Indonesia’s economy still move in the positive direction as a result of election
year in 2014 and the positive sign of global economy drivers such as Japan and United States.
Massive capital inflow to the country as a result of improvement in Indonesian Bond Rating
into Investment Grade from several credit rating agencies such as Moody’s and Fitch boosted
investors’ confidence to invest in the country. Going forward, this phenomenon continues to
drive the increasing shares prices being listed in Indonesia Stock Exchange (Reuters, 2013).
The bullish trend in the market surely makes investors difficult to recognize whether some
shares are still suitable to complements investors portfolio due to the fact that Indonesia stock
market is still considered inefficient. Therefore, it is highly required to determine whether the
intrinsic value of share is correctly priced or mispriced in order to identify which stocks are
worth buying. The enterprise value can be reflected from its intrinsic share price which
essential for both shareholders and stakeholders in deciding strategic corporate actions in the
long term. It is an obligation for all stakeholders who have been given trust by shareholders
to give the optimal return and finally maximize the shareholders wealth through the
increasing share value.Information regarding the share price of a company is truly required
by the investors as guidance in giving investment recommendation on stocks or even in
deciding the potential merger and acquisition.
In fact that Indonesian stock market is still considered inefficient where the current market
price of shares is not reflecting the true fair value of a company. Thus, a comprehensive
fundamental analysis and appropriate valuation method is essentially required in calculating
the true intrinsic value of a company share. One of the most widely-known as accurate and
reliable method in predicting the share value is fundamental analysis in which a
13
i
9
comprehensive analysis is done on the company performance, industry outlook, competitive
positioning and the macro economy conditions. In addition, an appropriate method of
valuation is also needed in identifying the true intrinsic value of a company share. Discounted
Cash Flow (DCF) approach is one of reliable method in valuing the share price through the
projections of company Free Cash Flow (FCF) in the long term.
In accordance to Indonesia Statistic Agency or BPS data in 2013 shows that agribusiness
and plantation industry is one of the most important sectors to Indonesian economy which
contribute 24 percent of the total GDP. Indonesia is the largest palm oil producer in the
world, in which making it as vital sector to country and finally the stocks from plantation
sectors is preferable among investors in the market. Several company shares from plantation
sectors are among top performing and preferred stocks by investors which include in LQ 45
(the market indices for top 45 largest market capitalization and most traded stocks in IDX)
such as PT. Astra Agro Lestari Tbk (AALI), PP. London Sumatera Indonesia, Tbk (LSIP)
and PT. BW Plantation, Tbk (BWPT).
In studying the valuation method for agribusiness sectors, this research selects the case
study on PT. Astra Agro Lestari Tbk (AALI.JK). PT. Astra Agro Lestari Tbk is the largest
agribusiness company listed in Indonesia Stock Exchange (IDX) measured by market
capitalization .Based on Reuters data, in 2013 AALI occupies the first position when it
passed through PT.London Sumatera Tbk (LSIP.JK) and PT. BW Plantation Tbk (BWPT)
with a total capitalization of Rp 37 trillion. As the largest plantation company in terms of
market value followed with strong fundamental as well as higher liquidity, the company
become the top stock list of investor portfolio and the hottest equity research object by almost
analysts in the capital market. Therefore, a reliable and valid valuation method is required in
order to determine the target price of AALI share.
Research Objective
The research aim to give AALI stock valuation and price target as well as
recommendation to investor based on its fundamental analysis.The overall purpose of this
thesis is to determine the fair value of the AALI stock through a strategic and financial
analysis of the corporation. This leads to the following problem statement:What is the fair
value of the AALI stock on January 16th 2015 (Target Price in next 12 months)
3 14
i
10
Literature Review
According to Fama (1970), the intrinsic value of company shares is the reflection of all the
information in the company. Share price can be estimated through several valuation methods.
Myer (1977) asserts that the share price can be forecasted from the present value of its
predictable cash flows plus the value of rights or options embedded in the company. In
addition, valuation’s methods vary in regards to the complexity of approach and the nature of
business models. According to Samsul (2006), there are several common methods in which
widely used in equity valuation such as Discounted Earnings Method, Relative Valuation
Method and Factor Model Approach. Discounted earnings method is classified into two
model such as earning approach and dividend approach. Relative approach is divided into
Price Earnings Ratio (PER), Price to Book Value Ratio (PBR) and Price Dividend Ratio.
Factor model is categorized into single factor, single index model and multifactor model.
According to Manurung (2011), there are several types of approach can be utilized in
conducting valuation such as discounted earnings method which can be calculated from
earnings and dividend. Earnings approach is the first approach being introduced as it believes
that the company will be going concern means that the company always strives to get
earnings. One of the basic foundations in earnings approach is present value principle in
which the value of earnings is the present value from the expected future earnings of the
company.In addition, the earnings approach has four types of method such as discounted
earnings, EBITDA approach, Price Earnings Ratio (PER) approach and free cash flow
approach.
DCF is a simple and widely known method of discounting the value of expected future
cash flows back to present value as a function of the time value of money and risk reflected in
the discount rate. Essentially, the DCF equation answers the question: What is the value of
future cash flows expressed in terms of today’s present value? Evaluating two or more assets
after adjusting each for the impact of both time and risk enables the decision maker to
compare the assets on equal grounds in terms of present value and was widely considered to
be one of the most important contributions to modern finance throughout history. Still to this
day, various DCF techniques are considered to be an integral component of modern day
finance evidenced by Higgins (1998) stating that “Indeed, it is not an exaggeration to say that
discounted cash flow analysis is the backbone of modern finance and even modern business”.
The discounted cash flows method according to Siegel (1985) was first developed by
4 15
i
11
Williams (1938) and later refined in the context of corporate finance by Gordon (1962). The
DCF method of valuation popularized by Gordon (1962) has remained the single most
popular method of valuation among finance professionals for the past four decades (Siegel
1985; Higgins 1998).
Following the work of Gordon (1962), a host of modifications to the traditional DCF
model evolved. To illustrate, Fernandez (2002) compiled a list of ten versions of cash flow
discounting models that can be used to value investments including, free cash flow, equity
cash flow, capital cash flow, adjusted present value, risk adjusted cash flow, risk-free
adjusted, economic profit and economic value added. Applying each model to one specific
company for the purpose of valuation, Fernandez (2002) demonstrates that each model
performs similarly since each method analyzes the same basic reality under the same
circumstances with the only difference being the starting point of the cash flows.
This valuation method is applied to estimate the value of a firm or an asset. It uses
future cash flows projections and discounts them with a suitable rate in order to calculate the
present value of the target. In a simple illustration, a company‘s value is equal to all the cash
they have that could make future investment and generate more money. However, cash in the
future always worth less than cash today due to the inflation. As the result, the net present
value should be multiplied with a discounted factor.There are three pathways to carrying on
DCF valuation approach: classic DCF valuation, adjusted present value approach and excess
returns approach. The classic DCF valuation is considered to be the most popular one due to
its ease. Analysts simply discount cash flows (to firm or equity) at the appropriate discount
rate (cost of capital or cost of equity). The sum of net present value of the cash flows is the
value of equity or firm. The effects of debt financing are built either into the cash flows in
equity valuation or into the cost of capital in firm valuation.
Refer to Manurung (2011) research on valuation in Valuasi Wajar Perusahaan, Discounted
Cash Flow model based on the discounted earnings approach is done by analyzing the free
cash flow of a company. Free cash flow is the summation of the cash flow from operations
and cash flow from investing activities. To understand the essence of cash flow in the
company is very important in determining the company expected cash flow. Cash flow itself
is categorized into cash inflow and cash outflow. Cash inflow said to be positive indicator as
it is cash coming from company revenue streams as a result of effective business operations.
Meanwhile, the cash outflow accounted as negative as it is cash paid out by a company to
sustain its operation in the future for example investment and expenditure. The statement of
5 16
i
12
cash flow from the company financial report is an obligation from the regulator to make sure
that investors recognize the cash flow of a company from its operation, financing and
investing activities.
There are several activities affecting the company cash inflow such as income streams
from company business operations, additional financing to company business operations,
issuance of company new shares, and income from asset’s sale activities such as property,
factory, land, inventories and other type of assets. The cash inflow and cash outflow in the
company can be categorized into three characteristics of cash flow activities such as cash
flow from operations, cash flow from investing activities and cash flow from financing
activities. According to Anthony, et al (2007) asserts that the cash flow calculation can be
performed through direct method and indirect method or reconciliation method. Direct
method is done by directly calculated the total of cash inflow and cash outflow in the
company. Currently, the regulators expect the company to provide this direct method of cash
flow calculation in the financial report. However, the company should also provide the
reconciliation from net income and cash flow from operations in the separate financial report.
Meanwhile, indirect method is done through the indirect calculation in which very
distinctive and difficult to understand compare to direct method. The indirect method started
with the net income calculation to be added with non-cash expenses such as
depreciation/amortization and additional working capital. As the free cash flow is the
difference of the cash flow from operations and cash flow from investing, thus when there is
a surplus in free cash flow or positive free cash flow, it can be used to other investments such
as financial instruments. If the free cash flow is negative or deficit, the company should
finance it through the bond issuance or new shares issuance in order to net off the deficit. The
calculation on company value with free cash flow approach states that the value of company
is the cash flow into the company as long as it operates. The future net cash flows of
company are defined as the true value of the company. According to Damodaran (2002), the
calculation on company value with discounted cash flow approach can be done by two form
of model, first is free cash flow and second is free cash flow to equity of FCFE.Finally, due
to its comprehensiveness in valuing the company future cash flows and appropriate approach
to AALI business model, hence the author focuses the AALI stock price valuation with
Discounted Cash Flow (DCF) model valuation.
Manurung (2011) asserts that the valuation method with discounted earnings approach lay
on the principle of “going concern”. Going concern principle believes that the company is
6 17
i
13
assumed to operate its business in the foreseeable future and will always make earnings. In
other words, the true value of a company share is measured by the capability of company to
create earnings in the future. This obliges investors to conduct appropriate valuations in
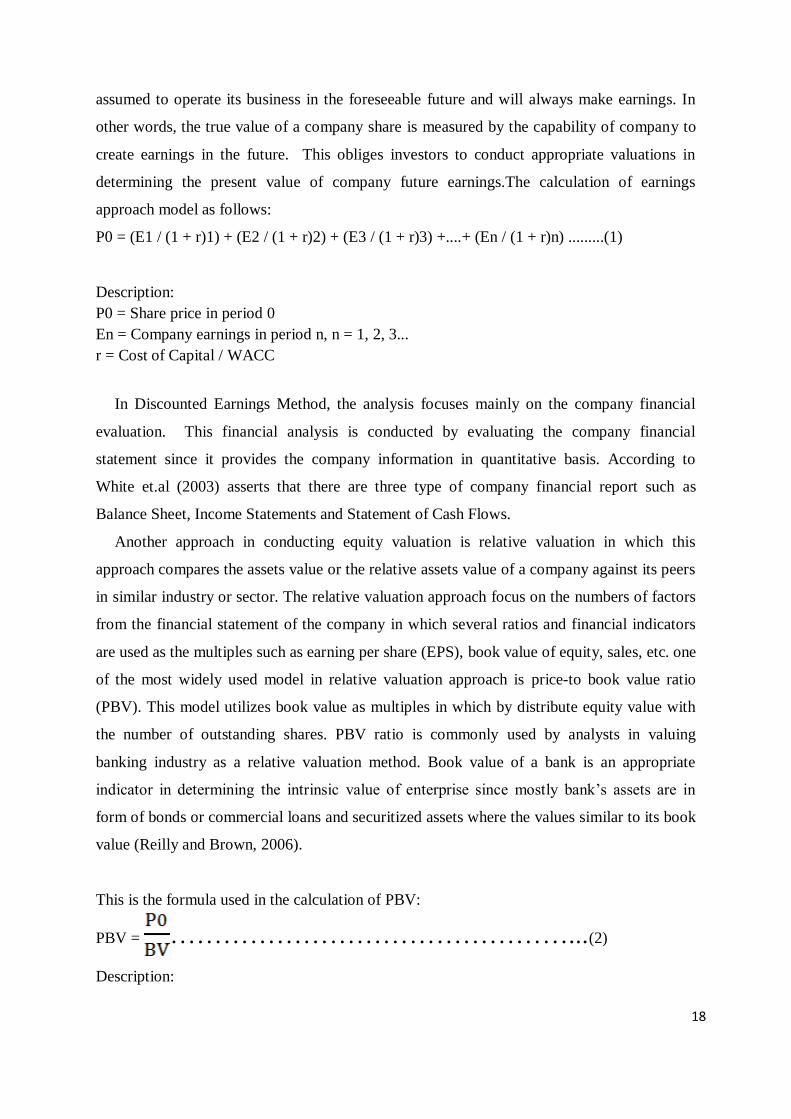
determining the present value of company future earnings.The calculation of earnings
approach model as follows:
P0 = (E1 / (1 + r)1) + (E2 / (1 + r)2) + (E3 / (1 + r)3) +....+ (En / (1 + r)n) .........(1)
Description:
P0 = Share price in period 0
En = Company earnings in period n, n = 1, 2, 3...
r = Cost of Capital / WACC
In Discounted Earnings Method, the analysis focuses mainly on the company financial
evaluation. This financial analysis is conducted by evaluating the company financial
statement since it provides the company information in quantitative basis. According to
White et.al (2003) asserts that there are three type of company financial report such as
Balance Sheet, Income Statements and Statement of Cash Flows.
Another approach in conducting equity valuation is relative valuation in which this
approach compares the assets value or the relative assets value of a company against its peers
in similar industry or sector. The relative valuation approach focus on the numbers of factors
from the financial statement of the company in which several ratios and financial indicators
are used as the multiples such as earning per share (EPS), book value of equity, sales, etc. one
of the most widely used model in relative valuation approach is price-to book value ratio
(PBV). This model utilizes book value as multiples in which by distribute equity value with
the number of outstanding shares. PBV ratio is commonly used by analysts in valuing
banking industry as a relative valuation method. Book value of a bank is an appropriate
indicator in determining the intrinsic value of enterprise since mostly bank’s assets are in
form of bonds or commercial loans and securitized assets where the values similar to its book
value (Reilly and Brown, 2006).
This is the formula used in the calculation of PBV:
PBV = ………………………………………...(2)
Description:
7 18
i
14
P0 = Share Price
BV = Book Value of Equity
In this thesis, the author intend to test AALI stock price with Discounted Earnings
approach specifically with Discounted Cash Flow (DCF) model. The reason why choosing
DCF model due to its alignment with AALI business model which suits to valuate in cash
basis method. Most tests of DCF models have been done byusing dividend discount
models.However, in this research, DCF method chosen as the ideal method for analysis since
it is more appropriate to the nature of plantation business where it relies on the long term
investment which is plantation as the future generating cash flow investment. On top of that,
in agribusiness sectors where AALI operate, not all the companies distribute the dividend
payment consistently to its investors which make it difficult to analyze with dividend model.
In addition, the literature review actually seeks to provide an overview of the DCF
valuationmethodused for the purpose of cash flow projections and value estimator.
In investments, it is impossible to get rid of all the risk. As investors, it deserves a rate of
return that compensates for taking on risk. The capital asset pricing model (CAPM) helps to
calculate investment risk and what return on investment should expect. The capital asset
pricing model was the work of financial economist William Sharpe, set out in his 1970 book
"Portfolio Theory and Capital Markets." His model starts with the idea that individual
investment contains two types of risk: First, Systematic Risk, these are market risks that
cannot be diversified away. Interest rates, recessions and wars are examples of systematic
risks. Second, Unsystematic Risk, also known as "specific risk," this risk is specific to
individual stocks and can be diversified away as the investor increases the number of stocks
in his or her portfolio. In more technical terms, it represents the component of a stock's return
that is not correlated with general market moves.
Modern portfolio theory shows that specific risk can be removed through diversification.
The trouble is that diversification still doesn't solve the problem of systematic risk; even a
portfolio of all the shares in the stock market can't eliminate that risk. Therefore, when
calculating a deserved return, systematic risk is what plagues investors most. CAPM,
therefore, evolved as a way to measure this systematic risk.
Sharpe found that the return on an individual stock, or a portfolio of stocks, should equal
its cost of capital. The standard formula remains the CAPM, which describes the relationship
between risk and expected return. Here is the formula:
8 19
i
15
ra = rf + βa (rm-rf)………………………………………………………….(3) Description:
(rm-rf) = Equity market premium
rf =Risk free rate
βa= Beta of stock
rm = Expected market return
Discount Rate Estimation
In conducting valuationwith discounted earnings approach, the discount rate is required to
calculate the present value of future expected cash flow from the company operations.
Discount rate used in this discounted earnings approach is Weighted Average Cost of Capital
(WACC).
Cost of Fund
Cost of Fund (Kd) is the cost which company should pay from its liabilities or
debts.Generally, the cost is paid in the form of interest’s fee and interest rate is determined by
the creditors. The interest rate is charged in accordance to several factors such as interest rate
in the market and default risk factor. Due to the difference of total debt and interest, therefore
the cost of fund is proportionately measured by its weighted average cost of fund.
Cost of Equity
Cost of Equity (Ke) is the expected rate of return from the company share. Investors
usually expect the return from the investment being made in the company shares.One of the
most common ways in calculating cost of equity is by using Capital Asset Pricing Model
(CAPM). This is the formula used in the calculation of cost of equity (Ke) with CAPM:
Ke = Rf + β x (Rm – Rf) ..................................................................................... (4)
In accordance to formula above, there are three data required as the input in CAPM
calculation, such as:
1. Risk free rate (Rf)
Risk free rate is the rate of return from the risk-free investing instrument.Risk free
investment is the government financial assets such as treasury bills or Sertifikat Bank
Indonesia (SBI), government bonds or SuratUtang Negara (SUN) which have low
probability of default.
2. Beta (β)
Beta measures the sensitivity of share to the systematic risk. In CAPM, the systematic
risk is defined as the market risk as a whole. In line with the concept of “higher risk
9 20
i
16
higher return”, therefore beta also can measure the relationship between the company
stock return and the market return.
3. Risk Premium (Rm-Rf)
Risk Premium is the difference of the average return of market and the average return
of risk free asset. According to Damodaran (2002), the rate ofrisk premiumof each
country is not similar as a result of different macro economy conditions, political risk,
and market structure.In calculating CAPM, the difference in each country risk can be
accommodated by addingthe country riskpremium, where the additionalpremiumto
offset the unique risk from each country.
4. Weighted Average Cost of Capital
Weighted Average Cost of Capital (WACC) is the average weighted of the whole
capital injected in the companyincludes cost of debt and cost of equity.
The formula used to calculate WACC as follows:
WACC …………………………..(5)
Description:
Ke = Cost of Equity
Kd = Cost of Debt
T = Tax rate
Equity Proportion
Debt Proportion
Data Collection Method
The thesis is written from an investor’s point of view and this implies that only publicly
available information will be applied in the thesis. As the valuation of AALI consists of both
financial and strategic aspects the data applied will be both quantitative and qualitative. The
primary sources of information are the annual reports of AALI and its competitors, which are
supplemented with the company web sites, statistical data, articles from journals and
newspapers as well as professional market reports create the foundation for a solid
knowledge on AALI and the plantation industry in general. The study trails the previous five
years financial performance and focuses on the five years duration of financial projections
starting from 2014 to 2018.The source of data used in this study is secondary data as it is
10 21
i
17
obtained indirectly from data source center such as Thomson Reuters and other medias as
follows:
a) Financial Report and Annual Report of PT. Astra Agro Lestari, Tbk in period of
2009-2013.
b) Share price quote ofPT. Astra Agro Lestari, Tbk with tickers AALI for five years
period (2009-2013).
c) Indonesian Stock Indices or Indeks Harga Saham Gabungan (IHSG) data in the same
period of year (2009-2013) in order to compare the share performance of AALI with
market performance.
d) Variable data such as Macro economy indicators (interest rate, GDP growth, inflation,
SBI rate and exchange rate) and industry productivity.
Method of Analysis
In this research, the selection method of a company is by purposive sampling method/non-
probability sampling which means that selecting PT. Astra Agro Lestari, Tbk. do not take
into account the principle of probability, and only seeing the factors from the data with the
purpose of research. The reason to choose AALI as the sample on this study because AALI
share include in LQ45 indices where the company shares is categorized as liquid shares,
mostly traded in large volume as well as one of the largest company in terms of market
capitalization. Thus, the result on this study is not the reflection to other companies in same
sectors or even across industry.
Phase of Fundamental Analysis
There are several steps in conducting the fundamental analysis and valuation on this study:
a. First, cconducting global macro economy analysis which affects the industry and
company performance in this case is AALI.
b. Second, doing industry analysis in which AALI include in the agribusiness and
plantation industry. Industry analysis is conducted with Michael Porter theory, five
forces model of competition, plantation industry analysis, and several financial
indicators analysis.
c. Third, conducting company analysis such as financial performance analysis, key
ratios analysisand financial projections analysis in which to be assumed based on the
macro economy and industry conditions.
d. Fourth, conducting cost of capital/WACC calculation.
e. Fifth, determining the share price target with valuation calculation by conducting
Discounted Earnings Approach (DCF).
11 22
i
18
RESULT ANALYSIS AND DISCUSSION
Global and Indonesia’s Macro Economy Analysis
The global economy is on the rising trend in 2013 and continues to move forward as the
macro economy indicators show a positive sign. According to International Monetary Fund
(IMF) in World Economic Outlook (WEO) 2014, global economy growth is projected to
strengthen to 3.6 percent in 2014 and then to increase further to 3.9 percent in 2015 (See table
1IMF World Economic Outlook 2014).A major impulse to global growth has come from the
United States, whose economy grew at 3¼ percent in the second half of 2013, stronger than
expected in the October 2013.Growth in other advanced economies is also projected to
strengthen moderately in 2014–2015, as a result of inclining momentum in 2013. GDP
growth in the global key drivers such as Japan, Emerging Asia and Advanced Europe remain
on the rising trend. Growth in Japan is expected to moderate, mostly as the result of a modest
fiscal drag. Among emerging market economies, growth is projected to remain robust in
emerging and Developing Asia and economy to recover in Eurozone drive by the Germany
and France as the main contributor.
Many analysts believe that Indonesia economic growth is bouncing back in 2014 as a
result of the election year in 2014 and declining in the current trade deficits. Bank Indonesia
forecasts that Indonesia GDP growth may increase to 5.86 percent in 2014 from 5.71 percent
in 2013 (Bank Indonesia). Getting election boost in 2014, though trending down, due to
subsidized fuel price hike and efforts to curb current account deficits in 2013-2014 via
monetary tightening. Non-food spending may still provide support, albeit investments may
grow slower. Headline inflation returning to normal after temporary pick up in 2013,
following administered and food prices hike. The ex-gold core inflation is seen rising lately
indicating pressure coming from Foreign Exchange (FX) depreciation. Policy rate has been
raised by 175 bps in 2013 in response to the higher inflation rate due to energy subsidy
reforms and efforts to close the perception gap. Current Account deficits expected to shrink,
as exports rises slowly with commodity prices stabilizing and slightly up. Balance of
Payment may still be in surplus despite some temporary outflows of capital. BI balancing FX
intervention and keeping FX reserves.
12 23
i
19
AALI Overview and Business Description
PT. Astra Agro Lestari Tbk is Indonesia's largest agribusiness company by market value.
AALI is a leading palm oil producer in Indonesia, established since 33 years ago and
headquartered in Jakarta. AALI deliver high quality palm oil products (CPO) to fulfill the
domestic and export markets. AALI, majority-owned by diversified conglomerate Astra
International, the largest diversified conglomerates in Indonesia. Astra Agro Lestari is
financially sound and has a strong presence in domestic market as well as benefit from
Indonesia’s economic growth, natural resources and infrastructure development. After the
long journey through acquisitions, mergers, and development, AALI has assets of Rp 14.96
trillion by the end of 2013. Currently, AALI manages the total of 281,378 ha of oil palm
plantations, which consist of 220,021 ha of nucleus estates and 61,357 ha of plasma estates.
In order to operate, AALI employs 29,766 permanent employees in Jakarta, Sumatra,
Kalimantan and Sulawesi. AALI has been public listed in Indonesia Stock Exchange (IDX)
since 1997. Currently public investors holding are 20.32% of the shares. Since the Initial
Public Offering (IPO) in 1997, AALI shares prices have been steadily increasing from Rp
1,550 per share to Rp 25,100 per share at the end of IDX trading in December 2013
(Company Annual Reports).
The outlook for 2014 remains positive, despite heightened competition in the agribusiness
market and weak rupiah concerns about possible increases in interest rates as well as inflation
remain.AALI’s CPO production increase 4.1%, reaching 1.39 million tonnes. The increase of
AALI’s CPO production until November 2013, is driven by the increase of November 2013
production amounting 155,321 tonnes. Thus, AALI’s CPO production until November 2013
reaches 1.39 million tonnes or increase by 4.1% compared to the same period last year.
Rising production trend in November 2013 also occurs in AALI’s kernel production which
reaches 296,886 tonnes or increase by 1.3% from 293,155 tonnes in 2012.
The challenging year of 2013 have inevitably affected the performance of PT Astra Agro
Lestari Tbk. Slow recovery from the global economic crisis has contributed to the price
volatility of various commodities, including the Crude Palm Oil (CPO) price. On the other
hand, US government policies to reduce the injection of fresh funds to support the recovery
of their real sectors have led to the depreciation of most Asian currencies, including the
Indonesian Rupiah. In addition, unfavorable weather condition also impacted to the decline of
operational performance in most palm plantations.As shown in figure 4.8, the production of
the Company’s Fresh Fruit Bunches (FFB) from nucleus plantations declined by 9.5%, from
13 24
i
20
4.13 million tons in 2012 to 3.74 million tons in 2013. This has brought down the average
crop productivity (yield) in 2013 to 20.7 tons/ha, compared to 23.5 tons/ha in the previous
year. Nevertheless, the company was still able to manage total CPO production of 1.54
million tons, an increase of 4.2% compared to last year. This increase was attributed to a
41.5% increase of FFB purchased from third party, from 1.26 million tons in 2012 to 1.78
million tons in 2013. CPO production in 2013 was the highest production level in the
Company’s history. With an average CPO selling price of Rp 7,277/kg, 0.6% lower
compared to 2012 price, coupled with a foreign exchange loss due to the Company’s US
Dollars debt, the Company still managed to record a profit attributable to Shareholders of Rp
1.80 trillion in 2013, lower than the Rp 2.41 trillion earned from the previous year.
Facing the challenging business climate of 2013, AALI strived to strengthen its business
model and focused on four key areas, namely: First, the company strived to achieve cost
leadership by improving internal processes, so that operational efficiency can be improved
through intensification and mechanization programs. Second, the company has been
expanding its business lines, both upstream by developing own seedling area, and
downstream by building a refinery and establishing a joint venture marketing company in
Singapore to market CPO derivative products. Third, the company expanded into rubber
plantations, as a part of its diversification strategy. Fourth, the company continued its efforts
to acquire new landbank followed by implementing a new planting and replanting program,
in order to ensure production sustainability.Capital expenditure of Rp 2.87 trillion was spent
throughout 2013 to support company growth strategy in the long term. Most of this
investment was allocated for intensification and mechanization activities, adding the capacity
of the CPO mills and storage, construction of refinery plants, as well as new planting of oil
palm crops and rubber, and replanting of oil palm crops. In 2013, the company increased its
CPO storage capacity by 10,000 tons to 225,450 tons. In the same year, the company
completed construction of one refinery in West Sulawesi. This plant has now begun operating
commercially, with a production capacity of 2,000 tons CPO/day. First shipment from this
refinery to customers was done in February 2014. Throughout 2013, the company carried out
new planting and replanting of 10,720 hectares.
Financial Analysis of AALI
As shown from table 1, AALI posted impressive financial results during the last five years
with the inclining revenue growth of more than 15 percent CAGR. The revenues grow from
14 25
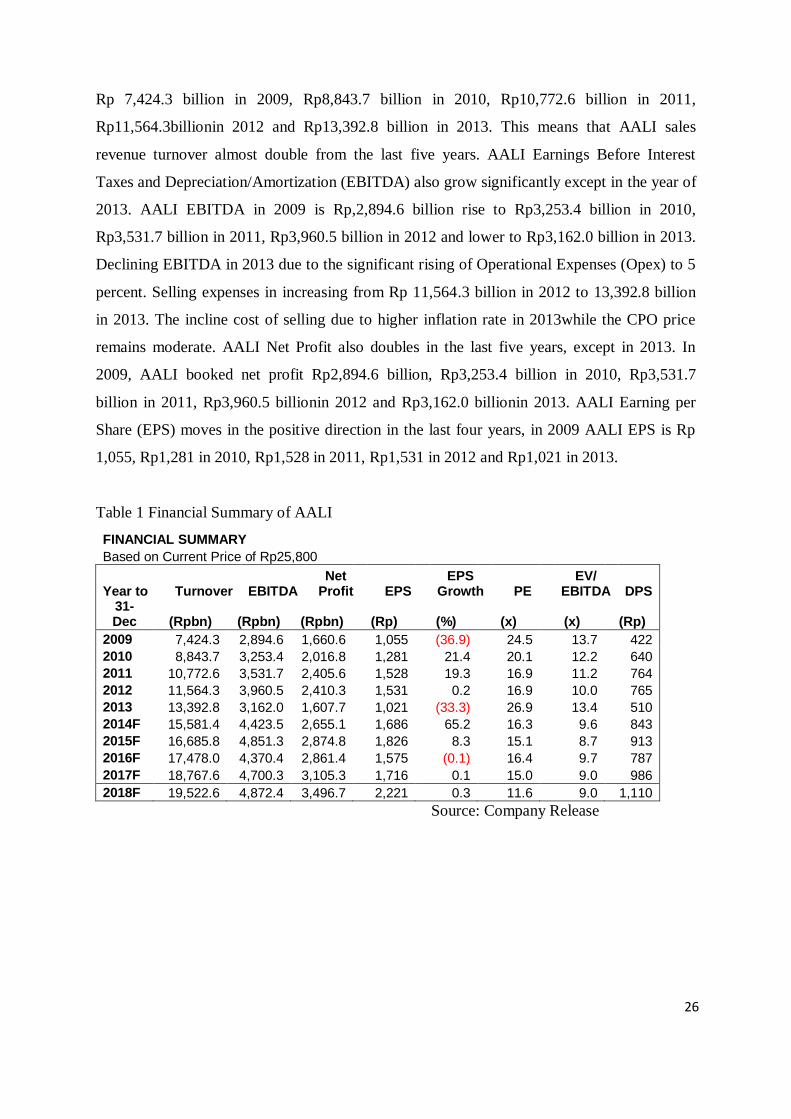
i
21
Rp 7,424.3 billion in 2009, Rp8,843.7 billion in 2010, Rp10,772.6 billion in 2011,
Rp11,564.3billionin 2012 and Rp13,392.8 billion in 2013. This means that AALI sales
revenue turnover almost double from the last five years. AALI Earnings Before Interest
Taxes and Depreciation/Amortization (EBITDA) also grow significantly except in the year of
2013. AALI EBITDA in 2009 is Rp,2,894.6 billion rise to Rp3,253.4 billion in 2010,
Rp3,531.7 billion in 2011, Rp3,960.5 billion in 2012 and lower to Rp3,162.0 billion in 2013.
Declining EBITDA in 2013 due to the significant rising of Operational Expenses (Opex) to 5
percent. Selling expenses in increasing from Rp 11,564.3 billion in 2012 to 13,392.8 billion
in 2013. The incline cost of selling due to higher inflation rate in 2013while the CPO price
remains moderate. AALI Net Profit also doubles in the last five years, except in 2013. In
2009, AALI booked net profit Rp2,894.6 billion, Rp3,253.4 billion in 2010, Rp3,531.7
billion in 2011, Rp3,960.5 billionin 2012 and Rp3,162.0 billionin 2013. AALI Earning per
Share (EPS) moves in the positive direction in the last four years, in 2009 AALI EPS is Rp
1,055, Rp1,281 in 2010, Rp1,528 in 2011, Rp1,531 in 2012 and Rp1,021 in 2013.
Table 1 Financial Summary of AALI
FINANCIAL SUMMARY Based on Current Price of Rp25,800
Year to Turnover EBITDA Net
Profit EPS EPS
Growth PE EV/
EBITDA DPS 31-Dec (Rpbn) (Rpbn) (Rpbn) (Rp) (%) (x) (x) (Rp)
2009 7,424.3 2,894.6 1,660.6 1,055 (36.9) 24.5 13.7 422
2010 8,843.7 3,253.4 2,016.8 1,281 21.4 20.1 12.2 640
2011 10,772.6 3,531.7 2,405.6 1,528 19.3 16.9 11.2 764
2012 11,564.3 3,960.5 2,410.3 1,531 0.2 16.9 10.0 765
2013 13,392.8 3,162.0 1,607.7 1,021 (33.3) 26.9 13.4 510
2014F 15,581.4 4,423.5 2,655.1 1,686 65.2 16.3 9.6 843
2015F 16,685.8 4,851.3 2,874.8 1,826 8.3 15.1 8.7 913
2016F 17,478.0 4,370.4 2,861.4 1,575 (0.1) 16.4 9.7 787
2017F 18,767.6 4,700.3 3,105.3 1,716 0.1 15.0 9.0 986
2018F 19,522.6 4,872.4 3,496.7 2,221 0.3 11.6 9.0 1,110
Source: Company Release
15 26
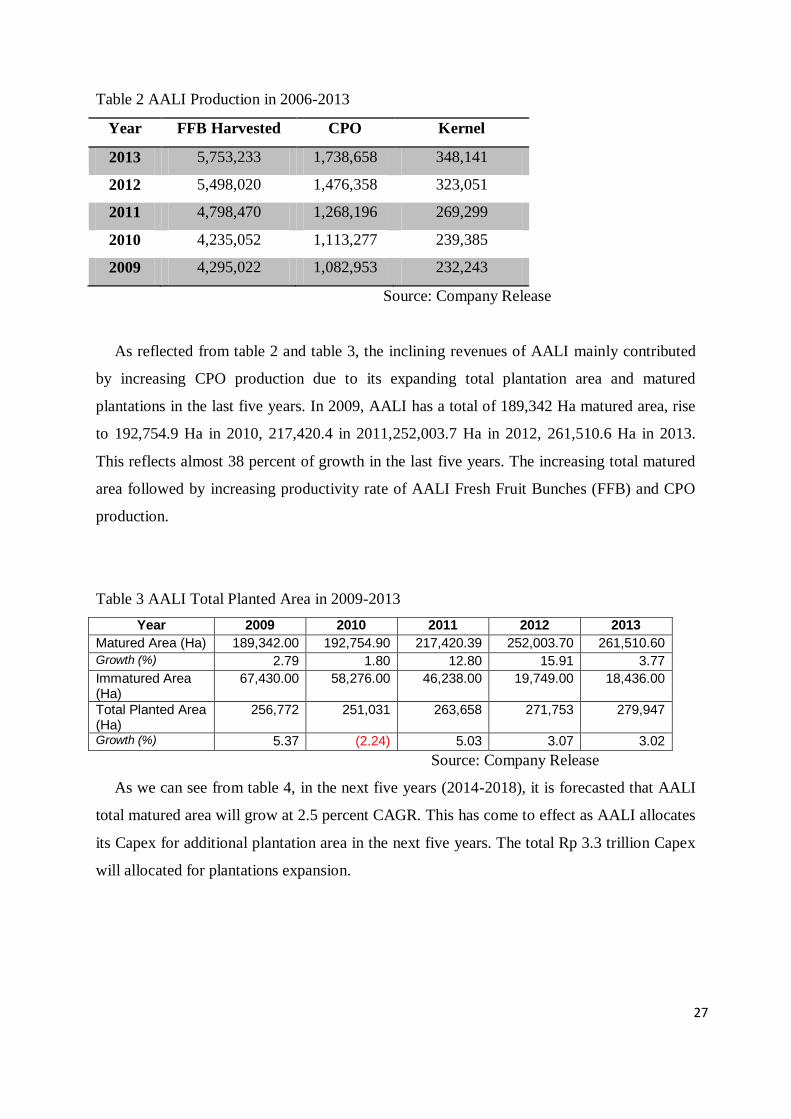
i
22
Table 2 AALI Production in 2006-2013
Year FFB Harvested CPO Kernel
2013 5,753,233 1,738,658 348,141
2012 5,498,020 1,476,358 323,051
2011 4,798,470 1,268,196 269,299
2010 4,235,052 1,113,277 239,385
2009 4,295,022 1,082,953 232,243
Source: Company Release
As reflected from table 2 and table 3, the inclining revenues of AALI mainly contributed
by increasing CPO production due to its expanding total plantation area and matured
plantations in the last five years. In 2009, AALI has a total of 189,342 Ha matured area, rise
to 192,754.9 Ha in 2010, 217,420.4 in 2011,252,003.7 Ha in 2012, 261,510.6 Ha in 2013.
This reflects almost 38 percent of growth in the last five years. The increasing total matured
area followed by increasing productivity rate of AALI Fresh Fruit Bunches (FFB) and CPO
production.
Table 3 AALI Total Planted Area in 2009-2013
Year 2009 2010 2011 2012 2013
Matured Area (Ha) 189,342.00 192,754.90 217,420.39 252,003.70 261,510.60
Growth (%) 2.79 1.80 12.80 15.91 3.77
Immatured Area (Ha)
67,430.00 58,276.00 46,238.00 19,749.00 18,436.00
Total Planted Area (Ha)
256,772 251,031 263,658 271,753 279,947
Growth (%) 5.37 (2.24) 5.03 3.07 3.02
Source: Company Release
As we can see from table 4, in the next five years (2014-2018), it is forecasted that AALI
total matured area will grow at 2.5 percent CAGR. This has come to effect as AALI allocates
its Capex for additional plantation area in the next five years. The total Rp 3.3 trillion Capex
will allocated for plantations expansion.
16 27
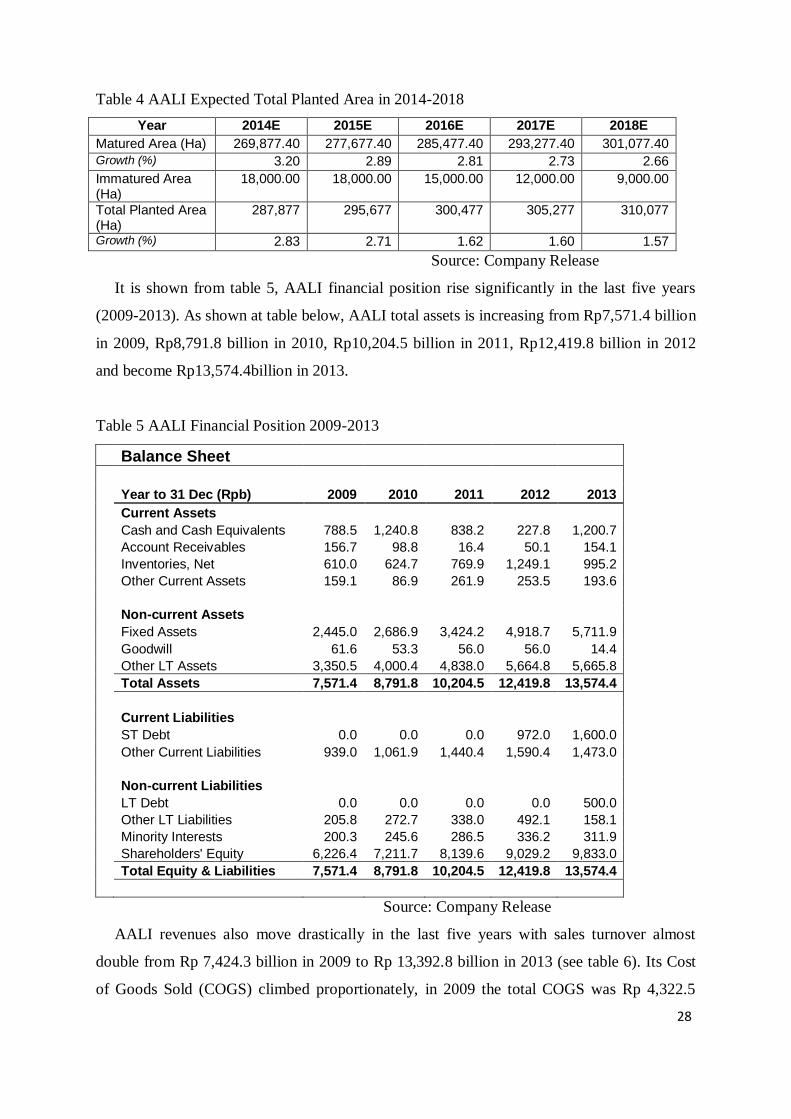
i
23
Table 4 AALI Expected Total Planted Area in 2014-2018
Year 2014E 2015E 2016E 2017E 2018E
Matured Area (Ha) 269,877.40 277,677.40 285,477.40 293,277.40 301,077.40
Growth (%) 3.20 2.89 2.81 2.73 2.66
Immatured Area (Ha)
18,000.00 18,000.00 15,000.00 12,000.00 9,000.00
Total Planted Area (Ha)
287,877 295,677 300,477 305,277 310,077
Growth (%) 2.83 2.71 1.62 1.60 1.57
Source: Company Release
It is shown from table 5, AALI financial position rise significantly in the last five years
(2009-2013). As shown at table below, AALI total assets is increasing from Rp7,571.4 billion
in 2009, Rp8,791.8 billion in 2010, Rp10,204.5 billion in 2011, Rp12,419.8 billion in 2012
and become Rp13,574.4billion in 2013.
Table 5 AALI Financial Position 2009-2013
Balance Sheet
Year to 31 Dec (Rpb) 2009 2010 2011 2012 2013
Current Assets Cash and Cash Equivalents 788.5 1,240.8 838.2 227.8 1,200.7
Account Receivables 156.7 98.8 16.4 50.1 154.1
Inventories, Net 610.0 624.7 769.9 1,249.1 995.2
Other Current Assets 159.1 86.9 261.9 253.5 193.6
Non-current Assets
Fixed Assets 2,445.0 2,686.9 3,424.2 4,918.7 5,711.9
Goodwill 61.6 53.3 56.0 56.0 14.4
Other LT Assets 3,350.5 4,000.4 4,838.0 5,664.8 5,665.8
Total Assets 7,571.4 8,791.8 10,204.5 12,419.8 13,574.4
Current Liabilities
ST Debt 0.0 0.0 0.0 972.0 1,600.0
Other Current Liabilities 939.0 1,061.9 1,440.4 1,590.4 1,473.0
Non-current Liabilities
LT Debt 0.0 0.0 0.0 0.0 500.0
Other LT Liabilities 205.8 272.7 338.0 492.1 158.1
Minority Interests 200.3 245.6 286.5 336.2 311.9
Shareholders' Equity 6,226.4 7,211.7 8,139.6 9,029.2 9,833.0
Total Equity & Liabilities 7,571.4 8,791.8 10,204.5 12,419.8 13,574.4
Source: Company Release
AALI revenues also move drastically in the last five years with sales turnover almost
double from Rp 7,424.3 billion in 2009 to Rp 13,392.8 billion in 2013 (see table 6). Its Cost
of Goods Sold (COGS) climbed proportionately, in 2009 the total COGS was Rp 4,322.5
17 28
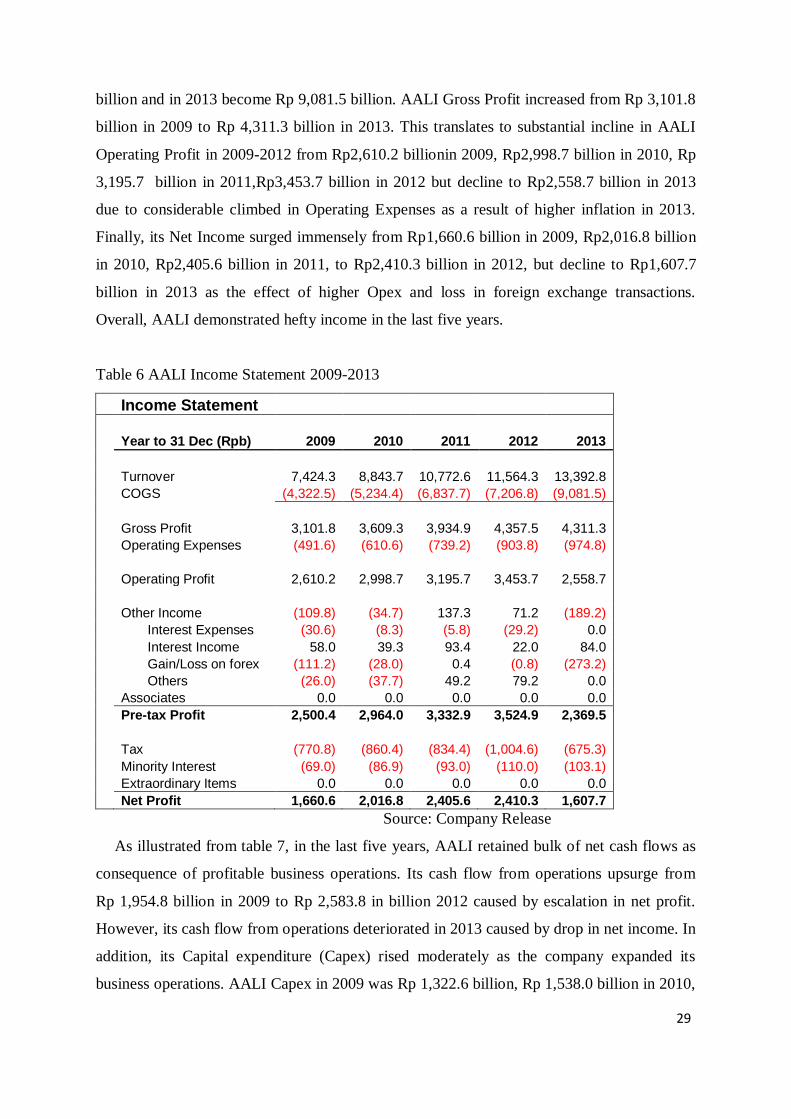
i
24
billion and in 2013 become Rp 9,081.5 billion. AALI Gross Profit increased from Rp 3,101.8
billion in 2009 to Rp 4,311.3 billion in 2013. This translates to substantial incline in AALI
Operating Profit in 2009-2012 from Rp2,610.2 billionin 2009, Rp2,998.7 billion in 2010, Rp
3,195.7 billion in 2011,Rp3,453.7 billion in 2012 but decline to Rp2,558.7 billion in 2013
due to considerable climbed in Operating Expenses as a result of higher inflation in 2013.
Finally, its Net Income surged immensely from Rp1,660.6 billion in 2009, Rp2,016.8 billion
in 2010, Rp2,405.6 billion in 2011, to Rp2,410.3 billion in 2012, but decline to Rp1,607.7
billion in 2013 as the effect of higher Opex and loss in foreign exchange transactions.
Overall, AALI demonstrated hefty income in the last five years.
Table 6 AALI Income Statement 2009-2013
Income Statement
Year to 31 Dec (Rpb) 2009 2010 2011 2012 2013
Turnover 7,424.3 8,843.7 10,772.6 11,564.3 13,392.8
COGS (4,322.5) (5,234.4) (6,837.7) (7,206.8) (9,081.5)
Gross Profit 3,101.8 3,609.3 3,934.9 4,357.5 4,311.3
Operating Expenses (491.6) (610.6) (739.2) (903.8) (974.8)
Operating Profit 2,610.2 2,998.7 3,195.7 3,453.7 2,558.7
Other Income (109.8) (34.7) 137.3 71.2 (189.2)
Interest Expenses (30.6) (8.3) (5.8) (29.2) 0.0
Interest Income 58.0 39.3 93.4 22.0 84.0
Gain/Loss on forex (111.2) (28.0) 0.4 (0.8) (273.2)
Others (26.0) (37.7) 49.2 79.2 0.0
Associates 0.0 0.0 0.0 0.0 0.0
Pre-tax Profit 2,500.4 2,964.0 3,332.9 3,524.9 2,369.5
Tax (770.8) (860.4) (834.4) (1,004.6) (675.3)
Minority Interest (69.0) (86.9) (93.0) (110.0) (103.1)
Extraordinary Items 0.0 0.0 0.0 0.0 0.0
Net Profit 1,660.6 2,016.8 2,405.6 2,410.3 1,607.7
Source: Company Release
As illustrated from table 7, in the last five years, AALI retained bulk of net cash flows as
consequence of profitable business operations. Its cash flow from operations upsurge from
Rp 1,954.8 billion in 2009 to Rp 2,583.8 in billion 2012 caused by escalation in net profit.
However, its cash flow from operations deteriorated in 2013 caused by drop in net income. In
addition, its Capital expenditure (Capex) rised moderately as the company expanded its
business operations. AALI Capex in 2009 was Rp 1,322.6 billion, Rp 1,538.0 billion in 2010,
18 29
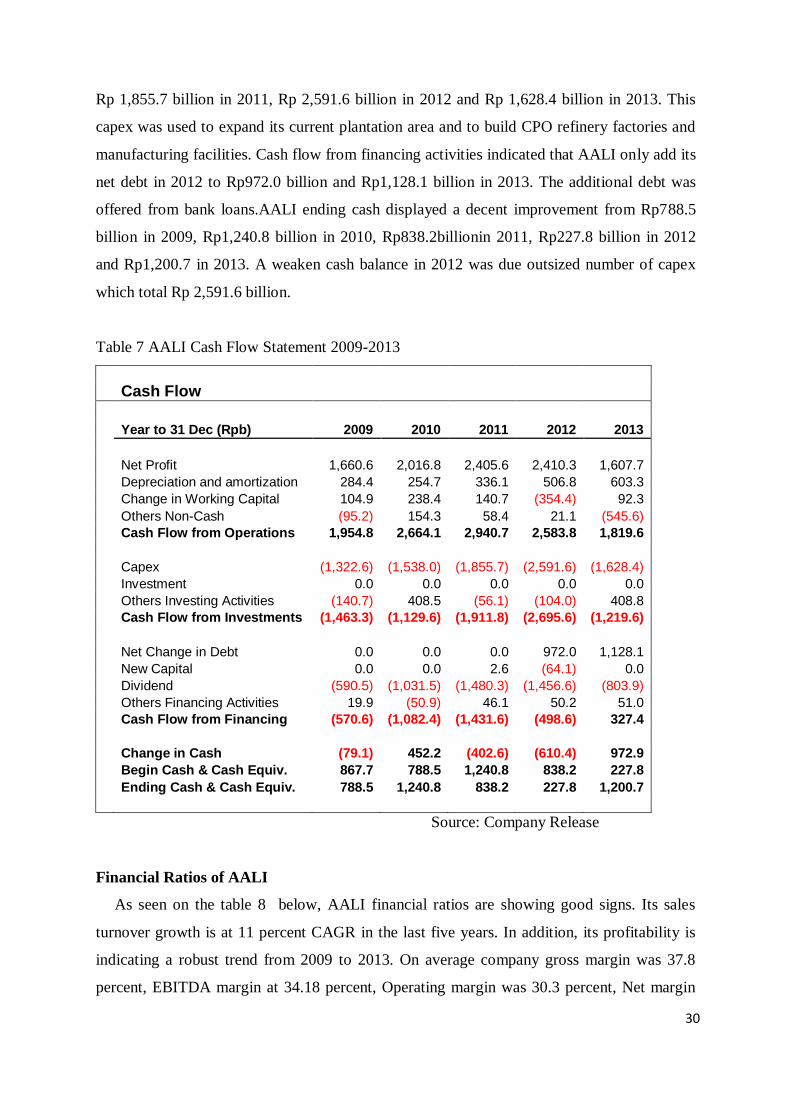
i
25
Rp 1,855.7 billion in 2011, Rp 2,591.6 billion in 2012 and Rp 1,628.4 billion in 2013. This
capex was used to expand its current plantation area and to build CPO refinery factories and
manufacturing facilities. Cash flow from financing activities indicated that AALI only add its
net debt in 2012 to Rp972.0 billion and Rp1,128.1 billion in 2013. The additional debt was
offered from bank loans.AALI ending cash displayed a decent improvement from Rp788.5
billion in 2009, Rp1,240.8 billion in 2010, Rp838.2billionin 2011, Rp227.8 billion in 2012
and Rp1,200.7 in 2013. A weaken cash balance in 2012 was due outsized number of capex
which total Rp 2,591.6 billion.
Table 7 AALI Cash Flow Statement 2009-2013
Cash Flow
Year to 31 Dec (Rpb) 2009 2010 2011 2012 2013
Net Profit 1,660.6 2,016.8 2,405.6 2,410.3 1,607.7
Depreciation and amortization 284.4 254.7 336.1 506.8 603.3
Change in Working Capital 104.9 238.4 140.7 (354.4) 92.3
Others Non-Cash (95.2) 154.3 58.4 21.1 (545.6)
Cash Flow from Operations 1,954.8 2,664.1 2,940.7 2,583.8 1,819.6
Capex (1,322.6) (1,538.0) (1,855.7) (2,591.6) (1,628.4)
Investment 0.0 0.0 0.0 0.0 0.0
Others Investing Activities (140.7) 408.5 (56.1) (104.0) 408.8
Cash Flow from Investments (1,463.3) (1,129.6) (1,911.8) (2,695.6) (1,219.6)
Net Change in Debt 0.0 0.0 0.0 972.0 1,128.1
New Capital 0.0 0.0 2.6 (64.1) 0.0
Dividend (590.5) (1,031.5) (1,480.3) (1,456.6) (803.9)
Others Financing Activities 19.9 (50.9) 46.1 50.2 51.0
Cash Flow from Financing (570.6) (1,082.4) (1,431.6) (498.6) 327.4
Change in Cash (79.1) 452.2 (402.6) (610.4) 972.9
Begin Cash & Cash Equiv. 867.7 788.5 1,240.8 838.2 227.8
Ending Cash & Cash Equiv. 788.5 1,240.8 838.2 227.8 1,200.7
Source: Company Release
Financial Ratios of AALI
As seen on the table 8 below, AALI financial ratios are showing good signs. Its sales
turnover growth is at 11 percent CAGR in the last five years. In addition, its profitability is
indicating a robust trend from 2009 to 2013. On average company gross margin was 37.8
percent, EBITDA margin at 34.18 percent, Operating margin was 30.3 percent, Net margin
19 30
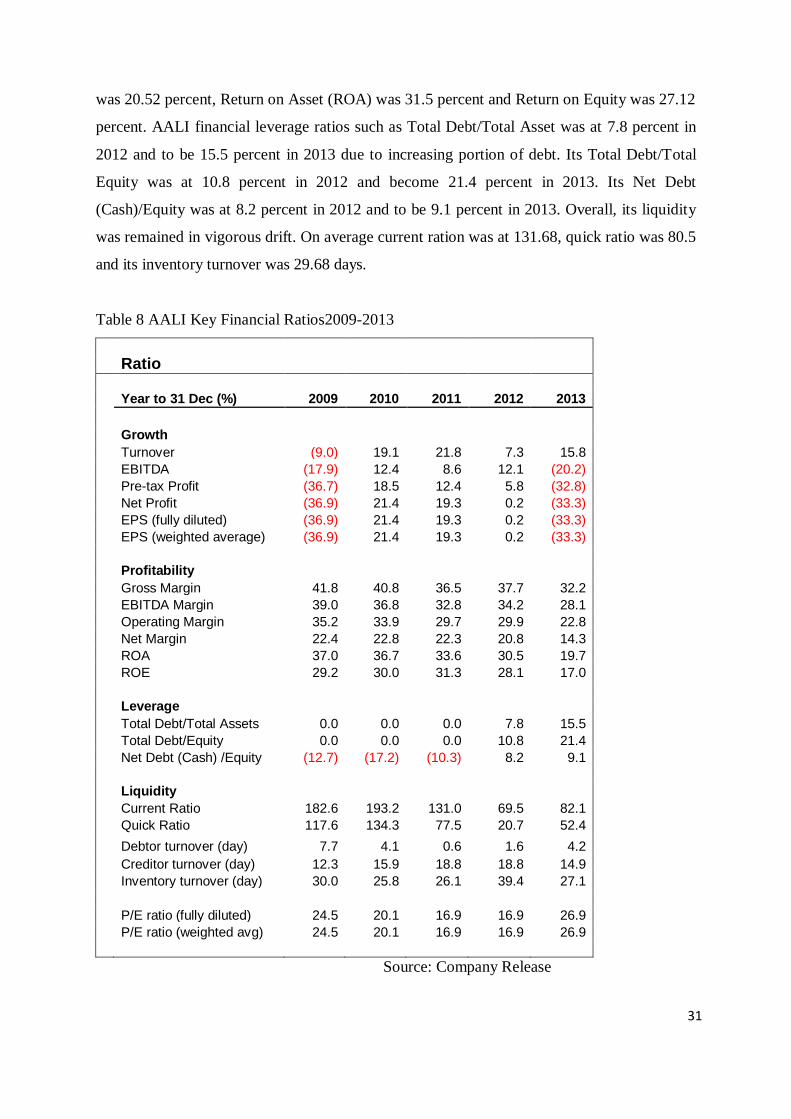
i
26
was 20.52 percent, Return on Asset (ROA) was 31.5 percent and Return on Equity was 27.12
percent. AALI financial leverage ratios such as Total Debt/Total Asset was at 7.8 percent in
2012 and to be 15.5 percent in 2013 due to increasing portion of debt. Its Total Debt/Total
Equity was at 10.8 percent in 2012 and become 21.4 percent in 2013. Its Net Debt
(Cash)/Equity was at 8.2 percent in 2012 and to be 9.1 percent in 2013. Overall, its liquidity
was remained in vigorous drift. On average current ration was at 131.68, quick ratio was 80.5
and its inventory turnover was 29.68 days.
Table 8 AALI Key Financial Ratios2009-2013
Ratio
Year to 31 Dec (%) 2009 2010 2011 2012 2013
Growth
Turnover (9.0) 19.1 21.8 7.3 15.8
EBITDA (17.9) 12.4 8.6 12.1 (20.2)
Pre-tax Profit (36.7) 18.5 12.4 5.8 (32.8)
Net Profit (36.9) 21.4 19.3 0.2 (33.3)
EPS (fully diluted) (36.9) 21.4 19.3 0.2 (33.3)
EPS (weighted average) (36.9) 21.4 19.3 0.2 (33.3)
Profitability
Gross Margin 41.8 40.8 36.5 37.7 32.2
EBITDA Margin 39.0 36.8 32.8 34.2 28.1
Operating Margin 35.2 33.9 29.7 29.9 22.8
Net Margin 22.4 22.8 22.3 20.8 14.3
ROA 37.0 36.7 33.6 30.5 19.7
ROE 29.2 30.0 31.3 28.1 17.0
Leverage
Total Debt/Total Assets 0.0 0.0 0.0 7.8 15.5
Total Debt/Equity 0.0 0.0 0.0 10.8 21.4
Net Debt (Cash) /Equity (12.7) (17.2) (10.3) 8.2 9.1
Liquidity
Current Ratio 182.6 193.2 131.0 69.5 82.1
Quick Ratio 117.6 134.3 77.5 20.7 52.4
Debtor turnover (day) 7.7 4.1 0.6 1.6 4.2
Creditor turnover (day) 12.3 15.9 18.8 18.8 14.9
Inventory turnover (day) 30.0 25.8 26.1 39.4 27.1
P/E ratio (fully diluted) 24.5 20.1 16.9 16.9 26.9
P/E ratio (weighted avg) 24.5 20.1 16.9 16.9 26.9
Source: Company Release
20 31
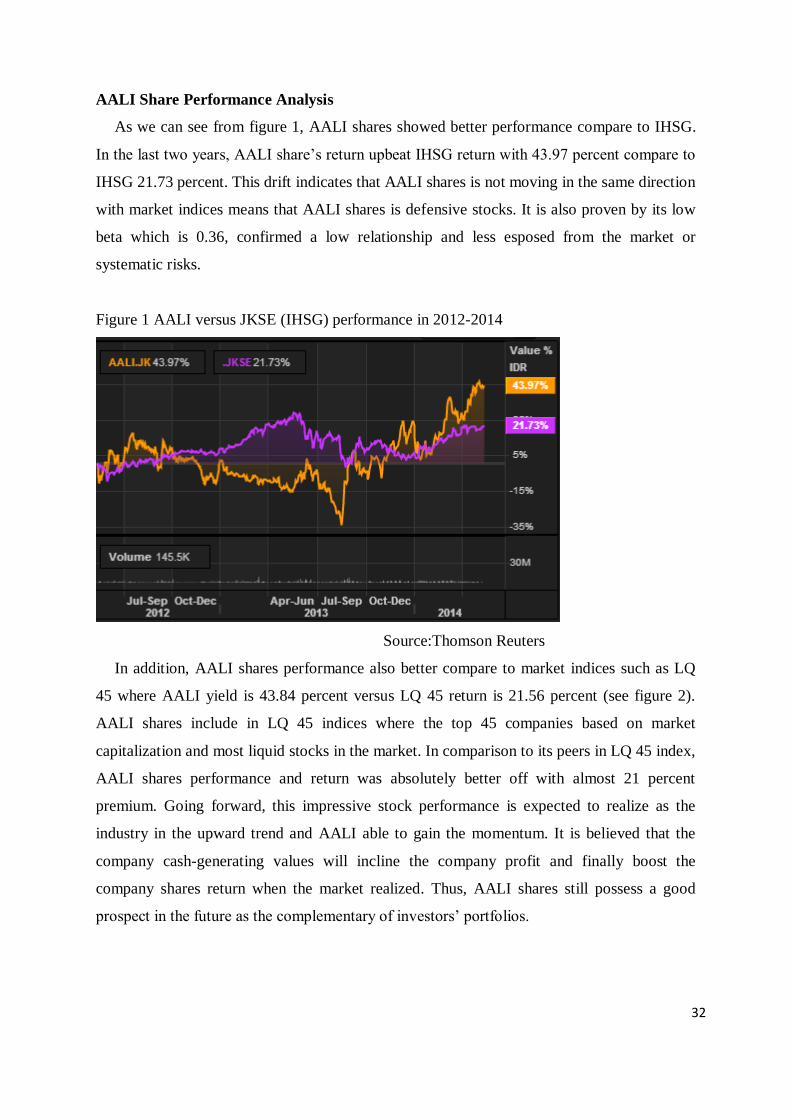
i
27
AALI Share Performance Analysis
As we can see from figure 1, AALI shares showed better performance compare to IHSG.
In the last two years, AALI share’s return upbeat IHSG return with 43.97 percent compare to
IHSG 21.73 percent. This drift indicates that AALI shares is not moving in the same direction
with market indices means that AALI shares is defensive stocks. It is also proven by its low
beta which is 0.36, confirmed a low relationship and less esposed from the market or
systematic risks.
Figure 1 AALI versus JKSE (IHSG) performance in 2012-2014
Source:Thomson Reuters
In addition, AALI shares performance also better compare to market indices such as LQ
45 where AALI yield is 43.84 percent versus LQ 45 return is 21.56 percent (see figure 2).
AALI shares include in LQ 45 indices where the top 45 companies based on market
capitalization and most liquid stocks in the market. In comparison to its peers in LQ 45 index,
AALI shares performance and return was absolutely better off with almost 21 percent
premium. Going forward, this impressive stock performance is expected to realize as the
industry in the upward trend and AALI able to gain the momentum. It is believed that the
company cash-generating values will incline the company profit and finally boost the
company shares return when the market realized. Thus, AALI shares still possess a good
prospect in the future as the complementary of investors’ portfolios.
21 32
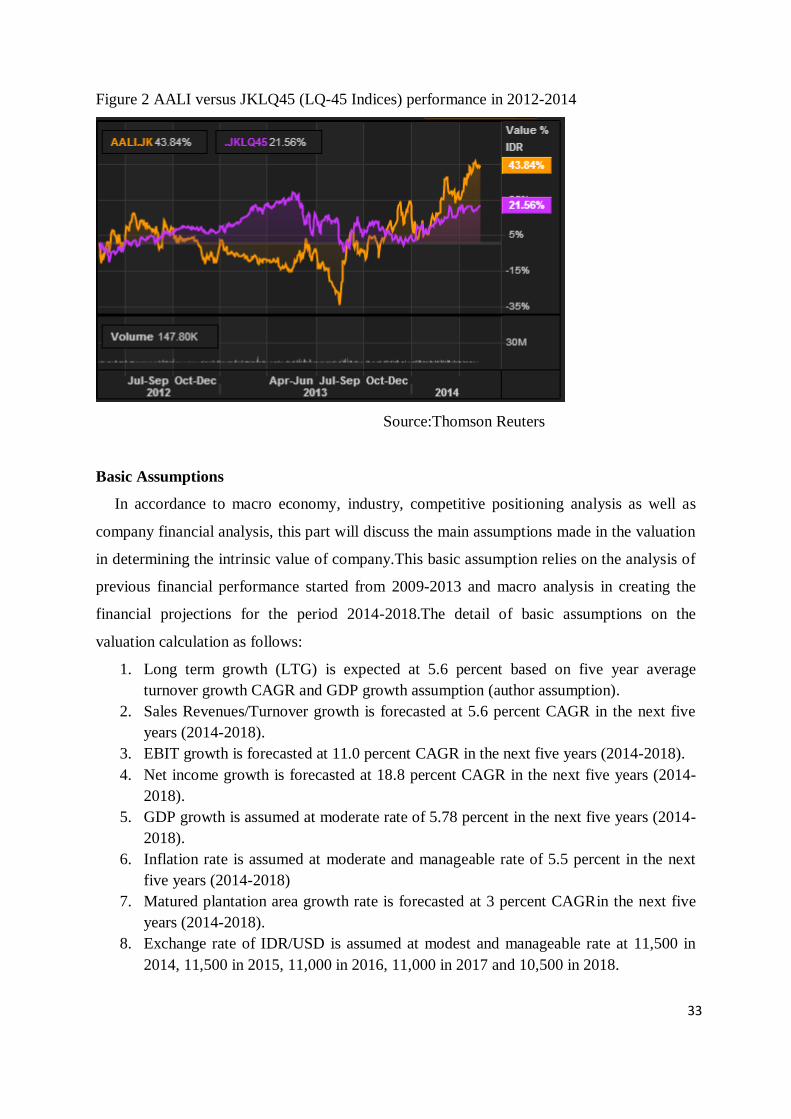
i
28
Figure 2 AALI versus JKLQ45 (LQ-45 Indices) performance in 2012-2014
Source:Thomson Reuters
Basic Assumptions
In accordance to macro economy, industry, competitive positioning analysis as well as
company financial analysis, this part will discuss the main assumptions made in the valuation
in determining the intrinsic value of company.This basic assumption relies on the analysis of
previous financial performance started from 2009-2013 and macro analysis in creating the
financial projections for the period 2014-2018.The detail of basic assumptions on the
valuation calculation as follows:
1. Long term growth (LTG) is expected at 5.6 percent based on five year average
turnover growth CAGR and GDP growth assumption (author assumption).
2. Sales Revenues/Turnover growth is forecasted at 5.6 percent CAGR in the next five
years (2014-2018).
3. EBIT growth is forecasted at 11.0 percent CAGR in the next five years (2014-2018).
4. Net income growth is forecasted at 18.8 percent CAGR in the next five years (2014-
2018).
5. GDP growth is assumed at moderate rate of 5.78 percent in the next five years (2014-
2018).
6. Inflation rate is assumed at moderate and manageable rate of 5.5 percent in the next
five years (2014-2018)
7. Matured plantation area growth rate is forecasted at 3 percent CAGRin the next five
years (2014-2018).
8. Exchange rate of IDR/USD is assumed at modest and manageable rate at 11,500 in
2014, 11,500 in 2015, 11,000 in 2016, 11,000 in 2017 and 10,500 in 2018.
22 33
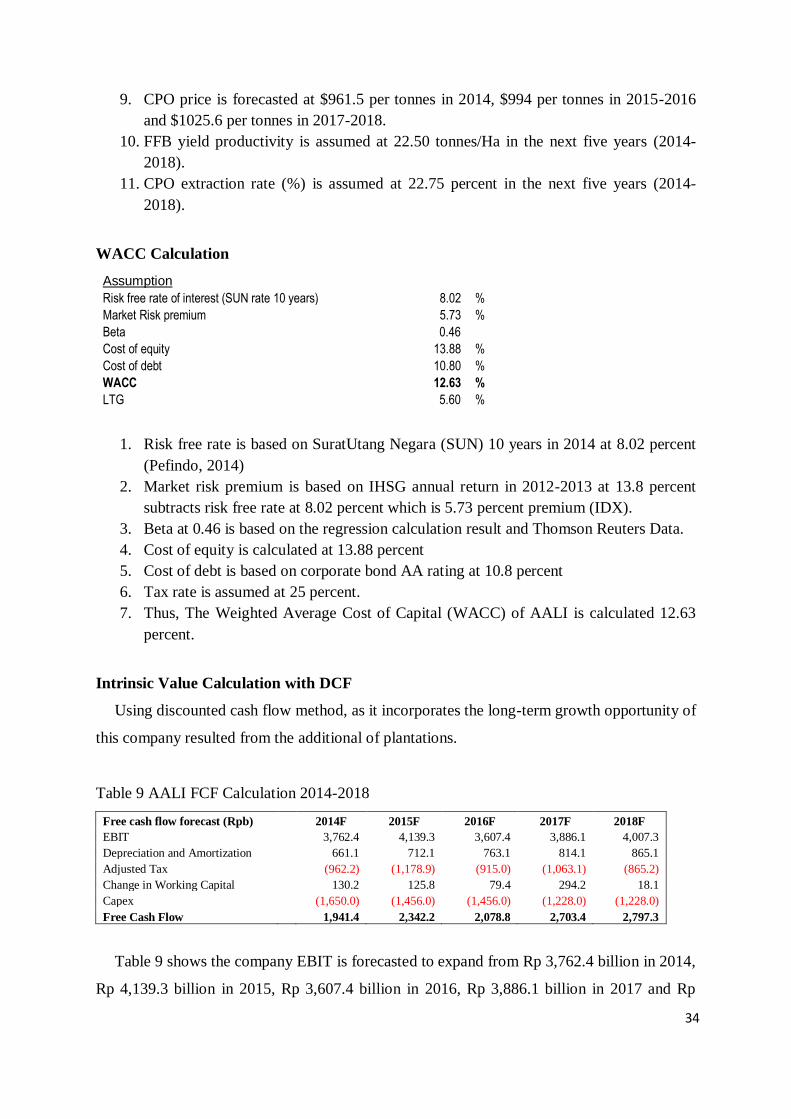
i
29
9. CPO price is forecasted at $961.5 per tonnes in 2014, $994 per tonnes in 2015-2016
and $1025.6 per tonnes in 2017-2018.
10. FFB yield productivity is assumed at 22.50 tonnes/Ha in the next five years (2014-
2018).
11. CPO extraction rate (%) is assumed at 22.75 percent in the next five years (2014-
2018).
WACC Calculation
Assumption Risk free rate of interest (SUN rate 10 years) 8.02 %
Market Risk premium 5.73 %
Beta 0.46 Cost of equity 13.88 %
Cost of debt 10.80 %
WACC 12.63 %
LTG 5.60 %
1. Risk free rate is based on SuratUtang Negara (SUN) 10 years in 2014 at 8.02 percent
(Pefindo, 2014)
2. Market risk premium is based on IHSG annual return in 2012-2013 at 13.8 percent
subtracts risk free rate at 8.02 percent which is 5.73 percent premium (IDX).
3. Beta at 0.46 is based on the regression calculation result and Thomson Reuters Data.
4. Cost of equity is calculated at 13.88 percent
5. Cost of debt is based on corporate bond AA rating at 10.8 percent
6. Tax rate is assumed at 25 percent.
7. Thus, The Weighted Average Cost of Capital (WACC) of AALI is calculated 12.63
percent.
Intrinsic Value Calculation with DCF
Using discounted cash flow method, as it incorporates the long-term growth opportunity of
this company resulted from the additional of plantations.
Table 9 AALI FCF Calculation 2014-2018
Free cash flow forecast (Rpb)
2014F 2015F 2016F 2017F 2018F
EBIT
3,762.4 4,139.3 3,607.4 3,886.1 4,007.3
Depreciation and Amortization
661.1 712.1 763.1 814.1 865.1
Adjusted Tax
(962.2) (1,178.9) (915.0) (1,063.1) (865.2)
Change in Working Capital
130.2 125.8 79.4 294.2 18.1
Capex
(1,650.0) (1,456.0) (1,456.0) (1,228.0) (1,228.0)
Free Cash Flow
1,941.4 2,342.2 2,078.8 2,703.4 2,797.3
Table 9 shows the company EBIT is forecasted to expand from Rp 3,762.4 billion in 2014,
Rp 4,139.3 billion in 2015, Rp 3,607.4 billion in 2016, Rp 3,886.1 billion in 2017 and Rp
23 34
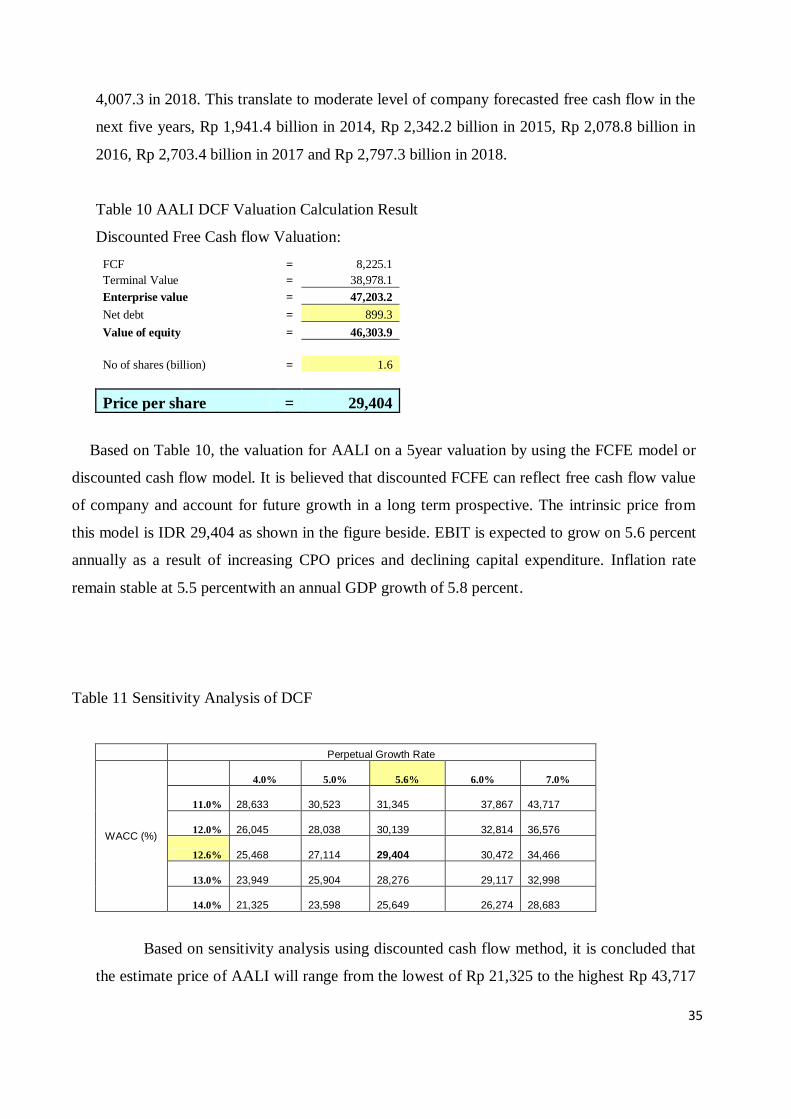
i
30
4,007.3 in 2018. This translate to moderate level of company forecasted free cash flow in the
next five years, Rp 1,941.4 billion in 2014, Rp 2,342.2 billion in 2015, Rp 2,078.8 billion in
2016, Rp 2,703.4 billion in 2017 and Rp 2,797.3 billion in 2018.
Table 10 AALI DCF Valuation Calculation Result
Discounted Free Cash flow Valuation:
FCF = 8,225.1
Terminal Value = 38,978.1
Enterprise value = 47,203.2
Net debt = 899.3
Value of equity = 46,303.9
No of shares (billion) = 1.6
Price per share = 29,404
Based on Table 10, the valuation for AALI on a 5year valuation by using the FCFE model or
discounted cash flow model. It is believed that discounted FCFE can reflect free cash flow value
of company and account for future growth in a long term prospective. The intrinsic price from
this model is IDR 29,404 as shown in the figure beside. EBIT is expected to grow on 5.6 percent
annually as a result of increasing CPO prices and declining capital expenditure. Inflation rate
remain stable at 5.5 percentwith an annual GDP growth of 5.8 percent.
Table 11 Sensitivity Analysis of DCF
Perpetual Growth Rate
WACC (%)
30,672 4.0% 5.0% 5.6% 6.0% 7.0%
11.0%
28,633
30,523
31,345
37,867
43,717
12.0%
26,045
28,038
30,139
32,814
36,576
12.6%
25,468
27,114
29,404
30,472
34,466
13.0%
23,949
25,904
28,276
29,117
32,998
14.0%
21,325
23,598
25,649
26,274
28,683
Based on sensitivity analysis using discounted cash flow method, it is concluded that
the estimate price of AALI will range from the lowest of Rp 21,325 to the highest Rp 43,717
24 35
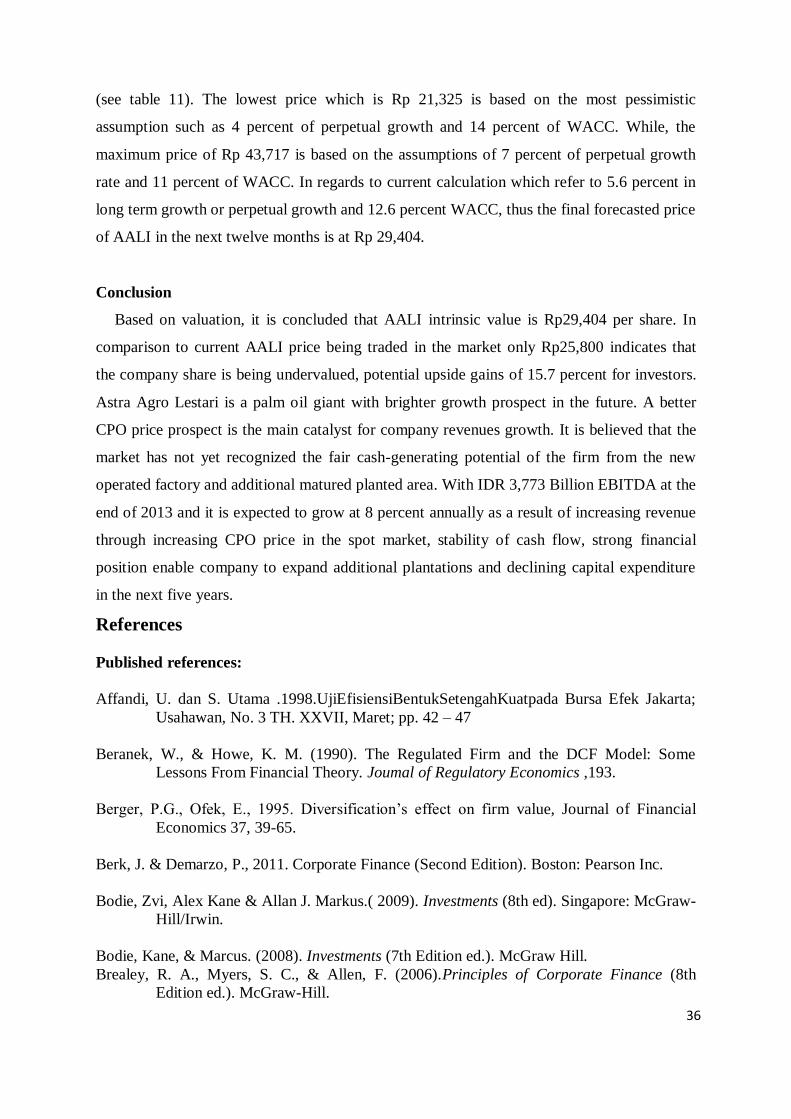
i
31
(see table 11). The lowest price which is Rp 21,325 is based on the most pessimistic
assumption such as 4 percent of perpetual growth and 14 percent of WACC. While, the
maximum price of Rp 43,717 is based on the assumptions of 7 percent of perpetual growth
rate and 11 percent of WACC. In regards to current calculation which refer to 5.6 percent in
long term growth or perpetual growth and 12.6 percent WACC, thus the final forecasted price
of AALI in the next twelve months is at Rp 29,404.
Conclusion
Based on valuation, it is concluded that AALI intrinsic value is Rp29,404 per share. In
comparison to current AALI price being traded in the market only Rp25,800 indicates that
the company share is being undervalued, potential upside gains of 15.7 percent for investors.
Astra Agro Lestari is a palm oil giant with brighter growth prospect in the future. A better
CPO price prospect is the main catalyst for company revenues growth. It is believed that the
market has not yet recognized the fair cash-generating potential of the firm from the new
operated factory and additional matured planted area. With IDR 3,773 Billion EBITDA at the
end of 2013 and it is expected to grow at 8 percent annually as a result of increasing revenue
through increasing CPO price in the spot market, stability of cash flow, strong financial
position enable company to expand additional plantations and declining capital expenditure
in the next five years.
References
Published references:
Affandi, U. dan S. Utama .1998.UjiEfisiensiBentukSetengahKuatpada Bursa Efek Jakarta;
Usahawan, No. 3 TH. XXVII, Maret; pp. 42 – 47
Beranek, W., & Howe, K. M. (1990). The Regulated Firm and the DCF Model: Some
Lessons From Financial Theory. Joumal of Regulatory Economics ,193.
Berger, P.G., Ofek, E., 1995. Diversification’s effect on firm value, Journal of Financial
Economics 37, 39-65.
Berk, J. & Demarzo, P., 2011. Corporate Finance (Second Edition). Boston: Pearson Inc.
Bodie, Zvi, Alex Kane & Allan J. Markus.( 2009). Investments (8th ed). Singapore: McGraw-
Hill/Irwin.
Bodie, Kane, & Marcus. (2008). Investments (7th Edition ed.). McGraw Hill.
Brealey, R. A., Myers, S. C., & Allen, F. (2006).Principles of Corporate Finance (8th
Edition ed.). McGraw-Hill.
25 36
i
32
Brealey, R. A. & S. C. Myers.; A. J. Marcus. 1999. Fundamentals of Corporate Finance. 2nd
edition, McGraw-Hill.
Brigham, E. F., &Gapenski, L. C. (1997).Financial Management - Theory and Practice (8th
Edition ed.). Orlando: The Dryden Press.
Campbell, J. Y.; R. J. Shiller. 1988. Stock Prices, Earnings and Expected Dividends. The
Journal of Finance, Vol. 43, No.3, pp 661-676
Cowles III, A. 1933. Can Stock Market Forecasters Forecast?.Econometrica, Vol.1, No. 3,
pp. 309-324
Damodaran, A. (1996). Investment Valuation.New York: John Wiley & Sons, Inc.
Damodaran, Aswath. (2001). The Dark Side of Valuation: Valuing Old Tech, New Tech, and
New Economy Companies. New Jersey: Prentice Hall.
Damodaran, Aswath. (2002). Investment Valuation: Tools and Technique for Determining the
Value of Any Asset (2nd edition). New Jersey: John Wiley & Sons.
Dixit, A.K. and Pindyck, R.S. (1995).The Options Approach to Capital Investment. Harvard
Business Review (28) 4, May-June, pp. 105-115.
Fama, E. F (1970). Efficient capital markets: A review of theory and empirical work. Journal
ofFinance, Vol. 25. 383 – 417.
Fernández, P. (2002). Valuation Methods and Shareholder Value Creation.
San Diego, CA: Academic Press.
Fernández, P. (2003). How to value a seasonal company discounting cash flows. SSRN
Working Paper No. 406220.
Gordon, M. (1962).The Investment Financing, and Valuation of the Corporation
Homewood: Irwin.
Hamonangan, F. and Sulistyawati, D (2012).Perhitungan Harga Saham Wajar PT. Bank
Central Asia Tbk dengan Menggunakan Metode Discounted Earning Approach dan
Price to Book Value. Journal of Capital Market and Banking, 20-38.
Higgins, R.C. (1998) Analysis for Financial Management 5th ed. Boston: McGraw Hill
Hull, J. C. (2008). Options, Futures and Other Derivatives (7th Edition ed.). Upper Saddle
River: Pearson Prentince Hall.
Humphrey, Albert (2005). SWOT Analysis for Management Consulting. SRI Alumni
Newsletter (SRI International).
26 37
i
33
Manurung, Adler Haymans. (1994). Development of Jakarta Stock Exchange; Thesis Master
Degree, Department of Commerce, University of Newcastle, Australia.
Manurung, Adler Haymans (1997d). Weak-form Efficiency of the Jakarta Stock Exchange;
Jurnal Manajemen Prasetiya Mulya.Jakarta: PT Adler Manurung Press.
Manurung, Adler Haymans, Prof Dr. (2010). Ekonomi Finansial, Penerbit PT Adler
Manurung Press, Jakarta, pp. 15-19
Manurung, Adler Haymans, (2011). Metode Riset: Keuangan, Investasi dan Akuntansi
Empiris, PT Adler Manurung Press, Jakarta
Manurung, Adler Haymans (2011). Valuasi Wajar Perusahaan. Jakarta: PT Adler Manurung
Press.
Michailetz, V. B., Artemenkov, A. I., &Artemenkov, I. L. (2007).Income Approach and
Discount Rates for Valuing Income-Producing Illiquid Assets. The Icfai Journal of
Applied Finance , 43-80.
Myers, Stewart C.. 1977. The determinants of corporate borrowing. Journal of Financial
Economics 5, 147-175.
Phelan, S.E. (1997). Exposing the illusion of confidence in financial analysis.
Management Decision (35) 2, pp.163-168.
Reilly and Brown.(2006). Investment Analysis and Portofolio Management. Mason OH:
Thomson (South Western).
Rhaiem, N., Ben, S., &Mabrouk, A. B. (2007). Estimation of Capital Asset Pricing Model at
Different Time Scales. The International Journal of Applied Economics and Finance
, 80.
Samsul,Mohamad. 2006. Pasar Modal dan Manajemen Portofolio, edisi pertama. Jakarta:
Erlangga.
Sharpe, William F. Portfolio Theory and Capital Markets. New York: McGraw-Hill, 1970.
Siegel, J.J. (1985) ‘The Application of DCF Methodology for Determining the Cost of Equity
Capital’ Financial Management Spring Edition pp.46-53
Simorangkir, J. and Simorangkir, P (2012).Valuasi Harga Saham PT. Bank Negara Indonesia
(Persero), Tbk dengan Discounted Earnings Approach dan Price to Book Value
Ratio. Journal of Capital Market and Banking, 1-19.
Electronic references:
Datastream Thomson Reuters Eikon. Indonesia Stock Exchange and Interest Rates. Retrieved
January 16, 2014
27 38
i
34
Laporan Tahunan PT Astra Agro Lestari Tbk Tahun 2009-2013.
Datastream Thomson Reuters Eikon
www.bloomberg.com
www.imf.org
www.bi.go.id
www.bps.go.id
www.depkeu.go.id
www.finance.yahoo.com
www.mpob.gov.my
www.esdm.go.id
www.gapki.or.id
www.stern.nyu.edu/damodaran/
28 39
i
35
Fundamental Valuation of
PT. Indofood Sukses Makmur, Tbk Using Discounted Cash Flow
and Residual Earning Model
STEFANIE WIJAYA Sampoerna School of Business
dan
ADLER HAYMANS MANURUNG
PT Finansial Bisnis Informasi
Abstract
Investment has been said to be a commitment to finance one or more firm(s) and hold
it for a period of time, for the purpose of capital gain. Investors can get capital gain by
investing in firm that is mispriced in the market; ie. buying stock that is undervalued by the
market. The quest that is left for investors is to find the right company to put their money in.
Top-down approach will be used in this paper; it is done by analyzing macroeconomic
condition, finding the best performing industry given macro condition, picking the desired
sector, and finally gather the justification to pick a targeted company. Finding the true value
for stocks can be done by doing fundamental valuation. There are various method that can be
used for determining the intrinsic value of stocks, two of which are the Discounted Cash Flow
Method and Residual Earning Model. This paper will elaborate the application of DCF
method and RE model in order to find the true value of a firm. In this research, PT. Indofood
Sukses Makmur, Tbk is found to be undervalue and provide potential upside gain for the
coming 12 months. Hence, a buy recommendation is iterated for PT. Indofood Sukses
Makmur, Tbk.
Keywords : Fundamental Valuation, Discounted Cash Flow, Residual Earning Model, Intrinsic
Valuation, Financial Modelling.
40
i
36
1. Introduction
Indonesia is the 4th most populous nation in the world and is now undergoing a major
structural shift in terms of demographics. More than half of the roughly 240 million
people in 2012 were between 5 and 34 years of age. The emerging middle class and
consumers from the Indonesian middle class broadly support domestic industry and
imported goods, particularly for retail and consumer products, processed foods, and the
automotive industry. In 2013, consumption accounted for 44% of the GDP.
In the world of consumer products, all eyes are on Indonesia. Indonesia’s population
of 245 million is Asia’s third largest after China and India, while its economy is among
the world’s fastest growing. Indonesia’s middle class, already almost four times the UK’s
entire population, is also gong richer with stronger purchasing power. Faced with such a
potentially huge market, no multinational corporation (MNC) consumer products firms
with global ambitions can afford to ignore Indonesia.
Household income in Indonesia has also been growing: in 2007, one-third of
Indonesia’s 60 million households had incomes above $5,000, up from fewer than 3
million households in 2000 (Euromonitor, 2009). Between 2000 and 2007, the proportion
of households with disposable income under US$2,500 declined from two-thirds of the
population to one quarter (Euromonitor, 2009). Broken into sectors, the most rapid
growth of consumer spending is for the financial services sector as for investment and
savings. Spending on food and beverage grows with a 5.2% CAGR, in line with the
average Indonesian GDP growth. Referring to Indonesia’s Central Bureau of Statistics, by
2030 the food and beverage spending is projected to be as large as $ 194 billion, the
second largest spending after financial services.
The attractiveness of Indonesian consumer sector may not only benefit big firms who
has been in the market and who are going into the market, but also particularly for
investors too. Looking for the long term growth prospects, consumer sector is one of the
most promising pick up. Looking closer into firms within the sector, PT. Indofood Sukses
Makmur, Tbk (INDF) is the largest Indonesian consumer product producers with
diversified products including instant noodles, flour, CPO edible oil (including
41
i
37
plantations), sugar, milk, seasoning, baby food, snacks and distribution. Holding the top 3
ranks1 among its peers for each division has positioned INDF as the market leader.
2. Background
2.1 INDONESIAN CONSUMER PRODUCT CONSUMPTION
The 2008-2009 credit crises did not do much to dent household spending and
Indonesia battered the global downturn better than many of its more export-reliant
neighbors. This consumer attitude adds to Indonesia’s attraction as a market for
FMCGs. It is expected that Indonesian real GDP gains to average 5.7% in 2014-15. A
global survey2 published in July 2013 showed that Indonesia came out on top in terms
of consumer confidence and spending intentions. Optimism about future employment
and income, relatively low indebtedness and political stability are keeping Indonesians
happy to spend.
While Indonesian economy grew more than 6% since 2010, consumers spending
also grew along rapidly. Major catalysts for the growth in consumer products sector are;
1) Rapid GDP growth that translates to higher disposable income per capita, 2) Higher
purchasing power, and 3) government regulation.
Based on the research from Euromonitor, the largest portion of household
spending in Indonesia is for food and non-alcoholic beverages consumption, which
constitutes 41.7% of total spending. Regmi et al. (2008) presented evidence that food
consumption patterns around the globe were moving toward more meats, dairy
products, sugar, and caffeinated beverages. This phenomenon also happened in
Indonesia as there were increased mobility and more modern lifestyle emerged. As
starch-based food consumption have declined, meat, dairy, and egg consumption has
grown strongly (Rada and Regmi, 2010). The prepared food and miscellaneous food
categories have also grown very quickly; much of this consists of packaged foods. Both
the decline in starch consumption and increase in packaged food consumption are
consistent with global trends.
1 Based on Euromonitor Research, 2014
2Global Consumer Confidence Survey, Nielson
31 42
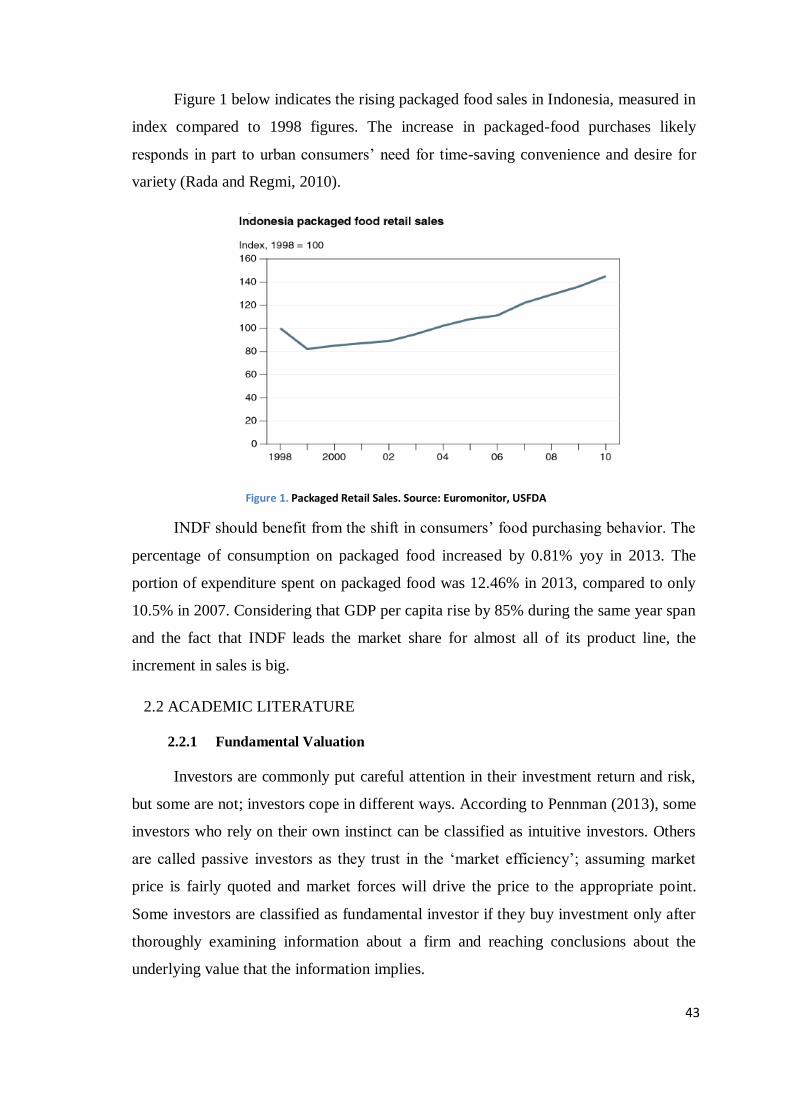
i
38
Figure 1 below indicates the rising packaged food sales in Indonesia, measured in
index compared to 1998 figures. The increase in packaged-food purchases likely
responds in part to urban consumers’ need for time-saving convenience and desire for
variety (Rada and Regmi, 2010).
Figure 1. Packaged Retail Sales. Source: Euromonitor, USFDA
INDF should benefit from the shift in consumers’ food purchasing behavior. The
percentage of consumption on packaged food increased by 0.81% yoy in 2013. The
portion of expenditure spent on packaged food was 12.46% in 2013, compared to only
10.5% in 2007. Considering that GDP per capita rise by 85% during the same year span
and the fact that INDF leads the market share for almost all of its product line, the
increment in sales is big.
2.2 ACADEMIC LITERATURE
2.2.1 Fundamental Valuation
Investors are commonly put careful attention in their investment return and risk,
but some are not; investors cope in different ways. According to Pennman (2013), some
investors who rely on their own instinct can be classified as intuitive investors. Others
are called passive investors as they trust in the ‘market efficiency’; assuming market
price is fairly quoted and market forces will drive the price to the appropriate point.
Some investors are classified as fundamental investor if they buy investment only after
thoroughly examining information about a firm and reaching conclusions about the
underlying value that the information implies.
32 43
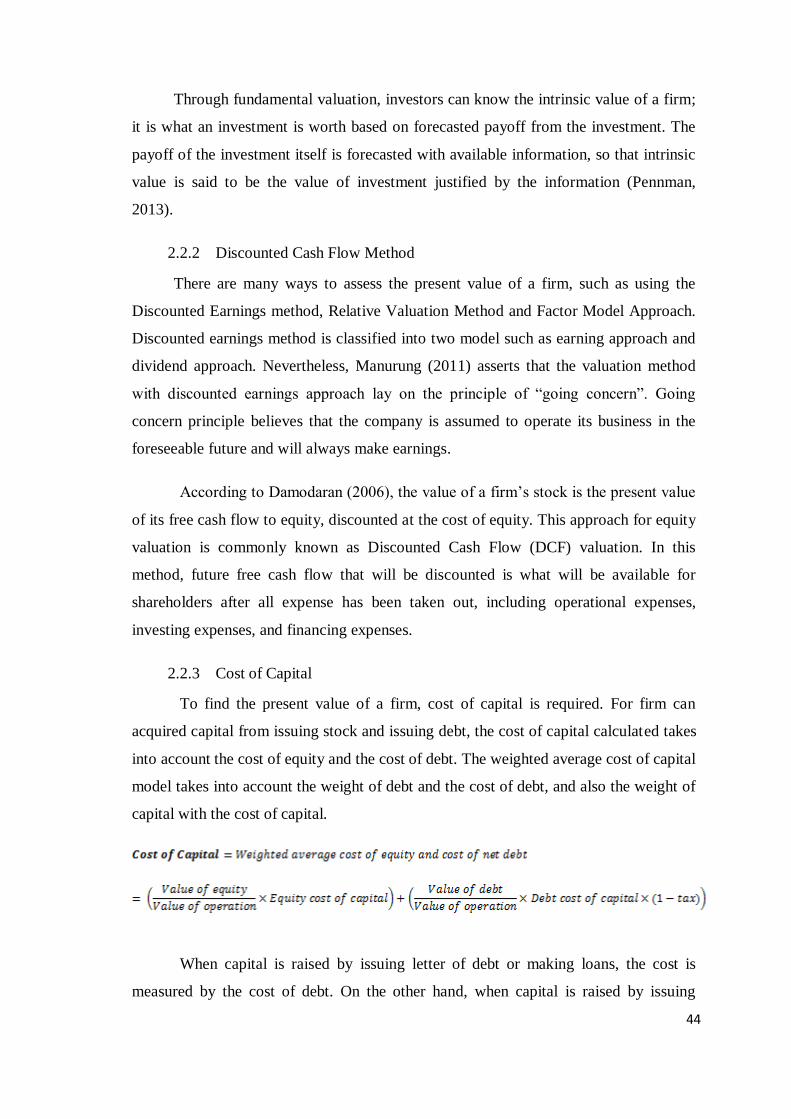
i
39
Through fundamental valuation, investors can know the intrinsic value of a firm;
it is what an investment is worth based on forecasted payoff from the investment. The
payoff of the investment itself is forecasted with available information, so that intrinsic
value is said to be the value of investment justified by the information (Pennman,
2013).
2.2.2 Discounted Cash Flow Method
There are many ways to assess the present value of a firm, such as using the
Discounted Earnings method, Relative Valuation Method and Factor Model Approach.
Discounted earnings method is classified into two model such as earning approach and
dividend approach. Nevertheless, Manurung (2011) asserts that the valuation method
with discounted earnings approach lay on the principle of “going concern”. Going
concern principle believes that the company is assumed to operate its business in the
foreseeable future and will always make earnings.
According to Damodaran (2006), the value of a firm’s stock is the present value
of its free cash flow to equity, discounted at the cost of equity. This approach for equity
valuation is commonly known as Discounted Cash Flow (DCF) valuation. In this
method, future free cash flow that will be discounted is what will be available for
shareholders after all expense has been taken out, including operational expenses,
investing expenses, and financing expenses.
2.2.3 Cost of Capital
To find the present value of a firm, cost of capital is required. For firm can
acquired capital from issuing stock and issuing debt, the cost of capital calculated takes
into account the cost of equity and the cost of debt. The weighted average cost of capital
model takes into account the weight of debt and the cost of debt, and also the weight of
capital with the cost of capital.
When capital is raised by issuing letter of debt or making loans, the cost is
measured by the cost of debt. On the other hand, when capital is raised by issuing
33 44
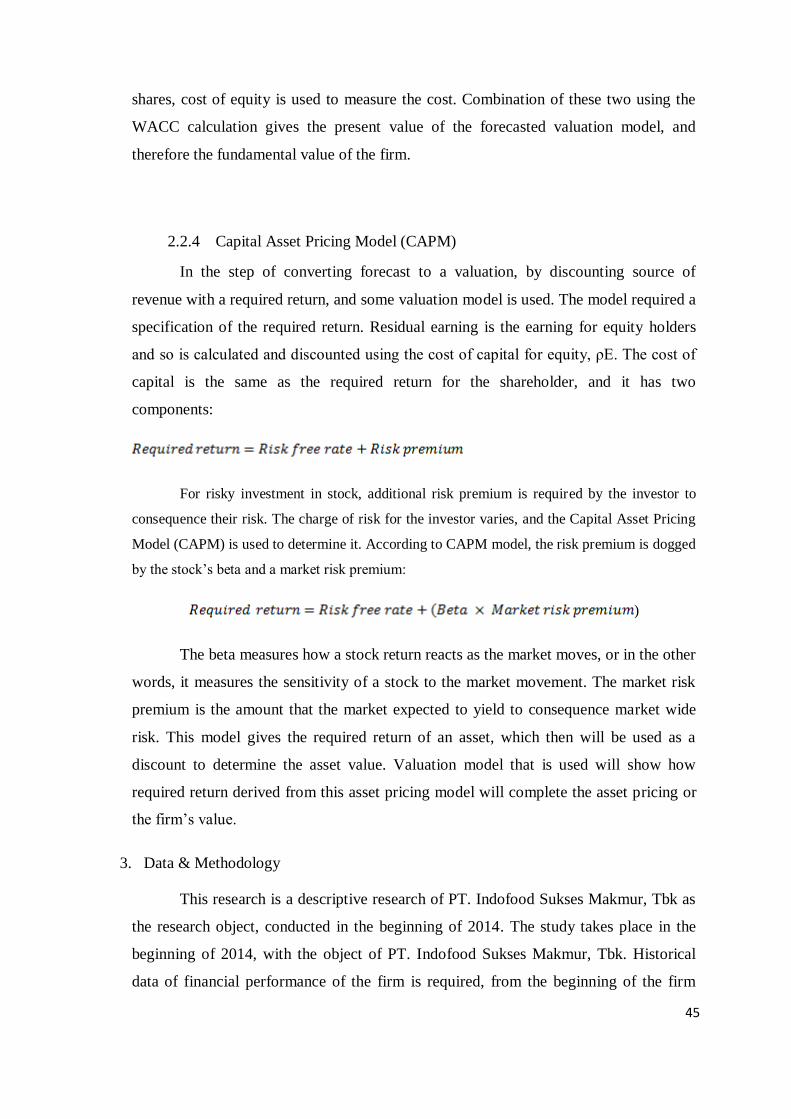
i
40
shares, cost of equity is used to measure the cost. Combination of these two using the
WACC calculation gives the present value of the forecasted valuation model, and
therefore the fundamental value of the firm.
2.2.4 Capital Asset Pricing Model (CAPM)
In the step of converting forecast to a valuation, by discounting source of
revenue with a required return, and some valuation model is used. The model required a
specification of the required return. Residual earning is the earning for equity holders
and so is calculated and discounted using the cost of capital for equity, ρE. The cost of
capital is the same as the required return for the shareholder, and it has two
components:
For risky investment in stock, additional risk premium is required by the investor to
consequence their risk. The charge of risk for the investor varies, and the Capital Asset Pricing
Model (CAPM) is used to determine it. According to CAPM model, the risk premium is dogged
by the stock’s beta and a market risk premium:
)
The beta measures how a stock return reacts as the market moves, or in the other
words, it measures the sensitivity of a stock to the market movement. The market risk
premium is the amount that the market expected to yield to consequence market wide
risk. This model gives the required return of an asset, which then will be used as a
discount to determine the asset value. Valuation model that is used will show how
required return derived from this asset pricing model will complete the asset pricing or
the firm’s value.
3. Data & Methodology
This research is a descriptive research of PT. Indofood Sukses Makmur, Tbk as
the research object, conducted in the beginning of 2014. The study takes place in the
beginning of 2014, with the object of PT. Indofood Sukses Makmur, Tbk. Historical
data of financial performance of the firm is required, from the beginning of the firm
34 45
i
41
went public. Forecasting will be made until approximately 10 years ahead, as it will
best reflect the business cycle of the firm. Data that is used in the report are: Financial
reports & annual reports of PT. Indofood Sukses Makmur for 7 years since it was
publicly listed in 2007 as they will be used to measure historical performance of INDF
since it went public, Industrial report & economic report in Indonesia; current and
historical, financial variables data, such as risk free rate, BI rate, overnight loan rate,
and macroeconomics variable data, such as GDP growth, inflation rate, and some other
variables.
According to Pennman (2013), the process of fundamental analysis comes with
several steps. The first one is to understand the business. An important element is to
understand the firm’s strategy to add value. Once a strategy has been selected, the
strategy becomes the one under which the business is valued as a going concern. The
second step is then to analyze information presented in the firm’s financial statement,
and other source of valuable related information. This information is then built into
forecasting model of valuation. There are some financial ratios that can be inferred and
used in comparing firms.
The next step is to develop forecast. The first thing to be specified is how payoff
can be measured, whether cash flow, earnings, book value, dividend, EBIT, or Return
on Equity that is needed to be measured. Fourth step is to convert the forecast into
valuation. As future payoff on a firm’s share is uncertain, it must be discounted for the
time value of money and risk consequence. Expected payoff is discounted by the
required return or cost of capital. The final step is to make an investment decision and
do trading based on the valuation.
The core basis used in this valuation is the Discounted Cash Flow (DCF)
approach that is combined with a other valuation method, such as the Abnormal
Earning Growth and Residual Earnings model as a comparation.
35 46
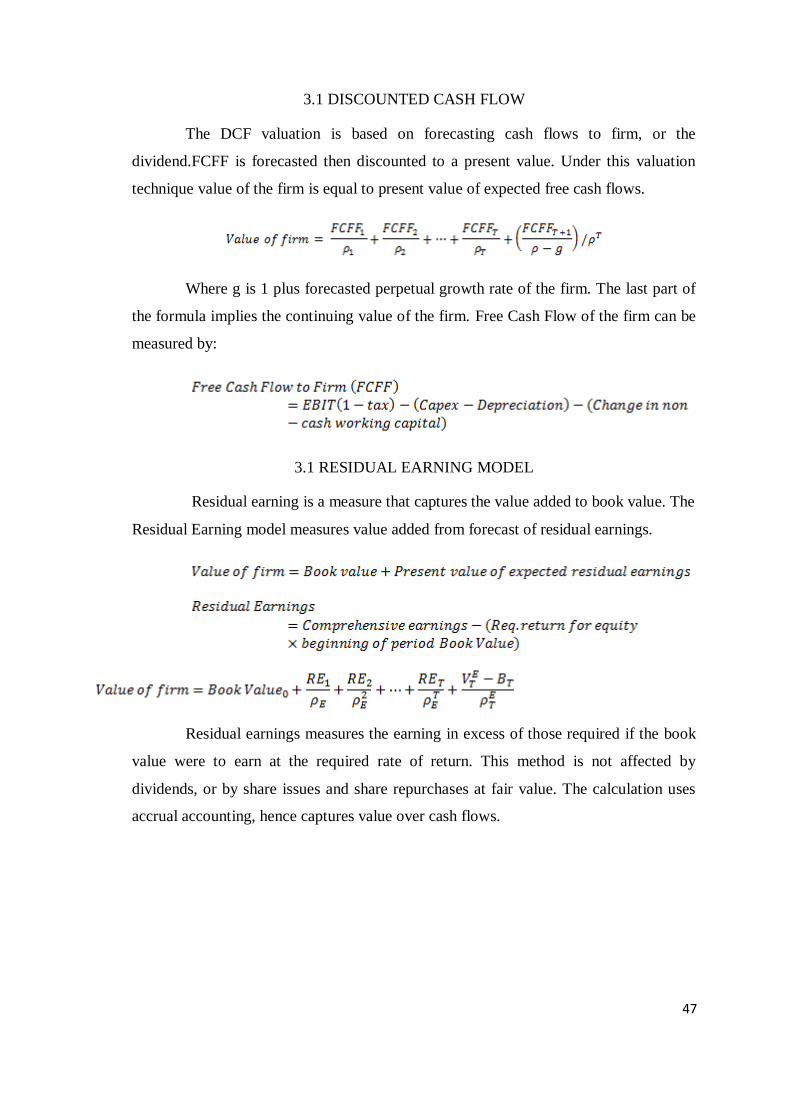
i
42
3.1 DISCOUNTED CASH FLOW
The DCF valuation is based on forecasting cash flows to firm, or the
dividend.FCFF is forecasted then discounted to a present value. Under this valuation
technique value of the firm is equal to present value of expected free cash flows.
Where g is 1 plus forecasted perpetual growth rate of the firm. The last part of
the formula implies the continuing value of the firm. Free Cash Flow of the firm can be
measured by:
3.1 RESIDUAL EARNING MODEL
Residual earning is a measure that captures the value added to book value. The
Residual Earning model measures value added from forecast of residual earnings.
Residual earnings measures the earning in excess of those required if the book
value were to earn at the required rate of return. This method is not affected by
dividends, or by share issues and share repurchases at fair value. The calculation uses
accrual accounting, hence captures value over cash flows.
47
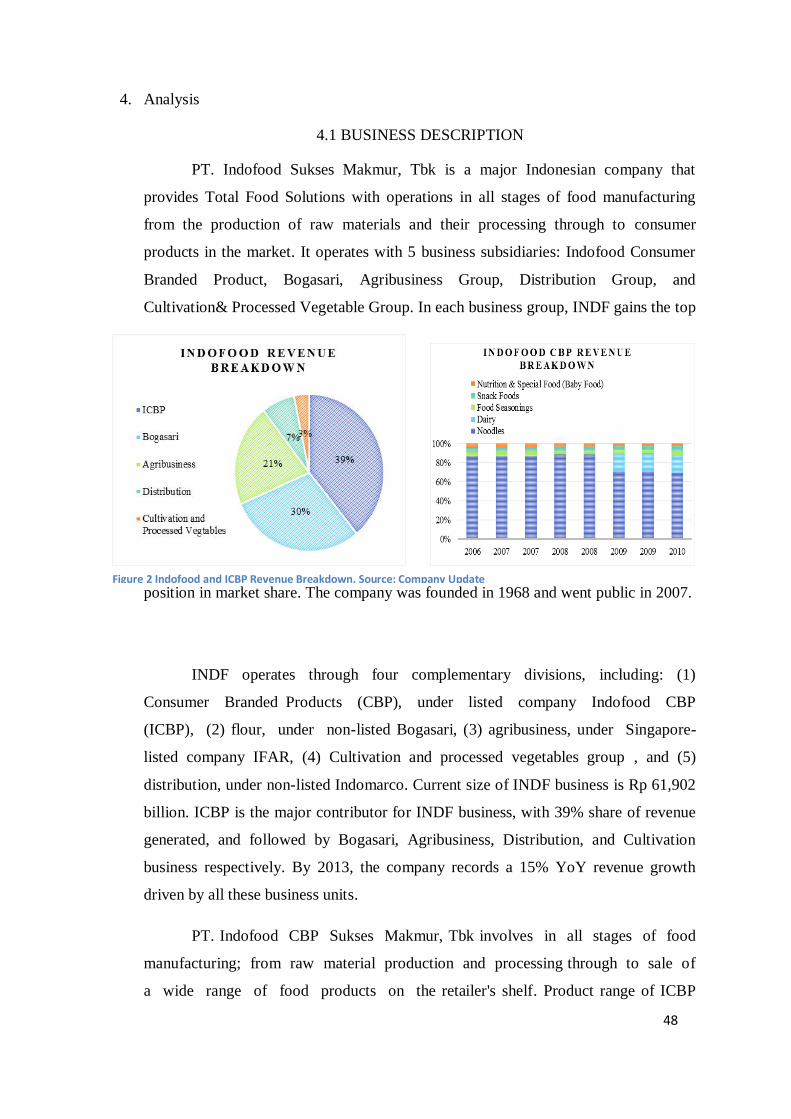
i
43
4. Analysis
4.1 BUSINESS DESCRIPTION
PT. Indofood Sukses Makmur, Tbk is a major Indonesian company that
provides Total Food Solutions with operations in all stages of food manufacturing
from the production of raw materials and their processing through to consumer
products in the market. It operates with 5 business subsidiaries: Indofood Consumer
Branded Product, Bogasari, Agribusiness Group, Distribution Group, and
Cultivation& Processed Vegetable Group. In each business group, INDF gains the top
position in market share. The company was founded in 1968 and went public in 2007.
INDF operates through four complementary divisions, including: (1)
Consumer Branded Products (CBP), under listed company Indofood CBP
(ICBP), (2) flour, under non-listed Bogasari, (3) agribusiness, under Singapore-
listed company IFAR, (4) Cultivation and processed vegetables group , and (5)
distribution, under non-listed Indomarco. Current size of INDF business is Rp 61,902
billion. ICBP is the major contributor for INDF business, with 39% share of revenue
generated, and followed by Bogasari, Agribusiness, Distribution, and Cultivation
business respectively. By 2013, the company records a 15% YoY revenue growth
driven by all these business units.
PT. Indofood CBP Sukses Makmur, Tbk involves in all stages of food
manufacturing; from raw material production and processing through to sale of
a wide range of food products on the retailer's shelf. Product range of ICBP
Figure 2 Indofood and ICBP Revenue Breakdown. Source: Company Update
48
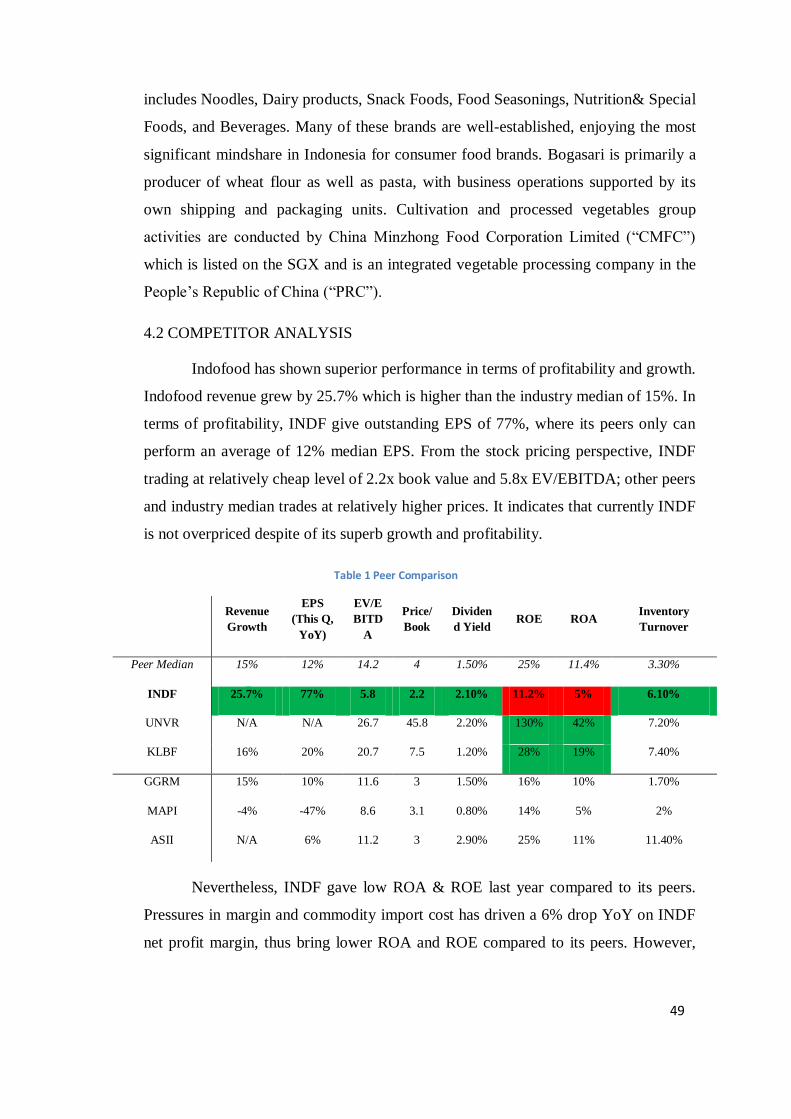
i
44
includes Noodles, Dairy products, Snack Foods, Food Seasonings, Nutrition& Special
Foods, and Beverages. Many of these brands are well-established, enjoying the most
significant mindshare in Indonesia for consumer food brands. Bogasari is primarily a
producer of wheat flour as well as pasta, with business operations supported by its
own shipping and packaging units. Cultivation and processed vegetables group
activities are conducted by China Minzhong Food Corporation Limited (“CMFC”)
which is listed on the SGX and is an integrated vegetable processing company in the
People’s Republic of China (“PRC”).
4.2 COMPETITOR ANALYSIS
Indofood has shown superior performance in terms of profitability and growth.
Indofood revenue grew by 25.7% which is higher than the industry median of 15%. In
terms of profitability, INDF give outstanding EPS of 77%, where its peers only can
perform an average of 12% median EPS. From the stock pricing perspective, INDF
trading at relatively cheap level of 2.2x book value and 5.8x EV/EBITDA; other peers
and industry median trades at relatively higher prices. It indicates that currently INDF
is not overpriced despite of its superb growth and profitability.
Table 1 Peer Comparison
Revenue
Growth
EPS
(This Q,
YoY)
EV/E
BITD
A
Price/
Book
Dividen
d Yield ROE ROA
Inventory
Turnover
Peer Median 15% 12% 14.2 4 1.50% 25% 11.4% 3.30%
INDF 25.7% 77% 5.8 2.2 2.10% 11.2% 5% 6.10%
UNVR N/A N/A 26.7 45.8 2.20% 130% 42% 7.20%
KLBF 16% 20% 20.7 7.5 1.20% 28% 19% 7.40%
GGRM 15% 10% 11.6 3 1.50% 16% 10% 1.70%
MAPI -4% -47% 8.6 3.1 0.80% 14% 5% 2%
ASII N/A 6% 11.2 3 2.90% 25% 11% 11.40%
Nevertheless, INDF gave low ROA & ROE last year compared to its peers.
Pressures in margin and commodity import cost has driven a 6% drop YoY on INDF
net profit margin, thus bring lower ROA and ROE compared to its peers. However,
49
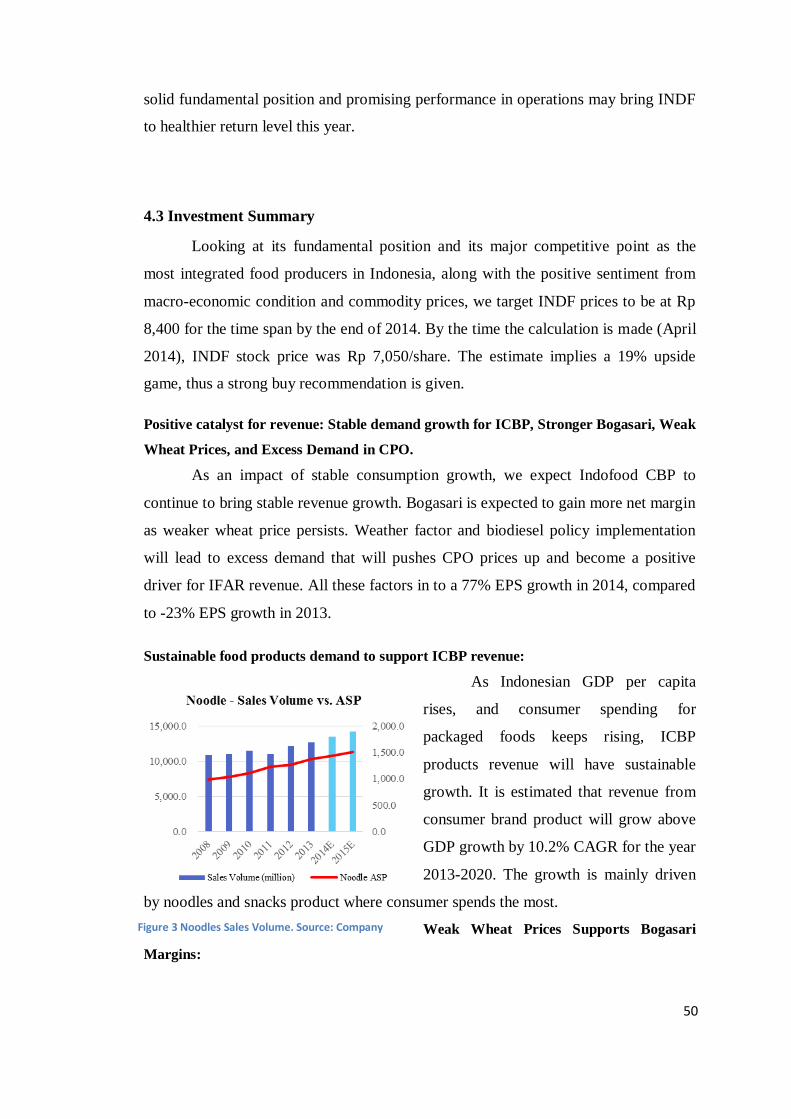
i
45
Figure 3 Noodles Sales Volume. Source: Company
solid fundamental position and promising performance in operations may bring INDF
to healthier return level this year.
4.3 Investment Summary
Looking at its fundamental position and its major competitive point as the
most integrated food producers in Indonesia, along with the positive sentiment from
macro-economic condition and commodity prices, we target INDF prices to be at Rp
8,400 for the time span by the end of 2014. By the time the calculation is made (April
2014), INDF stock price was Rp 7,050/share. The estimate implies a 19% upside
game, thus a strong buy recommendation is given.
Positive catalyst for revenue: Stable demand growth for ICBP, Stronger Bogasari, Weak
Wheat Prices, and Excess Demand in CPO.
As an impact of stable consumption growth, we expect Indofood CBP to
continue to bring stable revenue growth. Bogasari is expected to gain more net margin
as weaker wheat price persists. Weather factor and biodiesel policy implementation
will lead to excess demand that will pushes CPO prices up and become a positive
driver for IFAR revenue. All these factors in to a 77% EPS growth in 2014, compared
to -23% EPS growth in 2013.
Sustainable food products demand to support ICBP revenue:
As Indonesian GDP per capita
rises, and consumer spending for
packaged foods keeps rising, ICBP
products revenue will have sustainable
growth. It is estimated that revenue from
consumer brand product will grow above
GDP growth by 10.2% CAGR for the year
2013-2020. The growth is mainly driven
by noodles and snacks product where consumer spends the most.
Weak Wheat Prices Supports Bogasari
Margins:
50
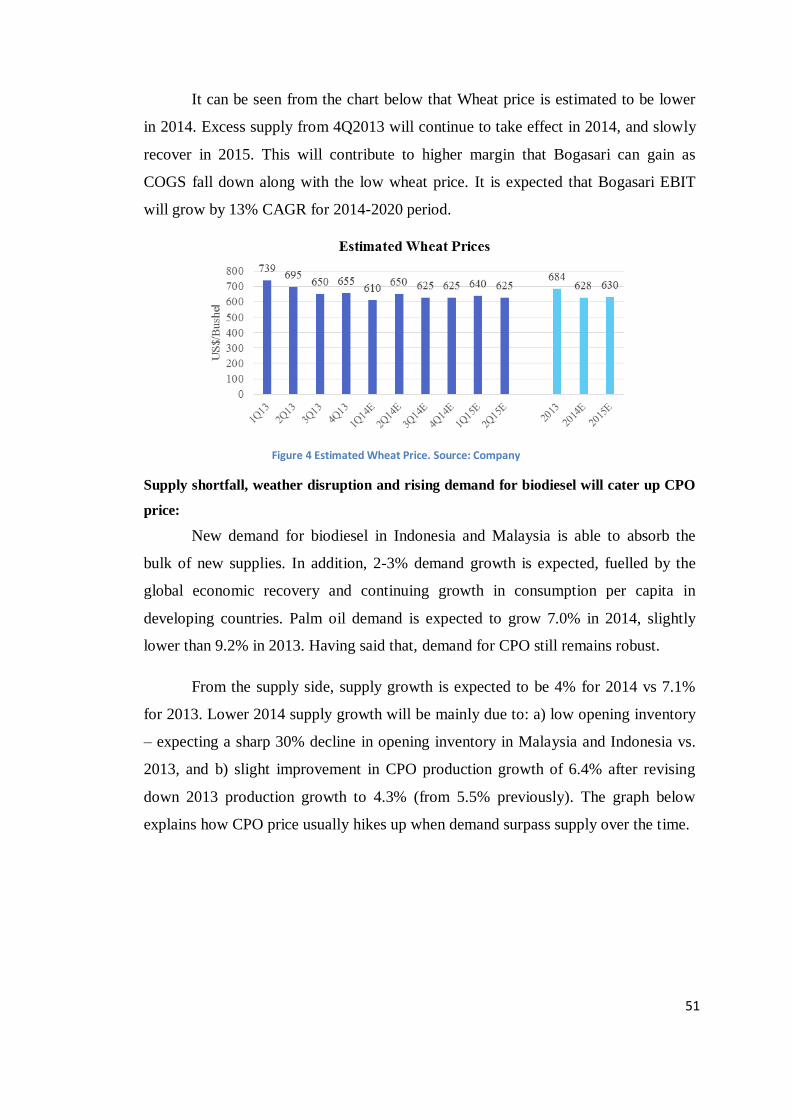
i
46
It can be seen from the chart below that Wheat price is estimated to be lower
in 2014. Excess supply from 4Q2013 will continue to take effect in 2014, and slowly
recover in 2015. This will contribute to higher margin that Bogasari can gain as
COGS fall down along with the low wheat price. It is expected that Bogasari EBIT
will grow by 13% CAGR for 2014-2020 period.
Figure 4 Estimated Wheat Price. Source: Company
Supply shortfall, weather disruption and rising demand for biodiesel will cater up CPO
price:
New demand for biodiesel in Indonesia and Malaysia is able to absorb the
bulk of new supplies. In addition, 2-3% demand growth is expected, fuelled by the
global economic recovery and continuing growth in consumption per capita in
developing countries. Palm oil demand is expected to grow 7.0% in 2014, slightly
lower than 9.2% in 2013. Having said that, demand for CPO still remains robust.
From the supply side, supply growth is expected to be 4% for 2014 vs 7.1%
for 2013. Lower 2014 supply growth will be mainly due to: a) low opening inventory
– expecting a sharp 30% decline in opening inventory in Malaysia and Indonesia vs.
2013, and b) slight improvement in CPO production growth of 6.4% after revising
down 2013 production growth to 4.3% (from 5.5% previously). The graph below
explains how CPO price usually hikes up when demand surpass supply over the time.
51
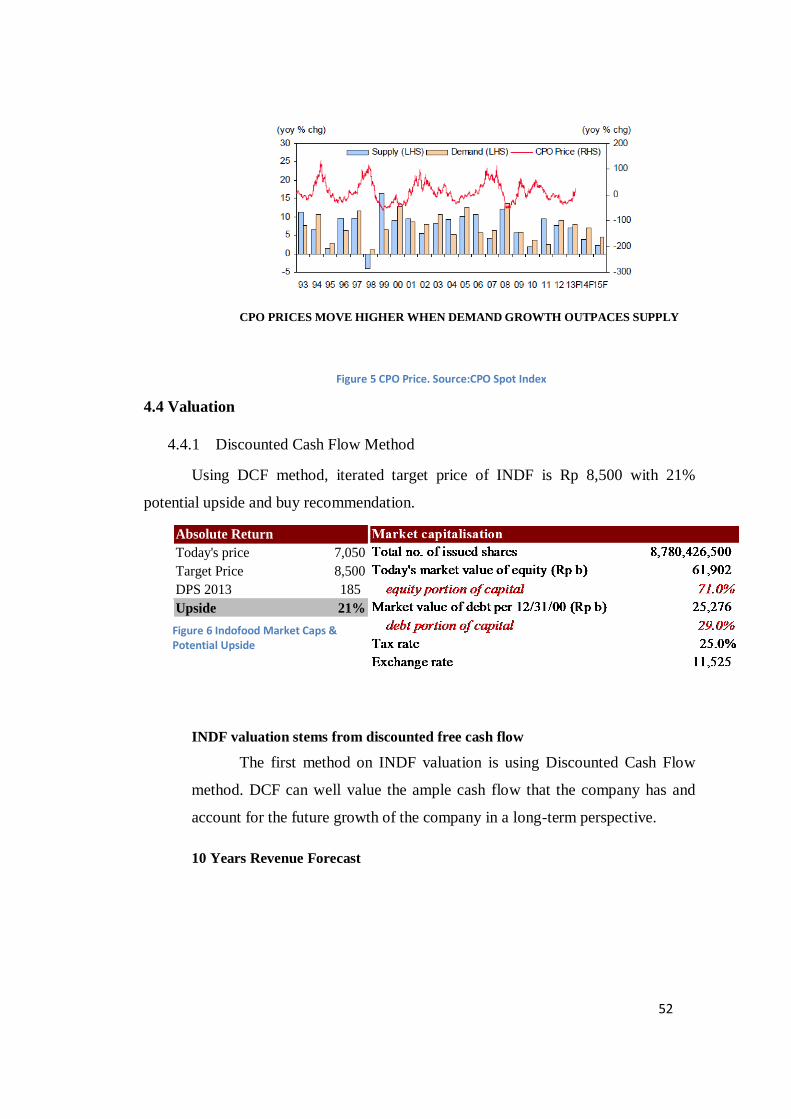
i
47
Absolute Return
Today's price 7,050
Target Price 8,500
DPS 2013 185
Upside 21%
Figure 6 Indofood Market Caps & Potential Upside
CPO PRICES MOVE HIGHER WHEN DEMAND GROWTH OUTPACES SUPPLY
4.4 Valuation
4.4.1 Discounted Cash Flow Method
Using DCF method, iterated target price of INDF is Rp 8,500 with 21%
potential upside and buy recommendation.
INDF valuation stems from discounted free cash flow
The first method on INDF valuation is using Discounted Cash Flow
method. DCF can well value the ample cash flow that the company has and
account for the future growth of the company in a long-term perspective.
10 Years Revenue Forecast
Figure 5 CPO Price. Source:CPO Spot Index
52
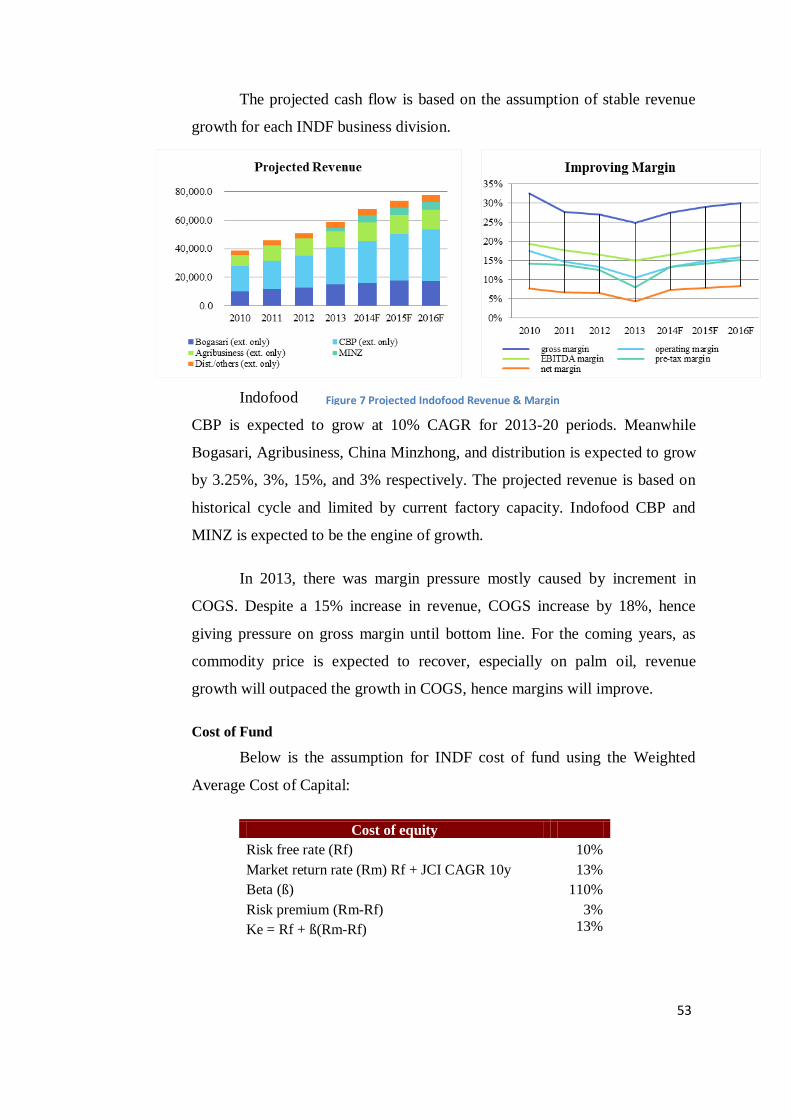
i
48
Figure 7 Projected Indofood Revenue & Margin
The projected cash flow is based on the assumption of stable revenue
growth for each INDF business division.
Indofood
CBP is expected to grow at 10% CAGR for 2013-20 periods. Meanwhile
Bogasari, Agribusiness, China Minzhong, and distribution is expected to grow
by 3.25%, 3%, 15%, and 3% respectively. The projected revenue is based on
historical cycle and limited by current factory capacity. Indofood CBP and
MINZ is expected to be the engine of growth.
In 2013, there was margin pressure mostly caused by increment in
COGS. Despite a 15% increase in revenue, COGS increase by 18%, hence
giving pressure on gross margin until bottom line. For the coming years, as
commodity price is expected to recover, especially on palm oil, revenue
growth will outpaced the growth in COGS, hence margins will improve.
Cost of Fund
Below is the assumption for INDF cost of fund using the Weighted
Average Cost of Capital:
Cost of equity
Risk free rate (Rf) 10%
Market return rate (Rm) Rf + JCI CAGR 10y 13%
Beta (ß) 110%
Risk premium (Rm-Rf) 3%
Ke = Rf + ß(Rm-Rf) 13%
53
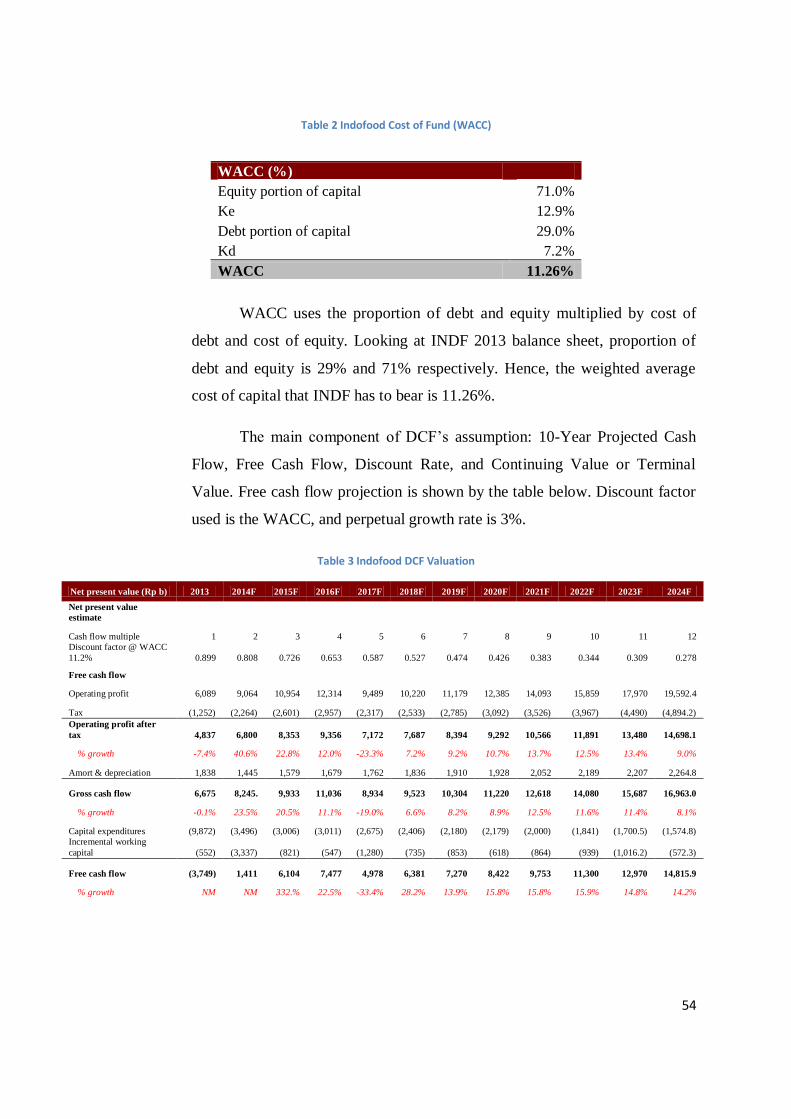
i
49
Table 2 Indofood Cost of Fund (WACC)
WACC uses the proportion of debt and equity multiplied by cost of
debt and cost of equity. Looking at INDF 2013 balance sheet, proportion of
debt and equity is 29% and 71% respectively. Hence, the weighted average
cost of capital that INDF has to bear is 11.26%.
The main component of DCF’s assumption: 10-Year Projected Cash
Flow, Free Cash Flow, Discount Rate, and Continuing Value or Terminal
Value. Free cash flow projection is shown by the table below. Discount factor
used is the WACC, and perpetual growth rate is 3%.
Table 3 Indofood DCF Valuation
Net present value (Rp b) 2013 2014F 2015F 2016F 2017F 2018F 2019F 2020F 2021F 2022F 2023F 2024F
Net present value
estimate
Cash flow multiple 1 2 3 4 5 6 7 8 9 10 11 12
Discount factor @ WACC
11.2% 0.899 0.808 0.726 0.653 0.587 0.527 0.474 0.426 0.383 0.344 0.309 0.278
Free cash flow
Operating profit 6,089 9,064 10,954 12,314 9,489 10,220 11,179 12,385 14,093 15,859 17,970 19,592.4
Tax (1,252) (2,264) (2,601) (2,957) (2,317) (2,533) (2,785) (3,092) (3,526) (3,967) (4,490) (4,894.2)
Operating profit after
tax 4,837 6,800 8,353 9,356 7,172 7,687 8,394 9,292 10,566 11,891 13,480 14,698.1
% growth -7.4% 40.6% 22.8% 12.0% -23.3% 7.2% 9.2% 10.7% 13.7% 12.5% 13.4% 9.0%
Amort & depreciation 1,838 1,445 1,579 1,679 1,762 1,836 1,910 1,928 2,052 2,189 2,207 2,264.8
Gross cash flow 6,675 8,245. 9,933 11,036 8,934 9,523 10,304 11,220 12,618 14,080 15,687 16,963.0
% growth -0.1% 23.5% 20.5% 11.1% -19.0% 6.6% 8.2% 8.9% 12.5% 11.6% 11.4% 8.1%
Capital expenditures (9,872) (3,496) (3,006) (3,011) (2,675) (2,406) (2,180) (2,179) (2,000) (1,841) (1,700.5) (1,574.8)
Incremental working
capital (552) (3,337) (821) (547) (1,280) (735) (853) (618) (864) (939) (1,016.2) (572.3)
Free cash flow (3,749) 1,411 6,104 7,477 4,978 6,381 7,270 8,422 9,753 11,300 12,970 14,815.9
% growth NM NM 332.% 22.5% -33.4% 28.2% 13.9% 15.8% 15.8% 15.9% 14.8% 14.2%
WACC (%)
Equity portion of capital 71.0%
Ke 12.9%
Debt portion of capital 29.0%
Kd 7.2%
WACC 11.26%
54
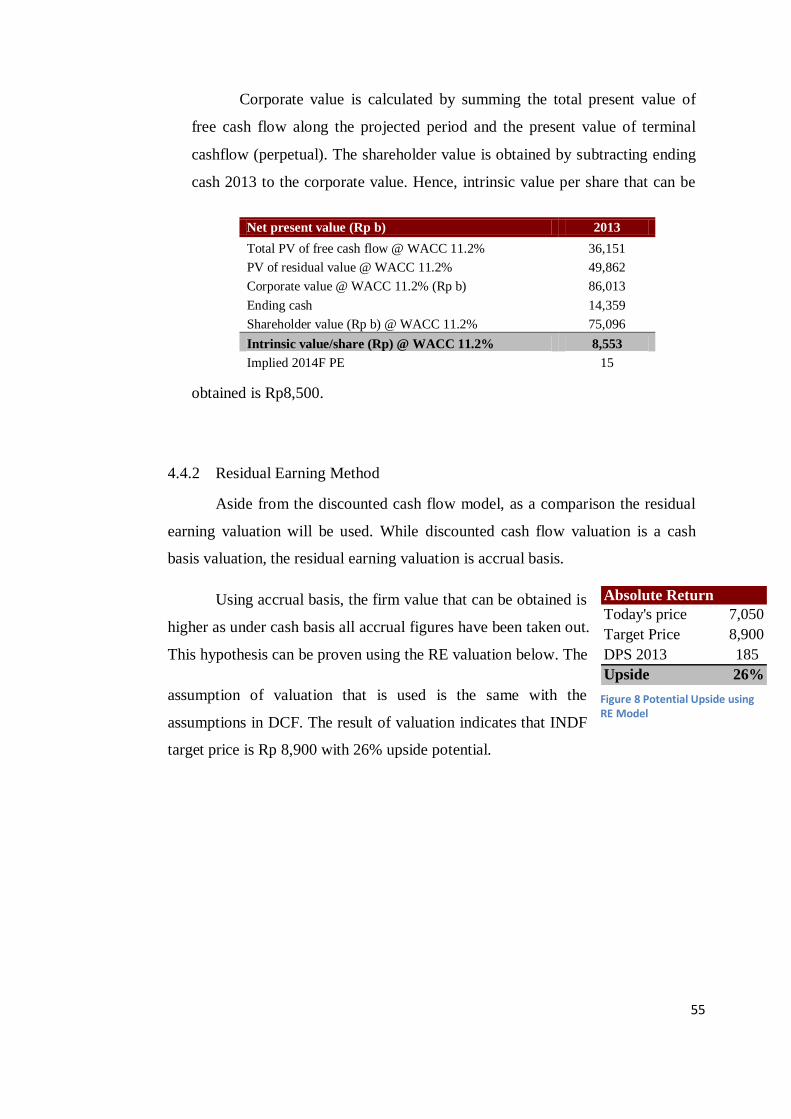
i
50
Absolute Return
Today's price 7,050
Target Price 8,900
DPS 2013 185
Upside 26%
Figure 8 Potential Upside using RE Model
Corporate value is calculated by summing the total present value of
free cash flow along the projected period and the present value of terminal
cashflow (perpetual). The shareholder value is obtained by subtracting ending
cash 2013 to the corporate value. Hence, intrinsic value per share that can be
obtained is Rp8,500.
4.4.2 Residual Earning Method
Aside from the discounted cash flow model, as a comparison the residual
earning valuation will be used. While discounted cash flow valuation is a cash
basis valuation, the residual earning valuation is accrual basis.
Using accrual basis, the firm value that can be obtained is
higher as under cash basis all accrual figures have been taken out.
This hypothesis can be proven using the RE valuation below. The
assumption of valuation that is used is the same with the
assumptions in DCF. The result of valuation indicates that INDF
target price is Rp 8,900 with 26% upside potential.
Net present value (Rp b) 2013
Total PV of free cash flow @ WACC 11.2% 36,151
PV of residual value @ WACC 11.2% 49,862
Corporate value @ WACC 11.2% (Rp b) 86,013
Ending cash 14,359
Shareholder value (Rp b) @ WACC 11.2% 75,096
Intrinsic value/share (Rp) @ WACC 11.2% 8,553
Implied 2014F PE 15
55
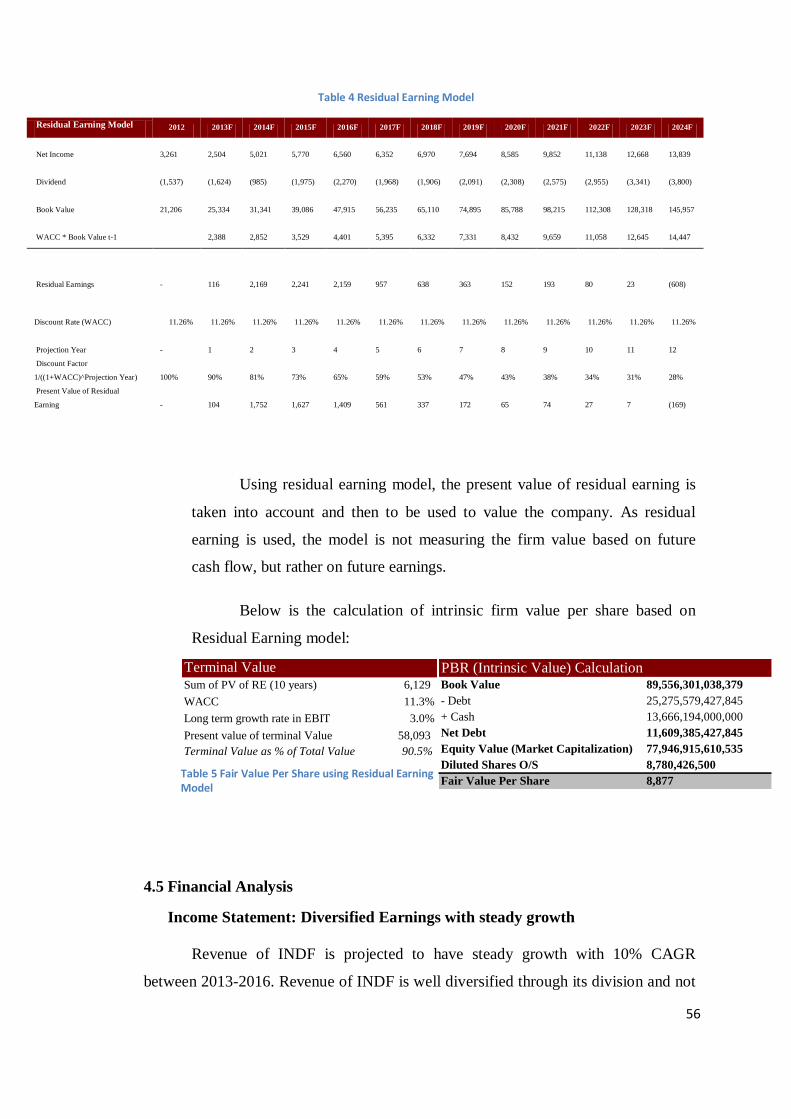
i
51
89,556,301,038,379
25,275,579,427,845
13,666,194,000,000
11,609,385,427,845
77,946,915,610,535
8,780,426,500
8,877
Diluted Shares O/S
Fair Value Per Share
PBR (Intrinsic Value) CalculationBook Value
- Debt
+ Cash
Net Debt
Equity Value (Market Capitalization)
6,129
11.3%
3.0%
58,093
90.5%
Terminal Value
Sum of PV of RE (10 years)
WACC
Long term growth rate in EBIT
Present value of terminal Value
Terminal Value as % of Total Value
Table 5 Fair Value Per Share using Residual Earning Model
Table 4 Residual Earning Model
Residual Earning Model 2012 2013F 2014F 2015F 2016F 2017F 2018F 2019F 2020F 2021F 2022F 2023F 2024F
Net Income
3,261
2,504
5,021
5,770
6,560
6,352
6,970
7,694
8,585
9,852
11,138
12,668
13,839
Dividend
(1,537)
(1,624)
(985)
(1,975)
(2,270)
(1,968)
(1,906)
(2,091)
(2,308)
(2,575)
(2,955)
(3,341)
(3,800)
Book Value
21,206
25,334
31,341
39,086
47,915
56,235
65,110
74,895
85,788
98,215
112,308
128,318
145,957
WACC * Book Value t-1
2,388
2,852
3,529
4,401
5,395
6,332
7,331
8,432
9,659
11,058
12,645
14,447
Residual Earnings
-
116
2,169
2,241
2,159
957
638
363
152
193
80
23
(608)
Discount Rate (WACC) 11.26% 11.26% 11.26% 11.26% 11.26% 11.26% 11.26% 11.26% 11.26% 11.26% 11.26% 11.26% 11.26%
Projection Year
-
1
2
3
4
5
6
7
8
9
10
11
12
Discount Factor
1/((1+WACC)^Projection Year)
100%
90%
81%
73%
65%
59%
53%
47%
43%
38%
34%
31%
28%
Present Value of Residual
Earning
-
104
1,752
1,627
1,409
561
337
172
65
74
27
7
(169)
Using residual earning model, the present value of residual earning is
taken into account and then to be used to value the company. As residual
earning is used, the model is not measuring the firm value based on future
cash flow, but rather on future earnings.
Below is the calculation of intrinsic firm value per share based on
Residual Earning model:
4.5 Financial Analysis
Income Statement: Diversified Earnings with steady growth
Revenue of INDF is projected to have steady growth with 10% CAGR
between 2013-2016. Revenue of INDF is well diversified through its division and not
56
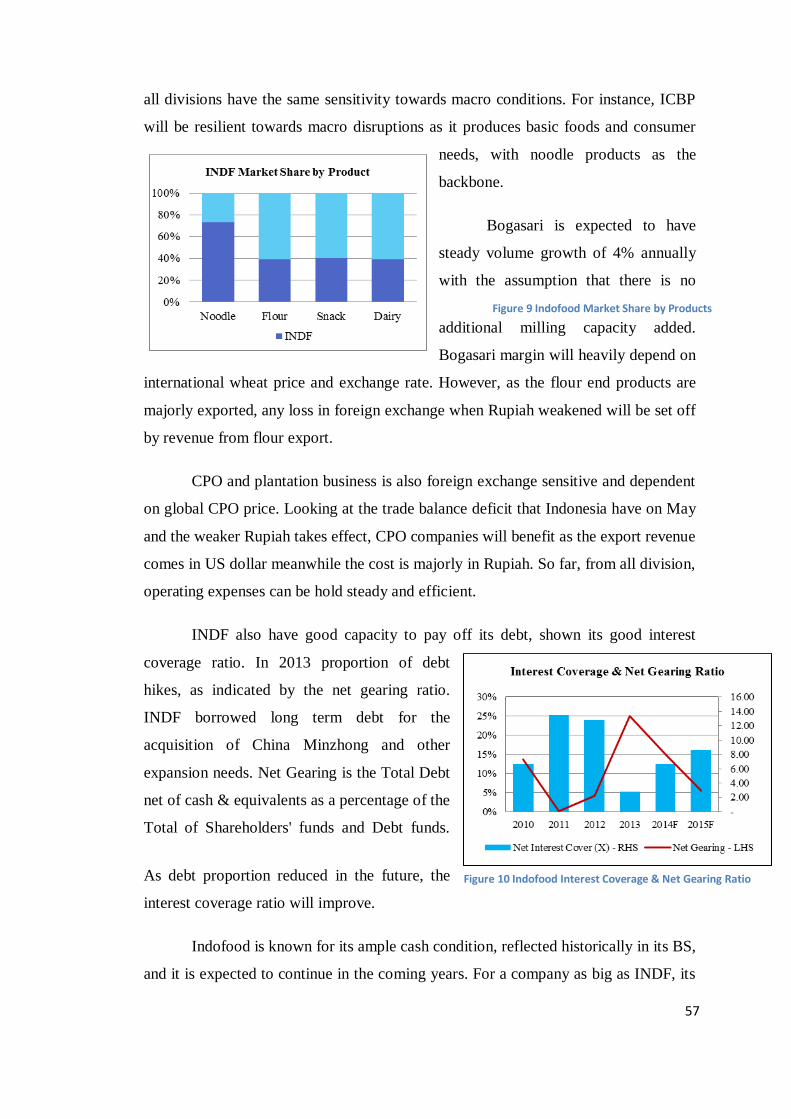
i
52
Figure 10 Indofood Interest Coverage & Net Gearing Ratio
Figure 9 Indofood Market Share by Products
all divisions have the same sensitivity towards macro conditions. For instance, ICBP
will be resilient towards macro disruptions as it produces basic foods and consumer
needs, with noodle products as the
backbone.
Bogasari is expected to have
steady volume growth of 4% annually
with the assumption that there is no
additional milling capacity added.
Bogasari margin will heavily depend on
international wheat price and exchange rate. However, as the flour end products are
majorly exported, any loss in foreign exchange when Rupiah weakened will be set off
by revenue from flour export.
CPO and plantation business is also foreign exchange sensitive and dependent
on global CPO price. Looking at the trade balance deficit that Indonesia have on May
and the weaker Rupiah takes effect, CPO companies will benefit as the export revenue
comes in US dollar meanwhile the cost is majorly in Rupiah. So far, from all division,
operating expenses can be hold steady and efficient.
INDF also have good capacity to pay off its debt, shown its good interest
coverage ratio. In 2013 proportion of debt
hikes, as indicated by the net gearing ratio.
INDF borrowed long term debt for the
acquisition of China Minzhong and other
expansion needs. Net Gearing is the Total Debt
net of cash & equivalents as a percentage of the
Total of Shareholders' funds and Debt funds.
As debt proportion reduced in the future, the
interest coverage ratio will improve.
Indofood is known for its ample cash condition, reflected historically in its BS,
and it is expected to continue in the coming years. For a company as big as INDF, its
57
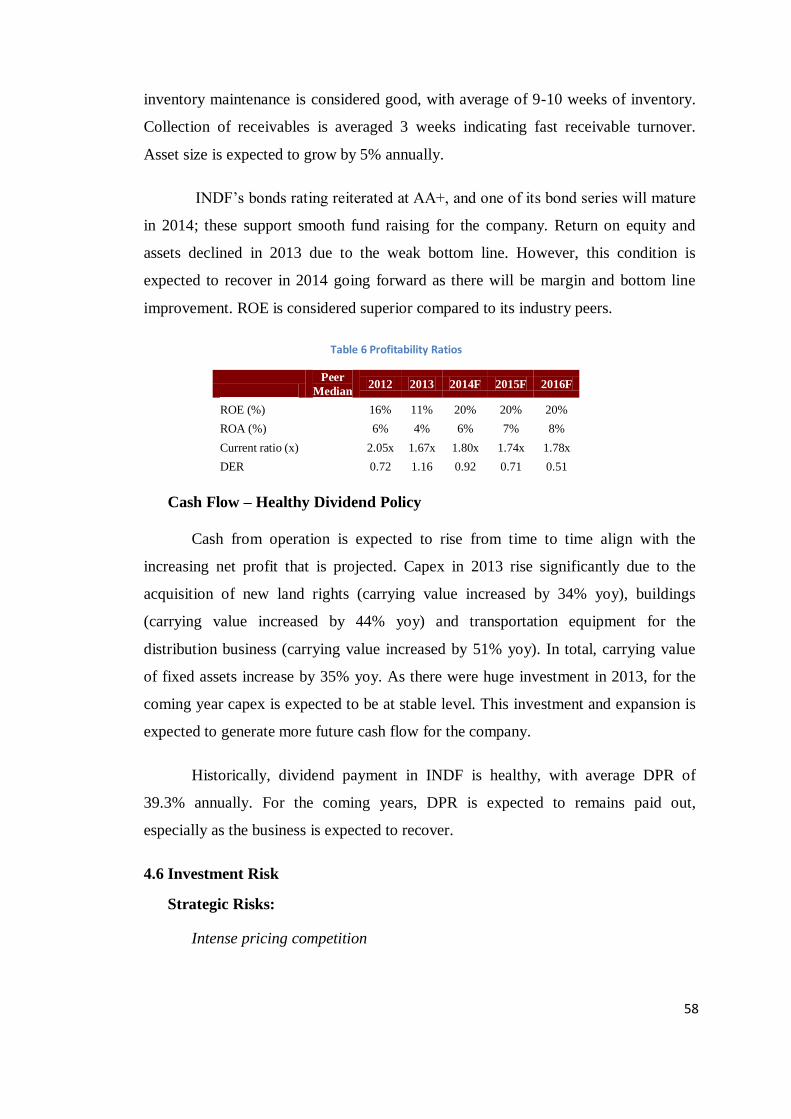
i
53
inventory maintenance is considered good, with average of 9-10 weeks of inventory.
Collection of receivables is averaged 3 weeks indicating fast receivable turnover.
Asset size is expected to grow by 5% annually.
INDF’s bonds rating reiterated at AA+, and one of its bond series will mature
in 2014; these support smooth fund raising for the company. Return on equity and
assets declined in 2013 due to the weak bottom line. However, this condition is
expected to recover in 2014 going forward as there will be margin and bottom line
improvement. ROE is considered superior compared to its industry peers.
Table 6 Profitability Ratios
Peer
Median 2012 2013 2014F 2015F 2016F
ROE (%) 16% 11% 20% 20% 20%
ROA (%) 6% 4% 6% 7% 8%
Current ratio (x) 2.05x 1.67x 1.80x 1.74x 1.78x
DER 0.72 1.16 0.92 0.71 0.51
Cash Flow – Healthy Dividend Policy
Cash from operation is expected to rise from time to time align with the
increasing net profit that is projected. Capex in 2013 rise significantly due to the
acquisition of new land rights (carrying value increased by 34% yoy), buildings
(carrying value increased by 44% yoy) and transportation equipment for the
distribution business (carrying value increased by 51% yoy). In total, carrying value
of fixed assets increase by 35% yoy. As there were huge investment in 2013, for the
coming year capex is expected to be at stable level. This investment and expansion is
expected to generate more future cash flow for the company.
Historically, dividend payment in INDF is healthy, with average DPR of
39.3% annually. For the coming years, DPR is expected to remains paid out,
especially as the business is expected to recover.
4.6 Investment Risk
Strategic Risks:
Intense pricing competition
58
i
54
Consumer product pricing competes very tightly to one another. Therefore,
predatory pricing and new entrants pricing can be a threat to push down the
volume sold for ICBP products.
Financial Risk:
Swing in commodity price
Bogasari margin and CPO products are dependent on commodity
prices. When wheat price started to spike up, there will be margin pressure in
Bogasari. Considering that its competitor paying close attention to pricing
between each other, it does not necessarily implies that Bogasari can rise up
selling price. Commodities producers like Bogasari and IFAR has weak power
to set the price due to the uniformity of the final product.
The price of palm oil may be affected by a wide variety of factors,
including weather, trade policy, currency movement, consumer preference,
lobbying by environmental NGOs, the price of substitute vegetable oils and
crude oil. Agri businesses and plantation companies may also be affected by
regulatory changes.
Foreign Exchange Risk
INDF is exposed to foreign exchange risk as its raw materials are
imported; wheat, seasoned oil, packaging materials, etc. Weakened rupiah
may be a threat for INDF as its raw material cost will spiked up. The forex
gain from ICBP products export may not surpass the forex loss in importing
raw materials. In 2013, almost 10% of outstanding Long term debt is denoted
is foreign currency. Therefore, the business is very sensitive to foreign
exchange movement. Dairy products that has skimmed milk as its raw
materials is also a threat, as the skimmed milk is imported and paid in US $.
Operation Risk:
Weather threat to CPO crop
In 2013, INDF business is pushed up to a good shape in support by its
CPO division. However, the CPO production is also very prone to weather
59
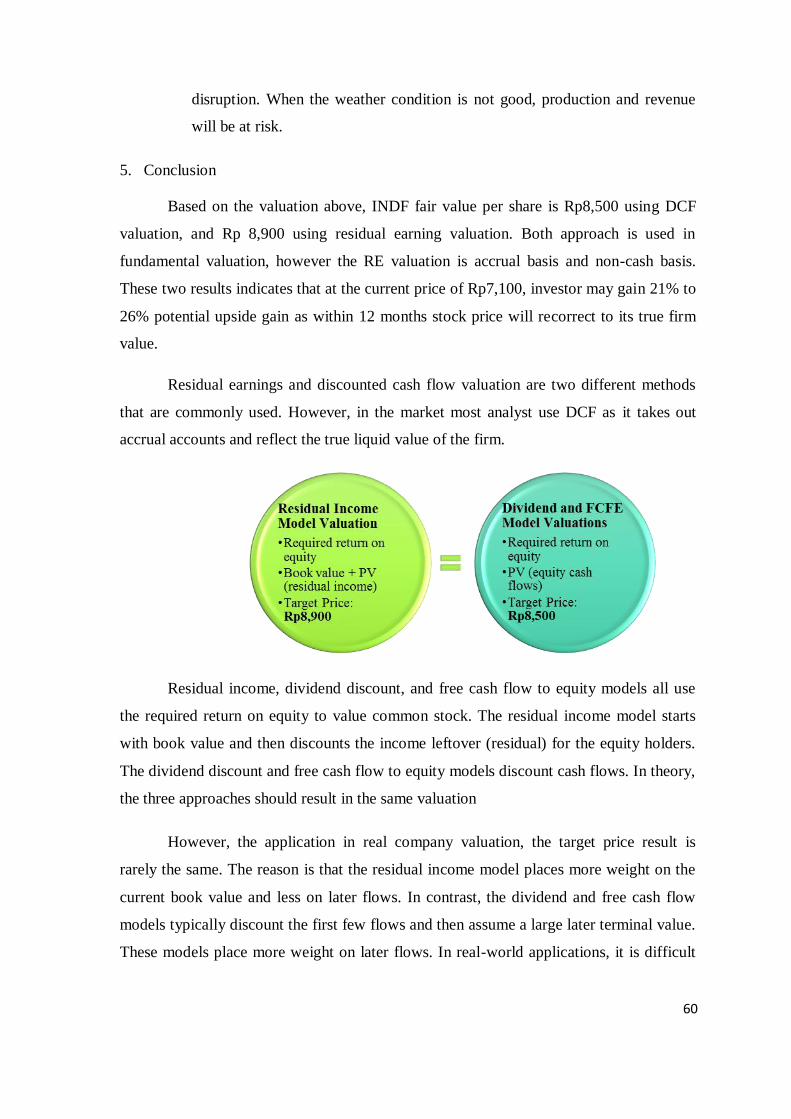
i
55
disruption. When the weather condition is not good, production and revenue
will be at risk.
5. Conclusion
Based on the valuation above, INDF fair value per share is Rp8,500 using DCF
valuation, and Rp 8,900 using residual earning valuation. Both approach is used in
fundamental valuation, however the RE valuation is accrual basis and non-cash basis.
These two results indicates that at the current price of Rp7,100, investor may gain 21% to
26% potential upside gain as within 12 months stock price will recorrect to its true firm
value.
Residual earnings and discounted cash flow valuation are two different methods
that are commonly used. However, in the market most analyst use DCF as it takes out
accrual accounts and reflect the true liquid value of the firm.
Residual income, dividend discount, and free cash flow to equity models all use
the required return on equity to value common stock. The residual income model starts
with book value and then discounts the income leftover (residual) for the equity holders.
The dividend discount and free cash flow to equity models discount cash flows. In theory,
the three approaches should result in the same valuation
However, the application in real company valuation, the target price result is
rarely the same. The reason is that the residual income model places more weight on the
current book value and less on later flows. In contrast, the dividend and free cash flow
models typically discount the first few flows and then assume a large later terminal value.
These models place more weight on later flows. In real-world applications, it is difficult
60
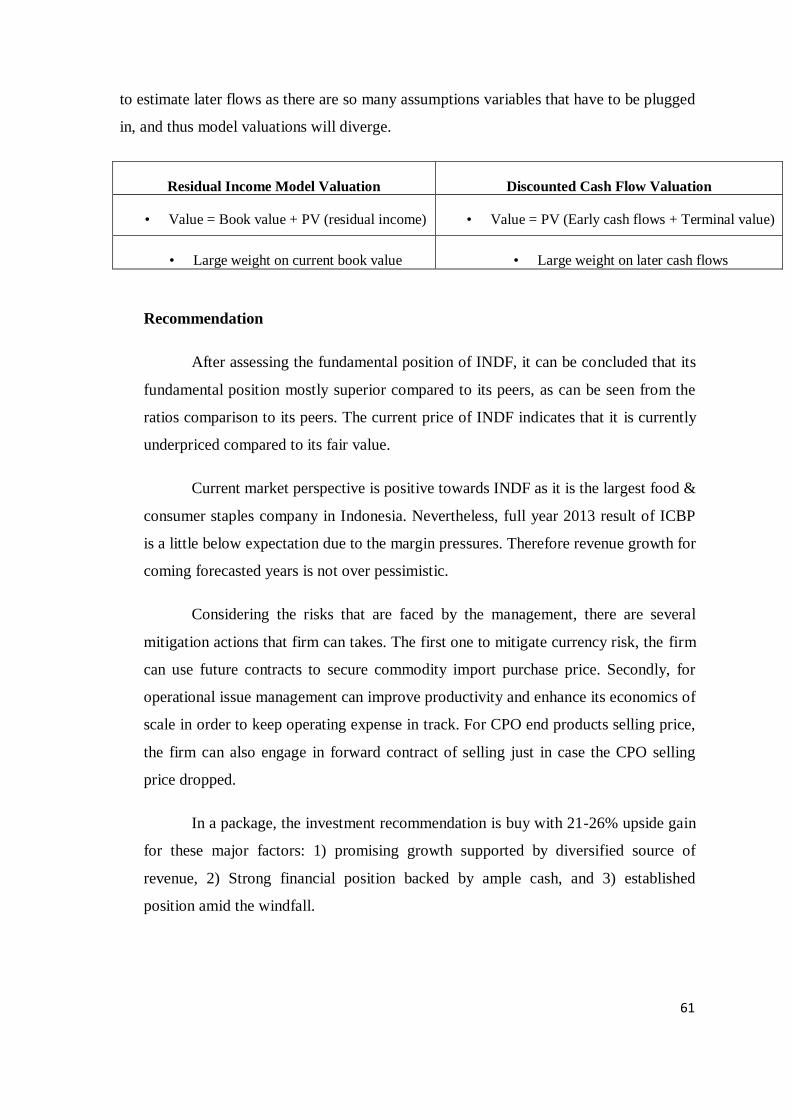
i
56
to estimate later flows as there are so many assumptions variables that have to be plugged
in, and thus model valuations will diverge.
Residual Income Model Valuation Discounted Cash Flow Valuation
• Value = Book value + PV (residual income) • Value = PV (Early cash flows + Terminal value)
• Large weight on current book value • Large weight on later cash flows
Recommendation
After assessing the fundamental position of INDF, it can be concluded that its
fundamental position mostly superior compared to its peers, as can be seen from the
ratios comparison to its peers. The current price of INDF indicates that it is currently
underpriced compared to its fair value.
Current market perspective is positive towards INDF as it is the largest food &
consumer staples company in Indonesia. Nevertheless, full year 2013 result of ICBP
is a little below expectation due to the margin pressures. Therefore revenue growth for
coming forecasted years is not over pessimistic.
Considering the risks that are faced by the management, there are several
mitigation actions that firm can takes. The first one to mitigate currency risk, the firm
can use future contracts to secure commodity import purchase price. Secondly, for
operational issue management can improve productivity and enhance its economics of
scale in order to keep operating expense in track. For CPO end products selling price,
the firm can also engage in forward contract of selling just in case the CPO selling
price dropped.
In a package, the investment recommendation is buy with 21-26% upside gain
for these major factors: 1) promising growth supported by diversified source of
revenue, 2) Strong financial position backed by ample cash, and 3) established
position amid the windfall.
61
i
57
References
Bloomberg Professional Database. (2008, August 09). Credit Derivates and Interest Rates. New York,
New York, United States of America. Retrieved August 09, 2008
Damodaran, Aswath. (2001). The Dark Side of Valuation: Valuing Old Tech, New Tech, and New
Economy Companies. New Jersey: Prentice Hall.
Damodaran, Aswath. (2002). Investment Valuation: Tools and Technique for Determining the Value
of Any Asset (2nd edition). New Jersey: John Wiley & Sons
Hull, J. C. (2008). Options, Futures and Other Derivatives (7th Edition ed.). Upper Saddle River:
Pearson Prentince Hall.
Manurung, Adler Haymans (2011). ValuasiWajar Perusahaan. Jakarta: PT Adler Manurung Press.
Miles, D., & A. Scott. (2005). Macroeconomics: Understanding The Wealth of Nations. Southern
Gate Chichester: John Wiley & Sons.
Mishkin, Federic S. (2009). The Economics of Money, Banking, and Financial Markets (2nd
ed of the business ed.). Boston: Pearson Education, Inc.
NYU Stern. (2014). Country Default Spread and Risk Premiums. Retrieved from
http://pages.stern.nyu.edu/~adamodar/New_Home_Page/datafile/ctryprem.html
Penman, Steven H.(2004). Financial Statement Analysis and Security Valuation ( 5th
ed.).
New York, NY: McGraw- Hill Education.
Sentana, I Made. (2014, January 5). Bank of Indonesia- 2014 Outlook. The Wall Street
Journal. Retrieved from http://blogs.wsj.com/economics/2014/01/05/bank-of-
indonesia-2014-outlook/
White, Gerald I., Ashwinpaul C. Sondhi&Dov Field. (2003). The Analysis and Use of
Financial Statements (3rd edition).Massachussetts: John Wiley & Sons, Inc.
62
i
58
MEASURING INTRINSIC VALUE OF PT. BANK MANDIRI TBK. USING RESIDUAL INCOME APPROACH, DIVIDEND DISCOUNT MODEL
AND PRICE TO BOOK VALUE
TEUKU RUSYDI KHAIRI
Sampoerna School of Business
dan
ADLER HAYMANS MANURUNG
PT Finansial Bisnis Informasi
Abstract
This paper empirically studies the valuation of PT. Bank Mandiri TBK (BMRI) using residual
income, dividend discounted model and price to book value method. It adopts top down
analysis approach whereas begin with the macroeconomic analysis, industry and then proceed
to company analysis which include financial projection for upcoming years with various growth
assumption gained from company visit. The result from study showed that the intrinsic value of
BMRI worth at Rp11,200 using residual income method while it worth at Rp10,100 and Rp9,800
based on dividend discounted model and price to book value ratio approach respectively. This
study indicated that the stock is undervalued comparing to its closed price at Rp8,7100 per
October 25, 2013.
Keywords: Valuation, Banking, Residual Income, Price to Book Value, Dividend Discount Model
63
i
59
Introduction
Indonesia capital market has been showing an impressive stretch during the last three years
in which Jakarta Composite Index (JCI) and foreign direct investment (FDI) kept hitting new record.
JCI, country’s equity benchmark, has shot up from 3,409 at the beginning of 2011 to hit 5,068 on
May 31, 2013, a surge of 49%. While FDI recorded its high in the first three month of 2013 reaching
IDR65.5 trillion (US$6.5 billion) and made up a total IDR93 trillion of FDI in the first quarter of 2013.
As stated by Indonesia Stock Exchange (2013) that the impressive bounce of Indonesian capital
market was largely due to nation’s robust economic growth (gross domestic product expanded at
average of 6.2% since the last three years) backed up by strong domestic consumption, rising middle
class income, healthy fiscal policy and political stability.
International investors have been keen to get more exposure in to Indonesia as the
country’s outlook became more appealing. Bond and equity prospect are racing on positive track
whereas in 2013 the country had raised total Rp 383 trillion from both instruments. International
investors as a result now dominate major portion of country’s equity and bond transaction.
According to latest figures from Indonesia Stock Exchange (IDX), foreign investors owned nearly 63%
of Indonesian stock in term of market capitalization as of 2013 and the rest 37% owned by domestic
institution and retail investors (IDX, 2013).
As far as the capital market is concerned, stock exchange rigorously managed to develop
large based of investor from domestic institution, foreigners, to retail investors. IDX has in
cooperation with Association of Indonesia Securities Companies (APEI), BAPEPAM LK and securities
companies been organizing free education program to introduce capital market to the public in
order to develop larger base of retail investors. IDX (2013) stated that registered investors account
rose rapidly from 370,786 in March 2013 to 422,324 as February 2014, a surge of 14%.
Nevertheless, one of the greatest challenges facing for every investor in dealing with capital
market is assessing the intrinsic value of the security. Understanding company valuation and
fundamental aspects is essential for every capital market investors to give them the objective
measure of their investing decision (Damodaran, 2009). Valuation is playing important part since it is
grounded on fundamental factors that largely influence the company performance. This is however
under assumption that the market is rational and any arbitrage opportunity will be eliminated by
market mechanism eventually the value of company should be returned to its intrinsic value.
64
i
60
The approach of company valuation may result in different methods. These methods are
consistent with the purposes and company business structure so that it will expectedly reach the
intrinsic value of the targeted company. The banking and property sector for example have different
business model due to the facts they both operate in different industry and business environment.
The use of inappropriate valuation methods for these two different sectors may produce bias value
and led to losses due to the facts that valuations approach are all based on different principles.
Understanding the valuation principles is critical for the analyst to choose the appropriate valuation
approach.
This paper aims to evaluate the intrinsic value one of the financial service in
Indonesia namely PT. Bank Mandiri Tbk. It is widely realized that banking industry is the life
blood and key driving force of economy since the real sector heavily determined on banking
industry soundness. Indeed, it has been challenging to value financial service rather than
real sector because of several factors. Firstly, its industry is heavily regulated whereas the
change in regulation could lead to large shift in value. The accounting rule is also varied with
general firms due to the assets are being marked to market. Lastly, its earning is largely
depending on the payment of third party for its credit whereas its ability to pay also
determined on business profitability.
Having said that, Damodaran (2009) argued that financial services are best valued
using equity valuation model rather than enterprise valuation model and with actual or
potential dividend rather than free cash flow to equity (Damodaran, 2009). However, this
paper will review how residual income, multiple valuations (i.e. price to book value) and
dividend discounted model to value financial service. As its known that the bank’s business
characteristic is generating income from its liabilities which mainly compose financial assets
those are marked to market and thus the valuation should pay more concern on its book
value and thus residual income is chosen to address this issue. However, the author adds
dividend discounted model and P/BV relative valuation as complementary model which will
be described in the following section.
PT Bank Mandiri Tbk (BMRI) is chosen as target analysis due to the bank has
managed to be one of the largest and valuable banking in Indonesia during the recent years.
This is shown by the stock price surge which has been rising significantly in less than two
65
i
61
years from Rp5,696 in the beginning of 2011 to Rp7,650 in November 1, 2013, a sour of
34%. Furthermore, BMRI is ranked as top five largest market capitalization in Indonesia
whooping at Rp245 trillion and the bank is also highly active traded stock with average daily
trading volume of 46 million shares. Apart from that, the author likes the company’s
fundamental that has demonstrated decent growth since its second crisis in 2005 as
indicated by stronger liquidity (84.5% LDR), better asset quality (1.9% NPL) and improved
profitability (5.57% NIM) in 2013.
1. Literature Review
Hamonangan and Sulistyawati (2012) in the journal of capital market and banking
analyzed the intrinsic value of PT. Bank Central Asia (BBCA) using two valuation approaches:
discounted earning and price to book value. Using these two methods, they found that
BBCA should be valued at Rp10, 820 per share and it was undervalued by 35.3% compared
to its closing price of Rp8, 000 per December 30, 2012. The valuation determined in this
analysis is proceeded through difference assumptions includes: 24% of credit growth, 18%
growth third party fund, interest income growth at 11%, net interest margin stood at 5%,
NPL, fee based income and inflation grew only by 0.5%, 25% and 6.75% respectively for
three years ahead.
Following this research, Simorangkir and Panubut (2012) determined intrinsic value
of PT. Bank Negara Indonesia (BBNI) using similar approach. The result indicated that BBNI
per share worth at Rp4,589 using discounted earning approach while PBV calculation gained
result of Rp4,508. These two valuation approach indicated BBNI is undervalued compared to
its closing price of Rp3,825 per October 21, 2011. The researchers proceed the analysis
using top down approach whereby began by macro analysis, industry, and proceed to
company analysis which include financial projection and examining intrinsic value
determinant. The assumptions used for valuation were also varied based on the historical
performance of the company.
Unlike above mentioned Indonesian researches who used discounted earnings and
PBV as valuation methodology, Sinkovic (2013) on his master thesis examined the intrinsic
value range of Gorensjka Banka -non public Slovenian retail banking- for its minority
shareholders using income and market approach. He argued that it is better to express
66
i
62
value in the range estimate rather than a single input due to the fact of different assumption
and subjective inputs in the model. The income approach utilized in the thesis includes
residual income model and discounted cash flow to equity while in the market approach or
comparable companies method utilized price to book value model. He found that value of
the bank as June 30, 2012 range between €700 to €749
Likewise Sinkovic (2013), Mata (2012) utilized the same valuation model to value
Banco Esperanto Santo (BES), a second largest Portuguese Bank listed in PS120 index. The
writer used the residual income and discounted cash flow model and relative valuation.
However, the thesis stress out to stick at excess return framework (i.e residual income
model) to determine BES intrinsic value since the model catches the growth opportunity in
emerging market and account the bank ability to capture value in domestic market. The
valuation suggests BES value at €1.26 per share as opposed to its closing price of €1.13.
In the light of 2009’s financial crisis, Luca (2009) examined the value of Danske Bank
Group, Denmark largest financial institution, using related valuation framework similarly to
Sinkovic (2009), Mata (2012) which include free cash flow to equity (FCFE), dividend
discount model (DDM), Residual Income model (RIM), and justified price to book value. Luca
(2009) argued that all these models are well appropriate to value bank. The bank was valued
at 131 DKK based on FCFE and dividend discount model (DDM) while the company value
increases to 144 DKK using residual income model and declined to 113 DKK using justified
PBV. That said, three out of four valuation model indicated that Danske Bank Group was
undervalued with an average upside potential of 5.1% based on the closing price of 129 DKK
per November 3, 2009.
2. Methodology
The aim of this chapter is to define the methodological approach used in this thesis. The
analysis of company valuation will be built on top down approach which starts by examining
macroeconomic environment and industry influences and finally performing individual company
analysis that include financial analysis and intrinsic value estimate. The company analysis is the main
core analysis in determining intrinsic value. It reviews historical and presents performance of
company’s financial condition and future prospect through qualitative and quantitative analysis.
67
i
63
Before proceeding to valuation, the future financial forecast is performed using the inputs
from previous analysis to build realistic forecast assumption. The valuation is finally proceeding with
different appropriate model namely residual earning method, dividend discounted model and
justified price to book value. The result of this valuation model will be compared to the market value
of the stock. Conclusion and recommendation are taken by comparing the calculated intrinsic value
to market value and could be used by future investors as benchmark of investing decision.
2.1 Data Collection
The empirical data used for this thesis is entirely secondary data which the sources consists of
variety of databases such as DataStream, company reports, government institution, and country
report. The following is specific data and its sources:
a. Annual report of PT. Bank Mandiri Tbk (BMRI)
from period 2008-2013 extracted from company website
b. Historical price of PT. Bank Mandiri Tbk from
period 2008-2013 obtained from Datastream
c. Historical value of Jakarta Composite Index (JCI)
from period 2008-2013 obtained from Datastream.
d. Macroeconomic data such as Certificate of Bank
Indonesia (SBI), inflation, GDP growth and exchange rate obtained from Datastream and
Bank Indonesia website.
3.2 Valuation Method
The most widely used valuation method for valuing companies is discounted free cash flow
model in which analysts project the value of operation measured by free cash flow and subtracting
with an estimated of net debt value. However, this model is primarily used to value non-financial
companies and rarely used for non-financial service due the fact that they are different in
characteristic as discussed at the previous section.
The choice of appropriate model is critical to reach a trustworthy analysis and rationale
output or value. There are three types of model used to value PT. Bank Mandiri Tbk (BMRI) in this
thesis, they are: 1) residual income model 2) discounted dividend model and 3) justified price to
book value. These three models are widely used to value financial services as described earlier in the
68
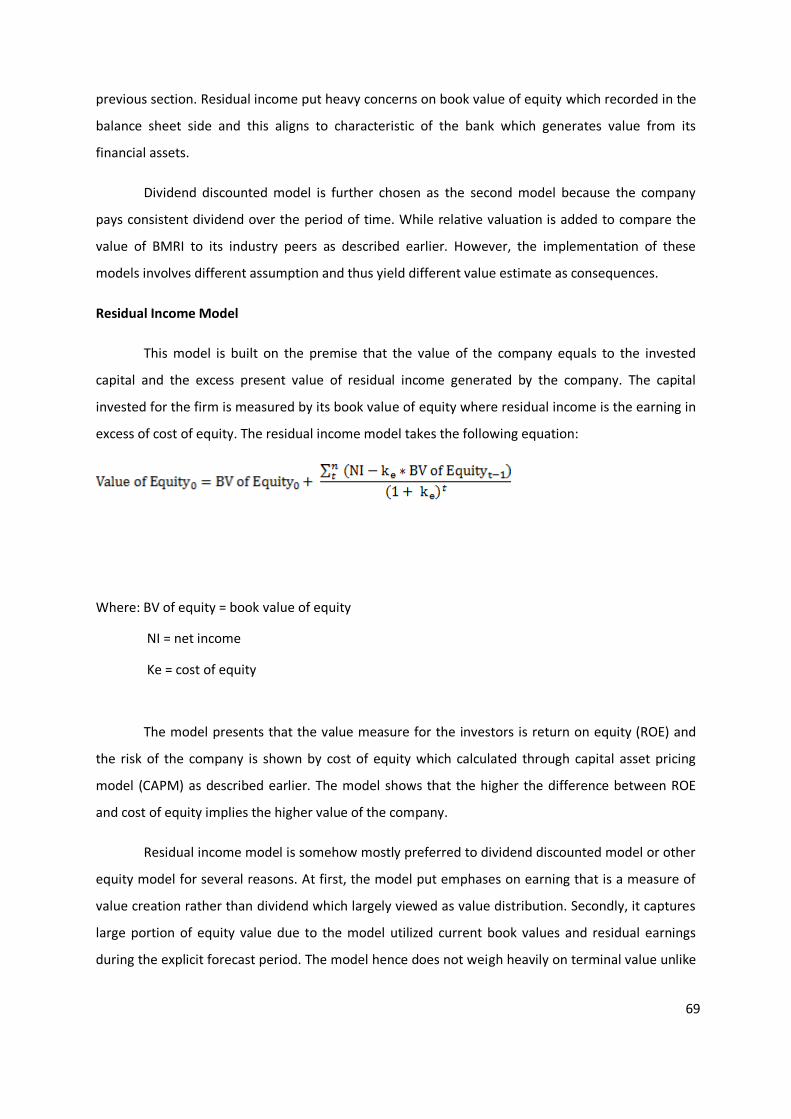
i
64
previous section. Residual income put heavy concerns on book value of equity which recorded in the
balance sheet side and this aligns to characteristic of the bank which generates value from its
financial assets.
Dividend discounted model is further chosen as the second model because the company
pays consistent dividend over the period of time. While relative valuation is added to compare the
value of BMRI to its industry peers as described earlier. However, the implementation of these
models involves different assumption and thus yield different value estimate as consequences.
Residual Income Model
This model is built on the premise that the value of the company equals to the invested
capital and the excess present value of residual income generated by the company. The capital
invested for the firm is measured by its book value of equity where residual income is the earning in
excess of cost of equity. The residual income model takes the following equation:
Where: BV of equity = book value of equity
NI = net income
Ke = cost of equity
The model presents that the value measure for the investors is return on equity (ROE) and
the risk of the company is shown by cost of equity which calculated through capital asset pricing
model (CAPM) as described earlier. The model shows that the higher the difference between ROE
and cost of equity implies the higher value of the company.
Residual income model is somehow mostly preferred to dividend discounted model or other
equity model for several reasons. At first, the model put emphases on earning that is a measure of
value creation rather than dividend which largely viewed as value distribution. Secondly, it captures
large portion of equity value due to the model utilized current book values and residual earnings
during the explicit forecast period. The model hence does not weigh heavily on terminal value unlike
69
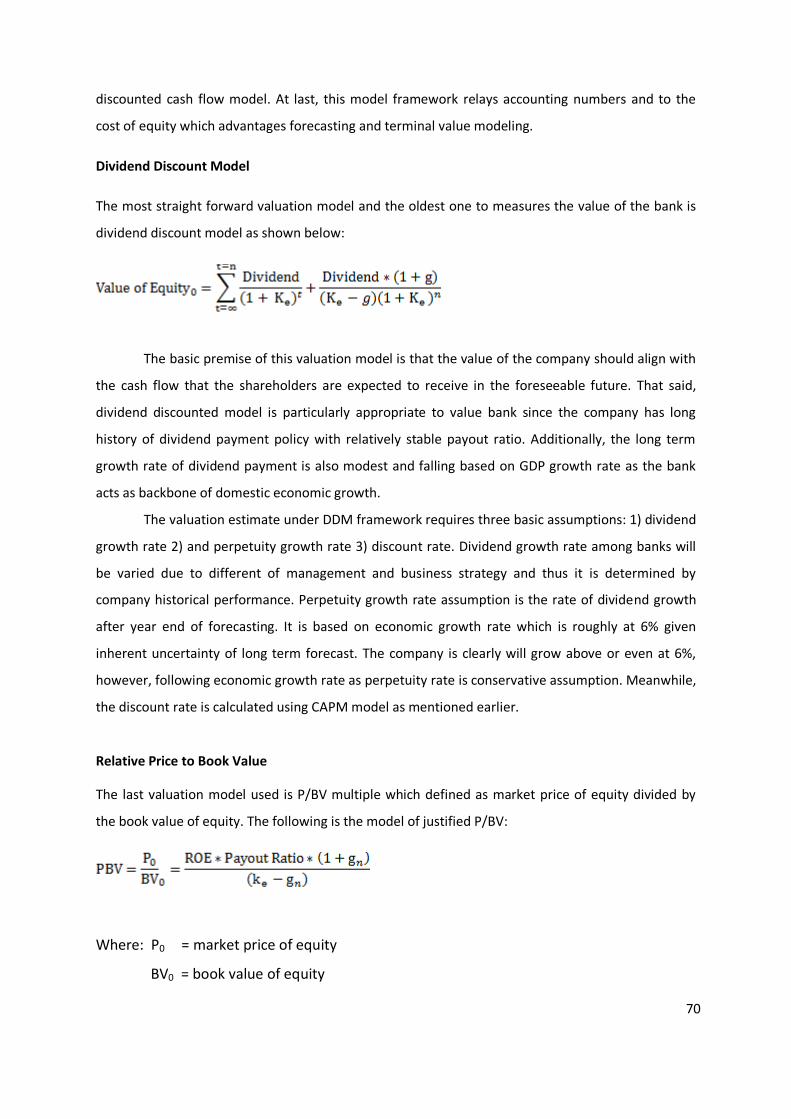
i
65
discounted cash flow model. At last, this model framework relays accounting numbers and to the
cost of equity which advantages forecasting and terminal value modeling.
Dividend Discount Model
The most straight forward valuation model and the oldest one to measures the value of the bank is
dividend discount model as shown below:
The basic premise of this valuation model is that the value of the company should align with
the cash flow that the shareholders are expected to receive in the foreseeable future. That said,
dividend discounted model is particularly appropriate to value bank since the company has long
history of dividend payment policy with relatively stable payout ratio. Additionally, the long term
growth rate of dividend payment is also modest and falling based on GDP growth rate as the bank
acts as backbone of domestic economic growth.
The valuation estimate under DDM framework requires three basic assumptions: 1) dividend
growth rate 2) and perpetuity growth rate 3) discount rate. Dividend growth rate among banks will
be varied due to different of management and business strategy and thus it is determined by
company historical performance. Perpetuity growth rate assumption is the rate of dividend growth
after year end of forecasting. It is based on economic growth rate which is roughly at 6% given
inherent uncertainty of long term forecast. The company is clearly will grow above or even at 6%,
however, following economic growth rate as perpetuity rate is conservative assumption. Meanwhile,
the discount rate is calculated using CAPM model as mentioned earlier.
Relative Price to Book Value
The last valuation model used is P/BV multiple which defined as market price of equity divided by
the book value of equity. The following is the model of justified P/BV:
Where: P0 = market price of equity
BV0 = book value of equity
70
i
66
Ke = cost of equity
ROE = return on equity
gn = growth rate
The model is justified to value financial service like bank looking that the bank owns major
financial assets that are marked to market. The intangible assets of financial services are also
relatively small. This model is highly grounded on Gordon’s growth model and aimed to find the fair
P/BV ratio that the bank should be traded. The model above implies four inputs: 1) ROE calculated
by net income divided by book value of equity 2) dividend payout ratio measured by historical
company historical policy 3) perpetuity growth rate assumption and 4) discount rate are based on
domestic economic growth rate and CAPM model respectively as mentioned at previous section.
Method of Analysis
The analysis method of this thesis takes several steps as the following:
a. Performing macroeconomic analysis which could influence the banking sectors and
the company performance. This type of analysis will review global economy,
country’s GDP performance, and inflation rate, monetary and fiscal policy which
expected to have impact to the performance of company.
b. Examining banking industry through five forces of Michael Porter approach such as
competitive pressure, barrier to entry and exit, industry threats and also measuring
specific banking ratios.
c. Reviewing historical financial condition of the company through financial ratios and
forecasting future earning and assets through specific rationale assumption. The
forecasting method requires extensive analysis of company’s income and expense
drivers and this consists of three stages, they are:
........................................................................................................................ E
xamining the earning and expense drivers
........................................................................................................................ M
aking assumption growth of earning and expense drivers.
........................................................................................................................ E
stimating the earning and expense based on growth assumption.
d. Measuring discount rate is critical point in valuation process. As defined earlier that
the discount rate is the rate used to discount the future value in to the present
71
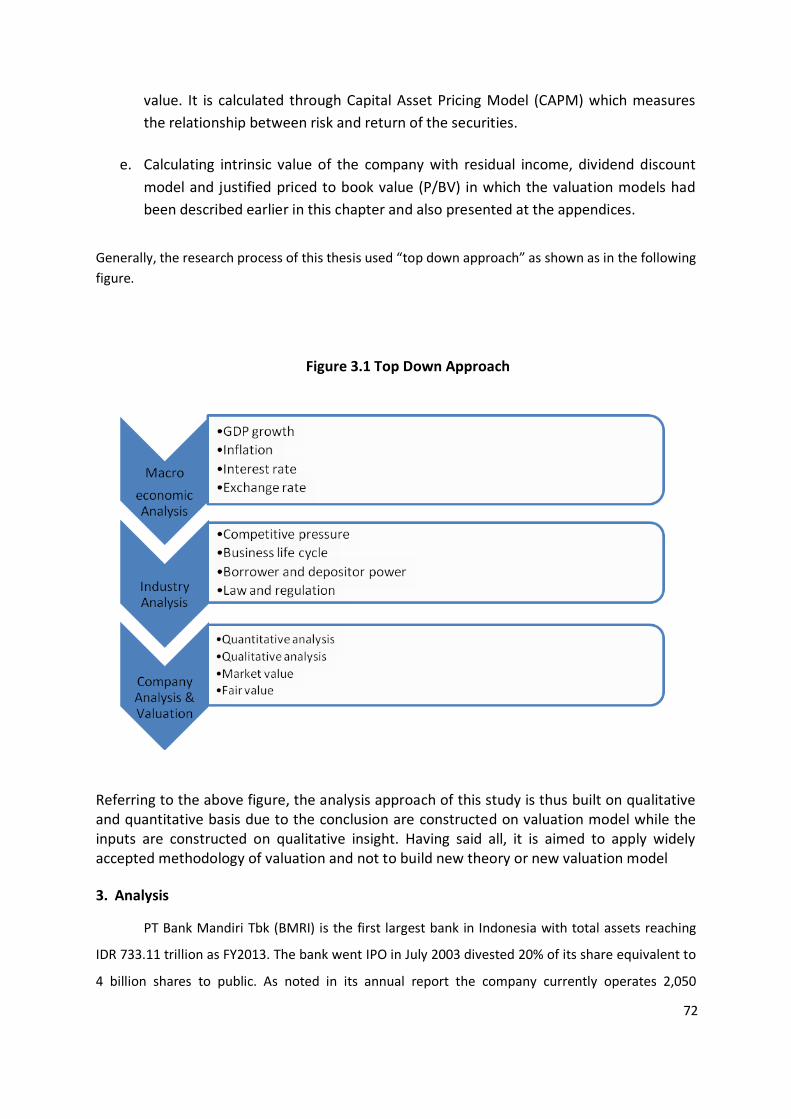
i
67
value. It is calculated through Capital Asset Pricing Model (CAPM) which measures
the relationship between risk and return of the securities.
e. Calculating intrinsic value of the company with residual income, dividend discount
model and justified priced to book value (P/BV) in which the valuation models had
been described earlier in this chapter and also presented at the appendices.
Generally, the research process of this thesis used “top down approach” as shown as in the following
figure.
Figure 3.1 Top Down Approach
Referring to the above figure, the analysis approach of this study is thus built on qualitative and quantitative basis due to the conclusion are constructed on valuation model while the inputs are constructed on qualitative insight. Having said all, it is aimed to apply widely accepted methodology of valuation and not to build new theory or new valuation model
3. Analysis
PT Bank Mandiri Tbk (BMRI) is the first largest bank in Indonesia with total assets reaching
IDR 733.11 trillion as FY2013. The bank went IPO in July 2003 divested 20% of its share equivalent to
4 billion shares to public. As noted in its annual report the company currently operates 2,050
72
i
68
branches spread across different time zone, about 11,541 automatic teller machines (ATMs) with
total loan and deposit accounted IDR 472.4 trillion and IDR 556.3 trillion.
Its core banking sector business mainly comprises four strategic business units:
corporate, commercial, micro and retail, consumer finance, and treasury. Corporate business
units account the biggest loan composition of BMRI, roughly 60% of total loan generating
Rp5.67 trillion net interest incomes in 2013. Tough positioned as biggest corporate lenders,
Its micro lending growth has increased sharply over couple years more than its corporate loan
segment, a growth of 49% CAGR from 2009-2013. Yet its net interest income in micro and
retail segment constituted 40% of total net interest income. In other word, Bank Mandiri
should be placed as the second largest micro finance provider after Bank Rakyat Indonesia
yet its position is seen to stand still as the company expected to expand its retail mix loan to
40% of total loan by 2014.
The author believes that Bank Mandiri strategy is on track to search for cost advantage in
operation and funding while also being aggressive in high yield segment and fee income business in
wholesale banking arena. Further, the author credits Bank Mandiri for its aggressive penetration in
noncore business segment such as acquiring insurance company, inHealth, the largest health
insurance provider in Indonesia. Given all these strategy and its position in funding franchise,
subsidiaries synergies, and transaction capability is seen able to maintain the bank’s current position
in the banking industry.
4.1 Macroeconomic Analysis
Indonesia economic growth has been mostly above 5 % within the last decade even starting
2006 the economy grew by more than 6% excluding crisis period in 2009 and 2010. However,
Indonesia’s GDP growth never fell below 4% even during these crisis periods. This is an exceptional
growth considering that many countries recorded GDP contraction during these periods. Indonesian
economy grew by 5.8% for year 2013, slower than 2012 and 2011 which respectively grew by 6.2%
and 6.5%. The slowdown was largely attributed to the slowdown of and export and investment
growth.
73
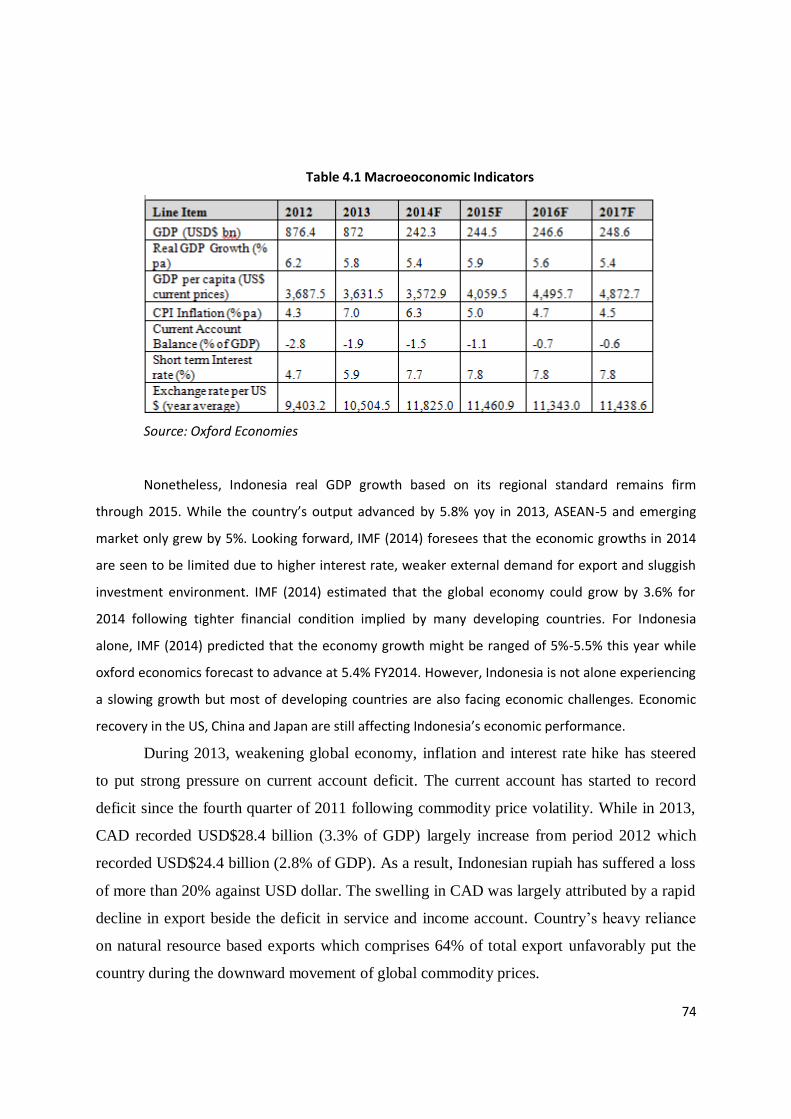
i
69
Table 4.1 Macroeoconomic Indicators
Source: Oxford Economies
Nonetheless, Indonesia real GDP growth based on its regional standard remains firm
through 2015. While the country’s output advanced by 5.8% yoy in 2013, ASEAN-5 and emerging
market only grew by 5%. Looking forward, IMF (2014) foresees that the economic growths in 2014
are seen to be limited due to higher interest rate, weaker external demand for export and sluggish
investment environment. IMF (2014) estimated that the global economy could grow by 3.6% for
2014 following tighter financial condition implied by many developing countries. For Indonesia
alone, IMF (2014) predicted that the economy growth might be ranged of 5%-5.5% this year while
oxford economics forecast to advance at 5.4% FY2014. However, Indonesia is not alone experiencing
a slowing growth but most of developing countries are also facing economic challenges. Economic
recovery in the US, China and Japan are still affecting Indonesia’s economic performance.
During 2013, weakening global economy, inflation and interest rate hike has steered
to put strong pressure on current account deficit. The current account has started to record
deficit since the fourth quarter of 2011 following commodity price volatility. While in 2013,
CAD recorded USD$28.4 billion (3.3% of GDP) largely increase from period 2012 which
recorded USD$24.4 billion (2.8% of GDP). As a result, Indonesian rupiah has suffered a loss
of more than 20% against USD dollar. The swelling in CAD was largely attributed by a rapid
decline in export beside the deficit in service and income account. Country’s heavy reliance
on natural resource based exports which comprises 64% of total export unfavorably put the
country during the downward movement of global commodity prices.
74
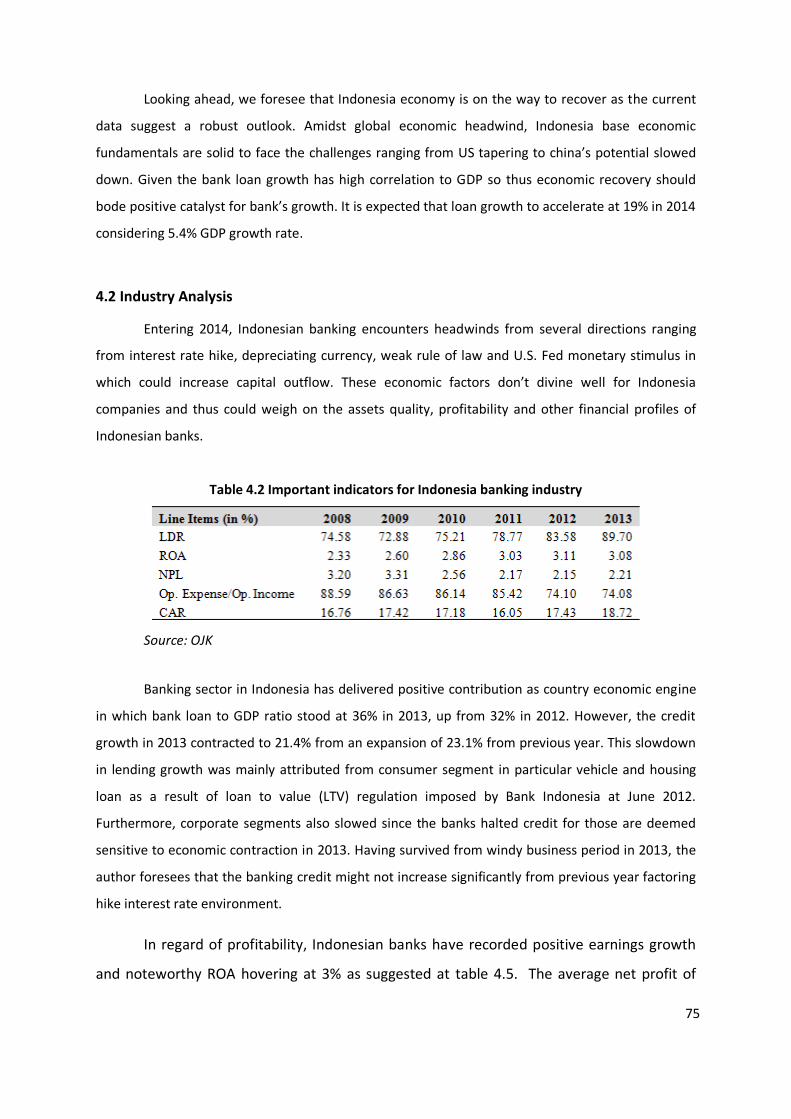
i
70
Looking ahead, we foresee that Indonesia economy is on the way to recover as the current
data suggest a robust outlook. Amidst global economic headwind, Indonesia base economic
fundamentals are solid to face the challenges ranging from US tapering to china’s potential slowed
down. Given the bank loan growth has high correlation to GDP so thus economic recovery should
bode positive catalyst for bank’s growth. It is expected that loan growth to accelerate at 19% in 2014
considering 5.4% GDP growth rate.
4.2 Industry Analysis
Entering 2014, Indonesian banking encounters headwinds from several directions ranging
from interest rate hike, depreciating currency, weak rule of law and U.S. Fed monetary stimulus in
which could increase capital outflow. These economic factors don’t divine well for Indonesia
companies and thus could weigh on the assets quality, profitability and other financial profiles of
Indonesian banks.
Table 4.2 Important indicators for Indonesia banking industry
Source: OJK
Banking sector in Indonesia has delivered positive contribution as country economic engine
in which bank loan to GDP ratio stood at 36% in 2013, up from 32% in 2012. However, the credit
growth in 2013 contracted to 21.4% from an expansion of 23.1% from previous year. This slowdown
in lending growth was mainly attributed from consumer segment in particular vehicle and housing
loan as a result of loan to value (LTV) regulation imposed by Bank Indonesia at June 2012.
Furthermore, corporate segments also slowed since the banks halted credit for those are deemed
sensitive to economic contraction in 2013. Having survived from windy business period in 2013, the
author foresees that the banking credit might not increase significantly from previous year factoring
hike interest rate environment.
In regard of profitability, Indonesian banks have recorded positive earnings growth
and noteworthy ROA hovering at 3% as suggested at table 4.5. The average net profit of
75
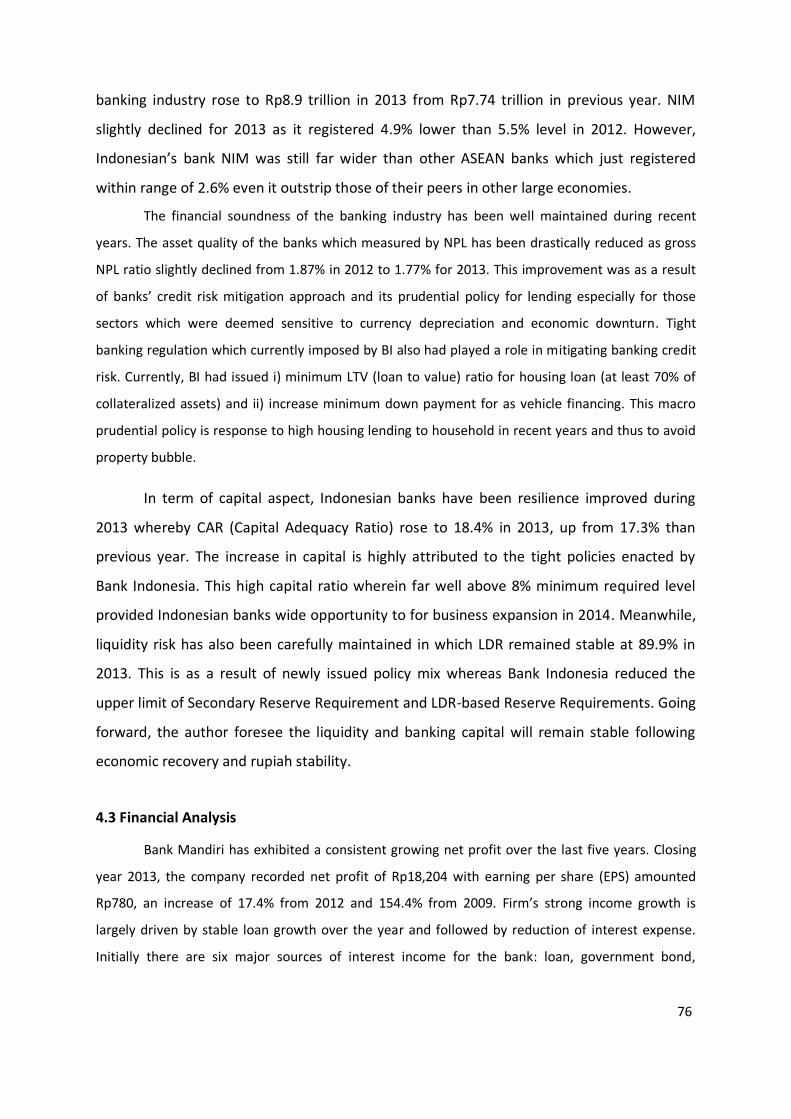
i
71
banking industry rose to Rp8.9 trillion in 2013 from Rp7.74 trillion in previous year. NIM
slightly declined for 2013 as it registered 4.9% lower than 5.5% level in 2012. However,
Indonesian’s bank NIM was still far wider than other ASEAN banks which just registered
within range of 2.6% even it outstrip those of their peers in other large economies.
The financial soundness of the banking industry has been well maintained during recent
years. The asset quality of the banks which measured by NPL has been drastically reduced as gross
NPL ratio slightly declined from 1.87% in 2012 to 1.77% for 2013. This improvement was as a result
of banks’ credit risk mitigation approach and its prudential policy for lending especially for those
sectors which were deemed sensitive to currency depreciation and economic downturn. Tight
banking regulation which currently imposed by BI also had played a role in mitigating banking credit
risk. Currently, BI had issued i) minimum LTV (loan to value) ratio for housing loan (at least 70% of
collateralized assets) and ii) increase minimum down payment for as vehicle financing. This macro
prudential policy is response to high housing lending to household in recent years and thus to avoid
property bubble.
In term of capital aspect, Indonesian banks have been resilience improved during
2013 whereby CAR (Capital Adequacy Ratio) rose to 18.4% in 2013, up from 17.3% than
previous year. The increase in capital is highly attributed to the tight policies enacted by
Bank Indonesia. This high capital ratio wherein far well above 8% minimum required level
provided Indonesian banks wide opportunity to for business expansion in 2014. Meanwhile,
liquidity risk has also been carefully maintained in which LDR remained stable at 89.9% in
2013. This is as a result of newly issued policy mix whereas Bank Indonesia reduced the
upper limit of Secondary Reserve Requirement and LDR-based Reserve Requirements. Going
forward, the author foresee the liquidity and banking capital will remain stable following
economic recovery and rupiah stability.
4.3 Financial Analysis
Bank Mandiri has exhibited a consistent growing net profit over the last five years. Closing
year 2013, the company recorded net profit of Rp18,204 with earning per share (EPS) amounted
Rp780, an increase of 17.4% from 2012 and 154.4% from 2009. Firm’s strong income growth is
largely driven by stable loan growth over the year and followed by reduction of interest expense.
Initially there are six major sources of interest income for the bank: loan, government bond,
76
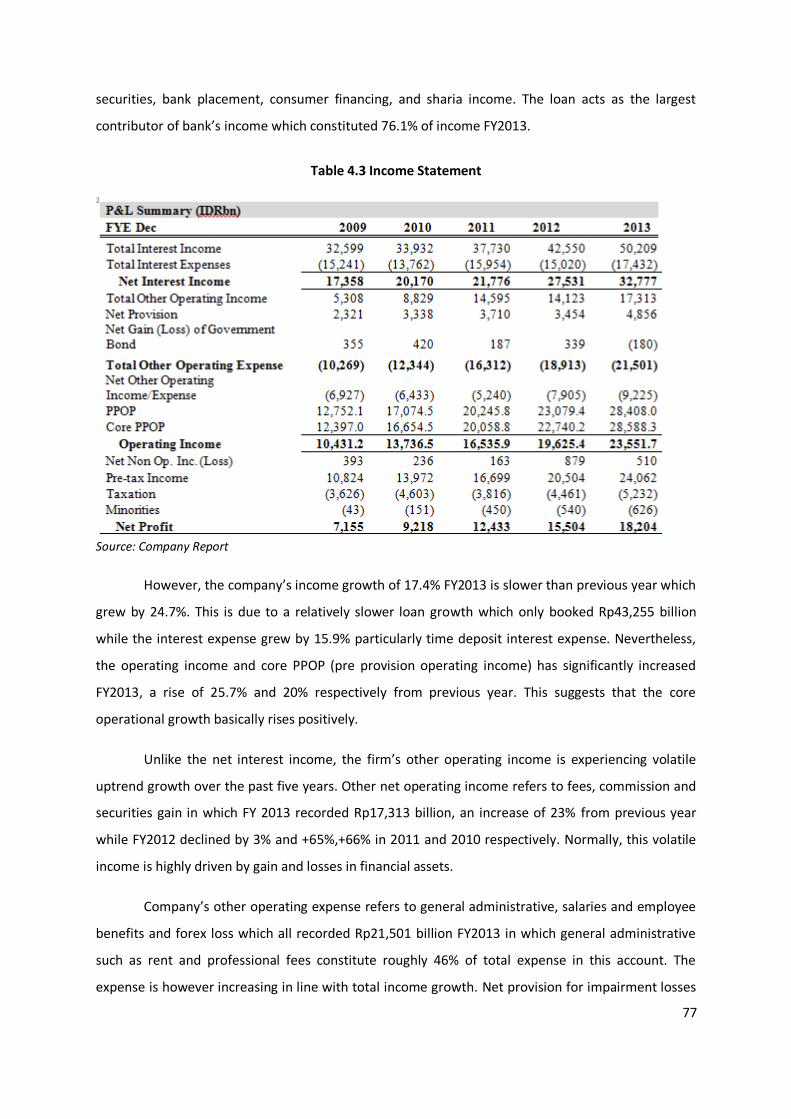
i
72
securities, bank placement, consumer financing, and sharia income. The loan acts as the largest
contributor of bank’s income which constituted 76.1% of income FY2013.
Table 4.3 Income Statement
Source: Company Report
However, the company’s income growth of 17.4% FY2013 is slower than previous year which
grew by 24.7%. This is due to a relatively slower loan growth which only booked Rp43,255 billion
while the interest expense grew by 15.9% particularly time deposit interest expense. Nevertheless,
the operating income and core PPOP (pre provision operating income) has significantly increased
FY2013, a rise of 25.7% and 20% respectively from previous year. This suggests that the core
operational growth basically rises positively.
Unlike the net interest income, the firm’s other operating income is experiencing volatile
uptrend growth over the past five years. Other net operating income refers to fees, commission and
securities gain in which FY 2013 recorded Rp17,313 billion, an increase of 23% from previous year
while FY2012 declined by 3% and +65%,+66% in 2011 and 2010 respectively. Normally, this volatile
income is highly driven by gain and losses in financial assets.
Company’s other operating expense refers to general administrative, salaries and employee
benefits and forex loss which all recorded Rp21,501 billion FY2013 in which general administrative
such as rent and professional fees constitute roughly 46% of total expense in this account. The
expense is however increasing in line with total income growth. Net provision for impairment losses
77
i
73
expenses is slightly volatile over the past five years. Allowance provision initially comprises three
accounts: provision for increase or decrease in earning assets, commitment and contingencies, and
other assets. Net provision FY2013 increased by 41% than previous year which recorded Rp4,856
billion. Additionally, while the increase of net income in 2013 coupled with dividend rise, all led to
higher retained earning and equity.
The company’s total assets are increasing since the last five years with compound annual
growth rate (CAGR) of 16.7% from 2009-2013. In 2009, total assets amounted at Rp395 trillion and
increased to Rp733 trillion FY2013, an increase of 85.8% from 2009 and 16.8% from 2012. This
substantial increase in total assets is largely driven by loan growth which FY2013 composed 62% of
the assets. Basically there are three major compositions of total assets: loans, government bond, and
financial assets. As December 2009, total loan only amounted Rp18 trillion and increased to Rp455
trillion FY2013 with annual compound annual growth rate (CAGR) of 25% within the year.
Table 4.4 Balance Sheet
Source: Company Report
Referring to above balance sheet table, it is clearly seen that the bank has robust loan
portfolio and strong deposit growth. The total portfolio raised by 22.7% yoy in 2013 while it grew by
23.4% CAGR from 2009 to 2013. This robust loan portfolio growth was led by superior performance
of micro loan and corporate credit which increase by 42.3% and 28.9% yoy respectively. The
78
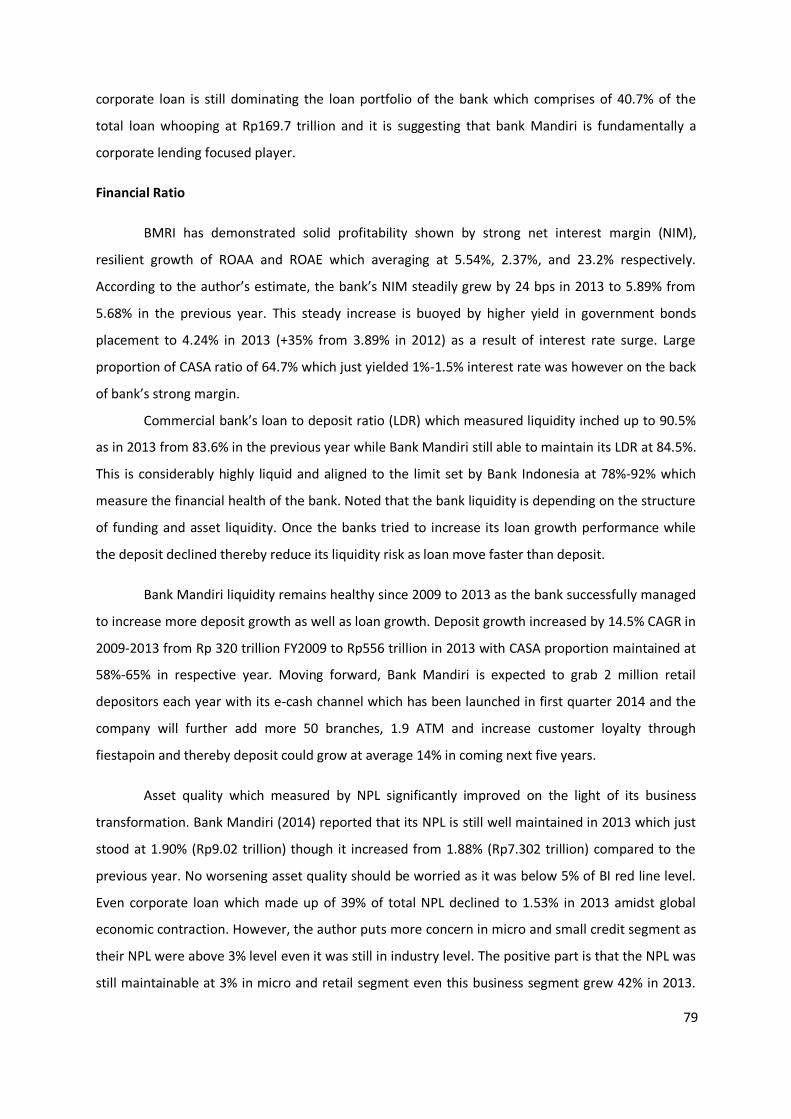
i
74
corporate loan is still dominating the loan portfolio of the bank which comprises of 40.7% of the
total loan whooping at Rp169.7 trillion and it is suggesting that bank Mandiri is fundamentally a
corporate lending focused player.
Financial Ratio
BMRI has demonstrated solid profitability shown by strong net interest margin (NIM),
resilient growth of ROAA and ROAE which averaging at 5.54%, 2.37%, and 23.2% respectively.
According to the author’s estimate, the bank’s NIM steadily grew by 24 bps in 2013 to 5.89% from
5.68% in the previous year. This steady increase is buoyed by higher yield in government bonds
placement to 4.24% in 2013 (+35% from 3.89% in 2012) as a result of interest rate surge. Large
proportion of CASA ratio of 64.7% which just yielded 1%-1.5% interest rate was however on the back
of bank’s strong margin.
Commercial bank’s loan to deposit ratio (LDR) which measured liquidity inched up to 90.5%
as in 2013 from 83.6% in the previous year while Bank Mandiri still able to maintain its LDR at 84.5%.
This is considerably highly liquid and aligned to the limit set by Bank Indonesia at 78%-92% which
measure the financial health of the bank. Noted that the bank liquidity is depending on the structure
of funding and asset liquidity. Once the banks tried to increase its loan growth performance while
the deposit declined thereby reduce its liquidity risk as loan move faster than deposit.
Bank Mandiri liquidity remains healthy since 2009 to 2013 as the bank successfully managed
to increase more deposit growth as well as loan growth. Deposit growth increased by 14.5% CAGR in
2009-2013 from Rp 320 trillion FY2009 to Rp556 trillion in 2013 with CASA proportion maintained at
58%-65% in respective year. Moving forward, Bank Mandiri is expected to grab 2 million retail
depositors each year with its e-cash channel which has been launched in first quarter 2014 and the
company will further add more 50 branches, 1.9 ATM and increase customer loyalty through
fiestapoin and thereby deposit could grow at average 14% in coming next five years.
Asset quality which measured by NPL significantly improved on the light of its business
transformation. Bank Mandiri (2014) reported that its NPL is still well maintained in 2013 which just
stood at 1.90% (Rp9.02 trillion) though it increased from 1.88% (Rp7.302 trillion) compared to the
previous year. No worsening asset quality should be worried as it was below 5% of BI red line level.
Even corporate loan which made up of 39% of total NPL declined to 1.53% in 2013 amidst global
economic contraction. However, the author puts more concern in micro and small credit segment as
their NPL were above 3% level even it was still in industry level. The positive part is that the NPL was
still maintainable at 3% in micro and retail segment even this business segment grew 42% in 2013.
79
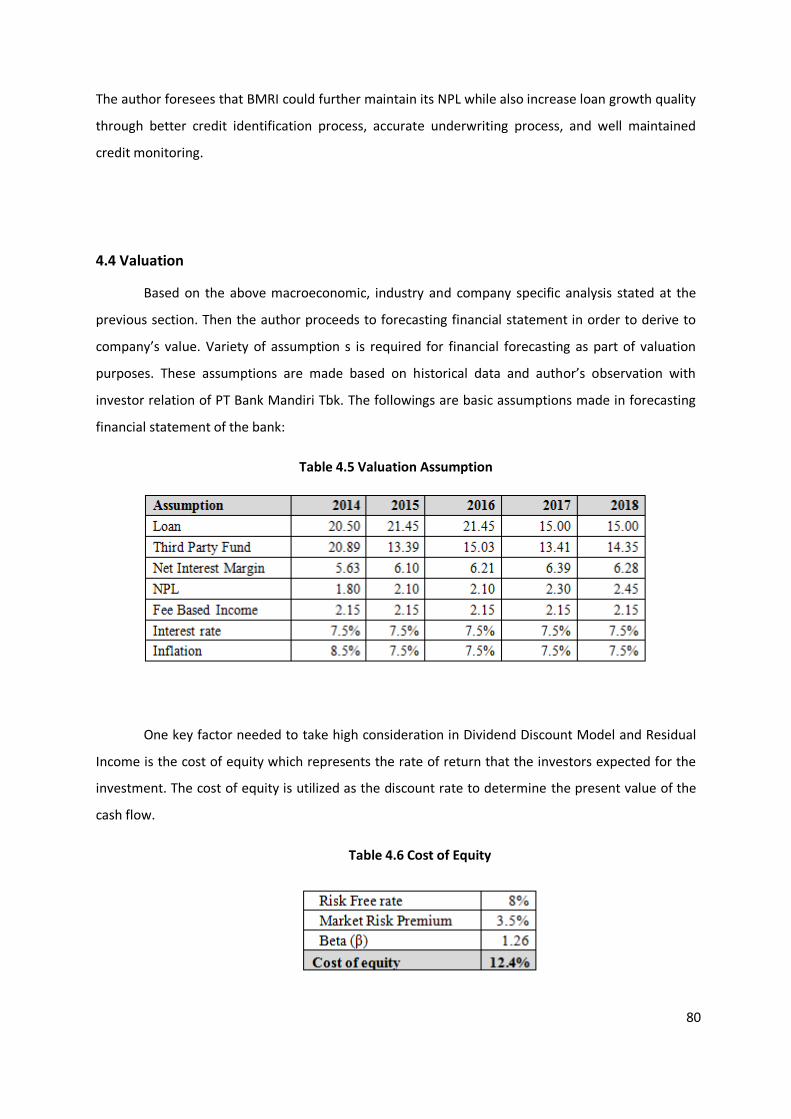
i
75
The author foresees that BMRI could further maintain its NPL while also increase loan growth quality
through better credit identification process, accurate underwriting process, and well maintained
credit monitoring.
4.4 Valuation
Based on the above macroeconomic, industry and company specific analysis stated at the
previous section. Then the author proceeds to forecasting financial statement in order to derive to
company’s value. Variety of assumption s is required for financial forecasting as part of valuation
purposes. These assumptions are made based on historical data and author’s observation with
investor relation of PT Bank Mandiri Tbk. The followings are basic assumptions made in forecasting
financial statement of the bank:
Table 4.5 Valuation Assumption
One key factor needed to take high consideration in Dividend Discount Model and Residual
Income is the cost of equity which represents the rate of return that the investors expected for the
investment. The cost of equity is utilized as the discount rate to determine the present value of the
cash flow.
Table 4.6 Cost of Equity
80
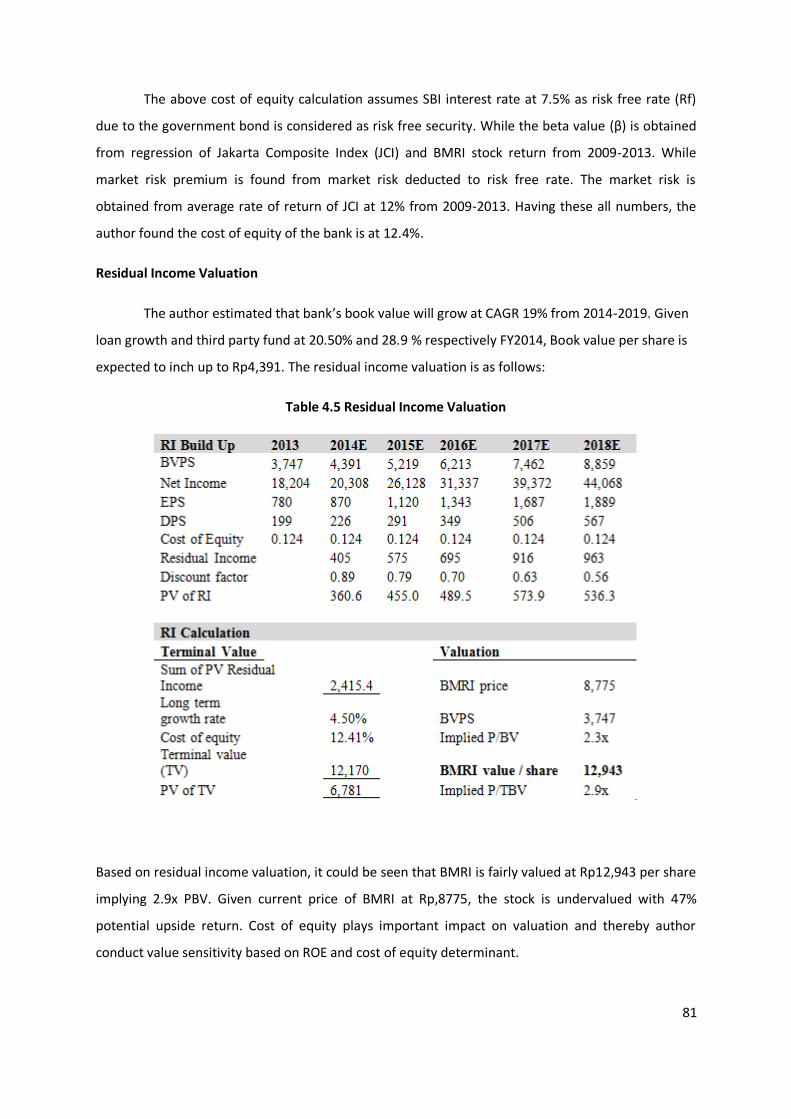
i
76
The above cost of equity calculation assumes SBI interest rate at 7.5% as risk free rate (Rf)
due to the government bond is considered as risk free security. While the beta value (β) is obtained
from regression of Jakarta Composite Index (JCI) and BMRI stock return from 2009-2013. While
market risk premium is found from market risk deducted to risk free rate. The market risk is
obtained from average rate of return of JCI at 12% from 2009-2013. Having these all numbers, the
author found the cost of equity of the bank is at 12.4%.
Residual Income Valuation
The author estimated that bank’s book value will grow at CAGR 19% from 2014-2019. Given
loan growth and third party fund at 20.50% and 28.9 % respectively FY2014, Book value per share is
expected to inch up to Rp4,391. The residual income valuation is as follows:
Table 4.5 Residual Income Valuation
Based on residual income valuation, it could be seen that BMRI is fairly valued at Rp12,943 per share
implying 2.9x PBV. Given current price of BMRI at Rp,8775, the stock is undervalued with 47%
potential upside return. Cost of equity plays important impact on valuation and thereby author
conduct value sensitivity based on ROE and cost of equity determinant.
81
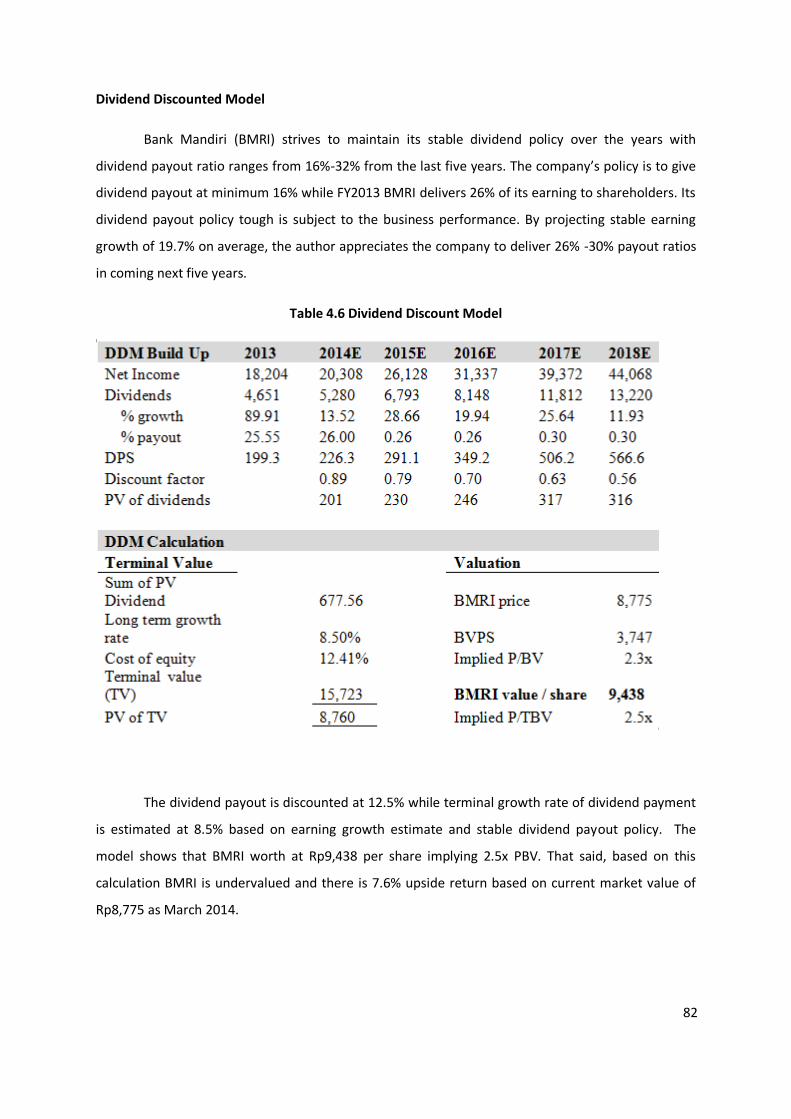
i
77
Dividend Discounted Model
Bank Mandiri (BMRI) strives to maintain its stable dividend policy over the years with
dividend payout ratio ranges from 16%-32% from the last five years. The company’s policy is to give
dividend payout at minimum 16% while FY2013 BMRI delivers 26% of its earning to shareholders. Its
dividend payout policy tough is subject to the business performance. By projecting stable earning
growth of 19.7% on average, the author appreciates the company to deliver 26% -30% payout ratios
in coming next five years.
Table 4.6 Dividend Discount Model
The dividend payout is discounted at 12.5% while terminal growth rate of dividend payment
is estimated at 8.5% based on earning growth estimate and stable dividend payout policy. The
model shows that BMRI worth at Rp9,438 per share implying 2.5x PBV. That said, based on this
calculation BMRI is undervalued and there is 7.6% upside return based on current market value of
Rp8,775 as March 2014.
82
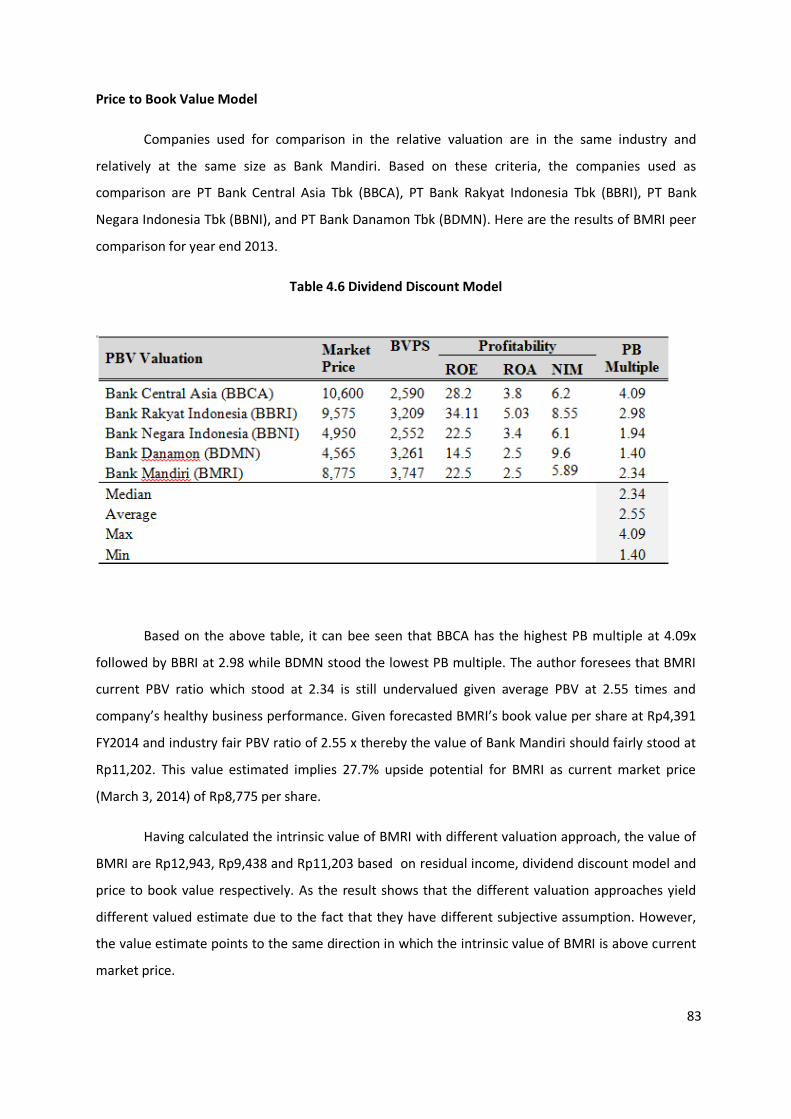
i
78
Price to Book Value Model
Companies used for comparison in the relative valuation are in the same industry and
relatively at the same size as Bank Mandiri. Based on these criteria, the companies used as
comparison are PT Bank Central Asia Tbk (BBCA), PT Bank Rakyat Indonesia Tbk (BBRI), PT Bank
Negara Indonesia Tbk (BBNI), and PT Bank Danamon Tbk (BDMN). Here are the results of BMRI peer
comparison for year end 2013.
Table 4.6 Dividend Discount Model
Based on the above table, it can bee seen that BBCA has the highest PB multiple at 4.09x
followed by BBRI at 2.98 while BDMN stood the lowest PB multiple. The author foresees that BMRI
current PBV ratio which stood at 2.34 is still undervalued given average PBV at 2.55 times and
company’s healthy business performance. Given forecasted BMRI’s book value per share at Rp4,391
FY2014 and industry fair PBV ratio of 2.55 x thereby the value of Bank Mandiri should fairly stood at
Rp11,202. This value estimated implies 27.7% upside potential for BMRI as current market price
(March 3, 2014) of Rp8,775 per share.
Having calculated the intrinsic value of BMRI with different valuation approach, the value of
BMRI are Rp12,943, Rp9,438 and Rp11,203 based on residual income, dividend discount model and
price to book value respectively. As the result shows that the different valuation approaches yield
different valued estimate due to the fact that they have different subjective assumption. However,
the value estimate points to the same direction in which the intrinsic value of BMRI is above current
market price.
83
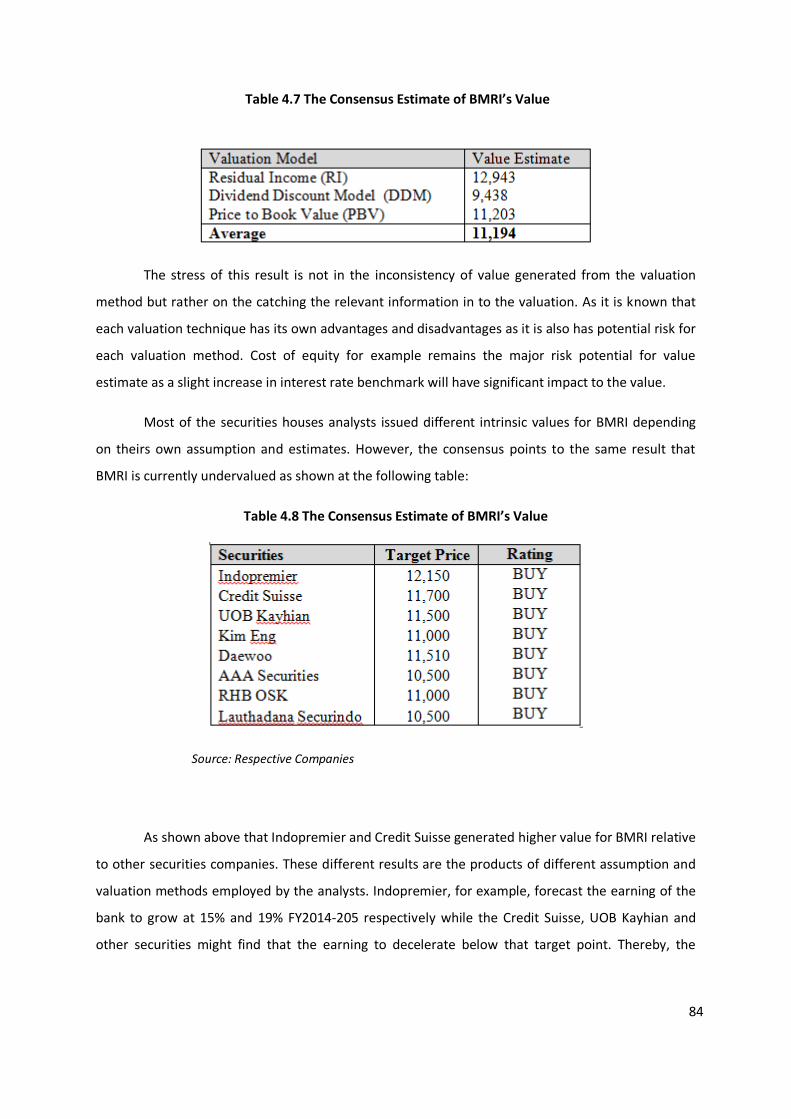
i
79
Table 4.7 The Consensus Estimate of BMRI’s Value
The stress of this result is not in the inconsistency of value generated from the valuation
method but rather on the catching the relevant information in to the valuation. As it is known that
each valuation technique has its own advantages and disadvantages as it is also has potential risk for
each valuation method. Cost of equity for example remains the major risk potential for value
estimate as a slight increase in interest rate benchmark will have significant impact to the value.
Most of the securities houses analysts issued different intrinsic values for BMRI depending
on theirs own assumption and estimates. However, the consensus points to the same result that
BMRI is currently undervalued as shown at the following table:
Table 4.8 The Consensus Estimate of BMRI’s Value
Source: Respective Companies
As shown above that Indopremier and Credit Suisse generated higher value for BMRI relative
to other securities companies. These different results are the products of different assumption and
valuation methods employed by the analysts. Indopremier, for example, forecast the earning of the
bank to grow at 15% and 19% FY2014-205 respectively while the Credit Suisse, UOB Kayhian and
other securities might find that the earning to decelerate below that target point. Thereby, the
84
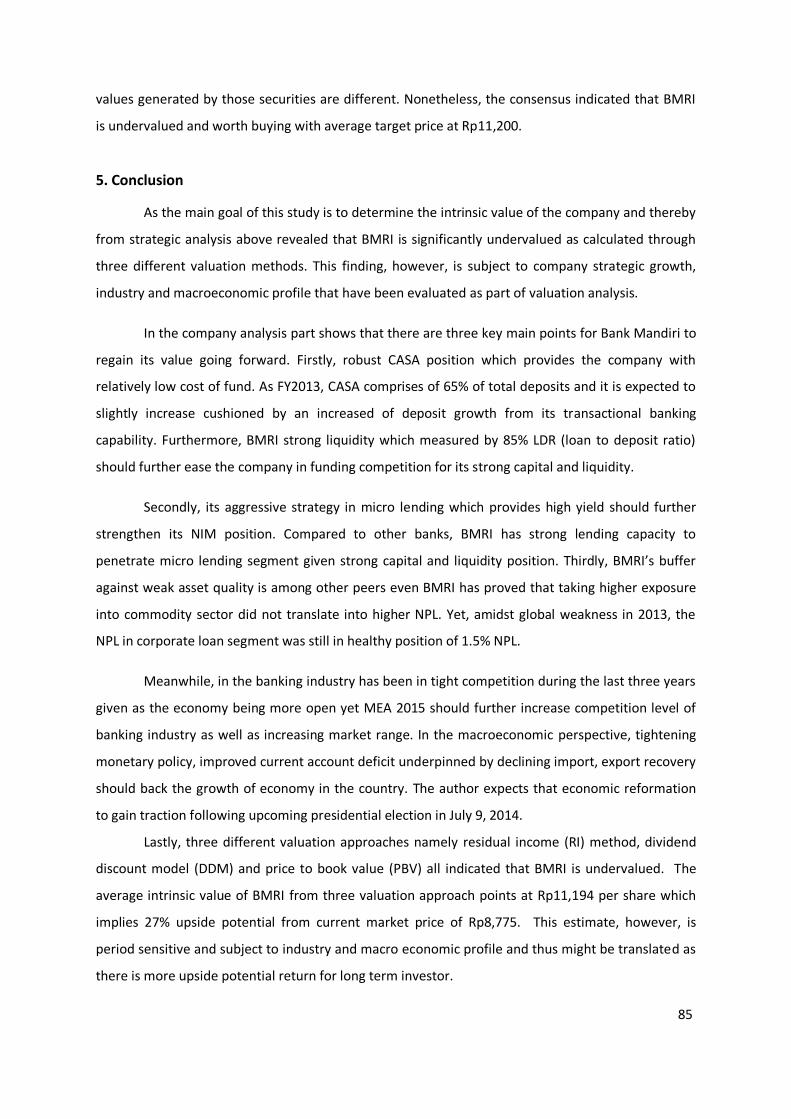
i
80
values generated by those securities are different. Nonetheless, the consensus indicated that BMRI
is undervalued and worth buying with average target price at Rp11,200.
5. Conclusion
As the main goal of this study is to determine the intrinsic value of the company and thereby
from strategic analysis above revealed that BMRI is significantly undervalued as calculated through
three different valuation methods. This finding, however, is subject to company strategic growth,
industry and macroeconomic profile that have been evaluated as part of valuation analysis.
In the company analysis part shows that there are three key main points for Bank Mandiri to
regain its value going forward. Firstly, robust CASA position which provides the company with
relatively low cost of fund. As FY2013, CASA comprises of 65% of total deposits and it is expected to
slightly increase cushioned by an increased of deposit growth from its transactional banking
capability. Furthermore, BMRI strong liquidity which measured by 85% LDR (loan to deposit ratio)
should further ease the company in funding competition for its strong capital and liquidity.
Secondly, its aggressive strategy in micro lending which provides high yield should further
strengthen its NIM position. Compared to other banks, BMRI has strong lending capacity to
penetrate micro lending segment given strong capital and liquidity position. Thirdly, BMRI’s buffer
against weak asset quality is among other peers even BMRI has proved that taking higher exposure
into commodity sector did not translate into higher NPL. Yet, amidst global weakness in 2013, the
NPL in corporate loan segment was still in healthy position of 1.5% NPL.
Meanwhile, in the banking industry has been in tight competition during the last three years
given as the economy being more open yet MEA 2015 should further increase competition level of
banking industry as well as increasing market range. In the macroeconomic perspective, tightening
monetary policy, improved current account deficit underpinned by declining import, export recovery
should back the growth of economy in the country. The author expects that economic reformation
to gain traction following upcoming presidential election in July 9, 2014.
Lastly, three different valuation approaches namely residual income (RI) method, dividend
discount model (DDM) and price to book value (PBV) all indicated that BMRI is undervalued. The
average intrinsic value of BMRI from three valuation approach points at Rp11,194 per share which
implies 27% upside potential from current market price of Rp8,775. This estimate, however, is
period sensitive and subject to industry and macro economic profile and thus might be translated as
there is more upside potential return for long term investor.
85
i
81
REFERENCES
Annual Report of PT Bank Mandiri (Persero), Tbk tahun 2009-2013. Bodie, Zvi, Alex Kane & Allan J. Markus. ( 2009). Investments (8th ed). Singapore: McGraw-Hill/Irwin. Damodaran, Aswath. (2001). The Dark Side of Valuation: Valuing Old Tech, New Tech, and New
Economy Companies. New Jersey: Prentice Hall Damodaran, Aswath. (2002). Investment Valuation: Tools and Technique for Determining the Value
of Any Asset (2nd edition). New Jersey: John Wiley & Sons Francis, J., Olsson, P., Oswald, D.R. (1997), Comparing the Accuracy and Explainability of Dividend,
Free Cash Flow and Abnormal Earnings Equity Valuation Models, Working paper, University of
Chicago and Stockholm School of Economics
Hamongan, Frans, & Sulistyawati, Dyah (2012), Perhitungan Harga Saham Wajar PT. Bank Central
Asia Tbk Dengan Menggunakan Metode Discounted Earning Approach dan Price to Book
Value, Journal of Capital Market and Banking
Hasjim, Stephan, (2014). Acquisition Plan to Boost Retail Lending, Jakarta: Indopremier Securities
Indonesia Stock Market. (2013). Embarking on New Journey. Retrieved January 30, 2011, from
http://www.idx.co.id/id-id/beranda/tentangbei/laporantahunan.aspx Indrawan, Rocky (2014). Exploring Java, Jakarta: RHB-OSK Securities
Koller, Tim, Goedhart, Marc & Wessels, David, Valuation-Measuring and Managing the Value of
Companies, 4th edition (2005), New York, McGraw Hill,
Manurung, Adler Haymans (2011). Valuasi Wajar Perusahaan. Jakarta: PT Adler Manurung Press. Miles, D., & A. Scott. (2005). Macroeconomics: Understanding The Wealth of Nations. Southern Gate
Chichester: John Wiley & Sons.
Marina, Rahmi., & Le, Wilianto (2014). Margin Support From Retail Lending, Jakarta: Kim Eng Securities
Ohlson, J.A. (1995), Earnings, Book Values, and Dividends in Equity Valuation, Contemporary
Accounting Research, Spring 1995, 661-687.
86
i
82
Penman, S.H. (1997), A Synthesis of Equity Valuation Techniques and the Terminal Value Calculation
for the Dividend Discount Model, Working paper, University of California, Berkeley
Simorangkir, (2012), Valuasi Harga Saham PT. Bank Negara Indonesia (Persero), TBK Dengan
Discounted earnings Approach dan Price to Book Value Ratio, Journal of Capital Market and
Banking
Ship, Taye. (2014). Riding the Tide, Jakarta: KDB Daewoo Securities Thompson, Arthur., Strickland A.J., & John E. Gamble.(2010). Crafting and Executing Strategy,
McGraw Hill, New York, NY White, Gerald I., Ashwinpaul C. Sondhi & Dov Field. (2003). The Analysis and Use of Financial
Statements (3rd edition). Massachussetts: John Wiley & Sons, Inc. Wild, John J., K.R. Subramanyam, & Robert F. Halsey. (2009). Financial Statement Analysis (9th ed).
Singapore: McGraw-Hill/Irwin.
87
i
83
ANALISIS PENGARUH SIZE, BUSINESS RISK, PROFITABILITY, LIQUIDITY, DAN ASSET STRUCTURE
TERHADAP STRUKTUR MODAL PADA PERUSAHAAN MANUFAKTUR YANG TERDAFTAR DI BURSA
EFEK INDONESIA PERIODE 2011-2013
Nurainun Bangun*
Hartanto Susilo**
Fakultas Ekonomi Universitas Tarumanagara
Abstract: The purpose of this research is to examine the effect of size, business risk, profitability,
liquidity, asset structure on company’s capital structure which is measured by debt to equity ratio in
manufacturing companies listed in Indonesia Stock Exchange. This research used 192 data from
manufacturing companies listed in Indonesia Stock Exchange, selected using purposive sampling
method, during the research period 2011 until 2013. Data were analyzed using multiple regression
method. The result of this research indicates that business risk, profitability, and liquidity have
significant effect on company’s capital structure which is measured by debt to equity ratio.
Meanwhile, size and asset structure have no significant effect on company’s capital structure which
is measured by debt to equity ratio.
Key words: Capital Structure, Size, Business Risk, Profitability, Liquidity, Asset Structure
88
i
84
ANALISIS PENGARUH SIZE, BUSINESS RISK, PROFITABILITY, LIQUIDITY, DAN ASSET STRUCTURE
TERHADAP STRUKTUR MODAL PADA PERUSAHAAN MANUFAKTUR YANG TERDAFTAR DI BURSA
EFEK INDONESIA PERIODE 2011-2013
PENDAHULUAN
Perusahaan merupakan suatu kegiatan bisnis yang sangat penting di dalam suatu
perekonomian. Perusahaan dibangun dengan tujuan untuk memperoleh keuntungan yang juga
dapat dimanfaatkan juga di masa yang akan datang serta digunakan untuk meningkatkan
kesejahteraan pemegang kepentingan perusahaan tersebut (stakeholders). Dalam tujuannya
memperoleh keuntungan ini, perusahaan memerlukan berbagai faktor-faktor pendukung yang
kuat, salah satunya mempunyai pengelolaan pembiayaan atau pendanaan yang sangat baik.
Dengan demikian, perusahaan diharapkan dapat bersaing dengan perusahaan lain yang telah
memberikan citra positif di dalam laporan keuangannya.
Salah satu keputusan pengelolaan pembiayaan atau pendanaan yang baik dapat dilihat
dari struktur modal, yaitu keputusan keuangan yang berkaitan dengan komposisi hutang, baik
hutang jangka panjang dan hutang jangka pendek, saham preferen, dan saham biasa yang
akan digunakan oleh perusahaan. Bagi banyak perusahaan, sumber pendanaan yang hanya
berupa modal sendiri seringkali dirasa kurang. Hutang yang dikarenakan sifatnya tidak
permanen dan lebih mudah untuk diadakan, seringkali menjadi bagian penting dalam struktur
permodalan. Keputusan pengelolaan pembiayaan merupakan keputusan mengenai seberapa
tingkat penggunaan hutang dibanding dengan ekuitas dalam membiayai investasi perusahaan.
Tujuan keputusan pengelolaan pembiayaan adalah untuk menentukan tingkat struktur modal
uang optimal, yaitu tingkat bauran utang dan ekuitas yang dapat memaksimumkan nilai
perusahaan. Dana yang tersedia pada struktur permodalan akan digunakan untuk mendanai
investasi yang tersedia. Dalam melakukan investasi, perusahaan berusaha menciptakan nilai.
Keputusan pengelolaan pembiayaan yang berhubungan dengan penentuan proporsi hutang
menjadi penting karena berkaitan dengan kepentingan pemegang saham dan perbandingan
antara total hutang jangka panjang terhadap ekuitas yang biasa diukur melalui debt to equity
ratio (DER) yang dapat menyatakan struktur modal.
Penelitian ini menganalisis variabel size, business risk, profitability, liquidity, dan asset
structure. Peneliti terdahulu atas variabel-variabel tersebut menunjukkan hasil yang berbeda.
Ukuran perusahaan menggambarkan besar kecilnya suatu perusahaan. Besar kecilnya
perusahaan dapat ditinjau dari lapangan usaha yang dijalankan. Hasil penelitian Nuswandari
(2013), Verena Sari dan Haryanto (2013), Indrajaya, Herlina dan Setiadi (2011), Seftianne
dan Handayani (2011), Ratna Sari dan Saifudin (2012) serta Akinyomi dan Olagunju (2013)
menyatakan bahwa size berpengaruh terhadap struktur perusahaan. Hasil penelitian ini
konsisten terhadap Pecking Order Theory, yang menyatakan bahwa perusahaan cenderung
memilih pendanaan internal daripada pendanaan eksternal. Perusahaan besar cenderung
memiliki tingkat penjualan serta keuntungan yang lebih besar sehingga mereka memiliki
dana cadangan yang lebih besar pula untuk memenuhi kebutuhan dana mereka. Sedangkan
hasil penelitian yang dilakukan oleh Joni dan Lina (2010) menunjukkan bahwa size tidak
berpengaruh terhadap struktur modal.
Menurut Gitman (2009) dalam penelitiaan Seftianne dan Handayani (2011), risiko
bisnis merupakan risiko dari perusahaan saat tidak mampu menutupi biaya operasionalnya
dan dipengaruhi oleh stabilitas pendapatan dan biaya. Hasil penelitian Ratna Sari dan
Saifudin (2012) dan Nuswandari (2013) menemukan bahwa risiko bisnis memiliki pengaruh
terhadap struktur modal. Sedangkan hasil penelitian Joni dan Lina (2010), Indrajaya, Herlina
89
i
85
dan Setiadi (2011), dan Seftianne dan Handayani (2011) menunjukkan bukti bahwa risiko
bisnis tidak berpengaruh terhadap struktur modal.
Verena Sari dan Haryanto (2013) menyatakan bahwa profitabilitas adalah tingkat
keuntungan bersih yang mampu diraih oleh perusahaan pada saat menjalankan operasinya.
Profitabilitas mencerminkan kemampuan perusahaan dalam menghasilkan laba atas
pengelolaan aset perusahaan yang merupakan perbandingan antara earning after tax dengan
total asset. Hasil penelitian Joni dan Lina (2010), Indrajaya, Herlina dan Setiadi (2011),
Akinyomi dan Olagunju (2013), dan Nuswandari (2013) menemukan bahwa profitabilitas
memiliki pengaruh terhadap struktur modal. Hasil penelitian Seftianne dan Handayani (2011)
dan Ratna Sari dan Saifudin (2012) menunjukkan bahwa profitabilitas tidak memiliki
pengaruh terhadap struktur modal.
Likuiditas perusahaan adalah kekuatan perusahaan dalam melunasi kewajibannya yang
jatuh tempo dalam jangka waktu pendek. Hasil pernelitian Verena Sari dan Haryanto (2013)
menunjukkan bahwa likuiditas memiliki pengaruh terhadap struktur modal. Sedangkan hasil
penelitian Seftianne dan Handayani (2011) dan Ratna Sari dan Saifudiin (2012) menunjukkan
bahwa likuiditas tidak memiliki pengaruh terhadap struktur modal.
Struktur aktiva mencerminkan dua komponen aktiva secara garis besar dalam
komposisinya yaitu aktiva lancar dan aktiva tetap. Aktiva lancar adalah uang kas dan aktiva-
aktiva lain yang dapat direalisasikan menjadi uang kas atau dijual atau dikonsumsi dalam
suatu periode akuntansi yang normal. Sedangkan aktiva tetap adalah aktiva berwujud yang
diperoleh dalam bentuk siap pakai atau dibangun lebih dahulu yang digunakan dalam operasi
perusahaan, tidak dimasukkan untuk dijual dalam rangka kegiatan normal perusahaan dan
mempunyai masa. Menurut penelitian Seftianne dan Handayani (2011) dan Verena Sari dan
Haryanto (2013), struktur aktiva tidak memiliki pengaruh terhadap struktur modal. Menurut
hasil penelitian Joni dan Lina (2010), Indrajaya, Herlina dan Setiadi (2011), Akinyomi dan
Olagunju (2013) dan Ratna Sari dan Saifudin (2012) menyatakan bahwa struktur aktiva
memiliki pengaruh terhadap struktur modal.
Struktur modal adalah perimbangan atau perbandingan antara pendanaan jangka
panjang perusahaan dengan modal sendiri. Terdapat beberapa teori yang mengungkapkan
struktur modal, diantaranya adalah Pecking Order Theory dan Trade Off Theory.
Pecking Order Theory pertama kali dikenalkan oleh Donaldson pada tahun 1961.
Brealey, Myers, Allen (2011) menjelaskan Pecking Order Theory dengan menyatakan bahwa
perusahaan menyukai internal financing (pendanaan dari hasil operasi perusahaan berwujud
laba ditahan). Apabila pendanaan dari luar (external financing) diperlukan, maka perusahaan
akan menerbitkan sekuritas yang paling aman terlebih dulu, yaitu dimulai dengan penerbitan
obligasi, kemudian diikuti oleh sekuritas yang berkarakteristik opsi (seperti obligasi
konversi), baru akhirnya apabila masih belum mencukupi, saham baru diterbitkan.
Trade Off Theory merupakan model struktur modal yang mempunyai asumsi bahwa
struktur modal perusahaan merupakan keseimbangan antara keuntungan penggunaan hutang
dengan biaya financial distress (kesulitan keuangan) dan agency cost (biaya keagenan).
Trade Off Theory merupakan model yang didasarkan pada pertukaran antara keuntungan dan
kerugian penggunaan hutang.
Permasalahan yang dianalisis dapat dirumuskan sebagai berikut: (1) Apakah size
memiliki pengaruh yang signifikan terhadap struktur modal?; (2) Apakah business risk
memiliki pengaruh yang signifikan terhadap struktur modal?; (3) Apakah profitability
memiliki pengaruh yang signifikan terhadap struktur modal?; (4) Apakah liquidity memiliki
pengaruh yang signifikan terhadap struktur modal?; (5) Apakah asset structure memiliki
pengaruh yang signifikan terhadap struktur modal?; (6) Apakah size, business risk,
90
i
86
profitability, liquidity, dan asset structure secara bersama-sama memiliki pengaruh yang
signifikan terhadap struktur modal?
Berdasarkan perumusan masalah diatas, dapat dirumuskan hipotesis yang akan diuji
kebenarannya dalam penelitian ini adalah:
a. H1: Size mempunyai pengaruh yang signifikan terhadap struktur modal
b. H2: Business Risk mempunyai pengaruh yang signifikan terhadap struktur modal
c. H3: Profitability memiliki pengaruh yang signifikan terhadap struktur modal
d. H4: Liquidity mempunyai pengaruh yang signifikan terhadap struktur modal
e. H5: Asset Structure mempunyai pengaruh yang signifikan terhadap struktur modal
f. H6: Size, business risk, profitability, liquidity, dan asset structure secara simultan
memiliki pengaruh terhadap struktur modal.
METODE
Pemilihan Sampel
Populasi penelitian ini adalah perusahaan yang terdaftar pada Bursa Efek Indonesia
pada periode 2011-2013. Penentuan anggota sampel dalam penelitian ini dilakukan dengan
metode purposive sampling. Adapun perusahaanyang menjadi sampel telah memenuhi
kriteria sebagai berikut: (1) Perusahaan telah mendaftarkan sahamnya pada Bursa Efek
Indonesia sejak tahun 2009; (2) Perusahaan mendapatkan laba selama 5 tahun berturut-turut;
(3) Perusahaan yang laporan keuangannya dilaporkan dalam rupiah; (4) Semua data yang
dibutuhkan dalam penelitian lengkap.
Dari populasi perusahaan manufaktur yang terdaftar di Bursa Efek Indonesia sebesar
136 perusahaan, terpilih sebagai sampel sebanyak 64 perusahaan yang memenuhi kriteria
yang telah ditentukan. Teknik analisis data yang digunakan dalam penelitian ini adalah
regresi berganda yang dilakukan dengan bantuan program pengolahan dat statistik, yaitu
Statical Package for Social Science (SPSS).
Sebelum pengujian hipotesis, terlebih dahulu dilakukan penguijan asumsi klasik untuk
mengetahui apakah model regresi layak dipakai untuk memprediksi pengaruh variabel bebas
terhadap variabel terikat, dimana meliputi:
1. Uji Normalitas
2. Uji Autokorelasi
3. Uji Multikolinearitas
4. Uji Heteroskedastisitas
Definisi Operasional dan Pengukuran Variabel
1. Variabel Dependen
Variabel capital structure yang digunakan dalam penelitian ini adalah struktur modal.
Struktur modal diproksikan dengan debt to equity ratio (DER). DER diukur dengan
membandingkan antara hutang jangka panjang dengan ekuitas.
Equity
Debt Term LongRatioEquityDebt
2. Variabel Independen
a. Size
Variabel Size yang dimaksudkan di sini yaitu ukuran perusahaan. Ukuran perusahaan
merupakan ukuran atau besarnya aset yang dimiliki perusahaan. Variabel ini
dilambangkan dengan X1. Menurut Paramu (2006) dalam Indrajaya, Herlina dan Setiadi
(2011) diukur dengan logaritma natural dari total assets.
91
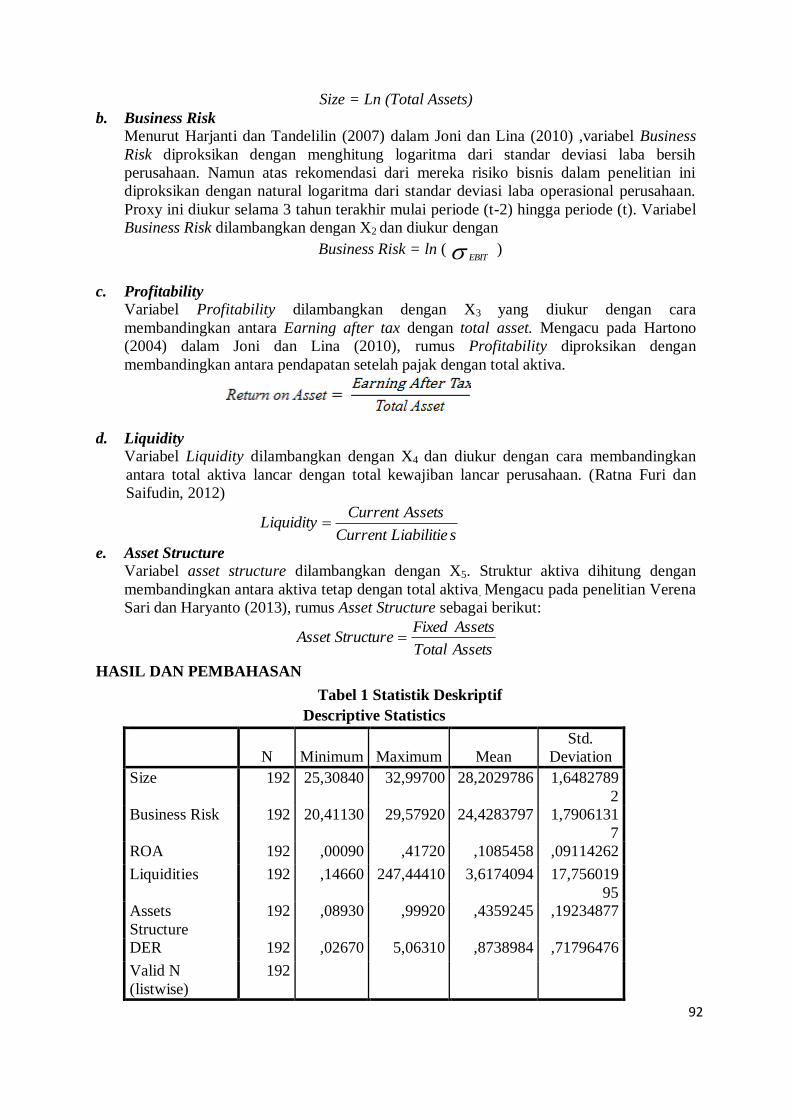
i
87
Size = Ln (Total Assets)
b. Business Risk
Menurut Harjanti dan Tandelilin (2007) dalam Joni dan Lina (2010) ,variabel Business
Risk diproksikan dengan menghitung logaritma dari standar deviasi laba bersih
perusahaan. Namun atas rekomendasi dari mereka risiko bisnis dalam penelitian ini
diproksikan dengan natural logaritma dari standar deviasi laba operasional perusahaan.
Proxy ini diukur selama 3 tahun terakhir mulai periode (t-2) hingga periode (t). Variabel
Business Risk dilambangkan dengan X2 dan diukur dengan
Business Risk = ln ( EBIT )
c. Profitability
Variabel Profitability dilambangkan dengan X3 yang diukur dengan cara
membandingkan antara Earning after tax dengan total asset. Mengacu pada Hartono
(2004) dalam Joni dan Lina (2010), rumus Profitability diproksikan dengan
membandingkan antara pendapatan setelah pajak dengan total aktiva.
d. Liquidity
Variabel Liquidity dilambangkan dengan X4 dan diukur dengan cara membandingkan
antara total aktiva lancar dengan total kewajiban lancar perusahaan. (Ratna Furi dan
Saifudin, 2012)
sLiabilitie Current
Assets CurrentLiquidity
e. Asset Structure
Variabel asset structure dilambangkan dengan X5. Struktur aktiva dihitung dengan
membandingkan antara aktiva tetap dengan total aktiva. Mengacu pada penelitian Verena
Sari dan Haryanto (2013), rumus Asset Structure sebagai berikut:
Assets Total
Assets Fixed StructureAsset
HASIL DAN PEMBAHASAN
Tabel 1 Statistik Deskriptif
Descriptive Statistics
N Minimum Maximum Mean
Std.
Deviation
Size 192 25,30840 32,99700 28,2029786 1,6482789
2
Business Risk 192 20,41130 29,57920 24,4283797 1,7906131
7
ROA 192 ,00090 ,41720 ,1085458 ,09114262
Liquidities 192 ,14660 247,44410 3,6174094 17,756019
95
Assets
Structure
192 ,08930 ,99920 ,4359245 ,19234877
DER 192 ,02670 5,06310 ,8738984 ,71796476
Valid N
(listwise)
192
92
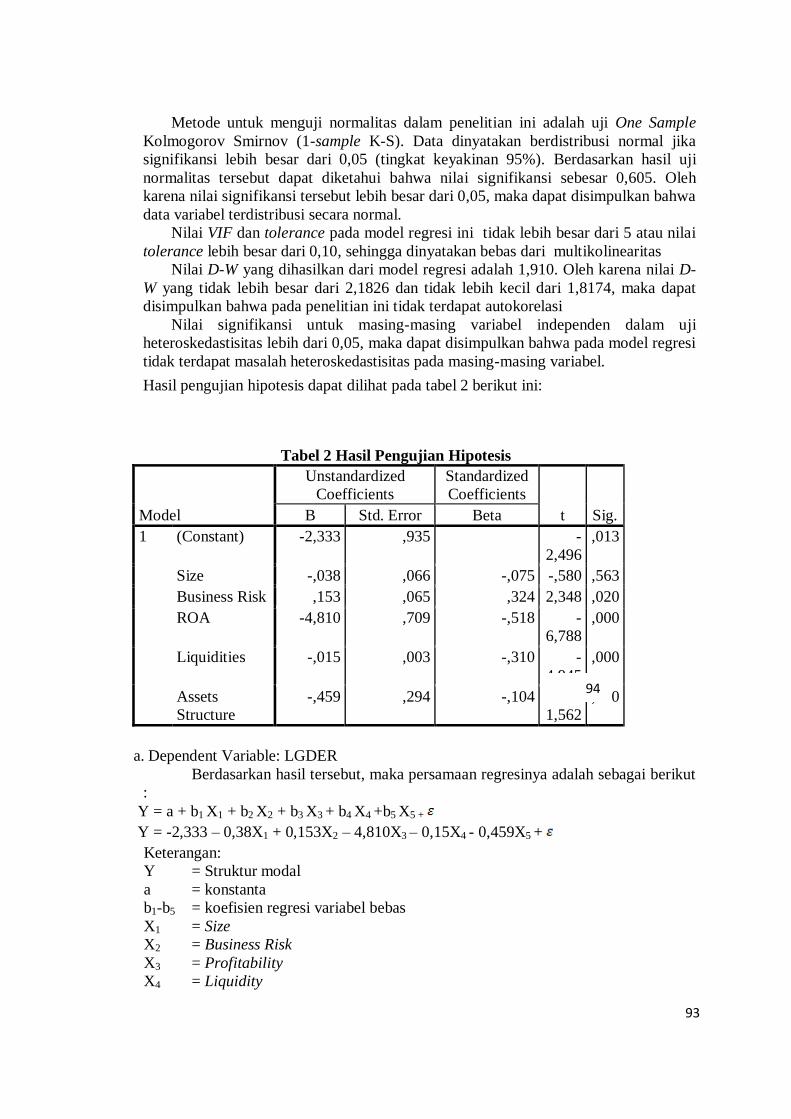
i
88
Metode untuk menguji normalitas dalam penelitian ini adalah uji One Sample
Kolmogorov Smirnov (1-sample K-S). Data dinyatakan berdistribusi normal jika
signifikansi lebih besar dari 0,05 (tingkat keyakinan 95%). Berdasarkan hasil uji
normalitas tersebut dapat diketahui bahwa nilai signifikansi sebesar 0,605. Oleh
karena nilai signifikansi tersebut lebih besar dari 0,05, maka dapat disimpulkan bahwa
data variabel terdistribusi secara normal.
Nilai VIF dan tolerance pada model regresi ini tidak lebih besar dari 5 atau nilai
tolerance lebih besar dari 0,10, sehingga dinyatakan bebas dari multikolinearitas
Nilai D-W yang dihasilkan dari model regresi adalah 1,910. Oleh karena nilai D-
W yang tidak lebih besar dari 2,1826 dan tidak lebih kecil dari 1,8174, maka dapat
disimpulkan bahwa pada penelitian ini tidak terdapat autokorelasi
Nilai signifikansi untuk masing-masing variabel independen dalam uji
heteroskedastisitas lebih dari 0,05, maka dapat disimpulkan bahwa pada model regresi
tidak terdapat masalah heteroskedastisitas pada masing-masing variabel.
Hasil pengujian hipotesis dapat dilihat pada tabel 2 berikut ini:
Tabel 2 Hasil Pengujian Hipotesis
Model
Unstandardized
Coefficients
Standardized
Coefficients
t Sig. B Std. Error Beta
1 (Constant) -2,333 ,935
-
2,496
,013
Size -,038 ,066 -,075 -,580 ,563
Business Risk ,153 ,065 ,324 2,348 ,020
ROA -4,810 ,709 -,518 -
6,788
,000
Liquidities -,015 ,003 -,310 -
4,945
,000
Assets
Structure
-,459 ,294 -,104 -
1,562
,120
a. Dependent Variable: LGDER
Berdasarkan hasil tersebut, maka persamaan regresinya adalah sebagai berikut
:
Y = a + b1 X1 + b2 X2 + b3 X3 + b4 X4 +b5 X5 +
Y = -2,333 – 0,38X1 + 0,153X2 – 4,810X3 – 0,15X4 - 0,459X5 +
Keterangan:
Y = Struktur modal
a = konstanta
b1-b5 = koefisien regresi variabel bebas
X1 = Size
X2 = Business Risk
X3 = Profitability
X4 = Liquidity
94
93
i
89
X5 = Assets Structure
= error
Pengujian Hipotesis
a. Pengujian hipotesis pertama (H1)
Dari tabel 2 tersebut dapat dilihat bahwa variabel size menghasilkan angka signifikan
0,563. Angka yang terbentuk lebih besar dari tingkat signifikansi yang digunakan dalam
penelitian ini yaitu 0,05. Hal ini berarti H01 diterima dan H1 ditolak, yaitu secara parsial Size
tidak memiliki pengaruh yang signifikan terhadap struktur modal pada perusahaan
manufaktur yang terdaftar di Bursa Efek Indonesia dengan tingkat keyakinan 95%. Hasil
penelitian ini konsisten terhadap Pecking Order Theory, yang menyatakan bahwa perusahaan
cenderung memilih pendanaan internal daripada pendanaan eksternal. Perusahaan besar
cenderung memiliki tingkat penjualan serta keuntungan yang lebih besar sehingga mereka
memiliki dana cadangan yang lebih besar pula untuk memenuhi kebutuhan dana mereka.
Akan tetapi, dari hasil penelitian menunjukkan bahwa Size tidak memiliki pengaruh yang
signifikan terhadap struktur modal.
Berdasarkan hasil penelitian yang dilakukan oleh peneliti, penelitian menyatakan bahwa
size tidak berpengaruh terhadap struktur modal dengan nilai signifikan 0,563. Penelitian ini
konsisten dengan penelitian yang dilakukan oleh Joni dan Lina (2010). Penelitian ini
menyatakan bahwa variabel size tidak mempunyai pengaruh signifikan terhadap struktur
modal. Di lain sisi penelitian ini berlawanan dengan penelitian yang dilakukan oleh
Nuswandari (2013) Verena Sari dan Haryanto (2013), Indrajaya, Herlina dan Setiadi (2011),
Seftianne dan Handayani (2011), Ratna Sari dan Saifudin (2012) serta Akinyomi dan
Olagunju (2013) yang menyatakan bahwa size berpengaruh terhadap struktur modal
b. Pengujian Hipotesis kedua (H2)
Variabel Business risk menghasilkan angka signifikan 0,020. Angka yang terbentuk lebih
kecil dari tingkat signifikansi yang digunakan dalam penelitian ini yaitu 0,05. Hal ini berarti
H02 ditolak dan H2 diterima, yaitu secara parsial Business Risk memiliki pengaruh yang
signifikan terhadap struktur modal pada perusahaan manufaktur yang terdaftar di Bursa Efek
Indonesia dengan tingkat keyakinan 95%. Hasil penelitian ini inkonsisten dengan Trade-off
theory yang menyatakan bahwa semakin tinggi risiko bisnis maka probabilitas terjadinya
financial distress akan semakin tinggi sehingga tingkat penggunaan hutang akan lebih
rendah. Menurut Seftianne dan Handayani (2011), Investor yang memiliki sifat risk seeker
akan lebih tertarik akan lebih tertarik kepada perusahaan dengan risiko yang tinggi karena
perusahaan dengan risiko yang tinggi akan menghasilkan return yang tinggi pula.
Hasil penelitian juga menunjukan bahwa business risk berpengaruh terhadap struktur
modal dengan nilai signifikan 0,020. Penelitian ini konsisten dengan penelitian yang
dilakukan oleh Ratna Sari dan Saifudin (2012). Penelitian ini menyatakan bahwa variabel
business risk mempunyai pengaruh signifikan terhadap struktur modal. Nuswandari (2013)
dalam penelitiannya juga mengungkapkan bahwa variabel business risk berpengaruh
signifikan terhadap struktur modal. Di lain sisi penelitian ini berlawanan dengan penelitian
yang dilakukan oleh Joni dan Lina (2010), Indrajaya, Herlina dan Setiadi (2011), Seftianne
dan Handayani (2011) yang menyatakan bahwa business risk tidak berpengaruh terhadap
struktur modal.
c. Pengujian hipotesis ketiga (H3)
94
i
90
Variabel Profitability menghasilkan angka signifikan 0,000. Angka yang terbentuk lebih
kecil dari tingkat signifikansi yang digunakan dalam penelitian ini yaitu 0,05. Hal ini berarti
H03 ditolak dan H3 diterima, yaitu secara parsial Profitability memiliki pengaruh yang
signifikan terhadap struktur modal pada perusahaan manufaktur yang terdaftar di Bursa Efek
Indonesia dengan tingkat keyakinan 95%. Menurut Nuswandari (2013), Perusahaan yang
mempunyai profitabilitas tinggi akan mengurangi hutang. Perusahaan cenderung
mengalokasikan sebagian besar keuntungannya pada laba ditahan sehingga mengandalkan
pendanaan internal dan relatif lebih rendah menggunakan hutang, Hal ini sesuai dengan
Pecking Order Theory.
Hasil penelitian juga menunjukan bahwa Profitability mempunyai pengaruh signifikan
terhadap struktur modal dengan nilai signifikan 0,000. Penelitian ini konsisten dengan
penelitian yang dilakukan oleh Joni dan Lina (2010), Indrajaya, Herlina dan Setiadi (2011),
Akinyomi dan Olagunju (2013), serta Nuswandari (2013) yang juga menyatakan bahwa
profitability berpengaruh terhadap struktur modal. Di lain sisi Seftianne dan Handayani
(2011) dan Ratna Sari dan Saifudin (2012) mengungkapkan bahwa profitability tidak
berpengaruh signifikan terhadap struktur modal.
d. Pengujian hipotesis keempat (H4)
Variabel liquidity menghasilkan angka signifikan 0,000. Angka yang terbentuk lebih
kecil dari tingkat signifikansi yang digunakan dalam penelitian ini yaitu 0,05. Hal ini berarti
H04 ditolak dan H4 diterima, yaitu secara parsial liquidity memiliki pengaruh yang signifikan
terhadap struktur modal pada perusahaan manufaktur yang terdaftar di Bursa Efek Indonesia
dengan tingkat keyakinan 95%. Menurut Pecking Order Theory, perusahaan yang memiliki
likuiditas yang tinggi akan cenderung tidak menggunakan pembiayaan dari hutang. Hal ini
disebabkan perusahaan dengan tingkat likuiditas yang tinggi mempunyai dana internal yang
lebih besar, sehingga perusahaan menggunakan dana internal dahulu untuk membiayai
investasinya sebelum menggunakan pembiayaan eksternal melalui hutang.
Hasil penelitian juga menunjukan bahwa liquidity mempunyai pengaruh signifikan
terhadap struktur modal dengan nilai signifikan 0,000. Penelitian ini konsisten dengan
penelitian yang dilakukan oleh Verena Sari dan Haryanto (2013) yang juga menyatakan
bahwa liquidity berpengaruh terhadap struktur modal. Di lain sisi penelitian ini berlawanan
dengan penelitian yang dilakukan oleh Seftianne dan Handayani (2011) serta Ratna Sari dan
Saifudin (2012) yang menyatakan bahwa variabel liquidity tidak mempunyai pengaruh
signifikan terhadap struktur modal.
e. Pengujian hipotesis kelima (H5)
Variabel assets structure menghasilkan angka signifikan 0,120. Angka yang terbentuk
lebih besar dari tingkat signifikansi yang digunakan dalam penelitian ini yaitu 0,05. Hal ini
berarti H05 diterima dan Ha5 ditolak, yaitu secara parsial asset structure tidak memiliki
pengaruh yang signifikan terhadap struktur modal pada perusahaan manufaktur yang terdaftar
di Bursa Efek Indonesia dengan tingkat keyakinan 95%. Menurut Verena Sari dan Haryanto
(2013), pada umumnya perusahaan yang memiliki jaminan terhadap hutang akan lebih mudah
mendapatkan hutang dikarenakan memiliki risiko yang lebih kecil sedangkan menurut hasil
penelitian, struktur aktiva tidak dapat memprediksi nilai struktur modal karena perusahaan
lebih cenderung menggunakan aktivanya untuk operasional perusahaan dan bukan untuk
mengurangi risiko hutang.
Hasil penelitian juga menunjukan bahwa assets structure tidak mempunyai pengaruh
signifikan terhadap struktur modal dengan nilai signifikan 0,120. Penelitian ini konsisten
95
i
91
dengan penelitian yang dilakukan oleh Seftianne dan Handayani (2011) dan Verena Sari dan
Haryanto (2013) yang juga menyatakan bahwa asset structure tidak berpengaruh terhadap
struktur modal. Di lain sisi Ratna Sari dan Saifudin (2012). juga mengungkapkan bahwa
profitabilitas dan ukuran perusahaan juga berpengaruh signifikan terhadap struktur modal,
tetapi variabel pertumbuhan aset dan struktur aktiva tidak berpengaruh terhadap struktur
modal. Di lain sisi penelitian ini berlawanan dengan penelitian yang dilakukan oleh Joni dan
Lina (2010), Indrajaya, Herlina dan Setiadi (2011), Akinyomi dan Olagunju (2013), dan
Ratna Furi dan Saifudin (2012) yang menyatakan bahwa variabel asset structure mempunyai
pengaruh signifikan terhadap struktur modal.
f. Pengujian hipotesis keenam (Uji H6)
Uji ini digunakan untuk mengetahui apakah dalam model regresi, variabel independen
berpengaruh signifikan terhadap variabel independen. Berdasarkan hasil pengujian, nilai
signifikansi 0,000 di mana kurang dari tingkat signifikansi 0,05 artinya Ho ditolak, sehingga
paling sedikit ada satu variabel independen yang mempengaruhi variabel dependen secara
signifikan. Hal ini juga berarti model regresi dapat dipakai untuk memprediksi pengaruh size,
business risk, profitability, liquidity, dan assets structure terhadap struktur modal perusahaan.
g. Uji Koefisien Determinasi (R2)
Berdasarkan hasil penelitian, nilai adjusted R2 yaitu sebesar 0,26 yang berarti variasi
variabel independen yang digunakan dalam model mampu menjelaskan sebesar 26% variasi
variabel dependen, sedangkan sisanya sebesar 74% dipengaruhi atau dijelaskan oleh variabel
lain yang tidak dimasukkan dalam model penelitian ini.
PENUTUP
Kesimpulan
Berdasarkan hasil yang diperoleh dari ketiga tahun tersebut, maka dapat ditarik
kesimpulan bahwa size dan asset structure tidak mempengaruhi struktur modal yang terdaftar
di Bursa Efek Indonesia periode 2011-2013 sedangkan business risk, profitability, dan
liquidity mempengaruhi struktur modal pada perusahaan yang terdaftar di Bursa Efek
Indonesia periode 2011-2013.
Saran dan Keterbatasan
Penelitian mempunyai keterbatasan seperti variabel independen yang digunakan dalam
penelitian ini hanya terdiri dari lima variabel, yaitu size, business risk, profitability, liquidity,
dan assets structure. Selain itu, pengukuran variabel independen dan dependen yang
digunakan dalam penelitian hanya terbatas pada satu pengukuran. Keterbatasan lain yaitu
karena perusahaan yang dijadikan sebagai subjek penelitian hanya terbatas pada perusahaan
yang listing di BEI dari tahun 2011 sampai dengan 2013. Selain itu, perusahaan yang
dijadikan subjek penelitian hanya terbatas pada perusahaan yang memiliki profit atau
keuntungan saja yang disebabkan karena salah satu variabel independen yaitu profitabilitas.
Berdasarkan hasil penelitian dan kelemahan yang ada, maka peneliti ingin memberikan
beberapa saran seperti:
1. Pada penelitian selanjutnya dapat menambahkan variabel independen lain seperti: non-
debt tax shield, volality/risk, effective tax rates, free cash flow, dividends payout ratio,
product uniqueness, dan lain-lain.
96
i
92
2. Penelitian selanjutnya juga dapat mengukur variabel independen dan dependen dalam
beberapa tipe. Variabel profitability dapat diukur berdasarkan NPM (net profit margin),
ROE (return on equity). Variabel size dapat diukur berdasarkan log of sales. Variabel
struktur modal dapat diukur berdasarkan debt to total assets ratio.
3. Sebaiknya jumlah sampel dan tahun penelitian lebih diperluas lagi dengan cara
memperpanjang periode penelitian.
4. Sebaiknya sampel penelitian tidak hanya mencakup perusahaan manufaktur tetapi
mencakup seluruh jenis perusahaan yang terdaftar di Bursa Efek Indonesia, seperti
perusahaan jasa, perusahaan perbankan, dan perusahaan non keuangan.
DAFTAR RUJUKAN
Brigham, Eugene F. dan Joel F. Houston. (2009). Fundamentals of financial management.
Twelfth Edition. Orlando: Harcourt College Publishers
Brigham, Eugene F. dan Michael C. Ehrhardt. (2011). Financial management theory and
practice. Thirteenth Edition. Mason: Thomson South-Western
Factbook. 2011-2013. Resources. http://www.idx.co.id/idid/beranda/publikasi/ factbook.aspx
Ghozali, Imam. (2011). Aplikasi Analisis Multivariate dengan Program SPSS. Semarang:
Badan Penerbit Universitas Diponegoro
Ikatan Akuntan Indonesia. (2012). Standar Akuntansi Keuangan. Jakarta: Salemba Empat
Indrajaya, Herlina, dan Setiadi Rini. (2011).Pengaruh Struktur Aktiva Perusahaan, Ukuran
Perusahaan, Tingkat Pertumbuhan, Profitabilitas, dan Risiko Bisnis Terhadap Struktur
Modal: Studi Empiris pada Perusahaan Pertambangan yang Listing di Bursa Efek
Indonesia Tahun 2004-2007.Akurat Jurnal Ilmiah Akuntansi. Nomor 6 Tahun ke 2.
John Akinyomi, Oladele dan Olagunju Adebayo. (2013). Determinants of Capital Structure
in Nigeria. International Journal of Innovation and Applied Studies. Vol 3 No 4.
Joni dan Lina. (2010). Faktor-faktor yang mempengaruhi struktur modal. Jurnal Bisnis dan
Akuntansi. Vol.12 No. 2 . (Agustus) (1) 81-96
Nuswandari, Cahyani. (2013). Determinan struktur modal dalam perspektif pecking order
theory dan agency theory. Dinamika Akuntansi, Keuangan dan Perbankan. Vol 2 No 1.
Ratna Furi, Vina dan Saifudin. (2012). Faktor-Faktor yang Mempengaruhi Struktur Modal
(Studi Empiris pada Perusahaan Manufaktur yang Terdaftar di BEI Tahun 2009-2010).
Jurnal Akuntansi. Vol. 1 No. 2 . (Februari) (1) 49-62
Reeve, James M., Carl S. Warren, dan Jonathan E. Duchac. (2009). Principles of Accounting.
Twenty-third Edition. United States of America: South-Western
Richard A.Brealey, Stewart C.Myers, Franklin Allen. (2011). Principles of Corporate
Finance. Tenth Edition. New York: McGraw-Hill Companies
Riyanto, Bambang.(2010). Dasar-Dasar Pembelanjaan Negara. Yogyakarta: BPFE
97

i
93
Seftianne dan Handayani, Ratih. (2011). Faktor- Faktor yang Memengaruhi Struktur Modal
pada Perusahaan Publik Sektor Manufaktur. Jurnal Bisnis dan Akuntansi. Vol 13 No 1.
Verena Sari, Devi dan A. Mulyo Haryanto. (2013).Pengaruh Profitabilitas, Perumbuhan Aset,
Ukuran Perusahaan, Struktur Aktiva dan Likuiditas terhadap Sruktur Modal pada
Perusahaan Manufaktur di Bursa Efek Indonesia Tahun 2008-2010. Diponegoro
Journal of Management. Vol. 2 No. 3.
Wedgandt, Jerry J., Paul D. Kimmel dan Donald E. Kieso.(2013). Financial Accounting :
IFRS Editon. New York: John Wiley and Sons,Inc
www.idx.co.id
98
i
94
KETENTUAN PENULISAN JURNAL
1. Substansi Artikel. Artikel yang diserahkan merupakan tulisan ilmiah dengan desain kuantitatif
maupun kualitatif berupa: studi pustaka, studi empiris, ataupun studi kasus, sebagai hasil pengembangan Ilmu Keuangan, Pasar Modal, Investasid dan Perbankan termasuk Risiko.
Artikel yang disumbangkan adalah artikel orisinil yang belum pernah dipublikasikan di media
lain dan menggunakan pustaka acuan mutakhir, proposi terbitan 15 tahun terakhir.
2. Gaya penulisan. Artikel ditulis dengan bahasa Indonesia atau bahasa Inggris yang baku.
Artikel memuat judul, nama penulis beserta keterangan dan alamat kerja yang jelas. Penulisan
abstrak dibatasi maksimum sampai 300 kata, untuk artikel Indonesia, abstrak ditulis Inggris dan sebaliknya, disertai kata kunci (ketword). Bagian utama artikel ditulis dengan sistematika:
Pendahuluan, Tujuan Penelitiani, Tinjauan Teori, Metodologi, Analisis dan Pembahasan,
Kesimpulan, Saran, Daftar Pustaka. Setiap judul baik suib judul tulisan perlu diberikan HURUF TEBAL SEMUA. Penyajian Gambar, tabel, bagan, dan pendukung lain harus disertai
dengan nomor urut, judul, dan sumber yang konsisten.
2.1 Contoh Daftar Pustaka Liu Pu, Stanley, Smith D, Syed, Azmat A. (1990). Stock Price Reactions to Wall Street
Journal's Securities Recomendation, Journal of Financial and Quantitative Analysis
(JFQA), Vol.25, No 3, Published by University of Washington School of Business Administration.
Manurung, Adler Haymans, (2011). Metode Riset: Keuangan, Investasi dan Akuntansi Empiris, PT Adler Manurung Press, Jakarta.
3. Seleksi Artikel. Artikel yang masuk ke redaksi akan diseleksi dan direview oleh anggota
dewan redaksi dan ada kemungkinan untuk diedit dan/atau dikembalikan untuk diperbaiki dan/atau dilengkapi. Artikel yang tidak dimuat tidak dikembalikan. Artikel yang dimuat
merupakan hak redaksi dan dapat ditampilkan dalam media lain untuk akademik. Isi artiker di
luar tanggung-jawab redaksi.
4. Penyerahan Artikel. Artikel yang akan dimuat dapat dikirim/diserahkan berupa print-out
ketikan dan dalam bentuk file Microsoft Word yang bisa dibuka dengan baik. Artikel dicetak pada kertas A4 atau folio, spasi ganda, huruf dengan Times New Roman 12, dimana jumlah
halaman 15- 45 halaman. Adapun alamat Redaksi Jurnal sebagai berikut:
Redaksi Jurnal Pasar Modal dan Perbankan
Staff Sirkulasi & Administrasi
Deasy Sinurat
Editorial Office
Redaksi Jurnal Pasar Modal dan Perbankan
Komplek Mitra Matraman A1/17
JL.Matraman Raya No.148 Jakarta Timur 13130 Telp. (62-21) 70741182, 85918040 Ext.140; Fax. (62-21) 85918041
Email : [email protected]
http://www. adlermanurungpress.com/journal/index-journal.php
99