June 2011 Water Sampling at the Monument Valley, Arizona ... · PDF fileJune 2011 Water...
148
June 2011 Water Sampling at the Monument Valley, Arizona, Processing Site August 2011 LMS/MON/S00611
Transcript of June 2011 Water Sampling at the Monument Valley, Arizona ... · PDF fileJune 2011 Water...
June 2011 Water Sampling at the Monument Valley, Arizona, Processing Site August 2011
LMS/MON/S00611

This page intentionally left blank
U.S. Department of Energy DVP—June 2011, Monument Valley, Arizona August 2011 RIN 11053841 and 11063901 Page i
Contents Sampling Event Summary ...............................................................................................................1 Monument Valley, Arizona, Processing Site Sample Locations .....................................................5 Data Assessment Summary ..............................................................................................................7
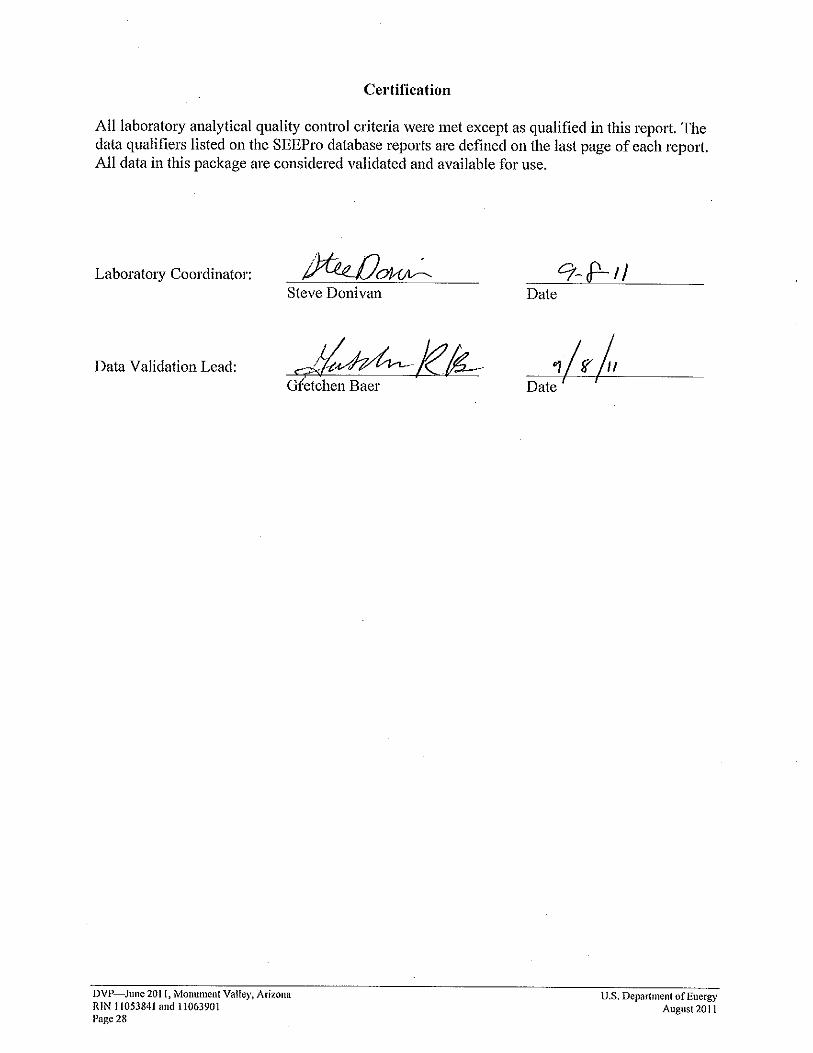
Water Sampling Field Activities Verification Checklist .............................................................9 Laboratory Performance Assessment ........................................................................................11 Sampling Quality Control Assessment ......................................................................................26 Certification ...............................................................................................................................28
Attachment 1—Assessment of Anomalous Data Potential Outliers Report Attachment 2—Data Presentation Groundwater Quality Data Surface Water Quality Data Static Water Level Data Time-Concentration Graphs Attachment 3—Sampling and Analysis Work Order Attachment 4—Trip Report
DVP—June 2011, Monument Valley, Arizona U.S. Department of Energy RIN 11053841 and 11063901 August 2011 Page ii
This page intentionally left blank
U.S. Department of Energy DVP—June 2011, Monument Valley, Arizona August 2011 RIN 11053841 and 11063901 Page 1
Sampling Event Summary Site: Monument Valley, Arizona, Processing Site Sampling Period: June 6–8 and 20, 2011 Forty-six groundwater samples and one surface water sample were collected at the Monument Valley, Arizona, Processing Site to monitor groundwater contaminants as specified in the 1999 Final Site Observational Work Plan for the UMTRA Project Site at Monument Valley, Arizona. Sampling and analysis were conducted as specified in the Sampling and Analysis Plan for U.S. Department of Energy Office of Legacy Management Sites (LMS/PLN/S04351, continually updated). Water levels were measured at each sampled well. Time-concentration plots for ammonia as nitrogen, chloride, nitrate + nitrite as nitrogen, sulfate, uranium, and vanadium are included with the results data. The data from this sampling event are consistent with values previously obtained.
• Widely fluctuating uranium concentrations in wells 0657 and 0662 have been noted previously. To better define the uranium concentration in this area, new wells 0733, 0734, and 0735 were installed. The uranium concentration in well 0733 was below the standard, but above in wells 0734 and 0735.
• Nitrate + nitrite as nitrogen concentrations in wells 0662, 0761, 0762, 0764, and 0771 had been increasing through 2008, which was consistent with downgradient movement of the contaminant plume. Results from the 2009, 2010, and 2011 events, however, demonstrate that nitrate + nitrite as nitrogen concentrations are leveling off or decreasing in these wells. New wells (0738, 0739, and 0740) were installed to better define the downgradient edge of the nitrate + nitrite as N plume. The concentrations in wells 0738 and 0739 were below the standard, but slightly above the standard in well 0740 on the west side of the valley.
• A de-nitrification treatment of well 0765 in September 2009 by the University of Arizona has decreased concentrations for most analytes at that location. Nitrate + nitrite as nitrogen and sulfate in nearby well 0766 also initially decreased after the treatment at 0765, but these concentrations have increased in the December 2010 and June 2011 events. The sulfate concentration in another nearby well, 0743, dropped sharply since December 2010.
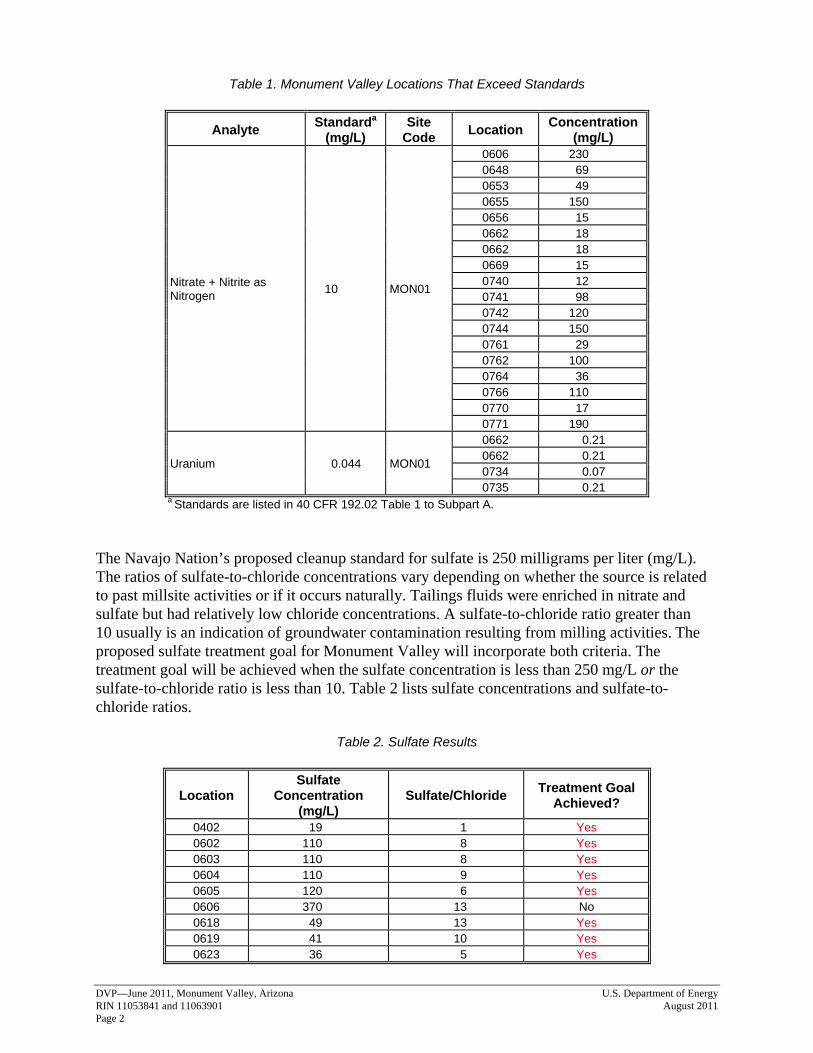
Wells with analyte concentrations that exceeded U.S. Environmental Protection Agency groundwater standards are listed in Table 1.
DVP—June 2011, Monument Valley, Arizona U.S. Department of Energy RIN 11053841 and 11063901 August 2011 Page 2
Table 1. Monument Valley Locations That Exceed Standards
Analyte Standarda (mg/L)
Site Code Location Concentration
(mg/L)
Nitrate + Nitrite as Nitrogen 10 MON01
0606 230 0648 69 0653 49 0655 150 0656 15 0662 18 0662 18 0669 15 0740 12 0741 98 0742 120 0744 150 0761 29 0762 100 0764 36 0766 110 0770 17 0771 190
Uranium 0.044 MON01
0662 0.21 0662 0.21 0734 0.07 0735 0.21
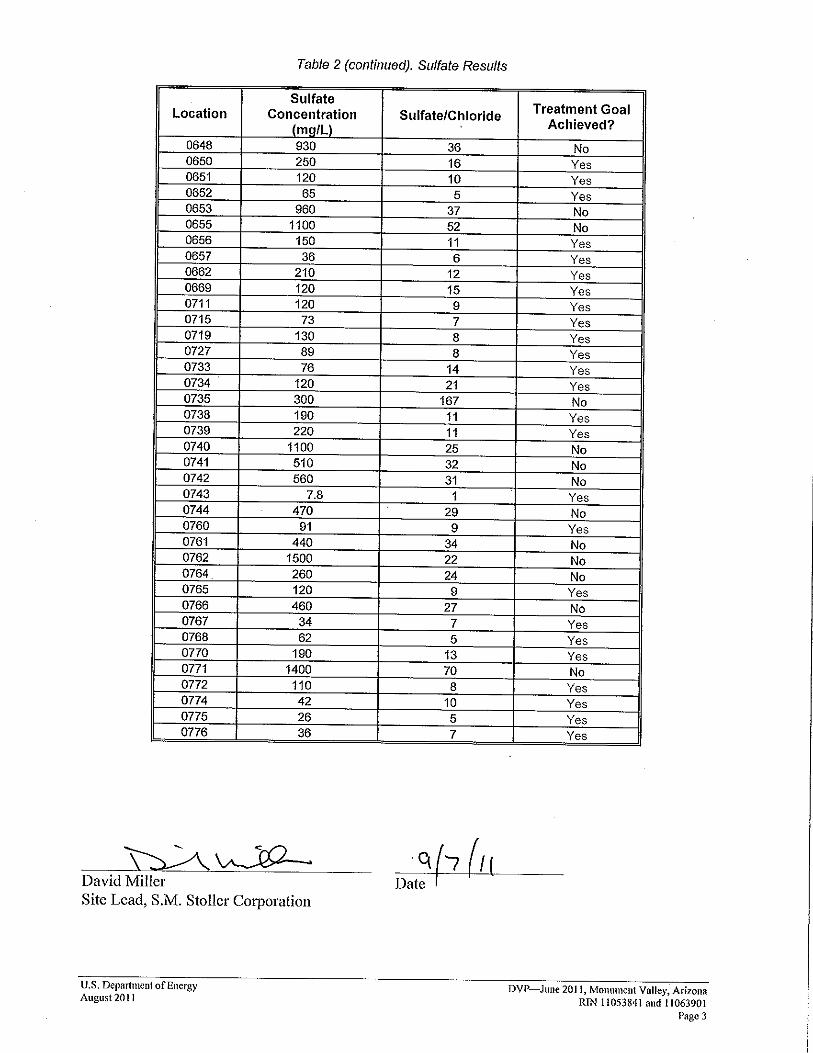
a Standards are listed in 40 CFR 192.02 Table 1 to Subpart A. The Navajo Nation’s proposed cleanup standard for sulfate is 250 milligrams per liter (mg/L). The ratios of sulfate-to-chloride concentrations vary depending on whether the source is related to past millsite activities or if it occurs naturally. Tailings fluids were enriched in nitrate and sulfate but had relatively low chloride concentrations. A sulfate-to-chloride ratio greater than 10 usually is an indication of groundwater contamination resulting from milling activities. The proposed sulfate treatment goal for Monument Valley will incorporate both criteria. The treatment goal will be achieved when the sulfate concentration is less than 250 mg/L or the sulfate-to-chloride ratio is less than 10. Table 2 lists sulfate concentrations and sulfate-to-chloride ratios.
Table 2. Sulfate Results
Location Sulfate
Concentration (mg/L)
Sulfate/Chloride Treatment Goal Achieved?
0402 19 1 Yes 0602 110 8 Yes 0603 110 8 Yes 0604 110 9 Yes 0605 120 6 Yes 0606 370 13 No 0618 49 13 Yes 0619 41 10 Yes 0623 36 5 Yes

DVP—June 2011, Monument Valley, Arizona U.S. Department of Energy RIN 11053841 and 11063901 August 2011 Page 4
This page intentionally left blank
U.S. Department of Energy DVP—June 2011, Monument Valley, Arizona August 2011 RIN 11053841 and 11063901 Page 5
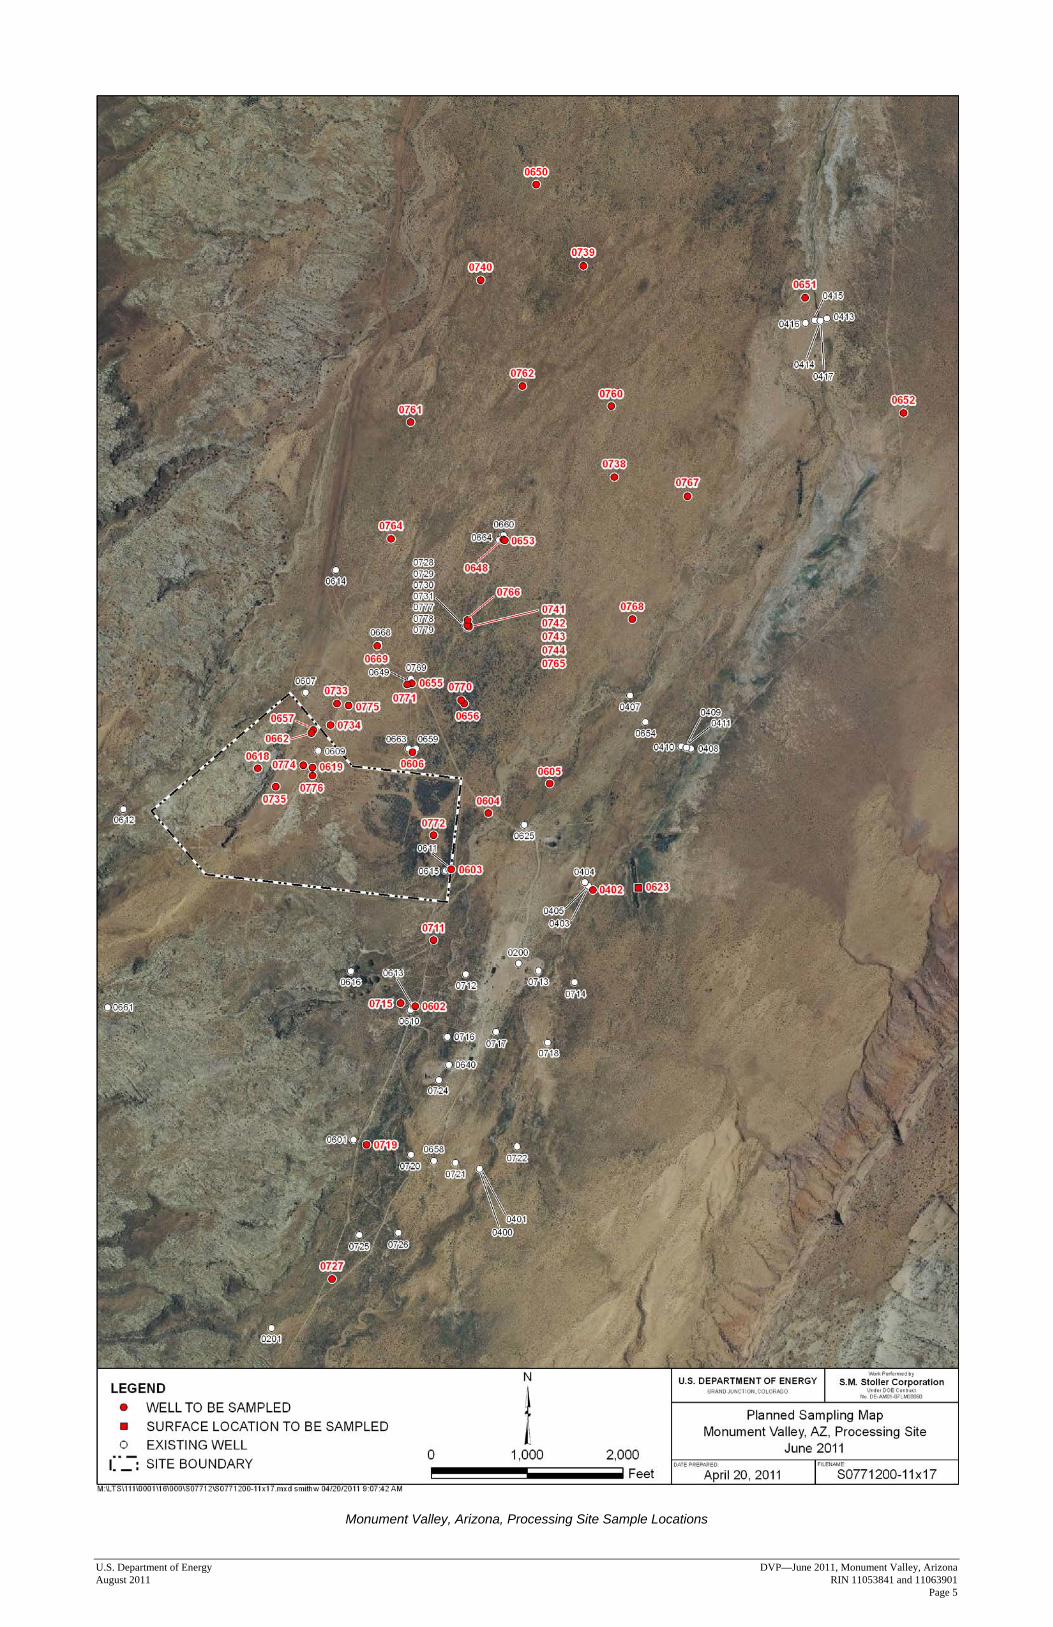
Monument Valley, Arizona, Processing Site Sample Locations
DVP—June 2011, Monument Valley, Arizona U.S. Department of Energy RIN 11053841 and 11063901 August 2011 Page 6
This page intentionally left blank
U.S. Department of Energy DVP—June 2011, Monument Valley, Arizona August 2011 RIN 11053841 and 11063901 Page 7
Data Assessment Summary
DVP—June 2011, Monument Valley, Arizona U.S. Department of Energy RIN 11053841 and 11063901 August 2011 Page 8
This page intentionally left blank
U.S. D
epartment of Energy
D
VP—
June 2011, Monum
ent Valley, A
rizona A
ugust 2011
RIN
11053841 and 11063901
Page 9
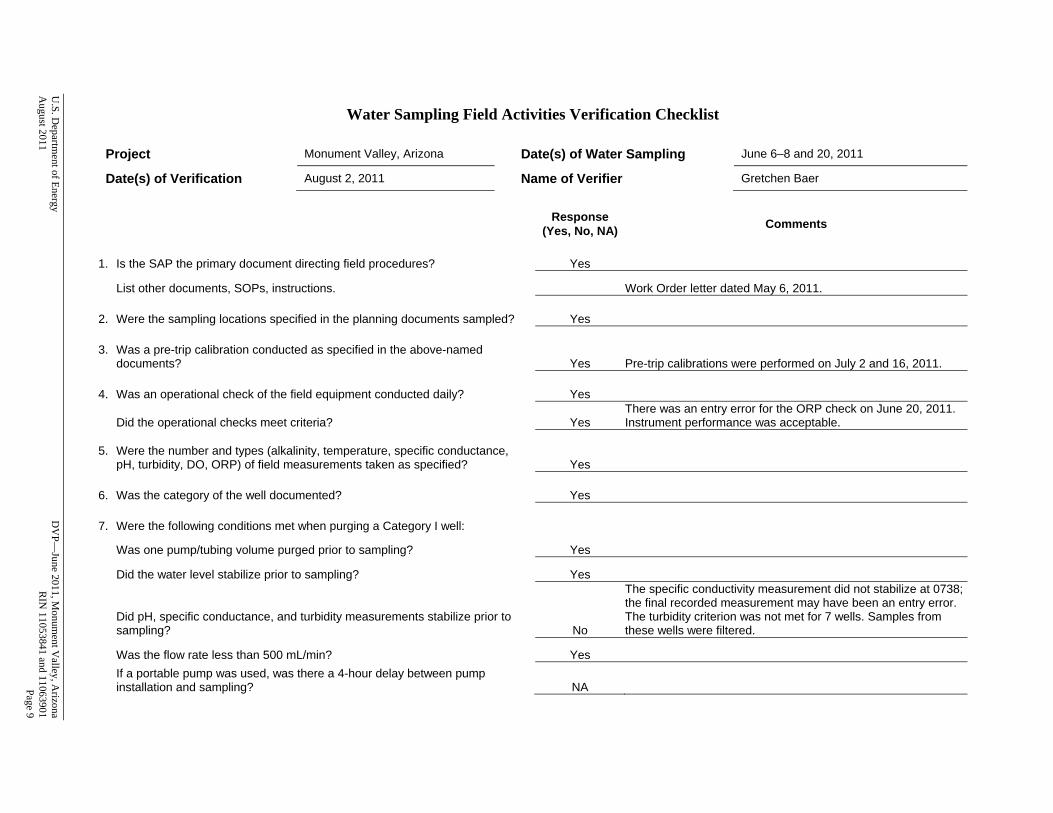
Water Sampling Field Activities Verification Checklist
Project Monument Valley, Arizona Date(s) of Water Sampling June 6–8 and 20, 2011
Date(s) of Verification August 2, 2011 Name of Verifier Gretchen Baer
Response
(Yes, No, NA) Comments
1. Is the SAP the primary document directing field procedures? Yes
List other documents, SOPs, instructions. Work Order letter dated May 6, 2011. 2. Were the sampling locations specified in the planning documents sampled? Yes 3. Was a pre-trip calibration conducted as specified in the above-named
documents? Yes Pre-trip calibrations were performed on July 2 and 16, 2011. 4. Was an operational check of the field equipment conducted daily? Yes
Did the operational checks meet criteria? Yes There was an entry error for the ORP check on June 20, 2011. Instrument performance was acceptable.
5. Were the number and types (alkalinity, temperature, specific conductance,
pH, turbidity, DO, ORP) of field measurements taken as specified? Yes 6. Was the category of the well documented? Yes 7. Were the following conditions met when purging a Category I well:
Was one pump/tubing volume purged prior to sampling? Yes
Did the water level stabilize prior to sampling? Yes
Did pH, specific conductance, and turbidity measurements stabilize prior to sampling? No
The specific conductivity measurement did not stabilize at 0738; the final recorded measurement may have been an entry error. The turbidity criterion was not met for 7 wells. Samples from these wells were filtered.
Was the flow rate less than 500 mL/min? Yes If a portable pump was used, was there a 4-hour delay between pump
installation and sampling? NA

DV
P—June 2011, M
onument V
alley, Arizona
U
.S. Departm
ent of Energy R
IN 11053841 and 11063901
A
ugust 2011 Page 10
Water Sampling Field Activities Verification Checklist (continued)
Response (Yes, No, NA) Comments
8. Were the following conditions met when purging a Category II well:
Was the flow rate less than 500 mL/min? Yes
Was one pump/tubing volume removed prior to sampling? Yes
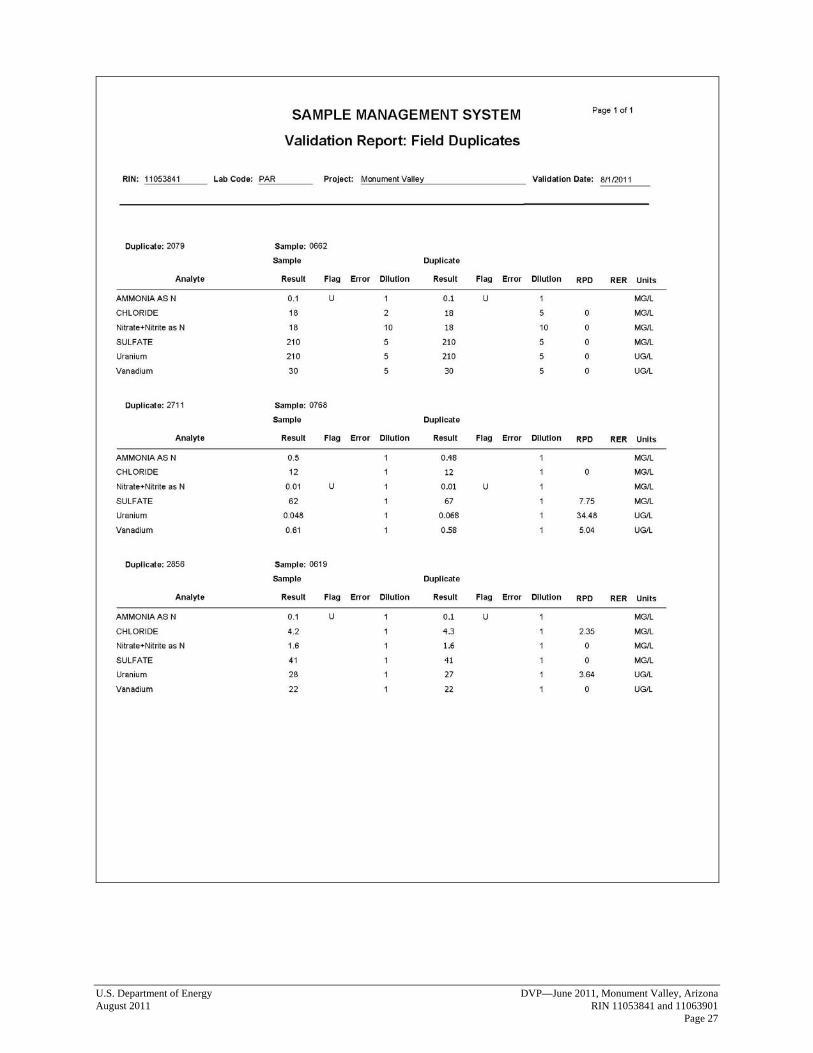
9. Were duplicates taken at a frequency of one per 20 samples? Yes Duplicate sample was collected from locations 0619, 0662, and 0768.
10. Were equipment blanks taken at a frequency of one per 20 samples that were
collected with nondedicated equipment? NA All samples were collected with dedicated equipment. 11. Were trip blanks prepared and included with each shipment of VOC samples? NA
12. Were QC samples assigned a fictitious site identification number? Yes Location IDs 2079, 2711, and 2856 were used for the duplicate samples.
Was the true identity of the samples recorded on the Quality Assurance Sample Log or in the Field Data Collection System (FDCS) report? Yes
13. Were samples collected in the containers specified? Yes 14. Were samples filtered and preserved as specified? Yes 15. Were the number and types of samples collected as specified? Yes 16. Were chain of custody records completed and was sample custody
maintained? Yes 17. Are field data sheets signed and dated by both team members (hardcopies) or
are dates present for the “Date Signed” fields (FDCS)? Yes
18. Was all other pertinent information documented on the field data sheets? Yes 19. Was the presence or absence of ice in the cooler documented at every sample
location? Yes 20. Were water levels measured at the locations specified in the planning
documents? Yes
U.S. Department of Energy DVP—June 2011, Monument Valley, Arizona August 2011 RIN 11053841 and 11063901 Page 11
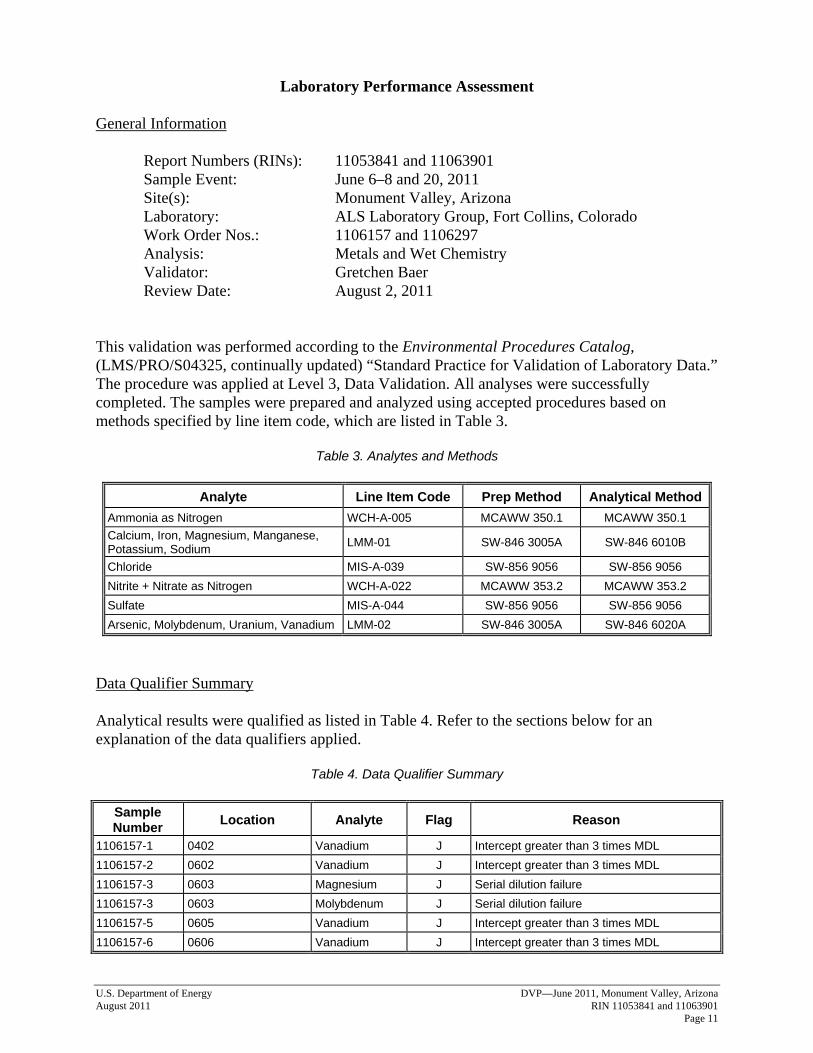
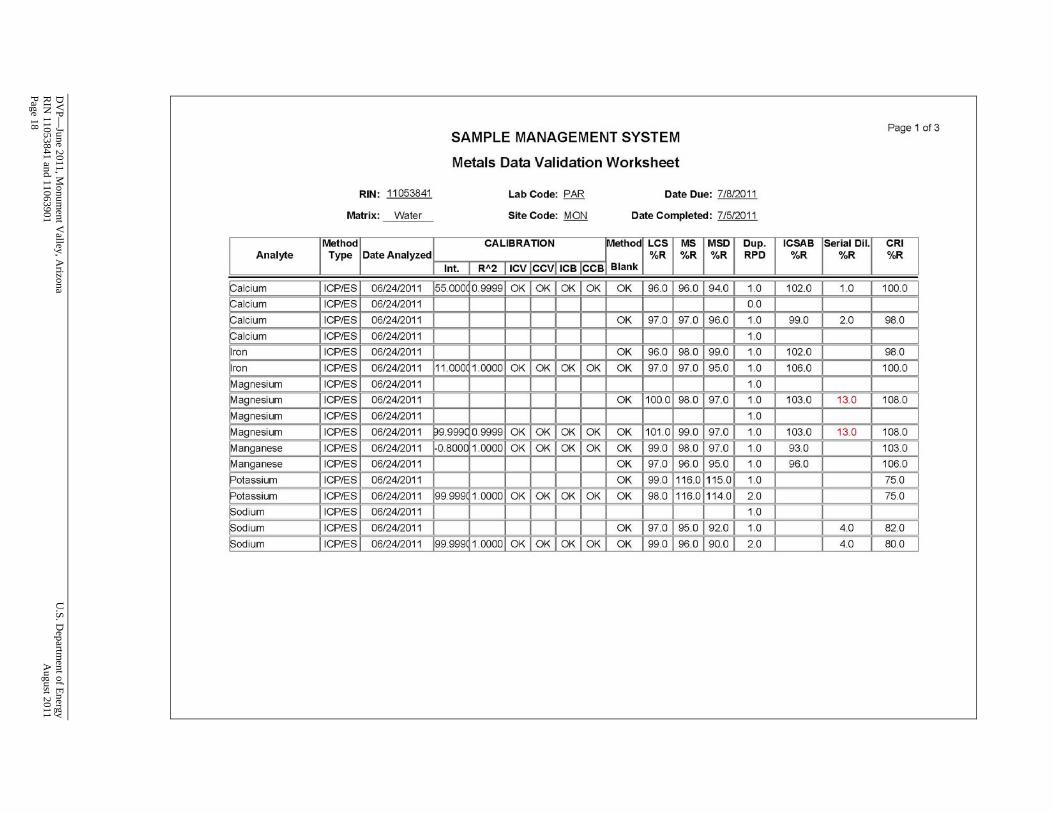
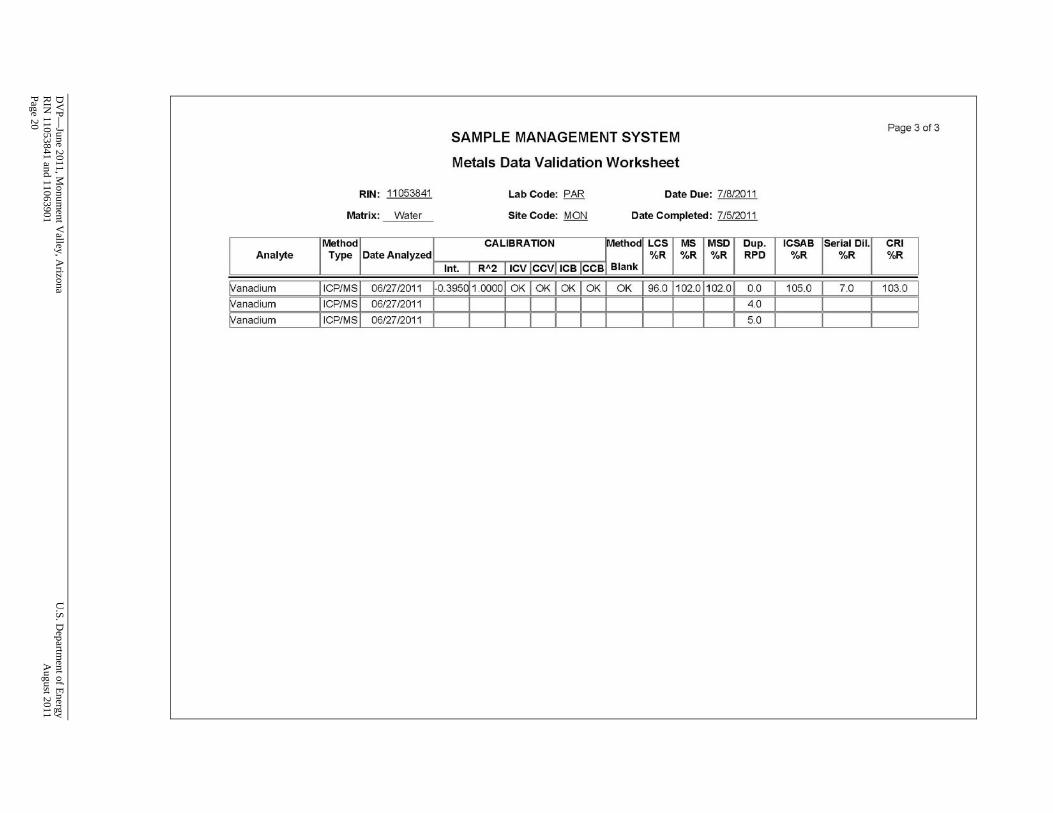
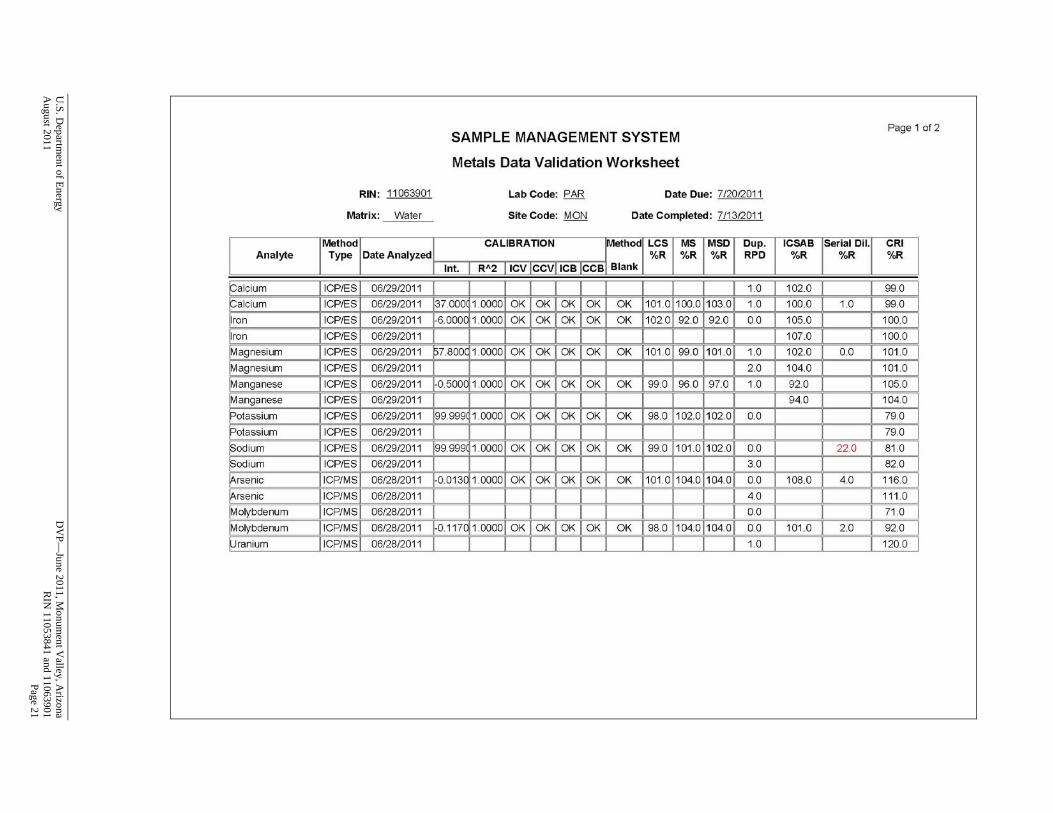
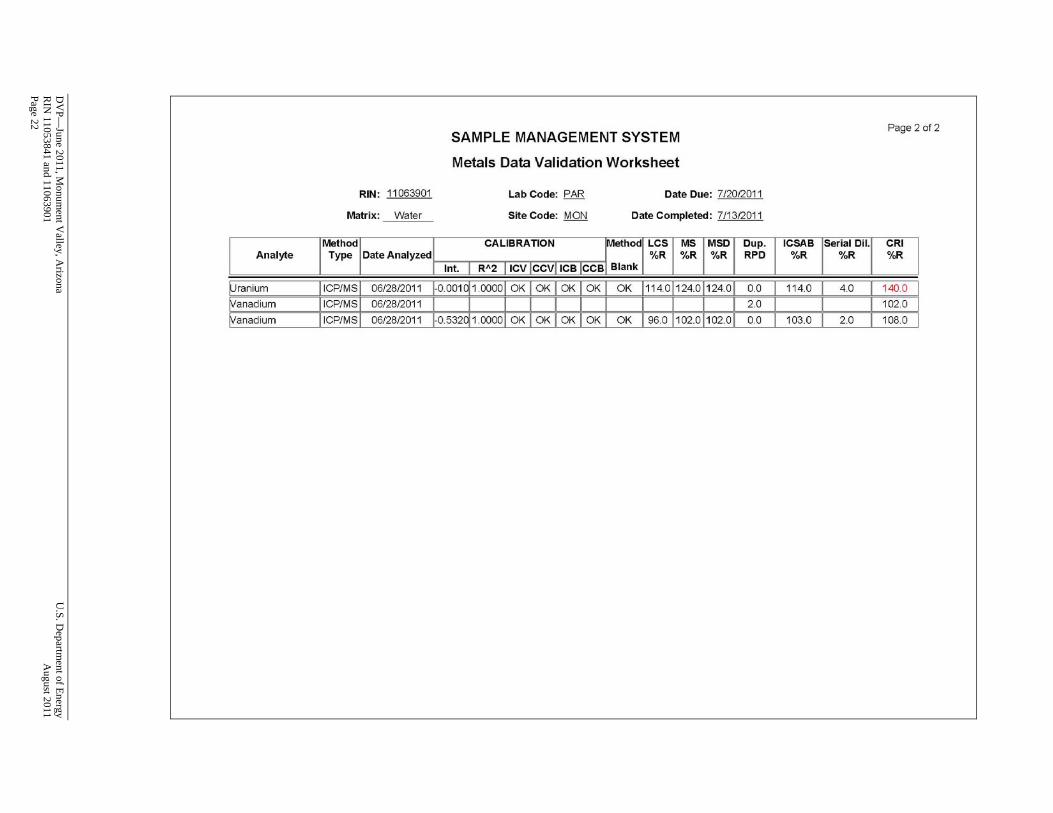
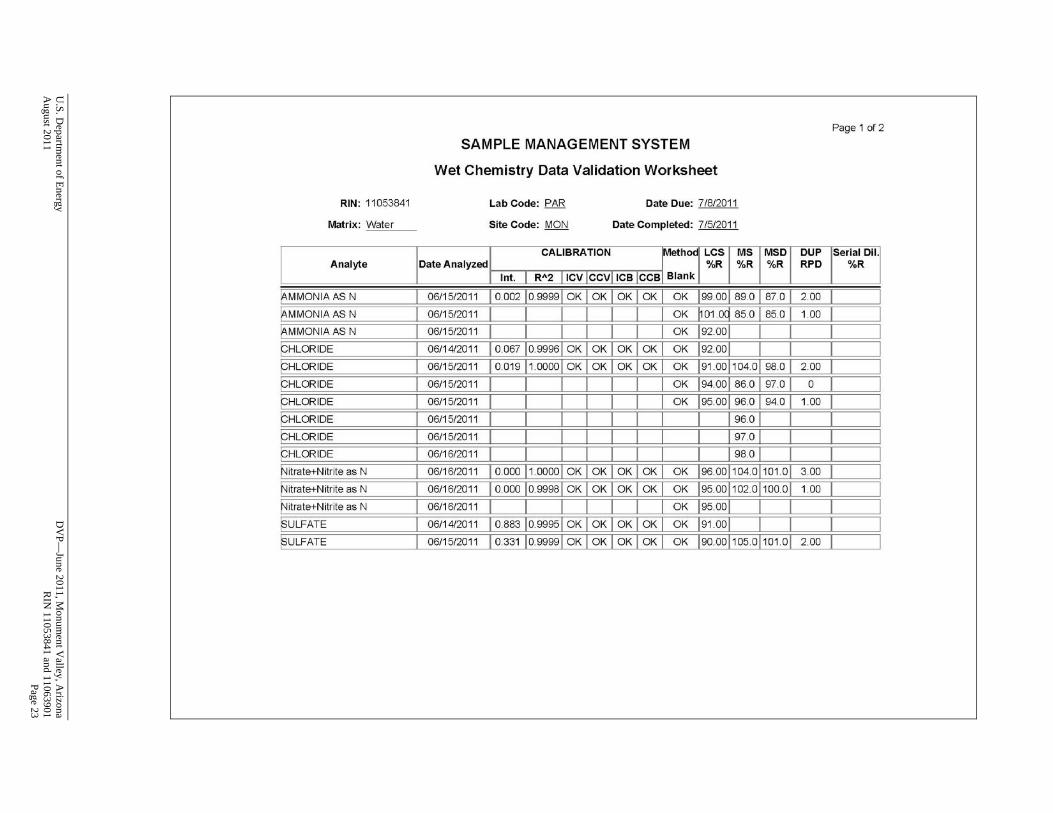
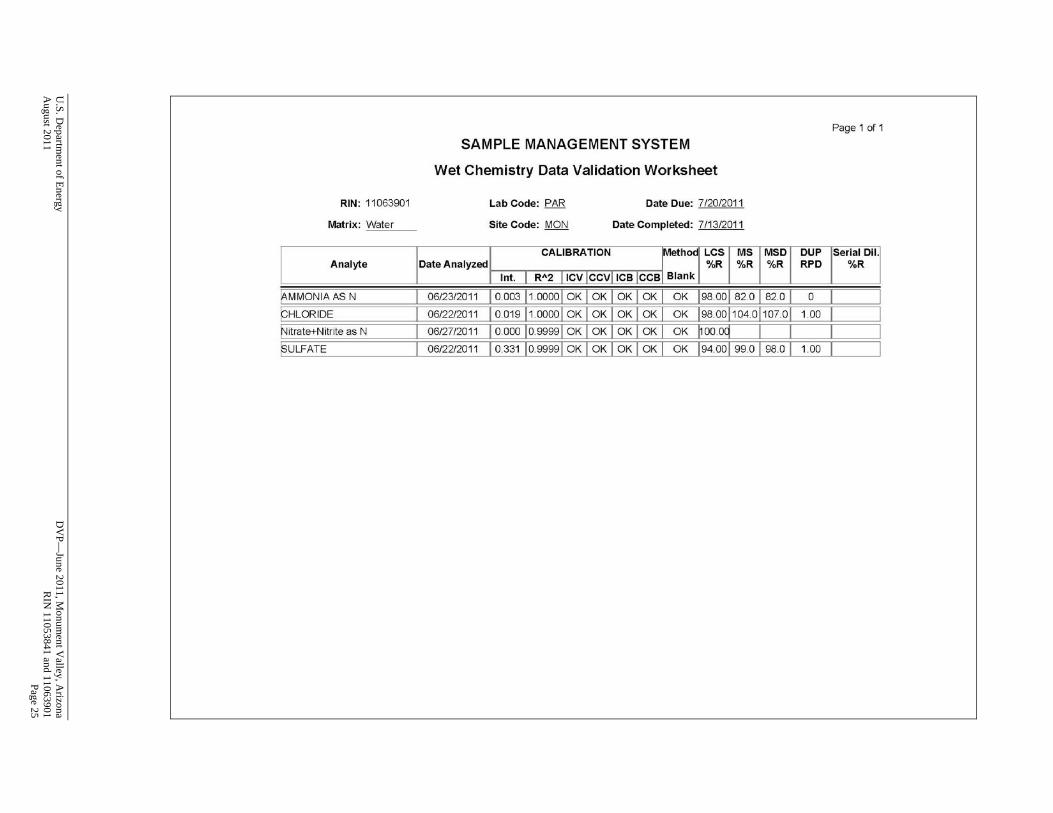
Laboratory Performance Assessment General Information
Report Numbers (RINs): 11053841 and 11063901 Sample Event: June 6–8 and 20, 2011 Site(s): Monument Valley, Arizona Laboratory: ALS Laboratory Group, Fort Collins, Colorado Work Order Nos.: 1106157 and 1106297 Analysis: Metals and Wet Chemistry Validator: Gretchen Baer Review Date: August 2, 2011
This validation was performed according to the Environmental Procedures Catalog, (LMS/PRO/S04325, continually updated) “Standard Practice for Validation of Laboratory Data.” The procedure was applied at Level 3, Data Validation. All analyses were successfully completed. The samples were prepared and analyzed using accepted procedures based on methods specified by line item code, which are listed in Table 3.
Table 3. Analytes and Methods
Analyte Line Item Code Prep Method Analytical MethodAmmonia as Nitrogen WCH-A-005 MCAWW 350.1 MCAWW 350.1 Calcium, Iron, Magnesium, Manganese, Potassium, Sodium LMM-01 SW-846 3005A SW-846 6010B
Chloride MIS-A-039 SW-856 9056 SW-856 9056 Nitrite + Nitrate as Nitrogen WCH-A-022 MCAWW 353.2 MCAWW 353.2 Sulfate MIS-A-044 SW-856 9056 SW-856 9056 Arsenic, Molybdenum, Uranium, Vanadium LMM-02 SW-846 3005A SW-846 6020A
Data Qualifier Summary Analytical results were qualified as listed in Table 4. Refer to the sections below for an explanation of the data qualifiers applied.
Table 4. Data Qualifier Summary
Sample Number Location Analyte Flag Reason
1106157-1 0402 Vanadium J Intercept greater than 3 times MDL 1106157-2 0602 Vanadium J Intercept greater than 3 times MDL 1106157-3 0603 Magnesium J Serial dilution failure 1106157-3 0603 Molybdenum J Serial dilution failure 1106157-5 0605 Vanadium J Intercept greater than 3 times MDL 1106157-6 0606 Vanadium J Intercept greater than 3 times MDL
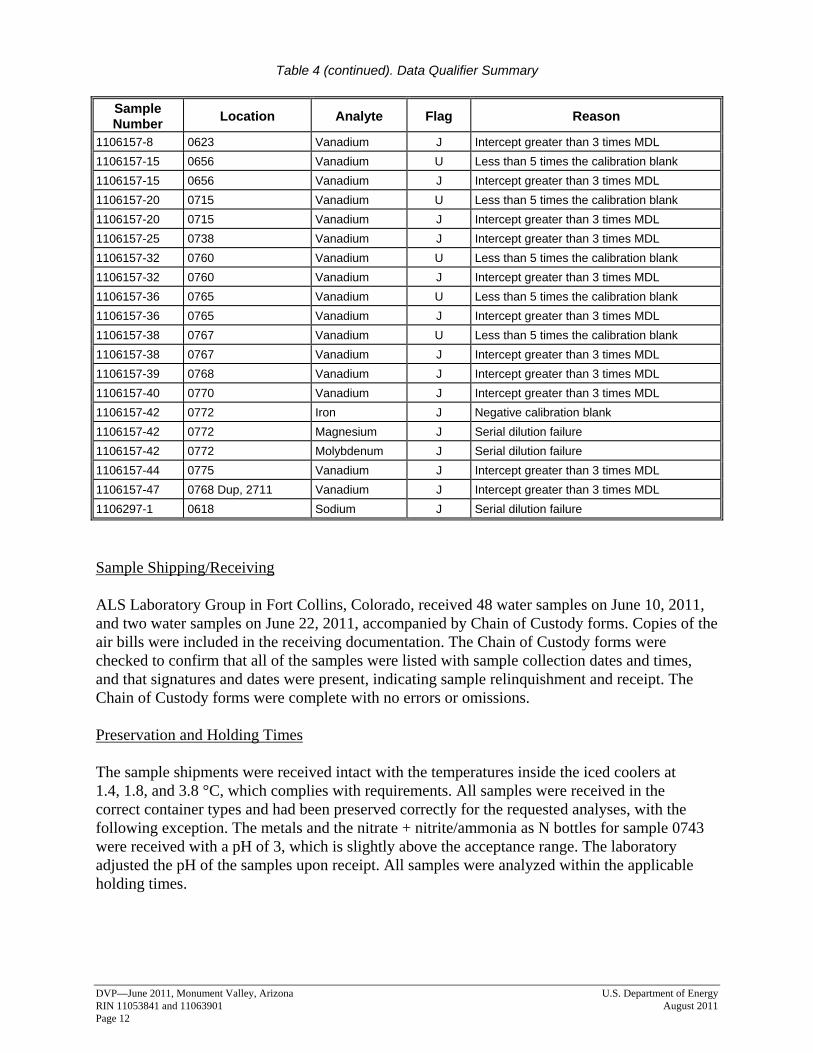
Table 4 (continued). Data Qualifier Summary
DVP—June 2011, Monument Valley, Arizona U.S. Department of Energy RIN 11053841 and 11063901 August 2011 Page 12
Sample Number Location Analyte Flag Reason
1106157-8 0623 Vanadium J Intercept greater than 3 times MDL 1106157-15 0656 Vanadium U Less than 5 times the calibration blank 1106157-15 0656 Vanadium J Intercept greater than 3 times MDL 1106157-20 0715 Vanadium U Less than 5 times the calibration blank 1106157-20 0715 Vanadium J Intercept greater than 3 times MDL 1106157-25 0738 Vanadium J Intercept greater than 3 times MDL 1106157-32 0760 Vanadium U Less than 5 times the calibration blank 1106157-32 0760 Vanadium J Intercept greater than 3 times MDL 1106157-36 0765 Vanadium U Less than 5 times the calibration blank 1106157-36 0765 Vanadium J Intercept greater than 3 times MDL 1106157-38 0767 Vanadium U Less than 5 times the calibration blank 1106157-38 0767 Vanadium J Intercept greater than 3 times MDL 1106157-39 0768 Vanadium J Intercept greater than 3 times MDL 1106157-40 0770 Vanadium J Intercept greater than 3 times MDL 1106157-42 0772 Iron J Negative calibration blank 1106157-42 0772 Magnesium J Serial dilution failure 1106157-42 0772 Molybdenum J Serial dilution failure 1106157-44 0775 Vanadium J Intercept greater than 3 times MDL 1106157-47 0768 Dup, 2711 Vanadium J Intercept greater than 3 times MDL 1106297-1 0618 Sodium J Serial dilution failure
Sample Shipping/Receiving ALS Laboratory Group in Fort Collins, Colorado, received 48 water samples on June 10, 2011, and two water samples on June 22, 2011, accompanied by Chain of Custody forms. Copies of the air bills were included in the receiving documentation. The Chain of Custody forms were checked to confirm that all of the samples were listed with sample collection dates and times, and that signatures and dates were present, indicating sample relinquishment and receipt. The Chain of Custody forms were complete with no errors or omissions. Preservation and Holding Times The sample shipments were received intact with the temperatures inside the iced coolers at 1.4, 1.8, and 3.8 °C, which complies with requirements. All samples were received in the correct container types and had been preserved correctly for the requested analyses, with the following exception. The metals and the nitrate + nitrite/ammonia as N bottles for sample 0743 were received with a pH of 3, which is slightly above the acceptance range. The laboratory adjusted the pH of the samples upon receipt. All samples were analyzed within the applicable holding times.
U.S. Department of Energy DVP—June 2011, Monument Valley, Arizona August 2011 RIN 11053841 and 11063901 Page 13
Laboratory Instrument Calibration Compliance requirements for satisfactory instrument calibration are established to ensure that the instrument is capable of producing acceptable qualitative and quantitative data for all analytes. Initial calibration demonstrates that the instrument is capable of acceptable performance in the beginning of the analytical run and of producing a linear curve. Compliance requirements for continuing calibration checks are established to ensure that the instrument continues to be capable of producing acceptable qualitative and quantitative data. All laboratory instrument calibrations were performed correctly in accordance with the cited methods. Method MCAWW 350.1, Ammonia as Nitrogen Calibrations were performed using six calibration standards on June 15 and 23, 2011. The calibration curve correlation coefficient values were greater than 0.995 and the absolute values of the intercepts were less than 3 times the method detection limit (MDL). Calibration and laboratory spike standards were prepared from independent sources. Initial and continuing calibration verification checks were made at the required frequency resulting in 14 verification checks. All calibration checks met the acceptance criteria. Method MCAWW 353.2, Nitrite + Nitrate as Nitrogen Calibrations were performed using seven calibration standards on June 16 and 27, 2011. The calibration curve correlation coefficient values were greater than 0.995 and the absolute values of the intercepts were less than 3 times the MDL. Calibration and laboratory spike standards were prepared from independent sources. Initial and continuing calibration verification checks were made at the required frequency resulting in nine verification checks. All calibration checks met the acceptance criteria. Method SW-846 6010, Calcium, Iron, Magnesium, Manganese, Potassium, Sodium Calibrations were performed on June 24 and 29, 2011, using three calibration standards. The correlation coefficient values were greater than 0.995. The absolute values of most intercepts were greater than 3 times the MDL. These intercepts were less than 3 times the reporting limits and all results were near or above the reporting limits. Calibration and laboratory spike standards were prepared from independent sources. Initial and continuing calibration verification checks were made at the required frequency resulting in 21 verification checks. All calibration checks met the acceptance criteria. Reporting limit verification checks were made at the required frequency to verify the linearity of the calibration curve near the practical quantitation limit (PQL) and all results were within the acceptance range. Method SW-846 6020A, Arsenic, Molybdenum, Uranium, Vanadium Calibrations were performed on June 27 and 28, 2011, using four standards. The calibration curve correlation coefficient values were greater than 0.995 and—with the exception of vanadium—the absolute values of the intercepts were less than 3 times the MDL. For vanadium, all associated detects less than 3 times the intercept are qualified with a “J” flag (estimated). (An intercept for molybdenum was only slightly higher than the MDL; the associated result was greater than 3 times the intercept). Calibration and laboratory spike standards were prepared
DVP—June 2011, Monument Valley, Arizona U.S. Department of Energy RIN 11053841 and 11063901 August 2011 Page 14
from independent sources. Initial and continuing calibration verification checks were made at the required frequency resulting in 18 verification checks. All calibration checks met the acceptance criteria. Reporting limit verification checks were made at the required frequency to verify the linearity of the calibration curve near the PQL and all results were within the acceptance range, with the following exceptions. A molybdenum and uranium check result was above the acceptance range. All affected results were greater than 5 times the PQL, so no qualification is necessary. Mass calibration and resolution verifications were performed at the beginning of each analytical run in accordance with the analytical procedure. Internal standard recoveries associated with requested analytes were stable and within acceptable ranges. Method SW-846 9056, Chloride, Sulfate Calibrations were performed using six calibration standards on June 14 and 15, 2011. The calibration curve correlation coefficient values were greater than 0.995 and the absolute values of the intercepts were less than 3 times the MDL. Calibration and laboratory spike standards were prepared from independent sources. Initial and continuing calibration verification checks were made at the required frequency resulting in 11 verification checks. All calibration checks met the acceptance criteria. Method and Calibration Blanks Method blanks are analyzed to assess any contamination that may have occurred during sample preparation. Calibration blanks are analyzed to assess instrument contamination prior to and during sample analysis. All method blank and calibration blank results were below the PQLs for all analytes. In cases where a blank concentration exceeds the MDL, the associated sample results are qualified with a “U” flag (not detected) when the sample result is greater than the MDL but less than 5 times the blank concentration. For some metals, some blanks were negative and the absolute values were greater than the MDL but less than the PQL. The associated results less than 5 times the MDL are qualified with a “J” flag as estimated values. Inductively Coupled Plasma Interference Check Sample Analysis Interference check samples were analyzed at the required frequency to verify the instrumental interelement and background correction factors. All check sample results met the acceptance criteria. Matrix Spike Analysis Matrix spike and matrix spike duplicate (MS/MSD) samples are used to measure method performance in the sample matrix. The MS/MSD data are not evaluated when the concentration of the unspiked sample is greater than 4 times the spike concentration. The spikes met the recovery and precision criteria for all analytes evaluated. At 81 percent, a MS recovery sulfate exceeded the laboratory’s acceptance criteria, but was within the ±25 percent requirement.
U.S. Department of Energy DVP—June 2011, Monument Valley, Arizona August 2011 RIN 11053841 and 11063901 Page 15
Laboratory Replicate Analysis Laboratory replicate analyses are used to determine laboratory precision for each sample matrix. The relative percent difference (RPD) for replicate results that are greater than 5 times the PQL should be less than 20 percent. For results that are less than the PQL, the range should be no greater than the PQL. The replicate results met these criteria, demonstrating acceptable laboratory precision. Laboratory Control Sample Laboratory control samples were analyzed at the correct frequency to provide information on the accuracy of the analytical method and the overall laboratory performance, including sample preparation. All control sample results were acceptable. Metals Serial Dilution Serial dilutions were prepared and analyzed for the metals analyses to monitor chemical or physical interferences in the sample matrix. Serial dilution data are evaluated when the concentration of the undiluted sample is greater than 50 times the PQL for method 6010 or greater than 100 times the PQL for method 6020. Some serial dilution results for magnesium, molybdenum, and sodium did not meet the acceptance criteria. Associated results are qualified with a “J” flag as estimated values. All other evaluated serial dilution data were acceptable. The laboratory flagged a manganese and a vanadium result for serial dilution failure, but the sample concentration was less than 50 times the PQL, so no further qualification is necessary. Detection Limits/Dilutions Samples were diluted in a consistent and acceptable manner when required. The required detection limits were met for all analytes. Completeness Results were reported in the correct units for all analytes requested using contract-required laboratory qualifiers. Chromatography Peak Integration The integration of analyte peaks was reviewed for all ion chromatography data. All peak integrations, including manual integrations, were satisfactory. Electronic Data Deliverable (EDD) File EDD files arrived on July 1 and 12, 2011. The data were loaded into SEEPro on July 27, 2011. The Sample Management System EDD validation module was used to verify that the EDD file was complete and in compliance with requirements. The module compares the contents of the file to the requested analyses to ensure that all and only the requested data are delivered. The contents of the EDD were manually examined to verify that the sample results accurately reflect the data contained in the sample data package.
DVP—June 2011, Monument Valley, Arizona U.S. Department of Energy RIN 11053841 and 11063901 August 2011 Page 16
U.S. Department of Energy DVP—June 2011, Monument Valley, Arizona August 2011 RIN 11053841 and 11063901 Page 17
DV
P—June 2011, M
onument V
alley, Arizona
U
.S. Departm
ent of Energy R
IN 11053841 and 11063901
A
ugust 2011 Page 18

U.S. D
epartment of Energy
D
VP—
June 2011, Monum
ent Valley, A
rizona A
ugust 2011
RIN
11053841 and 11063901
Page 19
DV
P—June 2011, M
onument V
alley, Arizona
U
.S. Departm
ent of Energy R
IN 11053841 and 11063901
A
ugust 2011 Page 20
U.S. D
epartment of Energy
D
VP—
June 2011, Monum
ent Valley, A
rizona A
ugust 2011
RIN
11053841 and 11063901
Page 21
DV
P—June 2011, M
onument V
alley, Arizona
U
.S. Departm
ent of Energy R
IN 11053841 and 11063901
A
ugust 2011 Page 22
U.S. D
epartment of Energy
D
VP—
June 2011, Monum
ent Valley, A
rizona A
ugust 2011
RIN
11053841 and 11063901
Page 23

DV
P—June 2011, M
onument V
alley, Arizona
U
.S. Departm
ent of Energy R
IN 11053841 and 11063901
A
ugust 2011 Page 24
U.S. D
epartment of Energy
D
VP—
June 2011, Monum
ent Valley, A
rizona A
ugust 2011
RIN
11053841 and 11063901
Page 25
DVP—June 2011, Monument Valley, Arizona U.S. Department of Energy RIN 11053841 and 11063901 August 2011 Page 26
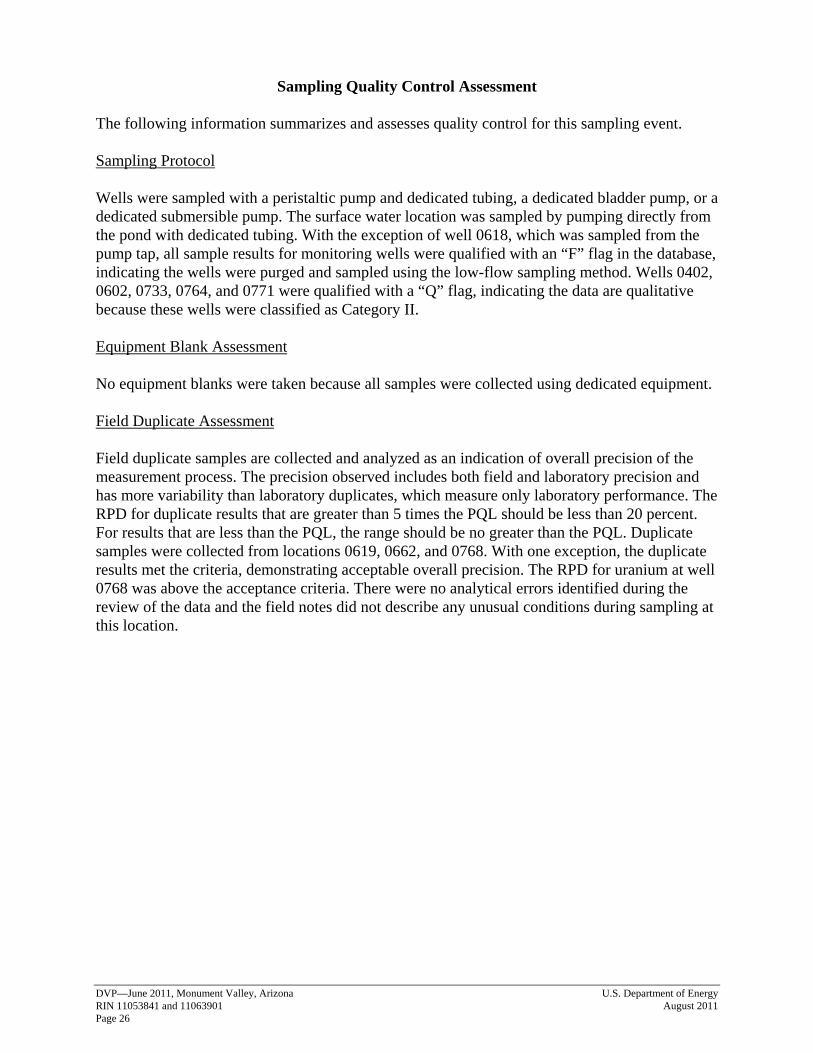
Sampling Quality Control Assessment The following information summarizes and assesses quality control for this sampling event. Sampling Protocol Wells were sampled with a peristaltic pump and dedicated tubing, a dedicated bladder pump, or a dedicated submersible pump. The surface water location was sampled by pumping directly from the pond with dedicated tubing. With the exception of well 0618, which was sampled from the pump tap, all sample results for monitoring wells were qualified with an “F” flag in the database, indicating the wells were purged and sampled using the low-flow sampling method. Wells 0402, 0602, 0733, 0764, and 0771 were qualified with a “Q” flag, indicating the data are qualitative because these wells were classified as Category II. Equipment Blank Assessment No equipment blanks were taken because all samples were collected using dedicated equipment. Field Duplicate Assessment Field duplicate samples are collected and analyzed as an indication of overall precision of the measurement process. The precision observed includes both field and laboratory precision and has more variability than laboratory duplicates, which measure only laboratory performance. The RPD for duplicate results that are greater than 5 times the PQL should be less than 20 percent. For results that are less than the PQL, the range should be no greater than the PQL. Duplicate samples were collected from locations 0619, 0662, and 0768. With one exception, the duplicate results met the criteria, demonstrating acceptable overall precision. The RPD for uranium at well 0768 was above the acceptance criteria. There were no analytical errors identified during the review of the data and the field notes did not describe any unusual conditions during sampling at this location.
U.S. Department of Energy DVP—June 2011, Monument Valley, Arizona August 2011 RIN 11053841 and 11063901 Page 27
Page 29
Attachment 1 Assessment of Anomalous Data

Page 30
This page intentionally left blank
Page 31
Potential Outliers Report

Page 32
This page intentionally left blank
Page 33
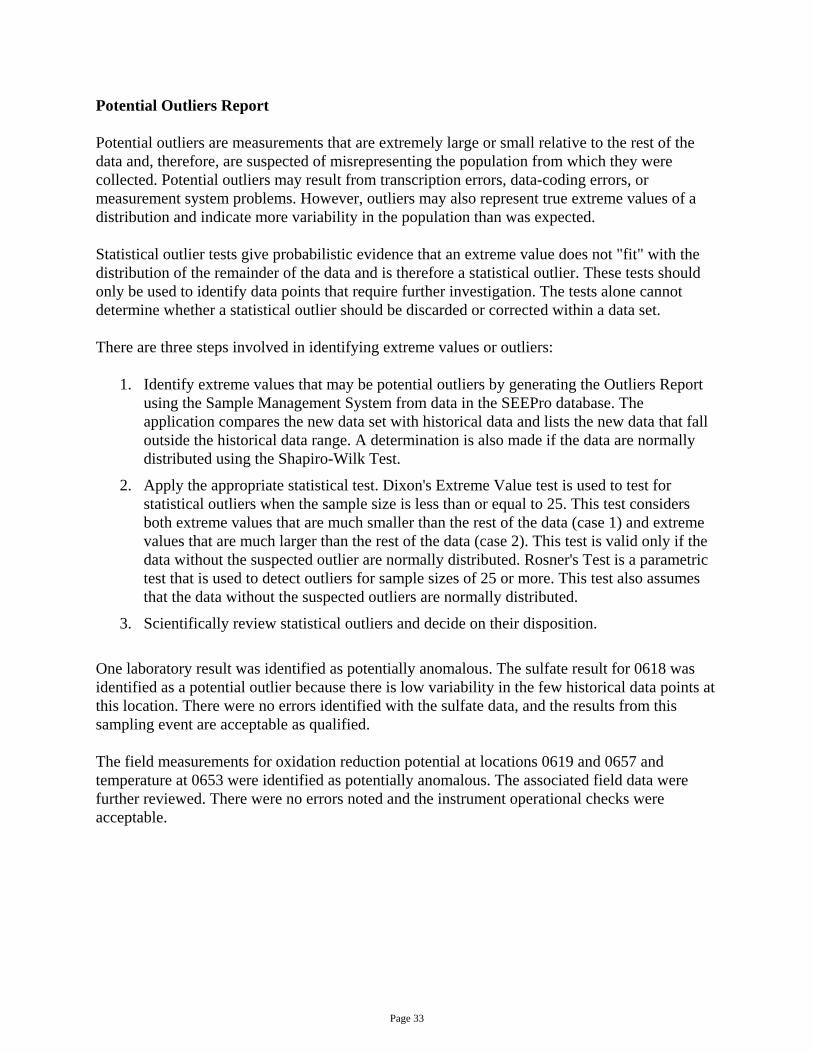
Potential Outliers Report Potential outliers are measurements that are extremely large or small relative to the rest of the data and, therefore, are suspected of misrepresenting the population from which they were collected. Potential outliers may result from transcription errors, data-coding errors, or measurement system problems. However, outliers may also represent true extreme values of a distribution and indicate more variability in the population than was expected. Statistical outlier tests give probabilistic evidence that an extreme value does not "fit" with the distribution of the remainder of the data and is therefore a statistical outlier. These tests should only be used to identify data points that require further investigation. The tests alone cannot determine whether a statistical outlier should be discarded or corrected within a data set. There are three steps involved in identifying extreme values or outliers:
1. Identify extreme values that may be potential outliers by generating the Outliers Report using the Sample Management System from data in the SEEPro database. The application compares the new data set with historical data and lists the new data that fall outside the historical data range. A determination is also made if the data are normally distributed using the Shapiro-Wilk Test.
2. Apply the appropriate statistical test. Dixon's Extreme Value test is used to test for statistical outliers when the sample size is less than or equal to 25. This test considers both extreme values that are much smaller than the rest of the data (case 1) and extreme values that are much larger than the rest of the data (case 2). This test is valid only if the data without the suspected outlier are normally distributed. Rosner's Test is a parametric test that is used to detect outliers for sample sizes of 25 or more. This test also assumes that the data without the suspected outliers are normally distributed.
3. Scientifically review statistical outliers and decide on their disposition.
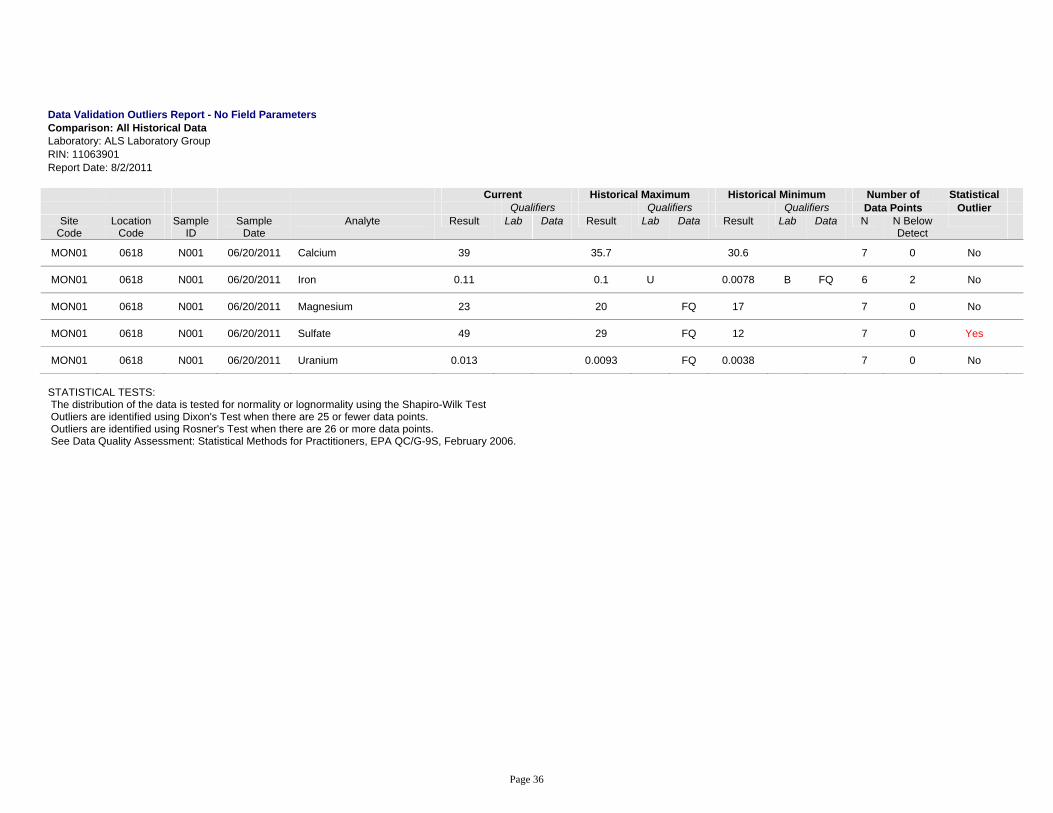
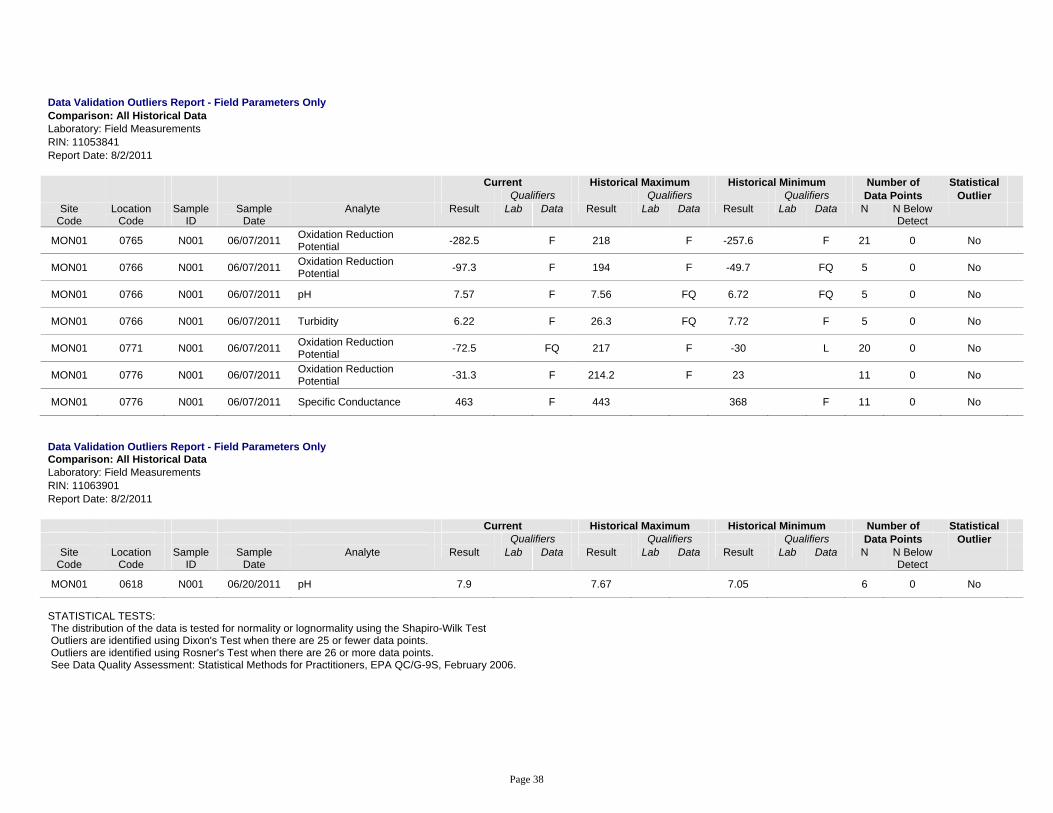
One laboratory result was identified as potentially anomalous. The sulfate result for 0618 was identified as a potential outlier because there is low variability in the few historical data points at this location. There were no errors identified with the sulfate data, and the results from this sampling event are acceptable as qualified. The field measurements for oxidation reduction potential at locations 0619 and 0657 and temperature at 0653 were identified as potentially anomalous. The associated field data were further reviewed. There were no errors noted and the instrument operational checks were acceptable.
Page 34
This page intentionally left blank

Page 35
Data Validation Outliers Report - No Field Parameters Comparison: All Historical Data Laboratory: ALS Laboratory Group RIN: 11053841 Report Date: 8/2/2011
Current Historical Maximum Historical Minimum Number of Statistical Qualifiers Qualifiers Qualifiers Data Points Outlier
Site Code
Location Code
Sample ID
Sample Date
Analyte Result Lab Data Result Lab Data Result Lab Data N N Below Detect
MON01 0402 0001 06/07/2011 Uranium 0.0000029 U FQ 0.001 U F 0.00001 B FQ 7 6 No
MON01 0603 N001 06/06/2011 Iron 0.16 F 0.12 J 0.0093 B F 10 6 No
MON01 0603 N001 06/06/2011 Magnesium 15 E JF 14.4 13 13 0 No
MON01 0605 N001 06/08/2011 Uranium 0.000062 F 0.032 0.000075 B UF 24 4 No
MON01 0606 N001 06/08/2011 Ammonia Total as N 110 F 140 F 113 FQ 12 0 No
MON01 0650 N001 06/06/2011 Chloride 16 F 14 F 6 GF 22 0 No
MON01 0650 N001 06/06/2011 Nitrate + Nitrite as Nitrogen 2.9 F 2.3 F 0.53 F 7 0 No
MON01 0650 N001 06/06/2011 Sulfate 250 F 190 F 25.5 F 22 0 No
MON01 0727 N001 06/06/2011 Nitrate + Nitrite as Nitrogen 0.82 F 0.91 F 0.83 F 5 0 No
MON01 0764 N001 06/07/2011 Nitrate + Nitrite as Nitrogen 36 FQ 55 FQ 39.8 FQ 12 0 No
MON01 0764 N001 06/07/2011 Sulfate 260 FQ 430 L 280 FQ 21 0 No
MON01 0765 0001 06/07/2011 Nitrate + Nitrite as Nitrogen 0.011 F 150 F 0.045 FQ 12 1 No
MON01 0765 0001 06/07/2011 Vanadium 0.001 UJF 0.015 U F 0.0011 JFQ 15 3 No
MON01 0772 N001 06/07/2011 Ammonia Total as N 2 F 7.9 F 2.28 F 14 0 No
MON01 0772 N001 06/07/2011 Potassium 0.64 B F 1.9 F 0.799 B F 7 0 No
MON01 0772 N001 06/07/2011 Sodium 93 F 232 94 JF 7 0 No
MON01 0772 N001 06/07/2011 Uranium 0.006 F 0.0387 0.0062 F 18 0 No
Page 36
Data Validation Outliers Report - No Field Parameters Comparison: All Historical Data Laboratory: ALS Laboratory Group RIN: 11063901 Report Date: 8/2/2011
Current Historical Maximum Historical Minimum Number of Statistical Qualifiers Qualifiers Qualifiers Data Points Outlier
Site Code
Location Code
Sample ID
Sample Date
Analyte Result Lab Data Result Lab Data Result Lab Data N N Below Detect
MON01 0618 N001 06/20/2011 Calcium 39 35.7 30.6 7 0 No
MON01 0618 N001 06/20/2011 Iron 0.11 0.1 U 0.0078 B FQ 6 2 No
MON01 0618 N001 06/20/2011 Magnesium 23 20 FQ 17 7 0 No
MON01 0618 N001 06/20/2011 Sulfate 49 29 FQ 12 7 0 Yes
MON01 0618 N001 06/20/2011 Uranium 0.013 0.0093 FQ 0.0038 7 0 No
STATISTICAL TESTS: The distribution of the data is tested for normality or lognormality using the Shapiro-Wilk Test Outliers are identified using Dixon's Test when there are 25 or fewer data points. Outliers are identified using Rosner's Test when there are 26 or more data points. See Data Quality Assessment: Statistical Methods for Practitioners, EPA QC/G-9S, February 2006.

Page 37
Data Validation Outliers Report - Field Parameters Only Comparison: All Historical Data Laboratory: Field Measurements RIN: 11053841 Report Date: 8/2/2011
Current Historical Maximum Historical Minimum Number of Statistical Qualifiers Qualifiers Qualifiers Data Points Outlier
Site Code
Location Code
Sample ID
Sample Date
Analyte Result Lab Data Result Lab Data Result Lab Data N N Below Detect
MON01 0402 N001 06/07/2011 Specific Conductance 620 FQ 618 FQ 358 F 9 0 No
MON01 0603 N001 06/06/2011 Specific Conductance 676 F 663 415 17 0 No
MON01 0603 N001 06/06/2011 Turbidity 8.9 F 6.7 F 0.51 8 0 No
MON01 0619 N001 06/07/2011 Oxidation Reduction Potential -18.9 F 447 36 F 24 0 Yes
MON01 0623 N001 06/07/2011 Oxidation Reduction Potential -50.6 438 13 12 0 No
MON01 0653 N001 06/07/2011 Temperature 20.45 F 18.7 14.9 F 33 0 Yes
MON01 0655 N001 06/07/2011 Oxidation Reduction Potential -73.1 F 460 -20 L 24 0 No
MON01 0657 N001 06/08/2011 Oxidation Reduction Potential 5.8 F 447 36 F 21 0 Yes
MON01 0669 N001 06/07/2011 Oxidation Reduction Potential -95.5 F 410 GF 8 L 23 0 No
MON01 0711 N001 06/06/2011 Specific Conductance 729 F 716 F 642 6 0 No
MON01 0715 N001 06/06/2011 Specific Conductance 585 F 548 F 493 F 6 0 No
MON01 0715 N001 06/06/2011 Temperature 16.82 F 16.11 F 14.79 F 5 0 No
MON01 0719 N001 06/06/2011 Specific Conductance 761 F 750 F 680 6 0 No
MON01 0727 N001 06/06/2011 Specific Conductance 622 F 604 F 575 F 6 0 No
MON01 0727 N001 06/06/2011 Temperature 18.07 F 16.91 F 15.84 F 5 0 No
MON01 0762 N001 06/07/2011 Specific Conductance 3930 F 3894 F 2010 21 0 No
MON01 0764 N001 06/07/2011 Oxidation Reduction Potential 30.6 FQ 227 L 37.2 FQ 21 0 No
Page 38
Data Validation Outliers Report - Field Parameters Only Comparison: All Historical Data Laboratory: Field Measurements RIN: 11053841 Report Date: 8/2/2011
Current Historical Maximum Historical Minimum Number of Statistical Qualifiers Qualifiers Qualifiers Data Points Outlier
Site Code
Location Code
Sample ID
Sample Date
Analyte Result Lab Data Result Lab Data Result Lab Data N N Below Detect
MON01 0765 N001 06/07/2011 Oxidation Reduction Potential -282.5 F 218 F -257.6 F 21 0 No
MON01 0766 N001 06/07/2011 Oxidation Reduction Potential -97.3 F 194 F -49.7 FQ 5 0 No
MON01 0766 N001 06/07/2011 pH 7.57 F 7.56 FQ 6.72 FQ 5 0 No
MON01 0766 N001 06/07/2011 Turbidity 6.22 F 26.3 FQ 7.72 F 5 0 No
MON01 0771 N001 06/07/2011 Oxidation Reduction Potential -72.5 FQ 217 F -30 L 20 0 No
MON01 0776 N001 06/07/2011 Oxidation Reduction Potential -31.3 F 214.2 F 23 11 0 No
MON01 0776 N001 06/07/2011 Specific Conductance 463 F 443 368 F 11 0 No
Data Validation Outliers Report - Field Parameters Only Comparison: All Historical Data Laboratory: Field Measurements RIN: 11063901 Report Date: 8/2/2011
Current Historical Maximum Historical Minimum Number of Statistical Qualifiers Qualifiers Qualifiers Data Points Outlier
Site Code
Location Code
Sample ID
Sample Date
Analyte Result Lab Data Result Lab Data Result Lab Data N N Below Detect
MON01 0618 N001 06/20/2011 pH 7.9 7.67 7.05 6 0 No
STATISTICAL TESTS: The distribution of the data is tested for normality or lognormality using the Shapiro-Wilk Test Outliers are identified using Dixon's Test when there are 25 or fewer data points. Outliers are identified using Rosner's Test when there are 26 or more data points. See Data Quality Assessment: Statistical Methods for Practitioners, EPA QC/G-9S, February 2006.
Page 39
Attachment 2 Data Presentation

Page 40
This page intentionally left blank
Page 41
Groundwater Quality Data

Page 42
This page intentionally left blank
Page 43
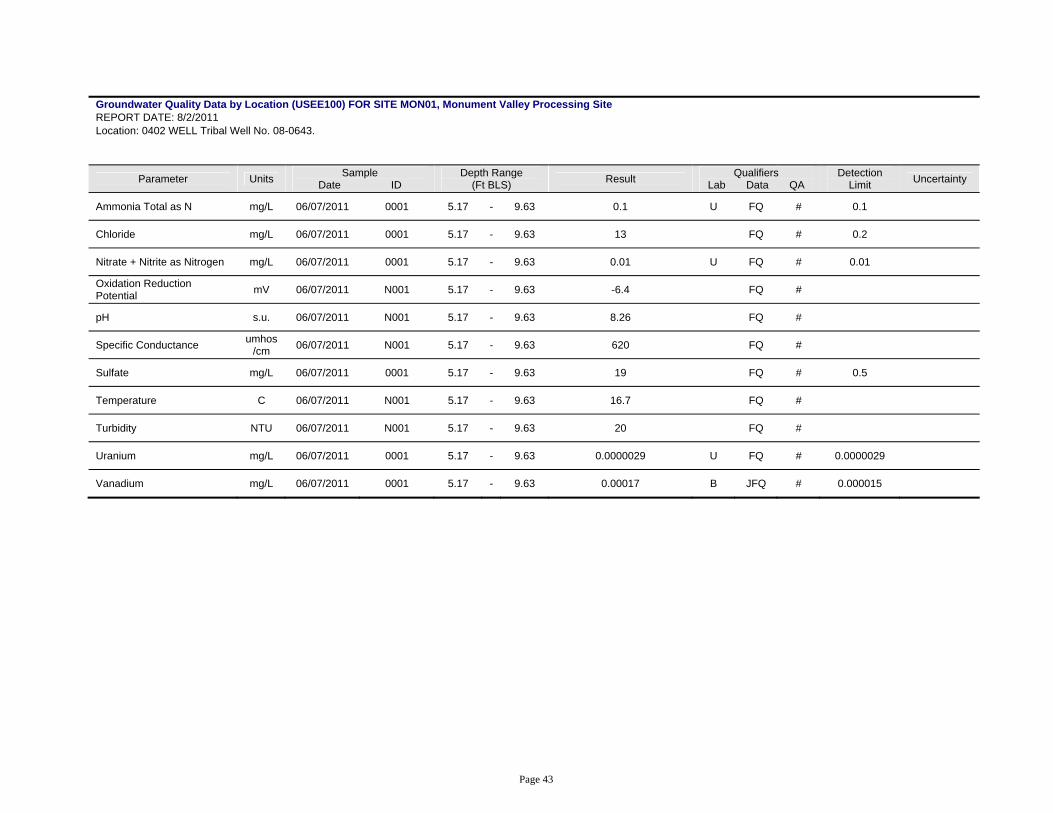
Groundwater Quality Data by Location (USEE100) FOR SITE MON01, Monument Valley Processing Site REPORT DATE: 8/2/2011 Location: 0402 WELL Tribal Well No. 08-0643.
Parameter Units Sample Date ID
Depth Range (Ft BLS) Result Qualifiers
Lab Data QA Detection
Limit Uncertainty
Ammonia Total as N mg/L 06/07/2011 0001 5.17 - 9.63 0.1 U FQ # 0.1
Chloride mg/L 06/07/2011 0001 5.17 - 9.63 13 FQ # 0.2
Nitrate + Nitrite as Nitrogen mg/L 06/07/2011 0001 5.17 - 9.63 0.01 U FQ # 0.01
Oxidation Reduction Potential mV 06/07/2011 N001 5.17 - 9.63 -6.4 FQ #
pH s.u. 06/07/2011 N001 5.17 - 9.63 8.26 FQ #
Specific Conductance umhos/cm 06/07/2011 N001 5.17 - 9.63 620 FQ #
Sulfate mg/L 06/07/2011 0001 5.17 - 9.63 19 FQ # 0.5
Temperature C 06/07/2011 N001 5.17 - 9.63 16.7 FQ #
Turbidity NTU 06/07/2011 N001 5.17 - 9.63 20 FQ #
Uranium mg/L 06/07/2011 0001 5.17 - 9.63 0.0000029 U FQ # 0.0000029
Vanadium mg/L 06/07/2011 0001 5.17 - 9.63 0.00017 B JFQ # 0.000015

Page 44
Groundwater Quality Data by Location (USEE100) FOR SITE MON01, Monument Valley Processing Site REPORT DATE: 8/2/2011 Location: 0602 WELL
Parameter Units Sample Date ID
Depth Range (Ft BLS) Result Qualifiers
Lab Data QA Detection
Limit Uncertainty
Ammonia Total as N mg/L 06/06/2011 N001 19.5 - 29.5 0.1 U FQ # 0.1
Chloride mg/L 06/06/2011 N001 19.5 - 29.5 14 FQ # 0.2
Nitrate + Nitrite as Nitrogen mg/L 06/06/2011 N001 19.5 - 29.5 0.76 FQ # 0.01
Oxidation Reduction Potential mV 06/06/2011 N001 19.5 - 29.5 89.1 FQ #
pH s.u. 06/06/2011 N001 19.5 - 29.5 7.76 FQ #
Specific Conductance umhos/cm 06/06/2011 N001 19.5 - 29.5 703 FQ #
Sulfate mg/L 06/06/2011 N001 19.5 - 29.5 110 FQ # 1
Temperature C 06/06/2011 N001 19.5 - 29.5 17.34 FQ #
Turbidity NTU 06/06/2011 N001 19.5 - 29.5 3 FQ #
Uranium mg/L 06/06/2011 N001 19.5 - 29.5 0.0036 FQ # 0.0000029
Vanadium mg/L 06/06/2011 N001 19.5 - 29.5 0.00088 JFQ # 0.000015
Page 45
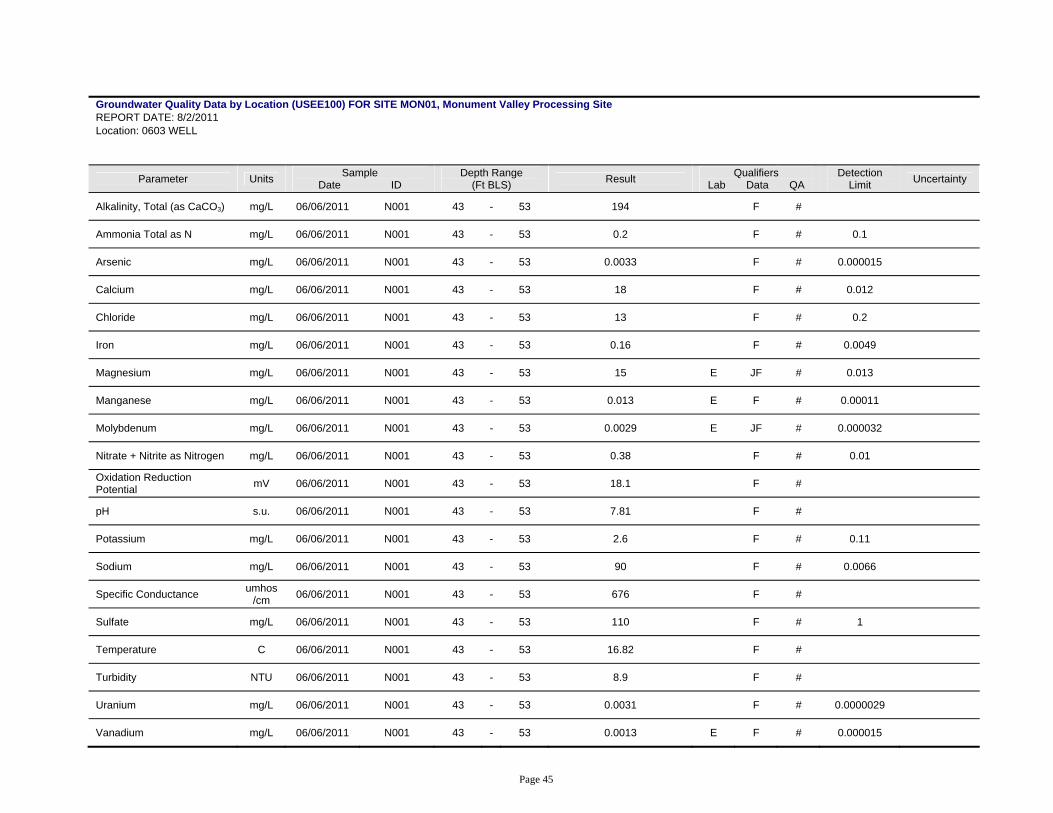
Groundwater Quality Data by Location (USEE100) FOR SITE MON01, Monument Valley Processing Site REPORT DATE: 8/2/2011 Location: 0603 WELL
Parameter Units Sample Date ID
Depth Range (Ft BLS) Result Qualifiers
Lab Data QA Detection
Limit Uncertainty
Alkalinity, Total (as CaCO3) mg/L 06/06/2011 N001 43 - 53 194 F #
Ammonia Total as N mg/L 06/06/2011 N001 43 - 53 0.2 F # 0.1
Arsenic mg/L 06/06/2011 N001 43 - 53 0.0033 F # 0.000015
Calcium mg/L 06/06/2011 N001 43 - 53 18 F # 0.012
Chloride mg/L 06/06/2011 N001 43 - 53 13 F # 0.2
Iron mg/L 06/06/2011 N001 43 - 53 0.16 F # 0.0049
Magnesium mg/L 06/06/2011 N001 43 - 53 15 E JF # 0.013
Manganese mg/L 06/06/2011 N001 43 - 53 0.013 E F # 0.00011
Molybdenum mg/L 06/06/2011 N001 43 - 53 0.0029 E JF # 0.000032
Nitrate + Nitrite as Nitrogen mg/L 06/06/2011 N001 43 - 53 0.38 F # 0.01
Oxidation Reduction Potential mV 06/06/2011 N001 43 - 53 18.1 F #
pH s.u. 06/06/2011 N001 43 - 53 7.81 F #
Potassium mg/L 06/06/2011 N001 43 - 53 2.6 F # 0.11
Sodium mg/L 06/06/2011 N001 43 - 53 90 F # 0.0066
Specific Conductance umhos/cm 06/06/2011 N001 43 - 53 676 F #
Sulfate mg/L 06/06/2011 N001 43 - 53 110 F # 1
Temperature C 06/06/2011 N001 43 - 53 16.82 F #
Turbidity NTU 06/06/2011 N001 43 - 53 8.9 F #
Uranium mg/L 06/06/2011 N001 43 - 53 0.0031 F # 0.0000029
Vanadium mg/L 06/06/2011 N001 43 - 53 0.0013 E F # 0.000015
Page 46
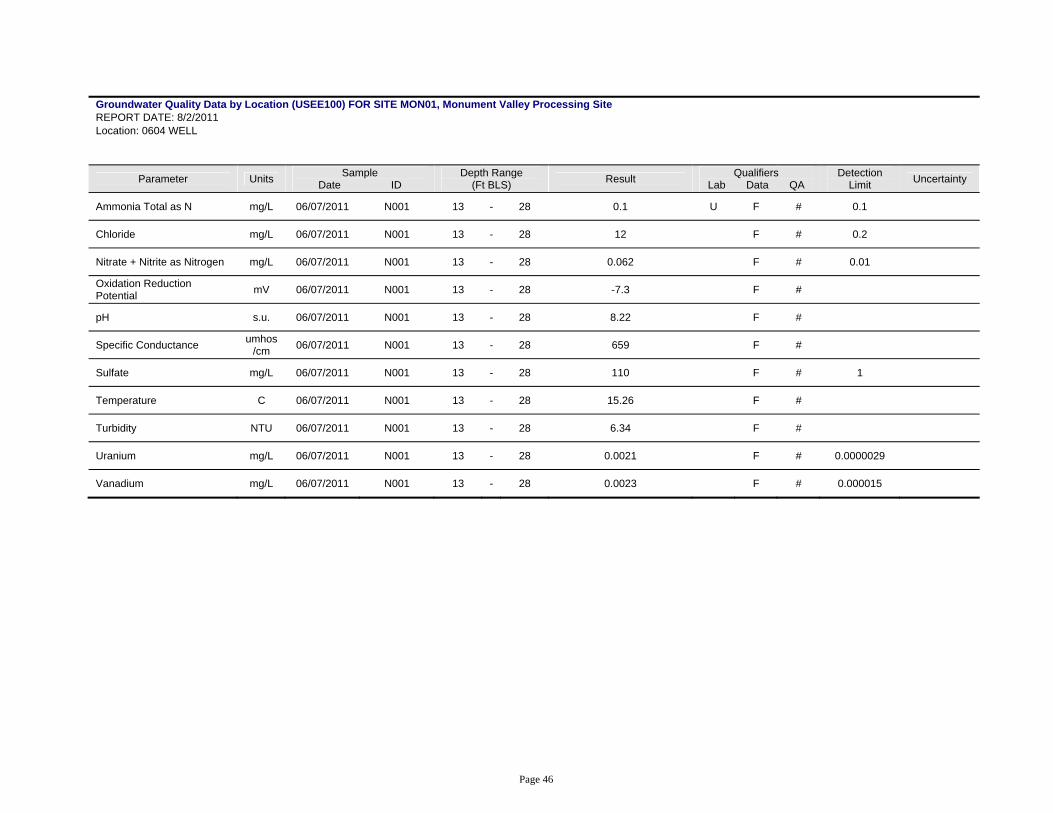
Groundwater Quality Data by Location (USEE100) FOR SITE MON01, Monument Valley Processing Site REPORT DATE: 8/2/2011 Location: 0604 WELL
Parameter Units Sample Date ID
Depth Range (Ft BLS) Result Qualifiers
Lab Data QA Detection
Limit Uncertainty
Ammonia Total as N mg/L 06/07/2011 N001 13 - 28 0.1 U F # 0.1
Chloride mg/L 06/07/2011 N001 13 - 28 12 F # 0.2
Nitrate + Nitrite as Nitrogen mg/L 06/07/2011 N001 13 - 28 0.062 F # 0.01
Oxidation Reduction Potential mV 06/07/2011 N001 13 - 28 -7.3 F #
pH s.u. 06/07/2011 N001 13 - 28 8.22 F #
Specific Conductance umhos/cm 06/07/2011 N001 13 - 28 659 F #
Sulfate mg/L 06/07/2011 N001 13 - 28 110 F # 1
Temperature C 06/07/2011 N001 13 - 28 15.26 F #
Turbidity NTU 06/07/2011 N001 13 - 28 6.34 F #
Uranium mg/L 06/07/2011 N001 13 - 28 0.0021 F # 0.0000029
Vanadium mg/L 06/07/2011 N001 13 - 28 0.0023 F # 0.000015

Page 47
Groundwater Quality Data by Location (USEE100) FOR SITE MON01, Monument Valley Processing Site REPORT DATE: 8/2/2011 Location: 0605 WELL
Parameter Units Sample Date ID
Depth Range (Ft BLS) Result Qualifiers
Lab Data QA Detection
Limit Uncertainty
Ammonia Total as N mg/L 06/08/2011 N001 14 - 29 0.41 F # 0.1
Chloride mg/L 06/08/2011 N001 14 - 29 19 F # 0.2
Nitrate + Nitrite as Nitrogen mg/L 06/08/2011 N001 14 - 29 0.01 U F # 0.01
Oxidation Reduction Potential mV 06/08/2011 N001 14 - 29 -81 F #
pH s.u. 06/08/2011 N001 14 - 29 8.08 F #
Specific Conductance umhos/cm 06/08/2011 N001 14 - 29 615 F #
Sulfate mg/L 06/08/2011 N001 14 - 29 120 F # 1
Temperature C 06/08/2011 N001 14 - 29 18.08 F #
Turbidity NTU 06/08/2011 N001 14 - 29 1.9 F #
Uranium mg/L 06/08/2011 N001 14 - 29 0.000062 F # 0.0000029
Vanadium mg/L 06/08/2011 N001 14 - 29 0.00035 JF # 0.000015
Page 48
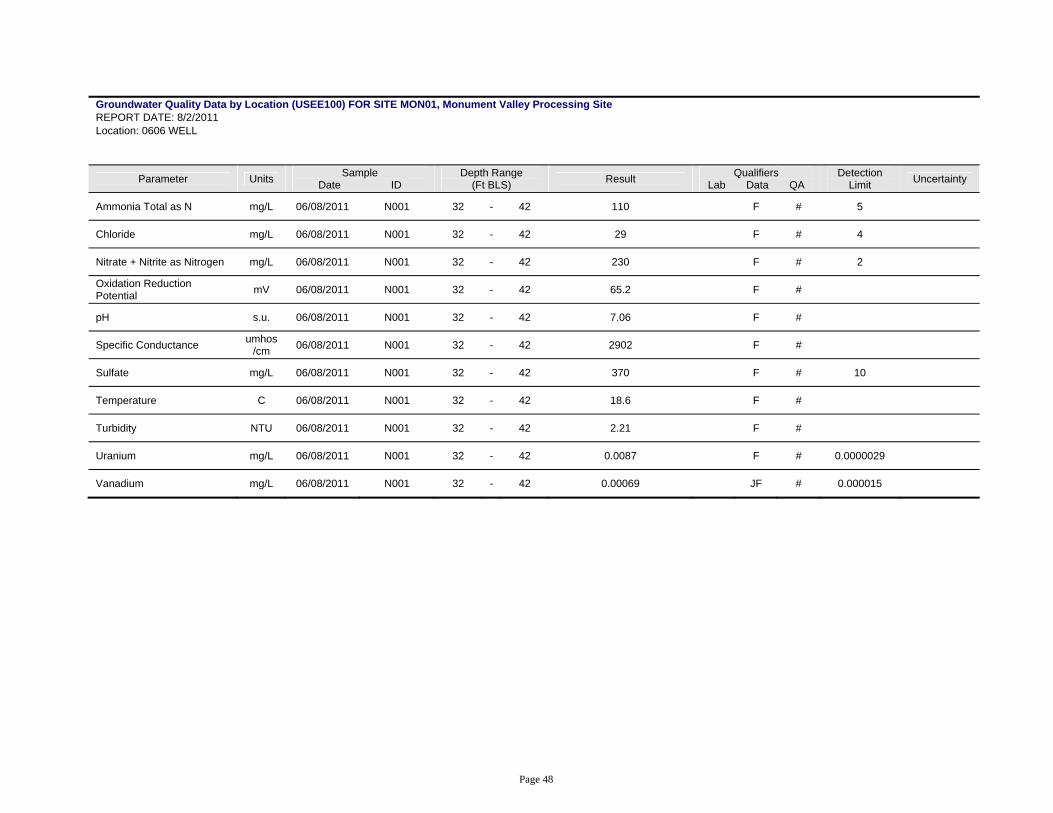
Groundwater Quality Data by Location (USEE100) FOR SITE MON01, Monument Valley Processing Site REPORT DATE: 8/2/2011 Location: 0606 WELL
Parameter Units Sample Date ID
Depth Range (Ft BLS) Result Qualifiers
Lab Data QA Detection
Limit Uncertainty
Ammonia Total as N mg/L 06/08/2011 N001 32 - 42 110 F # 5
Chloride mg/L 06/08/2011 N001 32 - 42 29 F # 4
Nitrate + Nitrite as Nitrogen mg/L 06/08/2011 N001 32 - 42 230 F # 2
Oxidation Reduction Potential mV 06/08/2011 N001 32 - 42 65.2 F #
pH s.u. 06/08/2011 N001 32 - 42 7.06 F #
Specific Conductance umhos/cm 06/08/2011 N001 32 - 42 2902 F #
Sulfate mg/L 06/08/2011 N001 32 - 42 370 F # 10
Temperature C 06/08/2011 N001 32 - 42 18.6 F #
Turbidity NTU 06/08/2011 N001 32 - 42 2.21 F #
Uranium mg/L 06/08/2011 N001 32 - 42 0.0087 F # 0.0000029
Vanadium mg/L 06/08/2011 N001 32 - 42 0.00069 JF # 0.000015

Page 49
Groundwater Quality Data by Location (USEE100) FOR SITE MON01, Monument Valley Processing Site REPORT DATE: 8/2/2011 Location: 0618 WELL 12" DIA Steel CSG. Old Mill Well??
Parameter Units Sample Date ID
Depth Range (Ft BLS) Result Qualifiers
Lab Data QA Detection
Limit Uncertainty
Alkalinity, Total (as CaCO3) mg/L 06/20/2011 N001 - 143 #
Ammonia Total as N mg/L 06/20/2011 N001 - 0.1 U # 0.1
Arsenic mg/L 06/20/2011 N001 - 0.0017 # 0.000015
Calcium mg/L 06/20/2011 N001 - 39 # 0.012
Chloride mg/L 06/20/2011 N001 - 3.9 # 0.2
Iron mg/L 06/20/2011 N001 - 0.11 # 0.0049
Magnesium mg/L 06/20/2011 N001 - 23 # 0.013
Manganese mg/L 06/20/2011 N001 - 0.0022 B # 0.00011
Molybdenum mg/L 06/20/2011 N001 - 0.0044 # 0.000032
Nitrate + Nitrite as Nitrogen mg/L 06/20/2011 N001 - 1.7 # 0.01
Oxidation Reduction Potential mV 06/20/2011 N001 - 164.1 #
pH s.u. 06/20/2011 N001 - 7.9 #
Potassium mg/L 06/20/2011 N001 - 1.4 # 0.11
Sodium mg/L 06/20/2011 N001 - 7.7 E J # 0.0066
Specific Conductance umhos/cm 06/20/2011 N001 - 382 #
Sulfate mg/L 06/20/2011 N001 - 49 # 0.5
Temperature C 06/20/2011 N001 - 19.37 #
Turbidity NTU 06/20/2011 N001 - 6.4 #
Uranium mg/L 06/20/2011 N001 - 0.013 # 0.0000029
Vanadium mg/L 06/20/2011 N001 - 0.066 # 0.000015

Page 50
Groundwater Quality Data by Location (USEE100) FOR SITE MON01, Monument Valley Processing Site REPORT DATE: 8/2/2011 Location: 0619 WELL Water Use Permit No. 92-082.
Parameter Units Sample Date ID
Depth Range (Ft BLS) Result Qualifiers
Lab Data QA Detection
Limit Uncertainty
Ammonia Total as N mg/L 06/07/2011 N001 103.9 - 153.9 0.1 U F # 0.1
Ammonia Total as N mg/L 06/07/2011 N002 103.9 - 153.9 0.1 U F # 0.1
Chloride mg/L 06/07/2011 N001 103.9 - 153.9 4.2 F # 0.2
Chloride mg/L 06/07/2011 N002 103.9 - 153.9 4.3 F # 0.2
Nitrate + Nitrite as Nitrogen mg/L 06/07/2011 N001 103.9 - 153.9 1.6 F # 0.01
Nitrate + Nitrite as Nitrogen mg/L 06/07/2011 N002 103.9 - 153.9 1.6 F # 0.01
Oxidation Reduction Potential mV 06/07/2011 N001 103.9 - 153.9 -18.9 F #
pH s.u. 06/07/2011 N001 103.9 - 153.9 7.78 F #
Specific Conductance umhos/cm 06/07/2011 N001 103.9 - 153.9 455 F #
Sulfate mg/L 06/07/2011 N001 103.9 - 153.9 41 F # 0.5
Sulfate mg/L 06/07/2011 N002 103.9 - 153.9 41 F # 0.5
Temperature C 06/07/2011 N001 103.9 - 153.9 17.85 F #
Turbidity NTU 06/07/2011 N001 103.9 - 153.9 0.83 F #
Uranium mg/L 06/07/2011 N001 103.9 - 153.9 0.028 F # 0.0000029
Uranium mg/L 06/07/2011 N002 103.9 - 153.9 0.027 F # 0.0000029
Vanadium mg/L 06/07/2011 N001 103.9 - 153.9 0.022 F # 0.000015
Vanadium mg/L 06/07/2011 N002 103.9 - 153.9 0.022 F # 0.000015

Page 51
Groundwater Quality Data by Location (USEE100) FOR SITE MON01, Monument Valley Processing Site REPORT DATE: 8/2/2011 Location: 0648 WELL
Parameter Units Sample Date ID
Depth Range (Ft BLS) Result Qualifiers
Lab Data QA Detection
Limit Uncertainty
Ammonia Total as N mg/L 06/07/2011 N001 38.5 - 88.5 3.4 F # 0.1
Chloride mg/L 06/07/2011 N001 38.5 - 88.5 26 F # 4
Nitrate + Nitrite as Nitrogen mg/L 06/07/2011 N001 38.5 - 88.5 69 F # 0.5
Oxidation Reduction Potential mV 06/07/2011 N001 38.5 - 88.5 91.9 F #
pH s.u. 06/07/2011 N001 38.5 - 88.5 7.33 F #
Specific Conductance umhos/cm 06/07/2011 N001 38.5 - 88.5 2488 F #
Sulfate mg/L 06/07/2011 N001 38.5 - 88.5 930 F # 10
Temperature C 06/07/2011 N001 38.5 - 88.5 17.92 F #
Turbidity NTU 06/07/2011 N001 38.5 - 88.5 1.1 F #
Uranium mg/L 06/07/2011 N001 38.5 - 88.5 0.01 F # 0.0000029
Vanadium mg/L 06/07/2011 N001 38.5 - 88.5 0.012 F # 0.000015

Page 52
Groundwater Quality Data by Location (USEE100) FOR SITE MON01, Monument Valley Processing Site REPORT DATE: 8/2/2011 Location: 0650 WELL
Parameter Units Sample Date ID
Depth Range (Ft BLS) Result Qualifiers
Lab Data QA Detection
Limit Uncertainty
Ammonia Total as N mg/L 06/06/2011 N001 77.5 - 97.5 0.1 U F # 0.1
Chloride mg/L 06/06/2011 N001 77.5 - 97.5 16 F # 0.4
Nitrate + Nitrite as Nitrogen mg/L 06/06/2011 N001 77.5 - 97.5 2.9 F # 0.05
Oxidation Reduction Potential mV 06/06/2011 N001 77.5 - 97.5 33.9 F #
pH s.u. 06/06/2011 N001 77.5 - 97.5 8.03 F #
Specific Conductance umhos/cm 06/06/2011 N001 77.5 - 97.5 925 F #
Sulfate mg/L 06/06/2011 N001 77.5 - 97.5 250 F # 2.5
Temperature C 06/06/2011 N001 77.5 - 97.5 17.67 F #
Turbidity NTU 06/06/2011 N001 77.5 - 97.5 1.35 F #
Uranium mg/L 06/06/2011 N001 77.5 - 97.5 0.0022 F # 0.0000029
Vanadium mg/L 06/06/2011 N001 77.5 - 97.5 0.0038 F # 0.000015

Page 53
Groundwater Quality Data by Location (USEE100) FOR SITE MON01, Monument Valley Processing Site REPORT DATE: 8/2/2011 Location: 0651 WELL
Parameter Units Sample Date ID
Depth Range (Ft BLS) Result Qualifiers
Lab Data QA Detection
Limit Uncertainty
Ammonia Total as N mg/L 06/07/2011 N001 20 - 80 0.1 U F # 0.1
Chloride mg/L 06/07/2011 N001 20 - 80 12 F # 0.2
Nitrate + Nitrite as Nitrogen mg/L 06/07/2011 N001 20 - 80 0.14 F # 0.01
Oxidation Reduction Potential mV 06/07/2011 N001 20 - 80 91.7 F #
pH s.u. 06/07/2011 N001 20 - 80 8.09 F #
Specific Conductance umhos/cm 06/07/2011 N001 20 - 80 649 F #
Sulfate mg/L 06/07/2011 N001 20 - 80 120 F # 1
Temperature C 06/07/2011 N001 20 - 80 17 F #
Turbidity NTU 06/07/2011 N001 20 - 80 9.33 F #
Uranium mg/L 06/07/2011 N001 20 - 80 0.0023 F # 0.0000029
Vanadium mg/L 06/07/2011 N001 20 - 80 0.012 F # 0.000015

Page 54
Groundwater Quality Data by Location (USEE100) FOR SITE MON01, Monument Valley Processing Site REPORT DATE: 8/2/2011 Location: 0652 WELL
Parameter Units Sample Date ID
Depth Range (Ft BLS) Result Qualifiers
Lab Data QA Detection
Limit Uncertainty
Ammonia Total as N mg/L 06/07/2011 N001 34 - 54 0.1 U F # 0.1
Chloride mg/L 06/07/2011 N001 34 - 54 14 F # 0.2
Nitrate + Nitrite as Nitrogen mg/L 06/07/2011 N001 34 - 54 4.4 F # 0.05
Oxidation Reduction Potential mV 06/07/2011 N001 34 - 54 82.2 F #
pH s.u. 06/07/2011 N001 34 - 54 7.78 F #
Specific Conductance umhos/cm 06/07/2011 N001 34 - 54 574 F #
Sulfate mg/L 06/07/2011 N001 34 - 54 65 F # 0.5
Temperature C 06/07/2011 N001 34 - 54 16.95 F #
Turbidity NTU 06/07/2011 N001 34 - 54 1.38 F #
Uranium mg/L 06/07/2011 N001 34 - 54 0.0044 F # 0.0000029
Vanadium mg/L 06/07/2011 N001 34 - 54 0.012 F # 0.000015

Page 55
Groundwater Quality Data by Location (USEE100) FOR SITE MON01, Monument Valley Processing Site REPORT DATE: 8/2/2011 Location: 0653 WELL
Parameter Units Sample Date ID
Depth Range (Ft BLS) Result Qualifiers
Lab Data QA Detection
Limit Uncertainty
Ammonia Total as N mg/L 06/07/2011 N001 56 - 76 0.1 U F # 0.1
Chloride mg/L 06/07/2011 N001 56 - 76 26 F # 4
Nitrate + Nitrite as Nitrogen mg/L 06/07/2011 N001 56 - 76 49 F # 0.5
Oxidation Reduction Potential mV 06/07/2011 N001 56 - 76 73.8 F #
pH s.u. 06/07/2011 N001 56 - 76 7.31 F #
Specific Conductance umhos/cm 06/07/2011 N001 56 - 76 2367 F #
Sulfate mg/L 06/07/2011 N001 56 - 76 960 F # 10
Temperature C 06/07/2011 N001 56 - 76 20.45 F #
Turbidity NTU 06/07/2011 N001 56 - 76 3.2 F #
Uranium mg/L 06/07/2011 N001 56 - 76 0.0099 F # 0.0000029
Vanadium mg/L 06/07/2011 N001 56 - 76 0.0084 F # 0.000015

Page 56
Groundwater Quality Data by Location (USEE100) FOR SITE MON01, Monument Valley Processing Site REPORT DATE: 8/2/2011 Location: 0655 WELL
Parameter Units Sample Date ID
Depth Range (Ft BLS) Result Qualifiers
Lab Data QA Detection
Limit Uncertainty
Ammonia Total as N mg/L 06/07/2011 N001 38 - 58 130 F # 5
Chloride mg/L 06/07/2011 N001 38 - 58 21 F # 4
Nitrate + Nitrite as Nitrogen mg/L 06/07/2011 N001 38 - 58 150 F # 1
Oxidation Reduction Potential mV 06/07/2011 N001 38 - 58 -73.1 F #
pH s.u. 06/07/2011 N001 38 - 58 7.19 F #
Specific Conductance umhos/cm 06/07/2011 N001 38 - 58 3447 F #
Sulfate mg/L 06/07/2011 N001 38 - 58 1100 F # 10
Temperature C 06/07/2011 N001 38 - 58 20.32 F #
Turbidity NTU 06/07/2011 N001 38 - 58 0.62 F #
Uranium mg/L 06/07/2011 N001 38 - 58 0.012 F # 0.0000029
Vanadium mg/L 06/07/2011 N001 38 - 58 0.0081 F # 0.000015

Page 57
Groundwater Quality Data by Location (USEE100) FOR SITE MON01, Monument Valley Processing Site REPORT DATE: 8/2/2011 Location: 0656 WELL
Parameter Units Sample Date ID
Depth Range (Ft BLS) Result Qualifiers
Lab Data QA Detection
Limit Uncertainty
Ammonia Total as N mg/L 06/08/2011 N001 38 - 58 44 F # 2
Chloride mg/L 06/08/2011 N001 38 - 58 14 F # 1
Nitrate + Nitrite as Nitrogen mg/L 06/08/2011 N001 38 - 58 15 F # 0.1
Oxidation Reduction Potential mV 06/08/2011 N001 38 - 58 129.5 F #
pH s.u. 06/08/2011 N001 38 - 58 7.66 F #
Specific Conductance umhos/cm 06/08/2011 N001 38 - 58 991 F #
Sulfate mg/L 06/08/2011 N001 38 - 58 150 F # 2.5
Temperature C 06/08/2011 N001 38 - 58 17.2 F #
Turbidity NTU 06/08/2011 N001 38 - 58 1.41 F #
Uranium mg/L 06/08/2011 N001 38 - 58 0.0053 F # 0.0000029
Vanadium mg/L 06/08/2011 N001 38 - 58 0.0008 UJF # 0.000015

Page 58
Groundwater Quality Data by Location (USEE100) FOR SITE MON01, Monument Valley Processing Site REPORT DATE: 8/2/2011 Location: 0657 WELL
Parameter Units Sample Date ID
Depth Range (Ft BLS) Result Qualifiers
Lab Data QA Detection
Limit Uncertainty
Ammonia Total as N mg/L 06/08/2011 N001 121 - 136 0.1 U F # 0.1
Chloride mg/L 06/08/2011 N001 121 - 136 5.7 F # 0.2
Nitrate + Nitrite as Nitrogen mg/L 06/08/2011 N001 121 - 136 3 F # 0.05
Oxidation Reduction Potential mV 06/08/2011 N001 121 - 136 5.8 F #
pH s.u. 06/08/2011 N001 121 - 136 7.78 F #
Specific Conductance umhos/cm 06/08/2011 N001 121 - 136 458 F #
Sulfate mg/L 06/08/2011 N001 121 - 136 36 F # 0.5
Temperature C 06/08/2011 N001 121 - 136 17.96 F #
Turbidity NTU 06/08/2011 N001 121 - 136 0.93 F #
Uranium mg/L 06/08/2011 N001 121 - 136 0.0053 F # 0.0000029
Vanadium mg/L 06/08/2011 N001 121 - 136 0.067 F # 0.000015
Page 59
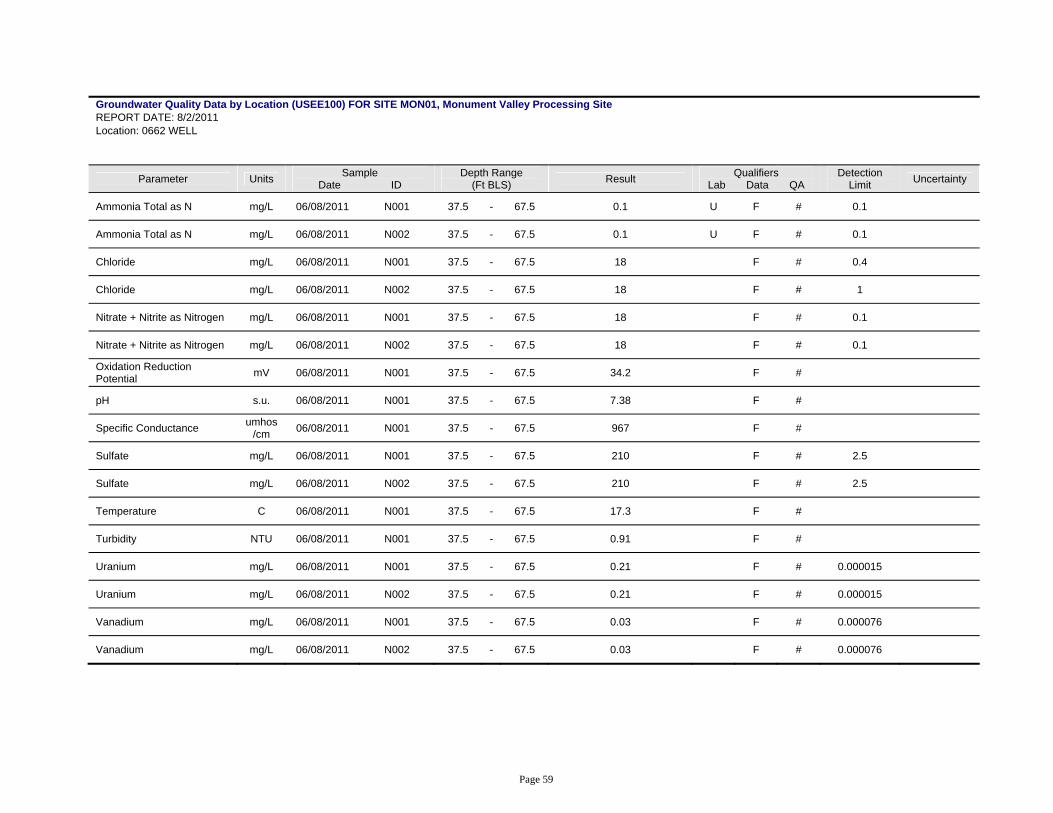
Groundwater Quality Data by Location (USEE100) FOR SITE MON01, Monument Valley Processing Site REPORT DATE: 8/2/2011 Location: 0662 WELL
Parameter Units Sample Date ID
Depth Range (Ft BLS) Result Qualifiers
Lab Data QA Detection
Limit Uncertainty
Ammonia Total as N mg/L 06/08/2011 N001 37.5 - 67.5 0.1 U F # 0.1
Ammonia Total as N mg/L 06/08/2011 N002 37.5 - 67.5 0.1 U F # 0.1
Chloride mg/L 06/08/2011 N001 37.5 - 67.5 18 F # 0.4
Chloride mg/L 06/08/2011 N002 37.5 - 67.5 18 F # 1
Nitrate + Nitrite as Nitrogen mg/L 06/08/2011 N001 37.5 - 67.5 18 F # 0.1
Nitrate + Nitrite as Nitrogen mg/L 06/08/2011 N002 37.5 - 67.5 18 F # 0.1
Oxidation Reduction Potential mV 06/08/2011 N001 37.5 - 67.5 34.2 F #
pH s.u. 06/08/2011 N001 37.5 - 67.5 7.38 F #
Specific Conductance umhos/cm 06/08/2011 N001 37.5 - 67.5 967 F #
Sulfate mg/L 06/08/2011 N001 37.5 - 67.5 210 F # 2.5
Sulfate mg/L 06/08/2011 N002 37.5 - 67.5 210 F # 2.5
Temperature C 06/08/2011 N001 37.5 - 67.5 17.3 F #
Turbidity NTU 06/08/2011 N001 37.5 - 67.5 0.91 F #
Uranium mg/L 06/08/2011 N001 37.5 - 67.5 0.21 F # 0.000015
Uranium mg/L 06/08/2011 N002 37.5 - 67.5 0.21 F # 0.000015
Vanadium mg/L 06/08/2011 N001 37.5 - 67.5 0.03 F # 0.000076
Vanadium mg/L 06/08/2011 N002 37.5 - 67.5 0.03 F # 0.000076

Page 60
Groundwater Quality Data by Location (USEE100) FOR SITE MON01, Monument Valley Processing Site REPORT DATE: 8/2/2011 Location: 0669 WELL
Parameter Units Sample Date ID
Depth Range (Ft BLS) Result Qualifiers
Lab Data QA Detection
Limit Uncertainty
Ammonia Total as N mg/L 06/07/2011 N001 34 - 54 3.3 F # 0.1
Chloride mg/L 06/07/2011 N001 34 - 54 7.8 F # 0.4
Nitrate + Nitrite as Nitrogen mg/L 06/07/2011 N001 34 - 54 15 F # 0.1
Oxidation Reduction Potential mV 06/07/2011 N001 34 - 54 -95.5 F #
pH s.u. 06/07/2011 N001 34 - 54 7.52 F #
Specific Conductance umhos/cm 06/07/2011 N001 34 - 54 779 F #
Sulfate mg/L 06/07/2011 N001 34 - 54 120 F # 1
Temperature C 06/07/2011 N001 34 - 54 19.16 F #
Turbidity NTU 06/07/2011 N001 34 - 54 0.63 F #
Uranium mg/L 06/07/2011 N001 34 - 54 0.0064 F # 0.0000029
Vanadium mg/L 06/07/2011 N001 34 - 54 0.053 F # 0.000015

Page 61
Groundwater Quality Data by Location (USEE100) FOR SITE MON01, Monument Valley Processing Site REPORT DATE: 8/2/2011 Location: 0711 WELL
Parameter Units Sample Date ID
Depth Range (Ft BLS) Result Qualifiers
Lab Data QA Detection
Limit Uncertainty
Ammonia Total as N mg/L 06/06/2011 N001 25.5 - 30.5 0.1 U F # 0.1
Chloride mg/L 06/06/2011 N001 25.5 - 30.5 14 F # 0.2
Nitrate + Nitrite as Nitrogen mg/L 06/06/2011 N001 25.5 - 30.5 0.57 F # 0.01
Oxidation Reduction Potential mV 06/06/2011 N001 25.5 - 30.5 95.5 F #
pH s.u. 06/06/2011 N001 25.5 - 30.5 7.78 F #
Specific Conductance umhos/cm 06/06/2011 N001 25.5 - 30.5 729 F #
Sulfate mg/L 06/06/2011 N001 25.5 - 30.5 120 F # 1
Temperature C 06/06/2011 N001 25.5 - 30.5 17.34 F #
Turbidity NTU 06/06/2011 N001 25.5 - 30.5 3.23 F #
Uranium mg/L 06/06/2011 N001 25.5 - 30.5 0.0038 F # 0.0000029
Vanadium mg/L 06/06/2011 N001 25.5 - 30.5 0.0015 F # 0.000015

Page 62
Groundwater Quality Data by Location (USEE100) FOR SITE MON01, Monument Valley Processing Site REPORT DATE: 8/2/2011 Location: 0715 WELL
Parameter Units Sample Date ID
Depth Range (Ft BLS) Result Qualifiers
Lab Data QA Detection
Limit Uncertainty
Ammonia Total as N mg/L 06/06/2011 N001 16 - 21 0.1 U F # 0.1
Chloride mg/L 06/06/2011 N001 16 - 21 10 F # 0.2
Nitrate + Nitrite as Nitrogen mg/L 06/06/2011 N001 16 - 21 0.73 F # 0.01
Oxidation Reduction Potential mV 06/06/2011 N001 16 - 21 103.6 F #
pH s.u. 06/06/2011 N001 16 - 21 7.8 F #
Specific Conductance umhos/cm 06/06/2011 N001 16 - 21 585 F #
Sulfate mg/L 06/06/2011 N001 16 - 21 73 F # 0.5
Temperature C 06/06/2011 N001 16 - 21 16.82 F #
Turbidity NTU 06/06/2011 N001 16 - 21 2.54 F #
Uranium mg/L 06/06/2011 N001 16 - 21 0.0029 F # 0.0000029
Vanadium mg/L 06/06/2011 N001 16 - 21 0.001 UJF # 0.000015

Page 63
Groundwater Quality Data by Location (USEE100) FOR SITE MON01, Monument Valley Processing Site REPORT DATE: 8/2/2011 Location: 0719 WELL
Parameter Units Sample Date ID
Depth Range (Ft BLS) Result Qualifiers
Lab Data QA Detection
Limit Uncertainty
Ammonia Total as N mg/L 06/06/2011 N001 19.35 - 24.35 0.1 U F # 0.1
Chloride mg/L 06/06/2011 N001 19.35 - 24.35 16 F # 0.4
Nitrate + Nitrite as Nitrogen mg/L 06/06/2011 N001 19.35 - 24.35 0.79 F # 0.01
Oxidation Reduction Potential mV 06/06/2011 N001 19.35 - 24.35 71.5 F #
pH s.u. 06/06/2011 N001 19.35 - 24.35 7.71 F #
Specific Conductance umhos/cm 06/06/2011 N001 19.35 - 24.35 761 F #
Sulfate mg/L 06/06/2011 N001 19.35 - 24.35 130 F # 1
Temperature C 06/06/2011 N001 19.35 - 24.35 16.98 F #
Turbidity NTU 06/06/2011 N001 19.35 - 24.35 1.84 F #
Uranium mg/L 06/06/2011 N001 19.35 - 24.35 0.0039 F # 0.0000029
Vanadium mg/L 06/06/2011 N001 19.35 - 24.35 0.0043 F # 0.000015

Page 64
Groundwater Quality Data by Location (USEE100) FOR SITE MON01, Monument Valley Processing Site REPORT DATE: 8/2/2011 Location: 0727 WELL
Parameter Units Sample Date ID
Depth Range (Ft BLS) Result Qualifiers
Lab Data QA Detection
Limit Uncertainty
Ammonia Total as N mg/L 06/06/2011 N001 23.73 - 28.78 0.1 U F # 0.1
Chloride mg/L 06/06/2011 N001 23.73 - 28.78 11 F # 0.2
Nitrate + Nitrite as Nitrogen mg/L 06/06/2011 N001 23.73 - 28.78 0.82 F # 0.01
Oxidation Reduction Potential mV 06/06/2011 N001 23.73 - 28.78 69.9 F #
pH s.u. 06/06/2011 N001 23.73 - 28.78 7.79 F #
Specific Conductance umhos/cm 06/06/2011 N001 23.73 - 28.78 622 F #
Sulfate mg/L 06/06/2011 N001 23.73 - 28.78 89 F # 0.5
Temperature C 06/06/2011 N001 23.73 - 28.78 18.07 F #
Turbidity NTU 06/06/2011 N001 23.73 - 28.78 9.08 F #
Uranium mg/L 06/06/2011 N001 23.73 - 28.78 0.002 F # 0.0000029
Vanadium mg/L 06/06/2011 N001 23.73 - 28.78 0.0028 F # 0.000015

Page 65
Groundwater Quality Data by Location (USEE100) FOR SITE MON01, Monument Valley Processing Site REPORT DATE: 8/2/2011 Location: 0733 WELL
Parameter Units Sample Date ID
Depth Range (Ft BLS) Result Qualifiers
Lab Data QA Detection
Limit Uncertainty
Ammonia Total as N mg/L 06/08/2011 0001 49 - 54 0.1 U FQ # 0.1
Chloride mg/L 06/08/2011 0001 49 - 54 5.3 FQ # 0.2
Nitrate + Nitrite as Nitrogen mg/L 06/08/2011 0001 49 - 54 4.4 FQ # 0.05
Oxidation Reduction Potential mV 06/08/2011 N001 49 - 54 49.2 FQ #
pH s.u. 06/08/2011 N001 49 - 54 7.51 FQ #
Specific Conductance umhos/cm 06/08/2011 N001 49 - 54 545 FQ #
Sulfate mg/L 06/08/2011 0001 49 - 54 76 FQ # 0.5
Temperature C 06/08/2011 N001 49 - 54 19.42 FQ #
Turbidity NTU 06/08/2011 N001 49 - 54 50.8 FQ #
Uranium mg/L 06/08/2011 0001 49 - 54 0.0053 FQ # 0.0000029
Vanadium mg/L 06/08/2011 0001 49 - 54 0.046 FQ # 0.000015

Page 66
Groundwater Quality Data by Location (USEE100) FOR SITE MON01, Monument Valley Processing Site REPORT DATE: 8/2/2011 Location: 0734 WELL
Parameter Units Sample Date ID
Depth Range (Ft BLS) Result Qualifiers
Lab Data QA Detection
Limit Uncertainty
Ammonia Total as N mg/L 06/08/2011 0001 50 - 80 0.1 U F # 0.1
Chloride mg/L 06/08/2011 0001 50 - 80 5.8 F # 0.2
Nitrate + Nitrite as Nitrogen mg/L 06/08/2011 0001 50 - 80 4.4 F # 0.05
Oxidation Reduction Potential mV 06/08/2011 N001 50 - 80 47.7 F #
pH s.u. 06/08/2011 N001 50 - 80 7.54 F #
Specific Conductance umhos/cm 06/08/2011 N001 50 - 80 601 F #
Sulfate mg/L 06/08/2011 0001 50 - 80 120 F # 1
Temperature C 06/08/2011 N001 50 - 80 17.87 F #
Turbidity NTU 06/08/2011 N001 50 - 80 62.3 F #
Uranium mg/L 06/08/2011 0001 50 - 80 0.07 F # 0.0000029
Vanadium mg/L 06/08/2011 0001 50 - 80 0.02 F # 0.000015
Page 67
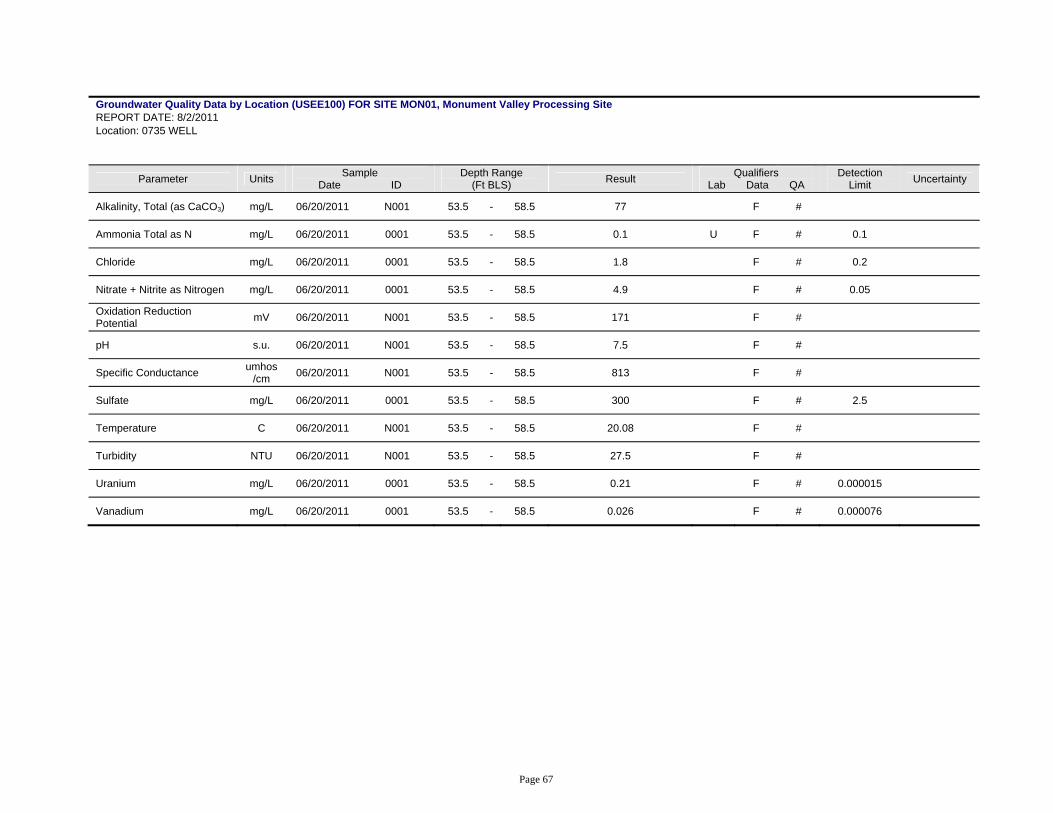
Groundwater Quality Data by Location (USEE100) FOR SITE MON01, Monument Valley Processing Site REPORT DATE: 8/2/2011 Location: 0735 WELL
Parameter Units Sample Date ID
Depth Range (Ft BLS) Result Qualifiers
Lab Data QA Detection
Limit Uncertainty
Alkalinity, Total (as CaCO3) mg/L 06/20/2011 N001 53.5 - 58.5 77 F #
Ammonia Total as N mg/L 06/20/2011 0001 53.5 - 58.5 0.1 U F # 0.1
Chloride mg/L 06/20/2011 0001 53.5 - 58.5 1.8 F # 0.2
Nitrate + Nitrite as Nitrogen mg/L 06/20/2011 0001 53.5 - 58.5 4.9 F # 0.05
Oxidation Reduction Potential mV 06/20/2011 N001 53.5 - 58.5 171 F #
pH s.u. 06/20/2011 N001 53.5 - 58.5 7.5 F #
Specific Conductance umhos/cm 06/20/2011 N001 53.5 - 58.5 813 F #
Sulfate mg/L 06/20/2011 0001 53.5 - 58.5 300 F # 2.5
Temperature C 06/20/2011 N001 53.5 - 58.5 20.08 F #
Turbidity NTU 06/20/2011 N001 53.5 - 58.5 27.5 F #
Uranium mg/L 06/20/2011 0001 53.5 - 58.5 0.21 F # 0.000015
Vanadium mg/L 06/20/2011 0001 53.5 - 58.5 0.026 F # 0.000076

Page 68
Groundwater Quality Data by Location (USEE100) FOR SITE MON01, Monument Valley Processing Site REPORT DATE: 8/2/2011 Location: 0738 WELL
Parameter Units Sample Date ID
Depth Range (Ft BLS) Result Qualifiers
Lab Data QA Detection
Limit Uncertainty
Ammonia Total as N mg/L 06/07/2011 0001 26 - 31 0.1 U F # 0.1
Chloride mg/L 06/07/2011 0001 26 - 31 17 F # 0.4
Nitrate + Nitrite as Nitrogen mg/L 06/07/2011 0001 26 - 31 0.01 U F # 0.01
Oxidation Reduction Potential mV 06/07/2011 N001 26 - 31 9.8 F #
pH s.u. 06/07/2011 N001 26 - 31 7.95 F #
Specific Conductance umhos/cm 06/07/2011 N001 26 - 31 737 F #
Sulfate mg/L 06/07/2011 0001 26 - 31 190 F # 1
Temperature C 06/07/2011 N001 26 - 31 17.85 F #
Turbidity NTU 06/07/2011 N001 26 - 31 20.7 F #
Uranium mg/L 06/07/2011 0001 26 - 31 0.00032 F # 0.0000029
Vanadium mg/L 06/07/2011 0001 26 - 31 0.00075 JF # 0.000015

Page 69
Groundwater Quality Data by Location (USEE100) FOR SITE MON01, Monument Valley Processing Site REPORT DATE: 8/2/2011 Location: 0739 WELL
Parameter Units Sample Date ID
Depth Range (Ft BLS) Result Qualifiers
Lab Data QA Detection
Limit Uncertainty
Ammonia Total as N mg/L 06/06/2011 0001 33 - 38 0.28 F # 0.1
Chloride mg/L 06/06/2011 0001 33 - 38 20 F # 0.4
Nitrate + Nitrite as Nitrogen mg/L 06/06/2011 0001 33 - 38 1.4 F # 0.01
Oxidation Reduction Potential mV 06/06/2011 N001 33 - 38 -3.4 F #
pH s.u. 06/06/2011 N001 33 - 38 7.9 F #
Specific Conductance umhos/cm 06/06/2011 N001 33 - 38 912 F #
Sulfate mg/L 06/06/2011 0001 33 - 38 220 F # 2.5
Temperature C 06/06/2011 N001 33 - 38 18.8 F #
Turbidity NTU 06/06/2011 N001 33 - 38 95.6 F #
Uranium mg/L 06/06/2011 0001 33 - 38 0.004 F # 0.0000029
Vanadium mg/L 06/06/2011 0001 33 - 38 0.0093 F # 0.000015
Page 70
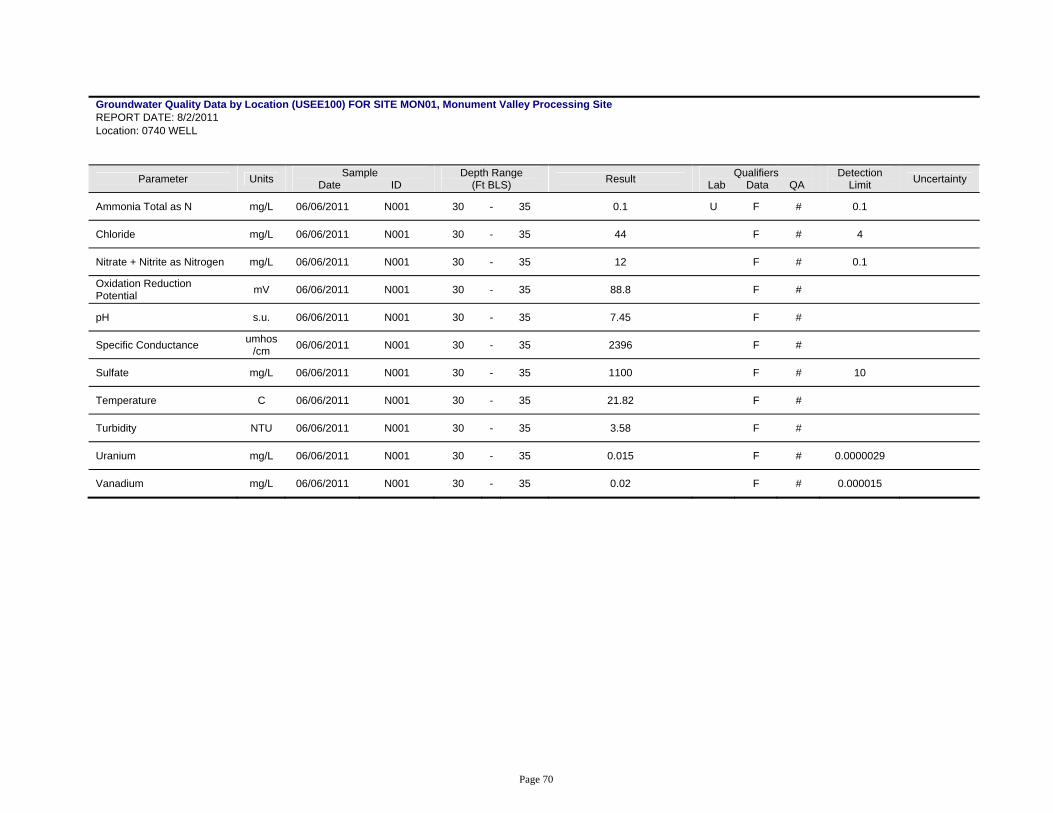
Groundwater Quality Data by Location (USEE100) FOR SITE MON01, Monument Valley Processing Site REPORT DATE: 8/2/2011 Location: 0740 WELL
Parameter Units Sample Date ID
Depth Range (Ft BLS) Result Qualifiers
Lab Data QA Detection
Limit Uncertainty
Ammonia Total as N mg/L 06/06/2011 N001 30 - 35 0.1 U F # 0.1
Chloride mg/L 06/06/2011 N001 30 - 35 44 F # 4
Nitrate + Nitrite as Nitrogen mg/L 06/06/2011 N001 30 - 35 12 F # 0.1
Oxidation Reduction Potential mV 06/06/2011 N001 30 - 35 88.8 F #
pH s.u. 06/06/2011 N001 30 - 35 7.45 F #
Specific Conductance umhos/cm 06/06/2011 N001 30 - 35 2396 F #
Sulfate mg/L 06/06/2011 N001 30 - 35 1100 F # 10
Temperature C 06/06/2011 N001 30 - 35 21.82 F #
Turbidity NTU 06/06/2011 N001 30 - 35 3.58 F #
Uranium mg/L 06/06/2011 N001 30 - 35 0.015 F # 0.0000029
Vanadium mg/L 06/06/2011 N001 30 - 35 0.02 F # 0.000015

Page 71
Groundwater Quality Data by Location (USEE100) FOR SITE MON01, Monument Valley Processing Site REPORT DATE: 8/2/2011 Location: 0741 WELL
Parameter Units Sample Date ID
Depth Range (Ft BLS) Result Qualifiers
Lab Data QA Detection
Limit Uncertainty
Ammonia Total as N mg/L 06/07/2011 0001 50 - 80 120 F # 5
Chloride mg/L 06/07/2011 0001 50 - 80 16 F # 4
Nitrate + Nitrite as Nitrogen mg/L 06/07/2011 0001 50 - 80 98 F # 1
Oxidation Reduction Potential mV 06/07/2011 N001 50 - 80 -113 F #
pH s.u. 06/07/2011 N001 50 - 80 7.41 F #
Specific Conductance umhos/cm 06/07/2011 N001 50 - 80 2364 F #
Sulfate mg/L 06/07/2011 0001 50 - 80 510 F # 10
Temperature C 06/07/2011 N001 50 - 80 18.65 F #
Turbidity NTU 06/07/2011 N001 50 - 80 17.9 F #
Uranium mg/L 06/07/2011 0001 50 - 80 0.01 F # 0.0000029
Vanadium mg/L 06/07/2011 0001 50 - 80 0.0073 F # 0.000015

Page 72
Groundwater Quality Data by Location (USEE100) FOR SITE MON01, Monument Valley Processing Site REPORT DATE: 8/2/2011 Location: 0742 WELL
Parameter Units Sample Date ID
Depth Range (Ft BLS) Result Qualifiers
Lab Data QA Detection
Limit Uncertainty
Ammonia Total as N mg/L 06/07/2011 N001 50 - 80 130 F # 5
Chloride mg/L 06/07/2011 N001 50 - 80 18 F # 4
Nitrate + Nitrite as Nitrogen mg/L 06/07/2011 N001 50 - 80 120 F # 1
Oxidation Reduction Potential mV 06/07/2011 N001 50 - 80 -104.5 F #
pH s.u. 06/07/2011 N001 50 - 80 7.35 F #
Specific Conductance umhos/cm 06/07/2011 N001 50 - 80 2484 F #
Sulfate mg/L 06/07/2011 N001 50 - 80 560 F # 10
Temperature C 06/07/2011 N001 50 - 80 19.82 F #
Turbidity NTU 06/07/2011 N001 50 - 80 2.65 F #
Uranium mg/L 06/07/2011 N001 50 - 80 0.0091 F # 0.0000029
Vanadium mg/L 06/07/2011 N001 50 - 80 0.008 F # 0.000015

Page 73
Groundwater Quality Data by Location (USEE100) FOR SITE MON01, Monument Valley Processing Site REPORT DATE: 8/2/2011 Location: 0743 WELL
Parameter Units Sample Date ID
Depth Range (Ft BLS) Result Qualifiers
Lab Data QA Detection
Limit Uncertainty
Ammonia Total as N mg/L 06/07/2011 N001 45 - 75 140 F # 5
Chloride mg/L 06/07/2011 N001 45 - 75 14 F # 1
Nitrate + Nitrite as Nitrogen mg/L 06/07/2011 N001 45 - 75 0.012 F # 0.01
Oxidation Reduction Potential mV 06/07/2011 N001 45 - 75 -278.9 F #
pH s.u. 06/07/2011 N001 45 - 75 6.78 F #
Specific Conductance umhos/cm 06/07/2011 N001 45 - 75 5274 F #
Sulfate mg/L 06/07/2011 N001 45 - 75 7.8 F # 2.5
Temperature C 06/07/2011 N001 45 - 75 18.84 F #
Turbidity NTU 06/07/2011 N001 45 - 75 8.35 F #
Uranium mg/L 06/07/2011 N001 45 - 75 0.00035 F # 0.0000029
Vanadium mg/L 06/07/2011 N001 45 - 75 0.0017 F # 0.000015

Page 74
Groundwater Quality Data by Location (USEE100) FOR SITE MON01, Monument Valley Processing Site REPORT DATE: 8/2/2011 Location: 0744 WELL
Parameter Units Sample Date ID
Depth Range (Ft BLS) Result Qualifiers
Lab Data QA Detection
Limit Uncertainty
Ammonia Total as N mg/L 06/07/2011 N001 31 - 61 140 F # 5
Chloride mg/L 06/07/2011 N001 31 - 61 16 F # 4
Nitrate + Nitrite as Nitrogen mg/L 06/07/2011 N001 31 - 61 150 F # 1
Oxidation Reduction Potential mV 06/07/2011 N001 31 - 61 -155.1 F #
pH s.u. 06/07/2011 N001 31 - 61 7.34 F #
Specific Conductance umhos/cm 06/07/2011 N001 31 - 61 2607 F #
Sulfate mg/L 06/07/2011 N001 31 - 61 470 F # 10
Temperature C 06/07/2011 N001 31 - 61 18.76 F #
Turbidity NTU 06/07/2011 N001 31 - 61 2.51 F #
Uranium mg/L 06/07/2011 N001 31 - 61 0.01 F # 0.0000029
Vanadium mg/L 06/07/2011 N001 31 - 61 0.0072 F # 0.000015
Page 75
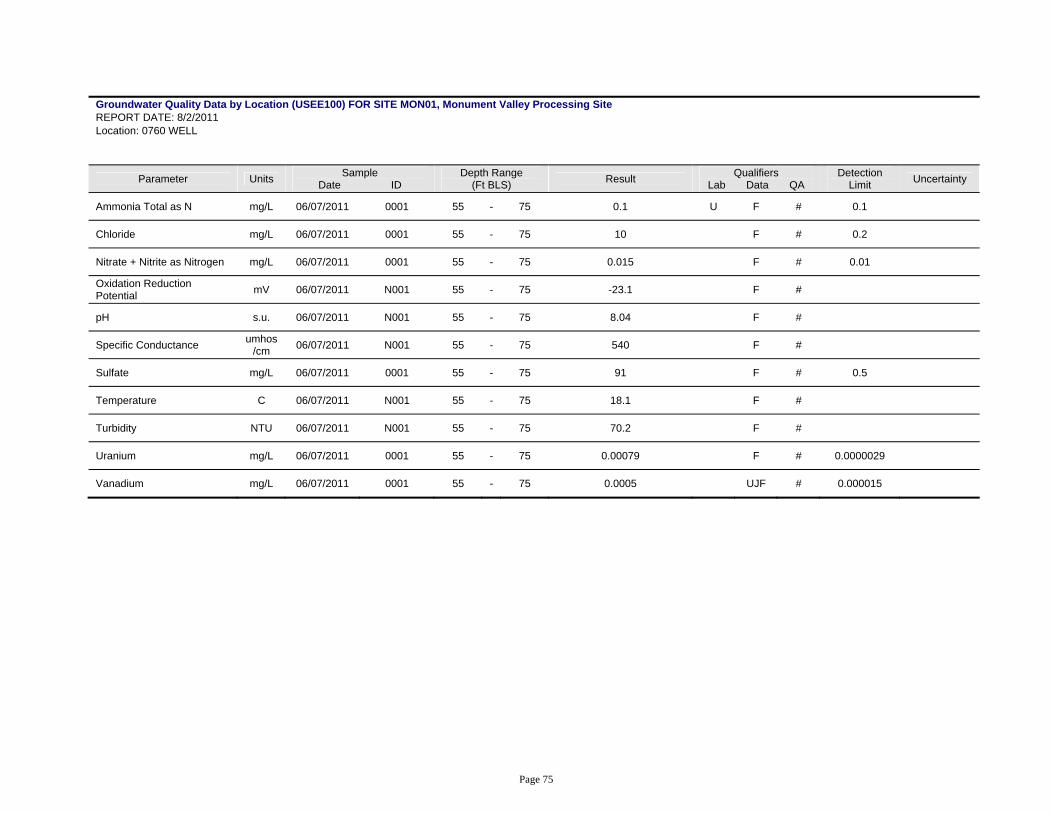
Groundwater Quality Data by Location (USEE100) FOR SITE MON01, Monument Valley Processing Site REPORT DATE: 8/2/2011 Location: 0760 WELL
Parameter Units Sample Date ID
Depth Range (Ft BLS) Result Qualifiers
Lab Data QA Detection
Limit Uncertainty
Ammonia Total as N mg/L 06/07/2011 0001 55 - 75 0.1 U F # 0.1
Chloride mg/L 06/07/2011 0001 55 - 75 10 F # 0.2
Nitrate + Nitrite as Nitrogen mg/L 06/07/2011 0001 55 - 75 0.015 F # 0.01
Oxidation Reduction Potential mV 06/07/2011 N001 55 - 75 -23.1 F #
pH s.u. 06/07/2011 N001 55 - 75 8.04 F #
Specific Conductance umhos/cm 06/07/2011 N001 55 - 75 540 F #
Sulfate mg/L 06/07/2011 0001 55 - 75 91 F # 0.5
Temperature C 06/07/2011 N001 55 - 75 18.1 F #
Turbidity NTU 06/07/2011 N001 55 - 75 70.2 F #
Uranium mg/L 06/07/2011 0001 55 - 75 0.00079 F # 0.0000029
Vanadium mg/L 06/07/2011 0001 55 - 75 0.0005 UJF # 0.000015

Page 76
Groundwater Quality Data by Location (USEE100) FOR SITE MON01, Monument Valley Processing Site REPORT DATE: 8/2/2011 Location: 0761 WELL
Parameter Units Sample Date ID
Depth Range (Ft BLS) Result Qualifiers
Lab Data QA Detection
Limit Uncertainty
Ammonia Total as N mg/L 06/07/2011 N001 39 - 49 0.1 U F # 0.1
Chloride mg/L 06/07/2011 N001 39 - 49 13 F # 2
Nitrate + Nitrite as Nitrogen mg/L 06/07/2011 N001 39 - 49 29 F # 0.2
Oxidation Reduction Potential mV 06/07/2011 N001 39 - 49 116.4 F #
pH s.u. 06/07/2011 N001 39 - 49 7.14 F #
Specific Conductance umhos/cm 06/07/2011 N001 39 - 49 1395 F #
Sulfate mg/L 06/07/2011 N001 39 - 49 440 F # 5
Temperature C 06/07/2011 N001 39 - 49 16.59 F #
Turbidity NTU 06/07/2011 N001 39 - 49 9.68 F #
Uranium mg/L 06/07/2011 N001 39 - 49 0.028 F # 0.0000029
Vanadium mg/L 06/07/2011 N001 39 - 49 0.003 F # 0.000015

Page 77
Groundwater Quality Data by Location (USEE100) FOR SITE MON01, Monument Valley Processing Site REPORT DATE: 8/2/2011 Location: 0762 WELL
Parameter Units Sample Date ID
Depth Range (Ft BLS) Result Qualifiers
Lab Data QA Detection
Limit Uncertainty
Ammonia Total as N mg/L 06/07/2011 N001 29 - 49 0.1 U F # 0.1
Chloride mg/L 06/07/2011 N001 29 - 49 67 F # 10
Nitrate + Nitrite as Nitrogen mg/L 06/07/2011 N001 29 - 49 100 F # 1
Oxidation Reduction Potential mV 06/07/2011 N001 29 - 49 162.6 F #
pH s.u. 06/07/2011 N001 29 - 49 7.33 F #
Specific Conductance umhos/cm 06/07/2011 N001 29 - 49 3930 F #
Sulfate mg/L 06/07/2011 N001 29 - 49 1500 F # 25
Temperature C 06/07/2011 N001 29 - 49 17.48 F #
Turbidity NTU 06/07/2011 N001 29 - 49 4.24 F #
Uranium mg/L 06/07/2011 N001 29 - 49 0.011 F # 0.0000029
Vanadium mg/L 06/07/2011 N001 29 - 49 0.0077 F # 0.000015

Page 78
Groundwater Quality Data by Location (USEE100) FOR SITE MON01, Monument Valley Processing Site REPORT DATE: 8/2/2011 Location: 0764 WELL
Parameter Units Sample Date ID
Depth Range (Ft BLS) Result Qualifiers
Lab Data QA Detection
Limit Uncertainty
Ammonia Total as N mg/L 06/07/2011 N001 47 - 52 0.1 U FQ # 0.1
Chloride mg/L 06/07/2011 N001 47 - 52 11 FQ # 2
Nitrate + Nitrite as Nitrogen mg/L 06/07/2011 N001 47 - 52 36 FQ # 0.2
Oxidation Reduction Potential mV 06/07/2011 N001 47 - 52 30.6 FQ #
pH s.u. 06/07/2011 N001 47 - 52 7.5 FQ #
Specific Conductance umhos/cm 06/07/2011 N001 47 - 52 1190 FQ #
Sulfate mg/L 06/07/2011 N001 47 - 52 260 FQ # 5
Temperature C 06/07/2011 N001 47 - 52 20.46 FQ #
Turbidity NTU 06/07/2011 N001 47 - 52 2.85 FQ #
Uranium mg/L 06/07/2011 N001 47 - 52 0.012 FQ # 0.0000029
Vanadium mg/L 06/07/2011 N001 47 - 52 0.013 FQ # 0.000015

Page 79
Groundwater Quality Data by Location (USEE100) FOR SITE MON01, Monument Valley Processing Site REPORT DATE: 8/2/2011 Location: 0765 WELL
Parameter Units Sample Date ID
Depth Range (Ft BLS) Result Qualifiers
Lab Data QA Detection
Limit Uncertainty
Ammonia Total as N mg/L 06/07/2011 0001 58.6 - 88.7 120 F # 5
Chloride mg/L 06/07/2011 0001 58.6 - 88.7 14 F # 0.4
Nitrate + Nitrite as Nitrogen mg/L 06/07/2011 0001 58.6 - 88.7 0.011 F # 0.01
Oxidation Reduction Potential mV 06/07/2011 N001 58.6 - 88.7 -282.5 F #
pH s.u. 06/07/2011 N001 58.6 - 88.7 6.62 F #
Specific Conductance umhos/cm 06/07/2011 N001 58.6 - 88.7 1974 F #
Sulfate mg/L 06/07/2011 0001 58.6 - 88.7 120 F # 1
Temperature C 06/07/2011 N001 58.6 - 88.7 19.56 F #
Turbidity NTU 06/07/2011 N001 58.6 - 88.7 16.8 F #
Uranium mg/L 06/07/2011 0001 58.6 - 88.7 0.0025 F # 0.0000029
Vanadium mg/L 06/07/2011 0001 58.6 - 88.7 0.001 UJF # 0.000015

Page 80
Groundwater Quality Data by Location (USEE100) FOR SITE MON01, Monument Valley Processing Site REPORT DATE: 8/2/2011 Location: 0766 WELL
Parameter Units Sample Date ID
Depth Range (Ft BLS) Result Qualifiers
Lab Data QA Detection
Limit Uncertainty
Ammonia Total as N mg/L 06/07/2011 N001 47.2 - 57.2 130 F # 5
Chloride mg/L 06/07/2011 N001 47.2 - 57.2 17 F # 4
Nitrate + Nitrite as Nitrogen mg/L 06/07/2011 N001 47.2 - 57.2 110 F # 1
Oxidation Reduction Potential mV 06/07/2011 N001 47.2 - 57.2 -97.3 F #
pH s.u. 06/07/2011 N001 47.2 - 57.2 7.57 F #
Specific Conductance umhos/cm 06/07/2011 N001 47.2 - 57.2 2324 F #
Sulfate mg/L 06/07/2011 N001 47.2 - 57.2 460 F # 10
Temperature C 06/07/2011 N001 47.2 - 57.2 17.77 F #
Turbidity NTU 06/07/2011 N001 47.2 - 57.2 6.22 F #
Uranium mg/L 06/07/2011 N001 47.2 - 57.2 0.015 F # 0.0000029
Vanadium mg/L 06/07/2011 N001 47.2 - 57.2 0.0038 F # 0.000015
Page 81
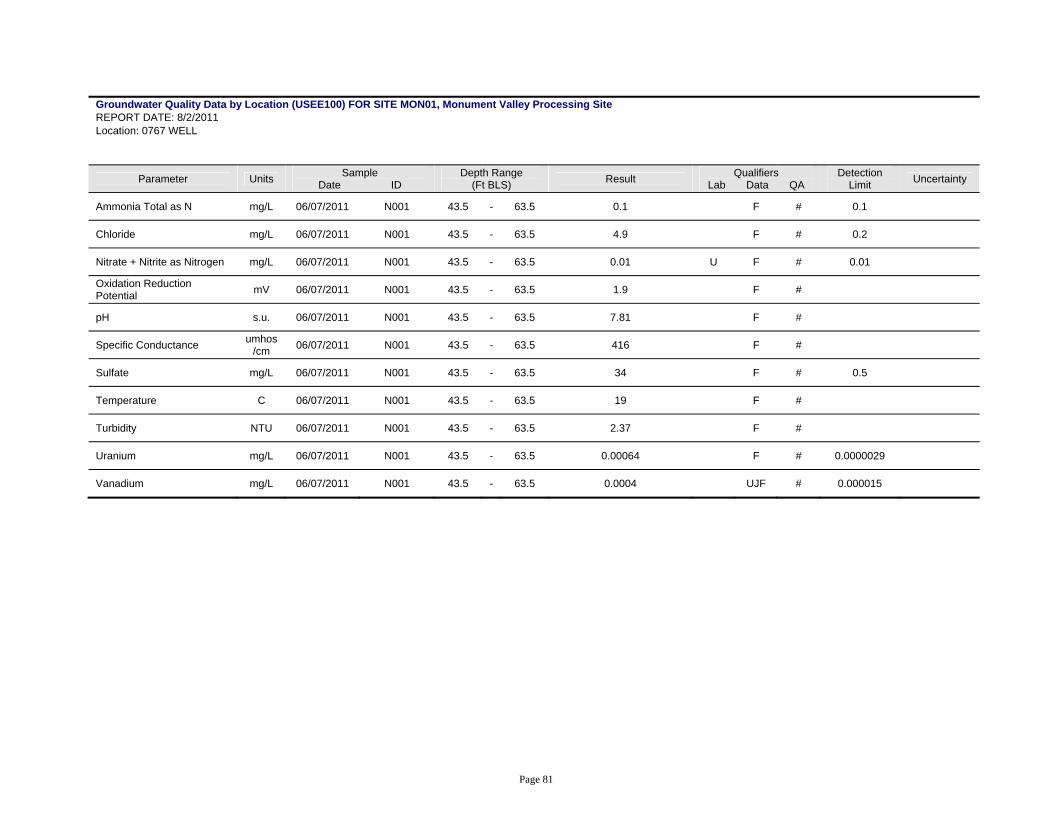
Groundwater Quality Data by Location (USEE100) FOR SITE MON01, Monument Valley Processing Site REPORT DATE: 8/2/2011 Location: 0767 WELL
Parameter Units Sample Date ID
Depth Range (Ft BLS) Result Qualifiers
Lab Data QA Detection
Limit Uncertainty
Ammonia Total as N mg/L 06/07/2011 N001 43.5 - 63.5 0.1 F # 0.1
Chloride mg/L 06/07/2011 N001 43.5 - 63.5 4.9 F # 0.2
Nitrate + Nitrite as Nitrogen mg/L 06/07/2011 N001 43.5 - 63.5 0.01 U F # 0.01
Oxidation Reduction Potential mV 06/07/2011 N001 43.5 - 63.5 1.9 F #
pH s.u. 06/07/2011 N001 43.5 - 63.5 7.81 F #
Specific Conductance umhos/cm 06/07/2011 N001 43.5 - 63.5 416 F #
Sulfate mg/L 06/07/2011 N001 43.5 - 63.5 34 F # 0.5
Temperature C 06/07/2011 N001 43.5 - 63.5 19 F #
Turbidity NTU 06/07/2011 N001 43.5 - 63.5 2.37 F #
Uranium mg/L 06/07/2011 N001 43.5 - 63.5 0.00064 F # 0.0000029
Vanadium mg/L 06/07/2011 N001 43.5 - 63.5 0.0004 UJF # 0.000015
Page 82
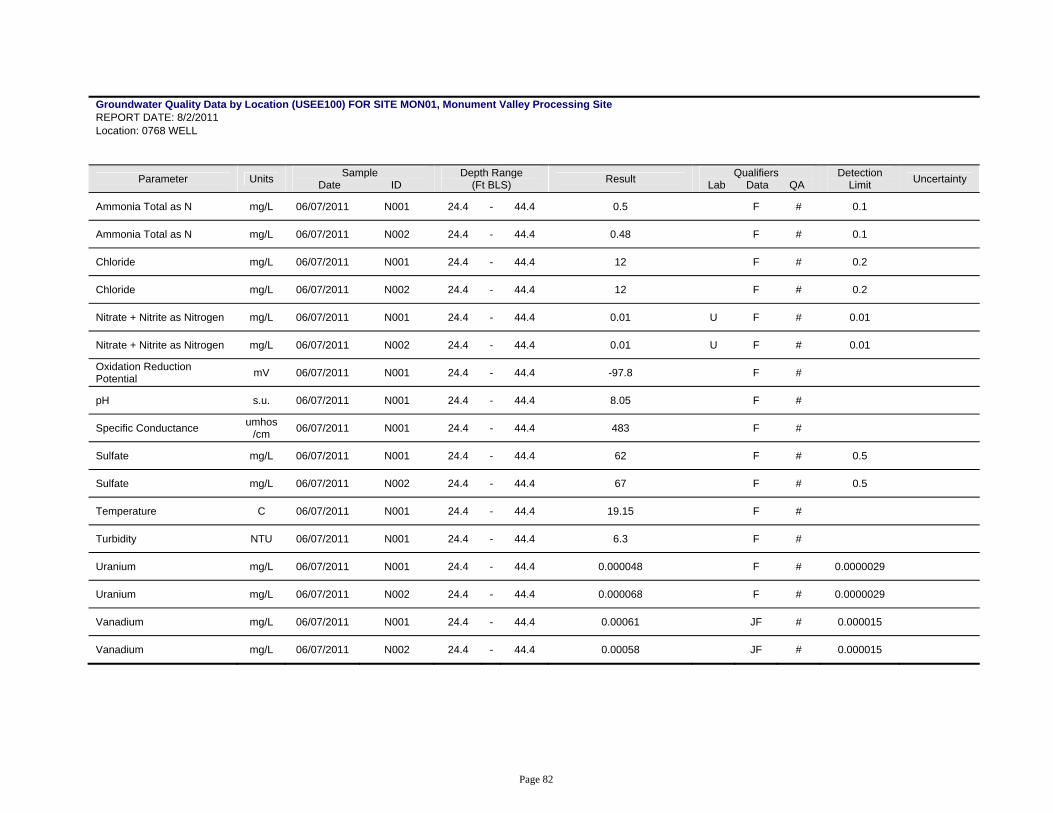
Groundwater Quality Data by Location (USEE100) FOR SITE MON01, Monument Valley Processing Site REPORT DATE: 8/2/2011 Location: 0768 WELL
Parameter Units Sample Date ID
Depth Range (Ft BLS) Result Qualifiers
Lab Data QA Detection
Limit Uncertainty
Ammonia Total as N mg/L 06/07/2011 N001 24.4 - 44.4 0.5 F # 0.1
Ammonia Total as N mg/L 06/07/2011 N002 24.4 - 44.4 0.48 F # 0.1
Chloride mg/L 06/07/2011 N001 24.4 - 44.4 12 F # 0.2
Chloride mg/L 06/07/2011 N002 24.4 - 44.4 12 F # 0.2
Nitrate + Nitrite as Nitrogen mg/L 06/07/2011 N001 24.4 - 44.4 0.01 U F # 0.01
Nitrate + Nitrite as Nitrogen mg/L 06/07/2011 N002 24.4 - 44.4 0.01 U F # 0.01
Oxidation Reduction Potential mV 06/07/2011 N001 24.4 - 44.4 -97.8 F #
pH s.u. 06/07/2011 N001 24.4 - 44.4 8.05 F #
Specific Conductance umhos/cm 06/07/2011 N001 24.4 - 44.4 483 F #
Sulfate mg/L 06/07/2011 N001 24.4 - 44.4 62 F # 0.5
Sulfate mg/L 06/07/2011 N002 24.4 - 44.4 67 F # 0.5
Temperature C 06/07/2011 N001 24.4 - 44.4 19.15 F #
Turbidity NTU 06/07/2011 N001 24.4 - 44.4 6.3 F #
Uranium mg/L 06/07/2011 N001 24.4 - 44.4 0.000048 F # 0.0000029
Uranium mg/L 06/07/2011 N002 24.4 - 44.4 0.000068 F # 0.0000029
Vanadium mg/L 06/07/2011 N001 24.4 - 44.4 0.00061 JF # 0.000015
Vanadium mg/L 06/07/2011 N002 24.4 - 44.4 0.00058 JF # 0.000015

Page 83
Groundwater Quality Data by Location (USEE100) FOR SITE MON01, Monument Valley Processing Site REPORT DATE: 8/2/2011 Location: 0770 WELL
Parameter Units Sample Date ID
Depth Range (Ft BLS) Result Qualifiers
Lab Data QA Detection
Limit Uncertainty
Ammonia Total as N mg/L 06/08/2011 N001 54.9 - 64.9 32 F # 2
Chloride mg/L 06/08/2011 N001 54.9 - 64.9 15 F # 2
Nitrate + Nitrite as Nitrogen mg/L 06/08/2011 N001 54.9 - 64.9 17 F # 0.1
Oxidation Reduction Potential mV 06/08/2011 N001 54.9 - 64.9 110.1 F #
pH s.u. 06/08/2011 N001 54.9 - 64.9 7.43 F #
Specific Conductance umhos/cm 06/08/2011 N001 54.9 - 64.9 1030 F #
Sulfate mg/L 06/08/2011 N001 54.9 - 64.9 190 F # 5
Temperature C 06/08/2011 N001 54.9 - 64.9 17.51 F #
Turbidity NTU 06/08/2011 N001 54.9 - 64.9 2.03 F #
Uranium mg/L 06/08/2011 N001 54.9 - 64.9 0.0052 F # 0.0000029
Vanadium mg/L 06/08/2011 N001 54.9 - 64.9 0.001 JF # 0.000015

Page 84
Groundwater Quality Data by Location (USEE100) FOR SITE MON01, Monument Valley Processing Site REPORT DATE: 8/2/2011 Location: 0771 WELL
Parameter Units Sample Date ID
Depth Range (Ft BLS) Result Qualifiers
Lab Data QA Detection
Limit Uncertainty
Ammonia Total as N mg/L 06/07/2011 N001 57.4 - 77.4 260 FQ # 20
Chloride mg/L 06/07/2011 N001 57.4 - 77.4 20 FQ # 4
Nitrate + Nitrite as Nitrogen mg/L 06/07/2011 N001 57.4 - 77.4 190 FQ # 1
Oxidation Reduction Potential mV 06/07/2011 N001 57.4 - 77.4 -72.5 FQ #
pH s.u. 06/07/2011 N001 57.4 - 77.4 7.22 FQ #
Specific Conductance umhos/cm 06/07/2011 N001 57.4 - 77.4 4171 FQ #
Sulfate mg/L 06/07/2011 N001 57.4 - 77.4 1400 N FQ # 10
Temperature C 06/07/2011 N001 57.4 - 77.4 18.9 FQ #
Turbidity NTU 06/07/2011 N001 57.4 - 77.4 0.62 FQ #
Uranium mg/L 06/07/2011 N001 57.4 - 77.4 0.014 FQ # 0.0000029
Vanadium mg/L 06/07/2011 N001 57.4 - 77.4 0.0089 FQ # 0.000015
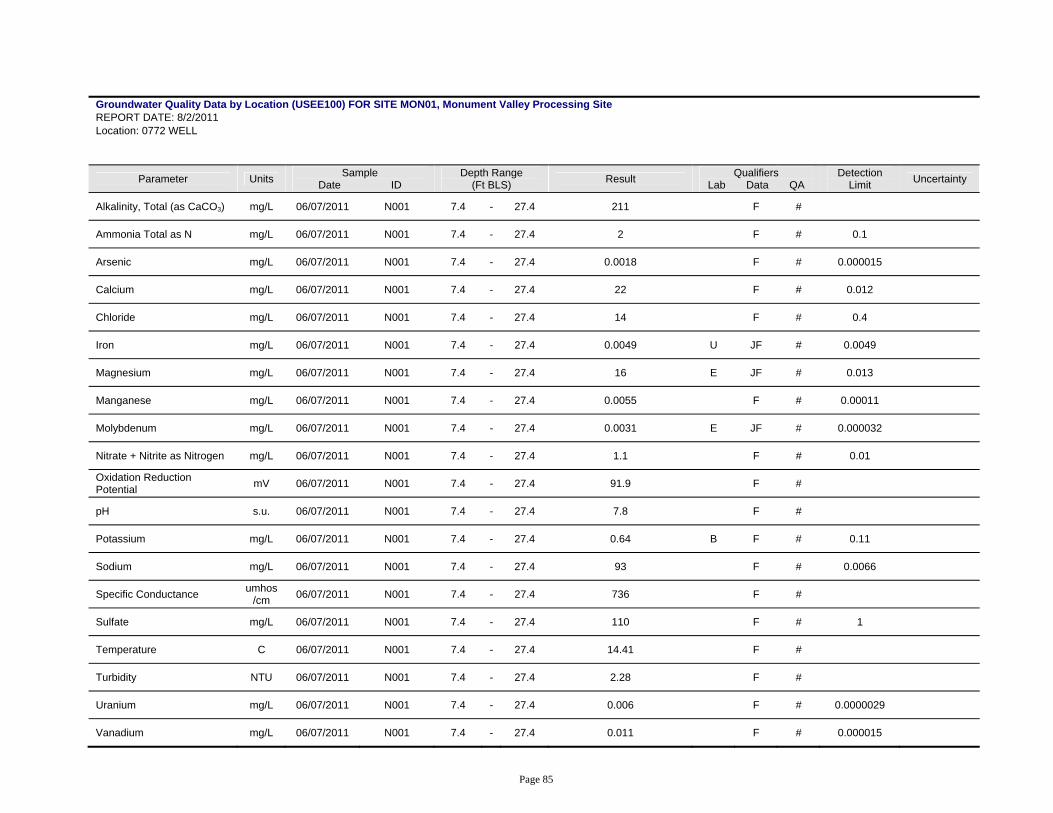
Page 85
Groundwater Quality Data by Location (USEE100) FOR SITE MON01, Monument Valley Processing Site REPORT DATE: 8/2/2011 Location: 0772 WELL
Parameter Units Sample Date ID
Depth Range (Ft BLS) Result Qualifiers
Lab Data QA Detection
Limit Uncertainty
Alkalinity, Total (as CaCO3) mg/L 06/07/2011 N001 7.4 - 27.4 211 F #
Ammonia Total as N mg/L 06/07/2011 N001 7.4 - 27.4 2 F # 0.1
Arsenic mg/L 06/07/2011 N001 7.4 - 27.4 0.0018 F # 0.000015
Calcium mg/L 06/07/2011 N001 7.4 - 27.4 22 F # 0.012
Chloride mg/L 06/07/2011 N001 7.4 - 27.4 14 F # 0.4
Iron mg/L 06/07/2011 N001 7.4 - 27.4 0.0049 U JF # 0.0049
Magnesium mg/L 06/07/2011 N001 7.4 - 27.4 16 E JF # 0.013
Manganese mg/L 06/07/2011 N001 7.4 - 27.4 0.0055 F # 0.00011
Molybdenum mg/L 06/07/2011 N001 7.4 - 27.4 0.0031 E JF # 0.000032
Nitrate + Nitrite as Nitrogen mg/L 06/07/2011 N001 7.4 - 27.4 1.1 F # 0.01
Oxidation Reduction Potential mV 06/07/2011 N001 7.4 - 27.4 91.9 F #
pH s.u. 06/07/2011 N001 7.4 - 27.4 7.8 F #
Potassium mg/L 06/07/2011 N001 7.4 - 27.4 0.64 B F # 0.11
Sodium mg/L 06/07/2011 N001 7.4 - 27.4 93 F # 0.0066
Specific Conductance umhos/cm 06/07/2011 N001 7.4 - 27.4 736 F #
Sulfate mg/L 06/07/2011 N001 7.4 - 27.4 110 F # 1
Temperature C 06/07/2011 N001 7.4 - 27.4 14.41 F #
Turbidity NTU 06/07/2011 N001 7.4 - 27.4 2.28 F #
Uranium mg/L 06/07/2011 N001 7.4 - 27.4 0.006 F # 0.0000029
Vanadium mg/L 06/07/2011 N001 7.4 - 27.4 0.011 F # 0.000015

Page 86
Groundwater Quality Data by Location (USEE100) FOR SITE MON01, Monument Valley Processing Site REPORT DATE: 8/2/2011 Location: 0774 WELL
Parameter Units Sample Date ID
Depth Range (Ft BLS) Result Qualifiers
Lab Data QA Detection
Limit Uncertainty
Ammonia Total as N mg/L 06/08/2011 N001 45 - 55 0.1 U F # 0.1
Chloride mg/L 06/08/2011 N001 45 - 55 4.4 F # 0.2
Nitrate + Nitrite as Nitrogen mg/L 06/08/2011 N001 45 - 55 1.7 F # 0.01
Oxidation Reduction Potential mV 06/08/2011 N001 45 - 55 41.3 F #
pH s.u. 06/08/2011 N001 45 - 55 7.73 F #
Specific Conductance umhos/cm 06/08/2011 N001 45 - 55 463 F #
Sulfate mg/L 06/08/2011 N001 45 - 55 42 F # 0.5
Temperature C 06/08/2011 N001 45 - 55 17.55 F #
Turbidity NTU 06/08/2011 N001 45 - 55 2.1 F #
Uranium mg/L 06/08/2011 N001 45 - 55 0.032 F # 0.0000029
Vanadium mg/L 06/08/2011 N001 45 - 55 0.02 F # 0.000015

Page 87
Groundwater Quality Data by Location (USEE100) FOR SITE MON01, Monument Valley Processing Site REPORT DATE: 8/2/2011 Location: 0775 WELL
Parameter Units Sample Date ID
Depth Range (Ft BLS) Result Qualifiers
Lab Data QA Detection
Limit Uncertainty
Ammonia Total as N mg/L 06/08/2011 N001 142 - 167 0.1 U F # 0.1
Chloride mg/L 06/08/2011 N001 142 - 167 5 F # 0.2
Nitrate + Nitrite as Nitrogen mg/L 06/08/2011 N001 142 - 167 0.59 F # 0.01
Oxidation Reduction Potential mV 06/08/2011 N001 142 - 167 55.2 F #
pH s.u. 06/08/2011 N001 142 - 167 7.74 F #
Specific Conductance umhos/cm 06/08/2011 N001 142 - 167 398 F #
Sulfate mg/L 06/08/2011 N001 142 - 167 26 F # 0.5
Temperature C 06/08/2011 N001 142 - 167 18.25 F #
Turbidity NTU 06/08/2011 N001 142 - 167 0.06 F #
Uranium mg/L 06/08/2011 N001 142 - 167 0.0028 F # 0.0000029
Vanadium mg/L 06/08/2011 N001 142 - 167 0.00091 JF # 0.000015
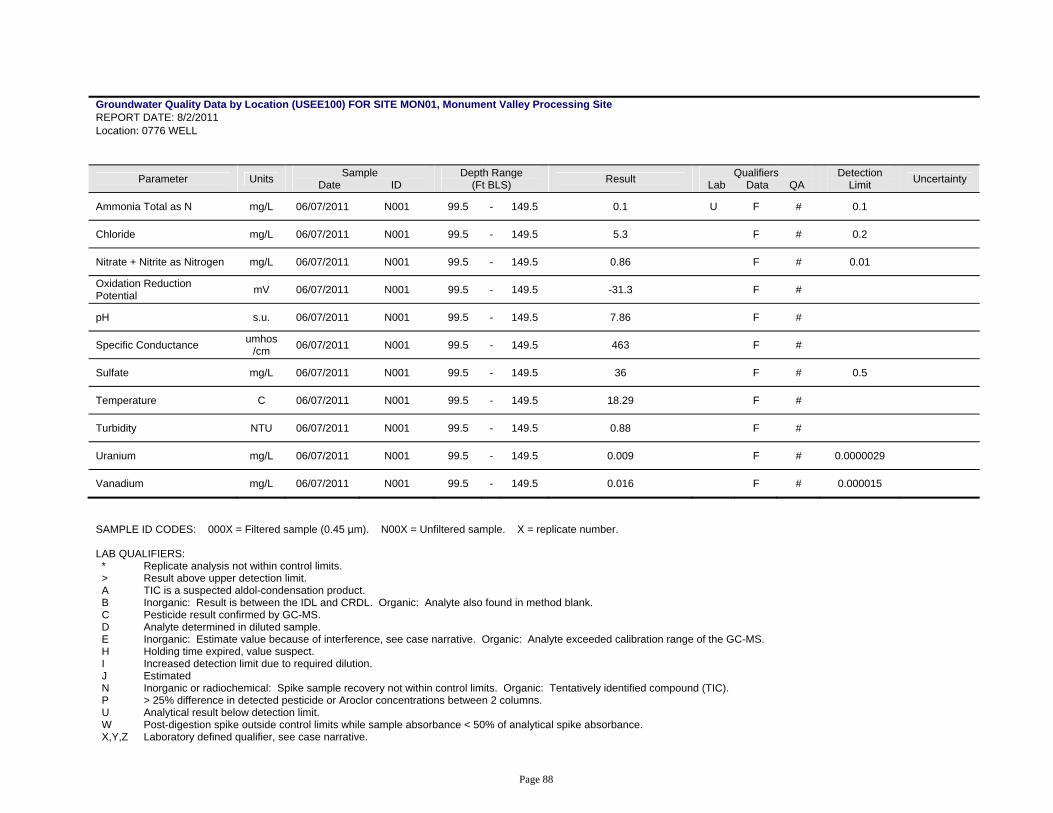
Page 88
Groundwater Quality Data by Location (USEE100) FOR SITE MON01, Monument Valley Processing Site REPORT DATE: 8/2/2011 Location: 0776 WELL
Parameter Units Sample Date ID
Depth Range (Ft BLS) Result Qualifiers
Lab Data QA Detection
Limit Uncertainty
Ammonia Total as N mg/L 06/07/2011 N001 99.5 - 149.5 0.1 U F # 0.1
Chloride mg/L 06/07/2011 N001 99.5 - 149.5 5.3 F # 0.2
Nitrate + Nitrite as Nitrogen mg/L 06/07/2011 N001 99.5 - 149.5 0.86 F # 0.01
Oxidation Reduction Potential mV 06/07/2011 N001 99.5 - 149.5 -31.3 F #
pH s.u. 06/07/2011 N001 99.5 - 149.5 7.86 F #
Specific Conductance umhos/cm 06/07/2011 N001 99.5 - 149.5 463 F #
Sulfate mg/L 06/07/2011 N001 99.5 - 149.5 36 F # 0.5
Temperature C 06/07/2011 N001 99.5 - 149.5 18.29 F #
Turbidity NTU 06/07/2011 N001 99.5 - 149.5 0.88 F #
Uranium mg/L 06/07/2011 N001 99.5 - 149.5 0.009 F # 0.0000029
Vanadium mg/L 06/07/2011 N001 99.5 - 149.5 0.016 F # 0.000015
SAMPLE ID CODES: 000X = Filtered sample (0.45 µm). N00X = Unfiltered sample. X = replicate number. LAB QUALIFIERS: * Replicate analysis not within control limits. > Result above upper detection limit. A TIC is a suspected aldol-condensation product. B Inorganic: Result is between the IDL and CRDL. Organic: Analyte also found in method blank. C Pesticide result confirmed by GC-MS. D Analyte determined in diluted sample. E Inorganic: Estimate value because of interference, see case narrative. Organic: Analyte exceeded calibration range of the GC-MS. H Holding time expired, value suspect. I Increased detection limit due to required dilution. J Estimated N Inorganic or radiochemical: Spike sample recovery not within control limits. Organic: Tentatively identified compound (TIC). P > 25% difference in detected pesticide or Aroclor concentrations between 2 columns. U Analytical result below detection limit. W Post-digestion spike outside control limits while sample absorbance < 50% of analytical spike absorbance. X,Y,Z Laboratory defined qualifier, see case narrative.

Page 89
DATA QUALIFIERS: F Low flow sampling method used. G Possible grout contamination, pH > 9. J Estimated value. L Less than 3 bore volumes purged prior to sampling. Q Qualitative result due to sampling technique. R Unusable result. U Parameter analyzed for but was not detected. X Location is undefined. QA QUALIFIER: # Validated according to quality assurance guidelines.
Page 90
This page intentionally left blank
Page 91
Surface Water Quality Data

Page 92
This page intentionally left blank
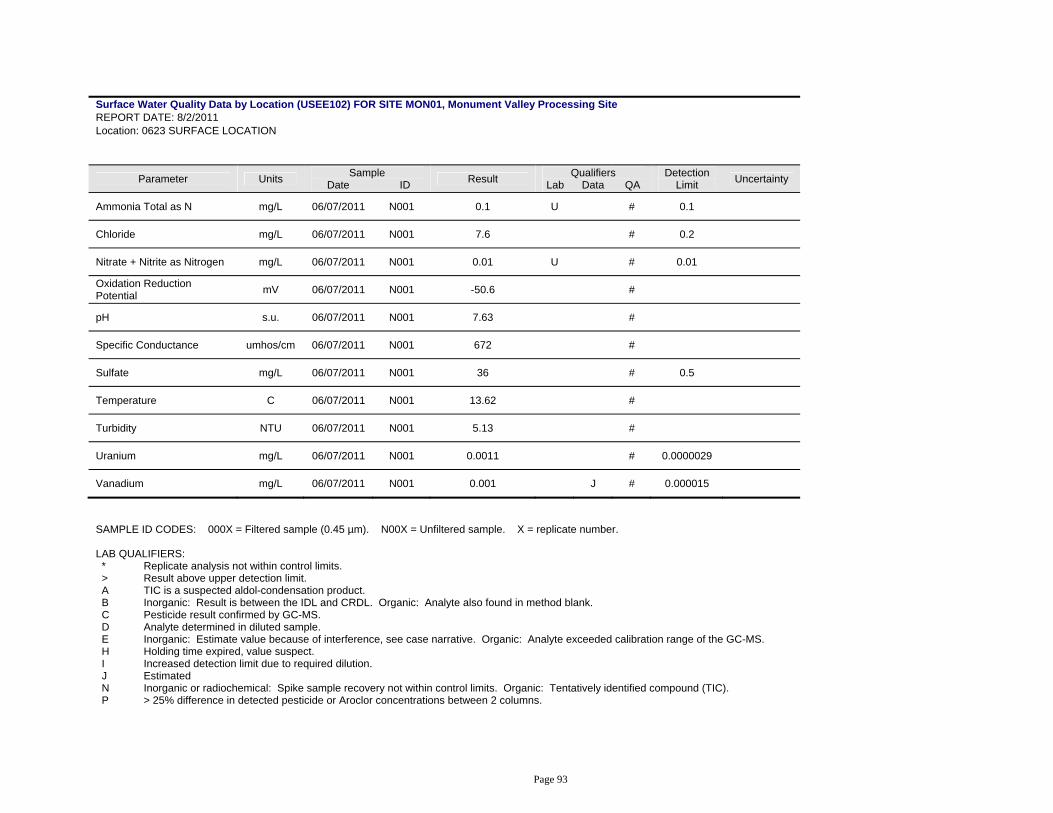
Page 93
Surface Water Quality Data by Location (USEE102) FOR SITE MON01, Monument Valley Processing Site REPORT DATE: 8/2/2011 Location: 0623 SURFACE LOCATION
Parameter Units Sample Date ID Result Qualifiers
Lab Data QA Detection
Limit Uncertainty
Ammonia Total as N mg/L 06/07/2011 N001 0.1 U # 0.1
Chloride mg/L 06/07/2011 N001 7.6 # 0.2
Nitrate + Nitrite as Nitrogen mg/L 06/07/2011 N001 0.01 U # 0.01
Oxidation Reduction Potential mV 06/07/2011 N001 -50.6 #
pH s.u. 06/07/2011 N001 7.63 #
Specific Conductance umhos/cm 06/07/2011 N001 672 #
Sulfate mg/L 06/07/2011 N001 36 # 0.5
Temperature C 06/07/2011 N001 13.62 #
Turbidity NTU 06/07/2011 N001 5.13 #
Uranium mg/L 06/07/2011 N001 0.0011 # 0.0000029
Vanadium mg/L 06/07/2011 N001 0.001 J # 0.000015
SAMPLE ID CODES: 000X = Filtered sample (0.45 µm). N00X = Unfiltered sample. X = replicate number. LAB QUALIFIERS: * Replicate analysis not within control limits. > Result above upper detection limit. A TIC is a suspected aldol-condensation product. B Inorganic: Result is between the IDL and CRDL. Organic: Analyte also found in method blank. C Pesticide result confirmed by GC-MS. D Analyte determined in diluted sample. E Inorganic: Estimate value because of interference, see case narrative. Organic: Analyte exceeded calibration range of the GC-MS. H Holding time expired, value suspect. I Increased detection limit due to required dilution. J Estimated N Inorganic or radiochemical: Spike sample recovery not within control limits. Organic: Tentatively identified compound (TIC). P > 25% difference in detected pesticide or Aroclor concentrations between 2 columns.
Page 94
U Analytical result below detection limit. W Post-digestion spike outside control limits while sample absorbance < 50% of analytical spike absorbance. X,Y,Z Laboratory defined qualifier, see case narrative. DATA QUALIFIERS: F Low flow sampling method used. G Possible grout contamination, pH > 9. J Estimated value. L Less than 3 bore volumes purged prior to sampling. Q Qualitative result due to sampling technique. R Unusable result. U Parameter analyzed for but was not detected. X Location is undefined. QA QUALIFIER: # Validated according to quality assurance guidelines.
Page 95
Static Water Level Data
Page 96
This page intentionally left blank
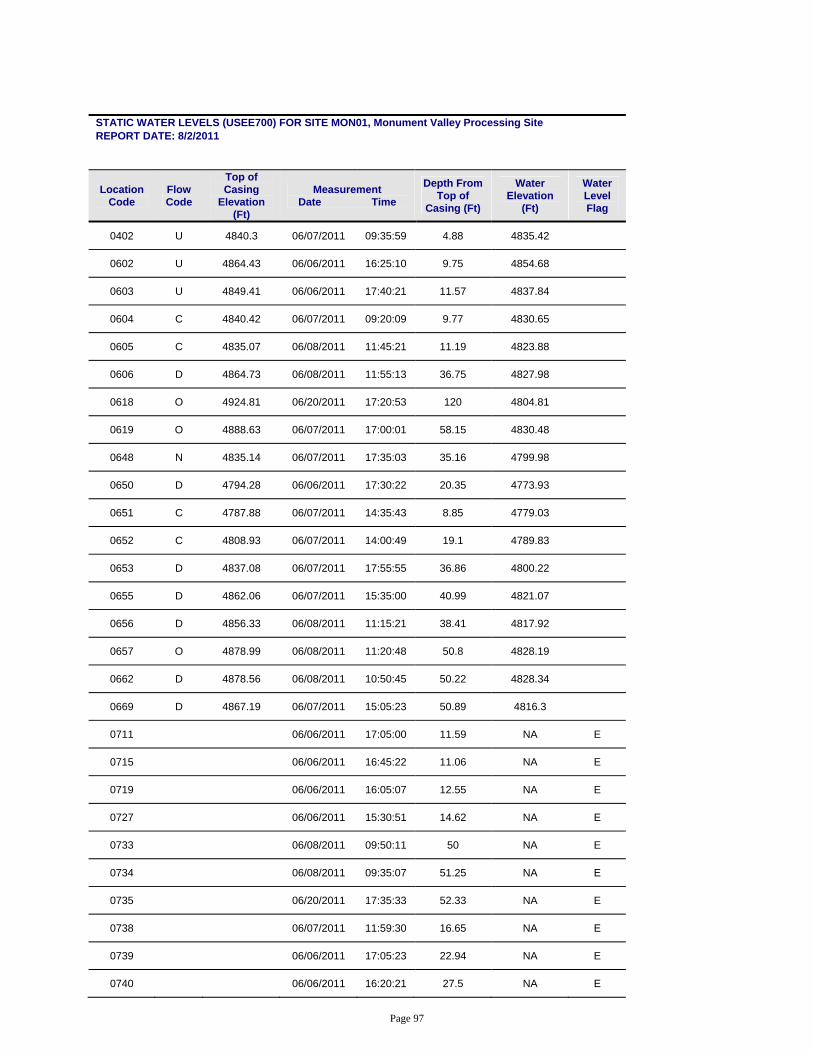
Page 97
STATIC WATER LEVELS (USEE700) FOR SITE MON01, Monument Valley Processing Site REPORT DATE: 8/2/2011
Location Code
Flow Code
Top of Casing
Elevation (Ft)
Measurement Date Time
Depth From Top of
Casing (Ft)
Water Elevation
(Ft)
Water Level Flag
0402 U 4840.3 06/07/2011 09:35:59 4.88 4835.42
0602 U 4864.43 06/06/2011 16:25:10 9.75 4854.68
0603 U 4849.41 06/06/2011 17:40:21 11.57 4837.84
0604 C 4840.42 06/07/2011 09:20:09 9.77 4830.65
0605 C 4835.07 06/08/2011 11:45:21 11.19 4823.88
0606 D 4864.73 06/08/2011 11:55:13 36.75 4827.98
0618 O 4924.81 06/20/2011 17:20:53 120 4804.81
0619 O 4888.63 06/07/2011 17:00:01 58.15 4830.48
0648 N 4835.14 06/07/2011 17:35:03 35.16 4799.98
0650 D 4794.28 06/06/2011 17:30:22 20.35 4773.93
0651 C 4787.88 06/07/2011 14:35:43 8.85 4779.03
0652 C 4808.93 06/07/2011 14:00:49 19.1 4789.83
0653 D 4837.08 06/07/2011 17:55:55 36.86 4800.22
0655 D 4862.06 06/07/2011 15:35:00 40.99 4821.07
0656 D 4856.33 06/08/2011 11:15:21 38.41 4817.92
0657 O 4878.99 06/08/2011 11:20:48 50.8 4828.19
0662 D 4878.56 06/08/2011 10:50:45 50.22 4828.34
0669 D 4867.19 06/07/2011 15:05:23 50.89 4816.3
0711 06/06/2011 17:05:00 11.59 NA E
0715 06/06/2011 16:45:22 11.06 NA E
0719 06/06/2011 16:05:07 12.55 NA E
0727 06/06/2011 15:30:51 14.62 NA E
0733 06/08/2011 09:50:11 50 NA E
0734 06/08/2011 09:35:07 51.25 NA E
0735 06/20/2011 17:35:33 52.33 NA E
0738 06/07/2011 11:59:30 16.65 NA E
0739 06/06/2011 17:05:23 22.94 NA E
0740 06/06/2011 16:20:21 27.5 NA E
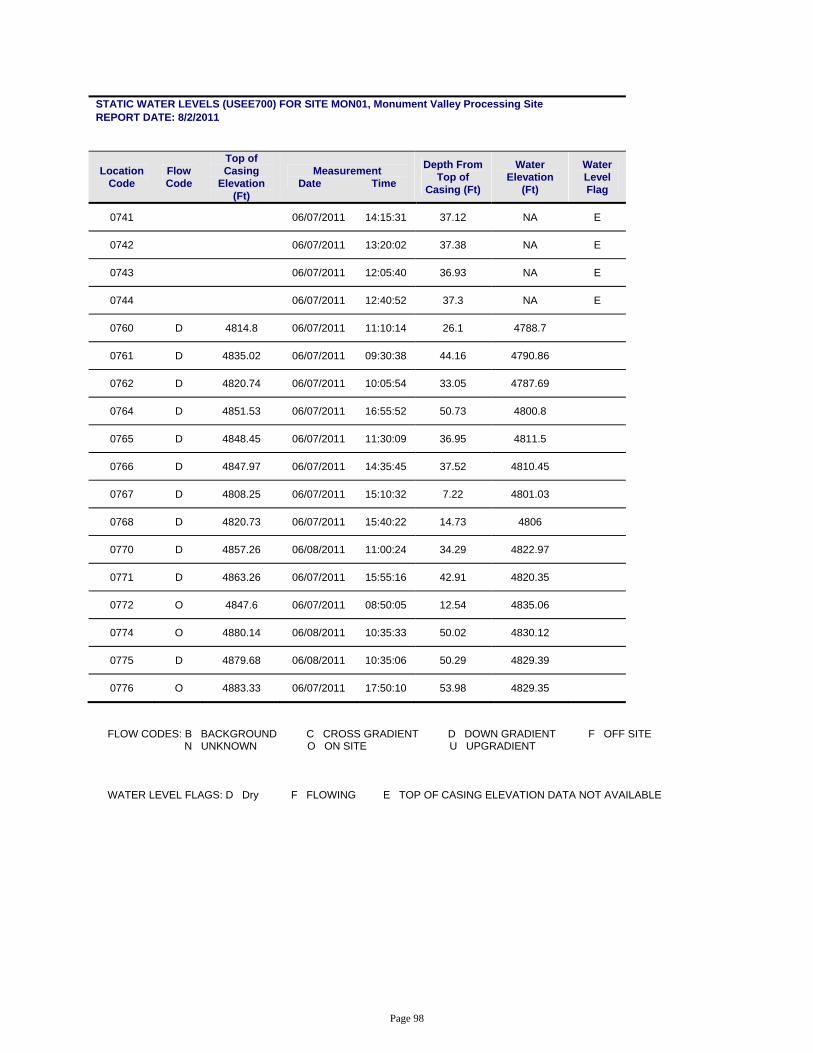
Page 98
STATIC WATER LEVELS (USEE700) FOR SITE MON01, Monument Valley Processing Site REPORT DATE: 8/2/2011
Location Code
Flow Code
Top of Casing
Elevation (Ft)
Measurement Date Time
Depth From Top of
Casing (Ft)
Water Elevation
(Ft)
Water Level Flag
0741 06/07/2011 14:15:31 37.12 NA E
0742 06/07/2011 13:20:02 37.38 NA E
0743 06/07/2011 12:05:40 36.93 NA E
0744 06/07/2011 12:40:52 37.3 NA E
0760 D 4814.8 06/07/2011 11:10:14 26.1 4788.7
0761 D 4835.02 06/07/2011 09:30:38 44.16 4790.86
0762 D 4820.74 06/07/2011 10:05:54 33.05 4787.69
0764 D 4851.53 06/07/2011 16:55:52 50.73 4800.8
0765 D 4848.45 06/07/2011 11:30:09 36.95 4811.5
0766 D 4847.97 06/07/2011 14:35:45 37.52 4810.45
0767 D 4808.25 06/07/2011 15:10:32 7.22 4801.03
0768 D 4820.73 06/07/2011 15:40:22 14.73 4806
0770 D 4857.26 06/08/2011 11:00:24 34.29 4822.97
0771 D 4863.26 06/07/2011 15:55:16 42.91 4820.35
0772 O 4847.6 06/07/2011 08:50:05 12.54 4835.06
0774 O 4880.14 06/08/2011 10:35:33 50.02 4830.12
0775 D 4879.68 06/08/2011 10:35:06 50.29 4829.39
0776 O 4883.33 06/07/2011 17:50:10 53.98 4829.35
FLOW CODES: B BACKGROUND C CROSS GRADIENT D DOWN GRADIENT F OFF SITE N UNKNOWN O ON SITE U UPGRADIENT WATER LEVEL FLAGS: D Dry F FLOWING E TOP OF CASING ELEVATION DATA NOT AVAILABLE
Page 99
Time-Concentration Graphs
Page 100
This page intentionally left blank

Page 101
Monument Valley Processing Site Ammonia Total as N Concentration
0
0.1
0.2
0.3
0.4
0.5
0.6
0.7
0.8
0.9
1
1997
1998
1999
2000
2001
2002
2003
2004
2005
2006
2007
2008
2009
2010
2011
2012
Date
Am
mon
ia T
otal
as
N (m
g/L) 0402
060206030604060506180619065006510652
Location
-
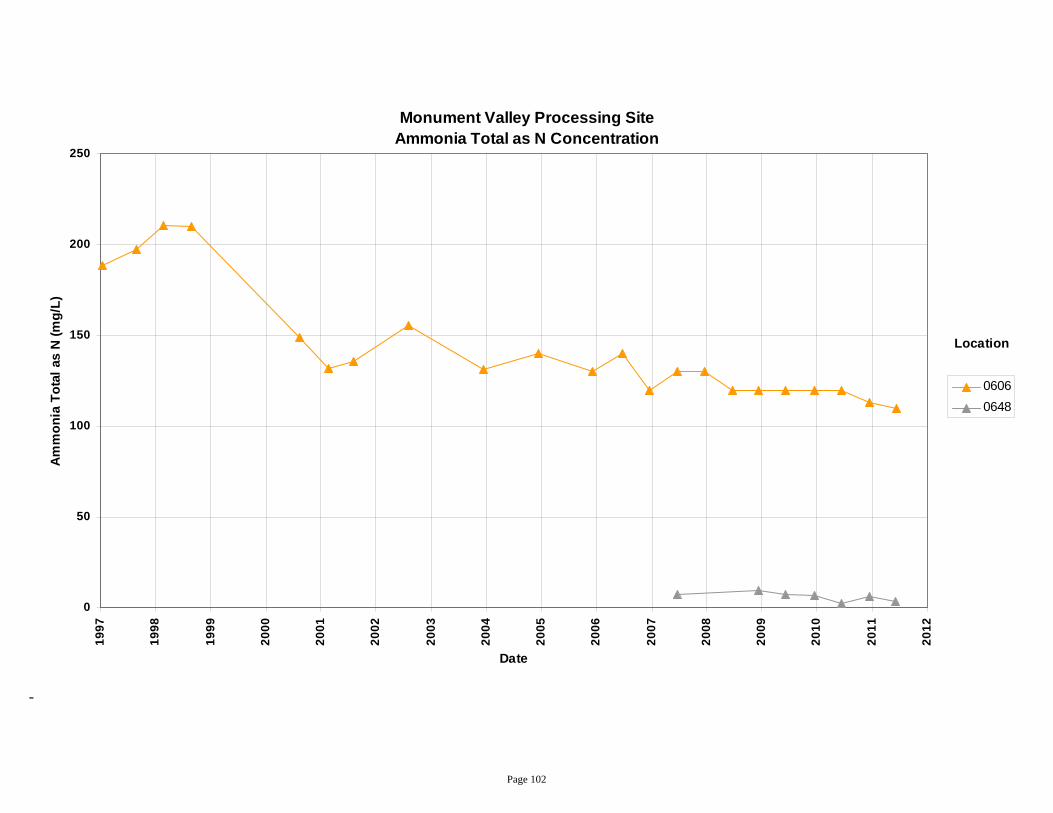
Page 102
Monument Valley Processing Site Ammonia Total as N Concentration
0
50
100
150
200
250
1997
1998
1999
2000
2001
2002
2003
2004
2005
2006
2007
2008
2009
2010
2011
2012
Date
Am
mon
ia T
otal
as
N (m
g/L)
06060648
Location
-
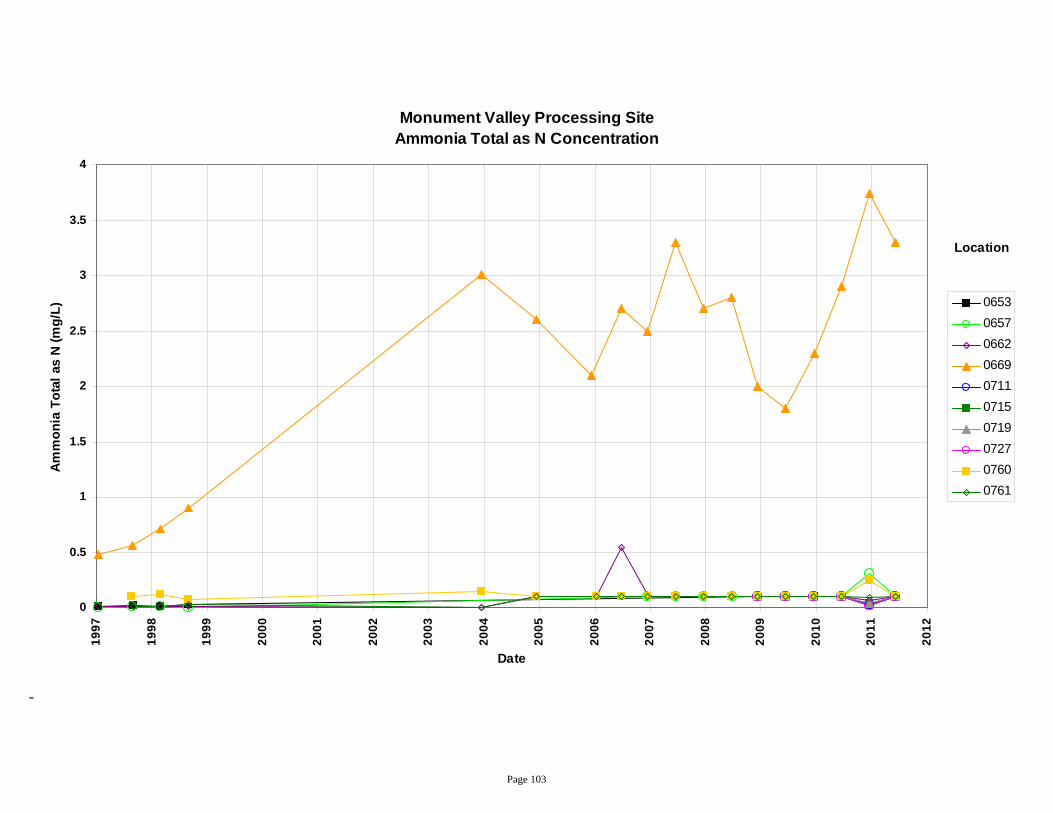
Page 103
Monument Valley Processing Site Ammonia Total as N Concentration
0
0.5
1
1.5
2
2.5
3
3.5
4
1997
1998
1999
2000
2001
2002
2003
2004
2005
2006
2007
2008
2009
2010
2011
2012
Date
Am
mon
ia T
otal
as
N (m
g/L) 0653
065706620669071107150719072707600761
Location
-
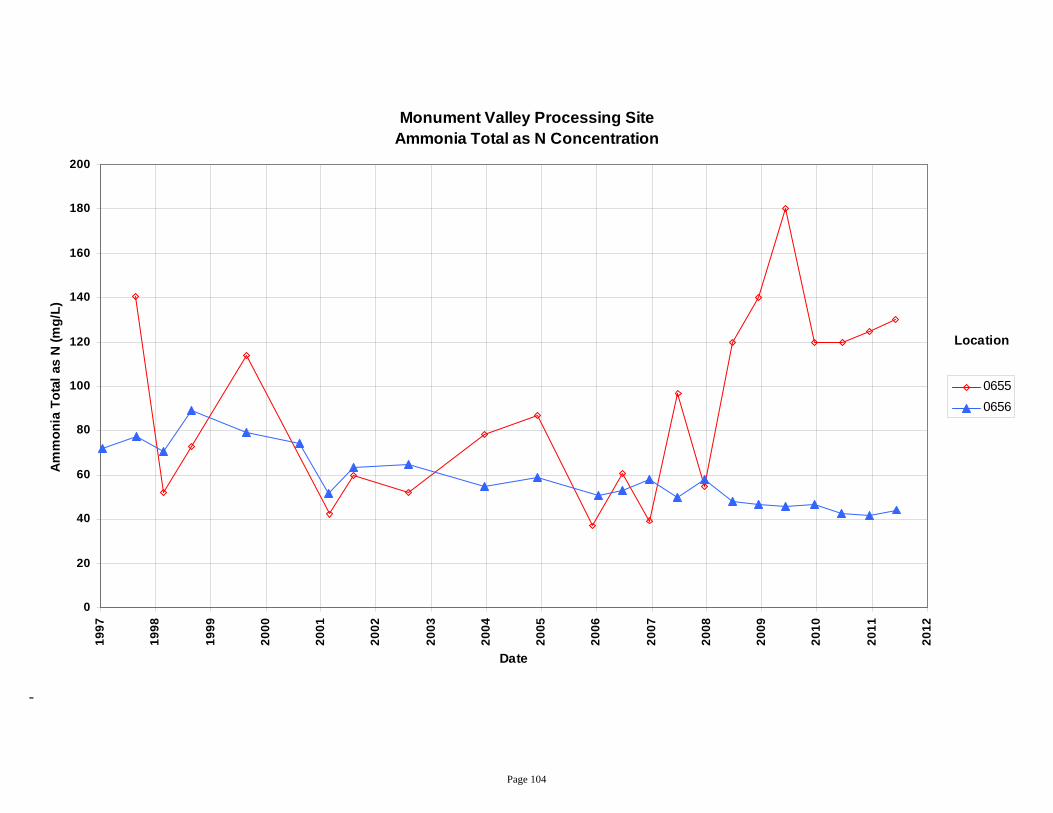
Page 104
Monument Valley Processing Site Ammonia Total as N Concentration
0
20
40
60
80
100
120
140
160
180
200
1997
1998
1999
2000
2001
2002
2003
2004
2005
2006
2007
2008
2009
2010
2011
2012
Date
Am
mon
ia T
otal
as
N (m
g/L)
06550656
Location
-
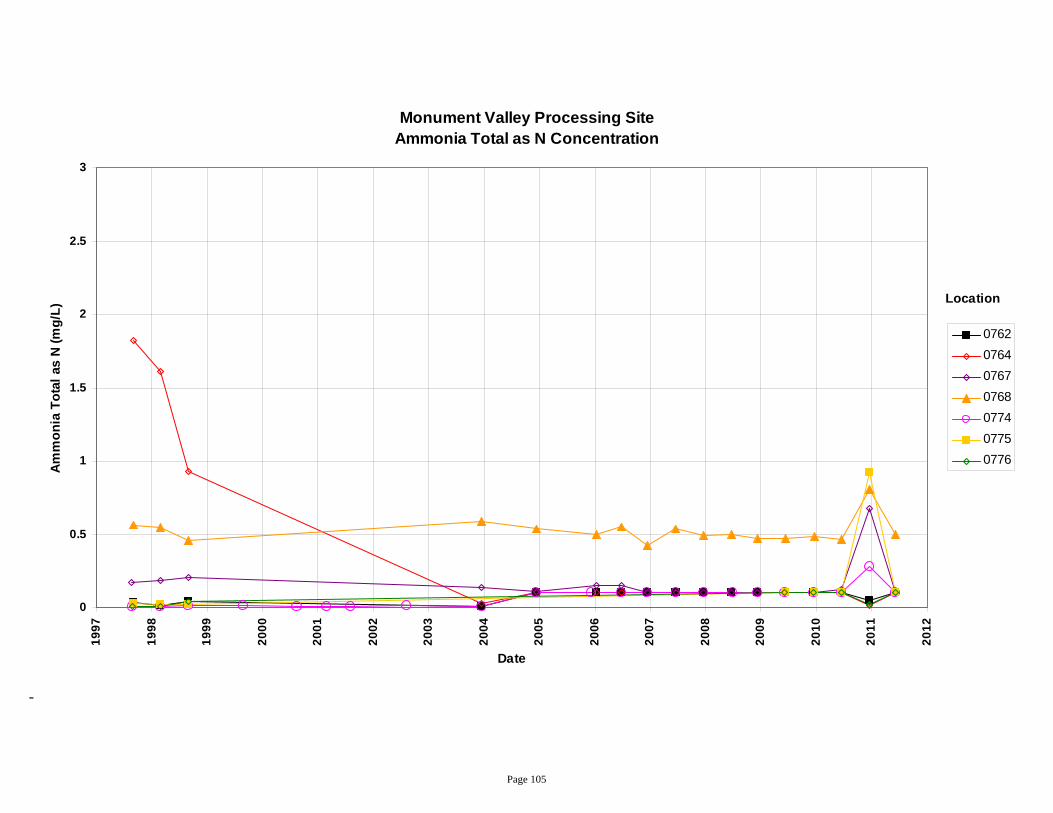
Page 105
Monument Valley Processing Site Ammonia Total as N Concentration
0
0.5
1
1.5
2
2.5
3
1997
1998
1999
2000
2001
2002
2003
2004
2005
2006
2007
2008
2009
2010
2011
2012
Date
Amm
onia
Tot
al a
s N
(mg/
L)
0762076407670768077407750776
Location
-
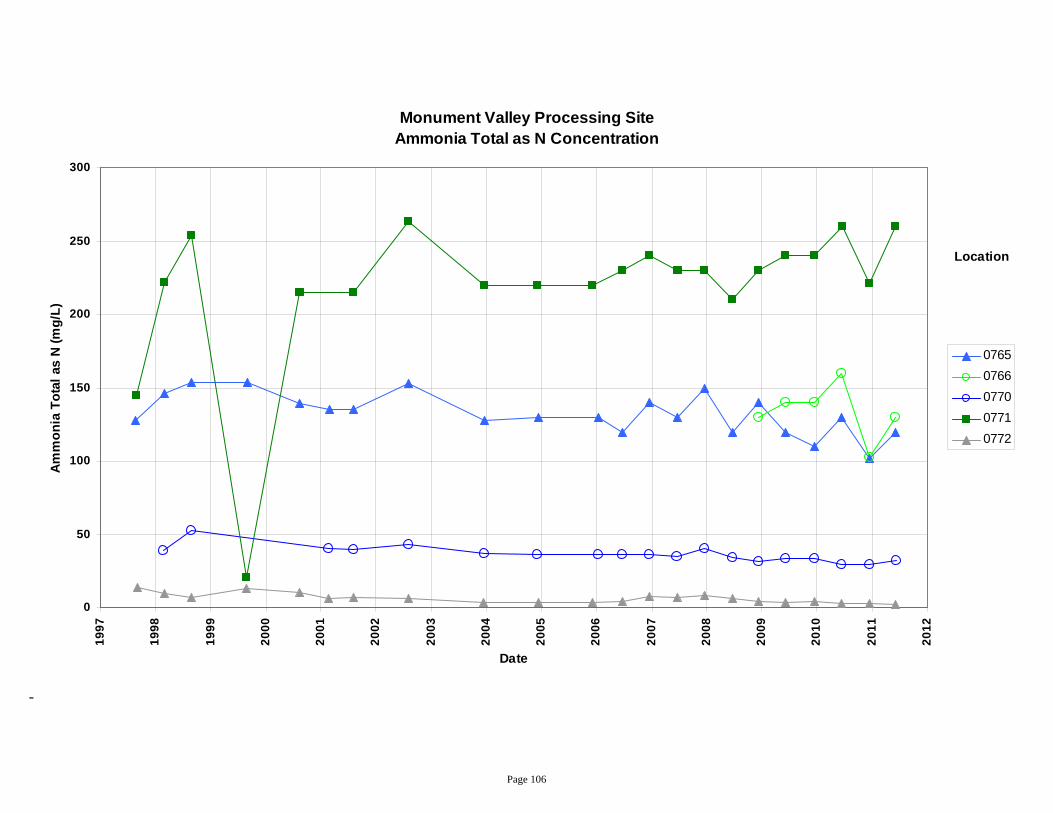
Page 106
Monument Valley Processing Site Ammonia Total as N Concentration
0
50
100
150
200
250
300
1997
1998
1999
2000
2001
2002
2003
2004
2005
2006
2007
2008
2009
2010
2011
2012
Date
Amm
onia
Tot
al a
s N
(mg/
L)
07650766077007710772
Location
-
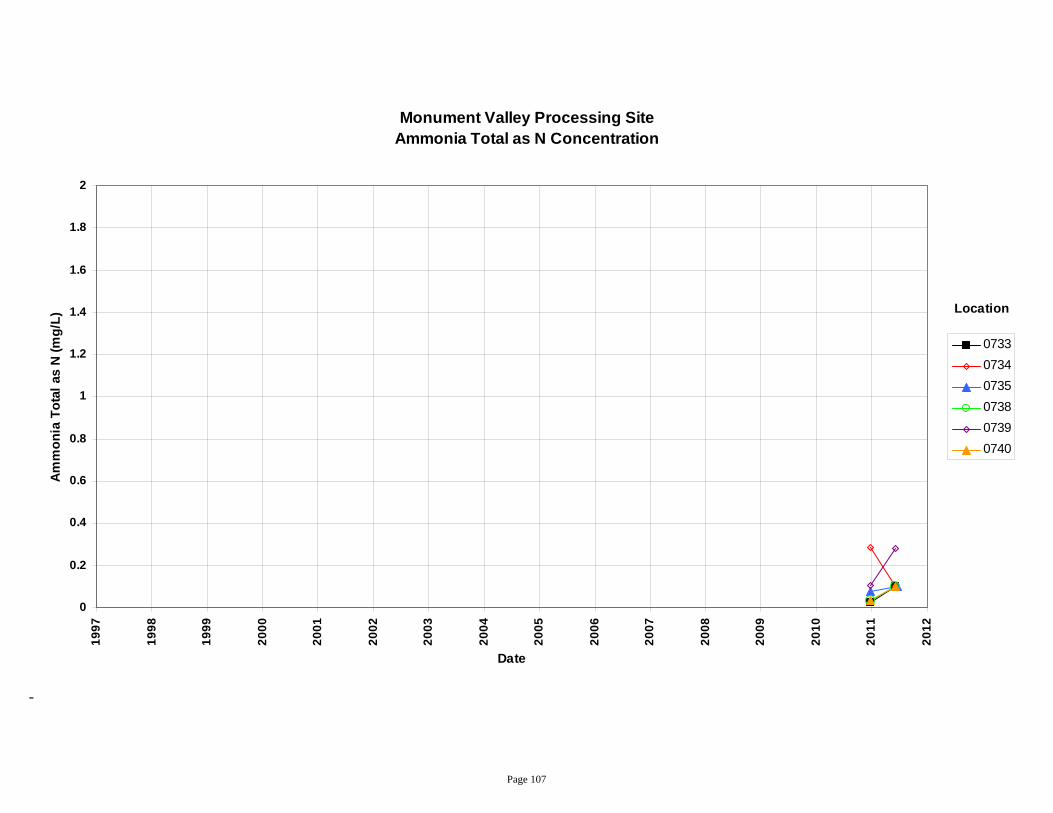
Page 107
Monument Valley Processing Site Ammonia Total as N Concentration
0
0.2
0.4
0.6
0.8
1
1.2
1.4
1.6
1.8
2
1997
1998
1999
2000
2001
2002
2003
2004
2005
2006
2007
2008
2009
2010
2011
2012
Date
Am
mon
ia T
otal
as
N (m
g/L)
073307340735073807390740
Location
-
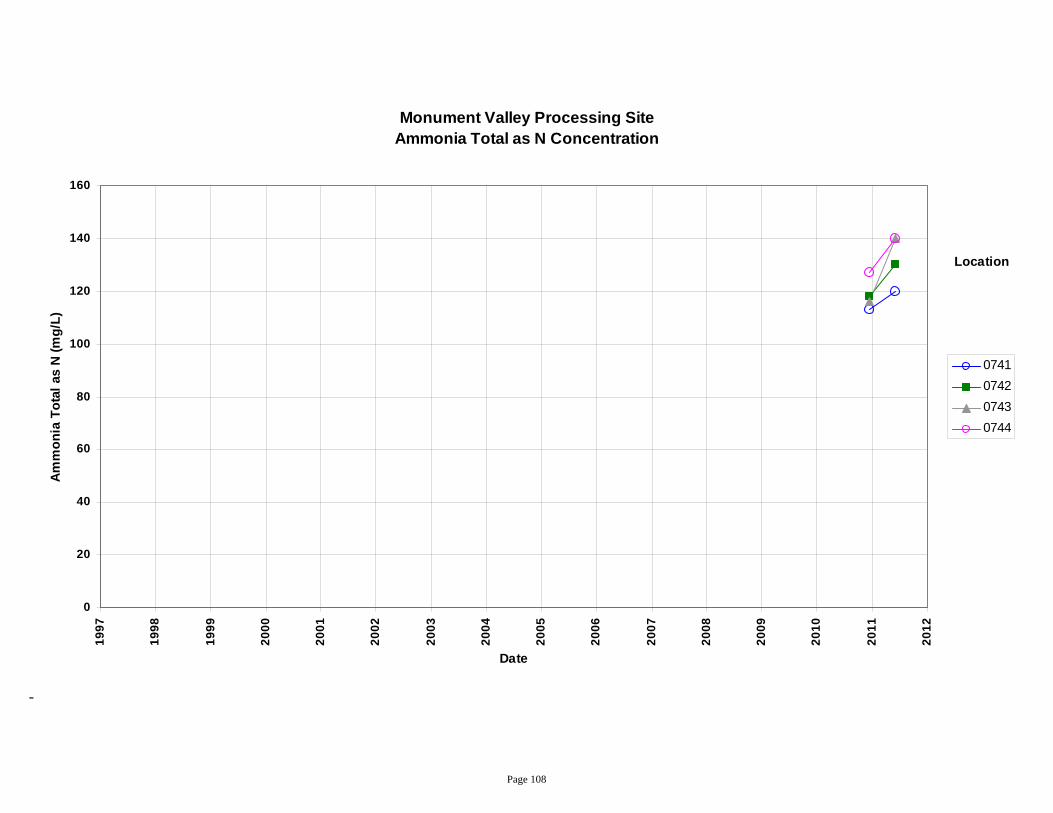
Page 108
Monument Valley Processing Site Ammonia Total as N Concentration
0
20
40
60
80
100
120
140
160
1997
1998
1999
2000
2001
2002
2003
2004
2005
2006
2007
2008
2009
2010
2011
2012
Date
Am
mon
ia T
otal
as
N (m
g/L)
0741074207430744
Location
-
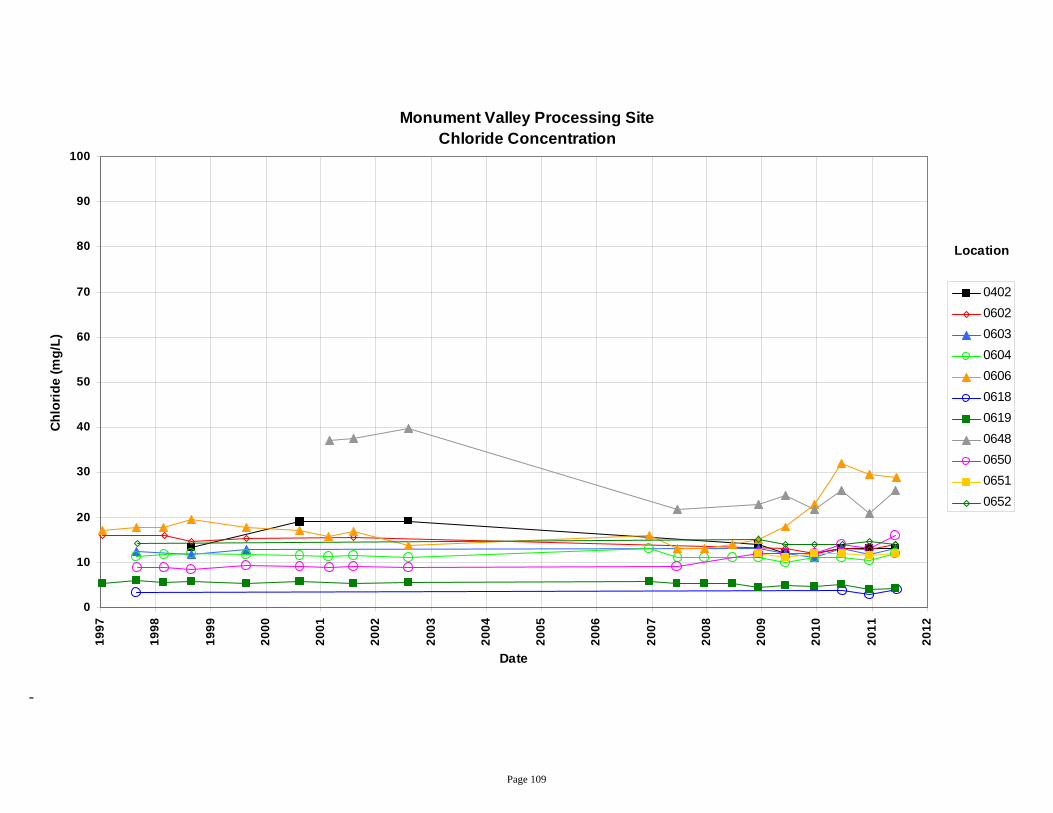
Page 109
Monument Valley Processing Site Chloride Concentration
0
10
20
30
40
50
60
70
80
90
100
1997
1998
1999
2000
2001
2002
2003
2004
2005
2006
2007
2008
2009
2010
2011
2012
Date
Chl
orid
e (m
g/L)
04020602060306040606061806190648065006510652
Location
-
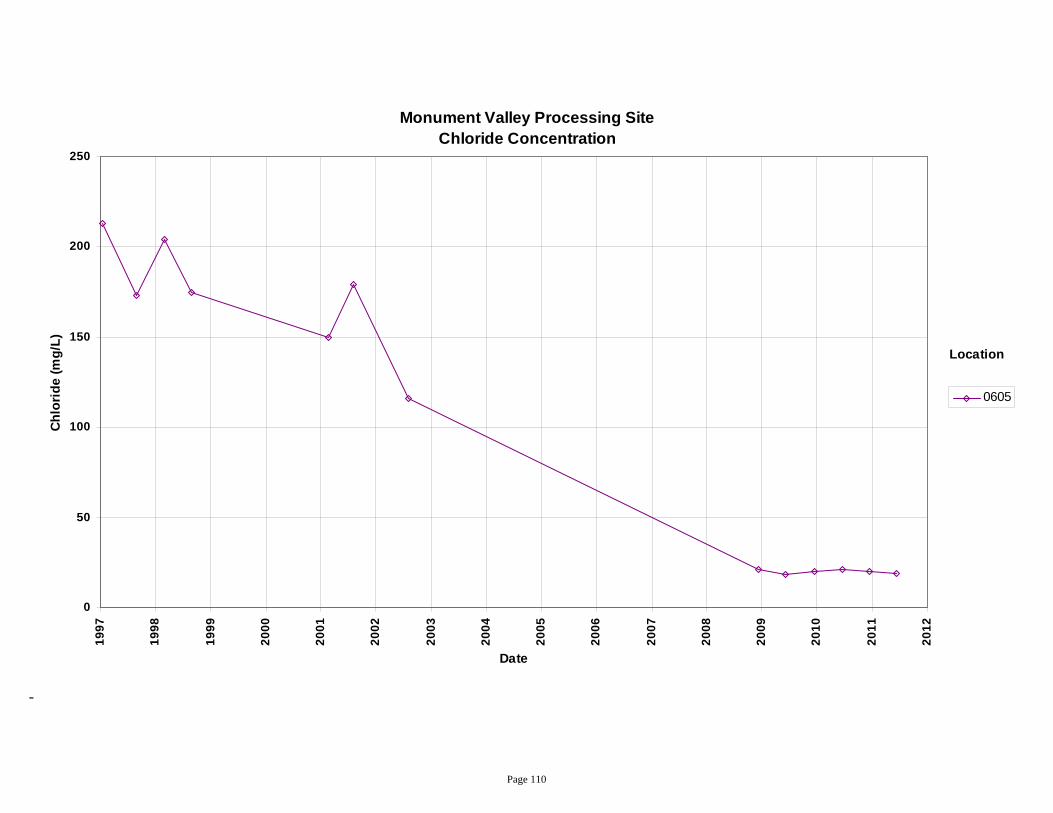
Page 110
Monument Valley Processing Site Chloride Concentration
0
50
100
150
200
250
1997
1998
1999
2000
2001
2002
2003
2004
2005
2006
2007
2008
2009
2010
2011
2012
Date
Chl
orid
e (m
g/L)
0605
Location
-

Page 111
Monument Valley Processing Site Chloride Concentration
0
10
20
30
40
50
60
70
80
90
100
1997
1998
1999
2000
2001
2002
2003
2004
2005
2006
2007
2008
2009
2010
2011
2012
Date
Chl
orid
e (m
g/L)
065306550656065706620669071107150719072707600761
Location
-
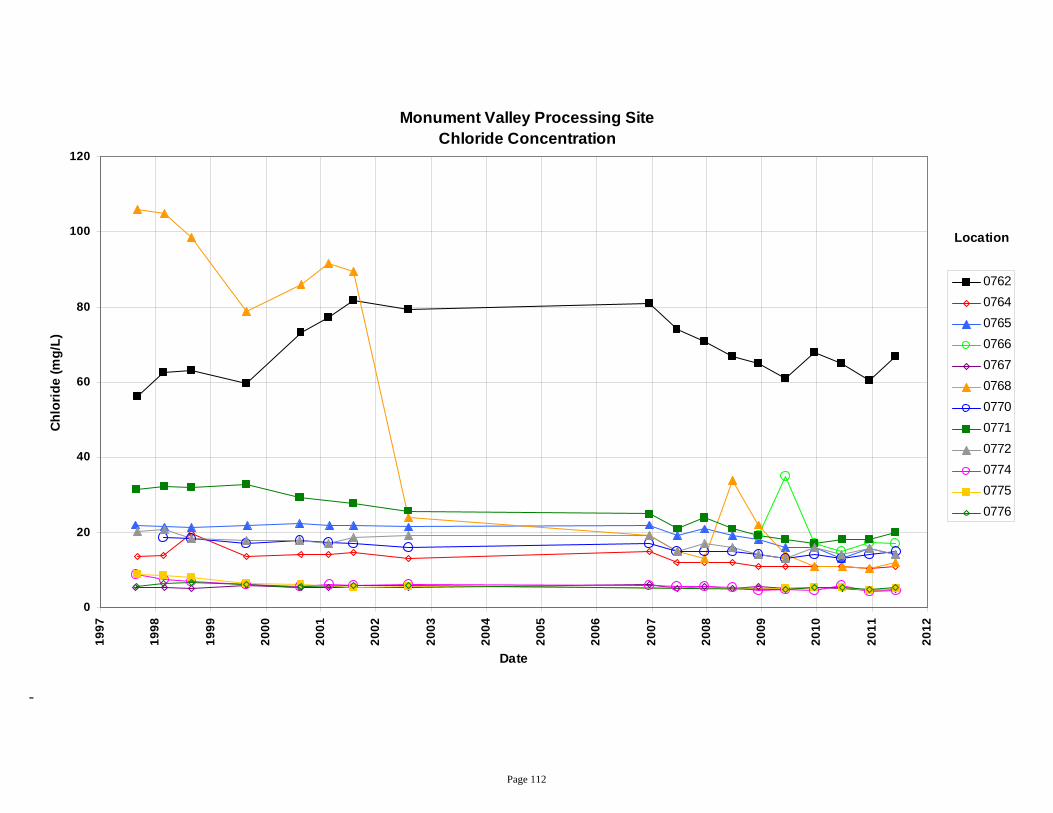
Page 112
Monument Valley Processing Site Chloride Concentration
0
20
40
60
80
100
120
1997
1998
1999
2000
2001
2002
2003
2004
2005
2006
2007
2008
2009
2010
2011
2012
Date
Chl
orid
e (m
g/L)
076207640765076607670768077007710772077407750776
Location
-
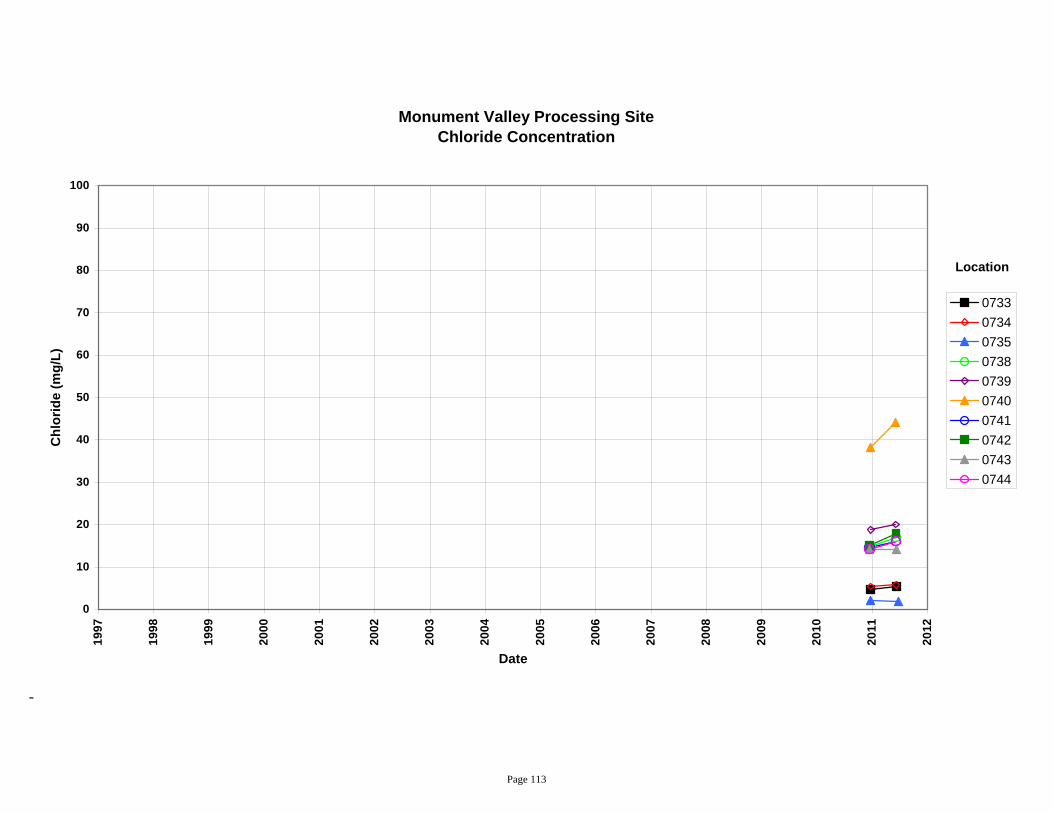
Page 113
Monument Valley Processing Site Chloride Concentration
0
10
20
30
40
50
60
70
80
90
100
1997
1998
1999
2000
2001
2002
2003
2004
2005
2006
2007
2008
2009
2010
2011
2012
Date
Chl
orid
e (m
g/L)
0733073407350738073907400741074207430744
Location
-
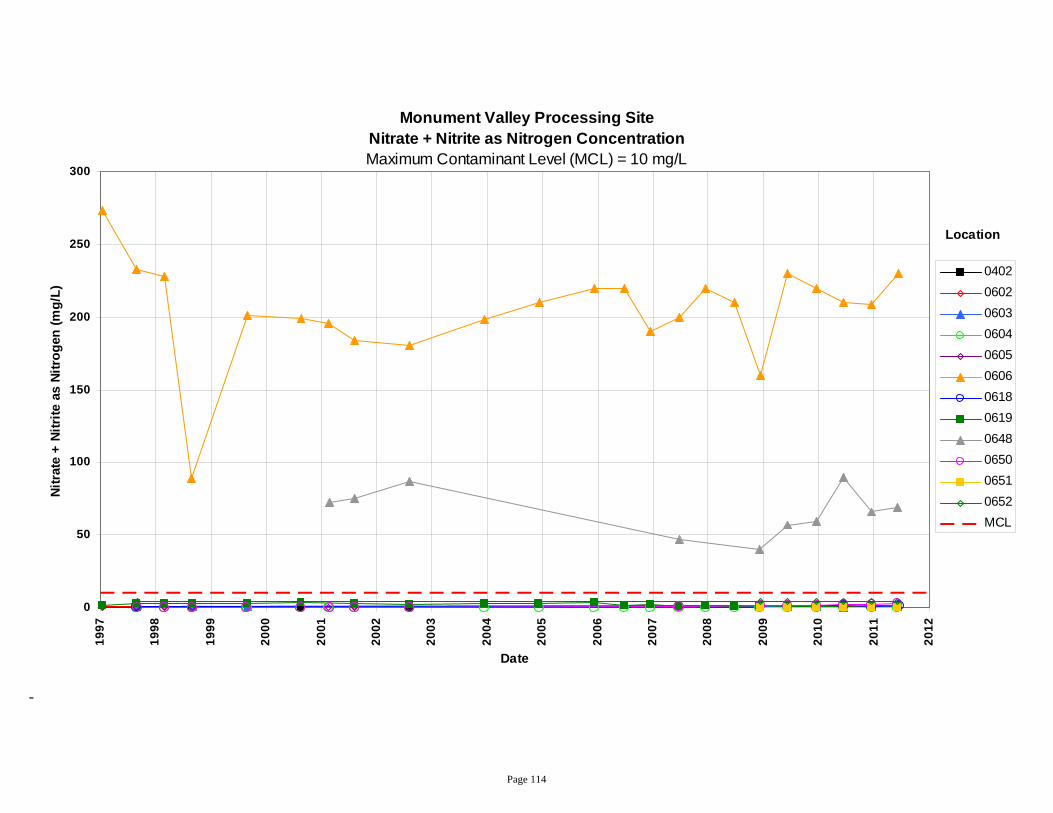
Page 114
Monument Valley Processing Site Nitrate + Nitrite as Nitrogen ConcentrationMaximum Contaminant Level (MCL) = 10 mg/L
0
50
100
150
200
250
300
1997
1998
1999
2000
2001
2002
2003
2004
2005
2006
2007
2008
2009
2010
2011
2012
Date
Nitr
ate
+ N
itrite
as
Nitr
ogen
(mg/
L)
040206020603060406050606061806190648065006510652MCL
Location
-
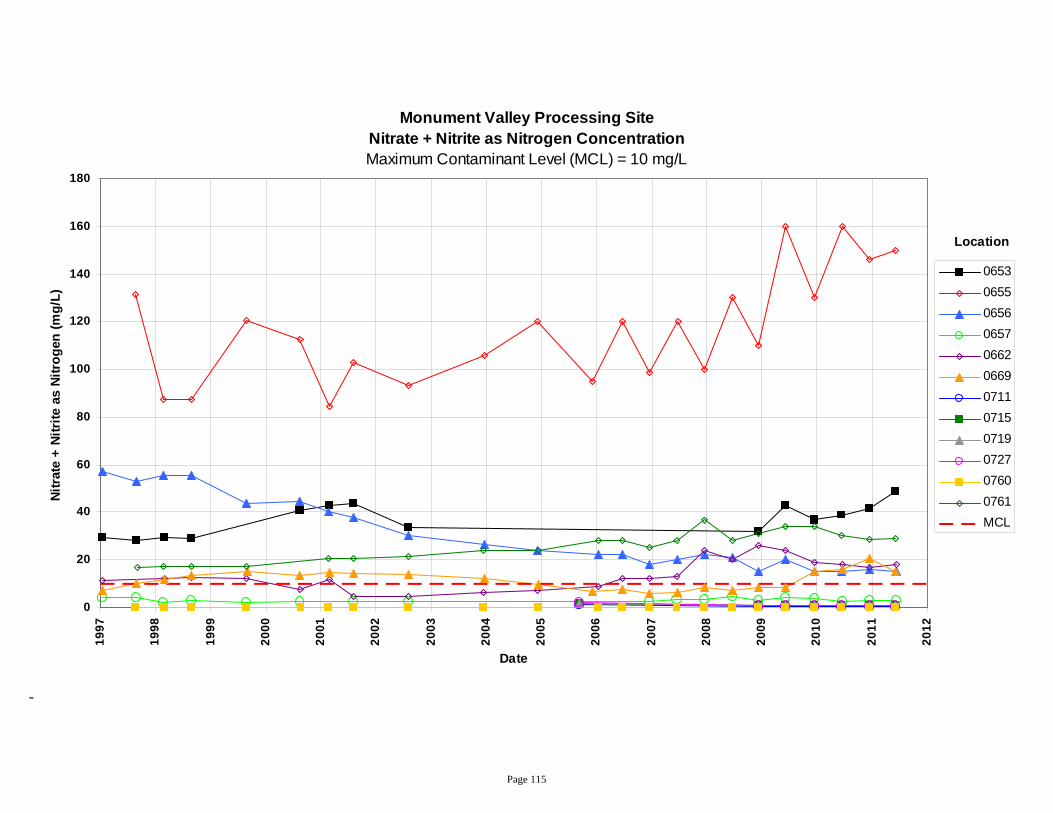
Page 115
Monument Valley Processing Site Nitrate + Nitrite as Nitrogen ConcentrationMaximum Contaminant Level (MCL) = 10 mg/L
0
20
40
60
80
100
120
140
160
180
1997
1998
1999
2000
2001
2002
2003
2004
2005
2006
2007
2008
2009
2010
2011
2012
Date
Nitr
ate
+ N
itrite
as
Nitr
ogen
(mg/
L)
065306550656065706620669071107150719072707600761MCL
Location
-
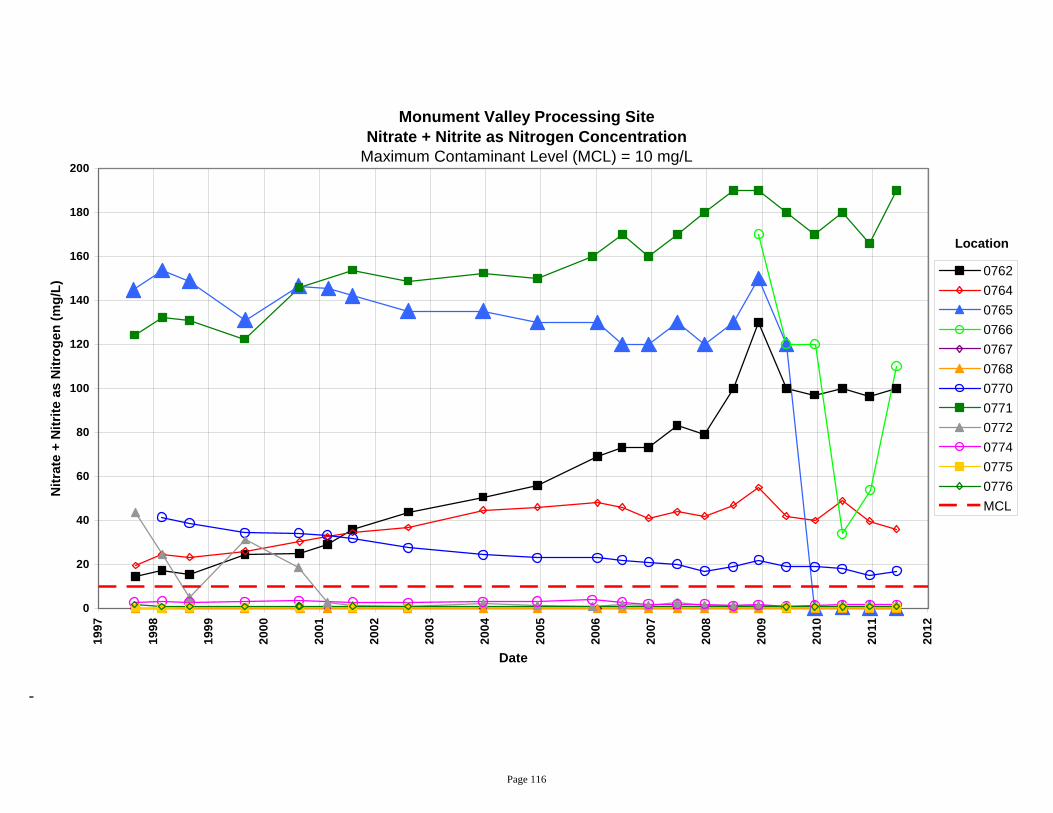
Page 116
Monument Valley Processing Site Nitrate + Nitrite as Nitrogen Concentration
Maximum Contaminant Level (MCL) = 10 mg/L
0
20
40
60
80
100
120
140
160
180
200
1997
1998
1999
2000
2001
2002
2003
2004
2005
2006
2007
2008
2009
2010
2011
2012
Date
Nitr
ate
+ N
itrite
as
Nitr
ogen
(mg/
L)
076207640765076607670768077007710772077407750776MCL
Location
-

Page 117
Monument Valley Processing Site Nitrate + Nitrite as Nitrogen ConcentrationMaximum Contaminant Level (MCL) = 10 mg/L
0
20
40
60
80
100
120
140
160
1997
1998
1999
2000
2001
2002
2003
2004
2005
2006
2007
2008
2009
2010
2011
2012
Date
Nitr
ate
+ Ni
trite
as
Nitr
ogen
(mg/
L) 0733073407350738073907400741074207430744MCL
Location
-
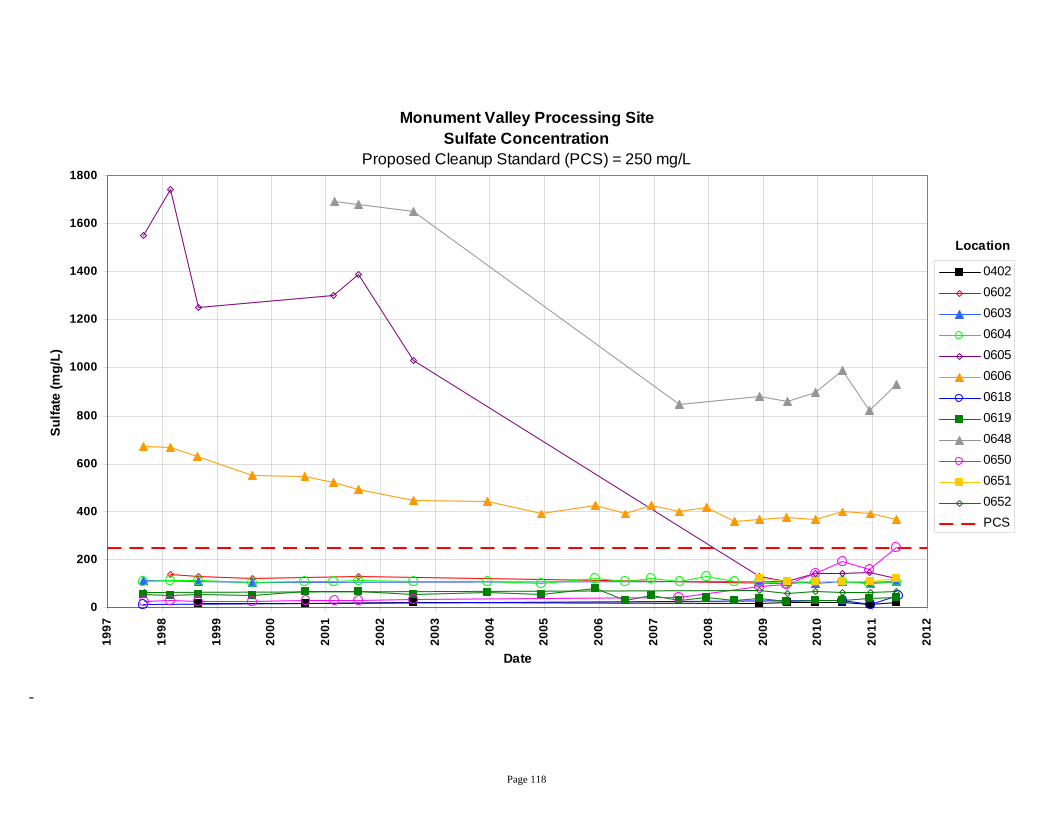
Page 118
Monument Valley Processing Site Sulfate Concentration
Proposed Cleanup Standard (PCS) = 250 mg/L
0
200
400
600
800
1000
1200
1400
1600
1800
1997
1998
1999
2000
2001
2002
2003
2004
2005
2006
2007
2008
2009
2010
2011
2012
Date
Sulfa
te (m
g/L)
040206020603060406050606061806190648065006510652PCS
Location
-

Page 119
Monument Valley Processing Site Sulfate Concentration
Proposed Cleanup Standard (PCS) = 250 mg/L
0
500
1000
1500
2000
2500
1997
1998
1999
2000
2001
2002
2003
2004
2005
2006
2007
2008
2009
2010
2011
2012
Date
Sulfa
te (m
g/L)
065306550656065706620669071107150719072707600761PCS
Location
-
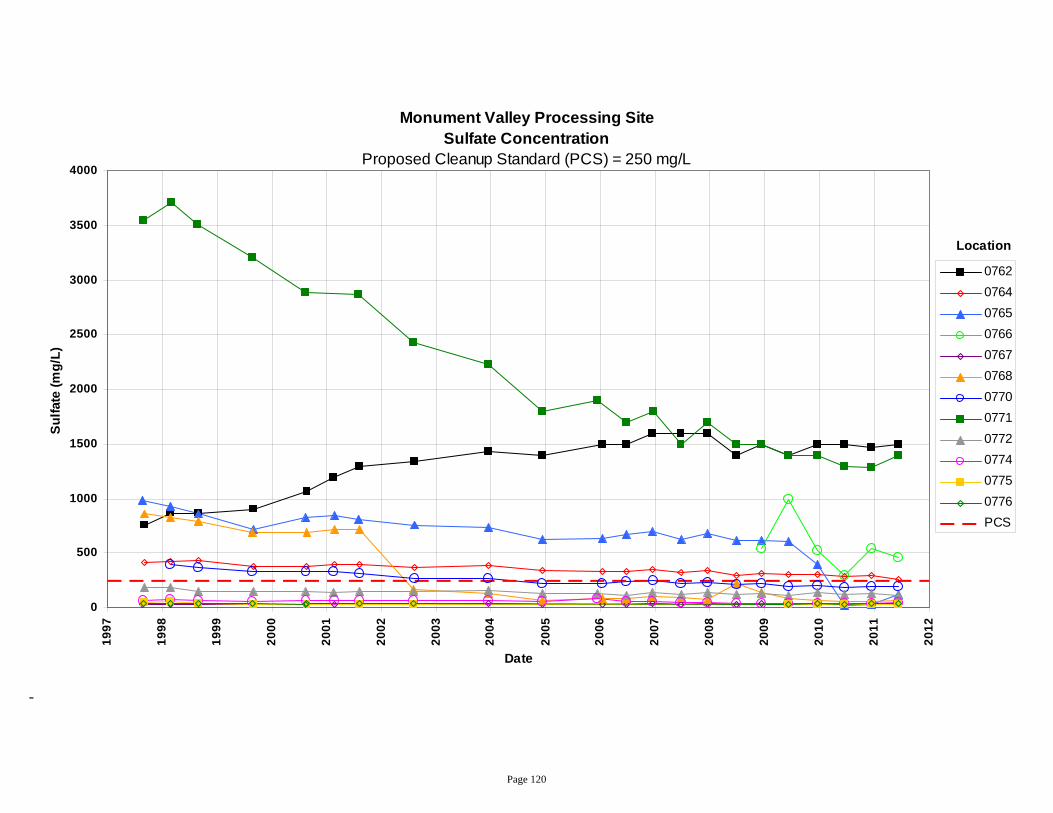
Page 120
Monument Valley Processing Site Sulfate Concentration
Proposed Cleanup Standard (PCS) = 250 mg/L
0
500
1000
1500
2000
2500
3000
3500
4000
1997
1998
1999
2000
2001
2002
2003
2004
2005
2006
2007
2008
2009
2010
2011
2012
Date
Sulfa
te (m
g/L)
076207640765076607670768077007710772077407750776PCS
Location
-

Page 121
Monument Valley Processing Site Sulfate Concentration
Proposed Cleanup Standard (PCS) = 250 mg/L
0
200
400
600
800
1000
1200
1997
1998
1999
2000
2001
2002
2003
2004
2005
2006
2007
2008
2009
2010
2011
2012
Date
Sul
fate
(mg/
L)
0733073407350738073907400741074207430744PCS
Location
-

Page 122
Monument Valley Processing Site Uranium Concentration
Maximum Contaminant Level (MCL) = 0.044 mg/L
0
0.01
0.02
0.03
0.04
0.05
0.06
0.07
0.08
0.09
1997
1998
1999
2000
2001
2002
2003
2004
2005
2006
2007
2008
2009
2010
2011
2012
Date
Ura
nium
(mg/
L)
040206020603060406050606061806190648065006510652MCL
Location
-
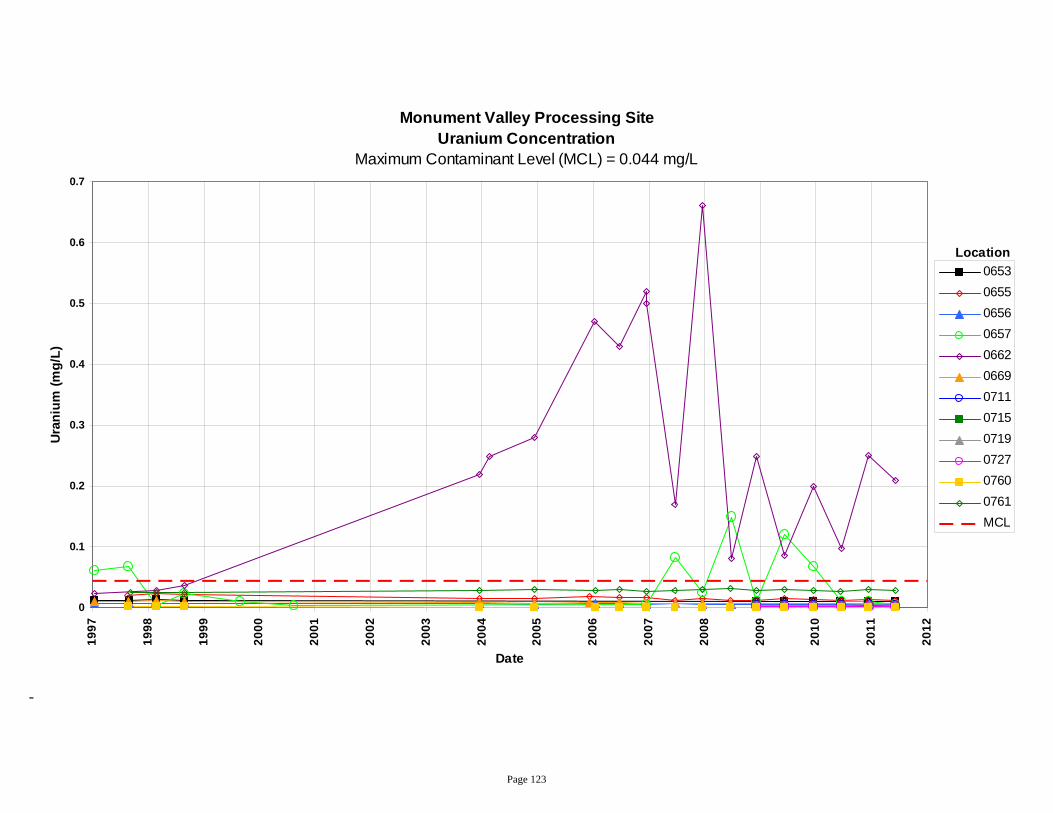
Page 123
Monument Valley Processing Site Uranium Concentration
Maximum Contaminant Level (MCL) = 0.044 mg/L
0
0.1
0.2
0.3
0.4
0.5
0.6
0.7
1997
1998
1999
2000
2001
2002
2003
2004
2005
2006
2007
2008
2009
2010
2011
2012
Date
Ura
nium
(mg/
L)
065306550656065706620669071107150719072707600761MCL
Location
-
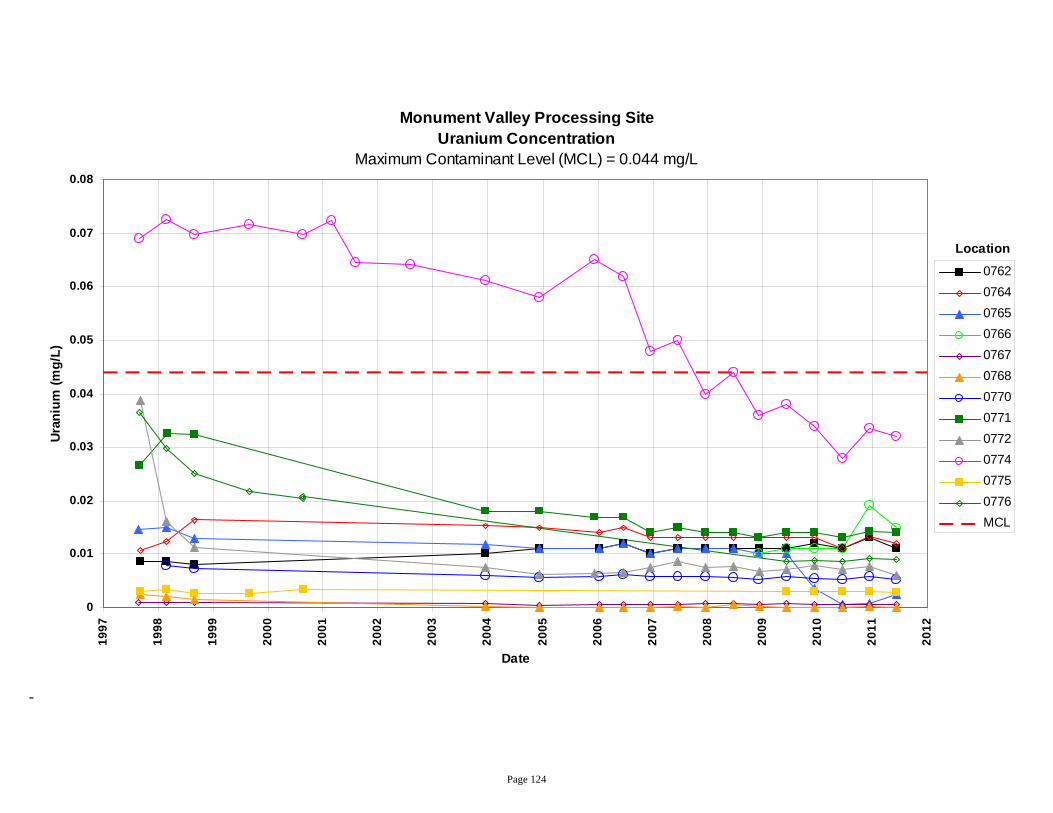
Page 124
Monument Valley Processing Site Uranium Concentration
Maximum Contaminant Level (MCL) = 0.044 mg/L
0
0.01
0.02
0.03
0.04
0.05
0.06
0.07
0.08
1997
1998
1999
2000
2001
2002
2003
2004
2005
2006
2007
2008
2009
2010
2011
2012
Date
Uran
ium
(mg/
L)
076207640765076607670768077007710772077407750776MCL
Location
-
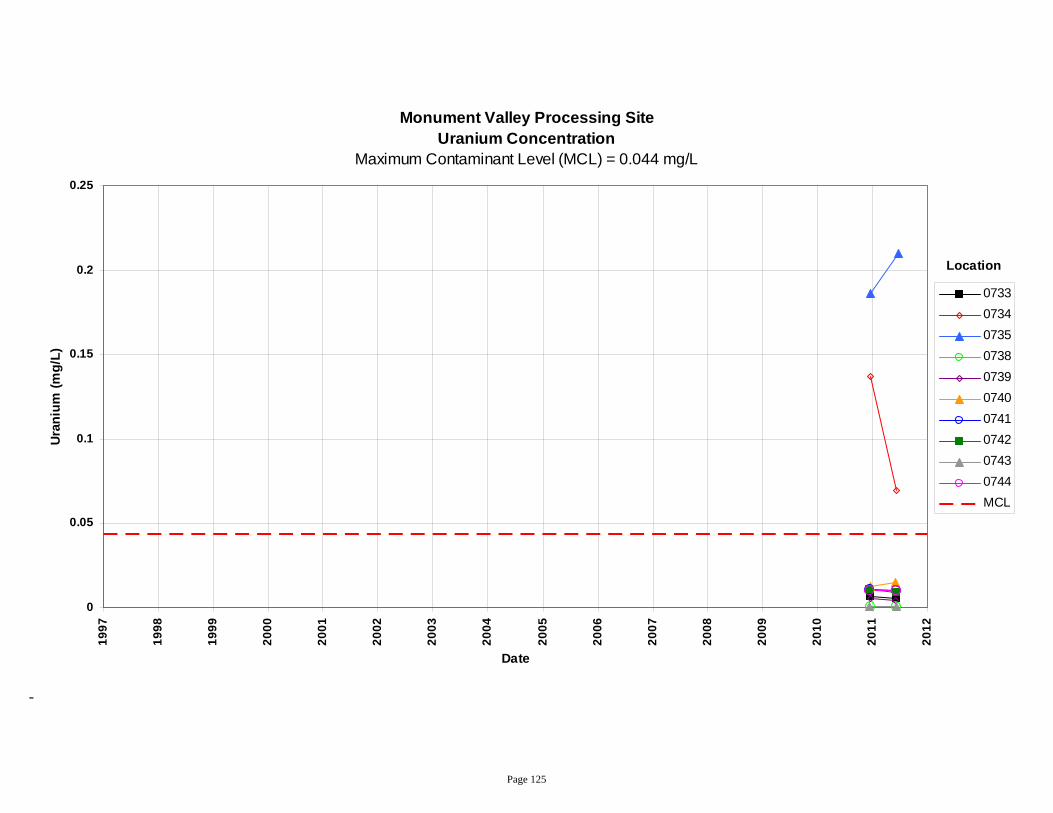
Page 125
Monument Valley Processing Site Uranium Concentration
Maximum Contaminant Level (MCL) = 0.044 mg/L
0
0.05
0.1
0.15
0.2
0.25
1997
1998
1999
2000
2001
2002
2003
2004
2005
2006
2007
2008
2009
2010
2011
2012
Date
Ura
nium
(mg/
L)
0733073407350738073907400741074207430744MCL
Location
-

Page 126
Monument Valley Processing Site Vanadium Concentration
0
0.01
0.02
0.03
0.04
0.05
0.06
0.07
0.08
0.09
0.1
1997
1998
1999
2000
2001
2002
2003
2004
2005
2006
2007
2008
2009
2010
2011
2012
Date
Vana
dium
(mg/
L)
040206020603060406050606061806190648065006510652
Location
-
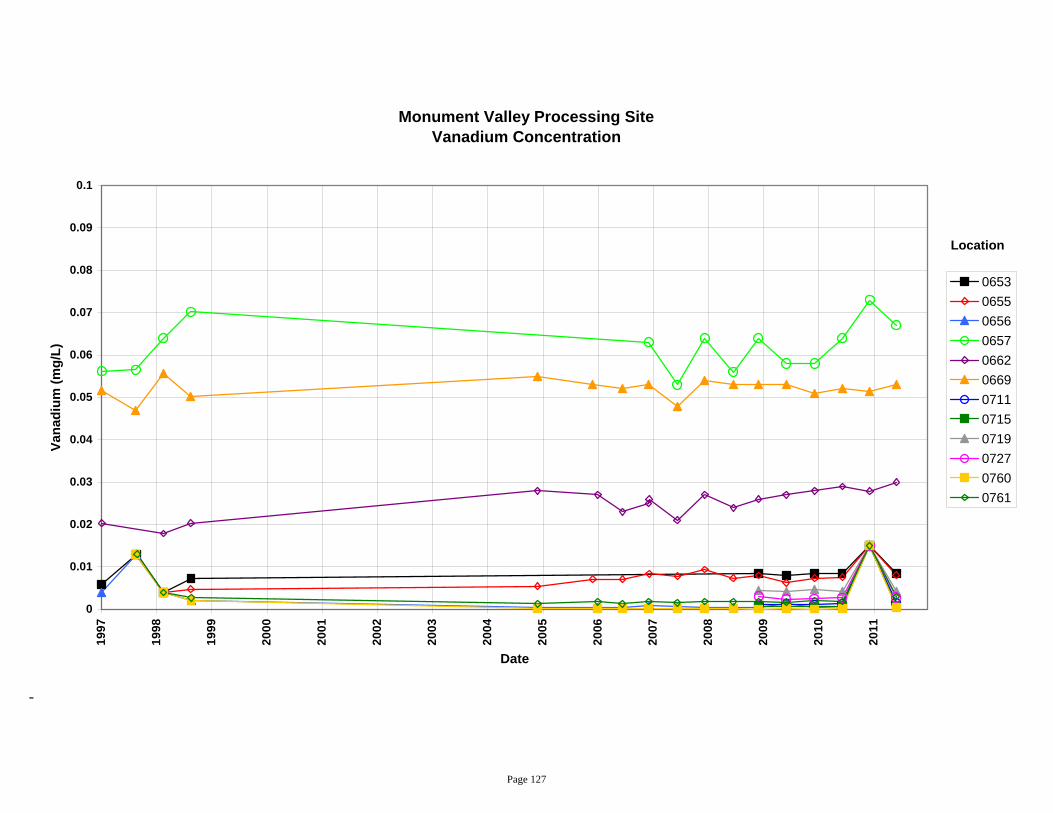
Page 127
Monument Valley Processing Site Vanadium Concentration
0
0.01
0.02
0.03
0.04
0.05
0.06
0.07
0.08
0.09
0.1
1997
1998
1999
2000
2001
2002
2003
2004
2005
2006
2007
2008
2009
2010
2011
Date
Vana
dium
(mg/
L)
065306550656065706620669071107150719072707600761
Location
-

Page 128
Monument Valley Processing Site Vanadium Concentration
0
0.01
0.02
0.03
0.04
0.05
0.06
0.07
0.08
0.09
0.1
1997
1998
1999
2000
2001
2002
2003
2004
2005
2006
2007
2008
2009
2010
2011
2012
Date
Vana
dium
(mg/
L)
076207640765076607670768077007710772077407750776
Location
-
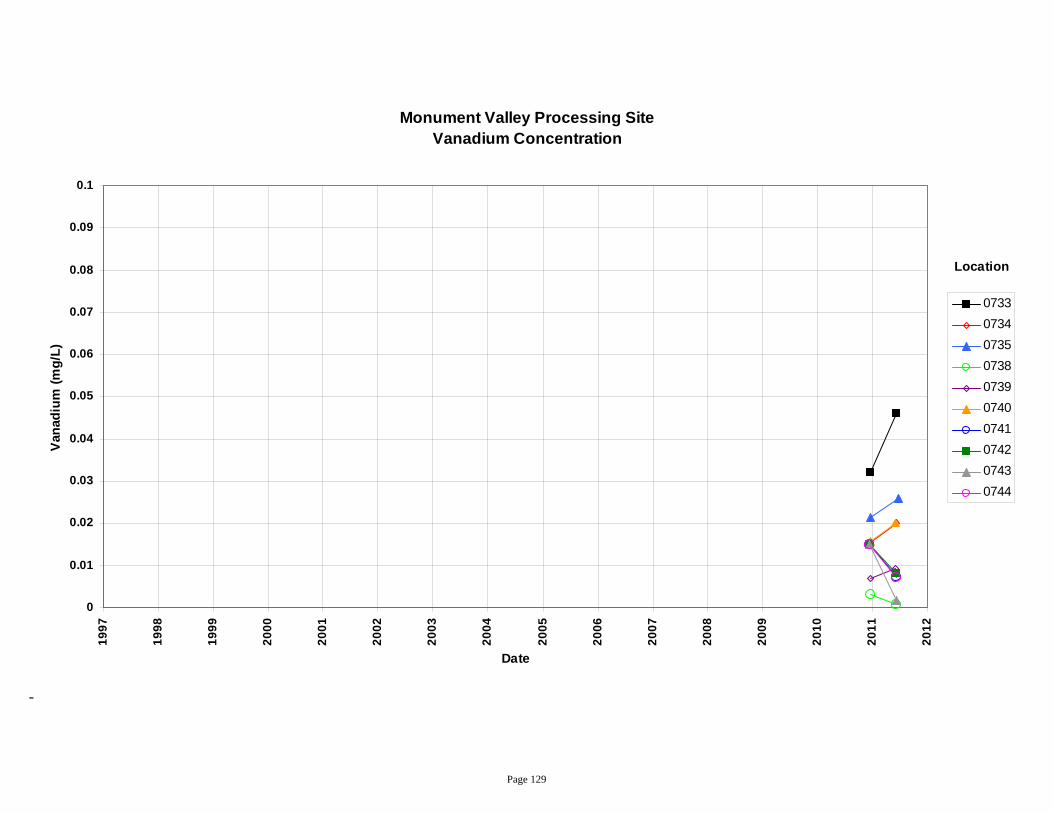
Page 129
Monument Valley Processing Site Vanadium Concentration
0
0.01
0.02
0.03
0.04
0.05
0.06
0.07
0.08
0.09
0.1
1997
1998
1999
2000
2001
2002
2003
2004
2005
2006
2007
2008
2009
2010
2011
2012
Date
Van
adiu
m (m
g/L)
0733073407350738073907400741074207430744
Location
-

Page 130
This page intentionally left blank
Page 131
Attachment 3 Sampling and Analysis Work Order
Page 132
This page intentionally left blank
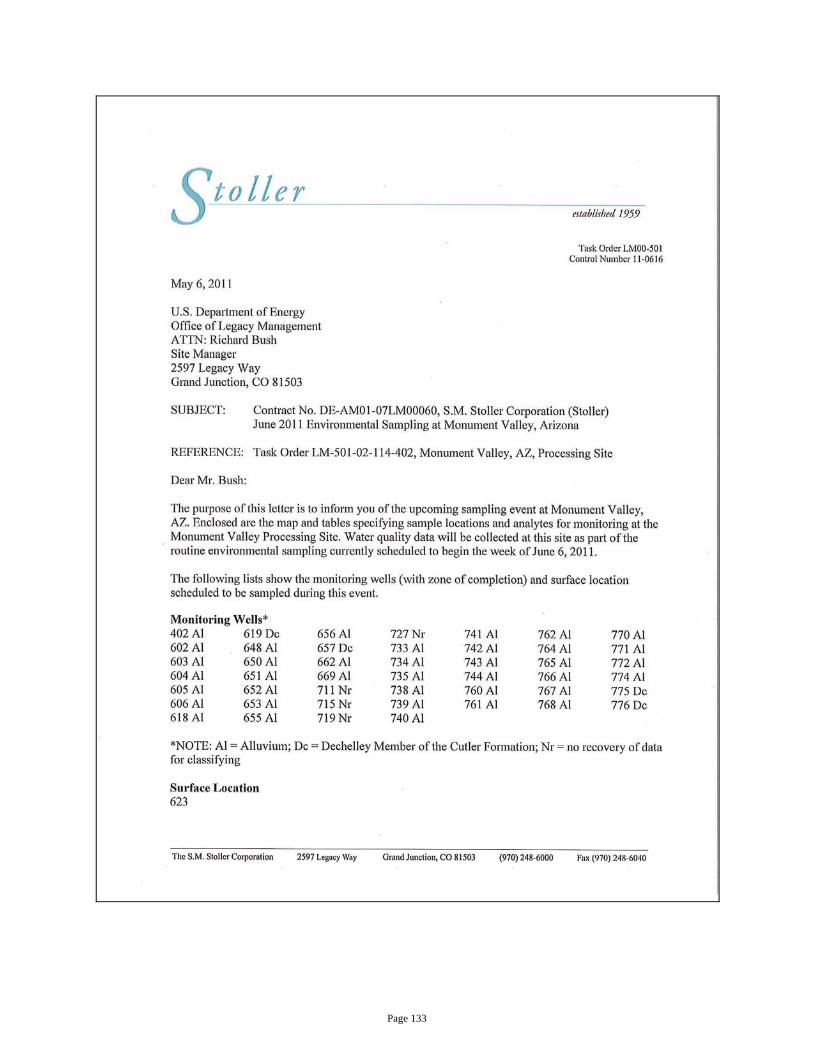
Page 133
Page 134
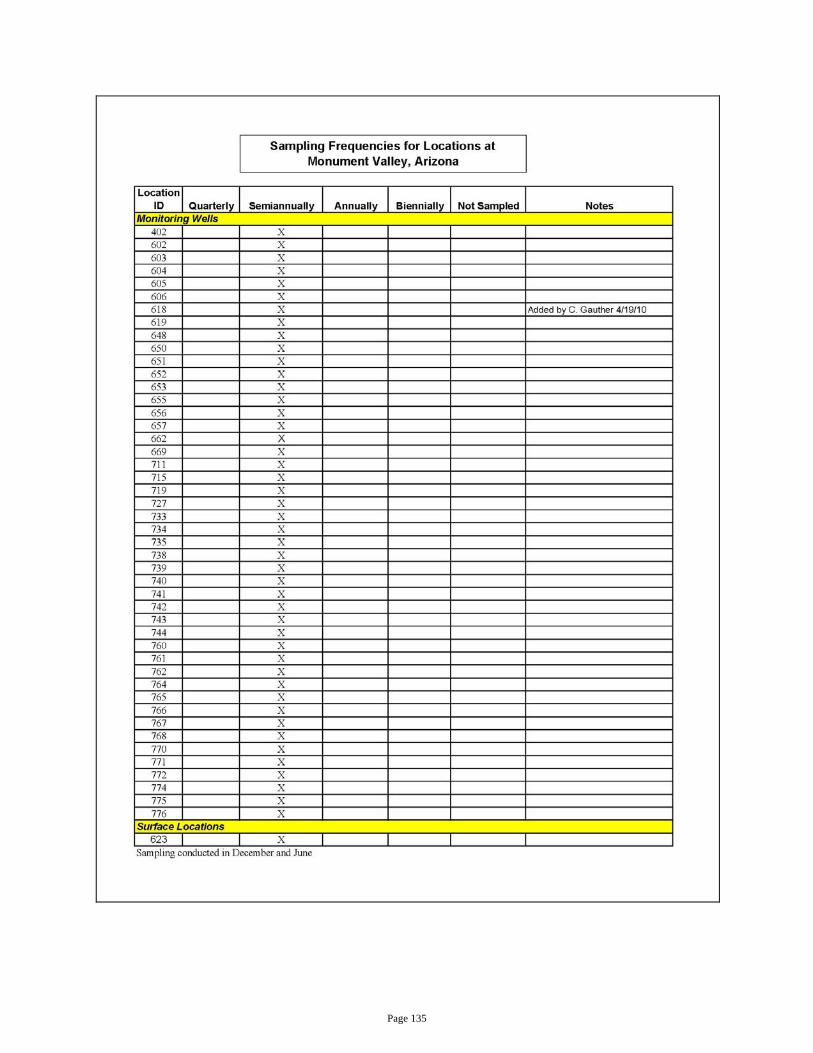
Page 135
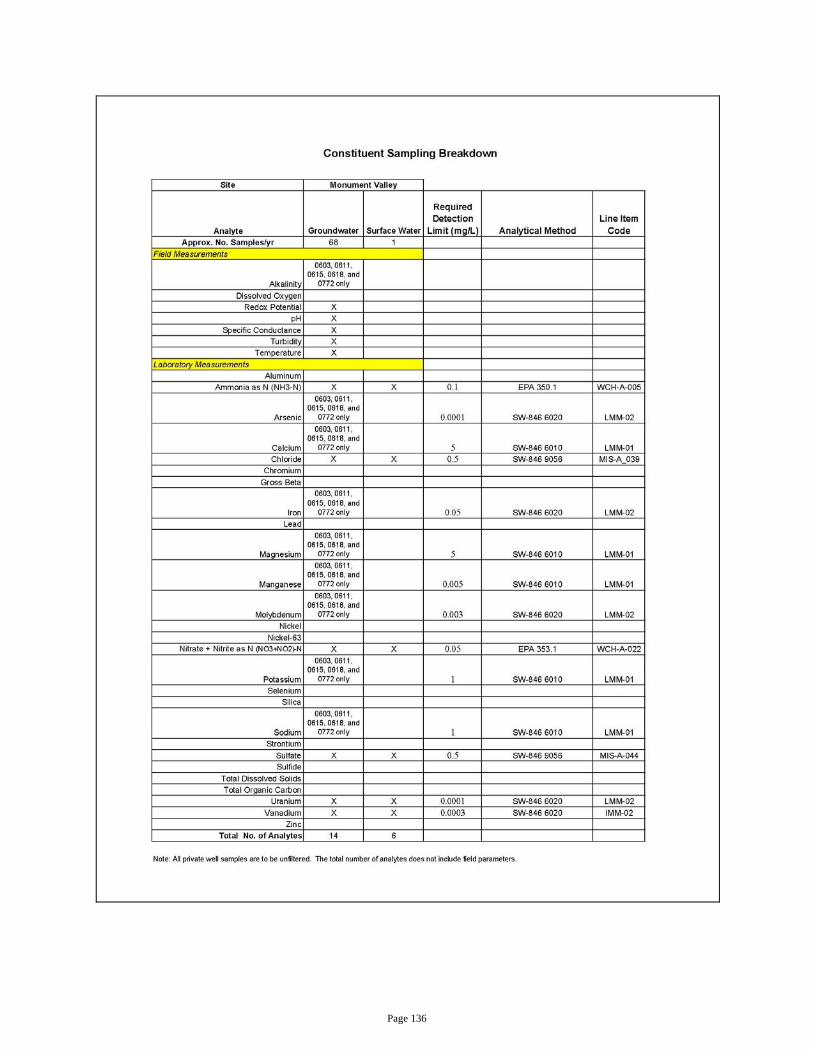
Page 136
Page 137
Attachment 4 Trip Report
Page 138
This page intentionally left blank

Page 139
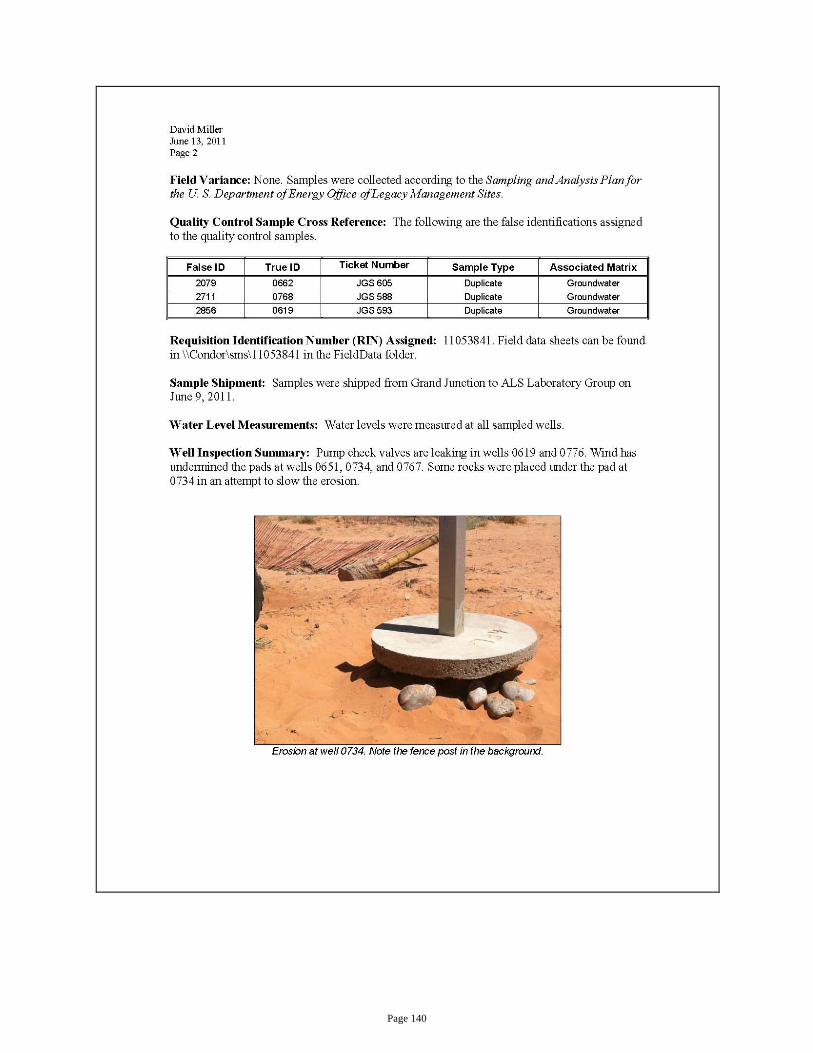
Page 140

Page 141
Page 142
This page intentionally left blank
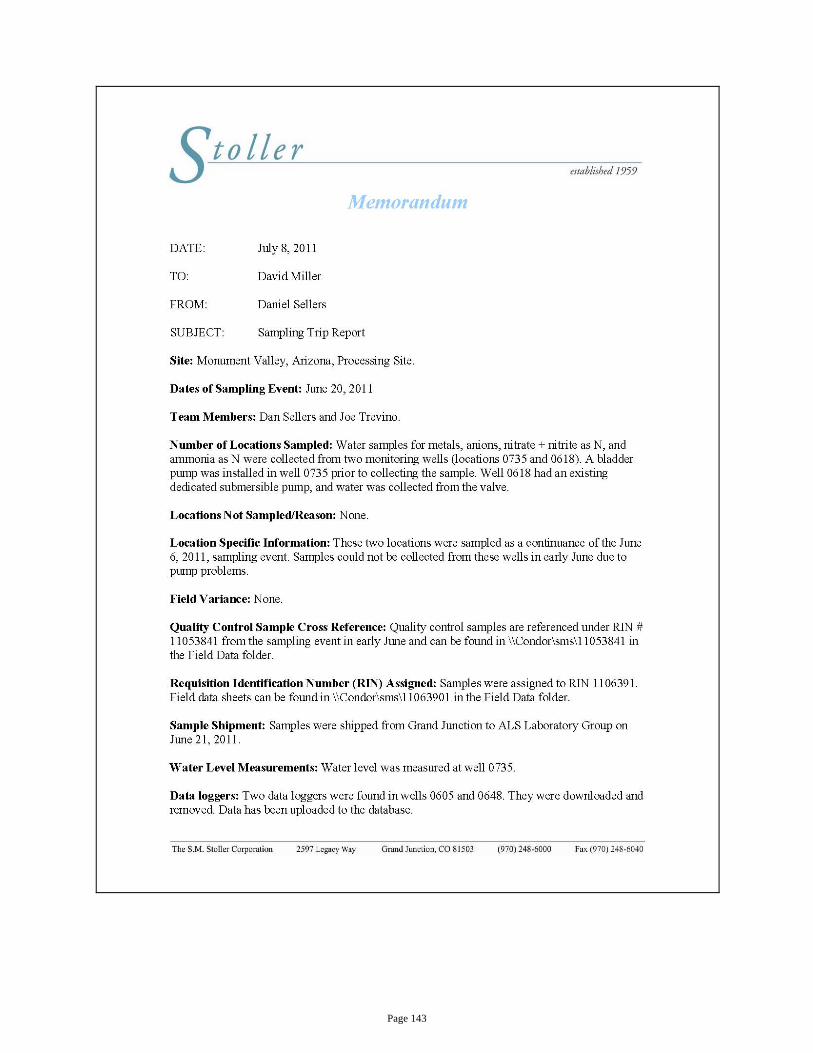
Page 143
Page 144