June 1988 CALIFORNIA DAIRY · MAJOR CONTRIBUTORS TO THIS FACT SHEET 31 Total Milk ... Average Milk...
36
iSA0 I’z;Ap0’/ / * United States General Accounting Office Fact Sheet for the Chairman, Committee ’ on Agriculture, Nutrition, and Forestry, U.S. Senate June 1988 CALIFORNIA DAIRY Production, Sales, and Product Disposition 136077 GAO/RCED-8848OFS J
Transcript of June 1988 CALIFORNIA DAIRY · MAJOR CONTRIBUTORS TO THIS FACT SHEET 31 Total Milk ... Average Milk...

iSA0
I’z;Ap0’/ / * United States General Accounting Office
Fact Sheet for the Chairman, Committee ’ on Agriculture, Nutrition, and Forestry, U.S. Senate
June 1988 CALIFORNIA DAIRY
Production, Sales, and Product Disposition
136077
GAO/RCED-8848OFS J


GA!0 united states General Accounting Oface Washington, D.C. 20548
Besonrces, Community, and Economic Development Division
B-227742
June 15, 1988
The Honorable Patrick J. Leahy Chairman, Committee on Agriculture,
Nutrition, and Forestry United States Senate
Dear Mr. Chairman:
As requested, this fact sheet presents information on California's (1) milk production, (2) costs of production and economic returns to milk production, (3) pricing system for grade A milk, and (4) manufacture and disposition of butter, nonfat dry milk, and cheese. California, the major milk-producing state west of the Rocky Mountains, is not covered by the federal milk marketing order system.'
In summary,
-- Milk production in California has grown faster than in the nation as a whole. California supplied 12.6 percent of the milk produced in the united States in 1987 compared to 10.6 percent in 1980.
-- Costs of production (for concentrates, forage, hired labor, and interest) from 1981 to 1986 were high in California relative to other regions. Overhead expenses, taxes, insurance, and capital replacement costs were lower for California than for the Upper Midwest, Corn Belt, and Northeast regions. Residual returns2 to
1 Federal milk marketing orders set forth acceptable marketing practices, terms and conditions of sale, and prices.
2According to the Economic Research Service, U.S. Department of Agriculture, residual returns are cash receipts less all costs of production, including the cost of providing land, labor, and capital to a milk production operation.
1
B-227742
--
--
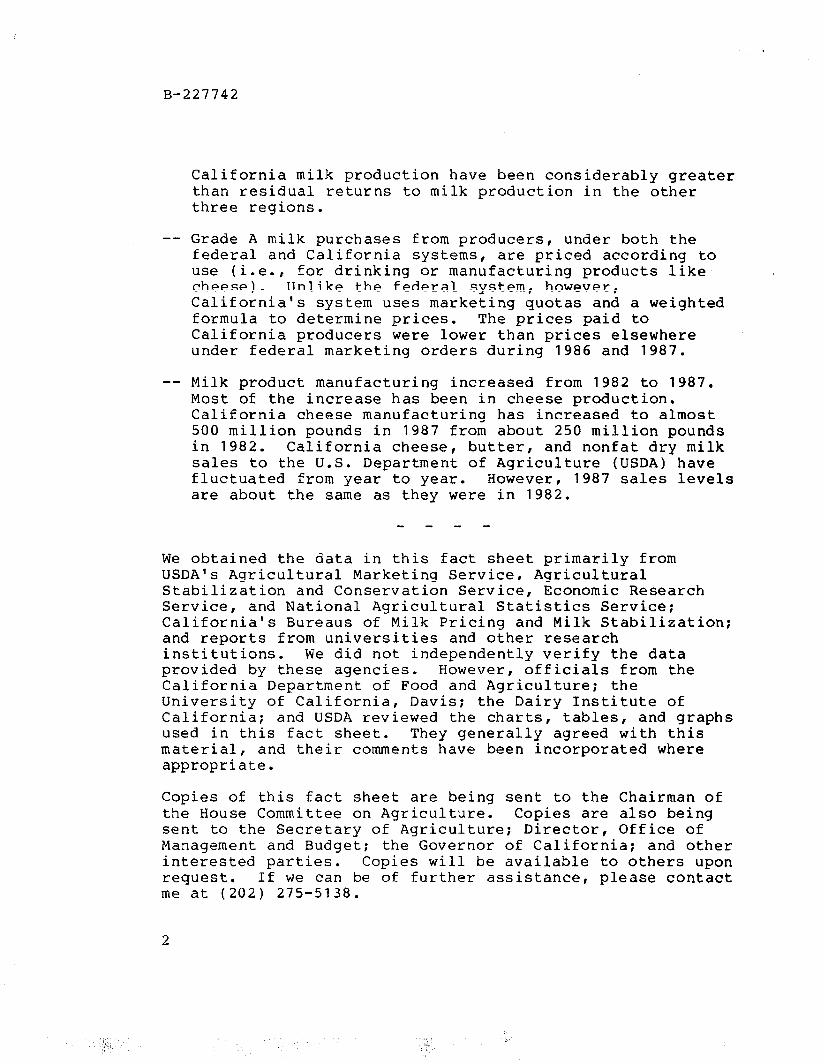
California milk production have been considerably greater than residual returns to milk production in the other three regions.
Grade A milk purchases from producers, under both the federal and California systems, are priced according to use (i.e., for drinking or manufacturing products like cheese). Unlike the federal system, however, California's system uses marketing quotas and a weighted formula to determine prices. The prices paid to California producers were lower than prices elsewhere under federal marketing orders during 1986 and 1987.
Milk product manufacturing increased from 1982 to 1987. Most of the increase has been in cheese production. California cheese manufacturing has increased to almost 500 million pounds in 1987 from about 250 million pounds in 1982. California cheese, butter, and nonfat dry milk sales to the U.S. Department of Agriculture (USDA) have fluctuated from year to year. However, 1987 sales levels are about the same as they were in 1982.
We obtained the data in this fact sheet primarily from USDA's, Agricultural Marketing Service, Agricultural Stabilization and Conservation Service, Economic Research Service, and National Agricultural Statistics Service; California's Bureaus of Milk Pricing and Milk Stabilization; and reports from universities and other research institutions. We did not independently verify the data provided by these agencies. However, officials from the California Department of Food and Agriculture; the University of California, Davis: the Dairy Institute of California; and USDA reviewed the charts, tables, and graphs used in this fact sheet. They generally agreed with this material, and their comments have been incorporated where appropriate.
Copies of this fact sheet are being sent to the Chairman of the House Committee on Agriculture. Copies are also being sent to the Secretary of Agriculture; Director, Office of Management and Budget; the Governor of California; and other interested parties. Copies will be available to others upon request. If we can be of further assistance, please contact me at (202) 275-5138.
2
B-227742
Major contributors to this fact sheet are listed in appendix I.
Sincerely yours,
Brian P Crowley Senior ksociate Director

CONTENTS
LETTER
SECTION
1
2
3
4
APPENDIX
I
TABLE
1.1
1.2
1.3
2.1
2.2
2.3 Residual Returns for Four Regions, 1981-86 20
3.1 Comparison of Federal Milk Marketing Orders and the California Milk Marketing System 22
3.2
3.3
Page
1
CALIFORNIA DAIRY PRODUCTION 6
COSTS OF PRODUCTION AND ECONOMIC RETURNS TO CALIFORNIA DAIRY OPERATIONS 10
PRICING GRADE A MILK IN CALIFORNIA: A COMPARISON WITH THE FEDERAL MARKETING ORDER SYSTEM 21
CALIFORNIA'S PRODUCTION AND DISPOSITION OF BUTTER, NONFAT DRY MILK, AND CHEESE 26
MAJOR CONTRIBUTORS TO THIS FACT SHEET 31
Total Milk Production on Farms, 1980-87 6
Average Number of Milk Cows on Farms, 1980-87 7
Average Milk Yields of Dairy Cows, 1980-87 . 9
Costs of Concentrates, Forage, Hired Labor, and Interest in Milk Production, 1980-86 13
Economic Costs of Milk Production for Four Regions, 1981-86 18
Federal Marketing Order and California Class I Prices, February 1986-February 1988 24
Minnesota-Wisconsin (M-W) and California Overbase Prices, January 1986-February 1988 25
4
FIGURE
1.1
2.1
2.2
2.3
2.4
2.5
2.6
2.7
4.1
4.2
4.3
4.4
4.5
GAO RCED
USDA
Size of California and U.S. Dairy Herds, 1982
U.S. Dairy Production Regions
Cost of Concentrates, 1981-86
Cost of Forage, 1981-86
Cost of Hired Labor, 1981-86
Cost of Interest, 1981-86
Economic Costs, 1981-86
Residual Returns, 1981-86
Fluid and Processed Product Disposition of California Milk, 1986
Class I and Manufacturing Use of California Milk, 1981-87
California Butter Production and Sales to USDA, 1982-87
California Nonfat Dry Milk Production and Sales to USDA, 1982-87
California Cheese Production and Sales to USDA, 1982-87
ABBREVIATIONS
General Accounting Office Resources, Community, and Economic Development
Division U.S. Department of Agriculture
Page
8
11
14
15
16
17
19
20
26
27
28
29
30
5

SECTION 1
CALIFORNIA DAIRY PRODUCTION
This section presents information on California milk production, number of cows, and the average yield per cow.
Table 1.1 shows that of the 15-billion-pound increase in total milk production on U.S. farms between 1980 and 1987, more than 3.5 billion pounds came from California. California increased its share of total U.S. milk production from 10.6 percent to 12.6 percent.
Table 1.1: Total Milk Production on Farms, 1980-87
Year
1980 13,577 128,525 10.6 1981 14,248 133,013 10.7 1982 14,528 135,505 10.7 1983 14,743 139,672 10.6 1984 15,299 135,450 11.3 1985 16,768 143,147 11.7 1986 17,235 143,381 12.0 1987 17,934 142,462 12.6
California U.S. --(millions of pounds)--
California as a percent of U.S.
Source: National Agricultural Statistics Service, USDA.
6

Table 1.2 shows that the number of milk cows and heifers that had calved in the United States was -approximately the same during 1987 as during 7980. The number of California cows and heifers increased about 100 thousand to nearly one million. We did not obtain information on the source of the increased herd, whether from California or imported from other states.
Table 1.2: Average Number of Milk Cows on Farms, 1980-87
Year
1980 896 10,810 8.3 1981 923 10,923 8.5 1982 940 11,011 8.5 1983 951 11,098 8.6 1984 967 10,833 8.9 1985 1,004 11,016 9.1 1986 1,013 10,839 9.3 1987 998 10,334 9.7
California ________ (thousands)---"!!
California as a percent of U.S.
Source: National Agricultural Statistics Service, USDA. California Dairy Industry Statistics, 1986, California Department of Food and Agriculture
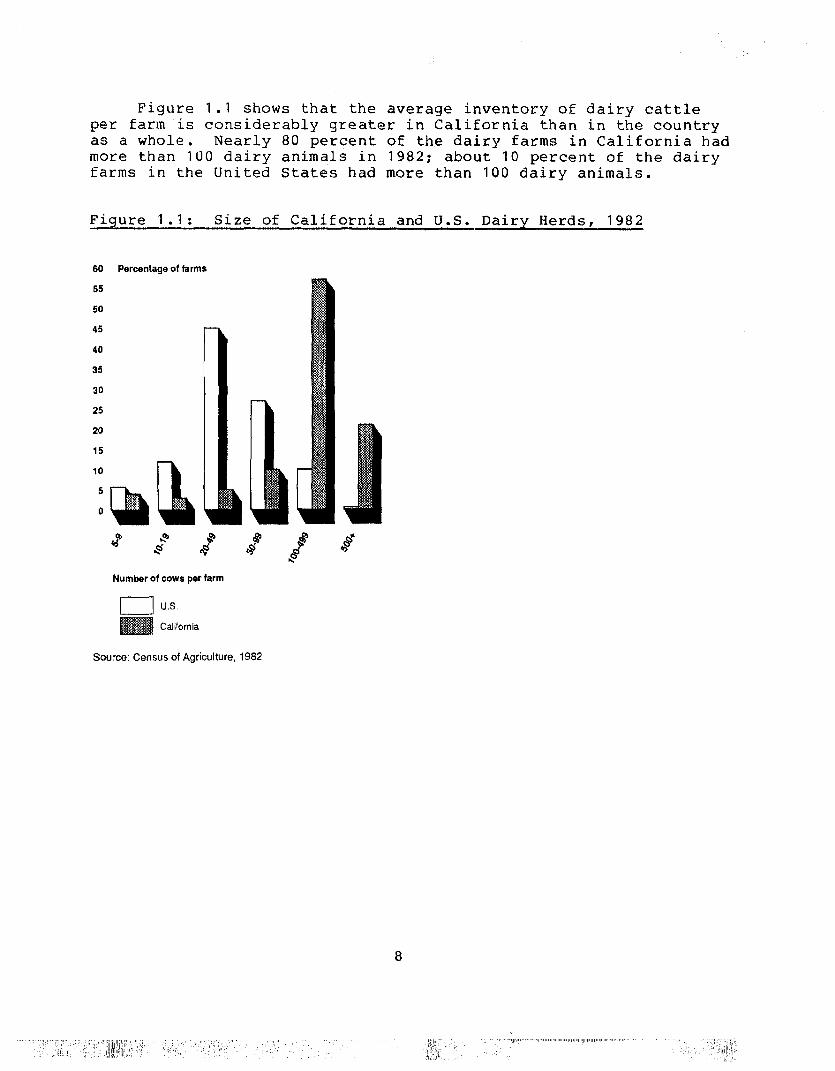
Figure 1.1 shows that the average inventory of dairy cattle per farm is considerably greater in California than in the country as a whole. Nearly 80 percent of the dairy farms in California had more than 100 dairy animals in 1982; about 10 percent of the dairy farms in the United States had more than 100 dairy animals.
Figure 1.1: Size of California and U.S. Dairy Herds, 1982
60 Percentaga of farms
55
50
45
40
35
30
25
20
15
10
5
0
Number of cows per farm
u U.S. Cal ifomia
Source: Census of Agriculture, 1982
8

Table 1.3 shows that, from 1980 through 1987, the difference between the average milk yield per cow in California and in the United States widened from over 3,200 pounds per year to almost 4,200 pounds.
Table 1.3: Average Milk Yields of Dairy Cows, 1980-87
Year Difference
California between y' --------------(pounds ~yea,,---------!_elds
1980 15,153 11,889 3,264 1981 15,437 12,177 3,260 1982 15,455 12,306 3,149 1983 15,503 12,585 2,918 1984 15,821 12,503 3,318 1985 16,701 12,994 3,707 1986 17,014 13,293 3,721 1987 17,970 13,786 4,184
Source: National Agricultural Statistics Service, USDA.
9
SECTION 2
COSTS OF PRODUCTION AND ECONOMIC RETURNS TO
CALIFORNIA DAIRY OPERATIONS
This section presents information on the cost and economic returns to California dairy production and compares California with the other major dairy producing regions.
Figure 2.1 depicts the six dairy production regions for which cost estimates are calculated by the Economic Research Service, U.S. Department of Agriculture. The regions are grouped according to similarity of dairy production practices. Four of the six regions are analyzed in this fact sheet: Pacific, Upper Midwest, Corn Belt, and Northeast, which account for 75 percent of total dairy production in the United States.
The Pacific Region constituted about 15 percent of total U.S. dairy production in 1987. California's milk production accounts for more than 80 percent of the Pacific Region's milk production.
10

Fiqure 2.1: U.S. Dairy Production Regions
m Oairy production regions
Source: Economic Research Service, USDA.
11

Table 2.1 details four major cash costs of dairy production. For the United States as a whole, concentrates (including grain), forage (including hay and pasture), hired labor, and interest costs together comprise about 70 percent of total cash costs. In 1986, concentrates, forage, hired labor, and interest ranged from $6.09 per hundredweight of milk produced in the Corn Belt to $6.76 in the Pacific Region. Figures 2.2, 2.3, 2.4, and 2.5 show how the four cash costs compare regionally. The difference between these costs in the Pacific Region and the Corn Belt narrowed from $1.58 per hundredweight in 1980 to $.67 in 1986.
12

Table 2.1: Costs of Concentrates, Forage, Hired Labor, and Interest In Milk Production, 1980-86
Pacific Region
Concentrates 3.77 Forage 2.65 Hired labor .86 Interest f$
Upper Midwest
Concentrates Forage Hired labor Interest
Northeast
Concentrates Forage Hired labor Interest
Corn Belt
Concentrates Forage Hired labor Interest
1980 1981 1982 1983 1984 1985 1986 -------------(dollars perndredweight)------------
3.59 3.33 2.47 2.52
.90 .95 1.09 1.18 8.05 7.98
3.48 2.74
.96 1.17
3.46 3.09 2.95 2.49 2.42 2.00 1.02 .99 .93 1 .Ol 1.02 .88 I.98 I.52 6.76
2.74 2.78 2.75 2.90 2.96 2.81 2.85 1.32 1.21 1.20 1.17 1.20 1.11 1 .oo
.58 .63 .67 .61 .67 .66 .64 1.64 1.94 1.95 1.94 2.11 1.93 1.70
6,28 6 56 A 6.57 6.62 6.94 6.51 6.19
3.36 3.63 3.40 3.47 3.53 1.26 1.17 1.26 1.18 1.17
.91 .97 1.05 1.04 1.13
.90 1.06 1.10 1.09 1.12
6,43 6.83 6.81 6.78 6.95
3.05 1 .Ol 1.14
&
3.30 .93
1.15
&
3.37 3.60 3.45 3.84 3.80 3.39 3.43 1.23 1.13 1.11 1.24 1.16 .97 .89
.61 .68 .65 .66 .69 .69 .67 1.42 1.68 1.71 1.70 1.82 1.26 1.10
6.63 /.09 6.92 3.44 I.41 6.31 EZE
Source: Economic Research Service, USDA
13

Figure 2.2: Cost of Concentrates, 1981-86
4.0 Dollars per hundredweight of Milk Produced
3.9 3.6
3.7
3.6
3.5
3.4
3.3
3.2
3.1
3.0
2.9
2.8
2.7
1981 Years
1982 1983
- Pacific ---. UMW B Northeast a I l m Cornbelt
Source: Economic Research Service, USDA.
1985 1986

Figure 2.3: Cost of Forage, 1981-86
3.0 Dollars par hundredweight of Milk Produced
0.5
1981
Years
1982 1963 1984 1985 1966
- Pacific 1-11 UMW m Northeast m 8 8 8 Cornbek
Source: Economic Research Service, USDA
15

Figure 2.4: Cost of Hired Labor, 1981-86
2.0 Dollars per hundredweight of Milk Produced
1.9
1.8
1.7
1.6
1.5
1.4
1.3 1.2 1 .l --- _
r --_.- 1.0 -- _..-
0.9 -
0.8
1981
Years
‘I,,
1982 1983 1964 1985 1986
- Pacific -1.1 UMW E Northeast n a n I Combelt
Source: Economic Research Service, USDA.
16

Figure 2.5: Cost of Interest, 1981-86
2.3 Dollars Per hundredweight of Milk Produced
2.2
1.8
1.7 mmmgamammm8mmmmmmmmmmmm0 *mm* ‘+
+* 1.6 l +A 1.5 ‘i
l 4 % 1.4
1.3 ‘% 1.2 1.1 ,b
8g8~..,_
1 .o 0.9 1w
0.8
1981
Years
1962 1963 1984 1985 1966
- Paciiic -1-1 UMW m Northeast n n n w Cornbelt
Source: Economic Research Service, USDA
17

As table 2.2 and figure 2.6 show, economic costs for the Pacific Region were the lowest of the four regions, declining more than those of other regions since 1981. Economic (or full ownership) costs include variable expenses, taxes, insurance, general farm overhead, capital replacement, and the cost of providing land, labor, and capital to a milk production operation.
Table 2.2: Econanic Costs of Milk Production for Four Regions, 1981-86
Region 1981 1982 1983 1984 1985 1986 -----(dollars pe redweight)----- -- -
Northeast $12.85 $12.73 $13.11 $13.36 $12.10 $12.14 Pacific 10.89 10.70 11.47 11.17 10.14 9.43 Upper Midwest 12.49 12.63 12.75 13.00 12.05 11.74 Corn Belt 13.97 13.68 14.58 14.28 13.02 12.69
Source : Economic Research Service, USDA.
18

Figure 2.6: Eaxmmic Costs, 1981-86
Dollars per hundredweight of Milk Produced
15
14
13
12
11
10
9
6
7
6
5
1981
Years
1982 1983 1984 1985 1986
B Pacific -... UMW w Northeast n I w n Cornbelt
Source: Economic Research Service, USDA.
19

Table 2.3 shows that at $3.10 per hundredweight in 1986, residual returns in the Pacific Region were the highest of the four regions. According to the Economic Research Service, USDA, residual returns are cash receipts less all costs of production, including the cost of providing land, labor, and capital to a milk production operation. Figure 2.7 portrays this information graphically.
Table 2.3 Residual Returns for Four Regions, 1981-86
Region 1981 1982 1983 1984 1985 1986 - ----(aollars perXGdredweig)----- - -
Northeast $2.37 $2.26 $1.80 $1.39 $1.82 $1.47 Pacific 3.50 3.39 2.48 2.54 2.82 3.10 Upper Midwest 2.36 1.93 1.73 1.35 1.36 1.54 Cornbelt .74 .77 t.171 .Ol .44 .49
Source : Economic Research Service, USDA.
Figure 2.7: Residual Returns, 1981-86
4.0 Dollars per hundredweight of Milk Produced
2.5
2.0
1.5
1 .O wmwammmmwma?~
0.5 N@ *8
n mmmmwmmmmm
0 Q4. .*a*
*0**
h.1.........**'
1981
Years
1982 1983 1984 1985 1986
- Pacific -1-- UMW m Northeast WMDM Cornbelt
Source: Economic Research Service, USDA.
20
I ’
SECTION 3
PRICING GRADE A MILK IN CALIFQRNIA:
A COMPARISON WITH THE FEDERAL MARKETING ORDER SYSTEM
This section compares the California marketing order system with the federal marketing order system. Table 3.1 lists key features for comparison, such as the type of milk covered by each system, basis for milk payment, classification of products made from milk, importance of dairy production history, prices paid to producers for manufacturing dairy products, and prices paid to producers for milk for fluid use. (For clarity in this fact sheet, we have used Roman numerals to refer to pricing classifications under both the federal and California milk marketing order systems, although Arabic numerals are normally used under the California system.)
21

Table 3.1: Canparison of Federal Milk Marketing Orders and the California Milk Marketing System
Feature
U.S. milk covered (1986)
Type of milk covered
Federal milk marketing orders
70 percent
grade A
Number of "use" classes
Basis for payment "Use", or product "Use" , or product manufactured fram milk. A manufactured fram milk. A higher price is paid for higher price is paid for grade A milk used for grade A milk used for drinking than for drinking than for identical milk processed identical milk processed into soft or hard dairy into soft or hard dairy products. products.
Three: I. whole, skim, and
lawfat milk II. ice cream,other
frozen desserts, cottage cheese
III. butter, nonfat dry milk, all cheese except cottage cheese
Five: I. whole, skim, and
lowfat milk II. heavy cream, cottage
cheese III. ice cream, other
frozen desserts IVa. butter, nonfat dry
milk IVb. all cheese except
cottage cheese
Milk components on which payment is based
Butterfat for all classes.
Dairy Enterprise Characteristic2 on which payment is based
Producers of grade A milk within a single order are paid the same "blend price" for each hurdred- weight of milk marketed, lregardless of how milk from the operation is used. The blend price is a weighted average of prices paid for grade A milk for each use class within the order. Prcducers' milk marketing histories are irrelevant.
22
California system
12 percent
"Market" milk (same as grade A)
Fat and solids-not-fat components for all classes. Fluid component also for class I.
Producers of grade A milk are assigned "bases" (allotments) according to milk production history. "Quotas" (proportion of base eligible for class I price) are also assigned. Producers with base and quota are paid for each hundredweight of milk marketed according to state-wide use of grade A milk and their assigned bases and quotas. Hence, each grade A prducer does not receive the same "blend price." (All milk

Feature
Price determination of milk used in hard dairy products
Class I price determination
Federal milk marketing orders
Most federal orders require that handlers pay the same price that manufacturing plants pay for grade B milk in Minnesota and Wisconsin.
A fixed amount of 1.04 cents per hundredweight is added to class III price and a distance differential is added to the sum. The distance differential is related to the distance of the relevant sale from Eau Claire, Wis.
California system
marketed in excess of base is usually paid the lowest or "overbase" price for grade A milk.)
The price that handler must pay for grade A milk is derived from a product price formula. The price for the butterfat component is based on 1) a wholesale butter price, 2) a yield factor, and 3) a manufacturing or "make" allowance.
Bimonthly, a price adjuster is calculated according to a formula in which the following weights are incorporated: 0.43 for cost of production, 0.42 for class IV price,
0.15 for consumer earnings, all relative to the same base period. The calculated price adjuster is multiplied. by the current statewide average price to derive the new price. The current statewide average price is subtracted from the new price to derive the price change. The price change is allocated to the components of class I milk as follows: 0.40 to butterfat, 0.40 to solids-not-fat, 0.20 to fluid carrier.
Source: L. J. (Bees) Butler, "Do State/Local Regulations Interfere With the Federal Milk (Price Support) Program? A Case Study: California Pricing," Paper prepared for the National Cornnission on Dairy Policy, Nov. 1987; Robert D. Boynton, "The California Milk Marketing System," Paper for Federal Milk Marketing Order Conference, Sept. 1985; Edward V. Jesse and Robert A. Cropp, "Milk Pricing and Pooling in California," University of Wisconsin-Extension, 1985.
23

Table 3.2 shows that monthly 1986-87 class I prices in California were lower than average federal market order minimum prices and very close to the lowest federal market order price for each month studied.
Table 3.2: Federal Marketing Order and California Class I Prices, February 1986-February 1988
Year Month Federal market order
Average High Low California ------(dollars per hundredweight)------
1986
1987
1988
February $13.35 $14.33 $12.30 $12.51 March 13.29 14.27 12.24 12.51 April 13.21 14.19 12.16 12.57
May 13.58 15.20 12.22 12.57 June 13.55 15.16 12.18 12.66 July 13.54 15.16 12.18 12.66
August 13.54 15.18 12.20 12.58 September 13.60 15.24 12.26 12.58
October 13.87 15.51 12.53 12.63 November 14.10 15.73 12.75 12.63 December 14.24 15.87 12.89 12.56
January 14.47 16.09 13.11 12.56 February 14.44 16.06 13.08 12.48
March 14.26 15.88 12.90 12.48 April 13.83 15.45 12.47 12.26
May 13.59 15.21 12.23 12.26 June 13.56 15.18 12.20 12.21 July 13.55 15.18 12.20 12.21
August 13.60 15.25 12.27 12.04 September 13.70 15.35 12.37 12.04
October 13.81 15.45 12.47 12.21 November 13.97 15.60 12.62 12.21 December 13.90 15.53 12.55 12.00
January 13.8ga 15.52a 12.54a 12.00 February 13.67a 15.30a 12.32a 12.02
a1988 Federal order prices are estimates.
Source: Agricultural Marketing Service, USDA; California Department of Food and Agriculture.
24

Table 3.3 shows that between January 1986 and February 1988, the California price for overbase milk (the lowest price paid for milk under the California marketing order) has been lower than the grade B price in Minnesota-Wisconsin. Federal orders usually require that the lowest price under that system be the same as the price paid to dairy operations in Minnesota and Wisconsin. In February 1988 the overbase price was $0.74 lower than the Minnesota-Wisconsin price.
Table 3.3: Minnesota-Wisconsin (M-W) and California Overbase Prices, January 1986- February 1988
California Year Month M-W price overbase price Difference
------(dollars per hundredweight)-----
1986
1987
1988
January $11.12 $10.66 $-0.46 February 11.04 10.66 -.38
March 11.02 10.66 -.36 April 10.98 10.66 -.32
May 10.98 10.66 -.32 June 11.00 10.66 -.34 July 11.06 10.65 -.41
August 11.33 11.03 -.30 September 11.55 11.03 -.52
October 11.69 11.04 -.65 November 11.91 11.05 -.86 December 11.88 10.86 -1.02 January 11.70 10.45 -1.25
February 11.27 10.40 -.87 March 11.03 10.40 -.63 April 11.00 10.40 -.60
May 11.00 10.40 -.60 June 11.01 10.56 -.45 Juljr 11.17 10.78 -.39
August 11.27 10.78 -.49 September 11.42 10.75 -.67
October 11.35 10.75 -.60 November 11.34 10.23 -1.11 December 11.12 10.23 -.89 January 10.91 9.86 -1.05
February 10.60 9.86 -.74
Source: Agricultural Marketing Service, USDA; California Department of Food and Agriculture.
25

SECTION 4
CALIFORNIA'S PRODUCTION AND DISPOSITION
OF BUTTER, NONFAT DRY MILK, AND CHEESE
Figure 4.1 shows that less than 40 percent of California's milk goes for class I use, about the same proportion as in the United States as a whole. About 25 percent of California's milk is used for butter and 25 percent for cheese. Figures 4.3, 4.4, and 4.5 show California's dairy production and sales to USDA.
Figure 4.1: Fluid and Processed Product Disposition of California Milk, 1986
4% Other
Fluid
4% Other Class 1
Butter/Powder
Source: Butler, "A Case Study: California Pricing."
26

As shown in figure 4.2, nearly all of the 3-billion pound increase in California milk production between 1982 and 1987 went to manufactured use, while class I use increased little from its level of slightly more than 6 billion pounds.
Figure 4.2: Class I and Manufacturing Use of California Milk, 1981-87
20 Billion Pounds 19 18
13
12
11
10
9 ,-I '
6
5’
1981
Years
1982 1983 1984 1985 1988 1987
- Production -1-1 Class 1 Usage m Manufacturing Use
Source: California Dairy Information Bulletin, California Agricultural Statistics Service
27

Figures 4.3, 4.4 and 4.5 show California butter, nonfat dry milk, and cheese production and sales to the federal government. As shown in figure 4.5, cheese manufacturing more than doubled between 1982 and 1987 when it rose to nearly 500 million pounds. Cheese sales to the federal government have fluctuated around 50 million pounds annually from 1982 to 1987.
Figure 4.3: California Butter Production and Sales to USDA, 1982-87
500 Millions of Pounds
Years
Butter Production
Butter Sales
Source: California Dairy Information Bulletin, California Agricultural Statistics Service.
28

Figure 4.4: California Nonfat Dry Milk Production and Sales to USDA, 1982-87
500 Millions of Pounds
400
Nonfat Dry Milk Production
Nonfat Dry Milk Sales
Source: California Dairy Information Bulletin, California Agricultural Statistics Service.
29

Fiqure 4.5: California Cheese Production and Sales to USDA, 1982-87
500
400
300
200
100
Millions of Pounds
0
u Cheese Production
Cheese Sales
Source: California Dairy Information Bulletin, California Agricultural StatiStiCS %viCa.
30

APPENDIX I APPENDIX I
MAJOR CONTRIBUTORS TO THIS FACT SHEET
RESOURCES, COMMUNITY, AND ECONOMIC DEVELOPMENT DIVISION, WASHINGTON, D.C.
Brian P. Crowley, Senior Associate Director, (202) 275-5138 John W. Harman, Associate Director Jeffrey E. Heil, Group Director Mary C. Kenney, Evaluator-in-Charge M. Jane Hunt, Reports Analyst Julian King, Information Processing Assistant Frances D. Williams, Secretary-Stenographer
(022950)
31


Requests for copies of GAO reports should be sent to:
U.S. General Accounting Office Post Office Box 6015 Gaithersburg, Maryland 20877
Telephone 202-275-6241
The first five copies of each report are free. Additional copies are $2.00 each.
There is a 25% discount on orders for 100 or more copies mailed to a single address.
Orders must be prepaid by cash or by check or money order made out to the Superintendent of Documents.

United States General Accounting Office Washington, D.C. 20548
Offkial Business Penalty for Private Use $300