Jukka Mannila KEY PERFORFORMANCE INDICATORS IN AGILE ...
105
Jukka Mannila KEY PERFORFORMANCE INDICATORS IN AGILE SOFTWARE DEVELOPMENT Information Technology 2013
Transcript of Jukka Mannila KEY PERFORFORMANCE INDICATORS IN AGILE ...

Jukka Mannila
KEY PERFORFORMANCE INDICATORS IN AGILE SOFTWARE
DEVELOPMENT
Information Technology
2013

KEY PERFORFORMANCE INDICATORS IN AGILE SOFTWARE DEVELOPMENT
Mannila, JukkaSatakunnan ammattikorkeakoulu, Satakunta University of Applied SciencesDegree Programme in Information TechnologyMarch 2013Supervisor: Kivi, Karri Number of pages: 70Appendices: 4
Keywords: agile, software, measuring, measurement, performance indicator
The background of the study was an organisation's need to have new ideas to measure a development team performance and the organisation’s performance in work efficiency and quality. The target was to define working and need based agile software development key performance indicators for the organisation.
The study was implemented by evaluating agile software development related books and internet sources to identify recommended key performance indicators and select some of them for the organisation use. During the evaluation it became clear that available material amount is limited and it was decided some workshops would be held to initiate new measurements in the organisation. The outcome of the workshops was a number of measurement proposals. The source data from books, internet sources and workshops were documented and a summary table with usage recommendations per a measurement was done.
The organisation's key performance indicators currently used were also documented to give some background data about the current measurements in the organisation.
By using the data in the summary table recommended measurement proposals were selected and documented. For the selected measurements more accurate data relating to scope, time period, organisational level, measurement type, targets and responsibilities were defined.
A measurements selection for the organisation's use was done based on the recommended key performance indicators and measurement needs in the organisation. Selected measurements were documented in more accurate details for the organisation. The used data sources for the measurements were defined as well. Also some example data per a measurement were presented.
The outcome of the study was the actual measurements which were taken into use in the organisation. Future work directly resulting from the study will be the automating of the source data collection and the reporting of the measurement data in a dashboard.

CONTENT1 INTRODUCTION...................................................................................................52 AGILE SOFTWARE DEVELOPMENT.................................................................7
2.1 The Manifesto for Agile Software Development.........................................82.2 The Twelve Principles of Agile Software ...................................................92.3 Scrum.........................................................................................................10
2.3.1 Sprint..............................................................................................112.3.2 Roles...............................................................................................11
2.4 Key practices of scrum...............................................................................123 KEY PERFORMANCE INDICATORS................................................................14
3.1 Measurements generally............................................................................143.2 Agile development measurements.............................................................15
4 COLLECTING THE DATA..................................................................................174.1 Current measurements................................................................................174.2 Collecting recommended new measurements............................................17
4.2.1 Agile literature................................................................................194.2.2 Internet sources..............................................................................194.2.3 Internal workshops.........................................................................19
4.3 Summary of the collected measurements...................................................194.4 Definitions for the recommended measurements.......................................20
5 CURRENTLY USED KEY PERFORMANCE INDICATORS............................215.1 Feature content measurements...................................................................21
5.1.1 Feature throughput: Running tested features.................................215.1.2 Feature throughput: area backlog items delivered.........................22
5.2 Test automation measurements..................................................................235.2.1 Test automation ratio......................................................................23
5.3 Fault measurements....................................................................................245.3.1 Customer fault figure.....................................................................245.3.2 Open faults.....................................................................................25
5.4 Organisation development measurements................................................265.4.1 Recruiting.......................................................................................275.4.2 Competence lift..............................................................................275.4.3 Employee engagement survey........................................................28
6 RECOMMENDED KEY PERFORMANCE INDICATORS................................306.1 Fault related measurements........................................................................30
6.1.1 Fault correction time to “Closed” state..........................................306.1.2 Number of faults raised from system verification..........................326.1.3 Faults from the implementation not done by a team......................336.1.4 Faults leading to new feature development....................................34
6.2 Delivery time measurements......................................................................366.2.1 Delivery on time.............................................................................366.2.2 Team commitment to the priority items.........................................37
6.3 Continuous integration cycle times............................................................396.3.1 Smoke test cycle time.....................................................................396.3.2 Regression test cycle time..............................................................40
6.4 Software quality measurements.................................................................416.4.1 Unit test coverage for the developed code.....................................416.4.2 Regression test coverage................................................................436.4.3 Technical debt................................................................................44
6.5 Team time usage.........................................................................................456.5.1 Planned and real working hours.....................................................456.5.2 New feature and fault correction work...........................................466.5.3 Sprint burn-down chart..................................................................47
6.6 Team activity measurements......................................................................496.6.1 Number of demos in sprint review.................................................496.6.2 Team morale barometer..................................................................506.6.3 Definition of done check list..........................................................52
7 SELECTED MEASUREMENTS IN PRACTISE.................................................547.1 Fault correction time to “Closed” state......................................................547.2 Delivery on time.........................................................................................567.3 Technical debt ...........................................................................................587.4 Unit test coverage for the developed code.................................................607.5 Smoke test cycle time ...............................................................................627.6 Regression test cycle time..........................................................................647.7 Future measurement - definition of done check list...................................65
8 CONCLUSION......................................................................................................67REFERENCES................................................................................................................69ATTACHMENTS

GLOSSARY
Agile An iterative and incremental software development method.
Continuous integration A developer commit starts a new build which is tested by
automated test cases – provides immediate feedback to the
developer.
Definition of done A criterion which needs to be met before an item can be said
to be done.
FCC The first correction completed.
FCRT The first correction ready for testing.
Feature A functionality (end-to-end) in a product.
KPI Key performance indicator, a measurement for measuring
software and software development.
Legacy code A code that relates to the earlier used technology.
Multitasking Several features or user stories under the work by a team.
Product area A part of a bigger product, typically owned by a product
owner.
Product backlog A product level prioritisation and planning document, updated
for each sprint by a product owner.
Product owner A person who represents customer(s) for teams and prioritises
customer requirements in a product backlog.
Regression test Verifies a product existing functionality when a new
functionality is developed.
Scrum An agile development method at team level.
Scrum master A team member who removes impediments and takes care
about of implementing scrum practices in a team.
Silo A competence managed only in one team or by one person.
Site A product development place or a city.

SLA Service level agreement.
Smoke test Verifies the basic functionality of a product after each product
build.
Sprint A time-boxed iteration in an agile development.
Sprint backlog A team level planning document for a sprint, owned by a team.
Story point A number that tells the team how hard the user story is to
implement, in a scale of 1,2,3,5,13,40 and 100 story points.
System verification A system level end-to-end testing.
Technical debt Short-cuts implemented and left to the code that require later
re-factoring for getting the code working well.
User story One or more sentences that describes what a user does or
needs to do by a product or a product functionality.
Value stream An organisation level which is responsible for one product
area, and consists of one or several teams.

5
1 INTRODUCTION
Key performance indicators (KPI) in agile software development are used to measure
products and development processes to initialise product and process improvements
based on the feedback from measurements. Key performance indicators have to be
objective, reusable and measurement results have to give some value for the
organisation using the measurement.
Agile development is a an iterative and incremental software development model in
which self-organizing and self-managing teams are in a key role. A target for a team
is to deliver a set of working software after every iteration and to demonstrate it to
counter-parties at the end of each iteration.
The study was done for an organisation which moved from the waterfall software
development model to the agile software development model some years ago. After
the change, key performance indicators have been changed to measure new
operational model activities. However, it was decided that the organisation would
need a study to clarify possible measurements for the agile software development
model. This was because a better understanding of the organisation’s performance in
the agile software development model was required.
It was decided that the evaluation of measurements would be a separate process
development project. The project team consisted of the organisation's line managers,
project managers and the operation development manager. As the study editor had a
need to write a thesis, it was agreed that the editor will document the evaluation and
results of the evaluation and organise required workshops and other meetings – and
that he will act as the leader for the work. It was also agreed that the content of the
work would be documentation of current measurements, a proposal definition for
new measurements and based on the measurements proposal, his work would include
a selection of measurements which would be utilised in the organisation. An outcome
would be a study about the measurements.

6
The target of the study was to define working and need based agile software
development key performance indicators which can be used to measure a
development team performance and the organisation’s performance in the work
efficiency and quality.
The study evaluates recommended agile development key performance indicators in
agile literature and in different sources on the internet. Also, some workshops were
organised in the organisation to define measurements. Another aspect of the study
was the organisation’s measurement needs. Based on preferred measurements and the
organisation's measurement needs measurement proposals for the organisation's use
were made. For the selected measurements measurement criteria, targets and
responsibilities were defined.
It is good to emphasize that story points and a team velocity calculation based on the
story points are the most used way to measure in the agile software development –
they can be mentioned in the study but its scope is to define a new view on the
measurements.
The project team selected together the measurements which were taken into use in
the organisation. For the selected measurements communication material was defined
but it is not attached to the study as it is only for the organisation's internal use. Also
some data collection was done for the selected measurements but the data is not
presented in the study – instead some example data is used to present the reporting of
the selected measurements.
In the long run, the selected measurements can be adjusted to the correct direction if
any need is discovered – thus, the adjustments are not in the scope of the study.

7
2 AGILE SOFTWARE DEVELOPMENT
“Agile software development is a group of software development methods based on
an iterative and an incremental development, where requirements and solutions
evolve through collaboration between self-organizing, cross-functional teams. It
promotes adaptive planning, evolutionary development and delivery, a time-boxed
iterative approach, and encourages rapid and flexible response to change. It is a
conceptual framework that promotes foreseen interactions throughout the
development cycle.“ (Agile software development 2013)
Agile software development poster in figure 1 (Agile software development 2013).
Figure 1. Agile software development poster
The following subchapters introduce the key principles in agile software
development.

8
2.1 The Manifesto for Agile Software Development
The Manifesto for Agile Software Development was published in 2001. The
statement below is a straight quote from the original Manifesto (Manifesto for Agile
Software Development 2001):
We are uncovering better ways of developing
software by doing it and helping others do it.
Through this work we have come to value:
• Individuals and interactions over processes and tools
• Working software over comprehensive documentation
• Customer collaboration over contract negotiation
• Responding to change over following a plan
That is, while there is value in the items on
the right, we value the items on the left more.
“Using the values from the Manifesto to guide us, we strive to deliver small chunks
of business value in extremely short release cycles” (Crispin & Gregory 2010, 3).
As the Manifesto states, individuals and interactions are valued in agile software
development as the target is a well-functioning team of skilled individuals (Cohn
2007, 21). The success of a development project depends on the skills and actions of
each team member.
Also, the working software is valued in agile software development as the target is a
stable and incrementally enhanced version of a product in the end of each sprint
(Cohn 2007, 22). The amount of specifications or other documentation have no value
if they do not come with an operational version of a product.
Customer collaboration is also valued in agile software development as the target is
that all the parties in a project are working towards the same set of goals (Cohn 2007,

9
22). A team has to be focused on a customer and customer needs as too much process
and other activities can sidetrack a project from the original purpose.
Finally, responding to change is valued in agile software development as the target is
to deliver as much value as possible to customers and end users (Cohn 2007, 22).
Development practices in the agile development support a team to react to changed
requirements and environments and enable a team to deliver software with value to
customers.
2.2 The Twelve Principles of Agile Software
Apart from the agile Manifesto there is also a set of guidelines, The Twelve
Principles, for the agile methodologies to open more what it is to be agile. The
statement below is a straight quote from the original principles (The Twelve
Principles of Agile Software 2013):
1. Our highest priority is to satisfy the customer through early and continuous
delivery of valuable software.
2. Welcome changing requirements, even late in development. Agile processes
harness change for the customer's competitive advantage.
3. Deliver working software frequently, from a couple of weeks to a couple of
months, with a preference to the shorter time-scale.
4. Business people and developers must work together daily throughout the
project.
5. Build projects around motivated individuals. Give them the environment and
support they need, and trust them to get the job done.
6. The most efficient and effective method of conveying information to and
within a development team is face-to-face conversation.
7. Working software is the primary measure of progress.
8. Agile processes promote sustainable development. The sponsors, developers,
and users should be able to maintain a constant pace indefinitely.
9. Continuous attention to technical excellence and good design enhances
agility.
10. Simplicity - the art of maximizing the amount of work not done - is essential.

10
11. The best architectures, requirements, and designs emerge from self-
organizing teams.
12. At regular intervals, the team reflects on how to become more effective, then
tunes and adjusts its behaviour accordingly.
“The Manifesto and its supporting principles provide the basic philosophy of agility,
and to them, all applied agile best practices can be directly correlated” (Leffingwell
2008, 10).
2.3 Scrum
The organisation is using scrum which is one of agile methods. “It is an iterative and
incremental software development framework for software projects and product or
application development” (Scrum 2013). It is a method dealing primarily at team
level, and makes it possible for a team to work together effectively and guide teams
to be self-directing (Andersson 2012).
The below list presents characteristics of scrum and is a straight quote from the book
by Dean Leffingwell (Leffingwell 2008, 41):
• Cross-functional teams working together in an open environment to produce
incremental releases of a product in (2 or 3 weeks) sprints.
• Teams are self-directed and empowered to meet the objectives of sprints.
• Team work is facilitated by a scrum master who eliminates impediments and
reinforces the core disciplines of scrum.
• Team work is prioritised via a product backlog which is re-prioritised for each
sprint (by a product owner).
“A key principle of Scrum is that during a project customers can change their minds
about what they want to be implemented” (Scrum 2013).
What has been presented above requires a lot of flexibility from teams and
developers in a team but also gives freedom to organise the work as the team wishes
inside a frame set by the organisation's management. The other side of the coin is that

11
the team and the developers in the team have to take and feel responsibility for the
ongoing work.
One challenge to the organisation is that scrum is originally designed for small teams
and organisations. In the organisation which is working in several sites with multiple
teams the scaling of practises may cause some challenges. For example sprint
plannings, reviews, and retrospectives for all development teams, can be challenging
to organise.
2.3.1 Sprint
A sprint is a basic unit of development in scrum. It produces increments of tested
functionality and each increment is, in principle, “potentially shippable” which
means that the sprint outcome could be available for customers. However, the normal
situation with a wider product is that there are several development sprints for a
release. A set of features that go into a sprint come from a product backlog, which is
an ordered list of requirements.
The duration of a sprint is fixed (time boxed) and is normally between one week and
one month. Each sprint is preceded by a planning meeting, where the tasks for the
starting sprint are identified, teams plan how much they can commit to complete
during the sprint and a commitment for the sprint goal is made by development
teams. The sprint goals should not be changed during the sprint. The outcome of the
sprint is followed via team demo a review meeting at the end of a sprint.
2.3.2 Roles
The main roles in scrum are a product owner, a scrum master and a team.
Product owner
A product owner is responsible for representing customers and interests of customers
and other stakeholders for teams. The product owner is doing this by managing a
product backlog which is a prioritised list of customer requirements and other work
to be done by teams. The product backlog prioritisation has to be done by the product

12
owner for each sprint and the product owner presents a new prioritisation in each
sprint planning in the beginning of a sprint.
Scrum master
A scrum master is a scrum team member who is responsible for helping the team to
achieve its goals by removing the impediments and blockers which team may have in
its work. A scrum master is also responsible for teaching scrum to everyone in the
team and for implementing scrum practices and rules during the sprints.
Team
A team is responsible for implementing functionalities according to the priorities
defined in a product backlog by a product owner. Based on the prioritisation a team
defines a team level sprint backlog for each sprint.
All the team members, developers and verification engineers in the team, are
responsible for taking care that the team is self-organizing, self-managing, and cross-
functional.
“As a summary, a team is the thing in scrum. After all, team members are the ones
who actually design, develop and deliver the sprint outcome, so optimizing their
performance by eliminating obstacles optimises the business's performance in
delivering value to its users. Management does its job when it eliminates
impediments. The team does its job when it meets its commitments as described in
the sprint's backlog.” (Leffingwell 2008, 292)
2.4 Key practices of scrum
The list below presents the key practices of scrum and is a straight quote from the
book by Dean Leffingwell (Leffingwell 2008, 44):
• Cross-functional and collocated teams of eight or fewer team members
develop software in sprints.
• Sprints are iterations with fixed duration. Each sprint delivers incremental,
tested functionality which can be delivered to the user.

13
• Work within a sprint is fixed. Once the scope of a sprint is committed, no
additional functionality can be added (expect by the team).
• The scrum master mentors the self-organizing and self-managing team.
• All work to be done is carried as a product backlog, which includes
requirements (features), defect workload, and as well infrastructure and
design activities.
• The product backlog is developed, managed, and prioritised by a product
owner, who is an integral member of the team and who has a primary
responsibility of interfacing with external customers.
• A daily 15 minute stand-up meeting, a daily scrum, is a primary
communication method (per team member: what have I done, what will I do,
my blockers).
• Scrum focuses heavily on time-boxing (sprints, stand-up meetings).
• Scrum allows requirements, architecture and design to emerge over the
course of the project (but the work within a sprint is fixed).
The main principles of the scrum process are presented in figure 2.
Figure 2. The Scrum process (Scrum 2013)

14
3 KEY PERFORMANCE INDICATORS
3.1 Measurements generally
A key performance indicator (KPI) in the software development is a measurement for
measuring some property of a software or its development process. The main
requirement is that a measurement enables an organization to improve products and
processes and the fundamental purpose of measurements is to provide feedback
about products and processes. Based on the measurements you can get feedback
about the quality of the current product or process, how to predict future qualities of
the product or process, how to improve the quality of a product or process and how
to determine the state of the project in relation to budget and schedule.
When you are trying to figure out what to measure, you need first to understand what
problem you are trying to solve. When you know the problem statement, you can set
a goal. The goal needs to be measurable. If the goal is measurable, a measurement
you need to gather to track a metric will be obvious. The target in the definition is to
obtain an objective, reproducible and quantifiable measurement. Measurements
should give continual feedback to you how the development is proceeding, so that
you can respond to unexpected events and change your processes as needed. “A
measurement is an indication of the size, quantity, amount or dimension of a
particular attribute of a product or process. For example the number of errors in a
system is a measurement.” (Topic:Software Metrics and Measurement 2010)
“Remember to use metrics as a motivating force and not for beating down a team's
morale. Keep the focus on the goal, not the metrics.” (Crispin & Gregory 2010, 76)
“The right metrics can help you to make sure your teams are on track to achieve
goals and provide a good return on your investment in them” (Crispin & Gregory
2010, 93). “By analysing the metrics the organisation can take corrective action to fix
those areas in the process, project or product which are the cause of the software
defects” (Software Quality Metrics 2010).

15
You must always think about what you are measuring, why you are measuring and
what you want to reach with a measurement. You should not measure just because of
measuring. You should be careful that the defined and utilized measurement does not
lead to the wrong behaviour in your organisation (people and teams trying to
maximize the outcome of a measurement for reaching the best possible results even
if it would not be feasible or the original purpose of a measurement). The
measurements should always be feasible for the organisation and support the
organisation's strategy.
“Also remember that metrics should be visible, providing necessary milestones upon
which to make decisions” (Crispin & Gregory 2010, 93).
3.2 Agile development measurements
As a team is a key player in the agile software development, quite often
measurements in the agile are somehow team centric and related to team's working
processes. Another important area is product metrics relating for example to faults
and release schedules and contents.
Another point of view to the agile software development metrics is division between
project and process metrics. Project metrics can be divided into iteration (sprint) and
release related metrics. Iteration metrics are applied to every sprint and they provide
fast feedback and adjustment on an iteration by iteration basis. Release metrics are
applied on a slower cycle, as per a release. Process metrics are related to work
processes in a product ownership and management, in release planning and tracking,
in iteration planning and tracking, in team effectiveness, in testing practises and in
development practises and infrastructure. (Leffingwell 2008, 312)
“Anyway, a primary metric for the agile software development is whether or not a
working software actually exists and is demonstrably suitable for the use in its
intended purpose and that a key indicator is determined empirically, by a
demonstration, at the end of every sprint and every release” (Leffingwell 2008, 312).

16
As some measurements are done at a team level the responsibility for measurements,
tracking results and taking the corrective actions should also be at a team level. A
team needs to have a freedom and a responsibility to adjust its own processes and
working methods in a direction which gives better results in measurements. Also a
self-organizing and self-directed team needs to be empowered and accountable to
take needed actions to make betterments. “Experience has shown that collecting
metric results via periodic self-assessment process is an effective way to measure and
continuously improve an individual team's performance” (Leffingwell 2008, 318).

17
4 COLLECTING THE DATA
The study is collects data about recommended agile software development process
measurements. This chapter describes how the study was done. The main steps of the
evaluation process were:
• Clarify and document the current measurements in the organisation.
• Search and document measurement recommendations from different sources.
• Document recommended measurements for the organisation.
• Make a decision about the selected measurements.
• Collect data for the selected measurements.
4.1 Current measurements
The currently used measurements in the organisation were documented as a part of
the study. They are presented in chapter 5. They were analysed to give an idea of
what is measured in the organisation nowadays. Also, some measurements relating to
the organisation development were also included in chapter 5 as they were seen to be
feasible to be presented in the current measurement collection.
4.2 Collecting recommended new measurements
The existing and recommended agile software development measurement data was
collected from different literature and internet sources and from internal workshops
held in the organisation. The data was collected as attachments to the study – one
attachment for literature data sources (attachment 2), one for internet data sources
(attachment 3) and one for collected workshop data (attachment 4). Attachments
include information about used data sources, possible link to the source data and
recommended agile development measurements per a source. In addition, the
collected measurement data in the attachments was summarized to a summary table
(attachment 1) and a definition of usage categories was done in the summary table
per a measurement; type, level, periord, scope.

18
During the data collection it was possible to notice a recursion in measurements as
the same measurements appeared frequently from the different sources. Also
frequency, i.e. how many times a measurement was presented in the source data, was
documented in the summary table.
It was also found out that when a measurement is taken out from the source context,
the meaning of a measurement may change and understanding a measurement is
more difficult. Attempts were also made to take this into account during the
measurement collection and documentation. As well, some filtering was done and for
example ROI (return on investment) and velocity related measurements are not
taken into account in the study – they are out of scope.
Based on attachment 1 data some measurements were selected and recommended to
be taken into use in the organisation. They are documented in chapter 6.
Measurement definition parameters (scope, period, level, type, target and
responsibility) were specified more accurately for the selected measurements
It was decided that some of the selected and recommended measurements in chapter
6 would be taken into use in the organisation. The selection decision was made by
the project team. Some example data, relating to the selected measurements, is
presented in chapter 7.
All the measurement definitions in chapters 6 and 7 are done in co-operation with the
organisation specialists and the project team during the writing of the study and they
are defined based on the organisation needs. The measurements are defined based on
our experience, knowledge and competencies about agile software development in a
large organisation.
However, it is important to remember and understand that we are not defining
measurements just because of measuring something – a measurement has to have a
purpose and we must be capable of justifying a measurement against questions why
something is measured and what we will reach with the measurement.

19
4.2.1 Agile literature
Measurement data from literature was searched by reading several agile software
development related books and theses. The most relevant literature was selected and
recommended measurements were collected. They are documented in a summary
document in attachment 2.
4.2.2 Internet sources
Several searches on the internet were performed to find feasible source web pages for
preferred measurements. The found web pages and measurements were collected to a
summary document in attachment 3. The collected data includes reference links to
the used web pages.
4.2.3 Internal workshops
During the study it became obvious that source material situation in the books and
internet sources was quite poor and the quality of source data was also quite weak. A
decision was made to hold internal agile development measurement workshops with
people working in the agile software development daily. The outcome was very
valuable input for the study. There was a separate workshop for line managers and
project managers and a separate workshop for development teams.
In principle, measurements were defined from scratch in the workshops and the
outcome included several good measurement proposals. It can be clearly stated that
the people who were participating in the workshops know the agile software
development process well. The proposed measurements were analysed and collected
in a separate document in attachment 4.
4.3 Summary of the collected measurements
A summary of the collected agile software development measurements, documented
in attachments 2, 3 and 4, is presented in attachment 1.
The measurements in attachment 1 are sorted under sub-topics in order to have some
structure in the table. The table columns include different usage recommendation

20
definitions for the measurements. It has to be noticed that one measurement can have
several recommended definitions selected under one measurement definition
category which means that the same measurement can be used in different categories
of types, scopes, levels and periods (several different modifications per a
measurement). You can also define your own measurements by using attachment 1
table as help.
Definition of measurement categories:
• type: number, ratio (%), trend, cumulative, correlation
• period: week, sprint, month, quarter, 6 months, year
• level: team, value stream, site, product, release
• scope: story point, user story, feature
• frequency: how many times a measurement was introduced or promoted in
the source data
4.4 Definitions for the recommended measurements
Measurement definition data used in the study is specified in table 1.
Table 1. Measurement definition data
Scope: Defines the the measurement scope i.e. what is measured.
Period: Defines the time period the measurement is followed.
Level: Defines the organisation level in which the measurement is
followed.
Type: Defines the type of the measurement (number, ratio, etc.).
Target: Defines the target for the measured data.
Responsible: Defines the responsible persons or organisation level for the
measurement.

21
5 CURRENTLY USED KEY PERFORMANCE INDICATORS
The company has defined and decided to follow some work process and organisation
efficiency related key performance indicators. The measurement definition was done
for tracking the progress in some key areas like feature content throughput, test
automation level, regression test case coverage, customer fault amount, internal fault
amount, technical debt in a product and organisational development. A message with
the company level key performance indicators was that the organisational efficiency
betterment targets have to be achieved by getting the same output with fewer
resources or more output with the same resources (Company efficiency program,
2012).
5.1 Feature content measurements
“Feature throughput is a number of features a team can develop in a particular
amount of time” (Shore & Warden 2008, 146).
5.1.1 Feature throughput: Running tested features
The reference to the measurement can be defined as “Number of features available
for releasing.” in attachment 1 and it was introduced in 13 data sources (attachments
2, 3 and 4). The detailed measurement content is introduced on the company level
definitions and presented in table 2.
Table 2. Feature throughput: Running tested features (Target setting 2013)
Scope: Number of tested and accepted features
Period: Month
Level: Product area
Type: Absolute number, cumulative progress
Target: Keep the number of accepted features on the planned level *
Responsible: R&D leaders

22
* A planned level is defined per product area. The organisation's actual targets are not
presented in the study.
The measurement measures monthly the progress of the feature development. It
demands the organisation to deliver tested and accepted end-user features which can
be delivered to customers and which brings value for customers. The measurement
shows, every month, how many features are accepted during the month and whether
the number of new features is on the planned level. The cumulative number of
features should be increasing linearly during the year.
The measurement indicates the real customer value by measuring the number of
accepted features for customers. It has to be noticed that features are communicated
to the customers with a roadmap and they have some expectations towards the
feature availabilities. From this point of view, we have to remember that features are
important, not only single user stories done by development teams.
5.1.2 Feature throughput: area backlog items delivered
The reference to the measurement can be defined as “Accepted user stories
(potentially shippable content).” in attachment 1 and it was introduced in 13 data
sources (attachments 2, 3 and 4). The detailed measurement content is introduced on
the company level with definitions and presented in table 3.
Table 3. Feature throughput: area backlog items delivered (Target setting 2013)
Scope: Number of area backlog items delivered (user stories)
Period: Year, reported monthly
Level: Product area, team
Type: Absolute number, trend
Target: x% increase from year to year (from Dec 2012 to Dec 2013) *
Responsible: R&D leaders (product area level), scrum teams (team level)
* A percentage is defined per product area. The organisation's actual targets are not
presented in the study.

23
The measurement measures monthly the progress of software development work on a
team level and as a summary on a product area level. It requires teams to deliver
fully implemented and tested user stories continuously sprint by sprint. The
measurement shows, every month, how many user stories the team has managed to
implement and what the user story implementation trend for the team is. “At the end
of a sprint every user story, planned to the sprint, should be done and partially
completed stories should be rare” (Shore & Warden 2008, 243).
The target is to increase the number of the implemented user stories and the
measurement gives some visibility whether different development efficiency
improvement actions have given the planned results. Also, in principle, the
measurement makes visible the problems a team has had with user stories and their
implementation. The corrective actions can and must be established based on the
measurement if a team level trend is going down.
5.2 Test automation measurements
5.2.1 Test automation ratio
The reference to the measurement can be defined as “Manual and automated
acceptance tests/total test cases, the report showing the ratio of automated tests.” in
attachment 1 and it was introduced in 12 data sources (attachments 2, 3, 4). The
detailed measurement content is introduced on the company level definitions and
presented in table 4.
Table 4. Test automation ratio (Target setting 2013)
Scope: Number of automated cases in use versus number of all test cases
in use (%)
Period: Year, reported monthly
Level: Product area, team
Type: Relative number (%), trend
Target: Increase automation level x% until end of 2013 (versus end of
2012) *
Responsible: R&D leaders (product area level), scrum teams (team level)

24
* A percentage is defined per product area. The organisation's actual targets are not
presented in the study.
The measurement shows the percentage of fully automated test cases on a product
area level and on a team level every month. Via the monthly trend the measurement
also shows the progress of the test automation on product and team levels.
The target is to increase the test automation ratio on a team level and also on a
product level as it helps to reduce manual testing effort and to achieve time savings
in software development. However, it also needs to be noticed that, in practise, the
test automation level does not necessarily increase all the time. The reason is that
also manual, for example end-to-end use case and usability, testing is needed and
developed. In addition, it needs to be noticed that targets need to be realistic and for
example 100% automation level is not a realistic and feasible target.
5.3 Fault measurements
5.3.1 Customer fault figure
The reference to the measurement can be defined as “New customer cases (faults).”,
“Open customer cases (faults).” and as well “Faults found by customer, escaping
from production.” in attachment 1 and it was introduced in 8 data sources
(attachments 2, 3 and 4). The detailed measurement content is introduced on the
company level definitions and presented in table 5.
Table 5. Customer fault figure (Target setting 2013)
Scope: Reported and open customer defect cases
Period: Year, reported monthly
Level: Product area
Type: Absolute number, trend
Target: Decrease number of defects x% until end of 2013 (versus end of
2012) *
Responsible: R&D leaders, quality

25
* A percentage is defined per product area. The organisation's actual targets are not
presented in the study.
The measurement actually includes two different measurements, how many new
customer defect reports have been received during the month and how many
customer defect reports are open at the end of month at the time the calculation is
done. Also the trend for both measurements is included and, based on the trend, the
target to decrease the amount until the end of the year.
The number of reported customer defect cases gives an indication whether the
internal testing has been effective and the testing process is working well. In
principle, we can talk about fault leakage from the testing process to customers. If
the number and trend are increasing or are huge after releasing a product, corrective
actions to the testing process have to be made to decrease the defect number and
increase customer satisfaction. However, the target has to be realistic and feasible.
The number of open customer defect cases indicates the effectiveness of customer
originated faults correction. If the number is increasing the work prioritisation has to
be adjusted towards the customer fault corrections instead of a new feature
development. Anyway, it has to be guaranteed that correction time related service
level agreements with customers have been maintained in the promised way.
5.3.2 Open faults
The reference to the measurement can be defined as “New/closed/open faults by
priority level (critical, major, minor).” in attachment 1 and it was introduced in 13
data sources (attachments 2, 3 and 4). The detailed measurement content is
introduced on the company level definitions and presented in table 6.

26
Table 6. Open faults (Target setting 2013)
Scope: Open faults during the development time (snapshot in the end of
month)
Period: Month
Level: Product area – a report per product
Type: Absolute number
Target: Maximum number of allowed open faults for a product xA-xB-xC
(A=critical, B=major, C=minor) *
Responsible: R&D leaders, quality
* Allowed numbers are defined per product area. The organisation's actual targets are
not presented in the study.
The measurement measures monthly the number of product area open faults in the
ongoing release implementation. The fault number is a snapshot in the end of month
indicating the number of faults on different criticality levels (A-B-C). The reference
is the defined maximum number of allowed faults on the different criticality levels. It
has to be noticed that if you have for example 10 teams implementing new features
the maximum number is divided to the teams (this means, in practise, that per team
you cannot have any faults open).
The measurement gives an indication of whether the testing has been effective and
the code quality is on the required level. If the number of faults is increasing, work
prioritisation has to be done towards the fault corrections instead of a new feature
development. Actually, the number is a very clear message for teams that they have
to increase the quality and start corrective actions to get the number going down. In
the worst case, the ongoing sprint can be cancelled and priority is set to fault
corrections or a starting new sprint is allocated only to fault corrections. This is a
product owner decision based on the measurement.
5.4 Organisation development measurements
Measurements in this chapter are not really measuring the agile software
development process but are in use in the organisation and are worth mentioning also

27
in this study to give a big picture of generally used measurements. The following
measurements cannot be found from attachment 1.
5.4.1 Recruiting
The measurement is relating to the organisation's capability to deliver new features to
customers in a required schedule. The measurement content is defined together with
the line managers in the organisation and presented in table 7.
Table 7. Recruiting (Target setting 2013)
Scope: Resource increase per month (number of persons)
Period: Month
Level: Product area
Type: Absolute number, cumulative development
Target: Recruiting performed based on the recruitment plan
Responsible: R&D leaders
The measurement indicates the number of employees in the organisation, their
monthly increase and whether recruiting new employees has been proceeding
according to the recruitment plan. The progress of recruiting new people is followed
monthly.
5.4.2 Competence lift
“If you are developing systems focus on growing a cadre of skilled people, everyone
does not have to be an expert; you should have some experts, some on their way to
expertise, and some beginners. You need to take care that they are all continually
increasing their expertise.” (Poppendieck & Poppendieck 2010, 92)
The measurement is related to the organisation's personnel competence levels and via
it to the capability to deliver new features to customers in required schedule. The
measurement content is defined together with the line managers in the organisation
and presented in table 8.

28
Table 8. Competence lift (Target setting 2013)
Scope: All persons in the organisation shall lift two of the key
competence by one level during the year 2013
Period: Year, reported quarterly
Level: Product area, employee
Type: Absolute number
Target: One level up in the 2 key competences per person
Responsible: R&D leaders, individual persons
The measurement measures the current personnel competence development in their
key competence areas (which are defined separately per person). The progress is
followed quarterly and the target is that in the end of the year 2 key competence areas
per person will be lifted up according to the separate competence level criteria.
5.4.3 Employee engagement survey
The measurement is relating to the personnel well-being and work satisfaction. The
measurement content is defined together with the line managers in the organisation
and presented in table 9.
Table 9. Employee engagement survey (Target setting 2013)
Measurement scope: Employee engagement survey results, betterment in
results
Measurement period: Year
Measurement level: Site
Measurement type: Absolute number
Measurement target: Employee engagement survey result favourable %
increased x% *
Measurement responsible: R&D leaders
* A percentage is defined on a site level. The organisation's actual targets are not
presented in the study.

29
The target relating to the measurement is to plan and implement actions which will
lift the personnel well-being and work satisfaction up during the year and check
results in the next employee engagement survey.
This is important as personnel well-being and satisfaction has a direct link to the
organisation's capability to deliver new content and value for customers.

30
6 RECOMMENDED KEY PERFORMANCE INDICATORS
This chapter introduces agile software development process key performance
indicators which are recommended to be taken into use. The measurements are
selected based on collected data in attachment 1. Attachment 1 gives many possible
measuring combinations for each measurement. The measurements described below
are selected from different possible combinations in the way that they would serve
the organisation in the best possible way. The selected measurements are specified
according to the table presented in chapter 4.4.
The target in the measurement selection has been a definition of working and need
based agile software development measurements to measure team and organisation
level performance in work efficiency and quality.
It has to be noticed that, in practise, measurements mentioned below need to be
automated as much as possible to avoid manual data collection work.
6.1 Fault related measurements
6.1.1 Fault correction time to “Closed” state
The measurement reference is “Fault closing time from New to Closed.” in
attachment 1 and its content is defined based on the recommendations in attachment
1. The measurement definition data is presented in table 10.

31
Table 10. Fault correction time to “Closed” state
Scope: Time from “new” to “closed” state for internal faults
Period: Sprint – reported in the end of sprint (or month)
Level: Value stream
Type: Absolute number (time in days), trend
Target: Decrease correction time from x days to y days until end of an
agreed time period.
Responsible: R&D Leaders, scrum teams
The measurement measures a fault closing time for internal faults, from “new” to
“closed” state on average during a sprint (or alternatively a month). A measurement
level is a value stream. A number is reported in the end of a sprint (month) and also a
measurement trend is followed to obtain the direction in which the average closing
time is going. The target is to decrease the average time during the year 2013.
Customer defects are not calculated as they have a separate handling process and
they are measured against service level agreements. They would be very problematic
from measurement point of view as they are open until a customer has installed the
correction and closed the defect report.
The measurement gives an indication whether fault corrections have been
progressing effectively. Work priorities have to be adjusted towards fault corrections
instead of new feature development if the average correction time is increasing. The
number is a clear message for teams that they have to increase quality and start
corrective actions to get the average time down. In the worst case, the ongoing sprint
can be cancelled and priority is set to the fault corrections or a new sprint can be
allocated only for the fault corrections. This is a product owner and value stream
leader decision based on the measurement.
It has to be noticed that “Closed” means that a correction has been done to the all the
software branches (releases) that require the correction.

32
In addition, we could also measure fault states FCRT (first correction ready for
testing) and FCC (first correction completed). FCRT means that a correction is done
to one software branch (typically to the main branch). FCC means that a correction is
also tested in one software branch. The final state is “Closed”. It would be interesting
to draw some diagram presenting all fault states (FCRT, FCC, Closed) and take a
look at which state is the most time consuming.
6.1.2 Number of faults raised from system verification
“No matter how hard you try, an occasional defect will escape to production despite
your best effort. The only way to prevent escaped defects in the future is to examine
the ones that occur in the present, find their root cause and eliminate them.”
(Poppendieck & Poppendieck 2010, 146)
The measurement reference is “Number of faults raised from system verification.” in
attachment 1 and its content is defined based on the recommendations in attachment
1. The measurement definition data is presented in table 11.
Table 11. Number of faults raised from system verification
Scope: Number of faults raised from system verification.
Period: Week (month)
Level: Release (of a product)
Type: Absolute number, cumulative amount
Target: Decreasing number of faults during the system verification
(towards 0)
Responsible: R&D leaders, quality
The measurement measures weekly (monthly) the number of open faults in a release
under the system verification. System verification is testing accepted features
(potentially shippable content) from the end user point of view i.e. doing end-to-end
testing for new features. The purpose is to prevent system level end-to-end process
faults escaping to customers.

33
The number is a snapshot per week (and month). It gives an indication whether
internal user story and feature testing has been effective and of high quality, and if
used internal testing process is working well and effectively. In principle, we can talk
about fault leakage level from the internal testing. If the fault amount is increasing
corrective actions to the internal testing process have to be made to decrease the
defect amount in coming releases.
The increasing number is also a message for teams that they have to increase quality
and start corrective actions to get the number of faults going down. It also gives a
hint about testing coverage problems, problems on test automation level, problems
on regression testing level and about possible process betterment needs.
6.1.3 Faults from the implementation not done by a team
The measurement reference is “Number of faults coming from the implementation
not done by a team.” in attachment 1 and its content is defined based on the
recommendations in attachment 1. The measurement definition data is presented in
table 12.
Table 12. Faults from the implementation not done by a team
Scope: Number of faults coming from the implementation not done by a
team.
Period: Sprint – reported in the end of the sprint
Level: Team
Type: Absolute number
Target: Decreasing the amount, target has to be 0 per sprint.
Responsible: Scrum team
The measurement indicates the number of faults which a team has to correct and
which is not related to the implementation a team has done.
A root cause can be that a clear code ownership has been lost specially with a very
wide and old code base. Old functionalities may have been done before starting the
agile development, with new teams or reformulated teams. Quite often faults are

34
coming from customers or from system verification and relate to the old
functionality. Also, a short response time is appreciated with customer defects and
faults have the highest priority.
From a team point of view the faults are unplanned and unexpected maintenance
work. As the work is unplanned it affects a team throughput, commitment keeping
ratio, a sprint content stability and feature on time delivery. A normal case is that a
team has to study the implementation relating to the fault, which is time consuming
as a team has not implemented the functionality. Also, the old functionality (can be
called a legacy code) may not have a test automation implemented which also
increases the amount of required work.
“The challenge of legacy code is that, because it was created without automated tests,
it usually isn't designed for testability. In order to introduce tests, you need to change
the code (re-factor). And in order to change the code you need to introduce tests, a
kind of chicken-egg problem.” (Shore & Warden 2008, 305)
“Anyway, everybody in the organisation is responsible for high-quality code even
though the original implementation is not done by a team or an individual person”
(Shore & Warden 2008, 192).
6.1.4 Faults leading to new feature development
The measurement reference is “Number of reported faults leading to new feature
versus all the faults.” in the attachment 1 and its content is defined based on the
recommendations in attachment 1. The measurement definition data is presented in
table 13.

35
Table 13. Faults leading to new feature development
Scope: Number of reported faults leading to new feature versus all the
faults.
Period: Quarter, year
Level: Product
Type: Absolute number
Target: Decreasing amount, target is 0
Responsible: R&D leaders, scrum teams
The measurement indicates quarterly the number of faults which actually are new
features - not faults. The measurement is an absolute number of cases and can also be
measured on a year basis. The target should be zero as new features should be
possible to identify earlier than in a testing phase.
A root case for faults is that all requirements are not recognized during specification
work. The situation can be that requirements are totally not identified or some user
stories are not recognized. The outcome is that a missing part is discovered during a
testing phase as missing functionality and a missing part implementation has to be
prioritized by a product owner among other features under the work. Alternatively,
the correction implementation affects a feature cycle time in an unplanned way as
new user stories are an additional unplanned development for the feature.
A big amount of team level clarification work before starting the implementation can
be a sign that the specification work is not well done and there is a risk of a new
feature required. There can be a dependency on a specifier who did user stories for a
feature. Some specifiers can have, generally, more unclear items in their
specifications.
Also, the number of re-opened faults can also indicate that some functionality has not
been noticed and needs to be taken under investigation.

36
A root cause analysis is recommended for the faults leading to a new development as
it may show a solution to the problem why a functionality or part of functionality
was not noticed originally.
6.2 Delivery time measurements
6.2.1 Delivery on time
The measurement reference is “Number of features available in planned release date
(customer delivery debt).” in attachment 1 and it was introduced in 7 data sources
(attachments 2, 3 and 4). Its content is defined based on the recommendations in
attachment 1. The measurement definition data is presented in table 14.
Table 14. Delivery on time
Scope: Ratio of features done in planned release schedule
Period: Product release*
Level: Value stream
Type: Relative amount (%)
Target: Agreed release features done in planned release schedule **
(Max >x%, target y%, min z% of features done)
Responsible: R&D leaders, scrum teams
* Several releases during the year 2013.
**If a feature is dropped during the release development, for example because of
dependent system re-schedule, the feature is not counted in the calculation.
A root for the measurement is that customer commitments must be kept, this is also a
quality issue. “The natural tendency is to stretch out product release durations but
stretching out the time between releases is moving in exactly the wrong direction”
(Poppendieck & Poppendieck 2008, 107).
The measurement measures whether the organisation has been capable of delivering
all features in a release which have been promised to customers, and what is the
ratio of the promised content. The measurement indicates the real customer value by

37
measuring the ratio of features done and available for customers. It has to be noticed
that very often features are communicated with a roadmap to customers and they
have some expectations of feature availability.
The measurement requires teams inside a value stream to deliver fully implemented
and tested features (accepted) in the agreed time schedule (has to be available on a
milestone date).
The target is to keep the promised content and, in principle, the measurement makes
it visible if the organisation has problems with features and their implementation.
Corrective actions can and must be taken based on the measurement if the target
value for features is not reached.
6.2.2 Team commitment to the priority items
“A commitment means that you are making a promise to your team and to
stakeholders to deliver all the user stories in a team's sprint plan” (Shore & Warden
2008, 240).
“At the beginning of a sprint there is a planning meeting at which a team commits to
the user stories that it will complete during the sprint. By the end of the sprint the
team should be able to meet that commitment.” (Poppendieck & Poppendieck 2010,
126)
The measurement reference is “Team commitment to the priority items - feature
priority versus used hours.” in attachment 1 and its content is defined based on the
recommendations in attachment 1. The measurement definition data is presented in
table 15.

38
Table 15. Team commitment to the priority items
Scope: Team commitment to the priority items - feature priority versus
used hours.
Period: Sprint
Level: Team
Type: Correlation (feature priority in a sprint versus used hours)
Target: All the available team sprint hours are planned to the priority
item(s) and used for the priority item(s)
Responsible: Scrum teams
The measurement identifies a team commitment to priority items during a sprint. It
requires teams to concentrate on the priority items and deliver them – instead of
spending time with all possible items. The measurement shows, in every sprint,
whether a team is using time for the correct and prioritized items.
The measurement makes it visible, in principle, whether a team has a problem with
multitasking. It identifies silos in team member competencies and impediments in the
development which affects the team time usage and causes multitasking – some team
members have to take some lower priority items as they cannot take and progress
with the most important items. The measurement tracks items under work and makes
it visible if the team works together on the same task and whether the team is
implementing items according to the given priority order.
The target for the measurement is to make it visible whether a team is concentrating
on priority item(s), targeting to have a short feature cycle time, minimizing the
partially done work and making it possible to have wanted features available by
planned release date.
Also, the measurement makes the maintenance work and its effect on the priority
items visible. However, it has to be remembered that maintenance has the highest
priority.

39
6.3 Continuous integration cycle times
Continuous integration - a developer delivers a new functionality or a fault fix by
checking the code into the source control system and including it in a build of a
system. After a build a smoke test suite and other appreciated tests (regression, daily
regression) are run before the new build is installed to testing environments so that
the changes do not break the environments. (Leffingwell 2008, 131) “Feedback to the
developer is immediate and mistakes are corrected as they are made” (Leffingwell
2008, 169).
6.3.1 Smoke test cycle time
The measurement reference is “Test case execution time (smoke, regression,
acceptance).” in attachment 1 and its content is defined based on the
recommendations in attachment 1. The measurement definition data is presented in
table 16.
Table 16. Smoke test cycle time
Scope: Smoke test cycle time
Period: Month*
Level: Value stream, product area
Type: Absolute number (time: minutes, hours)*
Target: Decrease feedback cycle with x minutes/hours
Responsible: R&D leaders
* The trend on the year basis can also be measured.
The measurement shows a smoke test set running time (minutes) and is reported
monthly. The measurement can also be followed on a year basis to find out the trend
of a cycling time. The target is to keep time in the agreed limits or maybe decrease
time to guarantee the quicker feedback to developers about their code commitments.
The measurement is done on a product level but can be enhanced to a value stream
level as well.

40
Smoke test cases are run for all product builds and a target is to get information about
a basic functionality functioning in the software (green/red build after smoke tests).
Also, in a case of failing smoke cases (red), a new build is not installed to testing
environments. Development teams are responsible for smoke cases. If a case is
failing, an owner team is responsible to start problem evaluation to find the source of
the problem and transfer correction responsibility to the correct developer – normally
for the one who has changed functionality lately.
One target is to decrease the feedback cycle time to developers to find out as quickly
as possible whether a new committed code breaks something in the software. A short
cycle time is appreciated and one way to decrease the time spent in smoke tests is
parallel testing in different environments.
6.3.2 Regression test cycle time
The measurement reference is “Test case execution time (smoke, regression,
acceptance).” in attachment 1 and its content is defined based on the
recommendations in attachment 1. The measurement definition data is presented in
table 17.
Table 17. Regression test cycle time
Scope: Regression test cycle time
Period: Month*
Level: Value stream, product area
Type: Absolute number (time: minutes, hours)*
Target: Decrease feedback cycle with x minutes/hours
Responsible: R&D leaders
* The trend on the year basis can also be measured.
The measurement shows a regression test set running time and is reported monthly.
The measurement can also be followed on a year basis to find out the trend of the
regression set running time. The target is to keep the running time in the agreed
limits and if needed cases can be redefined, a case amount can be limited or several

41
test rounds can be defined and run them at separate times. For example, schedule a
set #1 during the 1st and 4th night, a set #2 during the 2nd and 5th night and a set #3
during the 3rd and 6th night. In principle, the measurement is done on a product level
but can be enhanced to a value stream level as well.
Test sets can be defined in a way that they all include some basic cases and set
specific part on top of them. We do not need to run all the possible cases every day or
night. We can have daily, weekly, per sprint and monthly regression rounds – cases
which need to be run more frequently are included in the daily regression sets and
cases which can be run less frequently, for example to check some old legacy
functionality, can be run inside monthly regression.
Regression test sets can be run at night time and leave day time for manual testing.
This way we can get much higher testing environment usage percentage.
Regression testing guarantees that existing product functionalities are working after
a new functionality implementation. The high level of the test automation makes
testing more effective and less time consuming. A team is responsible to automate a
new functionality testing and define regression cases for the functionality which then
can be used for regression testing in the next release.
The target is to get information about the old functionality functioning in the
software (green/red regression results). In the case of failing regression test round
(red) teams know that something is wrong. Teams are responsible for the cases and
responsible team developers need to start actions to correct the situation, find out the
source of the problem and raise a fault report or correct the problem if the problem is
in a team's responsibility area.
6.4 Software quality measurements
6.4.1 Unit test coverage for the developed code
“Unit tests are written by developers to test that their design intent is actually carried
out by the code” (Poppendieck & Poppendieck 2008, 107).

42
“Tests should be created first – before the code is written. Either the tests are derived
from the specification or tests are the specification. In either case, coding is not done
until the tests for the code are available, because then developers know what it is
they are supposed to code.” (Poppendieck & Poppendieck 2010, 73)
The measurement reference is “Unit test coverage for the developed code (%),
number of passing tests – way towards (A)TDD.” in attachment 1 and it was
introduced in 9 data sources (attachments 2, 3 and 4). Its content is defined based on
the recommendations in attachment 1. The measurement definition data is presented
in table 18.
Table 18. Unit test coverage for the developed code
Scope: Unit test coverage for the developed code.
Period: Sprint – reported in the end of sprint, cumulative amount on a
year level
Level: Product, team
Type: Relative number (%), cumulative development
Target: Increase unit test coverage x% during the next 12 months.
Responsible: Scrum team, R&D leaders
The measurement shows the percentage of unit test cases coverage for a code in a
product and is reported in the end of every sprint.
The target is to increase a coverage percentage when new implementation is done (or
at least to keep it on the current level). A basic principle is that new automated unit
tests are written always when a new code is written and in many cases unit tests are
written first and an actual code after the test cases. It guarantees that a new
developed code works against its own basics level automated unit tests.
A team, and a single developer in a team, is responsible to write unit test cases for the
implemented new code. A year to year target for the measurement is to increase a
unit test case coverage level.

43
The original measurement definition in attachment 1 also presents a measurement
for a number of passing unit tests but it is not covered in this measurement.
6.4.2 Regression test coverage
“Knowing the code has sufficient coverage by automated regression tests gives a
feeling of confidence” (Crispin & Gregory 2010, 261). When an automated
regression test fails unexpectedly, a regression defect may have been introduced by a
code change. Running an automated suite of tests frequently (build regression, daily
regression, weekly regression, sprint regression) helps ensure that regression bugs
will be caught quickly. (Crispin & Gregory 2010, 262)
The measurement reference can be defined as “Automated regression testing
coverage.” in attachment 1 and its content is defined based on the recommendations
in attachment 1. The measurement definition data is presented in table 19.
Table 19. Regression test coverage
Scope: Automated regression testing coverage based on the product area
regression testing data definitions
Period: Year, reported monthly
Level: Product area
Type: Relative number (%)
Target: Increase automated regression test coverage x% until end of 2013
(versus end of 2012)
Responsible: R&D leaders, scrum teams
The measurement shows the percentage of automated regression test cases coverage
for the existing functionalities in a product area and is reported every month. The
year to year target for the measurement is to increase the automation level as much as
possible in the feasible manner and effort.
Regression testing guarantees that the existing product functionalities are working
after a new functionality implementation. They are written independently of the

44
implementation and thus treats the system as a black box (Leffingwell 2008, 160).
The high level of automation makes the testing more effective and less time
consuming.
A team is responsible to automate new functionality testing and define test cases
which can be used for the regression testing in a next release.
6.4.3 Technical debt
“All successful software gets changed. So, if we think we are working on code that
will be successful, we know we need to keep it easy to change. Anything that makes
code difficult to change is technical debt.” (Poppendieck & Poppendieck 2010, 34)
The measurement reference can be defined as “Technical debt ratio on a product
level (”undone work”).” in attachment 1 and its content is defined based on the
recommendations in attachment 1. The measurement definition data is presented in
table 20.
Table 20. Technical debt
Scope: Technical debt measured by Sonar tool
Period: Year, reported monthly
Level: Product area
Type: Relative number (%)
Target: Decrease technical depth x% in Sonar tool measurements until
end of 2013 (versus end of 2012)
Responsible: R&D leaders, scrum teams
The measurement indicates the amount of a technical debt in a product according to
separately defined algorithms in Sonar-tool. The current level is reported monthly
and a year to year target is to decrease its amount.
A team is responsible to minimize the technical debt in a done implementation and
also decrease its amount in the long run according to a separately defined target %.

45
Technical debt in a product is, for example, short-cuts implemented and left to the
code or leaving the known fault on purpose to the system. Technical debt can also be
duplicated methods in the code or missing comments in the code. However, in many
cases the technical debt requires later re-factoring work to the code to get it working
well and having it easily maintainable.
6.5 Team time usage
6.5.1 Planned and real working hours
“Most effort estimates contain a tremendous amount of uncertainty which is often not
fully reflected in the schedules and content commitments that teams create” (Cohn
2007, 200).
The measurement reference is “Planned hours versus real hours, in which area
(implementation, testing, etc.) is the difference.” in attachment 1 and its content is
defined based on the recommendations in attachment 1. The measurement definition
data is presented in table 21.
Table 21. Planned and real working hours
Scope: Difference in a work task real working hours and planned
working hours (implementation, testing, etc.).
Period: Sprint – reported in the end of sprint
Level: Team
Type: Absolute number (hours), relative number (%)
Target: Reality according to the plan (100%)
Responsible: Scrum team
The measurement identifies a feature effort estimation accuracy versus real hours
spent with a feature. The measurement can also be done on a user story level if
wanted. The measurement is done after each sprint and features which are fully done
are included in the calculation.

46
The target is to learn to do more accurate initial effort estimates and learn to
understand different kind of work items and contents to making the effort estimation
easier and more accurate.
The measurement makes it visible, in principle, if a team has problems in feature
work finalisation. This leads to multitasking in a team as some team members are
still working with an old feature and the rest of a team is taking new challenges -
instead of helping in a previous feature finalisation. The team does not work together
on the same task and feature.
The measurement shows the accuracy of the original effort estimate. In the long run
it helps teams to make better estimates by giving feedback about the accuracy. This is
important for understanding better a feature cycle time from a decision to a delivery
and for a release content planning stability to guarantee the content promised to
customers.
The user story quality needs to be on a good enough level for making better estimates
possible and to avoid surprises which ruin the given effort estimates. It is also a
necessity that a team is discussing with a feature specifier to clarify possible open or
unclear issues before giving effort estimates.
6.5.2 New feature and fault correction work
The measurement reference is “Number and ratio of new feature and fault correction
work, developing new features versus fixing faults.” in attachment 1 and its content
is defined based on the recommendations in attachment 1. The measurement
definition data is presented in table 22.

47
Table 22. New feature and fault correction work
Scope: Number and ratio of new feature and fault correction work
(developing new features versus fixing faults).
Period: Sprint – reported in the end of sprint
Level: Product, team
Type: Absolute number (hours), relative number (%)
Target: Minimize hours used for fault fixing
Responsible: Scrum team
The measurement identifies a number and a ratio of new feature development and
fault correction efforts (hours) in a sprint. The measurement can be done on a team
level and on a product level, and is done in the end of each sprint. Target is to get an
understanding how much a team uses time for fault fixings instead of implementing
new features.
The measurement makes the time spent on fault fixing visible and an increasing
amount can be an indications of serious problems in product quality. Problems
require immediate corrective actions and, in addition, they may require new priorities
towards fault fixings defined by a product owner. An increasing fault fixing ratio can
also identify coming problems in a feature cycle time and in a feature availability in a
releasing date. Any signs showing the increase in the measurement have to be taken
seriously.
6.5.3 Sprint burn-down chart
“A sprint burn-down chart is used to track the work of the current iteration and it
graphs the number of hours remaining on the vertical axis and the days of the sprint
on the horizontal axis” (Cohn 2007, 232).
The measurement reference is “Sprint burn-down chart for tracking of team level
work progress, work remaining.” in attachment 1 and it was introduced in 10 data
sources (attachments 2, 3 and 4). Its content is defined based on the
recommendations in attachment 1. The measurement definition data is presented in
table 23.

48
Table 23. Sprint burn-down chart
Scope: Sprint burn-down chart for tracking of team level work progress
during a sprint, identifying the work remaining.
Period: Sprint (followed daily during a sprint)
Level: Team
Type: Absolute number (hours), a graph (hours work left – sprint days)
Target: Hours burned close to ideal line, accuracy more than 80%
Responsible: Scrum team, R&D leaders
A sprint burn-down chart is a simple graph presenting team work progress (hours) on
a daily basis.
The burn-down chart includes an ideal line which gives information that each day of
a sprint a team should burn the same amount of work (hours) and the line goes
linearly towards zero, reaching zero on the last day of a sprint. A real burn-down line
should go as close to the ideal line as possible. Reality could be totally different in
very many cases. There can be some unexpected work appearing during a sprint, for
example relating to the maintenance, underestimations or missing user story work
items and tasks, which turns the real line to go away from the ideal line. The graph
should be updated every day during a sprint, by a team. The outcome is checked in a
sprint review in the end of a sprint.
You can see an example burn-down chart in figure 3. The sprint has not been
progressed as planned, about 30% of the planned work is not done.

49
Figure 3. An example burn-down chart
6.6 Team activity measurements
6.6.1 Number of demos in sprint review
“Sprint reviews help to keep a team honest as they are concrete demonstrations of a
team's progress during a sprint” (Shore & Warden 2008, 138).
“The incremental and iterative nature of agile development gives a chance to
demonstrate business value as it is produced, even before it is released” (Crispin &
Gregory 2010, 192).
The measurement reference is “Number of team demos kept in sprint review” in
attachment 1 and its content is defined based on the recommendations in attachment
1. The measurement definition data is presented in table 24.

50
Table 24. Number of demos in sprint review
Scope: Number of team demos in sprint review.
Period: Sprint, year
Level: Team
Type: Relative number (%), trend
Target: All development teams presents a demo (100%) about the
accepted content in a sprint review. Trend on a year level.
Responsible: Scrum team, R&D leaders
The measurement indicates a scrum team demo ratio in a sprint review meeting i.e.
how many teams of all the teams are giving a demo presentation in a sprint review.
The target is that all the teams have a demo presentation in each sprint review.
The measurement requires that teams are capable of keeping and demoing the
committed content (agreed in a sprint planning) in the end of a sprint. In principle,
the measurement makes it visible if a team has problems to keep the content they
have promised in a sprint planning and if a team has problems in the work process or
maybe on a person level. A discussion with a team, some coaching for a team or
other corrective actions to remove possible problems have to be taken to correct the
situation.
There is also a dependency on a feature effort estimate accuracy. Totally wrong effort
estimates can be a root cause for the problem. The first corrective action would be to
guarantee that the user story quality is on good enough level to avoid surprises which
ruin the given estimates.
Problems with missing demo presentations can also identify problems in a feature
cycle time from a decision to a delivery. This can lead to problems in release content
planning stability which has direct impact on the content promised for customers.
6.6.2 Team morale barometer
“Teams need a challenge, a common goal, and a mutual commitment to work
together to meet the goal. A wise organisation focus its attention, trainings, and

51
resources on creating an environment where teams and individuals are doing the best
job they can.” (Poppendieck & Poppendieck 2008, 127)
The measurement reference is “The team morale barometer, team members giving a
number 1-10, 10 representing happiness and 1 that the person would like to get off
the project.” in attachment 1 and its content is defined based on the recommendations
in attachment 1. The measurement definition data is presented in table 25.
Table 25. Team morale barometer
Scope: The team morale barometer
Period: Sprint, quarter
Level: Team, site
Type: Absolute number (average for all the teams), trend
Target: Site level average trend staying on appreciated level or increasing
trend.
Responsible: R&D leaders
The measurement indicates people satisfaction inside teams and is the average of all
team results. The measurement is done in each team in each sprint retrospective and
based on the results the average is calculated. Also, a satisfaction trend is measured
to catch the decreasing number and to start corrective actions.
The measurement is done in the way that all team members are giving a number
(secret i.e. without an identification who is giving a number) from 1 to 10 about their
happiness and satisfaction relating to the team and work. Number 10 means that a
person is satisfied with his work and number 1 that a person would like to get off the
project or work. The higher the average number is the better is the atmosphere inside
teams.
The measurement makes it visible if an organisation has problems which affect work
satisfaction. Possible problems can be on an organisation, a team or an individual
level. However, a discussion with a team, some coaching for a team and other

52
corrective actions to remove possible problems affecting work satisfaction have to be
taken to correct the situation.
6.6.3 Definition of done check list
“Check lists are one way for a product owner to make sure that all the aspects of a
user story and a feature are taken into account in the development” (Crispin &
Gregory 2010, 156).
The measurement reference is “Definition of done check list compliance level.” in
attachment 1 and its content is defined based on the recommendations in attachment
1. The measurement definition data is presented in table 26.
Table 26. Definition of done check list
Scope: Definition of done criteria check list compliance level
Period: Month
Level: Feature
Type: Relative number (%)
Target: All criteria checked for all features (100%)
Responsible: Scrum team, R&D leaders
The measurement identifies a definition of done criteria fulfilment and the
measurement can be done against a feature level definition of done criteria or a user
story level definition of done criteria. The definition of done criteria gives a criteria
which need to be met before a team can state that a feature or user story is done.
Actually, no feature should not leave a production, or a team, before the definition of
done criteria is met. The measurement is measured monthly and the target level is
100%.
The measurement also makes it visible if a team has problems in feature work
finalisation and with the definition of done. Possible problems can be in the
definition of done criteria itself, some items in the criteria are not understood at all,
some items in criteria are misunderstood or a team and people in a team have no
interest to take needed actions to finalize a feature work. However, a discussion with

53
a team, some coaching for a team and other corrective actions are required to correct
the situation as the definition of done is an absolute must to follow.
It should be noticed that the outcome is multitasking inside a team if some team
members are still working with the old feature's definition of done criteria related
tasks when the rest are taking new challenges - instead of helping with the definition
of done criteria tasks. A team should use all needed effort to close old items before
starting a new item.

54
7 SELECTED MEASUREMENTS IN PRACTISE
Several recommended measurements were introduced in chapter 6 but the
organisation decided to take into use 6 of them now on top of the measurements
introduced in chapter 5. The selected 6 measurements are described more accurately
in this chapter with some example data. The real data is not presented in the study
but collected inside the organisation.
The selected measurements are specified in more detail in the subchapters. The
source for collected data is defined, the data is collected and some graphical
illustrations are provided about the results. However, the presented source data in the
study is some example data - not the organisation's real data.
Preparation for implementing the selected measurements to practise has to be done
and they have to be communicated to the organisation. As well, data collection
methods need to be documented and communicated. A presentation material for the
communication has to be defined. However, presentation material is aimed for the
organisation's internal use and is not a part of the study.
After the study, a future activity is the collected data evaluation in terms of
measurement efficiency, value and quality. If any need appears measurements will be
adjusted to meet the organisation's needs more accurately.
7.1 Fault correction time to “Closed” state
A measurement was modified a bit for the organisation's use and a detailed definition
of a used measurement is in table 27.

55
Table 27. Fault correction time to “Closed” state
Scope: Time from “new” to “closed” state, internal faults *
Period: Month – reported in the end of month
Level: Value stream
Type: Absolute number (days), average value for all internal faults,
optional: monthly trend
Target: Decrease average correction time to 10 days until end of year
2013. (Max: 8 days, Target: 10 days, Min: 15 days)
Responsible: R&D Leaders, scrum teams in a value stream
* Customer faults are not calculated, they are separately handled against the SLA.
The measurement gives information about the fault correction time in the
organisation. Currently the time is too long and it was found important to pay special
attention to the closing times. The measurement target really challenges teams and
requires them to take the fault corrections seriously and give the correct priority for
them.
The average number of days is reported in the end of month. The target is to decrease
the average time to 10 days during the year 2013. The trend during the year can be
followed as well. A fault closing average time data example is presented in figure 4.
Figure 4. Fault correction time to “Closed” state

56
In practise, the measurement data is collected from a defect tracking tool. Defects
which are closed during month are taken into account in a monthly report (although
they would have been opened already in the previous month). A correction time per a
defect is calculated from opening and closing times (dates). A measurement outcome
is an average of all collected correction times.
The 1st real data collection month was February 2013. Based on the data it can be
said that lots of actions need to be taken during the year 2013 that the organisation
can reach the set target value for the measurement. The measurement gives an
indication that fault corrections have to progress more effectively that the average
time would go towards the set target level. If the average time is not decreasing,
work priorities have to be adjusted towards the fault corrections instead of a new
feature development.
7.2 Delivery on time
A measurement was modified a bit for the organisation's use and a detailed definition
of a used measurement is in table 28.
Table 28. Delivery on time
Scope: Ratio of features done in planned release schedule
Period: Product release
Level: Value stream
Type: Relative amount (%)
Target: Agreed release features done in planned schedule
(Max >100%, target 100%, min 90% of features done)
Responsible: R&D leaders, scrum teams
A release feature content ratio in percentages (%) is reported when a releasing date is
reached. The target is to implement the whole planned content for a release.
The measurement gives information about the release content keeping ratio in the
organisation. Currently the implementation time easily goes over the planned

57
schedule and it was found important to pay special attention to keep the release
content keeping. The measurement target requires teams to keep the commitments
they have done to user stories and features (for having on time deliveries).
During the year several releases will be released but only one of them during the time
period the study is done. A release is reaching ready for pilot deliveries milestone in
the beginning of March and it seems that the ratio for the release will be 100%. The
release includes 8 features and some snapshot (the 1st of March situation) of status
information is presented in figure 5.
Figure 5. A release feature implementation status example
Some comments relating to the figure:
• Feature names are hidden on purpose.
• Some features (3) include also cancelled user stories which are identified also
in the figure (red).
• One user story in the 2nd feature is in “started” state. Missing part is a test
automation for the user story.
• 10 user stories in the 4th feature are in “not started” state. A team has reported
that missing user stories will be done during the ongoing sprint and the
feature will be fully implemented for the release.
In practise, the measurement data is collected from the product backlog management
tool. A report per a release and a release content can be defined in the tool (example
report in the above figure). A feature is fully done when all the user stories in a

58
feature are in the “done” state or alternatively in the“cancelled” state for some reason
(out of scope in the study). The ratio is calculated based on fully done features versus
the planned release features. If a feature is dropped during the release development,
for example because of a dependent system re-schedule, the feature is not counted in
the calculation.
A root for the measurement is that customer commitments must be kept and whether
an organisation is capable of delivering features which have been promised to
customers, and what is the ratio of the promised content and gained customer value
by measuring the ratio of features done and available for customers. It has to be
noticed that very often features are communicated with a roadmap to customers and
they have some expectations of feature availability. Features have to be delivered in
the agreed time schedule (has to be available on a milestone date). The target is to
keep the promised content and, in principle, the measurement makes it visible if an
organisation has problems with features and their implementation.
7.3 Technical debt
A measurement was modified a bit for the organisation's use and a detailed definition
of a used measurement is in table 29.
Table 29. Technical debt
Scope: Technical debt measured by Sonar tool
Period: Month
Level: Product area
Type: Relative number (%)
Target: Decrease technical depth 10% in Sonar measurements until end of
2013 (versus end of 2012)
Responsible: R&D leaders, scrum teams
A technical debt on a product level in percentages (%) is reported in the end of every
month. The target is to decrease the percentage value by 10% during the year 2013.
The trend during the year can be followed as well. An example is presented in figure
6.

59
Figure 6. A technical debt
The measurement gives information about the technical debt in a product. The
organisation decided that it is important to have the technical debt at a lower level
and to pay special attention to decreasing it. The measurement target challenges
teams to put effort also to the code factoring work to reach the wanted level of the
technical debt.
In practise, the measurement data is collected from Sonar tool which is calculating
the debt automatically according to separately defined algorithms. It takes into
account design problems, coverage problems, code duplications, violations, comment
problems and code complexities. It summarizes the data automatically to be one
technical debt value. The 1st real data collection month was February 2013. Figure 7
gives an example of the available data in Sonar tool.

60
Figure 7. A technical debt information example
As the target is to decrease 10% of the amount of the technical debt until end of the
year 2013 the special separately agreed actions are required. It has been agreed with
a product owner that each team can use a specific number of hours in a sprint to re-
factor the code to reduce the technical debt.
7.4 Unit test coverage for the developed code
A measurement was modified a bit for the organisation's use and a detailed definition
of a used measurement is in table 30.

61
Table 30. Unit test coverage for the developed code
Scope: Unit test coverage for the developed code.
Period: Month – reported in the end of month
Level: Product area
Type: Relative number (%)
Target: Increase unit test coverage 10% during the next 12 months.
Responsible: Scrum team, R&D leaders
A unit test coverage on a product level in percentages (%) is reported in the end of
month. The target is to increase the percentage value by 10% during the year 2013. A
cumulative amount during the year can also be followed. An example is presented in
figure 8.
Figure 8. An unit test coverage
The measurement gives information about the unit test coverage in a product area.
The unit test coverage in the organisation is currently on the lower level than wanted.
It was decided to have a measurement also in the area for making the currrent level
and progress per month visible. Teams have to take care that the wanted level is
reached and in practise all new code have to have unit test cases written.
In practise, the measurement data is available and collected from Sonar tool which is
calculating the coverage automatically according to separately defined algorithms

62
and rules. The 1st real data collection month was February 2013. Figure 9 gives an
example of the available data in Sonar tool.
Figure 9. A unit test coverage data example
New automated unit tests are written always when a new code is written to maintain
the coverage level (%). A problematic part is an old legacy code which does not have
unit cases written and which is decreasing the coverage level even if in the case that
a new code is fully covered with unit test cases. Special actions with the old legacy
code are required to increase the number.
7.5 Smoke test cycle time
A measurement was modified a bit for the organisation's use and a detailed definition
of a used measurement is in table 31.
Table 31. Smoke test cycle time
Scope: Smoke test cycle time
Period: Month
Level: Product area
Type: Absolute number (minutes)
Target: To keep cycle time in 2 hours
Responsible: R&D leaders
The measurement shows a smoke test set running time and is reported monthly
(average in the end of the a month). The measurement was selected as we wanted to
keep smoke test cycle time within certain limits to guarantee a short continuous
integration response time to developers (about commitments they are doing to the

63
code). A short cycle time is appreciated. One way to decrease the time in smoke tests
is a parallel testing in different environments. It was decided in the organisation that
we need to follow the time and start actions if time is increasing.
A smoke test cycle time data illustration example is presented in figure 10.
Figure 10. Smoke test cycle time data example
In practise, the cycle time data is collected from the continuous integration reporting
tools. The cycle includes “radiosmoke” and “radioregression” test sets (sum of the
times). After the green cycles a build is ready to a system level installation. Figure 11
gives an example of available data in the reporting tool. The 1st real data collection
month was February 2013. The value is the average of smoke test round times in the
end of the month.
Figure 11. Smoke test cycle time reporting

64
Smoke test cases are run for all product builds and the target is to get information
about the basic functionality functioning in the software (green/red build after the
cycle). In the case of a failed smoke case (red), a new build is not installed to system
testing environments.
7.6 Regression test cycle time
A measurement was modified a bit for the organisation's use and a detailed definition
of a used measurement is in table 32.
Table 32. Regression test cycle time
Scope: Daily regression test cycle time
Period: Month
Level: Product area
Type: Absolute number (hours,minutes)
Target: Running in 8 hours in the end of year 2013 (running night time)
Responsible: R&D leaders
The measurement shows a regression test set running time and is reported monthly.
The measurement was selected in order to get the used time visible. As the target is
to keep the time within agreed limits, cases can be redefined, a number of cases can
be limited or several test rounds can be defined and run them at separate times or in
parallel environments. It was decided in the organisation that we need to follow the
time and start actions to reduce it during the year.
Some regression test example cycle time data illustration is example presented in
figure 12.

65
Figure 12. Regression test cycle time data example
In practise, the regression test cycle times are collected from the continuous
integration reporting tools. Figure 13 gives an example of the available data in the
tool – there are one succeeded regression round and 2 failed rounds in the example.
The 1st real data collection month was February 2013. The number is the average of
running times.
Figure 13. Regression test cycle time reporting
Regression test sets do not need to include all possible cases but tests can be divided
into several test sets which are run during the separate nights or in separate
environments.
7.7 Future measurement - definition of done check list
A measurement was modified a bit for the organisation's use and a detailed definition
of a used measurement is presented in table 33. However, the measurement was

66
decided to be taken into use later durintg the year 2013 when needed tools and
reportings are defined. That is not in the scope of the study.
Table 33. Definition of done check list
Scope: Feature definition of done check list compliance level
Period: Month
Level: Feature
Type: Relative number (%)
Target: All criteria checked for all features (100%)
Responsible: Scrum team, R&D leaders
The measurement identifies the definition of done criteria fulfilment per feature. The
definition of done criteria needs to be met before a team can state that a feature is
done. No feature should leave a production before the definition of done criteria is
met.

67
8 CONCLUSION
The original idea of the study was to evaluate the agile software development related
books and internet sources to identify the recommended key performance indicators
and select some of them to the organisation's use. During the source material
evaluation it became obvious that material situations in books and internet sources is
limited. In order to get more input to the study we decided to arrange some internal
agile development measurement workshops in the organisation. Invited people are
working daily in agile software development. Several useful measurements were
defined in the workshops. The workshops made it visible that there is lots of (hidden)
knowledge and potential capacity in the people of the organisation. In principle, we
can think that the measurements are defined based on the real needs in the
organisation.
It can be clearly stated that the people who were participating in the workshops, were
capable of providing very valuable input for the study as they know the agile
software development process very well. Also the project team, the organisation's
line managers, project managers and operation development manager, were
providing valuable input for the study. As the outcome is generated together in the
organisation the commitment to the selected measurements seems to be very good. I
would strongly recommend the same practises for all the organisations that need to
do some development process betterments but, at the same time, I would like to
emphasis that a process development project needs a leader who drives the project
forward.
The measurement definitions in chapter 6 and and also the measurement selection
decisions for chapter 7 were done in co-operation with organisation specialists and
the project team, which guarantees that the measurements are defined and selected
based on the organisation needs. As an outcome of measurement definitions the
usage definitions per measurement were done; type, level, period and scope.

68
It was easy to notice that the measurements were concentrating on the known key
areas in the software development and it is also visible in the measurement collection
data, for example fault amount, release content, testing cycle time and fault
correction time are the clear well-known key areas.
What we learned from the measurement data definition and collection was that for
most of the selected measurements the actual data has been available all the time but
the data is collected as measurements the first time now. The next step for the
measurement data collection would be data collection automation for making the
data more easily available. After the automatic collection is available the data can be
easily published in a dashboard which makes it more visible and accessible for all the
people in the organisation.
In the long run, the selected measurements and the data collection can be adjusted if
any need is discovered.
It is important to notice and understand that measurements should not be defined
because of measurements – a measurement has to have some meaning and we must
be capable of justifying a measurement against the questions why something is
measured and what will be reached by measuring something.

69
REFERENCES
Agile software development. Wikipedia 09.03.2013. Referred 10.3.2013.
http://en.wikipedia.org/wiki/Agile_software_development
Andersson, L. 2012. Maintenance in scrum. M. Sc. Thesis. University of Tampere:
School of Information Sciences.
Cohn M. 2007. Agile estimating and planning. 5th printing. Upper Saddle River, NJ:
Prentice Hall PTR.
Company efficiency program. Communication material. 1.8.2012. Referred 1.2.2013
Crispin, L. & Gregory, J. 2010. Agile testing. 6th printing. Boston, MA: Addison-
Wesley.
Leffingwell, D. 2008, Scaling software agility, best practices for large enterprises.
2nd printing. Boston MA: Addison-Wesley.
Manifesto for Agile Software Development. 2001. Referred 10.3.2013.
http://agilemanifesto.org/
Poppendieck, M. & Poppendieck, T. 2008. Implementing lean software development,
from concept to cash. 6th printing. Boston, MA: Addison-Wesley.
Poppendieck, M. & Poppendieck, T. 2010. Leading lean software development,
results are not the point. 3rd printing. Boston, MA: Addison-Wesley.
Scrum (development). Wikipedia 08.03.2013. Referred 11.3.2013.
http://en.wikipedia.org/wiki/Scrum_%28development%29

70
Shore, J. & Warden, S. 2008. The art of agile development. 1st printing. Sebastopol,
CA: O'Reilly Media Inc.
Software metric. Wikipedia 13.03.2013. Referred 13.3.2013.
http://en.wikipedia.org/wiki/Software_metric
Software Quality Metrics. 5.5.2010. Referred 13.3.1013.
http://it.toolbox.com/wiki/index.php/Software_Quality_Metrics
Target setting 2013. Target setting definition material. 21.1.2013. Referred 1.2.2013
The Twelve Principles of Agile Software. 2013. Referred 10.3.2013.
http://www.agilealliance.org/the-alliance/the-agile-manifesto/the-twelve-principles-
of-agile-software/
Topic:Software Metrics and Measurement. Wikiversity 21.2.2010. Referred
13.3.2013. http://en.wikiversity.org/wiki/Topic:Software_Metrics_and_Measurement

ATTACHMENT 1
SUMMARY OF THE COLLECTED MEASUREMENTS
Type Periord Level Scope
Measurement
Nu
mb
er
Rat
io (
%)
Tre
nd
Cu
mul
ativ
e
Cor
rela
tion
Wee
k (
day
)
Sp
rin
t
Mon
th
Qu
arte
r
Yea
r
Tea
m
Val
ue
stre
am
Sit
e
Pro
du
ct
Rel
ease
Hou
rs (
day
s)
Sto
ry p
oin
ts
Use
r st
ory
Fea
ture
Fre
qu
ency
Feature development
Number of features available for releasing.
x x x x x x x x x 13
Number of features available in planned release date (customer delivery debt).
x x x x x x 7
Time to market - feature cycle time from decision to delivery (days).
x x x x x x x
Feature cycle time (days) correlation to the work amount.
x x x x x x x 5
Quality of team planning
Planned work versus the work burned down.
x x x x x x x x x x
Content stability (added/ removed items).
x x x x x x x x x 6
Planned testing done (and not lagging behind).
x x x x x x x x x
Used hours per planned items in priority order.
x x x x x x x x x 6
Quality of user stories
Product backlog prioritization (content ranking by priority).
x x x x x x x 3
User story average cycle time - from started to done.
x x x x x x x x x 6
Team level clarification amount required before starting implementation.
x x x x x x x x
Defects per user story (as x x x x x x x x

Type Periord Level Scope
Measurement
Nu
mb
er
Rat
io (
%)
Tre
nd
Cu
mul
ativ
e
Cor
rela
tion
Wee
k (
day
)
Sp
rin
t
Mon
th
Qu
arte
r
Yea
r
Tea
m
Val
ue
stre
am
Sit
e
Pro
du
ct
Rel
ease
Hou
rs (
day
s)
Sto
ry p
oin
ts
Use
r st
ory
Fea
ture
Fre
qu
ency
user story definition is too ambiguous – quality issue).
User stories done per time versus specifier who defined the user stories.
x x x x x x x
User story deployment
Canceled user stories versus all user stories (%).
x x x x x x x
Accepted user stories (potentially shippable content).
x x x x x x x x x 13
Team velocity
Team velocity versus capacity.
x x x x x x x x 6
Team commitment keeping ratio (on time delivery).
x x x x x x x x x x 5
Team throughput – number of items delivered in a given time period.
x x x x x x x x x x x 2
Amount & ratio of partially done work - not known if the outcome is working. (trend to be decreasing).
x x x x x x x x x x x x 2
Team planned hours versus real hours
Team dedication rate to the sprint work (versus all available hours).
x x x x x x 2
Testing hours versus implementation hours (or total hours) - the whole-team-approach in testing.
x x x x x
Planned hours versus real hours, in which area (implementation, testing, etc.) is the difference.
x x x x x x x 2
Team test automation ratio increase versus time used
x x x x x x x x

Type Periord Level Scope
Measurement
Nu
mb
er
Rat
io (
%)
Tre
nd
Cu
mul
ativ
e
Cor
rela
tion
Wee
k (
day
)
Sp
rin
t
Mon
th
Qu
arte
r
Yea
r
Tea
m
Val
ue
stre
am
Sit
e
Pro
du
ct
Rel
ease
Hou
rs (
day
s)
Sto
ry p
oin
ts
Use
r st
ory
Fea
ture
Fre
qu
ency
for test automation (automation development efficiency).
Team commitment to the priority items - feature priority versus used hours.
x x x x x x
Team time usage
Team time usage (user stories, canceled stories, internal faults, external faults, implementation, testing, test automation, manual testing, fault corrections, planning and specification, meetings, root cause analysis, reviews, documents etc.)
x x x x x x x x 3
Team level peer code and test case reviews.
x x x x x x x x
(A)TDD usage. x x x x x x x x x x
Pair programming (hours/%), should be increasing.
x x x x x x x x x x 3
Code measurements
Ratio of reviewed code on the product level.
x x x x x x x 3
Generated, implemented, removed and commented code rows.
x x x x x x x
Number of implemented methods.
x x x x x x x x x
Technical debt
Amount and ratio of re-factoring work.
x x x x x x x x x 3
Technical debt ratio on a product level (”undone work”).
x x x x x x x x 3
Green build ratio
Product CI and automated x x x x x x x x x x 8

Type Periord Level Scope
Measurement
Nu
mb
er
Rat
io (
%)
Tre
nd
Cu
mul
ativ
e
Cor
rela
tion
Wee
k (
day
)
Sp
rin
t
Mon
th
Qu
arte
r
Yea
r
Tea
m
Val
ue
stre
am
Sit
e
Pro
du
ct
Rel
ease
Hou
rs (
day
s)
Sto
ry p
oin
ts
Use
r st
ory
Fea
ture
Fre
qu
ency
test case success (upgrade, smoke, regression steps).
Green build ratio for adaptation builds.
x x x x x x x x x
SVN check in
Ratio of correct case name and tags in SCM check-in - case quality versus criteria.
x x x x x x x x x
Environment updates
Number of laboratory environment updates versus number of commits.
x x x x x x x
Test case amounts
Manual and automated acceptance tests/total test cases, report showing the ratio of automated tests.
x x x x x x x 12
Number of unit tests – whether team puts effort into the unit tests.
x x x x x x x x
Unit test coverage for the developed code (%), number of passing tests – way towards (A)TDD.
x x x x x x x x x 9
Fault correction test automation ratio.
x x x x x x x 2
Test case execution time, case amount versus used time (smoke, regression, acceptance).
x x x x x x x x x x
Test case execution time (smoke, regression, acceptance).
x x x x x x
Number of cases in which test automation prevented builds and labs go broken.
x x x x x x
Regression testing

Type Periord Level Scope
Measurement
Nu
mb
er
Rat
io (
%)
Tre
nd
Cu
mul
ativ
e
Cor
rela
tion
Wee
k (
day
)
Sp
rin
t
Mon
th
Qu
arte
r
Yea
r
Tea
m
Val
ue
stre
am
Sit
e
Pro
du
ct
Rel
ease
Hou
rs (
day
s)
Sto
ry p
oin
ts
Use
r st
ory
Fea
ture
Fre
qu
ency
Automated regression testing coverage.
x x x x x x
Faults found by automated regression testing (i.e. time wasted in rework).
x x x x x x x x 2
Regression test case amount development.
x x x x x x x
Regression testing success ratio.
x x x x x x x x
Ratio of test automation case re-usage, number of cases reused versus all.
x x x x x x x
Fault source
Faults found by customer, escaping from production.
x x x x x x x x 8
Number of faults raised from system verification.
x x x x x x x x x
Number of faults coming from the implementation not done by a team.
x x x x x x x
Number of faults
Number of faults in a sprint/release, to track testing effectiveness.
x x x x 3
Number of defects versus number of test hours spent.
x x x x x x x x x 2
Number of defects versus number of test cases
x x x x x x x x x 3
New/closed/open faults by priority level (critical, major, minor).
x x x x x 13
Fault in-take/out-take ratio. x x x
Number of re-opened faults versus all the faults.
x x x x x x 2
Number of reported faults leading to new feature versus all the faults.
x x x x x x

Type Periord Level Scope
Measurement
Nu
mb
er
Rat
io (
%)
Tre
nd
Cu
mul
ativ
e
Cor
rela
tion
Wee
k (
day
)
Sp
rin
t
Mon
th
Qu
arte
r
Yea
r
Tea
m
Val
ue
stre
am
Sit
e
Pro
du
ct
Rel
ease
Hou
rs (
day
s)
Sto
ry p
oin
ts
Use
r st
ory
Fea
ture
Fre
qu
ency
Fault closing time
Fault assignment time from new to investigating.
x x x x x x x
Fault closing time from New to First Correction Ready for Testing FCRT.
x x x x x x x
Fault closing time from New to First Correction Completed FCC.
x x x x x x x
Fault closing time from New to Closed.
x x x x x x x
Lifetime of a fault from New to FCRT, FCC, Closed – diagram.
x x x x x 2
Root cause analysis
Ratio of fault root cause analysis completed in a planned time
x x x x x x x
Fault root origin and type, to learn what types of defects are the most common
x x x x x x 2
Maintenance in team time usage
Amount of unexpected maintenance work.
x x x x x x x x x x
Ratio and amount of time used in customer and maintenance case.
x x x x x x x x x x x
Number and ratio of new feature and fault correction work, developing new features vs. fixing faults.
x x x x x x x x x 3
Customer care cases
Ratio of adaptation (DB) cases from all the cases.
x x x x x x x x
Customer case response x x x x x x x 2

Type Periord Level Scope
Measurement
Nu
mb
er
Rat
io (
%)
Tre
nd
Cu
mul
ativ
e
Cor
rela
tion
Wee
k (
day
)
Sp
rin
t
Mon
th
Qu
arte
r
Yea
r
Tea
m
Val
ue
stre
am
Sit
e
Pro
du
ct
Rel
ease
Hou
rs (
day
s)
Sto
ry p
oin
ts
Use
r st
ory
Fea
ture
Fre
qu
ency
times versus SLA times.
New customer cases (faults).
x x x x x x x x x 4
Open customer cases (faults).
x x x x x x x x x 4
Process measurements, planning reviews etc
Team member participation to sprint plannings.
x x x x 2
Team member participation to sprint reviews.
x x x x
Unsolved impediments from sprint to sprint, quality of agile project management.
x x x x x
Number of team demos kept in sprint review.
x x x x x x
The team morale barometer, team members giving a number 1-10, 10 representing happiness and 1 that the person would like to get off the project.
x x x x 2
Retro findings applied to practice (per time).
x x x x x
Definition of done check list compliance level.
x x x x x x 3
Multitasking in time usage
Sprint work flow diagram for user stories under the work, cumulative view to ”not started”, ”ongoing” and ”done” tasks in a sprint. Indicates if a team has silos and impediments.
x x x x 6
Sprint work flow diagram for features under the
x x x x 6

Type Periord Level Scope
Measurement
Nu
mb
er
Rat
io (
%)
Tre
nd
Cu
mul
ativ
e
Cor
rela
tion
Wee
k (
day
)
Sp
rin
t
Mon
th
Qu
arte
r
Yea
r
Tea
m
Val
ue
stre
am
Sit
e
Pro
du
ct
Rel
ease
Hou
rs (
day
s)
Sto
ry p
oin
ts
Use
r st
ory
Fea
ture
Fre
qu
ency
work, cumulative view to multitasking in the team. Number of items in process and if the team works together on the same tasks.
Ratio of mini water-fall, user stories coming late in the sprint to testers. Shows amount of waiting time, user stories are too large.
x x x x x 3
Sprint burn-down/-up
Sprint burn-down chart for tracking of team level work progress, work remaining.
x x x x x x 10
Advanced sprint burn-down, showing also the added work, giving information about planning accuracy and work added.
x x x x x x
User story effort estimation versus actual effort (estimation accuracy).
x x x x x 2
Release burn-down/-up
Release burn-down chart for tracking work progress in a release (story points - sprints), if the project or release is “on schedule”.
x x x x x x x 7
Enhanced release burn-down, whether a release burn-down shape is due to progress or scope creep.
x x x x x x x
Feature effort estimation accuracy, original versus team versus real work.
x x x x x x x x x 5

ATTACHMENT 2
BOOK REFERENCES FOR AGILE KEY PERFORMANCE INDICATORS
Andersson, D. J. 2010. Kanban, successful evolutionary change for your
technology business. 1st printing. Sequim, WA: Blue Hole Press.
Measurement ideas based on the book:
• Page 25: Project work flow diagram for tasks under the work at the moment,
identifies multitasking.
• Page 25: Sprint work flow diagram for tasks under the work at the moment,
identifies multitasking.
• Page 26: Average lead time from starting a feature until it is finished (from
started to completed, horizontal distance between the lines).
Proposed measurements in the book:
• Page 140: Work in process (WIP) diagram, shows the work in process.
• Page 140: Lead time – how predictably organisation delivers against the
promises.
• Page 142: Due date performance - item/feature delivered in time.
• Page 142: Throughput – number of items delivered in a given time period
(month). Should be reported as a trend over the time.
• Page 143: Issues and blocked work items – a cumulative flow diagram of
reported impediments overlaid with a graph of the number of work in progress
items that have become blocked. Identifies how well an organisation manages
blocking issues and their impact.
• Page 144: Flow efficiency – indicates the waste in the system, measures the lead
time against the touch/used time.
• Page 145: Initial quality – number of escaped defects as a percentage against the
total WIP and throughput (bugs/feature each day in a sprint).
Andersson, L. 2012. Maintenance in scrum. M. Sc. Thesis. University of Tampere:
School of Information Sciences.
Measurement ideas based on the M. Sc. Thesis:

• Page 16: Team work flow in a sprint to identify the work in progress (WIP).
Cumulative presentation for ”not started”, ”ongoing” and ”done” tasks planned
to be done in a sprint.
• Page 16: Team work flow in a sprint for different kind of tasks (manual testing,
test automation, implementation). Cumulative presentation.
• Page 33: Amount of unexpected maintenance work in a sprint per team/value
stream, trend.
Appelo J. 2010. Management 3.0, leading agile developers - developing agile
leaders. 1st printing. Boston MA: Addison-Wesley.
Proposed measurements in the book:
• Page 226: Functionality – story points completed in a sprint per team (velocity)
• Page 226: Quality – problems reported by testers in a sprint per team
• Page 226: Tools – costs per month
• Page 226: People – impediments reported by team members per sprint
• Page 226: Time – days remaining until live release
• Page 226: Process – checklists completed (definition of done for user
story/feature)
• Page 226: Value – increase in usage in users per minute
Cohn M. 2007. Agile estimating and planning. 5th printing. Upper Saddle River,
NJ: Prentice Hall PTR.
Measurement ideas based on the book:
• Page 15: Multitasking on team level, several feature components under the work
at the same time. Multitasking correlation to the sprint actual/planned hours
ratio (burn-down chart).
• Page 17: Commitment to the priority items - feature priority versus used hours
in a sprint.
• Page 24: Amount of potentially shippable content (in user stories) team delivers
per a sprint.
Page 164: User story size (in story points/hours) correlation to the original effort
estimation accuracy.
• Page 242: Nightly build and automated test case success rates.

Crispin, L. & Gregory, J. 2010. Agile testing. 6th printing. Boston, MA: Addison-
Wesley.
Measurement ideas based on the book:
• Page 47: Mini-waterfall level inside a team and sprint – any tools to measure it?
• Page 74: Feature component cycle time “from concept to cash” (days).
• Page 113: (A)TDD usage per sprint per team/value stream (hours).
• Page 157: User story check list (definition of done) compliance level/ratio (%)
per month.
• Page 244: Pair programming usage per sprint per team/value stream (hours).
• Page 258: Team test automation versus manual testing/total testing per sprint
(cases), trend.
• Page 300: Planned testing hours versus implementation hours ratio (or versus
total hours) identifying the whole-team-approach in testing activities.
Proposed measurements in the book:
• Page 358: Number of passing test cases (unit, functional, user story, GUI, load),
trend.
• Page 362: Number of implemented methods per a sprint, trend.
• Page 362: Test coverage on code/methods per a sprint, trend.
• Page 365: Number of defects reported by priority per week.
• Page 365: Defect in- and outflow (amount) per week/sprint/month, for a
team/value stream.
• Page 435: Team work progress during a sprint by using burn-down chart and
estimated versus actual time for tasks.
• Page 438: Reported defects over a time, per week/sprint/month.
• Page 439: Amount of sprint deliverable re-factored and coded to standards, use
static analysis tools to measure.
• Page 439: Amount of sprint deliverable unit tested, coverage results per each
sprint. An increase on the high level coverage packages is desirable.
• Page 439: Sprint deliverable have passing, automated, acceptance tests.
Coverage report showing the ratio of automated tests.

• Page 439: Sprint deliverable successful integration, check the continuous
integration build test results.
Gustafsson, J. 2011. Model of agile software measurement: A case study. Chalmers
University of Technology, University of Gothenburg. Department of Computer
Science and Engineering. Master of science thesis. Referred 19.1.2013.
http://publications.lib.chalmers.se/records/fulltext/143815.pdf
Proposed measurements in the M. Sc. Thesis:
• Page 8: Quality - defect count per iteration
• Page 8: Quality/technical Debt - the consequences of taking shortcuts in
development
• Page 8: Quality/faults-slip-through - measures the test process efficiency by
where the defect should have been found and where it actually was found.
• Page 8: Predictability/velocity - used to estimate the delivery capacity, but
velocity used to measure productivity can degrade the quality.
• Page 8: Predictability/running automated tests – counts test points defined as
each step in every running automated test, the belief is that number of tests
written is better in proportion to the requirement's size than lines-of-code metric.
• Page 8: Value/customer satisfaction survey
• Page 8: Value/business value delivered
• Page 8: Lean/lead time – from concept-to-cash and as short and stable as
possible.
• Page 8: Lean/work in progress – constraining the WIP in different phases would
prevent large queues. A low WIP indicates that the team works together on the
same tasks.
• Page 8: Lean/queues – the cost of delay of the items in the queues, indicates that
the future lead time will be long and preventive actions has to be taken.
• Page 8: Cost/average cost per function – used to estimate future operation
expenses.
• Page 13: Quality/bug trend – bug time trend per severity grade and product area.
• Page 13: Quality/number of incidents caused by release

• Page 13: Product delivery/lead time precision – ability to deliver what has been
committed in detail in a multi-sprint plan. Measured in average days of delay of
delivery of full scope as defined at the start of the first sprint.
• Page 13: Number of innovations/ideas in different phases - Idea, Prototype,
Pilot, Production
• Page 13: Cost/off-shoring savings (euros) – measured as delivery of business
case
• Page 13: Service level/incident resolution – as per service level agreements.
• Page 13: Planning/detailed planning horizon – time in future when less than
80% of people are covered by detailed committed plan.
• Page 13: Planning/backlog horizon (months) – sum of resource estimates for
backlog items divided monthly technology capacity.
Krebs J. 2009. Agile Portfolio Management. Redmond, Washington: Microsoft
Press. Referred 23.1.2013. http://skillport.books24x7.com/toc.aspx?bookid=27540
Proposed measurements in the e-book:
• Page x: Comparing the plan with the actual value for measuring the progress
• Page x: Amount of story points planned versus the amount burned down
• Page x: Number of open defects
• Page x: Total number of defects
• Page x: Ratio of total number of test cases to open defects (135 tests with 18
open defects)
• Page x: Unit-test code coverage
• Page x: Total number of unit tests, whether the team puts the same amount of
quality into the development of unit tests (quality) as in the progress of the
project (a healthy balance)
• Page x: Number of cyclomatic dependencies
• Page x: Average lines of code in each method
• Page x: Percentage of code covered with test cases
• Page x: Effort estimation accuracy
• Page x: Percentage of automated test cases versus manual test cases
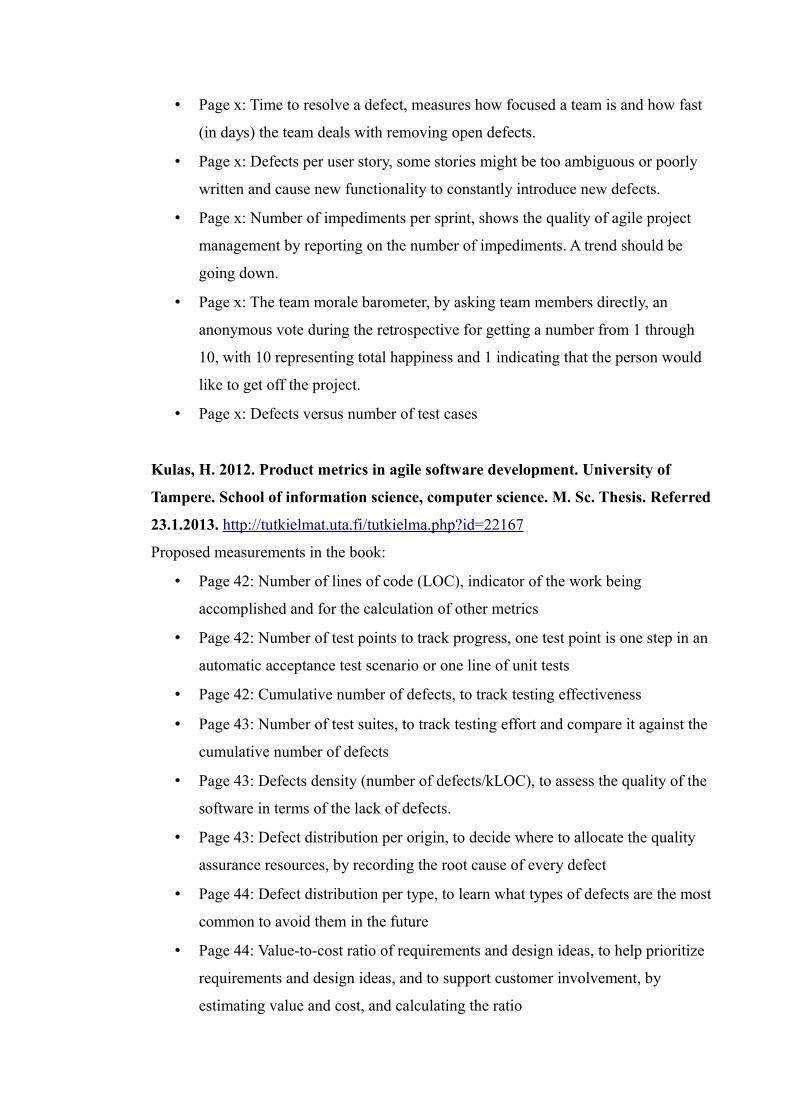
• Page x: Time to resolve a defect, measures how focused a team is and how fast
(in days) the team deals with removing open defects.
• Page x: Defects per user story, some stories might be too ambiguous or poorly
written and cause new functionality to constantly introduce new defects.
• Page x: Number of impediments per sprint, shows the quality of agile project
management by reporting on the number of impediments. A trend should be
going down.
• Page x: The team morale barometer, by asking team members directly, an
anonymous vote during the retrospective for getting a number from 1 through
10, with 10 representing total happiness and 1 indicating that the person would
like to get off the project.
• Page x: Defects versus number of test cases
Kulas, H. 2012. Product metrics in agile software development. University of
Tampere. School of information science, computer science. M. Sc. Thesis. Referred
23.1.2013. http://tutkielmat.uta.fi/tutkielma.php?id=22167
Proposed measurements in the book:
• Page 42: Number of lines of code (LOC), indicator of the work being
accomplished and for the calculation of other metrics
• Page 42: Number of test points to track progress, one test point is one step in an
automatic acceptance test scenario or one line of unit tests
• Page 42: Cumulative number of defects, to track testing effectiveness
• Page 43: Number of test suites, to track testing effort and compare it against the
cumulative number of defects
• Page 43: Defects density (number of defects/kLOC), to assess the quality of the
software in terms of the lack of defects.
• Page 43: Defect distribution per origin, to decide where to allocate the quality
assurance resources, by recording the root cause of every defect
• Page 44: Defect distribution per type, to learn what types of defects are the most
common to avoid them in the future
• Page 44: Value-to-cost ratio of requirements and design ideas, to help prioritize
requirements and design ideas, and to support customer involvement, by
estimating value and cost, and calculating the ratio
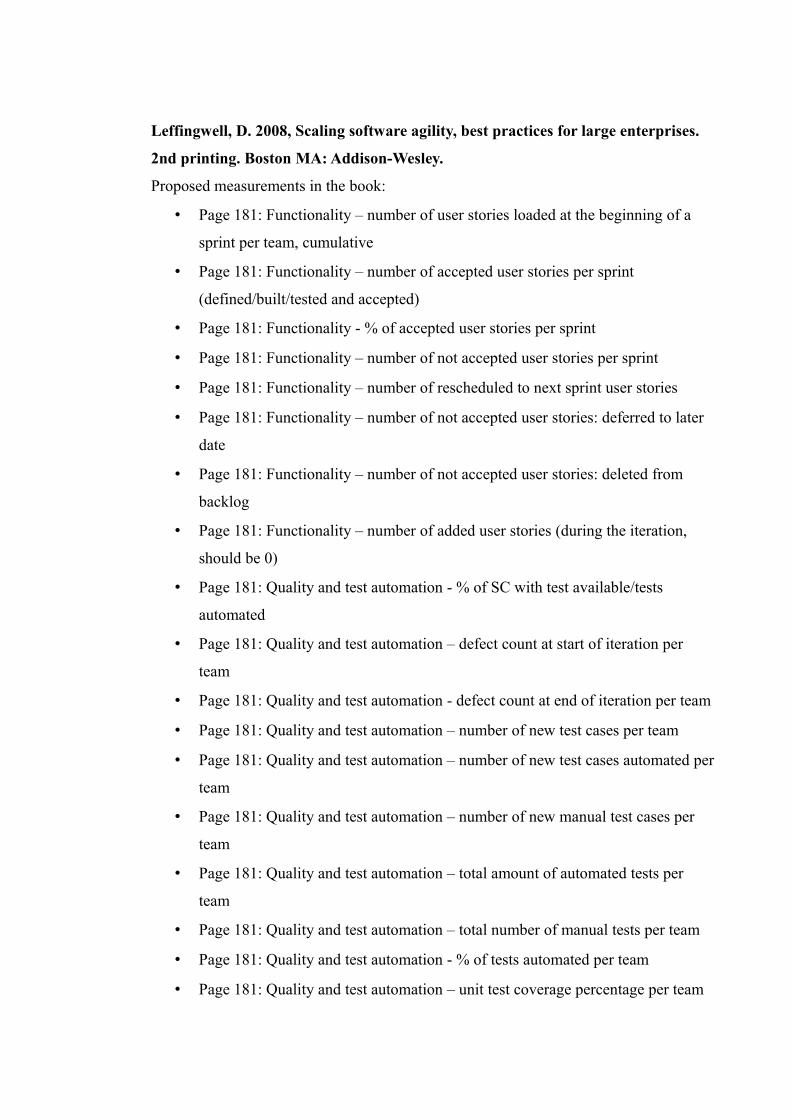
Leffingwell, D. 2008, Scaling software agility, best practices for large enterprises.
2nd printing. Boston MA: Addison-Wesley.
Proposed measurements in the book:
• Page 181: Functionality – number of user stories loaded at the beginning of a
sprint per team, cumulative
• Page 181: Functionality – number of accepted user stories per sprint
(defined/built/tested and accepted)
• Page 181: Functionality - % of accepted user stories per sprint
• Page 181: Functionality – number of not accepted user stories per sprint
• Page 181: Functionality – number of rescheduled to next sprint user stories
• Page 181: Functionality – number of not accepted user stories: deferred to later
date
• Page 181: Functionality – number of not accepted user stories: deleted from
backlog
• Page 181: Functionality – number of added user stories (during the iteration,
should be 0)
• Page 181: Quality and test automation - % of SC with test available/tests
automated
• Page 181: Quality and test automation – defect count at start of iteration per
team
• Page 181: Quality and test automation - defect count at end of iteration per team
• Page 181: Quality and test automation – number of new test cases per team
• Page 181: Quality and test automation – number of new test cases automated per
team
• Page 181: Quality and test automation – number of new manual test cases per
team
• Page 181: Quality and test automation – total amount of automated tests per
team
• Page 181: Quality and test automation – total number of manual tests per team
• Page 181: Quality and test automation - % of tests automated per team
• Page 181: Quality and test automation – unit test coverage percentage per team

• Page 185: Value delivery – number of features delivered in the release, all teams
together
• Page 185: Value delivery – number of feature value points delivered, all teams
• Page 185: Value delivery – planned release date versus actual release date
• Page 185: Architecture and feature debt – number of re-factorings completed
• Page 185: Architecture and feature debt – customer delivery debt (versus
promised features)
• Page 314: Product owner defined acceptance criteria per user story (%)
• Page 314: Product owner participation to iteration planning (rate)
• Page 314: Product owner participation to iteration review (rate)
• Page 314: Product backlog prioritization done per sprint (rate)
• Page 314: Product owner continuous collaboration with teams (rate)
• Page 314: Release planning meeting attendance level (rate) per sprint, trend
• Page 314: Release progress tracking by using feature acceptance as criteria
• Page 314: Team meets its commitment to release/sprint, ratio
• Page 314: Team velocity measurement per sprint
• Page 315: Sprint content ranking by priority, ranking ratio
• Page 315: Sprint work progress tracking, by burn-down chart and velocity
• Page 315: Sprint content stability (planned versus actual content) – work is not
added by product owner during a sprint
• Page 315: Team completing level for a sprint (versus planned content)
• Page 315: Team participation rate to sprint reviews
• Page 315: Team participation rate to sprint plannings
• Page 315: Team dedication rate to the sprint work (versus all available hours)
• Page 316: Team obstacle solving rate in a sprint
• Page 316: All planned user story testing done within a sprint and lag not behind,
ratio
• Page 316: Iteration defects are fixed within the iteration, number of over-
lappings
• Page 316: Unit tests written for the developed code, ratio
• Page 316: Acceptance tests written for the developed functionality, ratio
• Page 316: Automated unit test coverage in %

• Page 316: Automated acceptance test coverage in %
• Page 316: Continuous build success rate in %
• Page 316: Developers integrate code multiple times per day, average
deliveries/developers
• Page 316: Re-factoring work ratio in a sprint
• Page 316: Code review implementation ratio
• Page 316: Level of pair programming, hours used per sprint
• Page 320: Team velocity versus capacity in a sprint
• Page 320: Value feature points delivered per sprint
• Page 320: Release date percentage, promised/actual content
• Page 320: Number of defects and normalized defects in a sprint
• Page 320: Support calls and normalized support calls in a sprint
Poppendieck, M. & Poppendieck, T. 2007. Lean software development, an agile
toolkit. 11th printing. Upper Saddle River, NJ: Addison-Wesley.
Measurement ideas based on the book:
• Page XXVI: Time from the decision to the delivery capability per feature.
Correlation to the work amount.
• Page 5: Amount/Ratio of partially done development work in a sprint (user story
not done after a sprint). Until fully done you do not really know whether the
implemented outcome is working. Trend should be decreasing.
• Page 6: Amount of task switching per a sprint (hours), switching time is as
waste.
• Page 7: Amount of waiting time per sprint (hours).
Poppendieck, M. & Poppendieck, T. 2008. Implementing lean software
development, from concept to cash. 6th printing. Boston, MA: Addison-Wesley.
Measurement ideas based on the book:
• Page 244: Limit work to capacity: feature development time in sprints when
team velocity is known, number of features of different size (or user stories).
The ideal case is that a feature component can be done in one sprint by a team.
Proposed measurements in the book:

• Page 170: Cycle time of deployed features, number of features per time division
in weeks. Cumulative development.
• Page 170: Request age (age of active customer requests), number of requests per
time division in weeks. Cumulative development.
• Page 171: Customer request arrival rate per week. Request priority data
included.
• Page 238: Cycle time from concept to cash.
• Page 240: Financial return.
• Page 241: Customer satisfaction.

ATTACHMENT 3
INTERNET REFERENCES FOR AGILE KEY PERFORMANCE INDICATORS
Cerny K. Measuring High Performance Agile Teams. 18.3.2011. Referred
25.1.2013. http://kcerny.wordpress.com/2011/03/18/measuring-high-performance-agile-
teams/
Proposed measurements:
• Team velocity per sprint
• Acceleration per team
• Resource utilization or team utilization
• Backlog prioritization per product or per sprint
• Burndown charts per team per sprint
• Task hour burndown per team per sprint
• Story point burnup per team per sprint
• Estimates vs actuals accuracy level (%)
• Feature validation with customers/users
• Usability tests (i.e., time on task) per feature
• Defect breakout charts
• Independent security audit
• Adherence to doneness/acceptance criteria, ratio
• Adherence to checklists (checklist item burnup), ratio
• Adherence to standards, ratio
• Peer code reviews, ratio of reviewed code
• Test coverage per sprint, trend
• Running tested features per sprint/month
• Team member peer reviews per sprint
• Trust level within the team
• Capacity over time, per team/organisation
• Anonymous surveys

Derby E., Associates Inc. Metrics for Agile. 11.10.2011. Referred 25.1.2013.
http://www.estherderby.com/2011/10/metrics-for-agile.html
Proposed measurements:
• The ratio of fixing work to feature work - how much time are people spending
developing valuable new features vs. fixing stuff that wasn’t done right the first
time.
• Cycle time - how long does it take to go from an idea to a valuable product.
• Number of defects escaping to production - a category of fixing work that is a
direct indicator that the quality of the development process is improving.
Management Concepts & Book Summaries. Measuring Productivity – Second
Attempt. 15.1.2012. Referred 24.1.2013.
http://bigfatbooksinapage.com/2012/01/15/measuring-productivity-second-attempt/
Proposed measurements:
• Number of features per release/quarter
• Number of issues found by customers per month/release
• Percentage of product backlog reduced after release (backlog items), this figure
should stay steady or increase
• Percentage of test cases automated, total amount
• Percentage of user stories implemented using pair programming, should be a
decent number and increasing steadily initially,but stabilizing at a certain stage
• Value Points completed, count the number of features
• Number of automated test cases added per sprint
• Number of issues found by regression testing, more the number - more time is
wasted in rework, ideally no issues should be found
• Keeping up with the Release date, slippage in days
• Number of SIs that require code changes, reveals a gap in testing
Management Concepts & Book Summaries. Metrics for Agile – Part 2. 14.10.2012.
Referred 24.1.2013. http://bigfatbooksinapage.com/2012/10/14/metrics-for-agile-part-
2/
Proposed measurements:

• Average sizes of user stories - smaller user stories are better. Keeping track of
average size of user stories.
• Number of Person days working late/ weekends – should tend to zero. Agile is
all about development at a sustainable pace.
• Number of blocked days - number of days testers have no work to do since they
are waiting for user stories to be developed, the user stories are too large.
• Variance in time between builds - teams face the issue of user stories coming to
testers late in the sprint. Although a simple buildup/burnup chart can show the
problem, any improvement by the team is not easily measured. However, having
a variance in time between builds will show even small improvements by the
team.
• Total number of passing unit tests – pushes the team towards TDD and hence
create a cleaner design with less technical debt.
• Average time for a user story to move from defined to done - promotes the
creation of smaller user stories and to improve ability of the team to reduce the
time in progress.
Mazzanti G. Agile KPIs. 21.11.2010 Referred 26.1.2013.
http://www.slideshare.net/mgaewsj/agile-kpis-5853270
Proposed measurements:
• Total number of defects in a sprint/release
• Number of defects by category (i.e. critical, major, minor) in a sprint/release
• Number of non-functional defects (usability, performance) in a sprint/release
• Number of new defects / time (sprint)
• Number of defects fixed / time (sprint)
• Number of critical defects / time (sprint)
• Number of re-opened defects (regression) (sprint)
• Number of tests / defect
• Time required to fix a defect
• Number of defects found in-house / total number of defects (DRE)
• Number of defects found / number of test hours spent
• Number of story points per sprint (team specific metric)

• Release burn-down chart (story points - sprints)
• Sprint burn-down chart (story points – days)
• Number of running tested features (automated test passed = done)
• Early value delivery, value for customer/story points*100 (biggest value 1st
under work)
• Stories and story points completed in a sprint (%), per team
• Stories added/removed in a sprint/release (%), per team
• Stories unfinished/moved to next sprint, per team
• Sprints moved to next release
• Lead and cycle time (stories and defects)
• Average age of stories and defects
• Failed builds (%)
• Failed tests (%)
• Defects added and fixed (absolute and trend)
• Cycle Time, number of things in process/average completion rate
• Flow = speed * density, density up and speed down => traffic jam
McHugh K. M., IBM. Velocity: what flavor would you like? -- part 2 in a series.
8.4.2012. Referred 23.1.2013.
https://www.ibm.com/developerworks/mydeveloperworks/blogs/c914709e-8097-4537-
92ef-8982fc416138/entry/velocity_what_flavor_would_you_like_part_2_in_a_series5?
lang=en
Proposed measurements:
• Standard [complexity] velocity, story points / sprint
• Value velocity, business value / sprint
• Risk velocity, risk contribution / sprint
• Return on investment (ROI) velocity, return on investment / sprint
• Average velocity, the average velocity of a ”type” (above) / sprint
McHugh K. M., IBM. Velocity: Measuring Agile Velocity and Predicting with Agile
Velocity – part 3 in a series. 19.8.2012. Referred 23.1.2013.
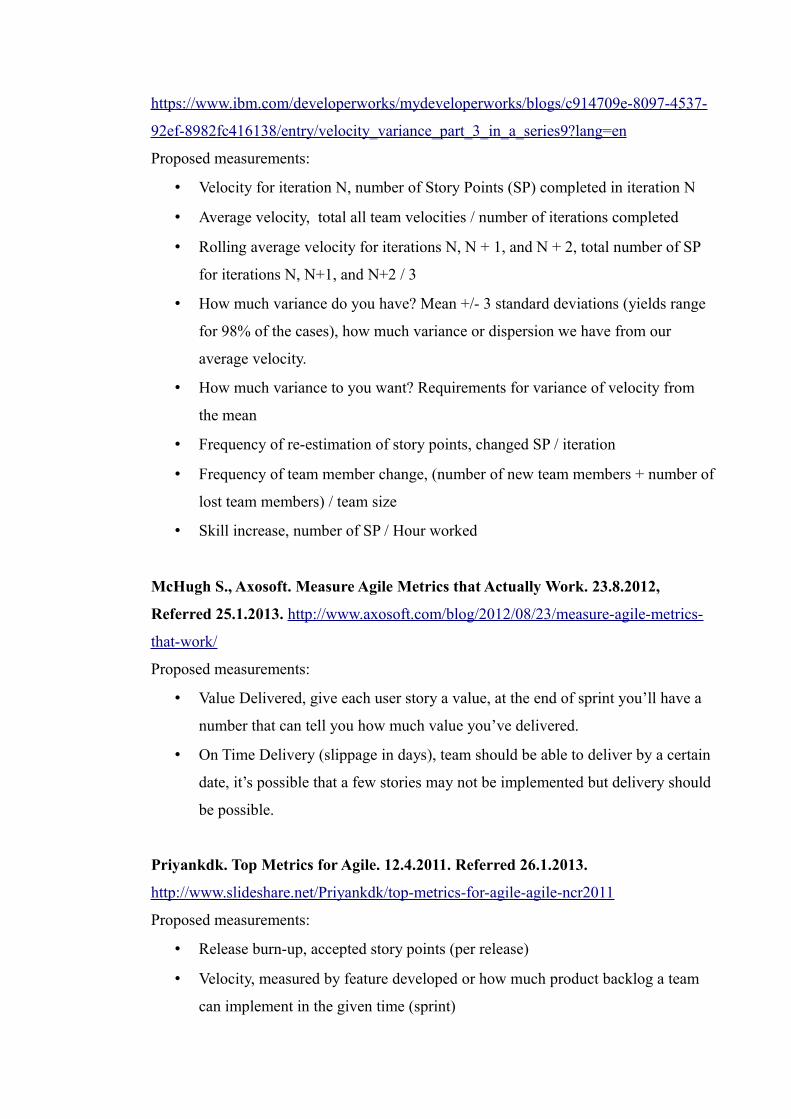
https://www.ibm.com/developerworks/mydeveloperworks/blogs/c914709e-8097-4537-
92ef-8982fc416138/entry/velocity_variance_part_3_in_a_series9?lang=en
Proposed measurements:
• Velocity for iteration N, number of Story Points (SP) completed in iteration N
• Average velocity, total all team velocities / number of iterations completed
• Rolling average velocity for iterations N, N + 1, and N + 2, total number of SP
for iterations N, N+1, and N+2 / 3
• How much variance do you have? Mean +/- 3 standard deviations (yields range
for 98% of the cases), how much variance or dispersion we have from our
average velocity.
• How much variance to you want? Requirements for variance of velocity from
the mean
• Frequency of re-estimation of story points, changed SP / iteration
• Frequency of team member change, (number of new team members + number of
lost team members) / team size
• Skill increase, number of SP / Hour worked
McHugh S., Axosoft. Measure Agile Metrics that Actually Work. 23.8.2012,
Referred 25.1.2013. http://www.axosoft.com/blog/2012/08/23/measure-agile-metrics-
that-work/
Proposed measurements:
• Value Delivered, give each user story a value, at the end of sprint you’ll have a
number that can tell you how much value you’ve delivered.
• On Time Delivery (slippage in days), team should be able to deliver by a certain
date, it’s possible that a few stories may not be implemented but delivery should
be possible.
Priyankdk. Top Metrics for Agile. 12.4.2011. Referred 26.1.2013.
http://www.slideshare.net/Priyankdk/top-metrics-for-agile-agile-ncr2011
Proposed measurements:
• Release burn-up, accepted story points (per release)
• Velocity, measured by feature developed or how much product backlog a team
can implement in the given time (sprint)

• Team sprint burn-down, shows both the status and rate of progress
• Actual percent complete (APC) – completed/total story points
• Expected percent complete (EPC) – number of completed iterations/number of
planned iterations
• Planned value (PV) – EPC * budget
• AC – actual cost in euros or in hours spent
• Earned value (EV) – APC*budget
• Schedule performance index (SPI) – EV/PV, should be >=1 (ahead of schedule)
• Cost performance index (CPI) – EV/AC, should be >=1 (under budget)
• Cost variance (CV) – EV-AC, should be > 0
• Schedule variance (SV) – EV-PV, should be > 0
• Defect removal efficiency – found before delivery/(found before + after
delivery)
• Iteration defect removal efficiency – found before iteration delivery/(found
before + after iteration delivery)
• Technical Debt
Rawsthorne D. 2009. Agile metrics. 26.9.2009. Referred 25.1.2013.
http://agile2009.agilealliance.org/files/session_pdfs/Rawsthorne_AgileMetrics_v6d.pdf
Proposed measurements:
• Sprint task hour burndown, for measuring work remaining (team level)
• Checklist item burnup, for measuring progress remaining (team)
• Story point burnup, to count or observe stories that are completed (team)
• Graduated story point burnup
• Velocity, to understand how fast the team does work, to estimate team capacity
• Product burndown, the amount of known work remaining at the end of each
sprint
• Release burndown, for product owner and stakeholders to determine if the
project or release is “on schedule”
• Enhanced burndown, to determine whether a project/release burndown’s shape
is due to progress or scope creep
• Running tested features (RTF), to “pass” if all of its acceptance tests pass

• Acceptance test metrics, how many tests you have defined fro your system, how
many are running in the regression test suite, how many are passing each sprint
• Earned value metrics
• Earned business value
Software Engineering Services Blog, Ness software engineering services. The Two
Agile Programming Metrics that Matter. 15.12.2011. Referred 25.1.2013.
http://blog.ness.com/spl/bid/72570/The-Two-Agile-Programming-Metrics-that-Matter
Proposed measurements:
• Scope variance: the number of story points delivered / story points committed, a
measure of development capacity and delivery trends.
• Release velocity variance: the current velocity / average velocity, indicator gives
a sense as to the overall pace of the team.
• Escaped defects / story point: also called defect density, this indicator will show
whether the team is sacrificing quality for speed or quantity of output.
• Business value variance: indicates story selection tradeoffs and more low value
stories implemented than expected due to technical or other valid reasons.
Srivastava R. Agile Metrics V6. 10.2.2010. Referred 26.1.2013.
http://www.slideshare.net/rsrivastava91/agile-metrics-v6
Proposed measurements:
• Running tested features (features – time), per all teams
• Velocity – commitment to user stories, per team
• Velocity – relative sizing (story points)
• Velocity – estimation (ideal hours)
• Burn down chart including added work (as negative work) for a sprint/release
• User story cycle time (iterative), number of iterations it takes to complete a user
story
• Cycle time (lean), average time between delivery of completed work items
Techtarget, Search Software Quality. 2012. Beyond burndowns: Metrics for
enterprise Agile. Referred 25.1.2013

http://searchsoftwarequality.techtarget.com/tip/Beyond-burndowns-Metrics-for-
enterprise-Agile
Proposed measurements:
• KLOC (thousands of lines of code) and KLOC/developer.
• Tasks completed per sprint per team.
• Time worked on task per sprint per team.
• Running tested features (RTF) - The RTF metric shows, at every moment in the
project, how many features are passing all their acceptance tests.
• Business value burn-up - tracked just like story point burn-up, but based on
product owner assigned business value as delivered.
• Automated unit and acceptance test results - a quality measurement.
• Defect count - a quality measurement.
• Technical debt - a quality measurement. This is “undone” work.
• Work in process - a lean productivity metric. Tracks number of items the team
has in process at all times. Want this to trend to 1.
• Story cycle time - tracks how long a story goes from in work to done.
• Cyclomatic complexity
• Coding standards violations
• Code duplication
• Code coverage
• Dead code
• Code dependencies incoming/outgoing (coupling)
• Abstractness (abstract and interface class versus concrete classes)
• WTFs/minute
Yeret Y. Getting to simple lean/agile KPIs. 24.9.2010. Referred 26.1.2013.
http://www.slideshare.net/yyeret/simple-lean-agile-kpis
Proposed measurements:
• Productivity, throughput – ability to deliver as much as possible per unit of time,
measure amount ”done” per time periord
• Productivity, effectiveness – resources used to deliver, minimal waste

• Predictability/Reliability – deliver on commitments, plan versus actual, track
whether we are meeting the commitments we make to
• Business Agility, response time/latency/time to market – ability to quick
delivery, cycle time
• Quality – minimum deviations from expected quality once delivered

ATTACHMENT 4
INTERNAL WORKSHOP REFERENCES FOR AGILE KEY PERFORMANCE INDICATORS
1. Management workshop (Management KPI workshop 11.12.2012)
Feature content targets set by a product owner:
• Number of features completed versus planned during a quarter/release
• Number of user stories completed versus planned during a sprint/month/release
• Feature effort estimation versus actual effort, estimation accuracy
• User story effort estimation versus actual effort, estimation accuracy
• Feature effort estimation accuracy, original estimate versus team estimate versus
real work
• FS2 versus FS4 decision done per a release, feature amount accuracy
• Feature development time from decision to delivery
• FS4 decisions done per month/quarter/half year
• Investment in euros per sprint/feature
• Number of team demos kept in value stream/general sprint review, trend
• Release burn-down chart for tracking of work progress in a release
• Sprint burn-down chart for tracking of team level work progress in a sprint
• Advanced sprint burn-down, showing also the added work during a sprint in a
graph, giving information about planning accuracy and work added
Fault correction related measurements:
• Fault in-take/out-take (new/closed) ratio per team/value stream during the
previous week/sprint/moth
• Number of fault corrections per team per sprint/month/week
• Number of open faults at the reporting time per team/value stream in the end of
week/sprint/month. Trend and cumulative development.
• Fault closing time from New to First Correction Ready for Testing (FCRT),
measured generally and on the team level (days)

• Fault closing time from New to First Correction Completed (FCC), measured
generally and on the team level (days)
• Fault closing time from New to Closed, measured generally and on the team
level (days)
• Fault closing diagram presenting FCRT, FCC, Closed – days in average for a
sprint
• New/closed/open A, B, C level faults per release (all value streams)
• Ratio of root cause analysis completed in a planned time
Code row amount measurements:
• Generated and implemented code rows per sprint/month
• Removed code rows, commented code rows per sprint/month
Technical debt:
• Technical debt ratio development per sprint on a product level, trend
Code reviews:
• Ratio of reviewed code on the product level, trend
Team time usage:
• Team time usage analysis in a sprint: new development, test automation, manual
testing, fault corrections, planning and specification, meetings, root cause
analysis, reviews, customer docs etc. - graph
• Number and ratio of user story and fault corrections work in hours in a sprint
per team/value stream. Trend and cumulative development.
• Correlation between team/value stream level “done” user stories/story points
and fault corrections in a sprint. Trend and cumulative development.
• Amount and ratio of manual and automated testing in a sprint per team/value
stream. Trend and cumulative development.
• Ratio and/or amount of time used in customer care and maintenance cases per
team in a sprint.
• Planned hours versus real hours, in which area (implementation, testing, etc.) is
the most difference between planned and real hours

NE system program System Verification fault amounts:
• Amount of faults raised from NE system program System verification per
release.
Customer care resolve cases:
• Customer care case amount per team/value stream per month/sprint
• Customer care case response time per team/Value Stream per month/sprint
2. Team workshop (Team KPI workshop 17.12.2012)
Faults related measurements:
• Lifetime of a fault from New to First Correction Ready for Testing (FCRT)/First
Correction Complete (FCC)/Closed, measured generally and on the team level
• Fault assignment time (from new to investigating), days.
• Number of re-opened faults versus all the faults in a release
• number of open faults at the reporting time per team/value stream in the end of
week/sprint/month
• Ratio of automated testing for fault corrections
• Ratio of faults coming from the implementation which is not done by a team i.e.
faults coming outside the team versus faults raised from own team
• Fault in-take/out-take (new/closed) ratio per team/value stream during the
previous week/sprint/moth
• Fault amount after the delivery per feature/release
• Fault correction time versus the size of change/correction
• Number of reported faults leading to new feature development versus all the
faults in a release
Customer care resolve cases:
• Resolve case amount per team/value stream in a sprint/month/quarter
• Total resolve case amount in a sprint/month/quarter
• Ratio of DB cases from all the cases, trend and cumulative data
• Resolve case response time per team/value stream versus SLA times

User story and test case amounts:
• Correlation of the number of user stories and manually run test case per team
per sprint
• Number of the canceled user stories in a sprint/release per team/value
stream/release (some work may have been done already)
• Number of canceled user stories versus implemented user stories
• The quality of user stories: team level work amount required before starting
implementation per user story/feature
• Number of “done” story points or user stories by a team in a sprint versus
specifier who defined the user stories (quality of user stories)
• Features “done” in 6/12 months
• User stories done by a team in sprint/month/quarter/release
• Story points done by a team/Value Stream in sprint/month/quarter/release –
more accurate than user story level
• Sprint content changes in story points during a sprint, planning quality
• Commitment versus actual work in a sprint, trend
Test automation:
• Number of faults found by using test automation in a sprint/quarter/release, for
measuring the quality and efficiency of test automation
• Number of cases in which test automation prevented builds and labs to go
broken, quality and efficiency of test automation
• Team level test automation ratio, trend
• Fault correction test automation ratio per team/value stream
• Ratio of test automation case re-usage, number of cases reused versus all
• Regression testing success ratio, trend
• Regression testing case amount development, cumulative measurement
• Regression testing case amount versus success rate, correlation
Team time usage:

• Team time usage in a sprint: user stories, canceled US, internal faults, external
faults, testing, implementation, etc.
• Average time used per user story, trend
• Team test automation ratio versus time used for test automation, efficiency of
test automation on team level.
• Number of backlog items planned versus used hours per team per sprint –
accuracy and quality of the team planning
• Ratio of correct case name and tags for automated test cases in SVN check-in -
case quality versus set criteria
• Ratio of planned testing versus real testing in hours in a sprint
• Used testing hours correlation to the found faults during and after testing
Production pipe:
• Green build ratio before system component verification laboratory installation
• Green build ratio after upgrade, smoke, regression steps
• Product level green build ratio
• Green build ratio for adaptation builds
• Number of laboratory environment updates versus number of commits
• Number of commits during a sprint per team/Value stream per sprint/month
Process automation:
• Testing environment creation time
• Testing environment scratch installation time
• Development environment creation time
• Test execution time, test case amount versus used time
• Definition of done fulfillment rate per user story/feature
Other proposals:
• Retro findings implemented into use per time
• Code re-factoring level in a sprint

REFERENCES
Management KPI workshop. Meeting minutes. 11.12.2012
Team KPI workshop. Meeting minutes. 17.12.2012