JSW Energy presentation Energy... · 5 1) Long term FSA with BLMCL for supply of lignite from its...
31
JSW Energy Limited Investor Presentation February 2018
Transcript of JSW Energy presentation Energy... · 5 1) Long term FSA with BLMCL for supply of lignite from its...

JSW Energy LimitedInvestor PresentationFebruary 2018
2
Agenda
Overview Value Proposition Operational Highlights
Appendix

3*Listed company. ** USD/ ` = 64.2723 (RBI reference rate as on February 6, 2018)
JSW Group – Overview
USD 11 billion group with presence across the core sectors
JSW Steel*: India’s leading integrated steelproducer (Steel making capacity: 18MTPA)
JSW Energy*: Engaged across the value chainof power business (Operational plants’capacity: 4,531MW)
JSW Infrastructure: Engaged in development and operations of ports (Operational capacity: 70MTPA)
JSW Cement: Manufacturer of PSC, OPCand GGBS cement (Operational plants’capacity: 11.6MTPA)
JSW Steel10,658
JSW Energy2,113
Group market cap (USD 12,771 mn **)
As on February 6, 2018

4
JSW Energy – Presence across the value chain
Power generation
Power transmission
Power trading
Equipment
manufacturingMining
Engaged in power trading since June 2006
Handled trading volume of ~4bn units in FY17
Operational transmission line – JV withMSETCL: two 400KV transmission lines
Currently operationalcapacity: 4,531MW
JV with Toshiba, Japan formanufacturing of super-criticalsteam turbines and generators
Rajasthan (lignite): Kapurdi(operational with capacity of7MTPA) and Jalipa (commencedoperations in Q3FY18) mines;mineable reserves of 441mn tonnes

5
1) Long term FSA with BLMCL for supply of lignite from its captive mines; BLMCL is a 49:51 JV between Raj WestPower Ltd (subsidiary of JSW Energy) and Rajasthan government undertaking, 2) USD/ INR = 60, 3) denotes start of first unit in respective fiscal year; TPP – Thermal Power Plant
Established energy company with 4,531 MW operational capacity
Proximity to load centre/fuel source/infrastructural facilities
Vijayanagar: 860MW
Configuration: 2 X 130MW and 2 X 300MW Units operating: since 20003
Technology: Sub-critical TPP Fuel Source: Gas & imported thermal coal Power Offtake: Long Term PPA & Merchant Project Cost: INR 30,957mn/ $516mn2
Ratnagiri: 1,200MW
Configuration: 4 X 300MW Units operating: since 20113
Technology: Sub-critical TPP Fuel Source: Imported thermal coal Power Offtake: Long Term PPA & Merchant Project Cost: INR 55,161mn/ $919mn2
Barmer: 1,080MW
Configuration: 8 X 135MW Units operating: since 20103
Technology: Sub-critical pithead lignite based TPP Fuel Source: Captive lignite mines of BLMCL1
Power Offtake: Long Term PPA Project Cost: INR 71,650mn/ $1,194mn2
Baspa II (300MW) & Karcham Wangtoo (1,091MW)
Units operating: Baspa II since 2003 and Karcham Wangtoo since2012
Technology & Fuel Source: Hydro Power Offtake: Long Term PPA and Merchant Asset Value to JSW Energy: INR 92,750mn/ $1,546mn2

6USD/ INR = 60
Proven track record
Despite turbulent sector dynamics, delivering sustainable growth driven by focused execution and balanced strategy
FY12 FY17
CAGR FY12–17: 6%Total Revenue INR 62,654mn / $1,044mn INR 84,804mn / $1,413mn
CAGR FY12–17: 17%EBITDA INR 15,944mn/ $266mn INR 35,414mn/ $590mn
CAGR FY12–17: 12%Capacity (MW) 2,600 4,531
Diversifying fuel sourcesFuel Type Thermal Coal Thermal Coal, Lignite, Hydro
CAGR FY12–17: 10%Net Generation (MUs) 13,594 21,631
Presence across the value chainBusiness SegmentPower generation, O&M,
transmission, trading, coal mining and equipment manufacturing
Power generation, O&M, transmission, trading, coal mining
and equipment manufacturing
CAGR FY12–17: 30%
Profitable and dividend paying since listingPAT INR 1,701mn/ $28mn INR 6,290mn/ $105mn

7
Audit Committee
Ensures regular review of audit plans, significant audit findings, adequacy of internal audit system, compliance withregulations by the Company and its subsidiaries
Comprises of six Non-Executive Directors
Compensation and Nomination & Remuneration Committee
Identifies qualified persons and recommends to the Board the appointment, removal and evaluation of Directors
Responsible for drafting policy on specific remuneration packages for Executive Directors and approving the paymentof remuneration to managerial personnel
Formulate criteria for independence of Director, evaluation of Independent Directors, policy on Board diversity
Comprises of four Non-Executive Directors
Stakeholders Relationship Committee
Responsible for the functioning of the investor grievances redressal system
Comprises of three Non-Executive Directors
Risk Management Committee
Periodically reviews risk assessment and minimisation procedures
Comprises of four Non-Executive Directors
Corporate Social Responsibility (CSR) Committee
Formulates and recommends to the Board a CSR Policy including list of projects and programs
Strong commitment towards CSR
Comprises of four Non-Executive Directors
Sound Corporate Governance
All key committees in place, having adequate independent director representation

8
Agenda
Overview Value Proposition Operational Highlights
Appendix

9
Value proposition
Efficient Capital Allocation and Execution Capabilities
Portfolio of Efficient Operating Assets
Diversified Fuel Tie-up
Balanced Mix of Off-take Arrangements
Robust Financial Profile
1
2
3
4
5

101) High capital cost due to CFBC boilers for lignite based power plant
USD/ INR = 60
Efficient Capital Allocation and Execution Capabilities
Vijayanagar (2000-2001):260 MW @ INR 43.42mn/MW (~$0.72mn/MW)
Vijayanagar (2010):600 MW @ INR 32.78mn/MW(~$0.55mn/MW)
Ratnagiri (2011-2012):1,200 MW @ INR 45.97mn/MW(~$0.77mn/MW)
Barmer (2010-2013):1,080 MW @ INR 66.34mn1 /MW(~$1.11mn/MW)
Leveraging upon strong project execution and project management expertise, and infrastructure
1
Power project Capacity Project cost 1st COD
MW ` crore/MW $mn/MW Year
Lanco (Amarkantak) 600 5.23 0.87 2009
Lanco (Udupi) 1,200 4.67 0.78 2010
Aryan Coal (Kasaipalli) 270 5.00 0.83 2011
Tata Power/DVC (Maithon) 1,050 5.24 0.87 2011
Adhunik (Padampur) 540 6.18 1.03 2013
GMR EMCO (Warora) 600 6.25 1.04 2013
GMR (Kamalanga ) 1,050 6.21 1.04 2013
Dhariwal (Chandrapur) 600 6.22 1.04 2014
DB Power (Janjgir-Champa) 1,200 7.02 1.17 2014
JPVL (Nigrie) 1,320 7.92 1.32 2014
Neyveli (Barsingsar) 1
250 7.00 1.17 2010
Giral (Rajasthan)1
250 7.69 1.28 2011
Project cost of select power plants set up by other players in the industry

11
JSW
En
ergy
Sta
nd
alo
ne
1
93%
81% 83% 84%
61% 61%64% 62% 61% 61% 56% 56%
FY13 FY14 FY15 FY16 FY17 9M FY18
JSW Energy Standalone PLF
All India private sector thermal power plants' PLF*
*Source-CEA
1) Includes Vijaynagar (860MW) and Ratnagiri (1,200MW) plants, 2) Vijaynagar’s SBU I (260MW) or SBU II (600MW) received either the Bronze Shield or the Silver Shield in the category of ‘Performance of Thermal Power Stations’ for FY07/FY08/ FY09/ FY10/ FY11/FY14 and the Gold Shield for FY12 and FY13, 3) Deemed PLF
Portfolio of Efficient Operating Assets
Among the best run thermal power plants in India on aconsistent basis
Vijayanagar plant has been consistently recognised as atop performing operating power plant by the Ministry ofPower for 8 consecutive years2
PLF in the recent past has been low due to lack ofschedule
2
Industry leading PLFs driven by O&M and execution expertise
Raj
We
st3
and
Hyd
ro
85% 86% 85% 82%86% 85% 82%
69%
94%
24% 14%
78%84%
24%
Q1
FY
17
Q2
FY
17
Q3
FY
17
Q4
FY
17
Q1
FY
18
Q2
FY
18
Q3
FY1
8
RajWest
Hydro

12
Diversified Fuel Tie-up and Balanced Mix of Off-take Arrangements
Lower fuel risk, resilience to sector dynamics. Approvals secured for using domestic coal.
Fuel sources –
o Imported coal
o Lignite
o Hydro
4
46.4%
24.3%
29.3%
Imported coal Lignite Hydro
Power off-take arrangements – optimal mix of long term contracts & merchant power sales (return optimisation) ….
Long term:
Stable cashflows, pre-defined returns
Insulated from inflation and fuel price movement, declining tariff
Short term:
Ability to capitalise on better realisations
Ability to respond to demand fluctuations and shortages
…. with aim to tie-up over 85% of capacity under long term PPAs
69.3%
30.7%
Long Term Short Term
3

13
FY17 Return on Capital Employed (%2)FY17 EBITDA Margin (%1)
FY17 Return on Net Worth (%)
Source: Annual Reports for FY 2017
(1) Calculated as EBITDA/ Revenue, where EBITDA includes Other Income, (2) Calculated as EBIT/ Average Capital Employed (Net Worth + Minority Interest + Gross Borrowings + Net Deferred Tax Liabilities)
Robust Financial Profile
Sector leading margins and return ratios
Dividend paying track-record since listingin 2010
5
41.8%45.9%
37.4%
28.2% 27.5% 26.6%
19.4%
JSW Energy R Power JPVL NTPC Adani Power CESC(Standalone)
Tata Power
10.2%
8.6%7.6%
6.9%6.4%
5.7%
3.0%
JSW Energy NTPC R Power CESC(Standalone)
Adani Power Tata Power JPVL
6.3%11.3%
6.6% 6.4% 5.3%
-14.5%
JSW Energy NTPC CESC(Standalone)
Tata Power R Power JPVL Adani Power
-118%

14
FY17 Net Debt/Equity (x)
Source: Annual Reports for FY 2017
Robust Financial Profile
FY17 Net Debt/EBITDA (x)
Well capitalised balance sheet, best positioned to tap growth opportunities
5
1.3
0.4
1.11.5
2.6
4.1
JSW Energy CESC(Standalone)
NTPC R Power JPVL Tata Power Adani Power
17.2
3.82.6
4.7
6.2
8.18.9
14.0
JSW Energy CESC(Standalone)
NTPC R Power Adani Power Tata Power JPVL

15
Agenda
Overview Value Proposition Operational Highlights
Appendix

16
Key highlights for Q3FY18
Long term PPA (LTPPA) tie-up proportion at 69.3% in Q3FY18, up from 64.6% in Q2FY18 - driven mainly
by signing of 176MW LTPPA with Haryana discom
Net debt reduced by ~ ` 2,490 crore in 9MFY18 after adjusting for JPVL liability; cost of debt dips by
113bps from Q4FY17 level
Long term credit rating upgrade of HBPCL from A+ to AA- and RWPL from A to A+ reflecting improved
business fundamentals
Secured approvals to blend domestic coal at Ratnagiri plant
Formation of Solar SPV; added ~10MW of solar projects thereby enhancing presence in RE segment
Proactive working capital management: Consolidated debtors and debtor days reduce by ~ ` 780 crore
and 26 days respectively over Q4FY17 levels
Efficiency measures drove O&M cost savings in 9MFY18 – working to sustain these levels
Termination of Bina transaction
17
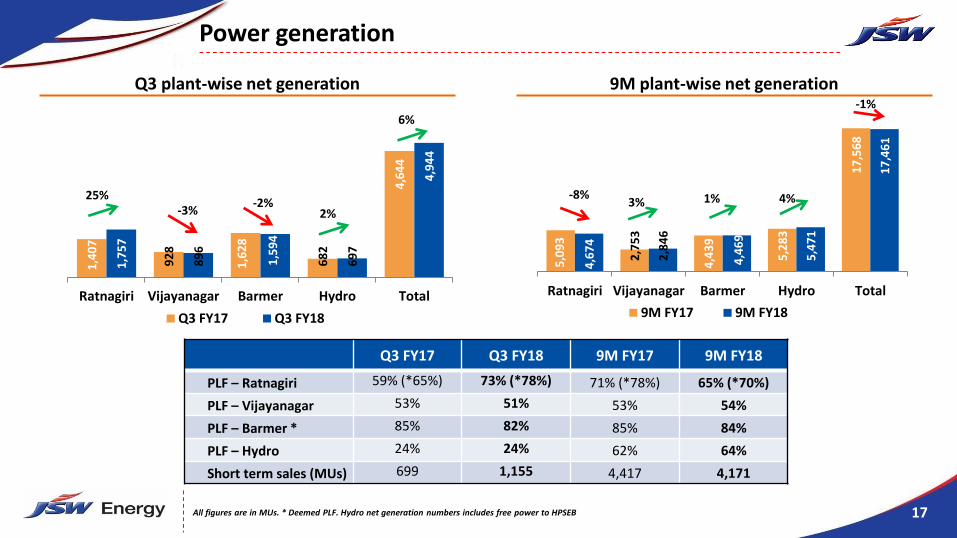
Power generation
Q3 plant-wise net generation 9M plant-wise net generation 1
,40
7
92
8
1,6
28
68
2
4,6
44
1,7
57
89
6
1,5
94
69
7
4,9
44
Ratnagiri Vijayanagar Barmer Hydro Total
Q3 FY17 Q3 FY18
25%-3%
-2%2%
6%
5,0
93
2,7
53
4,4
39
5,2
83
17
,56
8
4,6
74
2,8
46
4,4
69
5,4
71
17
,46
1
Ratnagiri Vijayanagar Barmer Hydro Total
9M FY17 9M FY18
3%-8% 1%
-1%
4%
Q3 FY17 Q3 FY18 9M FY17 9M FY18
PLF – Ratnagiri 59% (*65%) 73% (*78%) 71% (*78%) 65% (*70%)
PLF – Vijayanagar 53% 51% 53% 54%
PLF – Barmer * 85% 82% 85% 84%
PLF – Hydro 24% 24% 62% 64%
Short term sales (MUs) 699 1,155 4,417 4,171
All figures are in MUs. * Deemed PLF. Hydro net generation numbers includes free power to HPSEB

18
Long term PPAs
2700
2800
2900
3000
3100
Q1FY18 Q2FY18 Addition in Q3FY18 Q3FY18
32MW tied under “Group Captive” scheme at Ratnagiri plant in Q3FY18.
In HBPCL: Long term PPA for 176 MW with Haryana discom secured in Q3FY18. Regulatory approval for Punjab(200MW) is under process with the state regulator.
* Proportion of long term PPA to total capacity. Karcham Wangtoo capacity @ 1,000MW as currently approved
2,866MW64.5% *
208MW
Availability under long term PPA remained above normative in Q3FY18
in MW3,078MW69.3% *
2,870MW64.6% *

19
Consolidated financial results
*Not Annualized
` Crore
Q3 FY17 Q3 FY18 Particulars 9M FY17 9M FY18
1,955 2,081 Turnover 6,545 6,635
708 673 EBITDA 2,881 2,702
36% 32% EBITDA Margin(%) 44% 41%
423 341 Interest 1,288 1,132
244 241 Depreciation 731 728
41 92 Profit Before Tax 862 841
21 47 Profit after Tax 605 561
0.13 0.29 Diluted EPS (`) * 3.72 3.42
Significant debt reduction and lower cost of debt boost PBT

20
Consolidated financial highlights
Particulars Mar 31, 2017 Jun 30, 2017 Sep 30, 2017 Dec 31, 2017
Net Worth (` Crore) 10,368 10,696 11,259 11,469
Net Debt (` Crore) 13,384 13,686 12,679 11,896
Net Debt to Equity Ratio (x) 1.29 1.28 1.13 1.04
Weighted average cost of debt 10.17% 10.05% 9.33% 9.04%
Debt gearing continues to show declining trend
Reduction in cost of debt to 9.04% by end of Q3FY18

21
Sustained reduction in net debt
10000
10500
11000
11500
12000
12500
13000
13500
14000
14500
Q4FY17 Q1FY18 Q2FY18 Q3FY18
Net debt` 13,384 cr
JPVL related liability ` 1,000 cr (non-funded)
Net debt` 12,679 cr
Net debt` 13,686 cr
Total recovery of ~ ` 240 crore by end of Q3FY18 wrt JPVL advance of ` 1,000 crore
in ` crore
Net debt` 11,896 cr
` 14,384 cr
Reduction of ~ ` 2490 cr

22
Key updates during Q3FY18
Electric Vehicle: Making steady progess wrt product & technology strategies; business partnershipsand organisation structure
Major equipment ordered for the greenfield thermal power plants of 36MW announced in Q2FY18
Completion timeline: end of Sep 2019
Added ~10MW of solar projects in Q3FY18 - total solar projects of ~17MW under implementation
Formation of JSW Solar Limited, a wholly owned subsidiary to pursue RE opportunities
17MW break-up: 4MW - floating type, 3MW - rooftop type and 10MW – ground mounted type
Entire capacity secured by LTPAA; major equipment ordered
Completion timeline: By end of Sep 2018 in phases

23
Agenda
Overview Value Proposition Operational Highlights
Appendix

24
Strong financial track record
Key financial parameters FY15 FY16 FY17
EBITDA Margin (%) 40.1 42.4 41.8
Return on Avg. Net Worth (%) 19.2 16.0 6.3
EPS (` Per Share) 8.23 8.90 3.87
DPS (` Per Share) 2.00 2.00 0.50
Profit making entity since inception
Dividend paying track-record since listing
Free cash positive
Well capitalised balance sheet/ low gearing ratios
Robust financial profile in a challenging environment
62,654
91,477 89,076
96,103
1,00,596
84,804
15,944
30,066
34,536 38,535
42,612
35,414
0
8,000
16,000
24,000
32,000
40,000
-
20,000
40,000
60,000
80,000
1,00,000
1,20,000
FY12 FY13 FY14 FY15 FY16 FY17
Total Revenue (Rs. mn) EBITDA (Rs. mn, RHS)
91,191 94,049 89,205
75,739
1,44,762 1,33,844 1.60 1.52
1.36
1.01 1.49 1.29
-
0.40
0.80
1.20
1.60
2.00
2.40
-
40,000
80,000
1,20,000
1,60,000
FY12 FY13 FY14 FY15 FY16 FY17
Net Debt (Rs. mn) Net Debt to Equity
Note: Figures from FY16 onwards have been restated as per IndAS

25
Trend in Growth Rates
Demand growth rate picks up to 6.6% in Q3FY18
Source: CEA
Region Q1FY18 YoY Q2FY18 YoY Q3FY18 YoY 9MFY18 YoY Remarks
(MUs) change % (MUs) change % (MUs) change % (MUs) change %
North 95,880 4.2% 1,07,414 9.1% 85,539 6.5% 2,88,833 6.2% Driven by UP (Q3: 9%, 9M: 14% YoY growth)
West 94,762 5.2% 85,051 3.5% 97,008 12.8% 2,76,821 7.2% Q3 - MP: 24%, Mah: 4%; Guj: 18%9M - MP: 9%, Mah: 7%; Guj: 6%
South 79,531 5.0% 77,582 3.4% 76,274 0.6% 2,33,387 3.0% Telangana (Q3: 8%, 9M: 12%)
East 35,866 7.1% 36,219 6.1% 31,304 4.1% 1,03,389 5.5% DVC (Q3: 18%, 9M: 16%)
North-East 4,048 12.2% 4,617 11.5% 4,029 7.3% 12,694 10.4% Tripura (Q3: 43%, 9M: 88%)
All-India 3,10,087 5.1% 3,10,883 5.8% 2,94,154 6.6% 9,15,124 5.8%
Region FY17 FY18
Q1 Q2 Q3 Q4 Q1 Q2 Q3
North 8.9% 0.4% 0.2% 0.8% 4.2% 9.1% 6.5%
West 8.7% -1.0% -6.5% -1.8% 5.2% 3.5% 12.8%
South 7.3% 2.0% 12.4% 3.4% 5.0% 3.4% 0.6%
East 6.9% 4.2% 0.4% -1.7% 7.1% 6.1% 4.1%
NE 2.9% 6.6% 3.8% 4.5% 12.2% 11.5% 7.3%
All-India 8.1% 0.9% 1.0% 0.5% 5.1% 5.8% 6.6%

26
Thermal PLF increases to 59.9% in 9MFY18
Source: CEA
Gross Generation
Q1FY18 YoY change %
Q2FY18 YoY change %
Q3FY18 YoY change %
9MFY18 YoY change %
Remarks
(MUs) (MUs) (MUs) (MUs)
Thermal 2,61,664 2.3% 2,47,340 8.4% 2,58,355 1.6% 7,67,359 4.0% • Robust generation growth of 5.1%YoY in 9MFY18 primarily led by RE (22.2% growth) and hydro (5.5%) segments
• Q3FY18 thermal generation growth slow at 1.6% YoY
Hydro 36,270 17.6% 45,115 -3.7% 25,445 7.8% 1,06,830 5.5%
RE 25,391 27.1% 31,306 14.7% 21,559 28.6% 78,257 22.2%
Others 10,045 -0.2% 10,821 -16.1% 11,583 8.3% 32,449 -3.6%
Total 3,33,370 5.3% 3,34,582 6.1% 3,16,943 3.8% 9,84,895 5.1%
PLF (%) Q1FY17 Q1FY18 Q2FY17 Q2FY18 Q3FY17 Q3FY18 9MFY17 9MFY18 Remarks
Thermal 63.2% 62.5% 54.4% 57.6% 60.1% 59.5% 59.3% 59.9% • Private sector thermal PLF moves up to 55.7% for 9MFY18
• Q3FY18 PLF dropped to 59.5% from 60.1% in Q3FY17 due to weak state and private segments
Central 73.9% 73.7% 67.9% 69.7% 70.3% 71.2% 70.7% 71.5%
State 59.3% 59.1% 44.9% 49.7% 57.6% 54.7% 54.0% 54.5%
Private 58.0% 56.9% 52.1% 55.2% 55.1% 54.8% 55.1% 55.7%

27
Merchant tariff generally higher in CY17 on YoY basis
Source: IEX, PXIL
1.50
2.00
2.50
3.00
3.50
4.00
4.50
5.00
Jan Feb Mar Apr May Jun Jul Aug Sep Oct Nov Dec
IEX Average Market Clearing Price - INR/kWh
2014 2015 2016 2017 2018-YTD
Q1FY18 Q2FY18 Q3FY18 9MFY18
Merchant Volume
IEX+PXIL (MUs)11,877 12,214 11,028 35,120
Merchant Volume
growth YoY16.6% 11.2% 4.3% 10.6%
Merchant Volume as
% of Total Generation3.6% 3.7% 3.5% 3.6%
Merchant tariff declined in both CY15 and CY16 but staged a recovery in CY17

28
State31%
Private45%
Central 24%
Thermal capacity declines by ~0.5GW QoQ
Source: CEA
# Refers to total installed capacity of respective segments * QoQ change during the quarter
QoQ increase in total capacity by 2,397 MW in Q3FY18 led by RE segment. While thermal capacity declined by 490 MW QoQ, newcapacities of 2,689 MW and 198 MW were added in the RES and hydro segments respectively.
Sector-wise Installed Capacity – 333.6 GW(as on Dec 31, 2017)
Mode-wise Installed Capacity(as on Dec 31, 2017)
+40 MW * Total: 103.1 GW #
-425 MW *Total: 80.7 GW #
+2782 MW * Total: 149.8 GW #
Thermal66%
Nuclear2%
Hydro13%
RES19%
-490 MW * Total: 219 GW #
+198 MW * Total: 45 GW #
+2,689 MW *Total: 63 GW #
Total: 7 GW #
9MFY18 RE capacity increase is ~5.6GW FY18 addition likely to significantly fall short of target of 20.2GW

29
Indian economy and thermal coal prices
Source: API4 Coal Index, Bloomberg
Thermal coal prices firming up again, while INR appreciated slightly during Q3 FY18
Industrial production growth (% YoY)
Industrial Production growth hit a 2-year high of 8.4%YoY inNovember 2017 but its inherent volatility entails a wait-and-watch approach
2018 Union Budget outlines ~21%YoY increase in funds forinfrastructure in FY19. 4,000 km rail track electrificationproposed.
Indian government’s economic survey expects pick-up in GDPgrowth to 7-7.5% in FY19, up from the FY18 estimate of 6.75%
Indexed to Sept-2017 levels
-2%
0%
2%
4%
6%
8%
10%
12%
Apr-15 Oct-15 Apr-16 Oct-16 Apr-17 Oct-17
Overall IIP Manufacturing
80
100
120
140
160
Apr-15 Oct-15 Apr-16 Oct-16 Apr-17 Oct-17
Indexed API 4 Coal (monthly avg.) USD/INR (monthly avg.)
Month API 4 Coal USD/INR
Sep-17 100 100
Oct-17 99 101
Nov-17 100 100
Dec-17 104 99

30
This presentation has been prepared by JSW Energy Limited (the “Company”) based upon information available in the public domain solely for information purposes without regard to anyspecific objectives, financial situations or informational needs of any particular person. This presentation should not be construed as legal, tax, investment or other advice. This presentation isconfidential, being given solely for your information and for your use, and may not be copied, distributed or disseminated, directly or indirectly, in any manner. Furthermore, no person isauthorized to give any information or make any representation which is not contained in, or is inconsistent with, this presentation. Any such extraneous or inconsistent information orrepresentation, if given or made, should not be relied upon as having been authorized by or on behalf of the Company. The distribution of this presentation in certain jurisdictions may berestricted by law. Accordingly, any persons in possession of this presentation should inform themselves about and observe any such restrictions. Furthermore, by reviewing this presentation, youagree to be bound by the trailing restrictions regarding the information disclosed in thesematerials.
This presentation contains statements that constitute forward-looking statements. These statements include descriptions regarding the intent, belief or current expectations of the Company or itsdirectors and officers with respect to the results of operations and financial condition of the Company. These statements can be recognized by the use of words such as “expects,” “plans,” “will,”“estimates,” “projects,” or other words of similar meaning. Such forward-looking statements are not guarantees of future performance and involve risks and uncertainties, and actual results maydiffer from those specified in such forward-looking statements as a result of various factors and assumptions. The risks and uncertainties relating to these statements include, but are not limitedto, (i) fluctuations in earnings, (ii) the Company’s ability to manage growth, (iii) competition, (iv) (v) government policies and regulations, and (vi) political, economic, legal and social conditionsin India. The Company does not undertake any obligation to revise or update any forward-looking statement that may be made from time to time by or on behalf of the Company. Given theserisks, uncertainties and other factors, viewers of this presentation are cautioned not to place undue reliance on these forward-looking statements.
The information contained in this presentation is only current as of its date and has not been independently verified. The Company may alter, modify or otherwise change in any manner thecontents of this presentation, without obligation to notify any person of such revision or changes. No representation, warranty, guarantee or undertaking, express or implied, is or will be made asto, and no reliance should be placed on, the accuracy, completeness, correctness or fairness of the information, estimates, projections and opinions contained in this presentation. None of theCompany or any of its affiliates, advisers or representatives accept any liability whatsoever for any loss howsoever arising from any information presented or contained in this presentation.Please note that the past performance of the Company is not, and should not be considered as, indicative of future results. Potential investors must make their own assessment of the relevance,accuracy and adequacy of the information contained in this presentation and must make such independent investigation as they may consider necessary or appropriate for such purpose. Suchinformation and opinions are in all events not current after the date of this presentation.
None of the Company, any placement agent or any other persons that may participate in the offering of any securities of the Company shall have any responsibility or liability whatsoever for anyloss howsoever arising from this presentation or its contents or otherwise arising in connection therewith.
This presentation does not constitute or form part of and should not be construed as, directly or indirectly, any offer or invitation or inducement to sell or issue, or any solicitation of any offer topurchase or subscribe for, any securities of the Company by any person in any jurisdiction, including in India or the United States, nor shall it or any part of it or the fact of its distribution form thebasis of, or be relied on in connectionwith, any investment decision or any contract or commitment therefore.
Securities of the Company may not be offered, sold or transferred in to or within the United States absent registration under the United States Securities Act of 1933, as amended (the “SecuritiesAct”), except pursuant to an exemption from, or in a transaction not subject to, the registration requirements of the Securities Act and in compliance with any applicable securities laws of anystate of other jurisdiction of the United States. The Company’s securities have not been and will not be registered under the Securities Act.
This presentation is not a prospectus, a statement in lieu of a prospectus, an offering circular, an advertisement or an offer document under the Companies Act, 2013, as amended, the Securitiesand Exchange Board of India (Issue of Capital and Disclosure Requirements) Regulations, 2009, as amended, or any other applicable law in India.
Forward looking and cautionary statement

31
Thank you


![JSW Energy (Raigarh) Limited Balance Sheet as at March 31 ... · JSW Energy (Raigarh) Limited Statement of changes in equity for the year ended March 31, 2018 ( In `) [A] Equity share](https://static.fdocuments.in/doc/165x107/5e7e52636f3983498d04936d/jsw-energy-raigarh-limited-balance-sheet-as-at-march-31-jsw-energy-raigarh.jpg)