Journal of Non-Crystalline Solids - Home-The Lin Research Group
6
Dynamics of polystyrene-block-poly(methylmethacrylate) (PS-b-PMMA) diblock copolymers and PS/PMMA blends: A dielectric study Jin Liu a , Hanzheng Guo a , Xinchang Pang b , Xiaoli Tan a , Mufit Akinc a , Zhiqun Lin b , Nicola Bowler a, ⁎ a Department of Materials Science and Engineering, Iowa State University, Ames, IA 50011, United States b School of Materials Science and Engineering, Georgia Institute of Technology, Atlanta, GA 30332, United States abstract article info Article history: Received 15 June 2012 Received in revised form 6 September 2012 Available online 7 November 2012 Keywords: Copolymers; Molecular dynamics; Dielectric spectroscopy; Havriliak–Negami model The dielectric relaxation properties of poly(methylmethacrylate) (PMMA), polystyrene-block-poly (methylmethacrylate) (PS-b-PMMA) diblock copolymers and PS/PMMA blends were investigated by broad- band dielectric spectroscopy in the frequency range from 0.01 Hz to 1 MHz and temperature range from −40 to 150 °C. By parametric fitting techniques, an α relaxation process associated with the glass transition, the second- ary β relaxation process due to localized motions of side groups, and the conductivity at low frequencies were identified and modeled for all samples. Based on the modeling results, the characteristic relaxation time, fragility index, activation energies, and relaxation strength of PMMA and PS-b-PMMA diblock copolymers were compared. It was found that the structural α relaxation of the copolymers was suppressed compared with that of PMMA. The covalent chemical bonds that link PS and PMMA blocks in the diblock copolymers are therefore assumed to dom- inate over the PMMA–PMMA, PMMA–PS and PS–PS bonds that exist in the PMMA and PS/PMMA samples, ac- counting for the suppression of the cooperative structural α relaxation and for larger activation energies of the localized β relaxation of the diblock copolymers. Further, the activation energy barriers of localized β relaxations in the copolymers are observed to increase, above the glass transition temperature. © 2012 Elsevier B.V. All rights reserved. 1. Introduction The self-assembly of block copolymers into long-range ordered mor- phologies has been investigated for several decades [1]. Driven by the demand of miniaturization of devices in the microelectronics industry, they have become of great interest as a tool in nanomaterial fabrication in recent years [2,3]. For example, dielectric properties of different kinds of organo-metallic films and nanocomposites have been explored for potential applications in next-generation microelectronics [4–8]. Block copolymers possess favorable intrinsic properties such as long- range ordered phase separation and controllable morphology, and are relatively easy to synthesize, compared with other traditional patterning methods such as top-down lithography [9,10]. The use of block copoly- mer, instead of homopolymer counterparts, as the matrix in polymer- based nanocomposites affords opportunities to create tailored functional materials [11]. It is useful to understand the details of morphology changes in block copolymers under different conditions. Due to the accu- racy and sensitivity of the dielectric spectroscopy technique, dielectric relaxation behaviors of copolymers are examined in this work to inves- tigate their molecular dynamics. Dielectric spectroscopy is a proven and sensitive technique for monitoring dynamics of polar materials over a broad temperature and frequency range, as the permittivity changes in response to phase transitions such as the glass transition [12,13]. By observing the dielectric relaxation behavior of polymers, their molecular dynamics can be studied. Dielectric spectroscopy is now widely used to investigate molecular dynamics of copolymers and nanocomposites [14–16]. The dielectric spectra of polystyrene (PS) do not exhibit strong dielec- tric relaxation behavior because the functional groups of PS are stable phenyl groups which are not characterized by a high local dipole mo- ment. For poly(methylmethacrylate) (PMMA), on the other hand, there are two main dielectric relaxation mechanisms, namely, the structural α-type relaxation and localized β-type relaxation. The α relaxation arises from the motions of backbone chains, corresponding to the glass transi- tion of the polymer. The β relaxation is due to the localized rotational moment of the dipole vector of the ester group (O_C\O\CH 3 ). This localized β relaxation is the dominant relaxation process in PMMA. The dielectric strength of the β relaxation increases with temperature, which may be due to the increase of free volume, thereby leading to greater motion of dipoles [17]. The linear diblock copolymer, PS-b- PMMA, consists of PS and PMMA blocks covalently connected at one end. Depending on the molecular weight (MW) of the blocks and the po- lymerization process, linear diblock copolymers spontaneously phase- separate to form a wide range of morphologies, including: spherical, Journal of Non-Crystalline Solids 359 (2013) 27–32 ⁎ Corresponding author. E-mail address: [email protected] (N. Bowler). 0022-3093/$ – see front matter © 2012 Elsevier B.V. All rights reserved. http://dx.doi.org/10.1016/j.jnoncrysol.2012.09.015 Contents lists available at SciVerse ScienceDirect Journal of Non-Crystalline Solids journal homepage: www.elsevier.com/ locate/ jnoncrysol
Transcript of Journal of Non-Crystalline Solids - Home-The Lin Research Group

Journal of Non-Crystalline Solids 359 (2013) 27–32
Contents lists available at SciVerse ScienceDirect
Journal of Non-Crystalline Solids
j ourna l homepage: www.e lsev ie r .com/ locate / jnoncryso l
Dynamics of polystyrene-block-poly(methylmethacrylate) (PS-b-PMMA) diblockcopolymers and PS/PMMA blends: A dielectric study
Jin Liu a, Hanzheng Guo a, Xinchang Pang b, Xiaoli Tan a, Mufit Akinc a, Zhiqun Lin b, Nicola Bowler a,⁎a Department of Materials Science and Engineering, Iowa State University, Ames, IA 50011, United Statesb School of Materials Science and Engineering, Georgia Institute of Technology, Atlanta, GA 30332, United States
⁎ Corresponding author.E-mail address: [email protected] (N. Bowler).
0022-3093/$ – see front matter © 2012 Elsevier B.V. Allhttp://dx.doi.org/10.1016/j.jnoncrysol.2012.09.015
a b s t r a c t
a r t i c l e i n f oArticle history:Received 15 June 2012Received in revised form 6 September 2012Available online 7 November 2012
Keywords:Copolymers;Molecular dynamics;Dielectric spectroscopy;Havriliak–Negami model
The dielectric relaxation properties of poly(methylmethacrylate) (PMMA), polystyrene-block-poly(methylmethacrylate) (PS-b-PMMA) diblock copolymers and PS/PMMA blends were investigated by broad-band dielectric spectroscopy in the frequency range from 0.01 Hz to 1 MHz and temperature range from−40 to150 °C. By parametric fitting techniques, anα relaxation process associatedwith the glass transition, the second-ary β relaxation process due to localized motions of side groups, and the conductivity at low frequencies wereidentified and modeled for all samples. Based on themodeling results, the characteristic relaxation time, fragilityindex, activation energies, and relaxation strength of PMMAandPS-b-PMMAdiblock copolymerswere compared.It was found that the structuralα relaxation of the copolymerswas suppressed comparedwith that of PMMA. Thecovalent chemical bonds that link PS and PMMAblocks in the diblock copolymers are therefore assumed to dom-inate over the PMMA–PMMA, PMMA–PS and PS–PS bonds that exist in the PMMA and PS/PMMA samples, ac-counting for the suppression of the cooperative structural α relaxation and for larger activation energies of thelocalized β relaxation of the diblock copolymers. Further, the activation energy barriers of localized β relaxationsin the copolymers are observed to increase, above the glass transition temperature.
© 2012 Elsevier B.V. All rights reserved.
1. Introduction
The self-assembly of block copolymers into long-range orderedmor-phologies has been investigated for several decades [1]. Driven by thedemand of miniaturization of devices in the microelectronics industry,they have become of great interest as a tool in nanomaterial fabricationin recent years [2,3]. For example, dielectric properties of differentkinds of organo-metallic films and nanocomposites have been exploredfor potential applications in next-generation microelectronics [4–8].Block copolymers possess favorable intrinsic properties such as long-range ordered phase separation and controllable morphology, and arerelatively easy to synthesize, comparedwith other traditional patterningmethods such as top-down lithography [9,10]. The use of block copoly-mer, instead of homopolymer counterparts, as the matrix in polymer-based nanocomposites affords opportunities to create tailored functionalmaterials [11]. It is useful to understand the details of morphologychanges in block copolymers under different conditions. Due to the accu-racy and sensitivity of the dielectric spectroscopy technique, dielectricrelaxation behaviors of copolymers are examined in this work to inves-tigate their molecular dynamics.
rights reserved.
Dielectric spectroscopy is a proven and sensitive technique formonitoring dynamics of polar materials over a broad temperatureand frequency range, as the permittivity changes in response tophase transitions such as the glass transition [12,13]. By observingthe dielectric relaxation behavior of polymers, their molecular dynamicscan be studied. Dielectric spectroscopy is nowwidely used to investigatemolecular dynamics of copolymers and nanocomposites [14–16].
The dielectric spectra of polystyrene (PS) donot exhibit strong dielec-tric relaxation behavior because the functional groups of PS are stablephenyl groups which are not characterized by a high local dipole mo-ment. For poly(methylmethacrylate) (PMMA), on the other hand, thereare two main dielectric relaxation mechanisms, namely, the structuralα-type relaxation and localizedβ-type relaxation. Theα relaxation arisesfrom the motions of backbone chains, corresponding to the glass transi-tion of the polymer. The β relaxation is due to the localized rotationalmoment of the dipole vector of the ester group (O_C\O\CH3). Thislocalized β relaxation is the dominant relaxation process in PMMA. Thedielectric strength of the β relaxation increases with temperature,which may be due to the increase of free volume, thereby leading togreater motion of dipoles [17]. The linear diblock copolymer, PS-b-PMMA, consists of PS and PMMA blocks covalently connected at oneend. Depending on themolecularweight (MW)of the blocks and the po-lymerization process, linear diblock copolymers spontaneously phase-separate to form a wide range of morphologies, including: spherical,

28 J. Liu et al. / Journal of Non-Crystalline Solids 359 (2013) 27–32
lamellar, cylindrical and gyroid nanostructures. This phase-separationoffers, in turn, opportunity to confine nanoparticles to a particularphase, thereby controlling spatial distribution of nanoparticles with-in the target domain [18].
In this paper, the molecular dynamics of linear diblock copolymerPS-b-PMMA are studied and compared with those of PMMA homopoly-mer and a PS/PMMA blend. To compare molecular dynamics of PMMAbetween the diblock copolymer PS-b-PMMA and the PS/PMMA blend,copolymer PS-b-PMMA samples and blended PS/PMMA samples wereprepared. In both cases the MW of PS and PMMA was 50 k and 50 k,respectively. In order to investigate the molecular weight effect of PSon the molecular dynamics of copolymers, another copolymer samplePS-b-PMMA with the MW of PS and PMMA of 50 k and 130 k, respec-tively, was prepared. The frequency and temperature scans of dielectricmeasurements were conducted in a broad range, from 0.01 Hz to1 MHz and from −40 to 150 °C, respectively.
The dielectric properties of the blends and copolymers are found tobe dominated by the dielectric properties of PMMA, because PS is a non-polar polymer. The measured dielectric spectra are fitted by a sum oftwo Havriliak-Negami functions [19] and a conductivity term via theleast-squares fitting technique [20,21]. The comparison between PS-b-PMMA copolymers and PMMA is conducted in terms of their character-istic relaxation time, fragility index, and relaxation strength for the αrelaxation process, and characteristic relaxation time, activation energy,and relaxation strength for the β relaxation process. The study of dielec-tric relaxations of copolymers and homopolymers aims to explore therelaxation dynamics which depends on the morphology as well as thedegree of polymerization of polymers.
1
2
3
PMMA 50k
2. Experiment
2.1. Sample preparation
PMMA homopolymer and PS-b-PMMA diblock copolymers wereobtained from Polymer Source Inc. Disk-shaped samples for dielectrictesting, approximately 20 mm in diameter and ranging from 0.5 to1.25 mm thick, were formed as follows. PMMA was heated from roomtemperature to 150 °C, was die-pressed under 726 kg load for 5 minand was allowed to cool at room temperature without the load.PS-b-PMMA diblock copolymers were heated to 180 °C for 10 min,were die-pressed under 454 kg load and were allowed to cool at roomtemperature under a 136 kg load. The PS/PMMA blend was heated to180 °C for 30 min, was die-pressed under 272 kg load for 5 min andwas allowed to cool at room temperature under the same load. Theheating rate was 10 °C/min, while the samples were cooled naturallyat room temperature. Following the hot pressing processes, the sampleswere then polished and sputtered with Ag to form electrodes on bothsides of the disk-shaped samples. The thickness of the samples wasmeasured prior to sputter coating and their diameter was measuredafter sputter coating, using vernier calipers. In both cases, the averageof 10 measurements was recorded.
The molecular weight, diameter, thickness, and volume fraction ofthe PS component in the samples are summarized in Table 1. The vol-ume fraction of PS in each of PS-b-PMMA 50 k–50 k and 50 k–130 k
Table 1Molecular weight, volume fraction of PS (fPS), diameter, and thickness of the disk-shapedsamples used in the study.
Sample Mw fPS Diameter (mm) Thickness (mm)
PMMA 50 k 0 19.88±0.01 1.25±0.01PS 50 k 1 19.865±0.005 0.94±0.01PS-b-PMMA 50 k–50 k 0.53±0.03 19.88±0.01 0.855±0.005PS-b-PMMA 50 k–130 k 0.30±0.02 19.82±0.01 0.575±0.005PS/PMMA 50 k/50 k 0.53±0.03 19.90±0.01 0.905±0.005
is calculated based on the mass densities of PS and PMMA: 1.05 g/cm3
and 1.18 g/cm3, respectively. The electrode diameter (20 mm) is slight-ly larger than the sample diameter, which contributes to overall uncer-tainty of around 1% inmeasured permittivity (Table 1). The uncertaintyintroduced by the sample surface area being slightly smaller than theelectrode, approximately 0.01%, was estimated by calculating the effecton the deduced sample permittivity of a parallel air capacitor with theappropriate area and thickness. Themajor contribution to the 1% overalluncertainty derives from the standard deviation of several repeatedmeasurements.
2.2. Dielectric measurements
The complex permittivity of the samples was measured using aNovocontrol dielectric spectrometer with automatic temperature con-trol from −40 to 90 °C with a 10 °C increment, and from 90 to 150 °Cwith a 5 °C increment over a frequency range from 0.01 Hz to 1 MHz.The temperature increment was reduced above 90 °C so that the glasstransition could be investigated in detail. The experimentally measuredimaginary parts of relative permittivity of PMMA and PS-b-PMMA, PS/PMMA samples (the MW of both PS and PMMA is 50 K; denoted50 k–50 k) are shown in Figs. 1–3, respectively.
3. Spectral analysis
Theα and β relaxation processes and a conductivity term of PMMA,PS-b-PMMA, and PS/PMMA samples are modeled by least squaresfitting techniques [20,21]. The dielectric spectrum can be expressed asthe sum of α and β relaxation and a conductivity term, as describedby Eq. (1):
ε� ωð Þ−ε∞ ¼X2p¼1
Δεp
1þ iωτp;HN� �1−∝p;HN
� �βp;HN− iσ
ε0ωA ð1Þ
whereω is angular frequency, p=1, 2 denotes the two relaxation types,Δε is the dielectric strength, ε∞ is the permittivity well above the fre-quency of measurement, σ is the conductivity, ε0 is the permittivity offree space, and τHN, αHN and βHN are characteristic relaxation time andshape parameters that describe the Havriliak–Negami function [19].The term containing the power A is due to conductivity and electrodeeffects. A is always smaller than 1. It is common to proceed by fitting
-20
24
6
-50
050
100150
-2
-1
0
log10[frequency (Hz)]Temperature (°C)
Fig. 1. Experimentallymeasured imaginary relative permittivityε″ r of PMMA(MW=50 k).
-20
24
6
-50
0
50
100
150-3
-2
-1
0
1
log10[frequency (Hz)]
PS-b-PMMA 50k-50k
Temperature (°C)
log 10
[ε′′ r (
ω)]
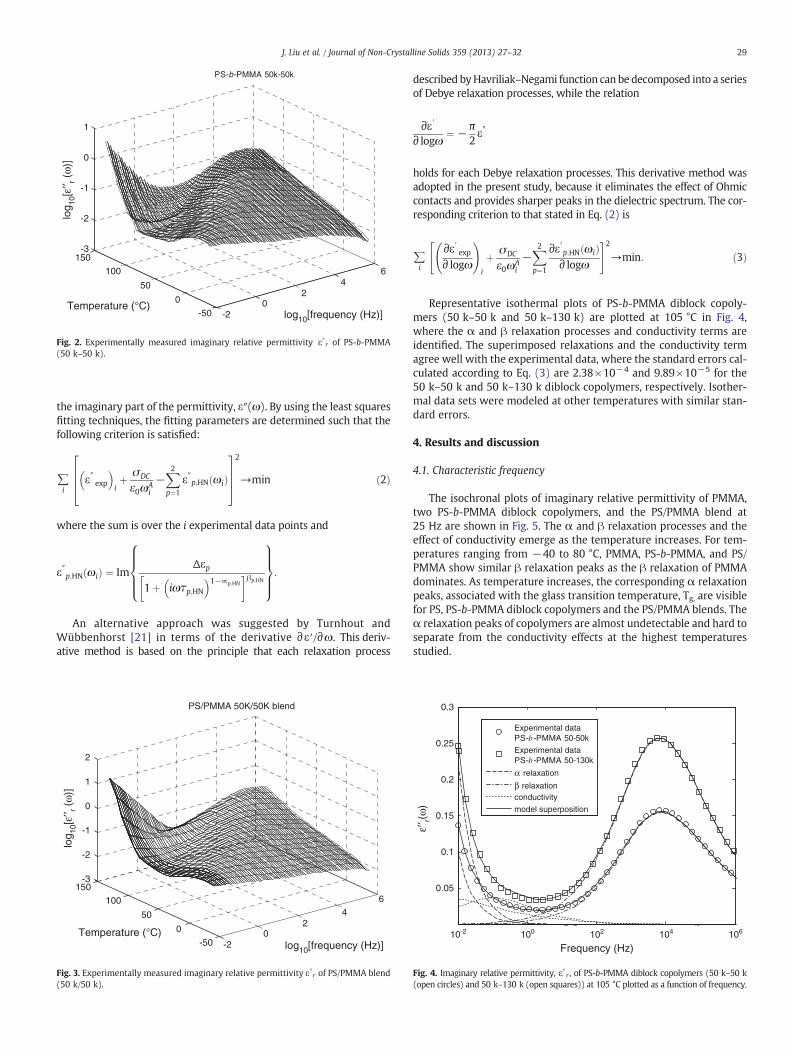
Fig. 2. Experimentally measured imaginary relative permittivity ε″r of PS-b-PMMA(50 k–50 k).
29J. Liu et al. / Journal of Non-Crystalline Solids 359 (2013) 27–32
the imaginary part of the permittivity, ε″(ω). By using the least squaresfitting techniques, the fitting parameters are determined such that thefollowing criterion is satisfied:
∑i
ε″ exp� �
iþ σDC
ε0ωAi
−X2p¼1
ε″p;HN ωið Þ
2664
37752
→min ð2Þ
where the sum is over the i experimental data points and
ε″p;HN ωið Þ ¼ ImΔεp
1þ iωτp;HN� �1−∝p;HN
� �βp;HN
8>>><>>>:
9>>>=>>>;:
An alternative approach was suggested by Turnhout andWübbenhorst [21] in terms of the derivative ∂ε′/∂ω. This deriv-ative method is based on the principle that each relaxation process
PS/PMMA 50K/50K blend
-20
24
6
-50
0
50
100
150
log10[frequency (Hz)]Temperature (°C)
log 10
[ε′′ r (
ω)]
-3
-2
-1
0
1
2
Fig. 3. Experimentally measured imaginary relative permittivity ε″r of PS/PMMA blend(50 k/50 k).
described byHavriliak–Negami function can be decomposed into a seriesof Debye relaxation processes, while the relation
∂ε′
∂ logω ¼ −π2ε″
holds for each Debye relaxation processes. This derivative method wasadopted in the present study, because it eliminates the effect of Ohmiccontacts and provides sharper peaks in the dielectric spectrum. The cor-responding criterion to that stated in Eq. (2) is
∑i
∂ε′ exp∂ logω
!i
þ σDC
ε0ωAi
−X2p¼1
∂ε′p;HN ωið Þ∂ logω
" #2→min: ð3Þ
Representative isothermal plots of PS-b-PMMA diblock copoly-mers (50 k–50 k and 50 k–130 k) are plotted at 105 °C in Fig. 4,where the α and β relaxation processes and conductivity terms areidentified. The superimposed relaxations and the conductivity termagree well with the experimental data, where the standard errors cal-culated according to Eq. (3) are 2.38×10⁻⁴ and 9.89×10⁻⁵ for the50 k–50 k and 50 k–130 k diblock copolymers, respectively. Isother-mal data sets were modeled at other temperatures with similar stan-dard errors.
4. Results and discussion
4.1. Characteristic frequency
The isochronal plots of imaginary relative permittivity of PMMA,two PS-b-PMMA diblock copolymers, and the PS/PMMA blend at25 Hz are shown in Fig. 5. The α and β relaxation processes and theeffect of conductivity emerge as the temperature increases. For tem-peratures ranging from −40 to 80 °C, PMMA, PS-b-PMMA, and PS/PMMA show similar β relaxation peaks as the β relaxation of PMMAdominates. As temperature increases, the corresponding α relaxationpeaks, associated with the glass transition temperature, Tg, are visiblefor PS, PS-b-PMMA diblock copolymers and the PS/PMMA blends. Theα relaxation peaks of copolymers are almost undetectable and hard toseparate from the conductivity effects at the highest temperaturesstudied.
10-2 100 102 104 106
0.05
0.1
0.15
0.2
0.25
0.3
Frequency (Hz)
ε′′ r(
ω)
Experimental dataPS-b -PMMA 50-50k
Experimental dataPS-b -PMMA 50-130k
α relaxation
β relaxationconductivity
model superposition
Fig. 4. Imaginary relative permittivity, ε″ r , of PS-b-PMMA diblock copolymers (50 k–50 k(open circles) and 50 k–130 k (open squares)) at 105 °C plotted as a function of frequency.

-40 -20 0 20 40 60 80 100 120 140
10-1
10-2
Temperature (°C)
ε′′ r(
ω)
PMMA
PS-b-PMMA 50k-50k
PS-b-PMMA 50k-130k
PS/PMMA
β
Conductivity
α (PMMA, PS/PMMA)
α (copolymers)
100
Fig. 5. Imaginary relative permittivity, ε″r , of samples as a function of temperaturemeasured at 25 Hz.
2.4 2.6 2.8 3 3.2 3.4 3.6
-4
-3
-2
-1
0
1
2
3
4
5
1000/T (K-1)
log 10
[f max
(H
z)]
α,β
PMMA
PS-b-PMMA 50k-50kPS-b-PMMA 50k-130k
PS/PMMA
α relaxations
β relaxations
Fig. 6. Arrhenius diagram of samples. fmax is the characteristic frequency of the maxi-mum in the curves of ε″(f) plotted as a function of frequency. The lines are obtainedby polynomial fit to the data points.
Table 2Parameters of α relaxation process for the samples used in the study, Eqs. (5)–(7).Uncertainties are estimated in accordance with the confidence level of the fit betweenthe experimental data and the model, Eq. (1), which is around 5%.
α Relaxation f0 (Hz) D T0 (K) Tg (K) m
PMMA (4.0±0.2)×108 2.50±0.1 340±20 95±5 131±7PS/PMMA blends (1.68±0.08)×107 1.80±0.09 340±20 96±5 139±7PS-b-PMMA50 k–50 k
(4.2±0.2)×102 0.56±0.03 350±20 97±5 126±6
PS-b-PMMA50 k–130 k
(2.7±0.1)×102 0.44±0.02 360±20 98±5 150±8
30 J. Liu et al. / Journal of Non-Crystalline Solids 359 (2013) 27–32
For amorphous polymer PMMA, the dielectric β relaxation pro-cess arises from localized rotational fluctuations of side chains. Themechanisms of β relaxation were discussed by Goldstein and Johari[22,23], and they argued that the β relaxation universally exists ina great variety of amorphous polymers. The temperature depen-dence of the characteristic relaxation time of β relaxation followsthe Arrhenius law:
f β;max ¼ f 0 exp − EAkBT
� �ð4Þ
where the factor f0 is on the order of the vibrational frequency of thelocalized motions, EA is the activation energy of the β relaxation, andkB is the Boltzmann constant. Above the glass transition temperatureTg, the glassy state is transformed to a rubbery state, which is alsoknown as a super cooled liquid. When the temperature increasesup to the melting temperature Tm, the super cooled liquid will trans-form to the liquid state. The segmental motions and chain connectiv-ity of polymers both contribute to the dynamic glass transition byintramolecular and intermolecular cooperativity. The characteristicrelaxation rate of α relaxation, which describes the viscosity andstructural relaxation, obeys the Vogel–Fulcher–Tammann (VFT)law [21,24–26]
fαmax ¼ f 0 exp − DT0
T−T0
� �ð5Þ
where D is the strength parameter and the temperature T0 is charac-teristic of static dipolar freezing of dipolar motion in the absenceof long-range correlation. The fragility of polymers, with index m[12], is related to the curvature in the plot of log10(fmax) versus 1/T,is thus a measure of the steepness of the temperature dependence,and is given by
m ¼d log10 − 1
2πfmax
� �dT=T0
T¼Tg:
��� ð6Þ
The fragility index m of the sample can be described by the follow-ing formula [12] in terms of VFT parameters,
m ¼ Tg
ln 10ð ÞDT0
Tg−T0
� �2 : ð7Þ
The relation between the maximum relaxation time and the corre-sponding Havriliak–Negami parameters αHN and βHN in Eq. (1) are [12]
fα;βmax ¼ fα;βHN
sin π 1−αHNð ÞβHN2 βHNþ1ð Þ
h isin π 1−αHNð Þ
2 βHNþ1ð Þh i
8<:
9=;
−1= 1−αð Þ
; ð8Þ
where fα;βHN ¼ 1= 2πτα;β
HN
� �is the characteristic frequency of the α and β
relaxations. Fig. 6 shows the Arrhenius diagram of α and β relaxationsof the samples. The corresponding parameters are summarized inTable 2, wherein the glass transition temperatures were estimated asthe temperature at which the characteristic relaxation time is 100 s.The values of f0 and D of the two diblock copolymers are much smallerthan those of PMMA, which indicates the suppression ofα relaxation inthe copolymers as compared to PMMA. On the other hand, f0 for the PS/PMMAblend is only a little less than that of PMMA. The fragility index ofPS-b-PMMA (50 k–50 k) is similar to that of PMMA (50 k), because mfor PS and PMMA is similar [12]. The fragility index of PS-b-PMMA(50 k–50 k) is, however, smaller than that of PS-b-PMMA (50 k–130 k),because the fragility of PMMA generally increases with the molecularweight [17].
The temperature dependence of the α and β relaxations of sam-ples extrapolated to higher temperature is shown in Fig. 7. For thePMMA sample, it can be seen that when the relaxation curves areextrapolated to higher temperature, the α relaxation and localized βrelaxation merge to form the αβ relaxation, while the cooperative αrelaxation of the PS/PMMA blend and of the PS-b-PMMA diblockcopolymers (50 k–50 k and 50 k–130 k) eventually disappear whenthe dielectric strength associated with the α relaxation approaches

2.1 2.2 2.3 2.4 2.5 2.6 2.7
-4
-2
0
2
4
6
8
αβ merging process, T ≈ 180°C
PMMA
PS-b-PMMA 50k-50k
PS-b-PMMA 50k-130k
PS/PMMA
log 10
[f max
(H
z)]
α,β
1000/T (K-1)
Fig. 7. Arrhenius diagrams showing the α relaxation at temperatures above Tg and ex-trapolation to higher temperatures using the fitting model.
Table 3Parameters of β relaxation process of the samples used in the study, Eqs. (5)–(7).
β Relaxation EA(kJ, T>Tg)
EA(kJ, TbTg)
PMMA 106±5 78±4PS/PMMA blends 106±5 78±4PS-b-PMMA 50 k–50 k 89±4 75±4PS-b-PMMA 50 k–130 k 88±4 82±4
31J. Liu et al. / Journal of Non-Crystalline Solids 359 (2013) 27–32
zero. The significant suppression of the α relaxation in the copolymersamples is discussed in Section 4.2.
For the β relaxation, all the samples show similar values of activa-tion energy, because the dominant β relaxation processes all arisefrom localized rotational motions of side chains of PMMA (Fig. 6).Fig. 8 shows the behavior of the β relaxation above Tg. The β relaxa-tion activation energy of PMMA and PS/PMMA above Tg is largerthan that of the 50 k–50 k and 50 k–130 k diblock copolymers dueto significant suppression of α relaxation in the dynamics of copoly-mers, which lowers the activation energy of the localized motionsas seen clearly in Table 3.
4.2. Dielectric strength
The dielectric strength of α and β relaxation processes as a functionof temperature is shown in Figs. 9 and 10, respectively. Uncertaintieswere assumed in accordance with the confidence level of the fitbetween the experimental data and themodel, Eq. (1), which is approx-imately 5%. It is noteworthy that the volume fraction of PS in the sam-ples is 0.53 for both PS-b-PMMA (50 k–50 k) and PS/PMMA, and is
2.4 2.45 2.5 2.55 2.6 2.65 2.7 2.753
3.5
4
4.5
5
5.5PMMA
PS-b-PMMA 50k-50k
PS-b-PMMA 50k-130k
PS/PMMA
1000/T (K-1)
log 10
[f max
(H
z)]
β
Fig. 8. Arrhenius diagram showing the β relaxation above Tg.
0.30 for PS-b-PMMA (50 k–130 k), Table 1. It is thus expected thatΔεα,β for PMMA should be larger than for the other samples, which isindeed the case seen in Figs. 9 and 10.
The overall dielectric strength of theα relaxation,Δεα shown in Fig. 9,of the PS-b-PMMA diblock copolymers (50 k–50 k and 50 k–130 k) issmaller than that of PMMA and the PS/PMMA blend. This is because theα relaxation of the copolymers is suppressed due the chemical connect-edness of the PS and PMMA blocks.
The dielectric strength of the α relaxation decreases when thetemperature goes up, indicating that the environment exerts weakerinfluence on the reorientation of the dipole in the cooperative regimeof the α relaxation, as temperature increases. In one description, theα relaxation is related to an effective dipole moment μeff which de-creases due to decrease of the size of the co-operatively rearrangingregions [27] when temperature increases [28].
The β relaxation is ascribed to the localized rotational fluctuationsof the ester group and depends on the total number of contributingdipoles. The molecular weight of PMMA homopolymer and the PMMAblock in PS-b-PMMA (50 k–50 k) diblock copolymer is the same, butΔεβ of PS-b-PMMA (50 k–50 k) shown in Fig. 10 is approximately halfof that of PMMA due to the reduced PMMA volume fraction in thecopolymer. Similarly, the dielectric strength Δεβ of PS-b-PMMA (50 k–130 k) is larger than that of PS-b-PMMA (50 k–50 k) due to the largermolecularweight of PMMA in the PS-b-PMMA (50 k–130 k)diblock co-polymer (i.e., higher volume fraction), thereby increasing the numberof dipoles that contribute to the β-relaxation. Comparing the behaviorof PS/PMMA and PS-b-PMMA (50 k–50 k) in terms of the strengths oftheir β-relaxations, Fig. 10, that of PS/PMMA is higher than that ofPS-b-PMMA because PS and PMMA are immiscible [28]. By contrast, inthe case of the diblock copolymer, the PS and PMMA chains are cova-lently linked and, as a result, the strength of the β-relaxation of PS-b-PMMA (50 k–50 k) is weaker than that of PS/PMMA.
2.45 2.5 2.55 2.6 2.650
0.2
0.4
0.6
0.8
1
1.2
1.4
1.6
1000/T (K-1)
Δεα
PMMA
PS-b-PMMA 50k-50kPS-b-PMMA 50k-130k
PS/PMMA
Fig. 9. Dielectric relaxation strength of α relaxation of samples as a function of inversetemperature above Tg.

2.45 2.5 2.55 2.6 2.65 2.70.8
1
1.2
1.4
1.6
1.8
2
2.2
1000/T (K-1)
1000/T (K-1)
Δεβ
Δεβ
PMMA
PS-b-PMMA 50k-50k
PS-b-PMMA 50k-130k
PS/PMMA
a)
2.7 2.8 2.9 3 3.1 3.2 3.3 3.4 3.5 3.6 3.7
0.8
1
1.2
1.4
1.6
1.8
2
2.2
2.4
2.6PMMA
PS-b-PMMA 50k-50k
PS-b-PMMA 50k-130k
PS/PMMA
b)
Fig. 10. Dielectric relaxation strength of β relaxation of samples as a function of inversetemperature a) above Tg and b) below Tg.
32 J. Liu et al. / Journal of Non-Crystalline Solids 359 (2013) 27–32
The dielectric strength of the β relaxation, Δεβ, shows a mostly in-creasing trend with temperature, except in the region around Tg, whichmay be affected by the presence of the α relaxation. The β relaxation isa thermally-activated process and the angular extension of the fluctuat-ing ester group increases with temperature, thereby increasing Δεβ.
5. Conclusion
The dielectric spectrum of PMMA homopolymer, and PS-b-PMMAdiblock copolymers (50 k–50 k and 50 k–130 k) and a PS/PMMA blendwas investigated by broadband dielectric spectroscopy. The experimen-tal results were modeled as the superposition of α and β relaxation pro-cesses and a conductivity term. The comparison of dielectric relaxationproperties of PMMAand PS-b-PMMAdiblock copolymerswas conductedin terms of the characteristic relaxation time, fragility index, activationenergies, characteristic relaxation time, and relaxation strength. It wasfound that α relaxation is greatly suppressed in PS-b-PMMA, due to thechange of local molecular dynamics. By extrapolation, the αβ mergingprocess was observed only in the PMMA sample. To account for the dif-ferent values of dielectric strength, changes of molecular dynamics ofsamples were discussed.
Acknowledgment
We gratefully acknowledge funding support from the Air Force Of-fice of Scientific Research (FA9550-09-1-0388).
References
[1] A. Keller, E. Pedemonte, F.M. Willmouth, Nature 225 (1970) 538.[2] M. Lazzari, M.A. López-Quintela, Adv. Mater. 15 (2003) 1583.[3] S.B. Darling, Prog. Polym. Sci. 32 (2007) 1152.[4] P. Sgarbossa, R. Bertani, V. Di Noto, M. Piga, G.A. Giffin, G. Terraneo, T. Pilati,
P. Metrangolo, G. Resnati, Cryst. Growth Des. 12 (2012) 297.[5] S. Lavina, E. Negro, G. Pace, S. Gross, G. Depaoli, M. Vidali, V. Di Noto, J. Non-Cryst.
Solids 353 (2007) 2878.[6] S. Gross, D. Camozzo, V. Di Noto, L. Armelao, E. Tondello, Eur. Polymer J. 43 (2007)
673.[7] S. Gross, V. Di Noto, U. Schubert, J. Non-Cryst. Solids 154 (2003) 332.[8] V. Di Noto, D. Barreca, C. Furlan, L. Armelao, Polym. Adv. Technol. 11 (2000) 108.[9] I.W. Hamley, The Physics of Block Copolymers, Oxford University Press, Oxford,
1998.[10] D.Y. Ryu, U. Jeong, J.K. Kim, T.P. Russell, Nat. Mater. 1 (2002) 114.[11] M.R. Bockstaller, R.A. Mickiewicz, E.L. Thomas, Adv. Mater. 17 (2005) 1331.[12] S. Moreno, R. Rubio, Macromolecules 35 (2002) 5480.[13] D. Boese, F. Kremer, Macromolecules 23 (3) (1990) 829.[14] G. Floudas, K. Meramveliotaki, N. Hadjichristidis, Macromolecules 32 (1999)
7496.[15] M.M. Mok, K.A. Masser, J. Runt, J.M. Torkelson, Macromolecules 43 (2010) 5740.[16] J.D. Menczel, R.B. Prime, Frontmatter, in Thermal Analysis of Polymers: Funda-
mentals and Applications, John Wiley & Sons, Inc., Hoboken, NJ, USA, 2008.[17] F. Kremer, A. Schönhals, Broadband Dielectric Spectroscopy, Springer, 2002.[18] F.S. Bates, G.H. Fredrickson, Phys. Today 52 (1999) 32.[19] S. Havriliak, S. Negami, Polymer 8 (1967) 161.[20] E. Schlosser, A. Schönhals, Colloid Polym. Sci. 267 (1989) 963.[21] J. Turnhout, M. Wübbenhorst, Dielectric Newsletter, NOVOCONTROL GmbH,
Hundsangen, November 2000.[22] G.P. Johari, M.J. Goldstein, J. Chem. Phys. 53 (1980) 2372.[23] G.P. Johari, J. Chem. Phys. 28 (1973) 1766.[24] V. Vogel, Z. Phys. 22 (1921) 645.[25] G.S. Fulcher, J. Am. Ceram. Soc. 8 (1925) 339.[26] G. Tammann, W.Z. Hesse, Z. Anorg. Allg. Chem. 156 (1926) 245.[27] G. Adam, J.H. Gibbs, J. Chem. Phys. 43 (1965) 139.[28] A. Schönhals, Europhys. Lett. 56 (2001) 815.