Journal of Duhok Universityportal.uod.ac/journal/issues/pes/files/PES - Volume 17 - Number 1... ·...
142
Journal of Duhok University Chief Editor: Secretary Editor: Prof. Dr. Ahmed Khursheed Alsulaifanie Prof Assist Dr. ismail Aba Bakir Ali Editorial Board (Pure and Engineering Sciences): Prof Dr. Adel Taleb Al-Saeed Dr. Manaf Ali Mohammed Technical Manager Miss.Chinar Mika’eL M. Ameen Miss.Hayam Ahmed Ali Mr.Ma’rouf M. A. Elias Journal of Duhok University Pure and Engineering Sciences Published biannual by Duhok University Address: Zakho Street 38 1006AJ Kurdistan Region-Iraq The Secretariat, JDU Editorial Board, Mobile.: 00964 (0) 07508504928 www.jdu.uod.ac E-mail: [email protected] UoD Printing Press
Transcript of Journal of Duhok Universityportal.uod.ac/journal/issues/pes/files/PES - Volume 17 - Number 1... ·...

Journal of Duhok University
Chief Editor: Secretary Editor:Prof. Dr. Ahmed Khursheed Alsulaifanie Prof Assist Dr. ismail Aba Bakir Ali
Editorial Board (Pure and Engineering Sciences):
Prof Dr. Adel Taleb Al-Saeed
Dr. Manaf Ali Mohammed
Technical ManagerMiss. Chinar Mika’eL M. Ameen
Miss. Hayam Ahmed AliMr. Ma’rouf M. A. Elias
Journal of Duhok University
Pure and Engineering SciencesPublished biannual by Duhok University
Address:Zakho Street 381006AJKurdistan Region-IraqThe Secretariat, JDU Editorial Board,
Mobile.: 00964 (0) 07508504928www.jdu.uod.ac E-mail: [email protected]
UoD Printing Press

JOURNAL OF DUHOK UNIVERSITY(Pure and Engineering Sciences)
VOLUME 17 DECEMBERNUMBER 1 2014

Journal of University of Duhok., Vol.17, No.1 (Pure and Eng. Sciences), 2014
JOURNAL PAPER INSTRUCTIONS TO AUTHORSGeneralThe paper should be valuable and should not have been published or submitted for publication in anyother Journals. The text should be complete with abstract, introduction, material and methods, results,discussion and reference. The text must not exceed 15 pages for sciences papers and 25 for the humanities
Content TextThe content text must be Normal, 10 pt., Times New Roman, at least 12 lines spaced, and justified. Eachparagraph should be spaced after 6 pt. The first line of the paragraphs should not be indented.
FootnotesFootnotes should not be used.
Page MarginsThe paper size should be A-4 size and page margins must be 2.5 cm top and bottom, 3 cm left and 2 cmright.
Page NumbersInclude page numbers. The page numbers should be placed in the lower right hand corner.
TitlesThe paper title must be capitalized, bold, centered, 11 pt., and spaced after 18 pt. Main titles and abstracttitle should be capitalized 9 pt., aligned left, bold, spaced before 12 pt., and after 6 pt., and numbered as(1., 2.,3.). Principle subtitles must be written in 10 pt, bold, aligned left.Author(s)The name(s) of the author(s) should be written only in the first page, capitalized, 8 pt, normal, centered,and spaced after 18 pt.(See below).
ALI MUHAMMED1, JALAL AMEEN 2 and DLOVAN ASSAD 2
The authors’ names should not cover all line and if there are more than, 3 or 4 writers the rest should bespaced to the line below, and writers also should be single spaced. The writers from the same departmentor the institution should be numbered by different numbers and indicated in the line below in 8 pt, as thefollowing:
1 Department of Geography, College of Arts, University of Duhok, Kurdistan Region, Iraq2 Department of Soil & Water Science, College of Agriculture, University of Duhok, Kurdistan Region, Iraq
AbstractAbstract body should be 8 pt., bold, aligned left, and single spaced. The abstract must not exceed 300words. (4-6) keywords must be provided at the end of abstract. The keywords title must be capitalized, 8pt., aligned left, and Italic. The keywords should be written in 8 pt., Italic, and their initials should becapitalized. Paragraphs in the abstract should be spaced after 6. (See below)
KEYWORDS: Erosivity factor, Rainfall, Fournier index, Water Quality
Summary should be provided also in Kurdish and Arabic at the end of the paper.

Journal of University of Duhok., Vol.17, No.1 (Pure and Eng. Sciences), 2014
Figures and TablesExcept the tables, all the graphs, maps and photographs must be named as figures. Tables and Figuresshould be numbered consecutively by Arabic numerals. The tables and figures must not exceed the pagemargins and must be on one page. All Table outline border should be (1 ½ pt.), inside border should be(½ pt.); table details should be Arial font and written with 7 pt. the figure and table names must be writtenwith 8 pt. style. Names must be written in the middle on top for the tables with space 4 after and for thediagrams/figures, underneath on the bottom with space 4 before and 12 after. If the figure and tablenames have to be more than one line, the line spacing should be single spaced, and the terms of “Figures”and “Tables” must be bold. (See below)
Table (1): The effect of pepper shoot & root aqueous extract on the growth of different other plants:
Shoot Extract Root Extract
Plant typeConc.%
Rootlength(cm)
Shootlength(cm)
Intactplantlength(cm)
Inhibition %
Conc.%
Rootlength(cm)
Shootlength(cm)
Intactplantlength(cm)
Inhibition%
Okra
0 *25.7 a** 27.8 a 53.5a - 0 25.7a 27.8a 53.5a -
5 25.00a 26.77a 51.77a 3.23 1 24.50a 27.00a 51.50a 3.73
10 24.50a 25.95a 50.45a 5.70 2 23.87a 25.65a 49.52a 7.43
Sorghum
0 21.6a 27.2a 48.8a - 0 21.7a 27.2a 48.9a -
5 13.00b 17.25b 30.25b 38.03 1 9.8b 25.5ab 35.3b 27.6
10 6.00c 5.50c 11.50c 76.44 2 9.4b 22.6b 31.9 b 34.6
Figure (1): xxxxxxxxxxxxx
Bullets and NumberingBullets and numbers should be indented 1 cm from the left margin and hanging indent should be 0.5 cm.Each line of bullets and numbers should be single spaced.
ReferencesReferences should be indicated in the typescript by giving the author's name, with the year of publicationin parentheses, as detailed in the APA style guide. All lines after the first line of each entry in yourreference list should be indented one cm from the left margin (hanging indentation). If several papers bythe same author(s) and from the same year are cited, a, b, c, etc. should be put after the year ofpublication. The references should be listed in full at the end of the paper in standard APA format. Forexample:
For Books:Ritter, D. F., Kochel, R. C., and Miller, J. R. (2002). Process Geomorphology (4th ed.). New York:
McGraw-Hill.Massey, W. R., and Jameson, W. M., Jr. (2001). Organizational behavior and the new internet logic (3rd
ed.). New York: McGraw-Hill.

Journal of University of Duhok., Vol.17, No.1 (Pure and Eng. Sciences), 2014
For articles:- Harlow, H. F. (1983). Fundamentals for preparing psychology journal articles. Journal of Comparative and
Physiological Psychology, 55, 893-896.- Loughran, J., and Corrigan, D. (1995). Teaching portfolios: A strategy for developing learning and
teaching in preservice education. Teaching and Teacher Education, 11, 565-577.
For chapters within books:- Smith, N. (1997). Challenges and choices facing social studies teachers. In R. Case & P. Clark
(Eds.), The Canadian anthology of social studies (pp. 3-9). Burnaby, BC: Simon Fraser UniversityField Relations.
For conference proceedings:- Demirci, A., McAdams, M. A., Alagha, O., and Karakuyu, M. (2006). The relationship between land
use change and water quality in Küçükçekmece Lake watershed. In A. Demirci, M. Karakuyu, andM. A. McAdams (Eds.). Proceedings of 4th gis days in Türkiye (pp. 27-35). Đstanbul, 13-16 September.
- Healey, M., Foote, K., and Hay, I. (2000). Developing the International Network for Learning andTeaching (INLT) Geography in Higher Education. In: International Geographical Union Commission onGeographical Education (Eds.). Geographical Education at the Cross-roads: Directions for the NextMillennium, Proceedings of the Kyongju Symposium (pp. 203-207), Korea.
For online documents:- Standler, R. (2000). Plagiarism in colleges in the USA. Retrieved August 6, 2004, from
www.rbs2.com/plag.htm- Bernstein, M. (2002). 10 tips on writing the living Web. A List Apart: For People Who Make
Websites, 149. Retrieved May 2, 2006, from http://www.alistapart.com/articles/writeliving- Titles of journals and names of publishers, etc. should not be abbreviated. Acronyms for the names of
organisations, examinations, etc. should be preceded by the title in full.
Note: Referred scientific materials such as: e-journals, e-books, etc. can be used as reference byauthors.For further information about APA reference style please visit
http://owl.english.purdue.edu/owl/resource/560/01/
SubmissionFour copies of the research paper with CD containing the paper in one file (Microsoft word 2003) shouldbe submitted to the following address:
The Secretariat,JDU Editorial Board,
Presidency of Dohuk University, DohukGovernorate,
Kurdistan Region, Iraq.Tel: 062-7225259
E-mail: [email protected]

Journal of University of Duhok, Vol. 17, No.1 (Pure and Eng. Sciences), 2014
CONTENTS
- Effect Of The Transverse Magnetic Field On Mercury Discharge ParametersMahmood E. Al- Hakary and Jundi Kh. Yousif……………………………………………………………….…1
- Immunohistochemical Markers For Recognition Tissue Of Origin In MetastaticCancersMayada I. Yalda,Melad A. Yalda and Bashar A. Hassawi ……………………………………………..…………6
- Spectrophotometric Determination Of Masalamine Using 9-ChloroacridineReagent–For Some Pharmaceutical FormulationsSuzan Ahmed Ali , Shrieen Othman and Theia'a Najim Al-Sabha…………………………………….……...…15
- Fpaa Based Pid Controller For Temperature Control Of Baby IncubatorAbdul-Kareem Z. Mansoor and Asmaa E. Hamdoon………………...…...………………………….…........…26
- Improve Microstructure And Mechanical Properties Of Al-A332–AlloyReinforced Al2o3 Micro And Nano Composites Fabricated By Stir CastingIbtihal A. Mahmood ,Adnan Dawood Mohammed and Rawnaq Ahmed Mohammed………………..………35
- Eog Signal Acquisition Using Reconfigurable Analog Devices And Use It ToControl Wheelchair MovementThair Ali Salih and Mohammed Talal Ghazal…………..……………………………………...………….……47
- Seasonal Variations Of Raw Water Of Tigris River And Effect On QualityWater PlantsLilyan yaaqub matti AlsakaJ…..……………………...…………………………………………………….……55
- Soil Testing Forecasting Using Time - Series Analysis TechniquesMuthaina .A. Mustafa………………………………………………..……………………...……………………72
- Concepts Of Water Management Among Riparian Countries (Iraq - Turkey -Syria) And It's Impact On Water Quality And QuantityLilyan yaaqub matti Alsaka…………...………………………...…………………………...……………………81
- Growth Of Scintillator Materials Of Cerium Doped Lanthanum Bromide SingleCrystals Via Bridgman TechniqueFaris Kochary………………………..……………...…………………………...………………………..………95
- Natural Radiological Hazardous Of Rocks In Duhok Governorate, KurdistanRegion, IraqRevink Ali Ramadhan and Khairi M-S. Abdullah……………………….....................…………………..………99
- Anatomical And Palynological Studies Of Cissus Quadrangularis And CayratiaGeniculata (Vitaceae and Leea Angulata (Leeaceae)Chnar Najmaddin........................……...............................................................................…………...…………108
- Concrete Surface Sealants: A Comparative StudyKhalid M.Shaheen and Leena J.Sedeeq............................………………………………………………………119
- Simulation Models For Bekhma Reservoir Operation System(ComparisonStudy)Mahdi Dawood, Kamel A. AlMohseen and Shaker A. Jalil………………………………………………….…126
Journal of University of Duhok, Vol. 17, No.1 (Pure and Eng. Sciences), Pp 1-5, 2014
1
EFFECT OF THE TRANSVERSE MAGNETIC FIELDON MERCURY DISCHARGE PARAMETERS
MAHMOOD E. AL- HAKARY and JUNDI KH. YOUSIF
Dept. of Physics, Faculty of Science, University of Zakho, Kurdistan region-Iraq
(Received: October 4, 2012; Accepted for publication: November 25, 2013)
ABSTRACTThe current –voltage characteristics of Glow discharge has been measured experimentally, from these
characteristics the electrical conductivity was calculated at different currents values (0, 30, and 60mA) or from(0-45.4µT) of transverse magnetic field. Also we studied the effect of transverse magnetic field on (I-V)characteristics, the electrical conductivity, and the resistance of the mercury discharge at constant gas pressure(0.75torr.). The results show that the magnetic field effect on the (I-V) characteristic for glow discharge isanalogous completely to Abnormal Glow Discharge., the average voltage increases while the current decreaseswith transverse magnetic field and this lead to decrease the electrical conductivity. And the resistance glowdischarge is increases with the electric current magnetic field.
KAY WORDS: Glow discharge, electrical conductivity, current voltage, transverse magnetic field
1. INTRODUCTION
any theoretical and experimentalworks have dealt with the
characteristic of the discharge current as afunction of the applied voltage (Qais , 2007,Ahmad, 2010, Escho, 2009, Akbar, 1996,Hippler, et al. 2008, Chen, 1984). The changesthat take place in the gas as a function of theapplied voltage are described by the typicaldependence of the discharge current (I) on theapplied voltage (V) is called (I-V) characteristicof the discharge. The main characteristics of thedischarge such as the breakdown voltage, thevoltage current characteristic and the structure ofthe discharge depend on the geometry of theelectrodes, the gas used, the pressure and theelectrode material.The production of plasma in rectangular tubes(Qais , 2007) has been carried out and reportedby various authors .They were concerned mainlywith the study of the characteristics of thepositive column. When a magnetic field act upona glow discharge, various changes such asincrease of equivalent pressure take place. If aD.C. transverse magnetic field is applied to thepositive column, the electron density distributionis deflected to the wall by the influence of themagnetic field. The aim of the present work is tostudy the effect of a D.C. transverse magneticfield on the I-V characteristic curve and electricfield gradient in discharge tube.
When a magnetic field is applied to plasmaglow discharge will occur many changes onplasma parameters. Allen (Allen, 2007) notedthat the current decreases while the voltageincreases with transverse magnetic field.
Many theoretical and experimental researchesare studied results for the electrical conductivityof noble gas plasmas are presented incomparison with experiment (Ahmad, 2010,Akbar, 1996, Adams, et al, 2007). Thecomposition is determined within a partiallyionized plasma model. The conductivity is thencalculated using linear response theory, in whichthe relevant scattering mechanisms of electronsfrom ions, electrons, and neutral species aretaken into account. In particular, the Ramsauer-Townsend effect in electron-neutral scattering isdiscussed and the importance of a correctdescription of the Coulomb logarithm in electronscattering by charged particles. And the effect ofthe magnetic field on plasma parameters werestudied previously, Kameda (Kameda , 1979)studied the effect transverse magnetic field (0-50G) on plasma parameters for plasma Argongas. Teruo et al (Teruo Kaneda, 1979) studiedthe influence of a transverse magnetic field on aglow discharge tube.
Selvarajen and Natarjan (Selvarajen andNatarjan,1982) studied the effect axial magneticfield (0-2050G) on breakdown voltage for dryair. Hosouba (Hassouba, 2001) studied the effectaxial magnetic field for (DC) negative glowdischarge for Argon gas at pressure range (0.4-
M

Journal of University of Duhok, Vol. 17, No.1 (Pure and Eng. Sciences), Pp 1-5, 2014
2
0.5Torr.). Kanedn and Antoni (Kanedn, Antoni,2000) studied the transverse magnetic on plasmaparameters of Positive Column. Al-Badrani (Al-Badrani, 2005) studied the effect of AxialMagnetic Field on DC Glow Discharge Plasmaparameters.
In this work a magnetic field perpendicularon the plasma was applied on the plasmaproperties (electron conductivity) at gas pressure(0.75torr) and different magnetic field strengthstudied. Also studied some other properties suchas; the relation between volt and current ofdischarge, these studies were done on normalglow state.
The plasma parameters such as electricalconductivity were founded from the (I-V)characteristics at pressure (0.75torr), andcalculated from the current density relation. Theelectrical conductivity as a function of magneticfield (0mA, 10mA, 30mA and 60mA), or from(0-45.4µT) as well as, we study the effect oftransverse magnetic field on these parameters.Also we found the effect of the magnetic fieldon the resistance discharge. Finally we calculatethe magnetic field (B) theoretically from Biot-Savart law, the value of the magnetic field at apoint is directly proportional to the both value ofthe current (I) in the conductor and the numberof turns per unit length (N) of the current-carrying segment, and depend on thepermeability (µ)
2/ ( )B NI watt m Tesla
2. DISCHARGE ELECTRIC CIRCUITAND EXPERIMENTAL PROCEDUREThe experimental system employed is shown
in Diagram (1),the discharge tube is made ofPyrex of radius (2cm) and length (20cm).Thedischarge contain a mercury gas evacuated to apressure (0.75torr), high power supply used togive a required electric field, and a digitalammeter is used, a transverse magnetic field ofmagnetic current ( 0,10,30,60mA) or from (0-45.4µT).
The type of plasma formed by applying of avoltage at (100 V to several kV) through a gas,usually argon or another noble gas. The glowdischarge owes its name to the fact that plasmais luminous; the luminosity is produced becausethe electrons gain sufficient energy to generatevisible light by excitation collisions whichgenerate photons.
A simple electric circuit used high powersupply voltage for generating glow dischargethrough the confined gas between the twoelectrodes, also a high resistance connected inthis circuit for discharge stability and to protectthe power supply from the higher currents duringsuddenly higher conductivity of the gas.
For studying the properties under the effecttransverse magnetic field, we applied two coilsof (600turn) on the two opposite side on themiddle discharge tube, an electric current frompower supply supplied to the coils for generatingthe required transverse magnetic field,
Diagram (1): Electrical circuit for glow discharge
Journal of University of Duhok, Vol. 17, No.1 (Pure and Eng. Sciences), Pp 1-5, 2014
3
3. CALCULATION OF PLASMAPARAMETERS
The very important process to measurethe plasma parameters is the electric probemethod:
The three processes to measure the plasmaparameters are:
1. Studding Emission 2. Microwave Process3. Langmuir Probe
There has been much recent interest in theinvestigation of the plasma parameters we reporton the technique of using the electrical probes,double and single Langmuir probes. TheElectrostatic Probes ( Langmuir Probes) Simplediagnostic tools techniques, electrical probes cangive valuable information on the plasmaproperties, and very important to measure theparameter in cold plasma, such as electrondensity ne, electron temperature (Te), electricalconductivity (), and electron energydistribution (EED).
Conductivity is the ability of the material toconduct electric current, we create a cylindricalglow discharge by applying a high voltagebetween the electrode that is sufficient to makethe break down of a gas and convert the insulatorto conductor (abnormal glow discharge)
The conduction is well described by Ohm'slaw which state that:
The current density ( J) is proportional to theapplied electric field (E)
J = E
Where:A
IJ where (J) is the current per
unit area,
22 (π D )
A π r2
where, D is the
diameter of the tube (1.98cm), and (d) is thedistance between the two electrodes
(16.8cm).Andd
VE is potential gradient.
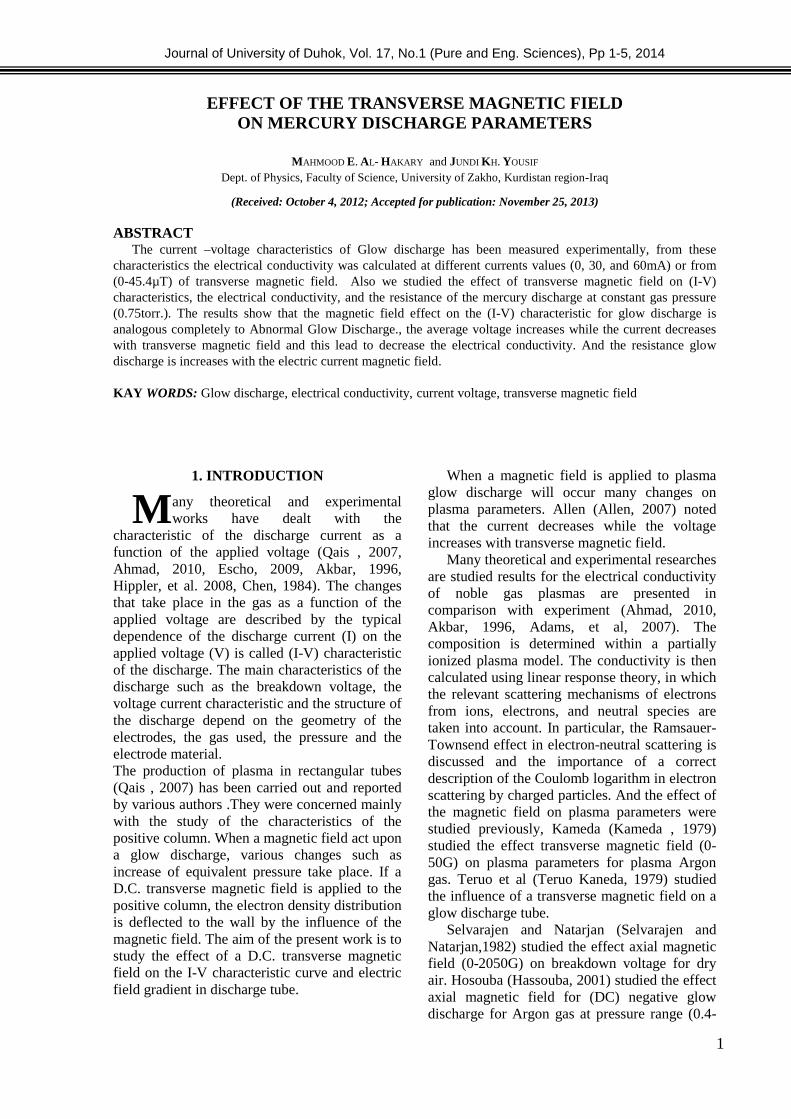
4. RESULT AND DISCUSSIONSThe plasma parameters such as electrical
conductivity were founded from the (I-V)characteristics at pressure (0.75torr) as shown infig.(1), and calculated from the current densityrelation.
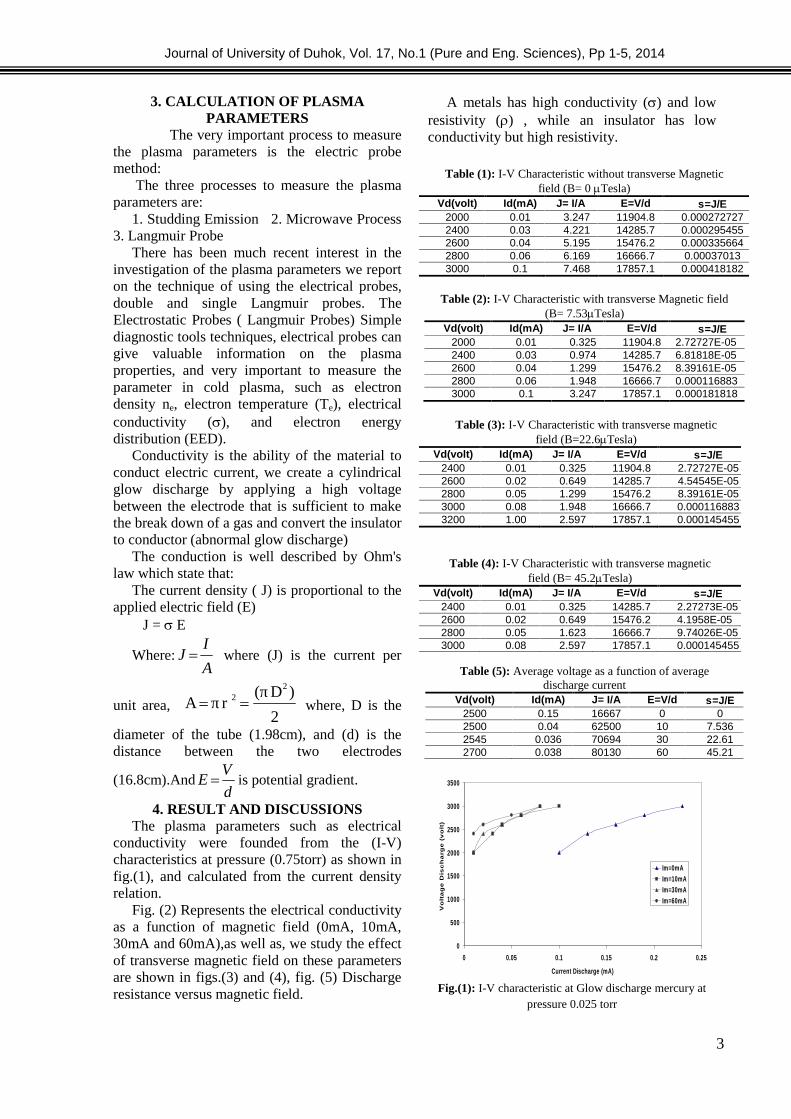
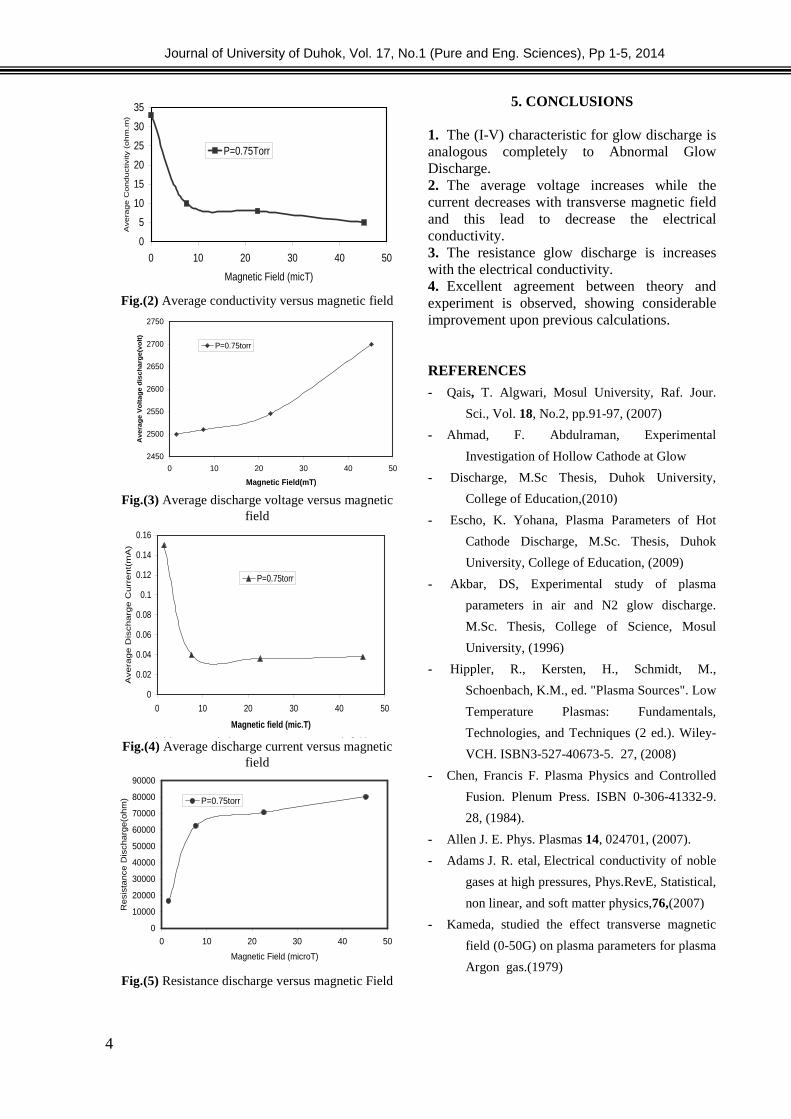
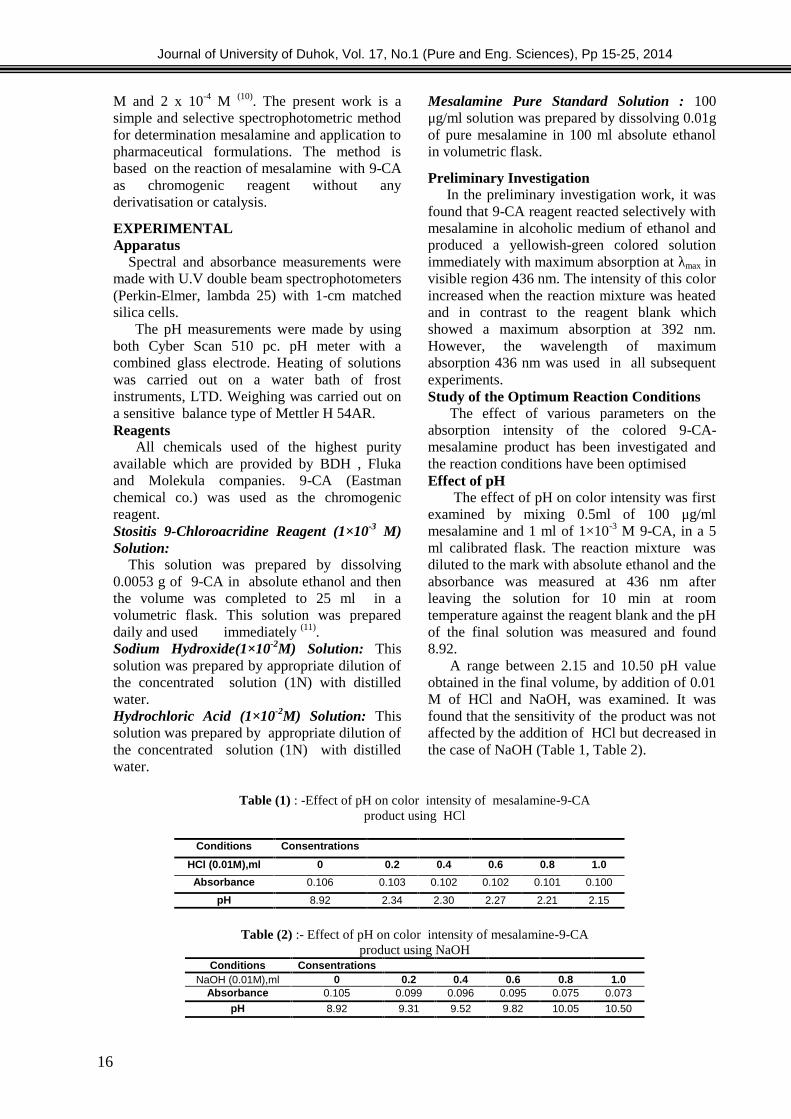
Fig. (2) Represents the electrical conductivityas a function of magnetic field (0mA, 10mA,30mA and 60mA),as well as, we study the effectof transverse magnetic field on these parametersare shown in figs.(3) and (4), fig. (5) Dischargeresistance versus magnetic field.
A metals has high conductivity () and lowresistivity () , while an insulator has lowconductivity but high resistivity.
Fig(1):I-Vcharatrestic at Glow discharge Mercury Plasma at pressure 0.025torr
0
500
1000
1500
2000
2500
3000
3500
0 0.05 0.1 0.15 0.2 0.25
Current Discharge (mA)
Vo
lta
ge
Dis
ch
arg
e (
vo
lt)
Im=0mA
Im=10mA
Im=30mA
Im=60mA
Fig.(1): I-V characteristic at Glow discharge mercury atpressure 0.025 torr
Table (1): I-V Characteristic without transverse Magneticfield (B= 0 Tesla)
Vd(volt) Id(mA) J= I/A E=V/d =J/E2000 0.01 3.247 11904.8 0.0002727272400 0.03 4.221 14285.7 0.0002954552600 0.04 5.195 15476.2 0.0003356642800 0.06 6.169 16666.7 0.000370133000 0.1 7.468 17857.1 0.000418182
Table (5): Average voltage as a function of averagedischarge current
Vd(volt) Id(mA) J= I/A E=V/d =J/E2500 0.15 16667 0 02500 0.04 62500 10 7.5362545 0.036 70694 30 22.612700 0.038 80130 60 45.21
Table (4): I-V Characteristic with transverse magneticfield (B= 45.2Tesla)
Vd(volt) Id(mA) J= I/A E=V/d =J/E2400 0.01 0.325 14285.7 2.27273E-052600 0.02 0.649 15476.2 4.1958E-052800 0.05 1.623 16666.7 9.74026E-053000 0.08 2.597 17857.1 0.000145455
Table (3): I-V Characteristic with transverse magneticfield (B=22.6Tesla)
Vd(volt) Id(mA) J= I/A E=V/d =J/E2400 0.01 0.325 11904.8 2.72727E-052600 0.02 0.649 14285.7 4.54545E-052800 0.05 1.299 15476.2 8.39161E-053000 0.08 1.948 16666.7 0.0001168833200 1.00 2.597 17857.1 0.000145455
Table (2): I-V Characteristic with transverse Magnetic field(B= 7.53Tesla)
Vd(volt) Id(mA) J= I/A E=V/d =J/E2000 0.01 0.325 11904.8 2.72727E-052400 0.03 0.974 14285.7 6.81818E-052600 0.04 1.299 15476.2 8.39161E-052800 0.06 1.948 16666.7 0.0001168833000 0.1 3.247 17857.1 0.000181818
Journal of University of Duhok, Vol. 17, No.1 (Pure and Eng. Sciences), Pp 1-5, 2014
4
Fig(2):Average Conductivity Versuses Magnetic Field
0
5
10
15
20
25
30
35
0 10 20 30 40 50
Magnetic Field (micT)
Ave
rag
e C
on
du
ctivity (
oh
m.m
)
P=0.75Torr
Fig.(2) Average conductivity versus magnetic field
Fig(3):Average Discharge Voltage versus magnetic field
2450
2500
2550
2600
2650
2700
2750
0 10 20 30 40 50
Magnetic Field(mT)
Av
era
ge
Vo
lta
ge
dis
ch
arg
e(v
olt
)
P=0.75torr
Fig.(3) Average discharge voltage versus magneticfield
Fig(4):Average Discharge current versus magnetic field
0
0.02
0.04
0.06
0.08
0.1
0.12
0.14
0.16
0 10 20 30 40 50
Magnetic field (mic.T)
Ave
rag
e D
isch
arg
e C
urr
en
t(m
A)
P=0.75torr
Fig.(4) Average discharge current versus magneticfield
Fig(5):Resistance Discharge Versus Magnetic Field
0
10000
20000
30000
40000
50000
60000
70000
80000
90000
0 10 20 30 40 50
Magnetic Field (microT)
Re
sist
an
ce D
isch
arg
e(o
hm
) P=0.75torr
Fig.(5) Resistance discharge versus magnetic Field
5. CONCLUSIONS
1. The (I-V) characteristic for glow discharge isanalogous completely to Abnormal GlowDischarge.2. The average voltage increases while thecurrent decreases with transverse magnetic fieldand this lead to decrease the electricalconductivity.3. The resistance glow discharge is increaseswith the electrical conductivity.4. Excellent agreement between theory andexperiment is observed, showing considerableimprovement upon previous calculations.
REFERENCES
- Qais, T. Algwari, Mosul University, Raf. Jour.
Sci., Vol. 18, No.2, pp.91-97, (2007)
- Ahmad, F. Abdulraman, Experimental
Investigation of Hollow Cathode at Glow
- Discharge, M.Sc Thesis, Duhok University,
College of Education,(2010)
- Escho, K. Yohana, Plasma Parameters of Hot
Cathode Discharge, M.Sc. Thesis, Duhok
University, College of Education, (2009)
- Akbar, DS, Experimental study of plasma
parameters in air and N2 glow discharge.
M.Sc. Thesis, College of Science, Mosul
University, (1996)
- Hippler, R., Kersten, H., Schmidt, M.,
Schoenbach, K.M., ed. "Plasma Sources". Low
Temperature Plasmas: Fundamentals,
Technologies, and Techniques (2 ed.). Wiley-
VCH. ISBN3-527-40673-5. 27, (2008)
- Chen, Francis F. Plasma Physics and Controlled
Fusion. Plenum Press. ISBN 0-306-41332-9.
28, (1984).
- Allen J. E. Phys. Plasmas 14, 024701, (2007).
- Adams J. R. etal, Electrical conductivity of noble
gases at high pressures, Phys.RevE, Statistical,
non linear, and soft matter physics,76,(2007)
- Kameda, studied the effect transverse magnetic
field (0-50G) on plasma parameters for plasma
Argon gas.(1979)

Journal of University of Duhok, Vol. 17, No.1 (Pure and Eng. Sciences), Pp 1-5, 2014
5
- Teruo Kaneda, The influence of a transverse
magnetic field on a glow discharge tube, J.
Light & Vis. Env., 2, No. 1, pp.45, (1979).
- Selvarajen and Natarjan., studied the effect axial
magnetic field (0-2050G) on breakdown
voltage for dry air (DC) negative glow
discharge for Argon gas at pressure range,
(0.4-0.5Torr.), (1982).
- Hassouba, M. A, The effect of magnetic field on
the Plasma parameters .J. Applied Physics,
14, pp131-135,(2001).
- Kanedn, Antoni, The plasma parameters of
Positive Column in a transverse magnetic
field, J. Physics, D, Appl, Phys. 12,PP 61-
69,(2000)
- Al-Badrani, F. Mohmammed, Effect of Axial
Magnetic Field on DC Glow Discharge
Plasma parameters, M.Sc. Thesis Collage of
Education, University of Mosul,(2005)
الخالصةة ومن هذه الخواص تم حساب التوصيلية الكهربائي.عملياً ) التيار- الفولطية( لقد تم في هذا البحث قياس خواص
.لتوليد المجال المغناطيسي المستعرض(0,30,60mA)عند مختلف التيارات تترواح قيمتها و التوصيلية ) التيار-الفولطية(وقمنا ايضاً بدراسة تأثير المجال المغناطيسي المستعرض على كالً من خواص
حظ ان الخواص مشابهة تماماً لخواص وقد لو .لغاز الزئبق (0.75torr)الكهربائية و مقاومة التفريغ التوهجي عند ضغط تحت التفريغ التوهجي ومعدل الفولطية يزداد والتيار يقل كلما زاد المجال المغناطيسي المستعرض ويؤدي بدوره الى
.ولوحظ ايضاً ان مقاومة التفريغ التوهجي تزداد بزيادة تيار المجال المغناطيسي المستعرض. نقصان التوصيلية الكهربائية
_
0.30,60 mA(
0.7

Journal of University of Duhok, Vol. 17, No.1 (Pure and Eng. Sciences), Pp 6-14, 2014
6
IMMUNOHISTOCHEMICAL MARKERS FOR RECOGNITION TISSUE OFORIGIN IN METASTATIC CANCERS
MAYADA I. YALDA,MELAD A. YALDA and BASHAR A. HASSAWI
School of Medicine, University of DuhoK, Kurdistan Region-Iraq
(Received: March 28, 2013; Accepted for publication: June 4, 2014)
ABSTRACTMetastatic cancer can be the first manifestation in patient with malignancy, where the primary
cancer's source is undetermined. The immunohistochemistry (IHC) is required in such cases, by usingcertain panels of immune-stains, to identify the cancer type or tissue of origin to determine the specifictherapy in the oncology unit. The aim of the study is to apply different IHC panels to tissue sections ofcases suspected to be metastatic cancers of undetermined origin by histopathological examination (H.P) topredict different tissue of origin and to clarify certain criteria of metastatic cancers including the type andmain primary and secondary sites. After reviewing 1316 cancer cases diagnosed by H.P from August 2009to December 2012, a total of 175 cases were diagnosed as metastatic cancers of undetermined origin.Panels of IHC markers were used to identify the type and tissue of origin. Among the 1,316 reviewedmalignant cases, 175 cases were diagnosed as secondary by histology. The IHC analysis showed that only162 of them were secondary cancers (12.3%). The commonest site of secondary at time of diagnosis wasthe abdominal cavity followed by the bone, lymph nodes, liver, lung, pleura and ovary. The IHC revealedthat carcinoma (62%) was the commonest type of metastasis followed by undifferentiated malignancy(16%), lymphoma, sarcoma, and neuroendocrine tumors. The commonest primary malignant site was theGIT (37%), metastasized to the abdomen cavity, bone, lymph nodes, liver and ovary. In conclusion the useof IHC is an important ancillary test to approach the diagnosis of secondary tumors and to identify theirtype and tissue of origin.
KEY WORDS: immunohistochemistry, metastasis, primary site, CUPs.
INTRODUCTION
etastasis is an important hallmarkof malignancy (Kumar et al, 2005). It
is theorized that metastasis always coincideswith a primary cancer. However, 4-10% ofpatients presenting to oncology units havemetastatic cancer of unknown primary site (alsocalled CUP). CUPs are heterogeneous groups ofmetastatic cancer for which the site of origincannot be identified at the time of diagnosis(Pavlidis et al, 2010). However most studiesinvolve minimum investigations before the termis used. The patient should have a biopsy-provenmalignancy, a detailed history, physicalexamination, lab and radiological studies(Briasoulis and Pavlidis, 1997,abdArmstrong and Blackhall, 2007). Otherstudies have shown that, if simple questioningdoes not reveal the cancer's source (coughing upblood—"probably lung", urinating blood—"probably bladder"), complex imaging will noteither. In some of these cases a primary tumormay appears later. In rare cases (e.g.,of melanoma), no primary tumor is found, evenon autopsy. It is therefore thought that someprimary tumors can regress completely, but
leave their metastases behind (Briasoulis andPavlidis, 1997, and American Cancer Society,2007).
In order to permit an easier way to giveidentity to many of these metastases, one mayrecall the theory of "the organ-specific targets"which stated that there is a propensity for certaintumors to seed in particular organs. This wasfirst discussed as the "seed and soil" theory. Forexample, stomach cancer often metastasizes tothe ovary in women, causing Krukenberg tumor(Robert Weinberg, 2007).
In many cases the cells in a metastatic tumorresemble those in the primary tumor and apathologist can tell whether that type of cell isnormally found in the part from which the tissuesample was taken. Still, the determination of theprimary tumor can sometimes be very difficult,and pathologist has to use several adjuvanttechniques, such as immunohistochemistry(IHC). Some studies have demonstrated that IHCcan identify unique subsets of CUPs, and thatorgan-specific chemotherapy for these subsetsmay have benefit (Varadhachary, et al, 2008,Horlings HM, et al, 2008.). Approach to theselesions begins with the use of certain select
M

Journal of University of Duhok, Vol. 17, No.1 (Pure and Eng. Sciences), Pp 6-14, 2014
7
panels of immune-stains, based on the site andthe histopathology impression of the tumor, bothare extremely useful to narrow the diagnosticconsiderations, if not definitively identify thetumor. For example: in lymph nodes, epithelioidneoplasm most commonly represents large celllymphomas or metastases of visceral carcinomasand malignant melanomas. The separation ofthese differential diagnostic possibilitiesprincipally involves the use of antibodies toCD45 (for lymphomas), Cytokeratin (forcarcinomas), and S100 (for melanomas) (Lotanet al, 2009).Then further markers should be useto classify the carcinoma and other cancers(Tot T, 2002).
PATIENTS AND METHODS
This study was conducted from August 2009to December 2012, by reviewing 1316(irrespective to the age and sex of the patients)cancer cases diagnosed in the central lab ofDuhok/ Iraq. From these cancers 175 werediagnosed as cancers of undetermined originhistologically by using the conventionalhistopathology stain.
The paraffin embedded blocks (PEBs) ofthose patients containing the cancer tissues wereselected to perform the immune-histochemicalstaining protocol according to the AvidinBiotin Complex (ABC) detection system(Mangham et al 2000).
Sections from the PEBs where obtained in a 4microns thickness and placed on positivelycharged slides together with adjacent parallelcontrol sections which were processed with eachset of staining for the IHC. Primary andsecondary antibody kits were used, provided bythe DAKO (an American company forTechnologies), detected with the Envision+system that employs peroxidase-labeled polymerconjugated to anti-mouse immunoglobulinantibodies. Immune complexes were identifiedby using peroxidase reaction with DAB+ aschromogen (Envision+ detection system, K4006,Dako Corp, Carpinteria, CA). The markers wereused in panels, as shown in text table, accordingto the distinguishing microscopic characteristics,whether the malignant cells are large, small,spindle or forming glands, but in general the firstpanel consists mainly of the combination of fourmarkers: Cytokeratin (for epithelial cells) as carcinomamarker CD45 as lymphoid marker S100 as melanoma marker
Vimentin as mesenchymal markerA second and a third panel of IHC carried
out according to the results of the previouspanel. Other markers used in IHC panels are alllisted in the text table (Miettinen, 1993, andBahrami et al, 2008).
RESULTS
This is a descriptive study of theundetermined (175) cases (13.3%). They wereanalysis and investigated by The IHC. Thesecondary tumors were proven in (162) cases12.3%. The other (13) cases 1% were primaryundifferentiated cancers and they were excludedfrom the study.
The age ranged from 1 to 92 years, with amean age on presentation of 51 years. Theyoungest patient (1 year old boy) presented withsarcoma and the oldest patient (92 years oldfemale) with lymphoma. The male to femaleratio was 1.3:1 (92 males 70 females). Thecommonest sites of secondary in descendingorder were the abdominal cavity (peritoneum)(37) cases, 23% followed by the bone (28) 17%,lymph nodes (24) 15%, liver (14) 9%, lung (13)8%, pleura and ovary (11) 7% for each. Other,less common areas are skin and subcutaneoustissues, colon, soft tissue, stomach, esophagus,testis, brain and breast as shown in figure 1.
After applying different IHC markers, thatare available in the central lab, the 162 cancerswere classified according to the tissue of originand the types of their putative malignant cells.Carcinoma was the commonest type included(100) case 62% followed by undifferentiatedmalignancy in (26) 16%, lymphoma (19) 12%,sarcoma (8) 5%, neuroendocrine tumors (5) 3%,Melanoma and malignant germ cell tumors (2)1% for each one of them (figure 2). The relationof these types to the metastatic site at time ofdiagnosis is shown in table 1. The commonestprimary origin (when detected) was the GITwhich metastasized to the abdomen cavity(peritoneum, as shown in figure 3), bone, lymphnodes, liver and ovary. The 100 cases ofcarcinoma were further divided by IHC analysisinto: adeno-carcinoma (66) cases 40.1%, poorlydifferentiated carcinoma in (28) 17.3%,squamous cell carcinoma (4) 2.5%, transitionalcell carcinoma (2) 1.2% (Figure 2). No cluecould be given on the primary site in cases of theundifferentiated cancer and the poorlydifferentiated carcinoma (54) cases for each ofthem and this represents 3.5% out of total (1316)malignant cases included in this study.

Journal of University of Duhok, Vol. 17, No.1 (Pure and Eng. Sciences), Pp 6-14, 2014
8
Text Table:- Panels of IHC markers used for different types of tissue.First panel Types
(Histogenesis)Second panel Organ
(Histogenesis)Third panel*
Cytokeratin Carcinoma(epithelial cells)
CK20+ CK7- Colorectal CEAEMA
Thyroglobulin
PSA
GCDFP-15
TTF-1
Uroplakin
ER
CA-125
CK20- CK7+ Adenocarcinoma lung, breast,ovary (non-mucinous),endometrium, thyroid
CK20+ CK7+ Adenocarcinoma stomach, biliarytract, pancreas, ovary
(mucinous), transitionalcaecinoma
CK20- CK7- Carcinoma prostate, renal,adrenal cortex, hepatocellular,
squamous carcinoma.**CD45 Lymphoma B cell marker+ B cell lymphoma Bcl6, **CD3, CD5, CD10, CD20,..
T cell marker+ T cell lymphomaS100 Melanoma and
some othersHMB45+,melanA+
Melanoma
**CD99+ Ewing's sarcoma/PNETVimentin Mesenchymaltumor Myoglobin Skeletal muscle Put in mind the Co-expression of
vimentinwith carcinoma (carry outother markers)
Sooth muscleactin+
Desmin+
Leiomyosarcoma
**CD117+ Gastrointestinal stromal tumor**CD34+ Vascular tumors
OthersNeuroendocrine and germ cell
tumor
A-PLAP+ Germ Cell Tumor Markers Markers to exclude certain primarytumors e.g. To excludedMesothelioma(CalretininCK5/6WT1) all negative
OCT3/4+Alpha-
fetoprotein+b-HCG+
Chromogranin Neuroendocrine tumorSynaptophysin
NSE
* The results of panel 3 depend on the positive and negative combination.** CD stands for cluster of differentiation
CK7: Cytokeratin 7, CK20: Cytokeratin 20, CEA:Carcinoemberionicantigene, EMA: Epithelial membraneantigen, PSA: Prostate-specific antigen, GCDFP-15: Grosscystic disease fluid protein-15, TTF-1: Thyroidtranscription factor-1,ER: Estrogens receptors, CA-125:Cancer antigen 125, Bcl-6: B-cell lymphoma 6,
HMB45: Human melanoma black 45,PNET: Primitiveneuroectodermaltumor,PLAP:Anti-Placental alkalinephosphatase,OCT3/4: octamer-binding transcriptionfactor3/4, b-HCG: beta- Human chorionic gonadotropin,NSE: Neuron-Specific Enolase, CK5/6: Cytokeratin 5/6,WT-1: Wilms tumor protein1

Journal of University of Duhok, Vol. 17, No.1 (Pure and Eng. Sciences), Pp 6-14, 2014
9
Fig.(1):- Metastatic sites at time of diagnosis
Fig.( 2): -Types of malignancy accurding to the histogenesis.
37
2824
0
5
10
15
20
25
30
35
40
2
26 194
28
66
100
0
20
40
60
80
100
120
Journal of University of Duhok, Vol. 17, No.1 (Pure and Eng. Sciences), Pp 6-14, 2014
9
Fig.(1):- Metastatic sites at time of diagnosis
Fig.( 2): -Types of malignancy accurding to the histogenesis.
24
14 13 11 116 5 4 2 2
198 5 2 2
Transitional cell carcinoma 2
Squamous cell carcinoma 4
Poor differentiated carcinoma 28
Adenocarcinoma 66
ALL CARCINOMA 100
Journal of University of Duhok, Vol. 17, No.1 (Pure and Eng. Sciences), Pp 6-14, 2014
9
Fig.(1):- Metastatic sites at time of diagnosis
Fig.( 2): -Types of malignancy accurding to the histogenesis.
2 2 2 1
Transitional cell carcinoma 2
Squamous cell carcinoma 4
Poor differentiated carcinoma 28
Adenocarcinoma 66
ALL CARCINOMA 100

Journal of University of Duhok, Vol. 17, No.1 (Pure and Eng. Sciences), Pp 6-14, 2014
10
Table(1):- Metastatic site at time of diagnosis versus IHC diagnosis of tissue of origin
Metastaticsite at time of
diagnosis
IHC diagnosis of tissue of origin Total
Carcinoma Undiffere-ntiated
Lymphoma Sarcoma Neuro-endocrine
Melanoma Germcell
tumor
No %
abdomen cavity& peritoneum
22 3 6 3 1 0 2 37 23%
Bone 19 5 3 0 1 0 0 28 17%Lymph nodes 14 5 0 1 2 2 0 24 15%
Liver 10 4 0 0 0 0 0 14 9%Lung 7 4 0 2 0 0 0 13 8%
Pleura 8 3 0 0 0 0 0 11 7%
Ovary 10 0 1 0 0 0 0 11 7%Skin &
subcutaneous3 1 1 1 0 0 0 6 4%
Colorectal 3 0 2 0 0 0 0 5 3%Soft tissue 1 0 1 1 1 0 0 4 2%Stomach 0 0 2 0 0 0 0 2 1%
Esophagus 2 0 0 0 0 0 0 2 1%Testis 0 0 2 0 0 0 0 2 1%Brain 1 1 0 0 0 0 0 2 1%
Breast 0 0 1 0 0 0 0 1 1%Total 100 26 19 8 5 2 2 162 100%
Fig.(3):- A-F Mass in the peritoneum of female patient, metastasized from the colon. A, H&E stain X 4 HPF. B,H&E stain X 10HPF. C, IHC positive stain for CEA. D, IHC positive stain for CK20. E, IHC negative stain for
CA125. F, IHC negative stain for CK7.
A B
C D
E F

Journal of University of Duhok, Vol. 17, No.1 (Pure and Eng. Sciences), Pp 6-14, 2014
11
DISCUSSION
The definition of cancer of unknown primarysite (CUP) varies greatly from a study toanother. Consensus has not been reached onwhether CUP is simply a malignancy ofundefined origin (MUO) or a distinct entity withspecific genetic characteristics. It is possible thatboth subsets coexist (Armstrong and Blackhall,2007). CUPs accounts for 4-10% of malignancy(Armstrong and Blackhall, 2007, and AmericanCancer Society, 2007).
Improvement in radiological investigationsdecreased the percentage to 3-7% (AmericanCancer Society, 2013). The relatively highpercentage of malignancy of unknown originseen in this study could be attributed and relatedto the improper evaluation of the cases and theshortage (lack) of important advancedradiological diagnostic techniques. Theapplication of IHC decreased our percentage ofCUP from 12.3 to 3.5%. The main reason tolook for the primary site is to guide treatment,especially for cancers that respond well tospecific chemotherapy or hormone drugs and toexpect the outcome and prognosis (Jerusalem etal, 2006). Regarding the age and sex in thisstudy was in agreement with other studies. Mostseries reviewing CUP patient groups gave anapproximate equal incidence for men andwomen and a median age on presentation forboth sex ranged 59-66 years (Glover et al, 2008,and Greco and Hainsworth, 2008).
The site of metastases on presentation alsovaries in different studies. Briasoulis E. (1997)reported the liver and bone then the lung andlymph nodes as the commonest metastases sites(Briasoulis and Pavlidis, 1997).
Rades D, et al (2001) found that commonestpresenting metastatic sites were lymph nodesand visceral organs. The National CancerInstitute (2008) declared that lungs, liver, brain,and bones are the most common metastasis sitesseen in solid tumors. In the current study theperitoneum was the commonest site ofmetastases, this was in agreement with theresults of other series (Agarwal et al, 2004 andShaw and Sobin, 2006). LevyAD et al (2008)also found that the peritoneal cavity is the mostcommon side for secondary cancers and considerit as a merrier for carcinomas of gastrointestinaltract and ovary (LevyAD et al, 2008).
In the past, peritoneal metastases wereconsidered as a final stage of cancer, andpatients were offered a palliative chemotherapy.
In 2003 and the following years, prolongedsurvival of patients was reported in randomizedtrials, after recognition and treating primary siteand treating the peritoneal metastases with apreoperative hyper-thermic intra-peritonealchemotherapy (Verwaal et al, 2003,Sugarbaker,2009, and Yonemura et al, 2010).
In the current study as in the majority of otherstudies (American Cancer Society, 2013) CUPswere mainly adenocarcinomas andundifferentiated tumors; less commonly,squamous cell carcinoma, melanoma andsarcoma.Secondary metastasis is the main presentation
of about 2-6% of cancer’s patients in whichinvestigations fail to find the primary site lesion.(Sendler A, et. 2008)
The development and application of moresophisticated diagnostic tests will decrease theincidence and prevalence of CUP. However,CUP follows an aggressive biological andclinical behavior, with a median survival rangingfrom only 2 to 10 months (Pavlidis and Fizazi,2009). Nevertheless, it can be hypothesized thatdetection of a primary tumor may optimizetreatment planning, which, in turn, may improvepatient outcome. Indeed, some studies haveshown that the survival of patients in whom aprimary tumor was eventually detected washigher than in patients in whom the primarytumor remained undetected (Raber et al, 1991and Haas et al, 2002).Sometimes the primary sitecannot be determined even at postmortemexamination (Neumann and Nystrom 1982).
CONCLUSION
The appropriate use and interpretation of IHCis necessary to differentiate primary fromsecondary tumor and to minimize the list ofpossible origin in CUP. The lack of a generallyagreed definition of CUP has limited the abilityto obtain accurate data about incidence andoutcome for this group of patients. In the nearfuture, an advanced multi-parametric approach,including the use of CT scan or whole-bodyMRI techniques, IHC and molecular technologyis expected to decrease the incidence of CUPand improve the therapeutic management andsurvival in patients diagnosed with primary ofunknown primary origin.

Journal of University of Duhok, Vol. 17, No.1 (Pure and Eng. Sciences), Pp 6-14, 2014
12
REFERENCES Agarwal A, Yeh BM, Breiman RS et-al.
(2004).Peritoneal calcification: causes anddistinguishing features on CT. AJR Am JRoentgenol.182 (2): 441-5.
American Cancer Society.(2013). Cancer Facts andFigures. Atlanta, Ga: American Cancer Society2013.
American Cancer Society. Statistics for 2007. AmericanCancer Society Statistics. Available at http://www.cancer.org/Research/CancerFactsFigures/index.Accessed July11, 2007.
Armstrong AC, Blackhall FH (2007). Management ofcancer from an unknown primary. Expert OpinPharmacother; 8:445-55.
Bahrami A., Truong L. D., Ro J.Y.(2008). Undifferentiated tumor: True identity byimmune-histochemistry. Arch Pathol LabMed 132, 326–48.
Briasoulis E, Pavlidis N (1997). "Cancer of UnknownPrimary Origin". Oncologist 2 (3): 142–52.
Glover KY, Varadhachary GR, Lenzi R, et al. (2008).Unknown primary cancer. In: Abeloff MD,Armitage JO, Lichter AS, Niederhuber JE. KastanMB, McKenna WG.eds.Clinical Oncology. 4th ed.Philadelphia, Pa; Elsevier;: 2057-74.
Greco FA, Hainsworth JD. (2008). Cancer of unknownprimary site. In: DeVita VT, Lawrence TS,Rosenberg SA, eds. DeVita, Hellman, andRosenberg's Cancer: Principles and Practice ofOncology. 8th ed. Philadelphia, Pa: LippincottWilliams & Wilkins; 2363-87.
Haas I, Hoffmann TK, Engers R, Ganzer U.(2002).Diagnostic strategies in cervical carcinomaof an unknown primary (CUP) Eur ArchOtorhinolaryngol. 9:323–25.
Horlings HM, van Laar RK, Kerst JM, et (2008)Gene expression profiling to identify the histo-genetic origin of metastatic adeno-carcinomas ofunknown primary. J Clin Oncol 26:4435–4441.
Jerusalem G, Rorive A, Ancion G, et al.(2006).Diagnostic and therapeutic management ofcarcinoma of unknown primary: radio-imaginginvestigations. Ann Oncol. Sep;17Suppl 10:x168-176
Kumar, Vinay; Abbas, Abul K; Fausto, Nelson;Robbins, Stanley L; Cotran, Ramzi S(2005). Robbins and Cotran pathologic basis ofdisease (7th Ed.). Philadelphia: ElsevierSaunders. 978-187-8.
LevyAD, Arnáiz J, Shaw JC, Sobin LH. (2008).Primary peritoneal tumors: imaging features withpathologic correlation. RadioGraphics; 28: 583–607.
Lotan TL, Ye H, Melamed J, Wu XR, Shih Ie M, et al.(2009). Immunohistochemical panel to identify theprimary site of invasivemicropapillarycarcinoma.Am J SurgPathol 33:1037–41.
Mangham DC, Bradwell AR, Isaacson PG.(2000).MICA-a highly sensitive and avidin-free immune-
histochemical detection system. dvAnatPathol. Nov; 7 (6):360-4.
Miettinen M. Keratin (1993).Immunohistochemistry:update of applications and pitfalls. PatholAnnu ; 28:113–43
National Cancer Institute: Metastatic Cancer: Retrievedon 2008-11-01
Pavlidis N, Briasoulis E, Pentheroudakis G (2010).Cancers of unknown primary site: ESMO ClinicalPractice Guidelines for diagnosis, treatment andfollow-up. Ann Oncol 21: Suppl 5v228–31.
Pavlidis N, Fizazi K. (2009). Carcinoma of unknownprimary (CUP) Crit Rev OncolHematol. ; 69:271–278.
Raber MN, Faintuch J, Abbruzzese JL, Sumrall C, FrostP. (1991).Continuous infusion 5-fluorouracil,etoposide and cis-diamminedichloroplatinum inpatients with metastatic carcinoma of unknownprimary origin. Ann Oncol. 2:519–20.
Rades D, Kühnel G, Wildfang I, Börner AR, SchmollHJ, Knapp W. (2001). Localised disease in cancerof unknown primary (CUP): the value of positronemission tomography (PET) for individualtherapeutic management. Germany Ann Oncol.Nov;12(11):1605-9.
Ringenberg QS (1985).Tumors of unknown origin. MedPediatrOncol 13 (5): 301-6.
Robert Weinberg, (2007). The Biology of Cancer, citedin Basics: A mutinous group of cells on a greedy,destructive task, by Natalie Angier, New YorkTimes, 3 April
Sendler A, et. Carcinoma of unknown primary site(CUP syndrome). Chirurg. 2008 Jul;79(7):689-95
Shaw JC, Sobin LH. (2006). Secondary tumors andtumorlike lesions of the peritoneal cavity: imagingfeatures with pathologic correlation. Radiographics.29 (2): 347-73.
Sugarbaker P. H., (2009). “Epithelial appendicealneoplasms,” Cancer Journal, vol. 15, no. 3, pp.225–35.
Tot T (2002).Cytokeratins 20 and 7 as biomarkers:usefulness in discriminating primary frommetastatic adenocarcinoma. Eur J Cancer 38: 758–63.
V. J. Verwaal, S. Van Ruth, E. De Bree et al., (2003).“Randomized trial of cytoreduction andhyperthermicintraperitoneal chemotherapy versussystemic chemotherapy and palliative surgery inpatients with peritoneal carcinomatosis of colorectalcancer,” Journal of Clinical Oncology, vol. 21, no.20, pp. 3737–43.
Varadhachary GR, Raber MN, Matamoros A,Abbruzzese JL (2008).Carcinoma of unknownprimary with a colon-cancer profile-changingparadigm and emerging definitions. Lancet Oncol9: 596–99.
Y. Yonemura, A. Elnemr, Y. Endou, et al.,(2012).“Effects ofneoadjuvantintraperitoneal/systemic chemotherapy(bidirectional chemotherapy) for the treatment ofpatients with peritoneal metastasis from gastriccancer,” International Journal of SurgicalOncology, vol. 2012, Article ID 148420, p. 8.

Journal of University of Duhok, Vol. 17, No.1 (Pure and Eng. Sciences), Pp 6-14, 2014
13
IHC
IHC
1316
20092012175
IHC
1316175 IHC 162)12.3 (%
IHC
IHC

Journal of University of Duhok, Vol. 17, No.1 (Pure and Eng. Sciences), Pp 6-14, 2014
14
شرة داخل الجسمأي للسرطانات المنتمنشمعلمات الصبغات الكيميائية النسيجية المناعية في معرفة النسيج الالخالصة
غير المنشأحيث يكون النسيج , ان تمثل العارض األول لمرضى السرطاناتالمنتشرةيمكن للسرطانات : الخلفيةعن طريق , ضروريا)IHC(المناعية في مثل هذه الحاالت يكون استخدام الصبغات الكيميائية النسيجية. معروف
.ي مراكز العالجألعطاء العالج المناسب فالمنشأمتعاقبه للمعلمات المناعية لمعرفة نوع السرطان أو النسيج مجموعةلحاالت تشخص بواسطة التحليل النسيجي المرضي المعتاد كسرطانات متعاقبهمجموعةبIHCاستخدام :الهدف
مثل نوع السرطانات والمصادر الرئيسيه لها , منتقلة وذلك لمعرفة النسيج األولي ودراسه بعض خصائص هذه السرطانات.واألماكن الرئيسيه ألنتشارها
العراق، من اب / حاله سرطان تم تشخيصهم في المختبر المركزي في دهوك 1316بعد مراجعة: والطرقالمرضى غير معروفة األصل بواسطة شرةحاله منهم شخصت على أنها سرطانات منت175وجد أن , 2012إلى كانوناألول 2009
تم اختيار هذه . يد نوع وأصل الورملتحدIHCتم استخدام جداول لمعلمات مختلفة من . التحليل النسيجي المرضي.المجموعات اعتمادا على النتائج لمختلف جداول المعلمات
. بواسطة التحليل النسيجي المرضيشرة حاله كسرطان منت175تم تشخيص , حالة سرطان1316من أصل : النتائجوقع الرئيسي لألنتقال في وقت الم. منهم هي فعال سرطان منتقل%)12,3(حاله 162وجد ان فقط IHCبعد استخدام
أن IHCكشف تحليل . غشاء الرئه والمبيض, الرئه, الكبد, العقد اللمفاويه, النشخيص هوالتجويف البطني يعقبه العظم, ثم السرطان اللمفاوي, يليه السرطان الغير متمايز, شرةسرطانات الخاليا البطانيه هوالنوع األول للسرطانات المنت
لقد كان المصدر األولي للسرطانات المنتقله هوالجهاز الهضمي حيث . والسرطان العصبي الصماوي, والسرطان الحشويالكبد والمبيض , العقد اللمفاويه, كان انتقاله بشكل اساسي الى التجويف البطني يعقبه العظم
نتقل واألولي وللتحقق من للتمييز بين السرطان المكتشخيص مساعد هامIHCلقد تم تاكيد اهمية تقنية :االستنتاج.نوع السرطان والنسيج األولي له وذلك ألعطاء العالج المناسب

Journal of University of Duhok, Vol. 17, No.1 (Pure and Eng. Sciences), Pp 15-25, 2014
15
SPECTROPHOTOMETRIC DETERMINATION OF MASALAMINEUSING 9-CHLOROACRIDINE REAGENT–FOR SOME
PHARMACEUTICAL FORMULATIONS
SUZAN AHMED ALI* , Shrieen Othman** and Theia'a Najim Al-Sabha****Directorate of Education-Sumeal
** Dept. of Chemistry , Faculty of Science, University of Zakho, Kurdistan Region-Iraq*** Dept. of Chemistry , College of Education , University of mosul-Iraq
(Received: June 23, 2013; Accepted for publication: February 3, 2014)
ABSTRACTA spectrophotometric method is proposed for the determination of mesalamine drug in their pure forms and in
pharmaceutical formulations, based on the product formation reaction with 9-chloroacridine (9-CA). The molarabsorptivity values are 1.8×10³ L.mol-1.cm-1 and the lower limit of detection (LOD) and limit of quantitation (LOQ)are 1.8733 and 5.676 μg/ml respectively. The stoichiometry of the drug-9-CA product was found to be 1:1. Theprocedure is characterised by its simplicity with good accuracy and precision and no interference was observed fromcommon pharmaceutical excipients. The proposed method was applied successfully for the determination ofmesalamine in their pharmaceutical formulations and the obtained results were statistically compared with thosegiven by the official method.
KEYWORDRS: Spectrophotometric, Mesalamine, 9-Chloroacridine.
INTRODUCTION
esalamine also known as mesalazine,chemically known as 5-aminosalicylic
acid(5-ASA) was used for its local effects in thetreatment of inflammatory bowel disease,including ulcerative colitis and Crohn’s disease(1,2). Despite the fact that it has been used forover 50 years, the mechanism of action of thisdrug remains unkown. Mesalamine has beenshown to be a potent scavenger of reactiveoxygen species that play a significant role in thepathogenesis of inflammatory bowel disease,inhibition of natural killer cell activity, inhibitionof antibody synthesis, inhibition of cyclo-oxygenase and lipoxygenase pathways andimpairment of neutrophil function (3,4).
5-Aminosalicylic acid(5-ASA)
Many Spectrophotometric methods dependingon using various reagent have been reported forthe determination of mesalamine drug. p-Dimethyl amino benzaldehyde, 2,2-–bipyridyl orpotassium ferricyanide in the presence of ferricchloride(5), N-(1-naphthyl)ethylenediaminedihydrochloride(6), tetracyanoethylene (TCNE)
and 2,3-dichloro-5,6-dicyano-1,4-benzoquinone(DDQ)(7) are used for the determination ofmesalamine. The HPLC method, for thedetermination of mesalamine, adopted by theBritish Pharmacopoeia (BP) was used the mobilephase containing glacial acetic acid, methanoland methyl isobutyl ketone (10:40:50 v/v)(8).Nanostructured nickel-aluminum layered doublehydroxide (Ni-Al LDH) was synthesized and thepotential of the obtained material, as solid-phaseextraction (SPE) sorbent, for the separation andpre-concentration of the trace amount ofmesalamine was assessed using column method.The retained analyte on Ni-Al LDH was elutedwith NaOH solution and the concentration of theelueted mesalamine was thenspectrofluorometrically determined at λem = 480nm with excitation at λex = 340 nm. Thecalibration graph for the pre-concentrationsystem was linear in the range of 0.1-45.0 μg/ml(9).
The oxidative behavior of mesalamine hasbeen investigated by differential pulsevoltammetry using a glassy carbon electrode indifferent buffer systems. Linear sweepvoltammetry was used to study the influence ofpH on the peak current and peak potential. TheBritton-Robinson buffer of pH 1.81 was selectedas a suitable analytical medium in whichmesalamine exhibited a sensitive diffusioncontrolled oxidative peak at 0.564 V (vs.Ag/AgCl). The peak current varied linearly withdrug concentration in the range between 1 x 10⁻⁶
M
Journal of University of Duhok, Vol. 17, No.1 (Pure and Eng. Sciences), Pp 15-25, 2014
16
M and 2 x 10⁻⁴ M (10). The present work is asimple and selective spectrophotometric methodfor determination mesalamine and application topharmaceutical formulations. The method isbased on the reaction of mesalamine with 9-CAas chromogenic reagent without anyderivatisation or catalysis.
EXPERIMENTALApparatus
Spectral and absorbance measurements weremade with U.V double beam spectrophotometers(Perkin-Elmer, lambda 25) with 1-cm matchedsilica cells.
The pH measurements were made by usingboth Cyber Scan 510 pc. pH meter with acombined glass electrode. Heating of solutionswas carried out on a water bath of frostinstruments, LTD. Weighing was carried out ona sensitive balance type of Mettler H 54AR.Reagents
All chemicals used of the highest purityavailable which are provided by BDH , Flukaand Molekula companies. 9-CA (Eastmanchemical co.) was used as the chromogenicreagent.Stositis 9-Chloroacridine Reagent (1×10⁻³ M)Solution:
This solution was prepared by dissolving0.0053 g of 9-CA in absolute ethanol and thenthe volume was completed to 25 ml in avolumetric flask. This solution was prepareddaily and used immediately (11).Sodium Hydroxide(1×10⁻²M) Solution: Thissolution was prepared by appropriate dilution ofthe concentrated solution (1N) with distilledwater.Hydrochloric Acid (1×10⁻²M) Solution: Thissolution was prepared by appropriate dilution ofthe concentrated solution (1N) with distilledwater.
Mesalamine Pure Standard Solution : 100μg/ml solution was prepared by dissolving 0.01gof pure mesalamine in 100 ml absolute ethanolin volumetric flask.
Preliminary InvestigationIn the preliminary investigation work, it was
found that 9-CA reagent reacted selectively withmesalamine in alcoholic medium of ethanol andproduced a yellowish-green colored solutionimmediately with maximum absorption at λmax invisible region 436 nm. The intensity of this colorincreased when the reaction mixture was heatedand in contrast to the reagent blank whichshowed a maximum absorption at 392 nm.However, the wavelength of maximumabsorption 436 nm was used in all subsequentexperiments.Study of the Optimum Reaction Conditions
The effect of various parameters on theabsorption intensity of the colored 9-CA-mesalamine product has been investigated andthe reaction conditions have been optimisedEffect of pH
The effect of pH on color intensity was firstexamined by mixing 0.5ml of 100 μg/mlmesalamine and 1 ml of 1×10⁻³ M 9-CA, in a 5ml calibrated flask. The reaction mixture wasdiluted to the mark with absolute ethanol and theabsorbance was measured at 436 nm afterleaving the solution for 10 min at roomtemperature against the reagent blank and the pHof the final solution was measured and found8.92.
A range between 2.15 and 10.50 pH valueobtained in the final volume, by addition of 0.01M of HCl and NaOH, was examined. It wasfound that the sensitivity of the product was notaffected by the addition of HCl but decreased inthe case of NaOH (Table 1, Table 2).
Table (1) : -Effect of pH on color intensity of mesalamine-9-CAproduct using HCl
Table (2) :- Effect of pH on color intensity of mesalamine-9-CAproduct using NaOH
ConsentrationsConditions1.00.80.60.40.20NaOH (0.01M),ml
0.0730.0750.0950.0960.0990.105Absorbance
10.5010.059.829.529.318.92pH
ConsentrationsConditions
1.00.80.60.40.20HCl (0.01M),ml
0.1000.1010.1020.1020.1030.106Absorbance
2.152.212.272.302.348.92pH
Journal of University of Duhok, Vol. 17, No.1 (Pure and Eng. Sciences), Pp 15-25, 2014
17
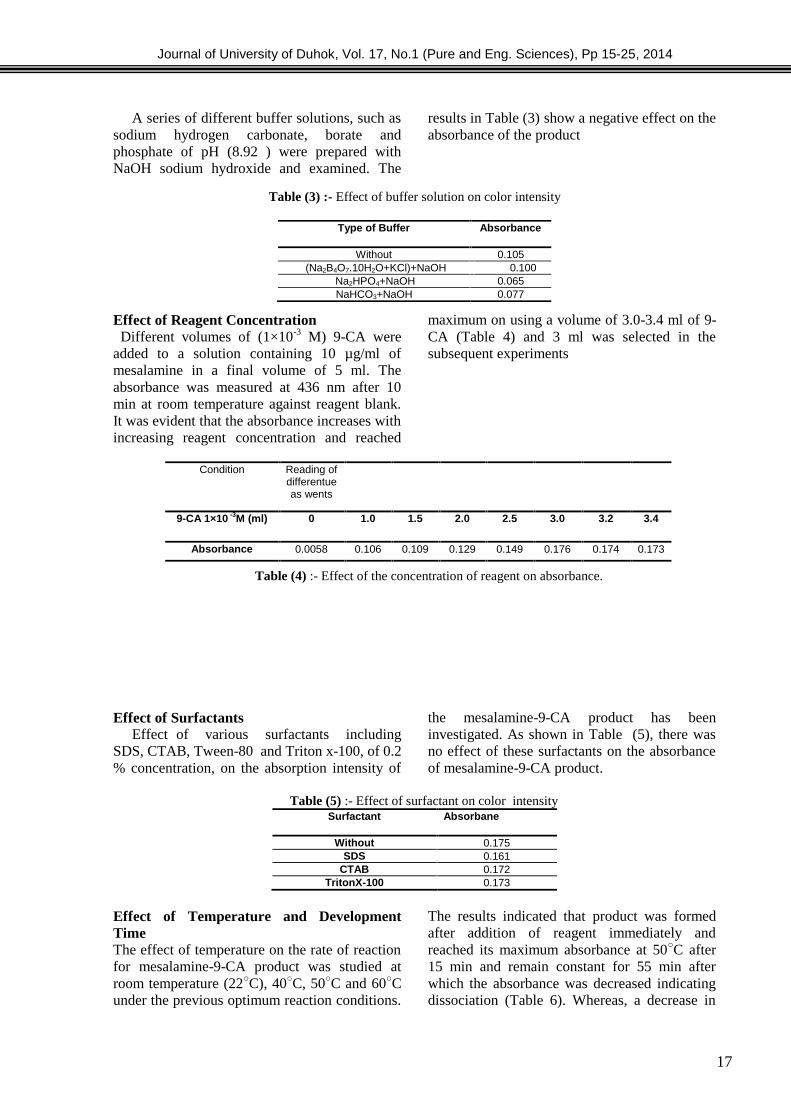
A series of different buffer solutions, such assodium hydrogen carbonate, borate andphosphate of pH (8.92 ) were prepared withNaOH sodium hydroxide and examined. The
results in Table (3) show a negative effect on theabsorbance of the product
Table (3) :- Effect of buffer solution on color intensity
Effect of Reagent ConcentrationDifferent volumes of (1×10⁻³ M) 9-CA were
added to a solution containing 10 µg/ml ofmesalamine in a final volume of 5 ml. Theabsorbance was measured at 436 nm after 10min at room temperature against reagent blank.It was evident that the absorbance increases withincreasing reagent concentration and reached
maximum on using a volume of 3.0-3.4 ml of 9-CA (Table 4) and 3 ml was selected in thesubsequent experiments
Table (4) :- Effect of the concentration of reagent on absorbance.
Effect of SurfactantsEffect of various surfactants including
SDS, CTAB, Tween-80 and Triton x-100, of 0.2% concentration, on the absorption intensity of
the mesalamine-9-CA product has beeninvestigated. As shown in Table (5), there wasno effect of these surfactants on the absorbanceof mesalamine-9-CA product.
Table (5) :- Effect of surfactant on color intensitySurfactant Absorbane
Without 0.175SDS 0.161
CTAB 0.172TritonX-100 0.173
Effect of Temperature and DevelopmentTimeThe effect of temperature on the rate of reactionfor mesalamine-9-CA product was studied atroom temperature (22○C), 40○C, 50○C and 60○Cunder the previous optimum reaction conditions.
The results indicated that product was formedafter addition of reagent immediately andreached its maximum absorbance at 50○C after15 min and remain constant for 55 min afterwhich the absorbance was decreased indicatingdissociation (Table 6). Whereas, a decrease in
Type of Buffer Absorbance
Without 0.105(Na2B4O7.10H2O+KCl)+NaOH 0.100
Na2HPO4+NaOH 0.065NaHCO3+NaOH 0.077
Reading ofdifferentueas wents
Condition
3.43.23.02.52.01.51.009-CA 1×10 -3M (ml)
0.1730.1740.1760.1490.1290.1090.1060.0058Absorbance

Journal of University of Duhok, Vol. 17, No.1 (Pure and Eng. Sciences), Pp 15-25, 2014
18
absorbance with increased temperature wasnoticedindic
ating dissociation.
Table (6) : -Effect of
temperature on the formation and stability of the mesalamine-9-CA product
However; the optimum reaction conditions for determination of mesalamine have beensummarized in Table (7).
Table (7) :- Summary of optimum conditions for the determinationof mesalamine
Final Absorption SpectraUsing the optimum condition described
previously, the absorption spectra were recordedwithin 382 and 600 nm(Fig. 1). The yellow dyeformed gave maximum absorption at 436 nm for
mesalamine-9-CA product against reagentblank which showed low absorbance at theabove λmax and maximum absorption at 392 nm.These wavelength at maximum absorption havebeen selected for the recommended procedure.
Fig (1): Absorption spectra of:a) 25 µg/ml mesalamine versus reagent blank and
b) reagent blank versus ethanol.
Recommended Procedure
382.0 400 420 440 460 480 500 520 540 560 580 600.00.00
0.2
0.4
0.6
0.8
1.0
1.2
1.40
nm
A
AbsorbanceTime(min)
60C50
C
C40R.T
----- ----- -----0.0550.00.1080.1100.1070.10550.1830.1820.1800.175100.1850.1950.1830.180150.1870.1950.1850.183200.1890.19501860.183250.1900.1950.1860.185300.1920.1950.1890.185400.1910.1950.1930.187500.1910.1950.1930.18860
----0.1930.1900.19170 ---- --------0.19180 ---- ---- ----0.19090
FinalpH
Stabilityperiod(min)
Developmenttime(min)
9-CA
1 10-3 M
(ml)
Temp.(○C)Abs.
λmax
(nm)Compound
8.9255153.0500.195436mesalamine
b
a

Journal of University of Duhok, Vol. 17, No.1 (Pure and Eng. Sciences), Pp 15-25, 2014
19
To a series of 5 ml calibrated flasks,increasing volumes of the working mesalaminesolution (100 μg/ml) were transferred to coverthe concentration range 2-28 μg/ml, followed byaddition of 3 ml of 1×10⁻³ M 9-CA . Thesolutions were diluted to the mark with absoluteethanol and the blank solution was prepared in asimilar way without mesalamine. The solutionswere kept at 50°C for 15 min in a water bath andthe absorbance was measured at 436 nm aftercooling the room temperature.Quantitation
A plot of absorbance versus determinedconcentration Fig. (2) shows that Beer's law wasobeyed over the range 2-28 μg/ml and molarabsorptivity was 1.8×10³ L. mol-1.cm-1, Table(9), which indicating that the method wassensitive. The linearity was represented by theregression equation and the correspondingcorrelation coefficient for the studiedmesalamine determined by the proposed methodrepresents excellent linearity (Table 8). LOD andLOQ were determined as described in chaptertwo and the values are cited in Table (9)
(2) :- Fig
Calibration graph for determination of mesalamine
Table (8):- Slopes, intercepts and correlation coefficients for the determination of mesalamine
Table (9): Summary of the quantitation values of the proposed method
Accuracy and Precision of the MethodTo check the accuracy and precision of the
method , the recovery % and RSD for thedetermination of mesalamine were estimated at
four replicates of three different concentrations.The results shown in Table (10) indicatedreasonably good accuracy (average recovery100.4 %) while RSD ≤4.3 % .
Table (10) :- Accuracy and precision of the method
Correlation CoefficientInterceptslopecompound
0.9940.0180.012mesalamine
compound Linearity range( μg/ml)
Molar absorptivity(L.mol-1.cm-1)
LOD( μg/ml)
LOQ( μg/ml)
Sandell'sSensitivity(µg.cm-2)
mesalamine 2.0-28 1.8×10³ 1.8733 5.676 0.08333

Journal of University of Duhok, Vol. 17, No.1 (Pure and Eng. Sciences), Pp 15-25, 2014
20
*Average of four determinations.
Study of InterferencesThe extent of interference by some excipients
which often accompany pharmaceuticalpreparations were studied by measuring theabsorbance of solutions containing fixed amount
of drug (14 µg/ml) and various amounts ofdiverse species in a final volume of 5 ml. It wasfound that the studied excipients did not interfereseriously (Table 11). Slight positive interferencewas observed in the presence of large excess ofexcipients. However; an error of 5.0 % in theabsorbance readings was considered tolerable.Typical results are given in Table (11).
Table (11) :- Effect of exciepient on the determination of 14 µg/ml mesalamine
Exciepient Recovery % of 14 μg/ml in the presence of
40 120 200 280 400 480 560
NaCl 96.59 93.66 95.61 96.59 96.1 99.52 98.05
Lactose 100 ---- 105.37 103.41 102.43 103.90 103.41Glucose 99.03 ---- 105.34 104.47 97.57 95.63 96.60Acacia 104.37 ---- ---- 105.83 103.88 103.88 103.39
Sucrose 98.05 105.85 104.88 103.90 100 100.98 97.07
Nature of the Colored ProductThe most wiely applied method is that of
continuous variation introduced by Job's andmolar ratio methods (12) . The mesalamine with9-CA have been studied by these methods usingthe recommended procedure.Job's Method
Job's method of continuous variation wasemployed to establish the stoichiometry of thecolored product. A 1x10⁻³ M standard solutionsof mesalamine and 9-CA reagent were used. Aseries of solutions were prepared in which thetotal volume of mesalamine and reagent was
kept at 2 ml. The reagents were mixed in variousproportions diluted to volume in a 5-mlcalibrated flask with absolute ethanol and thegeneral procedure followed.
As shown in Fig. (3), the result indicated thatthe stoichiometric composition of the productwas 1:1 (mesalamine : 9-CA) was formed. Thisindicates that aromatic amino grouppresented in the compound was responsible forthe formation of the product.
Fig. (3) :- Continuous variation plot for the mesalamine– 9-CA
0
0.05
0.1
0.15
0.2
0.25
0 0.25 0.5 0.75 1
Absorbance
[mesalamine]/[mesalamine]+[9-CA]
R.S.D*%
Error%
Averagerecovery
%
Recovery*%
Amount added(μg/ml)
compound
4.3-4.68100.4
95.324.0mesalamine 2.54.46104.4614.0
2.01.42101.4222.0

Journal of University of Duhok, Vol. 17, No.1 (Pure and Eng. Sciences), Pp 15-25, 2014
21
Mole Ratio Method
Application of a molar ratio method wasdetermined by the inflection point in a plot of theabsorption versus the molar ratio of thereactants. Different volumes of 1x10⁻³ M 9-CAwere added to the fixed volume (1ml) of 1x10⁻³
M mesalamine, then the solution was diluted to
the mark in 5-ml volumetric flask with absoluteethanol and the general procedure followed. Theintersections of the obtained straight linesindicate the molar ratio of the product. As shownin Fig.(4), the result also proved the formation ofthe 1:1stochiometry.
Fig. (4):- Mole ratio plot for mesalamine–9-CA product (1:1)ratio
Solutions were carefully formulated so as tocontain one proportion of mesalamine to one ofthe 9-CA reagent exactly. Under theseconditions, the complex was appreciablydissociated, and as it has been expected, it wasfound of low absorbance, that is As, is obtained.Similar solutions were then prepared containingthe same amount of mesalamine, but with anoptimum amount of 9-CA reagent. It can beassumed, in the latter case, that the mesalamine– 9-CA product has been largely associated andit would consequently have a higher absorbance,i.e. Am. The difference between the twoabsorbances however, represents a measure ofthe degree of dissociation of the product.
α = Am-As/Am
Where:α = degree of dissociation
Am= the absorbance of the solution containingexcess amount of reagent relative to themesalamine.As= the absorbance of the solution containingstoichiometric amount of mesalamine andreagent.
The conditional stability constant of the 1:1mesalamine-9-CA product, the reaction betweenthe amine (A) and reagent (B) proceedaccording to :
A + B ABα α 1-α
They can be expressed by the rats constantas:
K= (1-α) /α2C
Where:K= Stability constant of the product.C= final molar concentration of mesalamine(1×10⁻³M).The results cited in Table (12) indicated that theproduct is stable.
Table (12):- Stability constant of mesalamine – 9-CA product at concentration(1×10⁻³)M.
0
0.05
0.1
0.15
0.2
0.25
0.3
0.35
0 0.25 0.5 0.75 1 1.25 1.5 1.75 2
Absorbance
[9-CA]/[mesalamine]
Average Kst
(L.mol-1)αAbsorbanceVol. of mesalamineCompound
AmAs

Journal of University of Duhok, Vol. 17, No.1 (Pure and Eng. Sciences), Pp 15-25, 2014
22
Proposed Chemical ReactionThe method was based on the reaction of
mesalamine with 9-CA to form colored productwith maximum absorption at 436 nm. The molar
ratio of mesalamine to reagent was 1:1. This canbe explained by the proposed followingreactions. Scheme (1).
+N
Cl
N
NHNH2
9-chloroacridine
9-N-(4- - hydroxy -3- -Carboxyphenyl)aminoacridine
mesalamine
HO
O OH
OH
O
OH
+ HCl
Scheme (1):- Proposed mechanism of formation reaction for assay of the mesalamine by 9-CA, HCl
Analysis of Pharmaceutical FormulationsTablets and Capsules
Ten tablets or capsules content for each drugwere weighed and finely powdered, anaccurately weighed portion of the powderequivalent to 400 mg of mesalamine wasdissolved in ethanol. Shaking for 10 min, thenfiltered through Whatmann no. 42 filter paperinto 50 ml standard flask and the filtrate wasdiluted to the mark by repeated washing withethanol. Solutions of lower concentrations wereprepared by appropriate dilution with ethanol.The concentration of drug per capsule and tabletwas determined using its respective calibrationgraph constructed for pure drug by the followinggeneral procedure.
The proposed method was successfullyapplied to determine mesalamine inpharmaceutical capsules and tabletsformulations. The obtained results werecompared statistically by a Student's t-test foraccuracy and a variance ratio F-test for precisionwith the official method(13) procedure, as citedbelow, at the 95% confidence level with fourdegrees of freedom, as shown in Table (13).The results showed that the experimental t-test
and F-test were less than the theoreticalvalue ( t= 3.182, F= 9.12 ), indicating that therewas no significant difference between theproposed method and official method. Theproposed method was compared favorably withother reported methods as shown in Table (14).
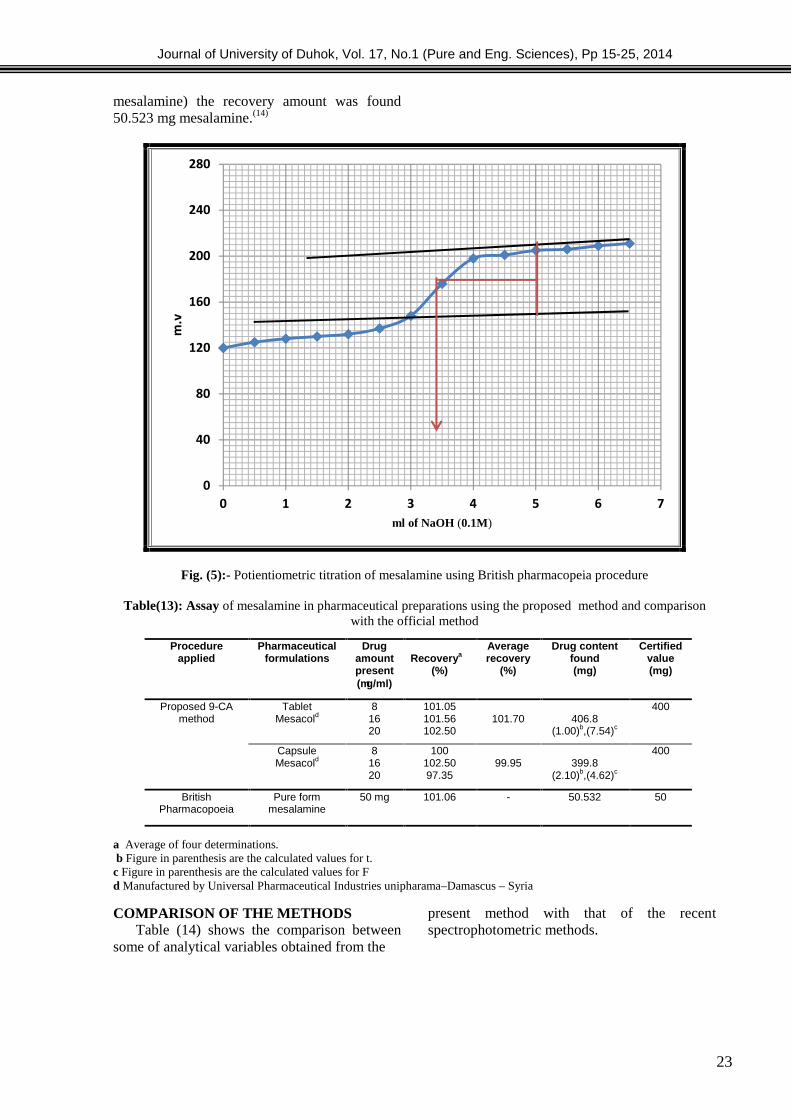
British Pharmacopeia ProcedureThe British pharmacopeia 2008 procedure
were based on a potentiometric titration and theend point was determined by the followingvariation of potential difference between twoelectrodes (indicator and reference electrodes)immersed in the 100 ml solution containing 50mg mesalamine (this solution was prepared bydissolving mesalamine in boiling water and thencooled rapidly to room temperature). Thissolution was titrated against 0.1 M NaOH andthe graph of the variation of the potentialdifference as a function of the quantity of NaOHadded has been plotted. As shown in Fig. (5), theend-point corresponds to sharp variation ofpotential difference was 3.3 ml NaOH and byapplying the equation (1ml of 0.1 M sodiumhydroxide was equivalent to 15.31 mg of
4.53×1040.357140.2100.1350.5
mesalamine0.217990.2890.2261.0
0.084550.3430.3141.5
acridine
Journal of University of Duhok, Vol. 17, No.1 (Pure and Eng. Sciences), Pp 15-25, 2014
23
mesalamine) the recovery amount was found50.523 mg mesalamine.(14)
Fig. (5):- Potientiometric titration of mesalamine using British pharmacopeia procedure
Table(13): Assay of mesalamine in pharmaceutical preparations using the proposed method and comparisonwith the official method
a Average of four determinations.b Figure in parenthesis are the calculated values for t.
c Figure in parenthesis are the calculated values for Fd Manufactured by Universal Pharmaceutical Industries unipharama–Damascus – Syria
COMPARISON OF THE METHODSTable (14) shows the comparison between
some of analytical variables obtained from the
present method with that of the recentspectrophotometric methods.
0
40
80
120
160
200
240
280
0 1 2 3 4 5 6 7
m.v
ml of NaOH (0.1M)
Certifiedvalue(mg)
Drug contentfound(mg)
Averagerecovery
(%)Recoverya
(%)
Drugamountpresent(g/ml)
Pharmaceuticalformulations
Procedureapplied
400406.8
(1.00)b,(7.54)c101.70
101.05101.56102.50
81620
TabletMesacold
Proposed 9-CAmethod
400399.8
(2.10)b,(4.62)c99.95
100102.5097.35
81620
CapsuleMesacold
5050.532-101.0650 mgPure formmesalamine
BritishPharmacopoeia

Journal of University of Duhok, Vol. 17, No.1 (Pure and Eng. Sciences), Pp 15-25, 2014
24
Table (14):- Comparison of the proposed method with other spectrophotometric methods
CONCLUSIONS
A simple, precise, selective and sensitivespectrophotometric method has been developedfor the determination of microgram amounts ofmesalamine range between 2-28 μg/ml with anaccuracy (average recovery %) 100.4% and RSD≤4.3%, indicating that the method is relativelyaccurate and precise. The method is based on thereaction of mesalamine with 9-CA reagent toform colored product having maximumabsorption at 436 nm. The molar absorptivity1.8×103 L. mol-1. cm-1 indicating that themethod is sensitive. The method does not requireany pretreatment or extraction steps. Theproposed method was applied successfully forthe assay of the pharmaceutical formulations fortablets and capsules of mesalamine.
REFERENCES C. QX, Z. KJ, D. Chen and LP. Gao, (2003), Eur. J.
Pharm. Biopharm., 55, 203-208. R. Gotti and et al; (2001), J. Chromatogr. A, 916:
175- 183. DL. Geier, Miner PB. ,(1992), Am. J. Med , 93, 208-
298.
G. Palumbo, G. Carlucci and P. Mazzeo, (1995), J.Pharm. Biomed. Anal. Oxford, 14, 175-180.
Narala S. R.; K. Saraswathi, Int. J. Res. Pharm.Biomed. Sci., 2010, 1, 10-13
Patel K. M.; Patel C.N.; Panigrahi B.; Parikh A.S.;Patel H.N., Pharm Analysis, 2010, 2, 284-288.
Al-Sabha T. N.; . Altaee O. A, J.Edu & Sci., 2008, 21,49-62.
British Pharmacopoeia Commission, BritishPharmacopeia, London, Stationery Office, (2003),2, 1257.
H. A. Zadeh and S. Kohansal , (2012), J. Braz. Chem.Soc., 23, 473-481.
B. Nigović , B. Simunić, (2003), J. Pharm. Biomed.Anal. 31,169-174.
A. Albert, "The Acridines," 2nd Ed., (1966), St.Martin,s press, New York, N. Y., p. 254.
L. G. Hargis, (1988), "Analytical Chemistry",Prentice- Hall. Inc., New Jersey, 424-427.
Seize, T. K. ,(1977), Student's t-test. SouthernMedical J. , 70, 1299.
British Pharmacopoeia, (2008), II, 1403. S. Narala1 and K. Saraswathi, (2010), Int. J. of Res. in
Pharmaceutical and Biomedical Sci., 1, 10-13. B. S. Chandra et al., (2011), Quim. Nova, 34, 1068-
1073. M. S. Al-Enizzi, T. N. Al-Sabha, T. S. Al-Ghabsha,
(2012), J. Chem., M. U, 7, 87-102.
Literature methodPresent methodAnalytical parameters
Vanillin(17)Fe-bipyridyl(16)o-Chloranil(15)9-Chloroacridine
320520571.5436λmax(nm)
acidic-9.88.92pH
R.T1002550Temp.(°C )
-15515
Development time (min)
120-4555
Stability period(min)
2-304-241.25-302-28
Beer’s law( μg/ml )
1.3 x1043.8 x1033.4×103
1.8×10³Molar absorptivity (L.mol-
1.cm-1)
100.3499.93100.44100.40
Recovery(%)
0.4090.6841.67≤ 4.3RSD(%)
TabletTabletTablet, CapsuleTablet, CapsuleApplication

Journal of University of Duhok, Vol. 17, No.1 (Pure and Eng. Sciences), Pp 15-25, 2014
25
9-
9-
103×1.8111.87335.6761:1
كلوراكردين وتطبيقاتها- 9باستخدام الكاشف الميزاالمينفية لتقديـــرـــطريقة طيعلى المستحضـــرات الصيدالنيــــة
الخالصة-9ن بشكله النقـي وفـي مستحضـره الصـيدالني، وذلـك بمفاعلتـه مـع الكاشـف مييشمل طريقة طيفية لتقديـر الميزاال
5.676و 1.8733وبحــد كشــف وحــد كمـــي 1-ســم. 1-مــول. لتــر103×1.8كلــوراكردين وكانــت االمتصاصــية الموالريــة
لقـد تـم . بتطبيـق طريقتـي جـوب والنسـبة الموليـة1:1لقد وجـد أن النـاتج يتكـون بنسـبة و . مللتر وعلى التوالي/مايكروغرام بنجاح من دون حدوث تداخل ) الحبوب والكبسول(مستحضراته الصيدالنية ن في ميتطبيق الطريقة بنجاح لتقدير الميزاال
.مع المضافات كما تمت مقارنة الطريقة المقترحة مع طرائق طيفية أخرى
Journal of University of Duhok, Vol. 17, No.1 (Pure and Eng. Sciences), Pp 26-34 2014
26
FPAA BASED PID CONTROLLER FOR TEMPERATURECONTROL OF BABY INCUBATOR
ABDUL-KAREEM Z. MANSOOR* and ASMAA E. HAMDOON
**
* Dept. of Electrical Power Technology Engineering, Technical College of Mosul-Iraq** Dept. of Computer Technology Engineering, Technical College of Mosul-Iraq
(Received: July 16, 2013; Accepted for publication: March 2, 2014)
ABSTRACTThe factors affect the child within incubator is mainly the temperature, moisture and oxygen, the
organization of temperatures is one of the basic criteria for building a stable environment for the child.The present work presents a development of temperature control of the environment inside the incubator.Temperature control is obtained through using the field programmable analog array (FPAA) card. TheAnadigm (AN221E04) FPAA card permits a media for designing and implementing the PID controllertogether with the PWM controller used to operate the solid state relay (SSR) which is in turn is used tocontrol the operation of the heater.
KEY WORDS: Premature infant Incubator, Temperature control, FPAA, PID controller, Pulse Width Modulation (PWM).
1- INTRODUCTION
ne of the most important elements in anewborn's survival is the infant's
temperature regulation. However a pretermnewborn infant needs special care because somevital organs and/or biochemical/enzyme systemsmay not have developed society, or because thegrowth of the fetus may have been disturbed,with the result that the infant is unlikely tosurvive undamaged without special protection.An infant is called preterm if it is born followinga gestation period of less than 37 weeks. Thepreterm infant has several disadvantages interms of thermal regulation (Carlos, 2009).
Since the premature infants are at risk todevelop hypoxia, hypothermia and many otherassociated adverse conditions, hence they needspecial care and attention. One of the majorproblems that newborns face is improperthermoregulation. The temperature inside themother’s womb is 38⁰C (100.4⁰F). Leaving thewarmth of the womb at birth, the wet new bornfinds itself in a much colder environment andimmediately starts losing heat.
In the first 10-20 minutes, the new born whois not thermally protected may lose enough heatfor the body temperature to fall by 2-4⁰C (3.6-7.2⁰F), with even greater falls in the followinghours if proper care is not given. If heat loss isnot prevented and is allowed to continue, thebaby will develop hypothermia and is atincreased risk of developing health problems andof death. Therefore an infant incubator isnecessary which attempts to create the necessary
environment for the baby’s survival (Tamanna etal., 2012).
Temperature regulation is of primaryimportance in an incubator. The present worktherefore focuses on the temperature control ofan incubator.
2- TEMPERATURE CONTROL SYSTEM:-
Temperature regulation is one of the mostimportant factors affecting survival of newborninfants. Temperature control system is animportant integral part of a baby incubator.
Selection of an appropriate temperaturesensor is important for effective control oftemperature in the incubator.
Comparing the sensitivity and response timeof available temperature sensors like thermistor,thermocouple, RTD in the range of temperature25⁰C-40⁰C along with accuracy, repeatability,term stability, linearity, self-heating; thermistoris the best choice in this case (Tamanna et al.,2012).
The air inside the incubator is warmed by aheater and is continually circulated by a fan.
The air temperature inside the incubator iscontrolled by a thermostat which is set by thenursing staff (incubator operator). Havingdecided that a baby requires care in an incubator,the nurse must choose an appropriate airtemperature.
The average temperature needed to provide asuitable thermal environment for a healthy babycared for in an incubator is shown in Table 1(Mohamed et al., 2008).
O
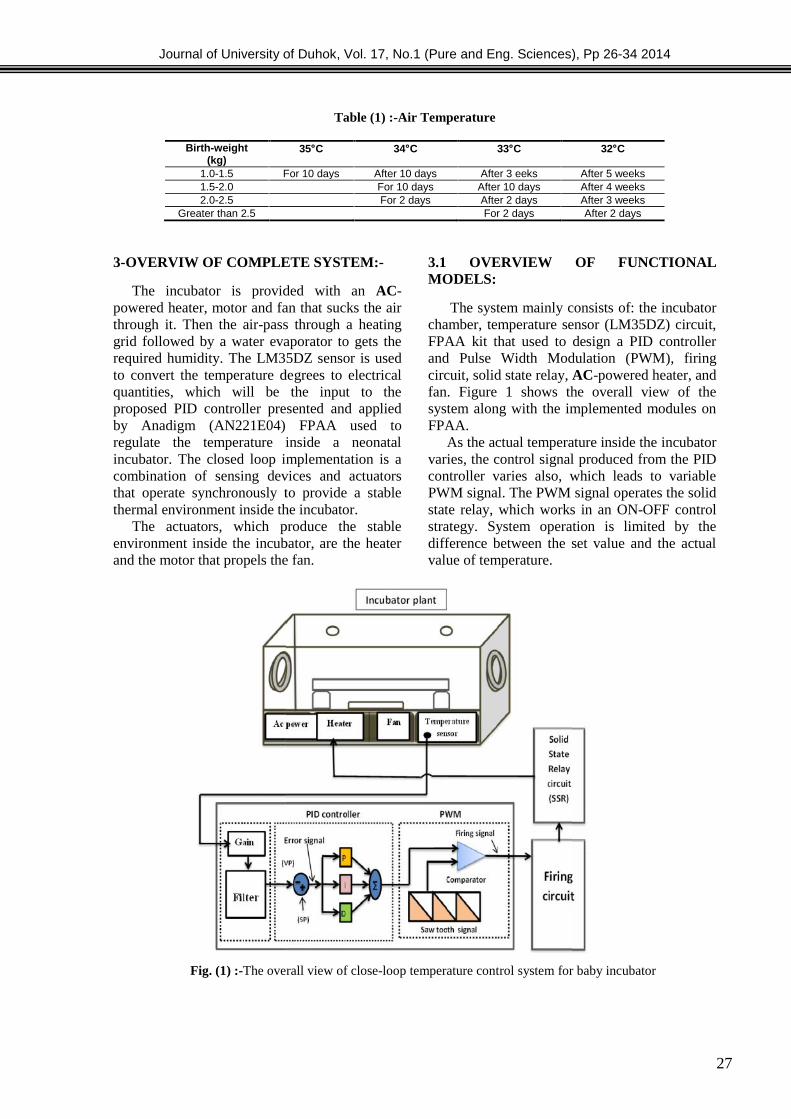
Journal of University of Duhok, Vol. 17, No.1 (Pure and Eng. Sciences), Pp 26-34 2014
27
Table (1) :-Air Temperature
Birth-weight(kg)
35C 34C 33C 32C
1.0-1.5 For 10 days After 10 days After 3 eeks After 5 weeks1.5-2.0 For 10 days After 10 days After 4 weeks2.0-2.5 For 2 days After 2 days After 3 weeks
Greater than 2.5 For 2 days After 2 days
3-OVERVIW OF COMPLETE SYSTEM:-
The incubator is provided with an AC-powered heater, motor and fan that sucks the airthrough it. Then the air-pass through a heatinggrid followed by a water evaporator to gets therequired humidity. The LM35DZ sensor is usedto convert the temperature degrees to electricalquantities, which will be the input to theproposed PID controller presented and appliedby Anadigm (AN221E04) FPAA used toregulate the temperature inside a neonatalincubator. The closed loop implementation is acombination of sensing devices and actuatorsthat operate synchronously to provide a stablethermal environment inside the incubator.
The actuators, which produce the stableenvironment inside the incubator, are the heaterand the motor that propels the fan.
3.1 OVERVIEW OF FUNCTIONALMODELS:
The system mainly consists of: the incubatorchamber, temperature sensor (LM35DZ) circuit,FPAA kit that used to design a PID controllerand Pulse Width Modulation (PWM), firingcircuit, solid state relay, AC-powered heater, andfan. Figure 1 shows the overall view of thesystem along with the implemented modules onFPAA.
As the actual temperature inside the incubatorvaries, the control signal produced from the PIDcontroller varies also, which leads to variablePWM signal. The PWM signal operates the solidstate relay, which works in an ON-OFF controlstrategy. System operation is limited by thedifference between the set value and the actualvalue of temperature.
Fig. (1) :-The overall view of close-loop temperature control system for baby incubator
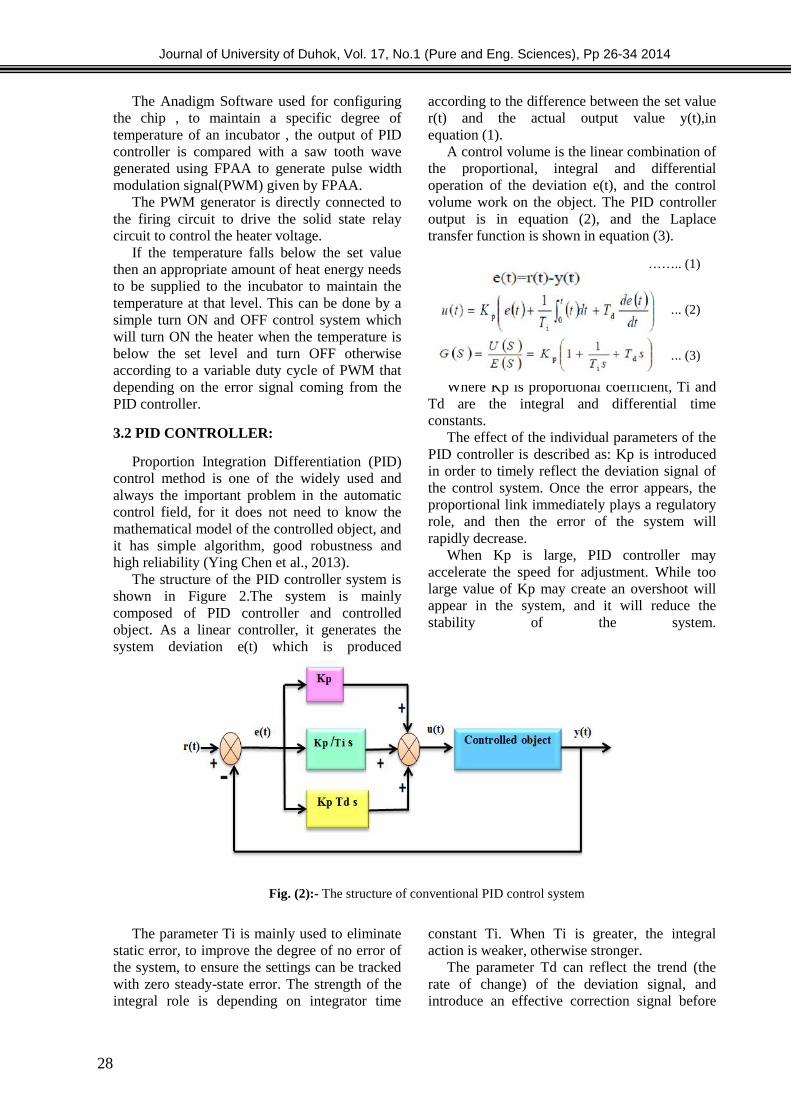
Journal of University of Duhok, Vol. 17, No.1 (Pure and Eng. Sciences), Pp 26-34 2014
28
The Anadigm Software used for configuringthe chip , to maintain a specific degree oftemperature of an incubator , the output of PIDcontroller is compared with a saw tooth wavegenerated using FPAA to generate pulse widthmodulation signal(PWM) given by FPAA.
The PWM generator is directly connected tothe firing circuit to drive the solid state relaycircuit to control the heater voltage.
If the temperature falls below the set valuethen an appropriate amount of heat energy needsto be supplied to the incubator to maintain thetemperature at that level. This can be done by asimple turn ON and OFF control system whichwill turn ON the heater when the temperature isbelow the set level and turn OFF otherwiseaccording to a variable duty cycle of PWM thatdepending on the error signal coming from thePID controller.
3.2 PID CONTROLLER:
Proportion Integration Differentiation (PID)control method is one of the widely used andalways the important problem in the automaticcontrol field, for it does not need to know themathematical model of the controlled object, andit has simple algorithm, good robustness andhigh reliability (Ying Chen et al., 2013).
The structure of the PID controller system isshown in Figure 2.The system is mainlycomposed of PID controller and controlledobject. As a linear controller, it generates thesystem deviation e(t) which is produced
according to the difference between the set valuer(t) and the actual output value y(t),inequation (1).
A control volume is the linear combination ofthe proportional, integral and differentialoperation of the deviation e(t), and the controlvolume work on the object. The PID controlleroutput is in equation (2), and the Laplacetransfer function is shown in equation (3).
…….. (1)
…….. (2)
…….. (3)
Where Kp is proportional coefficient, Ti andTd are the integral and differential timeconstants.
The effect of the individual parameters of thePID controller is described as: Kp is introducedin order to timely reflect the deviation signal ofthe control system. Once the error appears, theproportional link immediately plays a regulatoryrole, and then the error of the system willrapidly decrease.
When Kp is large, PID controller mayaccelerate the speed for adjustment. While toolarge value of Kp may create an overshoot willappear in the system, and it will reduce thestability of the system.
Fig. (2):- The structure of conventional PID control system
The parameter Ti is mainly used to eliminatestatic error, to improve the degree of no error ofthe system, to ensure the settings can be trackedwith zero steady-state error. The strength of theintegral role is depending on integrator time
constant Ti. When Ti is greater, the integralaction is weaker, otherwise stronger.
The parameter Td can reflect the trend (therate of change) of the deviation signal, andintroduce an effective correction signal before
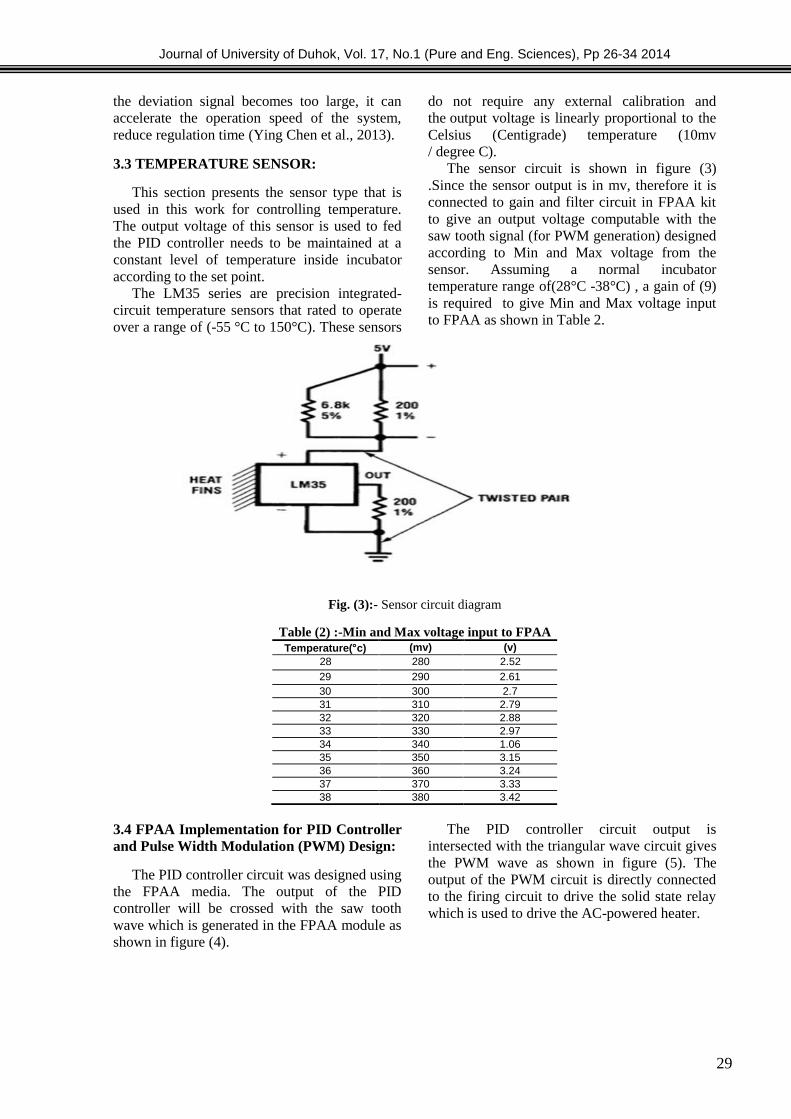
Journal of University of Duhok, Vol. 17, No.1 (Pure and Eng. Sciences), Pp 26-34 2014
29
the deviation signal becomes too large, it canaccelerate the operation speed of the system,reduce regulation time (Ying Chen et al., 2013).
3.3 TEMPERATURE SENSOR:
This section presents the sensor type that isused in this work for controlling temperature.The output voltage of this sensor is used to fedthe PID controller needs to be maintained at aconstant level of temperature inside incubatoraccording to the set point.
The LM35 series are precision integrated-circuit temperature sensors that rated to operateover a range of (-55 °C to 150°C). These sensors
do not require any external calibration andthe output voltage is linearly proportional to theCelsius (Centigrade) temperature (10mv/ degree C).
The sensor circuit is shown in figure (3).Since the sensor output is in mv, therefore it isconnected to gain and filter circuit in FPAA kitto give an output voltage computable with thesaw tooth signal (for PWM generation) designedaccording to Min and Max voltage from thesensor. Assuming a normal incubatortemperature range of(28°C -38°C) , a gain of (9)is required to give Min and Max voltage inputto FPAA as shown in Table 2.
Fig. (3):- Sensor circuit diagram
Table (2) :-Min and Max voltage input to FPAATemperature(c) (mv) (v)
28 280 2.5229 290 2.6130 300 2.731 310 2.7932 320 2.8833 330 2.9734 340 1.0635 350 3.1536 360 3.2437 370 3.3338 380 3.42
3.4 FPAA Implementation for PID Controllerand Pulse Width Modulation (PWM) Design:
The PID controller circuit was designed usingthe FPAA media. The output of the PIDcontroller will be crossed with the saw toothwave which is generated in the FPAA module asshown in figure (4).
The PID controller circuit output isintersected with the triangular wave circuit givesthe PWM wave as shown in figure (5). Theoutput of the PWM circuit is directly connectedto the firing circuit to drive the solid state relaywhich is used to drive the AC-powered heater.
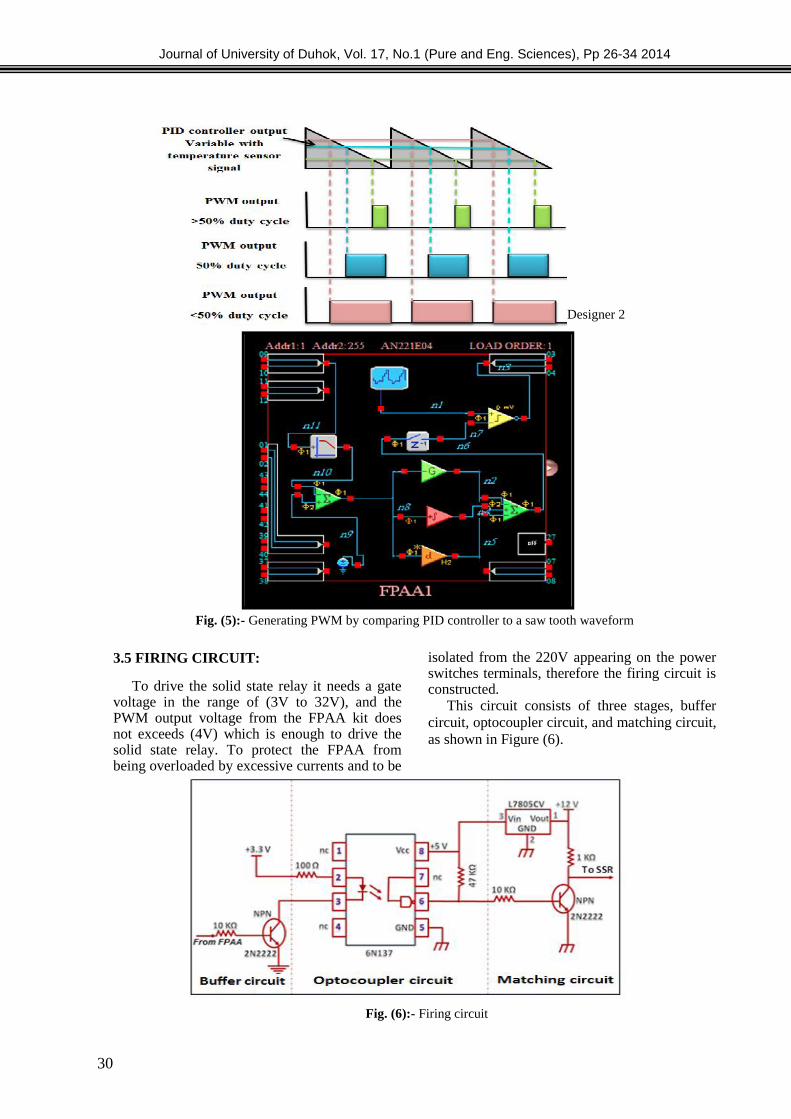
Journal of University of Duhok, Vol. 17, No.1 (Pure and Eng. Sciences), Pp 26-34 2014
30
Fig. (4):- Implementation PID controller and PWM using Anadigm Designer 2
Fig. (5):- Generating PWM by comparing PID controller to a saw tooth waveform
3.5 FIRING CIRCUIT:
To drive the solid state relay it needs a gatevoltage in the range of (3V to 32V), and thePWM output voltage from the FPAA kit doesnot exceeds (4V) which is enough to drive thesolid state relay. To protect the FPAA frombeing overloaded by excessive currents and to be
isolated from the 220V appearing on the powerswitches terminals, therefore the firing circuit isconstructed.
This circuit consists of three stages, buffercircuit, optocoupler circuit, and matching circuit,as shown in Figure (6).
Fig. (6):- Firing circuit

Journal of University of Duhok, Vol. 17, No.1 (Pure and Eng. Sciences), Pp 26-34 2014
31
3.6 SOLID STATE RELAY (SSR) CIRCUIT:
The solid-state relay is an ON-OFF controldevice in which the load current is conducted byone or more semiconductors - e.g., powertransistors, an SCR, or a TRIAC. The SSRrequires a relatively low control circuit energy tobe switched ON and OFF.When the voltage is applied to the input of theSSR, the relay is energized by a light emittingdiode. The light from the diode is beamed into alight sensitive semiconductor which, in the case
of zero voltage crossover relays, conditions thecontrol circuit to turn on the output solid stateswitch at the next zero voltage crossover.
In the case of nonzero voltage crossoverrelays, the output solid state switch is turned onat the precise voltage occurring at the time.
Removal of the input power disables thecontrol circuit and the solid state switch is turnedoff when the load current passes through thezero point of its cycle. As shown in figure(7).
Fig. (7):- Solid state relay circuit
Figure (8) Shows a solid state relay circuitusing a photocoupler. The figure includes aninput circuit, photocoupler, thyristor fortriggering, rectifying diode bridge, snubbercircuit, and high power triac.
During the operation, the photocoupler turnson the thyristor for triggering and its ON-current
activates the high power triac to drive the load.Because of a low collector withstand voltage andlow output current of the photocoupler, athyristor for triggering is needed to interface itwith power control devices such as a power triacor power thyristor (Handbook. 2006).
Fig. (8):- Solid State Relay with Built-in Zero-Crossing Circuit.
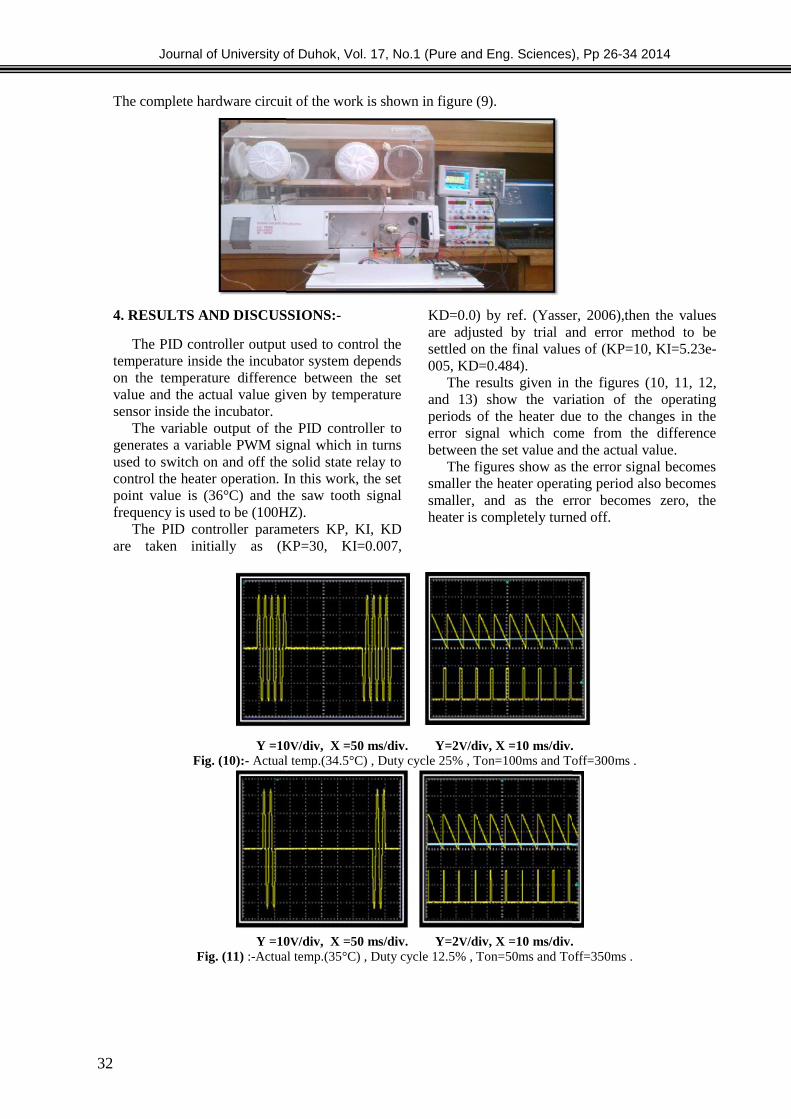
Journal of University of Duhok, Vol. 17, No.1 (Pure and Eng. Sciences), Pp 26-34 2014
32
The complete hardware circuit of the work is shown in figure (9).
Fig. (9) The complete hardware circuit
4. RESULTS AND DISCUSSIONS:-
The PID controller output used to control thetemperature inside the incubator system dependson the temperature difference between the setvalue and the actual value given by temperaturesensor inside the incubator.
The variable output of the PID controller togenerates a variable PWM signal which in turnsused to switch on and off the solid state relay tocontrol the heater operation. In this work, the setpoint value is (36°C) and the saw tooth signalfrequency is used to be (100HZ).
The PID controller parameters KP, KI, KDare taken initially as (KP=30, KI=0.007,
KD=0.0) by ref. (Yasser, 2006),then the valuesare adjusted by trial and error method to besettled on the final values of (KP=10, KI=5.23e-005, KD=0.484).
The results given in the figures (10, 11, 12,and 13) show the variation of the operatingperiods of the heater due to the changes in theerror signal which come from the differencebetween the set value and the actual value.
The figures show as the error signal becomessmaller the heater operating period also becomessmaller, and as the error becomes zero, theheater is completely turned off.
Y =10V/div, X =50 ms/div. Y=2V/div, X =10 ms/div.Fig. (10):- Actual temp.(34.5°C) , Duty cycle 25% , Ton=100ms and Toff=300ms .
Y =10V/div, X =50 ms/div. Y=2V/div, X =10 ms/div.Fig. (11) :-Actual temp.(35°C) , Duty cycle 12.5% , Ton=50ms and Toff=350ms .
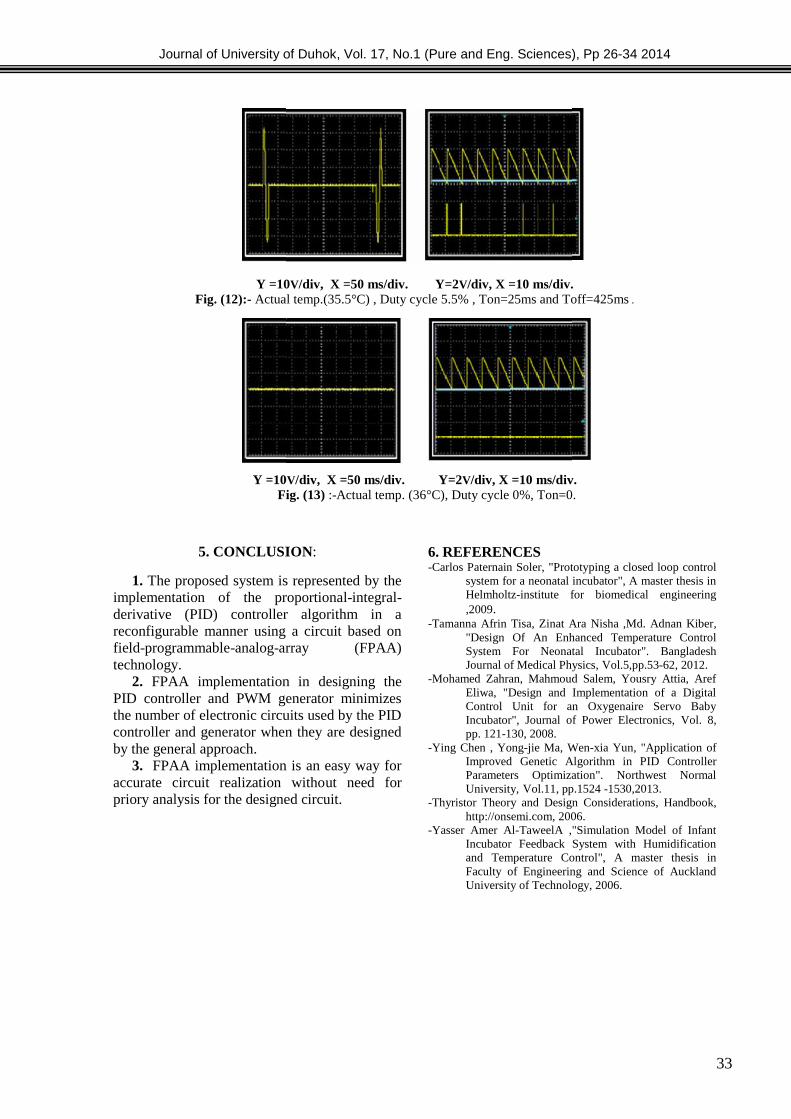
Journal of University of Duhok, Vol. 17, No.1 (Pure and Eng. Sciences), Pp 26-34 2014
33
Y =10V/div, X =50 ms/div. Y=2V/div, X =10 ms/div.Fig. (12):- Actual temp.(35.5°C) , Duty cycle 5.5% , Ton=25ms and Toff=425ms .
Y =10V/div, X =50 ms/div. Y=2V/div, X =10 ms/div.Fig. (13) :-Actual temp. (36°C), Duty cycle 0%, Ton=0.
5. CONCLUSION:
1. The proposed system is represented by theimplementation of the proportional-integral-derivative (PID) controller algorithm in areconfigurable manner using a circuit based onfield-programmable-analog-array (FPAA)technology.
2. FPAA implementation in designing thePID controller and PWM generator minimizesthe number of electronic circuits used by the PIDcontroller and generator when they are designedby the general approach.
3. FPAA implementation is an easy way foraccurate circuit realization without need forpriory analysis for the designed circuit.
6. REFERENCES-Carlos Paternain Soler, "Prototyping a closed loop control
system for a neonatal incubator", A master thesis inHelmholtz-institute for biomedical engineering,2009.
-Tamanna Afrin Tisa, Zinat Ara Nisha ,Md. Adnan Kiber,"Design Of An Enhanced Temperature ControlSystem For Neonatal Incubator". BangladeshJournal of Medical Physics, Vol.5,pp.53-62, 2012.
-Mohamed Zahran, Mahmoud Salem, Yousry Attia, ArefEliwa, "Design and Implementation of a DigitalControl Unit for an Oxygenaire Servo BabyIncubator", Journal of Power Electronics, Vol. 8,pp. 121-130, 2008.
-Ying Chen , Yong-jie Ma, Wen-xia Yun, "Application ofImproved Genetic Algorithm in PID ControllerParameters Optimization". Northwest NormalUniversity, Vol.11, pp.1524 -1530,2013.
-Thyristor Theory and Design Considerations, Handbook,http://onsemi.com, 2006.
-Yasser Amer Al-TaweelA ,"Simulation Model of InfantIncubator Feedback System with Humidificationand Temperature Control", A master thesis inFaculty of Engineering and Science of AucklandUniversity of Technology, 2006.

Journal of University of Duhok, Vol. 17, No.1 (Pure and Eng. Sciences), Pp 26-34 2014
34
للسيطرة على درجات الحرارة لحاضنة الطفل باالعتماد على التكاملي- التفاضلي-التناسبيمسيطر الاستخدامالمصفوفات التناظرية القابلة للبرمجة
: الخالصةان ,العوامل الرئيسية التي توثر على الطفل داخل الحاضنة هي درجة الحرارة بشكل رئيسي والرطوبة واالوكسجين
نظام التحكم في درجاتتطوير يقدم البحث.تنظيم درجات الحرارة هي احد المعايير األساسية لبناء بيئة مستقرة للطفليتم تصميم وتنفيذ حيث .)FPAA(التناظرية القابلة للبرمجةباستخدام بطاقة المصفوفات داخل الحاضنة الحرارة
ريالىللتحكم بعمل) FPAA(داخل بطاقة معا(PWM)وبناء(PID)تكاملي- تفاضلي- مسيطر نوع تناسبي.التي من خاللها تتم السيطرة على عمل المسخن)SSR(الحالة الصلبة

Journal of University of Duhok, Vol. 17, No.1 (Pure and Eng. Sciences), Pp 35-46,2014
35
IMPROVE MICROSTRUCTURE AND MECHANICAL PROPERTIESOF AL-A332–ALLOY REINFORCED AL2O3 MICRO ANDNANO COMPOSITES FABRICATED BY STIR CASTING
IBTIHAL A. MAHMOOD ,ADNAN DAWOOD MOHAMMED and RAWNAQ AHMED MOHAMMEDUniversity of Technology
Minstery of Water Resorce
(Received: July 24, 2013; Accepted for publication: March 2, 2014)
ABSTRACTAluminium matrix composites (AMCs) reinforced with micro and nano-sized Al2O3 particles are
widely used for high performance applications such as automotive, military, and aerospace and electricityindustries because of their improved physical and mechanical properties. The major problem infabricating metal matrix composites by liquid phase is the poor readability which leads to the non-uniform distribution of the particles. In order to improve the microstructure and mechanical properties ofcomposite, firstly improve the wettability and distribution of reinforcement particles within the matrix.Three steps were applied in stir casting process to avoid agglomeration and segregation of particles. Theprocess included heat treatment of micro and nano Al2O3 particles, injection of heat-treated particleswithin the molten A332 aluminium alloy by inert argon gas and stirring the melt at suitable speed. In thepresent work, nano and micro-composites (A332/Al2O3) with different weight percent of particles werefabricated by stir-casting techniques. Micro structural characterization was investigated by optical (OP)and scanning electron microscopy (SEM). Tensile, hardness tests were carried out in order to identifymechanical properties of the composites. The results of micro structural study revealed uniformdistribution, grain refinement and low porosity in micro and nano-composite specimens. The mechanicalresults showed that the addition of alumina (micro and nano) led to the improvement in yield strength,ultimate tensile strength, and hardness. It was indicated that type of fabrication process and particle sizewere the effective factors influencing on the mechanical properties. Decreasing alumina particle size andusing steps of stir casting method- process obtained the best mechanical properties.
KEY WORDS: - metal–matrix composite-nano Al2O3- stir casting
INTRODUCTION
he Ceramic reinforced aluminium alloysexhibit a unique combination of
properties not found in monolithic aluminiumalloys. Recent investigations find that theincorporation of nano-particles into thealuminium matrix could enhance the hardness,the yield and ultimate tensile strengthconsiderably, while the ductility is retained(Mazahery 2009, Habibnejad 2009). The greatenhancement in strength values of thesecomposites is attributed to good distribution ofthe nano and micro particulates. The addition ofhigh modulus ceramic particles to conventionalaluminium alloys results in increased strength,elastic modulus, wear resistance, as well as otherdesirable engineering properties Liquidmetallurgy technique is the most economical ofall the available routes for metal–matrixcomposite production and generally can beclassified into four categories: pressureinfiltration, stir casting, spray deposition and insitu processing (Kok 2005). Compared to other
routes, melt stirring process has some importantadvantages, e.g., the wide selection of materials,better matrix–particle bonding, easier control ofmatrix structure, simple and inexpensiveprocessing, flexibility and applicability to largequantity production and excellent productivityfor near-net shaped components (M. Rosso2001), but there are some problems associatedwith stir casting of AMCs such as: poorwettability and heterogeneous distribution of thereinforcement material. Poor wettability ofreinforcement in the melt means that the moltenmatrix cannot wet the surface of reinforcementparticles therefor, when the reinforcementparticles are added into the molten matrix, theyfloat on the melt surface (J. Hashim 2001, J.Hashim 1999).and a another problem is theheterogeneous distribution of the reinforcementmaterial . This is because when the particleswere wetted in the metal melt, the particles willtend to float to the molten melt due to thedensity differences between the reinforcementparticles and the matrix alloy melt, so that thedispersion of the ceramic particles is not uniform
T
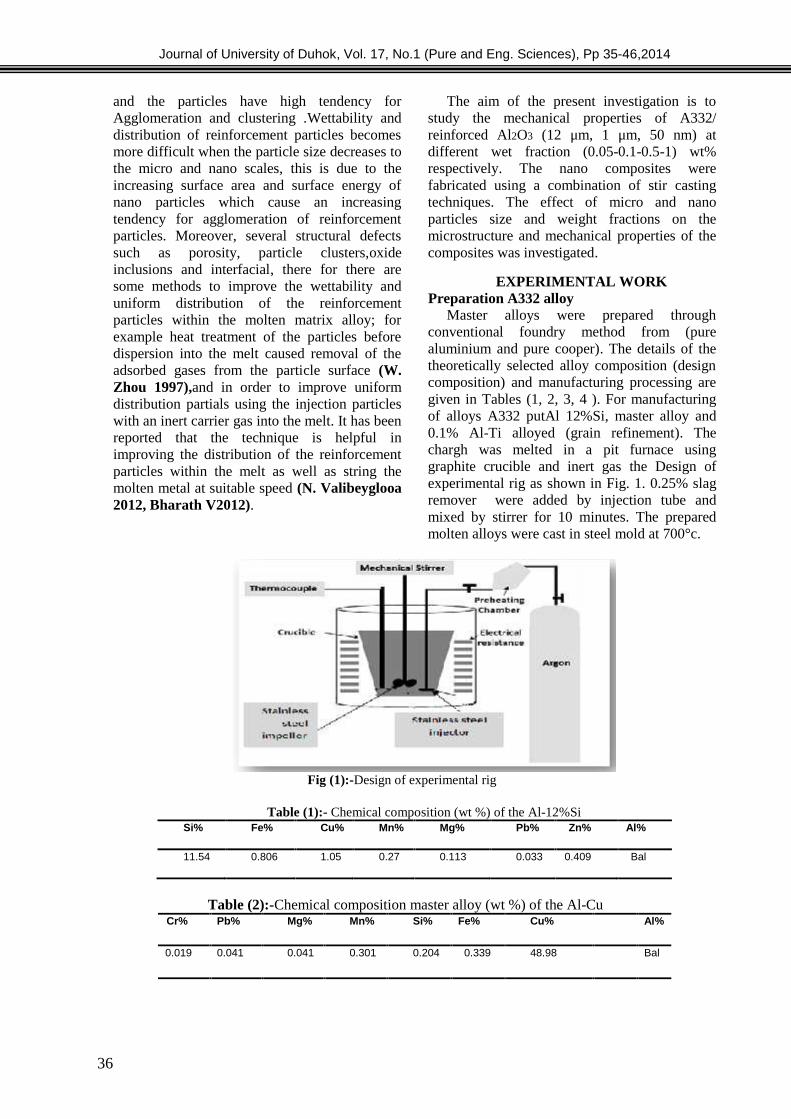
Journal of University of Duhok, Vol. 17, No.1 (Pure and Eng. Sciences), Pp 35-46,2014
36
and the particles have high tendency forAgglomeration and clustering .Wettability anddistribution of reinforcement particles becomesmore difficult when the particle size decreases tothe micro and nano scales, this is due to theincreasing surface area and surface energy ofnano particles which cause an increasingtendency for agglomeration of reinforcementparticles. Moreover, several structural defectssuch as porosity, particle clusters,oxideinclusions and interfacial, there for there aresome methods to improve the wettability anduniform distribution of the reinforcementparticles within the molten matrix alloy; forexample heat treatment of the particles beforedispersion into the melt caused removal of theadsorbed gases from the particle surface (W.Zhou 1997),and in order to improve uniformdistribution partials using the injection particleswith an inert carrier gas into the melt. It has beenreported that the technique is helpful inimproving the distribution of the reinforcementparticles within the melt as well as string themolten metal at suitable speed (N. Valibeyglooa2012, Bharath V2012).
The aim of the present investigation is tostudy the mechanical properties of A332/reinforced Al2O3 (12 μm, 1 μm, 50 nm) atdifferent wet fraction (0.05-0.1-0.5-1) wt%respectively. The nano composites werefabricated using a combination of stir castingtechniques. The effect of micro and nanoparticles size and weight fractions on themicrostructure and mechanical properties of thecomposites was investigated.
EXPERIMENTAL WORKPreparation A332 alloy
Master alloys were prepared throughconventional foundry method from (purealuminium and pure cooper). The details of thetheoretically selected alloy composition (designcomposition) and manufacturing processing aregiven in Tables (1, 2, 3, 4 ). For manufacturingof alloys A332 putAl 12%Si, master alloy and0.1% Al-Ti alloyed (grain refinement). Thechargh was melted in a pit furnace usinggraphite crucible and inert gas the Design ofexperimental rig as shown in Fig. 1. 0.25% slagremover were added by injection tube andmixed by stirrer for 10 minutes. The preparedmolten alloys were cast in steel mold at 700°c.
Fig (1):-Design of experimental rig
Table (1):- Chemical composition (wt %) of the Al-12%SiSi% Fe% Cu% Mn% Mg% Pb% Zn% Al%
11.54 0.806 1.05 0.27 0.113 0.033 0.409 Bal
Table (2):-Chemical composition master alloy (wt %) of the Al-CuAl%Cu%Fe%Si%Mn%Mg%Pb%Cr%
Bal48.980.3390.2040.3010.0410.0410.019

Journal of University of Duhok, Vol. 17, No.1 (Pure and Eng. Sciences), Pp 35-46,2014
37
Table( 3):- Chemical composition (wt %) of the Al-TiAl%Cr%Mn%Mg%Cu%Fe%Si%Ti%
Bal0.10.10.10.10.50.55
Table( 4):- Chemical composition (wt %) of the A332MaterialAlloy
Si% Cu% Fe% Mg% Zn% Mn% Al%
NominalChemicalcomposition
8.5-10.5
2-4 1.2 0.5-1.5 1 0.5 Bal
A332 fabric 9.62 3.2 1.1 1.2 1 0.1 Bal
MANUFACTURING AND CASTING OFCOMPOSITE SAMPLES
A332 aluminium alloy and particulatealumina powder with size of (12 μm, 1 μm, 50nm) respectively, were used as the matrix andreinforcement phases the chemical compositionfor composites. Composite specimens weremanufactured by stir casting methods usingmechanical mixing of the molten alloy. Microand nano-particles were heated treatment ofreinforcement particles at 1000 ◦C for 20 min inan inert atmosphere and then injected into themelt by using a stainless steel injection tube andinert argon gas in a graphite crucible inserted ina resistance heating furnace. The wet fraction ofalumina powder injected into the compositeswere chosen (0.05-0.1-0.5-1) wt% micro-alumina and (0.05-0.1-0.5-1) wt% nano-aluminarespectively. The stirring was continued for 15min to produce homogenous mixture. The speedof impeller was 400 rpm .Stirring process wasstarted 10 min before addition of reinforcementparticles in the melt and continued 15 min afterthat. Then, the stirrer was turned off and finallycomposite slurry was poured in a preheated steelmold .The pouring temperature for the processeswas 700 °C.
MEASUREMENTS AND TESTING
To study the microstructure of the specimensthey were cut by an automatic cutter device. Thespecimen surfaces were prepared by grindingthrough 600 and 1200 grit papers and then bypolishing with 3 μm diamond paste. Microscopicexamination of the composites was carried outby optical and scanning electron microscopy.The density of the samples was measured by theArchimedes’s method, while the theoreticaldensities calculated by taking the densities ofA332 aluminium alloy and Al2O3 particles wereequal to 2.7 and 3.9 g/cm3, respectively. Theporosity percentage in the materials wascalculated according to the difference betweenthe theoretical and measured density .Toinvestigate the mechanical properties of thecomposites The Brinell hardness values of thesamples were measured on the polished samplesusing a ball with 5 mm diameter at a load of 250kg. The tensile tests were carried out usingInstron testing machine according to ASTM.B557 and ASTM E9-89a, respectively as shown infig 2. The cross head speed was set at 3 mm/minon the round specimens. Each test was repeatedtwo times to obtain a precise average value foreach property.
Fig(2):- tensile test sample
G-gage length (30 mm0.06). D-diameter (6.0
mm 0.1).
R- radius of fillet (6mm)min.A-length of reduced section(36mm)

Journal of University of Duhok, Vol. 17, No.1 (Pure and Eng. Sciences), Pp 35-46,2014
38
RESULT AND DISCUSSION
1-Microstructure analysisThe morphology of the microstructural
constituents, their orientation, bonding,distribution, presence of porosity and impuritieshave strong influence on strength.Theirappearance of the microstructural featuresdepends upon the composition and processingmethod. In general as shows in Fig.3 the
microstructures of the manufactured sample.According to optical microscopic observation, incase of A332, without additives of any element,the microstructure of Aluminum-Silicon alloy332 consists of two phases, the white phase α-Aland the dark cubic phase β-Si in a soft matrix ofternary eutectic formed from the white phase α-Al, dark cubic phase β-Si (Ali Mazahery 2012) .
Fig (3): the microstructure of A332
The microstructure of composite samplescontaining four weight percent (0.05-0.1-0.5-1)of micron and nano size (12 μm, 1 μm, 50 nm)Al2o3 particles fabricated by stir castingprocesses. During solidification of A332–Al2O3composites, nucleation of α -Al phase starts inthe liquid at a distance away from the particles,where the temperature is lower. The growth of α-Al nuclei leads to enrichment of Si and othersolutes in the remaining melt. Because of Sienrichment in the zones near Al2O3 particles,surface of Al2O3 particles can act as the suitablesubstrates for nucleation of Si phase (AliMazahery 2012). Therefore, the microstructureof the composites contains primary α -Al
dendrites and eutectic silicon, while Al2O3particles are separated at inter-dendritic regionsand in eutectic silicon therefore, themicrostructure of the composites containsprimary α-Al dendrites and eutectic silicon,while Al2O3 particles are separated at inter-dendrite regions and in eutectic silicon.fig 4(A-B-C-D) shown the microstructures of somesamples.
A: 0.05wt% Al2O3 (1micron)
A
-AL
Si
A
Hypoeutectic
Al2O3
Dendrite
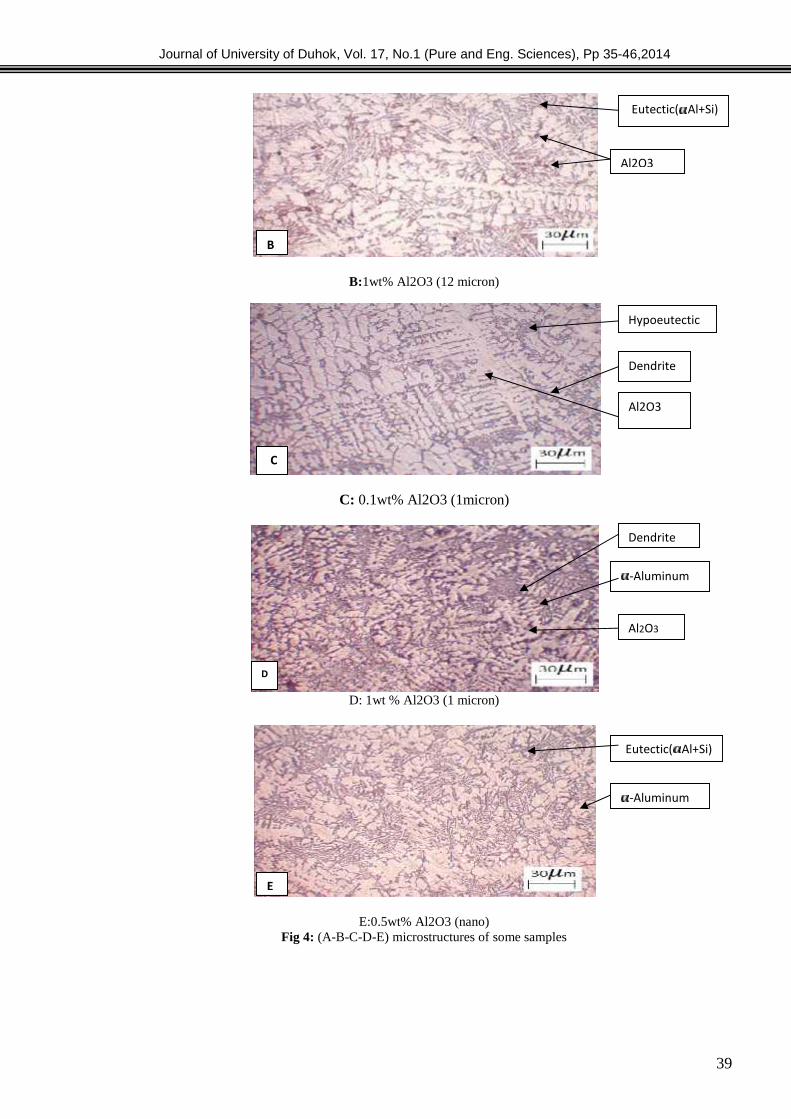
Journal of University of Duhok, Vol. 17, No.1 (Pure and Eng. Sciences), Pp 35-46,2014
39
B:1wt% Al2O3 (12 micron)
C: 0.1wt% Al2O3 (1micron)
D: 1wt % Al2O3 (1 micron)
E:0.5wt% Al2O3 (nano)Fig 4: (A-B-C-D-E) microstructures of some samples
c
D
Dendrite
-Aluminum
Al2O3
B
Eutectic( Al+Si)
Al2O3
E
Eutectic( Al+Si)
-Aluminum
Hypoeutectic
Dendrite
Al2O3
C

Journal of University of Duhok, Vol. 17, No.1 (Pure and Eng. Sciences), Pp 35-46,2014
40
Fig (5 a-b) the typical SEM images of nanoand micro composite samples and see some
agglomeration for Al2O3 in matrix structures .
Fig 5 (A-B):- Typical SEM images of nano and micro composite
2- Tensile strengthThe strength has prime importance in
engineering design such as yield strength,ultimate tensile strength and modulus ofelasticity. The most of these properties aredetermined by using ASTM standardizedtesting method.Table 5 shows mechanicalproperties of alloy 332 produced by casting.
Mechanical properties (σt & σy) and elongationare recorded. After preparation A332 wecompare it with nominal mechanical propertiesstandard from (ASM Handbook 2004).
Table( 5):- properties ofstandard and fabricated A332Property Alloy T
MPaY 0.2% MPa
E %
Nominal A 332 248 193 1Fabricated A332 250 195 1.5
A
C
B
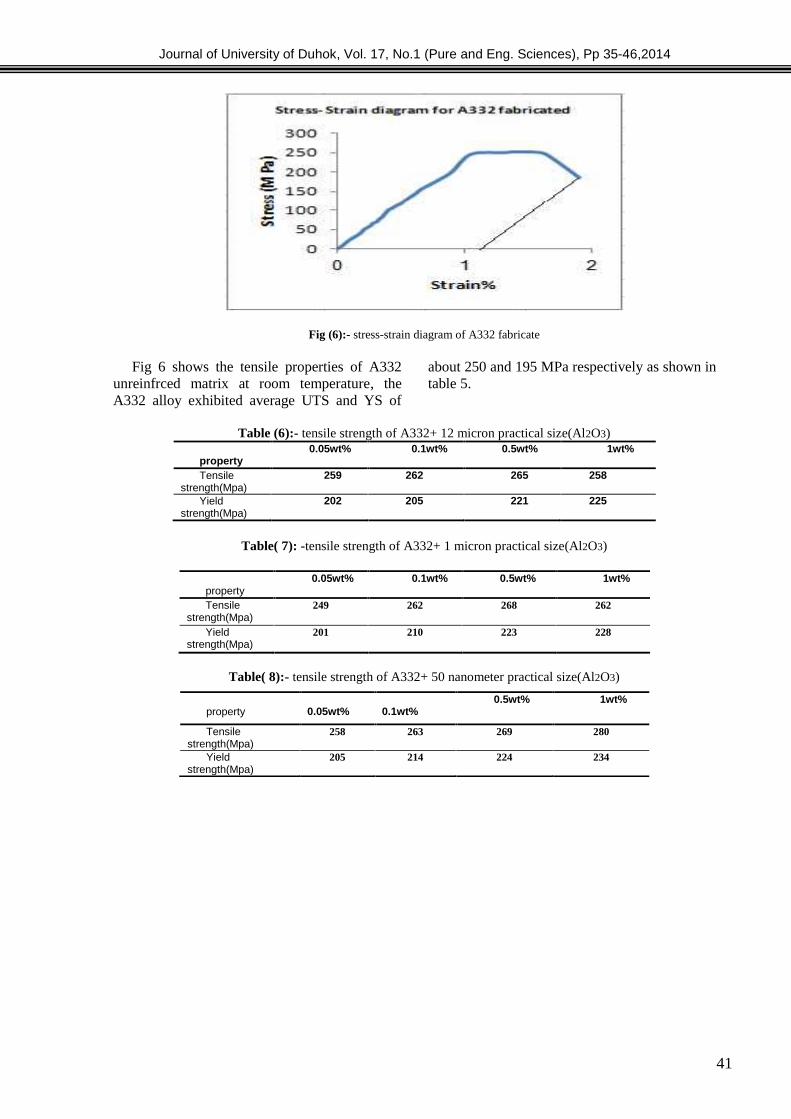
Journal of University of Duhok, Vol. 17, No.1 (Pure and Eng. Sciences), Pp 35-46,2014
41
Fig (6):- stress-strain diagram of A332 fabricate
Fig 6 shows the tensile properties of A332unreinfrced matrix at room temperature, theA332 alloy exhibited average UTS and YS of
about 250 and 195 MPa respectively as shown intable 5.
Table (6):- tensile strength of A332+ 12 micron practical size(Al2O3)
property0.05wt% 0.1wt% 0.5wt% 1wt%
Tensilestrength(Mpa)
259 262 265 258
Yieldstrength(Mpa)
202 205 221 225
Table( 7): -tensile strength of A332+ 1 micron practical size(Al2O3)
property0.05wt% 0.1wt% 0.5wt% 1wt%
Tensilestrength(Mpa)
249 262 268 262
Yieldstrength(Mpa)
201 210 223 228
Table( 8):- tensile strength of A332+ 50 nanometer practical size(Al2O3)
property 0.05wt% 0.1wt%0.5wt% 1wt%
Tensilestrength(Mpa)
258 263 269 280
Yieldstrength(Mpa)
205 214 224 234

Journal of University of Duhok, Vol. 17, No.1 (Pure and Eng. Sciences), Pp 35-46,2014
42
Fig (7):- Tensile strength and elongation for12 micron
Fig (8):- Tensile strength and elongation for1 micron
Fig (9):- Tensile strength and elongation for nano composite
00.511.522.533.544.55
248250252254256258260262264266268270
0 0.5 1 1.5
Elng
atio
n%
Tens
ile S
tren
gth
T(M
pa)
Alumina reinforced wt%
Tensile Strength
Elngation%
0
1
2
3
4
5
6
245
250
255
260
265
270
275
0 0.5 1 1.5
Elon
gatio
n%
Tens
ile S
tren
gth
T(M
pa)
Alumina reinforced wt%
Tensile Strength
Elngation%
01234567
245250255260265270275280285
0 0.5 1 1.5
Elon
gatio
n%
Tens
ile S
tren
gth
T(M
pa)
Alumina reinforced wt%
Tensile Strength
Elngation%

Journal of University of Duhok, Vol. 17, No.1 (Pure and Eng. Sciences), Pp 35-46,2014
43
Figures 7, 8 and 9 display the tensile curvesand elongation of the composites respectively. Itis believed that the great enhancement in tensilestress observed in these composites is due togood distribution of the nano- Al2O3 particlesand low degree of porosity, which leads toeffective transfer of applied tensile load to theuniformly distributed strong Al2O3 particulates.The grain reinforcement and strong
multidirectional thermal stress at the Al/ Al2O3interface are also important factors which play asignificant role in the high strength of thecomposites. Al2O3 particles have grain-refinedstrengthening effect, which is improved withincreasing volume fraction since they act as theheterogeneous nucleation catalyst for aluminiumthis result agree with the same result (BharathV 2012, (Ali Mazahery 2012).
Fig (10):- Yield strength for composite
The best yield strength is compositeA332+1wt% Al2O3 in different nano size ofalumina. The rate of increasing in yield strengthis 11%for 12 micron, 17% for 1 micron and 20%for nano alumina. From the above it isconcluded that the modulus of elasticity,yield strength and ultimate tensile strengthof aluminum cast composite materials islargely controlled by the selection of strongmatrix composition, smaller particles size,increasing volume fraction of particles. Furtherimprovements in mechanical properties inaluminum alloy based casting composite can beachieved by modifying the process parametersmetal treatment, the bonding between thedispersions and matrix and also reducing microporosities in the casting. In general the yieldstress increases with the particle volume fractionand a better orientation of the particle along thetensile axis. The addition of alumina don’t effecton young modulus of all sample which is about72GPa (_±2%).Higher elongation percentagevalue was obtained for A332 with 1wt% nanoalumina. It is observed that agglomerationincreases with increase in volume fraction butif the agglomeration is well bonded with
matrix, it can contribute to strengthen ofcomposites. The measure of the ductility instress strain diagram also represents thematerials toughness which is important propertyneeded for composite materials, the bestelongation is 6 in A332 with 1 wt% nanoalumina. The improvements in the ductilitycan be achieved through the control ofporosity, mechanical working deformationprocesses, reducing the particle size andincreasing the uniformly distribution of particlein aluminum composites (Daouda 2002,Madeva Nagaral 2013).
3-DensityThe density of A332 and their composite
were computed by mass- volume relation andplotted against wt % of alumina. As shown in fig(11) the density decreases with an increase inweight percentage of alumina in thecomposite.Also, according to the measured andtheoretical densities of composite samples, it isrevealed that the amount of porosity in thecomposite samples increases with increasingweight percentage of Al2O3 particles anddecreasing the size of particles (El-Sayed 2011).
190195200205210215220225230235240
0 0.5 1 1.5
Yiel
d St
ress
(Mpa
)
Alumina reInforced wt%
12 micron
1micron
nano

Journal of University of Duhok, Vol. 17, No.1 (Pure and Eng. Sciences), Pp 35-46,2014
44
Fig (11):- Density for composite
4- Hardness Measurements
Fig12 shows the results of micro hardnesstests conducted on A332 alloy compositecontaining different weight percentage of Al2O3particles. A significant increase in hardness ofthe alloy matrix can be seen with addition ofAl2O3 particles. Higher value of hardness isclear indication of the fact that the presences ofparticulates in the matrix have improved theoverall hardness of the composites. This is truedue to the fact that aluminium alloy is a softmaterial and the reinforced particle especiallyceramics material being hard, contributespositively to the hardness of the composites. Thepresence of stiffer and harderAl2O3reinforcement leads to
the increase in constraint to plasticdeformation of the matrix during the hardnesstest. Thus increase of hardness of compositescould be attributed to the relatively highhardness of Al2O3 itself. As shown in fig(12).The best composite in hardness isA332+1wt% Al2O3 (50nano alumina). Thepercentage value of increasing hardness is 50%between 0.05wt% to 1wt% (nano alumina), 37%between 0.05wt% to 1wt% (1 micron) and 25%between 0.05 wt % to 1 wt % (12 micron) so(Daouda 2002, H.R.Ezatpoura 2011, S.A.Sajjadi 2012) reached the same result ,thehardness of the composites is increased withincreased wt% and decrees of particle size.
Fig (12):- Hardness for composite
CONCLUSION
1. The results showed use of heat-treatedparticles, injection of particles and the stirringsystem were improved the wettability anddistribution of the nano particles more thanmicro particles within the aluminum melt.
2. The addition of nano particles results insignificant improvement in hardness, yieldstrength and ultimate tensile strength of thecomposites more than micro particales.
2.582.6
2.622.642.662.68
2.72.72
0 0.5 1 1.5
Dens
ity (g
/cm
^3)
Alumina reinforced wt%
12 micron
1micron
nano
020406080
100120140
0 0.5 1 1.5
Hard
ness
(Kgf
/mm
^2)
Alumina reInforced wt%
12 micron
1 micron
nano

Journal of University of Duhok, Vol. 17, No.1 (Pure and Eng. Sciences), Pp 35-46,2014
45
REFERENCES ASM Handbook, “Properties and Selection: Nonferrous
Alloy and Special-Purpose Materials”, Vol.2,2004.
Ali Mazahery, Mohsen Ostad Shabni Trans.Nonferrous Met. Soc. China 22(2012)pp275−280.
Bharath V, Mahadev Nagaral and V. Auradi*International Journal of Engineering Research& Technology (IJERT) Vol. 1 Issue 6, August- 2012 ISSN: pp 2278-0181.
Daouda A. and Reif W., Journal of MaterialsProcessing Technology, Vol. 123, (2002) pp.313–318.
El-Sayed Youssef El-Kady, Tamer SamirMahmoud, Mohamed Abdel-Aziz SayedMaterials Sciences and Applications, 2011, 2,390-398.
H.R.Ezatpoura,H.Beygia,S.A.Sajjadia,M.TorabiParizib"Conferences on applications ofNanotechnology in Sciences,Engineering andMedicine(NTC2011), 16-17 May2011Mashhad-Iran.
Habibnejad-Korayema M, Mahmudia R,Pooleb WJ,"Enhanced properties of Mg-based nanocomposites reinforced with Al2O3 nano –
particles. Mater Sci Eng A,2009, 519(1-2):pp198-203.
J. Hashim, L. Looney, M.S.J. Hashmi, Journal ofMaterials Processing Technology 92-93(1999) pp 1-7.
J. Hashim, L. Looney, M.S.J. Hashmi, Journal ofMaterials Processing Technology119 (2001)pp 324–328.
Kok, Journal of Materials Processing Technology161 (2005) pp 381–387.
Mazahery A, Abdizadeh,Baharvandihr,"Development of high- performance A356/nano Al2O3 composite. Mater Sci EngA,2009, 518 ,pp61-64.
M. Rosso, Journal of Materials ProcessingTechnology 175 (2006) pp 364–375.
Madeva Nagaral1*, Bharath V2 and V Auradi1Nagaral et al., J Material Sci Eng 2013, 2:1
N. Valibeyglooa, R. Azari Khosroshahib*Proceedings of the 4th InternationalConference on Nano structures (ICNS4)12-14 March, 2012, Kish Island, I.R. Iran
.S.A. Sajjadi a, H.R. Ezatpour a, M. Torabi Parizib Materials and Design 34 (2012) pp-06–111.
W. Zhou, Z.M. Xu, Journal of Materials ProcessingTechnology 63 (1997) pp 358–363.
(A332)
(Al2O3)

Journal of University of Duhok, Vol. 17, No.1 (Pure and Eng. Sciences), Pp 35-46,2014
46
(A332)(Stir Casting)
(OP)(SEM)
مقواة بدقائق مايكروية ونانوية من (A332)تحسين الخواص الميكانيكية والبنية المجهرية لسبيكة (Al2O3)
الخالصةان مركبات االلمنيوم المعززة بدقائق مايكروية ونانوية تستخدم على نطاق واسع في اغلب التطبيقات العسكرية
المشكلة الرئيسية في تصنيع المتراكبات . والفضائية والصناعات الكهربائية بسبب تحسن خواصها الفيزيائية والميكانيكيةاللتصاق مع الدقائق فيحدث توزيع غير متجانس للدقائق المايكروية المعدنية هو ان الطور السائل السائل يكون ضعيف ا
من اجل تحسين البنية المجهرية والخواص الميكانيكية للمتراكبات تم تحسين قابلية الترطيب للدقائق وتحسين . والنانويةتكتل والفصل بين حيث طبقت ثالث خطوات اثناء عملية السباكة لتجنب ال.قابلية توزيع الجسيمات داخل المتراكبة
الجسيمات وشملت المعالجة الحرارية للدقائق قبل عملية الحقن داخل المنصهر واستخدام غاز االركون الخامل بنسب وزنية مختلفة A332في هذا البحث تم اضافة دقائق مايكروية ونانوية الى سبيكة االلمنيوم .واستعمال عملية الخلط
كذلك تم اجراء (SEM)والكترونيا (OP)وتم فحص المسبوكات مجهريا (stir casting)باسخدام تقنية السباكة وقد اظهرت النتائج الى ان توزيع الدقائق المايكروية .فحوصات الشد والصالدة من اجل تحديد الخواص الميكانيكية
.والنانوية كان متجانس اضافة الى تحسن في خواص مقاومة الخضوع وقوة الشد وزيادة الصالدة

Journal of University of Duhok, Vol. 17, No.1 (Pure and Eng. Sciences), Pp 47-54, 2014
47
EOG SIGNAL ACQUISITION USING RECONFIGURABLE ANALOGDEVICES AND USE IT TO CONTROL WHEELCHAIR MOVEMENT
THAIR ALI SALIH and MOHAMMED TALAL GHAZAL
Dept. of Computer Technology Engineering, Technical College, Technical institution of Iraq, Mosul, Iraq
(Received: July 24, 2013; Accepted for publication: June 25, 2014)
ABSTRACTThis paper present an electrooculography (EOG) acquisition system based on reconfigurable devices.
The field programmable analog array FPAA is used for extract the EOG signal which makes it possible todesign flexible and adaptable EOG applications with the functionality that can be dynamically changed orextended. The EOG signals in this system have been acquired using a five-lead configuration. The FPAAhas online Programmable feature that can dynamically be adapted the amplifier to detect the signal, it isreduced the circuit complexity and succeeded in detect these weak signals which coupled with huge noise.The system is established and its performance was tested. It is used to guide an autonomous robot(wheelchair) as a system to help the people with severe disabilities. It was found that the proposed systemcould produce clear EOG signals which are suitable for many activates and the success percentage of thesystem is 95%.
KEY WORDS: FPAA, EOG, Wheelchair, Control, Robot.
INTRODUCTION
obot applications or more commonlytechnologies and know how derived
from robotic researches have quickly developedthrough the last years to actual products formedical uses (Colle et al., 2002). There hasbeen an increase in the development of assistivetechnology for people with multiple disabilities,and has made significant developments incommunication systems between humans andmachines (Barea et al., 2002, Barea et al., 2010).
The development of a wheelchair representsthe most important applications useful toincrease the mobility of persons with disabilitiesand / or elderly (Barea et al., 2002). The personswith a serious disability or handicap may find itdifficult or impossible to guide wheelchair so theeye movements can be used to develop newsystem between humans and machines.Previously the implementation of eye signalsand other bio signals acquisition circuits were achallenge for electronic circuit design. But thisresearch have been presents a new methodologyof detecting the eye movement usingreconfigurable analog devices. The designincorporates many salient features including anovel algorithm, which learns the eye signallevel of the user and helps in minimizing thenoise due to the user. It also provided withobstacle avoidance system, which is used to help
in guiding the patient user and prevent accidents.These features described are however not limitedto wheelchair control alone but can be applied tomany control system in general.
The Electrooculography (EOG) signals havebeen widely used in biomedical andrehabilitation engineering applications,particularly in wheelchair control system. Manyefficient wheelchair control using EOG signalshave been developed in the last decades, such aselectrical powered wheelchair control system(Barea et al., 2002). Also, on the basis of thephysiological and morphological data of theEOG, a previous model of the ocular motorsystem based on EOG was proposed(Bidimensional dipolar model EOG, BiDiM-EOG) (Barea, Boquete, Bergasa, Lopez, &Mazo, 2003), and many useful human- computerinterface (HCI) systems, such as activityrecognition based on eye movement analysis(Bulling et al., 2011), multitask gadget control(Gandhi et al., 2010), computer cursor control(Septanto et al., 2009), home automation (Harunand Mansor, 2009), computer animationapplication (Krupiński and Mazurek, 2009), eyewriting recognition (Tsai et al., 2008), mobilerobot control (Kim et al., 2007), visualimprovement system for the elderly (Yu et al.,2005), and hospital alarm system(Venkataramanan et al., 2005). Many techniqueshave been proposed to develop all of these HCIs,
R

Journal of University of Duhok, Vol. 17, No.1 (Pure and Eng. Sciences), Pp 47-54, 2014
48
which can be divided into two main types:pattern recognition and non-pattern recognition.In pattern recognition, features extracted arediscriminated by a suitable classifier (Brunner etal., 2007). Time-domain features that have beenfrequently used are mean value, peak duration,peak polarity and slope (Kherlopain et al., 2006).In addition, spectral analysis has been deployedas the useful features for eye movementclassification (Bukhari et al., 2010; Lv et al.,2010). All of these features are usuallyimplemented with two classifier types, that is,neural networks (Güven and Kara, 2006;Kikuchi and Fukushima, 2000; Lee and Lee,1993) and support vector machine (Bulling et al.,2011; Shuyan and Gangtie, 2009).
Indeed, the computational times andimplementation complexity become a majorlimitation of algorithm based on patternrecognition, particularly for implementing inmicrocontroller devices. Many research studieshave established better performance of EOGsignal classification based on non-patternrecognition (Deng et al., 2010; Gandhi et al.,2010). This technique has a simple structure.The classifier module of pattern recognitionalgorithm has been degraded to a simplethreshold comparison module. In this study, non-pattern recognition algorithm has beenimplemented in order to be used inmicrocontroller devices.
EOG signal conditioning and acquisitionsystems are consist of an analog conditioningstage that amplifies and filters the signal,followed by a digital stage performing thecontrol of wheelchair movement [since EOGsignal features (low differential voltageamplitude, high noise level and low frequencyband) suit perfectly the front-end ports of a FieldProgrammable Analog Array (FPAA) device.][The use of FPAA device provide the systemwith the ability to modify any feature that has tobe altered, as a function of the EOG signalquality being processed and the information thatis needed to extract at any time.] Moreover,minimal processing noise is achieved due to thepresence of a single analog device (Morales etal., 2011).
This paper has been divided into thefollowing sections: Section 2 describeselectrooculography (EOG) and the technique ofsensing electrical signals from the eyeball andsuitability to detect eye movements. Section 3includes EOG signal acquisition and processingrequirements. A study of FPAA suitability for
EOG signal acquisition, and the FPAA featuresthat may be used for reliable analog conditioningexplained in section 4. A microcontroller(Arduino mega 2560) system that enablesstandard electric wheelchair control by eyemovement is developed and a novel algorithm toguide the wheelchair movement is proposed insection 5. In section 6 the results and finally theconclusions and points to future research work insection 7.
ELECTROOCULOGRAPHY
The human eye is a spherical structure witha radius of 12mm. The signals that can be sensefrom the movement of the human eyes can beknown as Electrooculography. The EOG isderived from the Cornea Retinal Potential (CRP)that is generated within the eyeball by themetabolically active retinal epithelium. Theproduction of CRP comes from thehyperpolarization and depolarization’s of thenervous cells in the retina. EOG is the electricalrecording corresponding to the eye movement.The eye has a resting electrical potential, withthe front of the globe positive and back withglobe negative (Fig.1). This phenomenon wasfirst observed by Emil du Bois-Reymond in1848 and has been the foundation inelectrooculography (Bukhari et al., 2011).
Fig. (1) Ocular dipole.
The EOG value varies from 50 to 3500 μVwith a frequency range of about DC-100 Hz. Itsbehavior is practically linear for gaze angles of±30◦ and changes approximately 20 μV for eachdegree of eye movement. It should be pointedout here that the variables measured in thehuman body (any biopotential) are rarelydeterministic. Its magnitude varies with time,even when all possible variables are controlled(Barea et al., 2010). This means that thevariability of the electrooculogram readingdepends on many factors that are difficult to
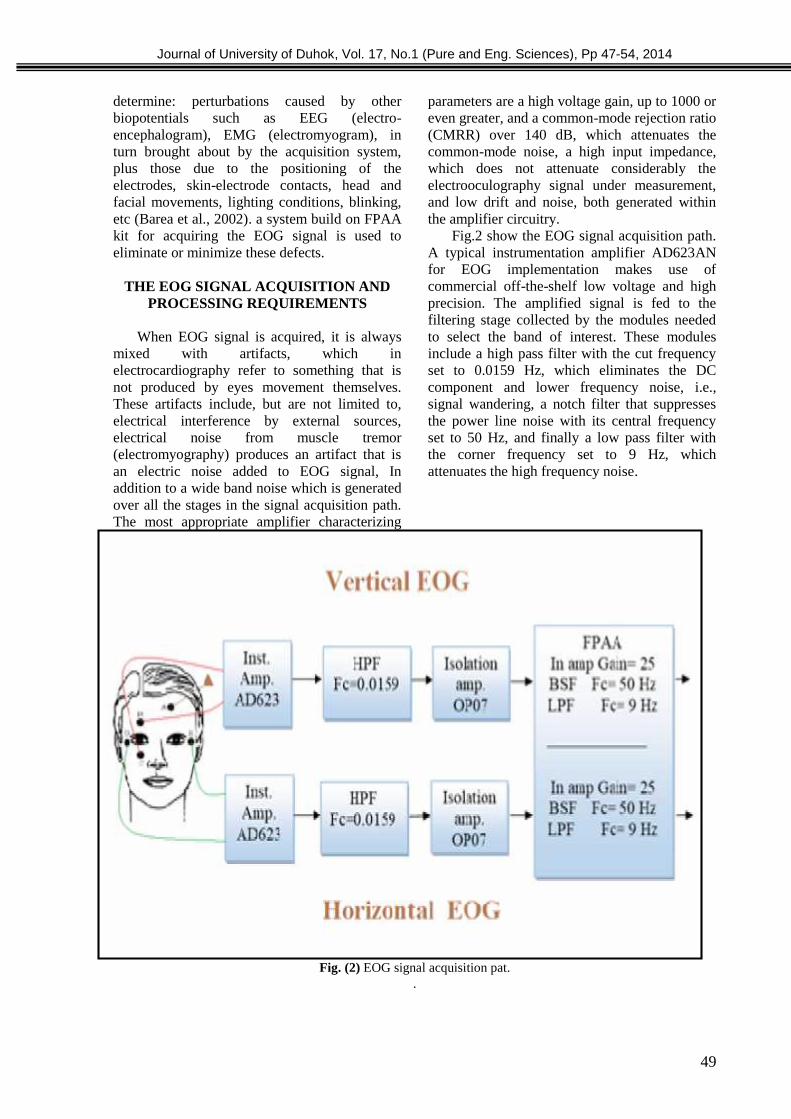
Journal of University of Duhok, Vol. 17, No.1 (Pure and Eng. Sciences), Pp 47-54, 2014
49
determine: perturbations caused by otherbiopotentials such as EEG (electro-encephalogram), EMG (electromyogram), inturn brought about by the acquisition system,plus those due to the positioning of theelectrodes, skin-electrode contacts, head andfacial movements, lighting conditions, blinking,etc (Barea et al., 2002). a system build on FPAAkit for acquiring the EOG signal is used toeliminate or minimize these defects.
THE EOG SIGNAL ACQUISITION ANDPROCESSING REQUIREMENTS
When EOG signal is acquired, it is alwaysmixed with artifacts, which inelectrocardiography refer to something that isnot produced by eyes movement themselves.These artifacts include, but are not limited to,electrical interference by external sources,electrical noise from muscle tremor(electromyography) produces an artifact that isan electric noise added to EOG signal, Inaddition to a wide band noise which is generatedover all the stages in the signal acquisition path.The most appropriate amplifier characterizing
parameters are a high voltage gain, up to 1000 oreven greater, and a common-mode rejection ratio(CMRR) over 140 dB, which attenuates thecommon-mode noise, a high input impedance,which does not attenuate considerably theelectrooculography signal under measurement,and low drift and noise, both generated withinthe amplifier circuitry.
Fig.2 show the EOG signal acquisition path.A typical instrumentation amplifier AD623ANfor EOG implementation makes use ofcommercial off-the-shelf low voltage and highprecision. The amplified signal is fed to thefiltering stage collected by the modules neededto select the band of interest. These modulesinclude a high pass filter with the cut frequencyset to 0.0159 Hz, which eliminates the DCcomponent and lower frequency noise, i.e.,signal wandering, a notch filter that suppressesthe power line noise with its central frequencyset to 50 Hz, and finally a low pass filter withthe corner frequency set to 9 Hz, whichattenuates the high frequency noise.
Fig. (2) EOG signal acquisition pat..

Journal of University of Duhok, Vol. 17, No.1 (Pure and Eng. Sciences), Pp 47-54, 2014
50
FPAA FOR EOG ANALOG SIGNALCONDITIONING
This section explores the fitness of FPAA forEOG analog signal acquisition and conditioning.The following presentation of the Anadigm®FPAA architecture and functionalities allows totie with EOG signals conditioning requirement.The EOG acquisition system is toughlyconditioned by the external signal features, likeamplitude, noise level and frequency bandwidthrequirements. So that the circuit implementationwould have to allow changing the gain to dealwith the lowering in the amplitude of the signal,also it must be capable to adjust the behavior ofthe filters in response to multiple noiseintensities. The FPAA can be simply meets thoserequirements. As well, the FPAA offer aninteresting balance between performance andcircuit design time. Practically the FPAAAN221E04 reconfigurable device from Anadigmwas used to get high accuracy results. TheAN221E04 device involves a 2x2 matrix of fullyConfigurable Analog Blocks (CABs), enclosedby a fabric of programmable interconnectresources. Configuration data is stored in an onchip SRAM configuration memory (Fathima etal., 2008). An AN221E04 Chip Overview isshown in (Fig. 3).
Fig. (3) Structure of the FPAA.
The four CABs have access to a single LookUp Table (LUT) which offers a new method ofadjusting any programmable element within thedevice in response to a signal or time base. It canbe used to implement arbitrary input-to-outputtransfer functions (companding, sensorlinearization), generate arbitrary signals, andeven perform voltage dependent filtering. A
voltage reference generator supplies referencevoltages to each of the CABs within the deviceand has external pins for the connection offiltering capacitors. Analog input signals can beconnected from the outside world via the fourConfigurable Input/output Cells (AN221E04manufacture data).
FPAA CONFIGURATION FOR EOGSIGNAL CONDITIONING
This section will present the elements ofFPAA that will be used for conditioning theEOG signal. A high pass filter was used toeliminate ground shifting problem occurs in theEOG signals before FPAA stage. A passive RCfilter was designed for that purpose with the cutfrequency set to 0.0159 Hz followed by isolationstage with OP07 operational amplifier to providesafety relating to the electrodes and reducehazards. The FPAA configuration is made by thesubsequent resources: the input cell chopperamplifier is employed by the lowest existinggain (16), chopper amplifier offerings a CMRRof 102 dB in addition to the input cellantialiasing filter is employed by its lowestallowable corner frequency (76 kHz). This filtereliminates the noise caused by the chopperamplifier switching clock. The EOG signal isprocessed in the internal CABs after it has beenamplified and filtered in the input cell.
The configuration of analog modules arereported in Table 1, which are defined in thefollowing. The notch filter that eliminates theAC line interferences is accomplished by theBiquadratic Filter CAM with gain set to (1). TheBiquadratic Filter CAM makes a full cycle,biquadratic (two pole) band stop filter with itsswitching clock set to 7.352 kHz. This clockfrequency allows the band-stop center frequencyto be set to 50 Hz. A quality factor (Q= 5) jamsother EOG signal components. Lastly the low-pass filter that eliminates noise components over9 Hz has been accomplished by a Bilinear FilterCAM in low pass configuration and with unitygain. The switching clock for this module is setto 7.352 kHz. This election enables theantialiasing filter hosted in the output cell toeliminate the noise generated by the switchedcapacitors within this CAM. The output cellantialiasing filter is set to its lowest possiblecorner frequency (76 kHz). The overallarchitecture provides a good signal to noiseratio. This circuit implementation occupies twoCABs, leaving unused two complete CABs, so

Journal of University of Duhok, Vol. 17, No.1 (Pure and Eng. Sciences), Pp 47-54, 2014
51
that, another full EOG analog processing pathcould be fitted within the same device which issuitable to acquire both vertical and horizontalchannels of the EOG acquisition system in thesame device.
Table 1: Configurable Analog Modules: FPAA
MICROCONTROLLER SYSTEM
The EOG signal is processed by Arduinomega 2560 microcontroller circuit which is usedto decide the direction flow for the wheelchair(right, left, forward or backward). To allow thewheelchair robot to detect obstacles in its way,an obstacles avoidance circuit has been attachedto the system as shown in (Fig.4). The Arduinoworked as a join part between the EOG signalacquisition circuit and the wheelchair movementcontrol system, in addition to obstaclesavoidance circuit.
Fig. (4) The Ultrasonic ranger SRF08 connectiondiagram with Arduino.
The microcontroller programmedaccording to the following algorithm:
- Initial inputs/output ports and SRF08 Ultrasonicsensor.
- Train the microcontroller by the acquired eyesignals (Up, Down, Right and left) from the usereye at the first 10 seconds.
- Check the distance between the wheelchair andobstacles to avoid collision.
- Acquire new signals and compare it with thetrained signals to determine the direction ofwheelchair movement.
- Delay 50 msec.- Repeat checking the distance and comparing
new acquired signals.- End.
The output of the system is connected withthe wheelchair controller, which is position thewheelchair in accordance with the user’scommand. Sensor data is processed by a novelalgorithm, implemented within themicrocontroller. Thus, user eye movement istranslated into electric wheelchair position.Through the performed experiment, the system’sability to correctly recognize user’s command isverified. The system block diagram is shown in(Fig.5).
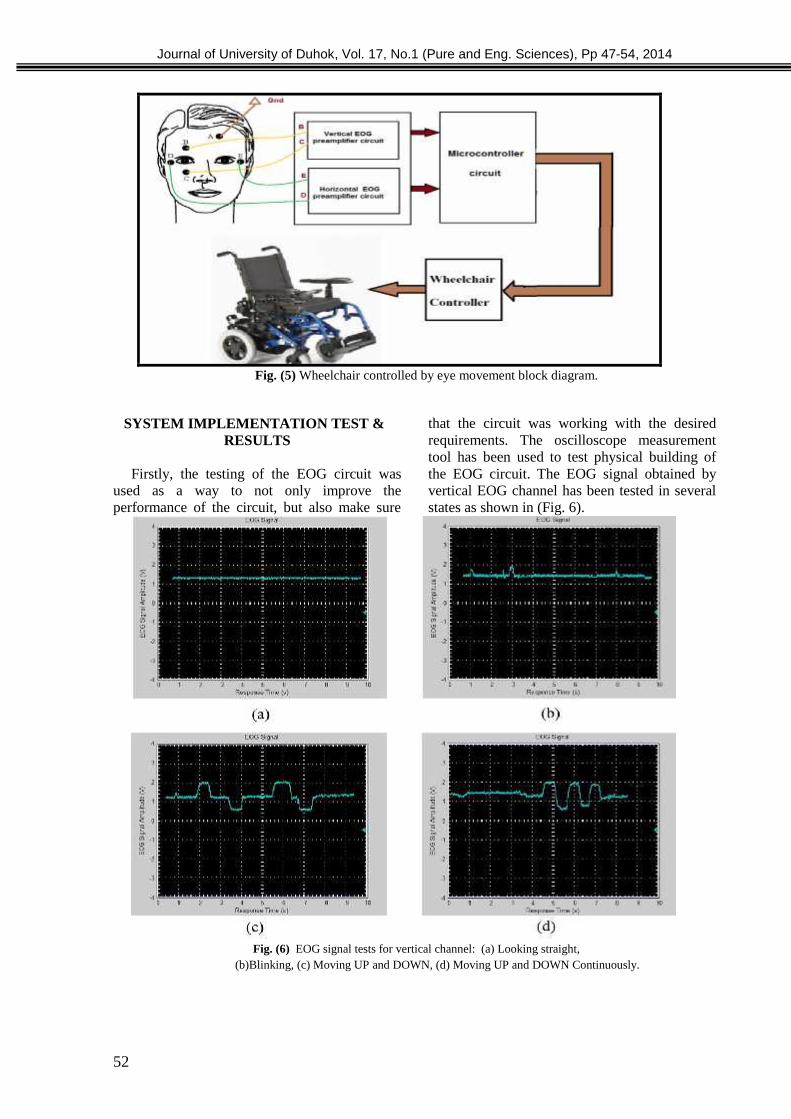
Journal of University of Duhok, Vol. 17, No.1 (Pure and Eng. Sciences), Pp 47-54, 2014
52
Fig. (5) Wheelchair controlled by eye movement block diagram.
SYSTEM IMPLEMENTATION TEST &RESULTS
Firstly, the testing of the EOG circuit wasused as a way to not only improve theperformance of the circuit, but also make sure
that the circuit was working with the desiredrequirements. The oscilloscope measurementtool has been used to test physical building ofthe EOG circuit. The EOG signal obtained byvertical EOG channel has been tested in severalstates as shown in (Fig. 6).
Fig. (6) EOG signal tests for vertical channel: (a) Looking straight,(b)Blinking, (c) Moving UP and DOWN, (d) Moving UP and DOWN Continuously.

Journal of University of Duhok, Vol. 17, No.1 (Pure and Eng. Sciences), Pp 47-54, 2014
53
As a results, a differential potential have beenoccurred when move the eyeballs, also, the EOGsignal amplitude increase with the increasing ofthe degree of movement. To test the overallsystem, select a suitable environment isimportant, the senior design lab represent thebest place for test because it has all of thesoftware simulation and hardware tools neededto assemble any parts that need it and test eachindividual part to make sure it arrived in goodworking condition, the test must begin on howwell it follows as well as its ability to avoidobstacles. The first test of the navigation system is tomove in a straight line. The chair moves forwardby moving the eyeball UP then moving theeyeball to the CENTER to stop the chair. Thenreturn back to the starting point by moving theeyeball to the DOWN position. In the second test the wheelchair rotating to theright and left respectively. The chair moves rightby moving the eyeball to RIGHT then movingthe eyeball to the CENTER to stop the chair.And finally, rotate to left by moving the eyeballto the LEFT. The third test is to determine what will happenif a static obstacle is placed in front of the chairsuch as a box. The chair will need to go away ofthe box while checking the output on the sensorto determine if chair has clear way to move.
CONCLUSION
This paper has been proposed a flexible EOGacquisition system using FPAA AnadigmAN221E04, which processed the detectedbioelectric signals generated from eyemovement. The EOG signal was successfullyused to generate driving and steering commandsfor a wheelchair. Which help many disabledpersons to control the wheelchair without help ofa caretaker. The system is tested and theprobability of command error is less than5%.Various user interfaces can be developed tocontrol different tasks using EOG signal likepainting and drawing on the intelligent board.
REFERENCES- Barea R, Boquete L, Mazo M, Lopez E (2002).
System for assisted mobility using eyemovements based oelectrooculography. IEEETrans. Neural Syst. Rehabil. Eng., 4: 209-218.
- Barea R, Boquete L, Mazo M, Lopez E, BergasaLM (2002). EOG guidance of a
wheelchair.Journal of Intelligent and RoboticSystems, vol. 34, p. 20, 2002.
- Barea R, Boquete L, Rodr?guez-Ascariz J,Ortega S,and Lopez E (2010). Sensory System forImplementing a Human—Computer InterfaceBased on Electrooculography. Sensors, vol.11(1), pp. 310-328.
- Brunner S, Hanke S, Wassertheuer S, HochgattererA (2007). EOG pattern recognition trial for ahuman-computer interaction. In: Stephanidis C(ed.) UAHCI 2007. LNCS, 4555: 769-776.
- Bukhari WM, Daud W, Sudirman R (2010). Awavelet approach on energy distribution of eyemovement potential towards direction. InProceedings of the IEEE Symposium onIndustrial Electronics and Applications, pp.181-185, IEEE Press.
- Bukhari, W.,Daud, W., and Sudirman, R (2011).Time Frequency Analysis ofElectrooculograph (EOG) Signal of EyeMovement Potentials Based on WaveletEnergy Distribution.fifth Asia ModellingSymposium, pp.81-86.
- Bulling A, Ward JA, Gellersen H, Tr?ster G (2011).Eye movement analysis for activityrecognition using electrooculography. IEEETrans. Pattern Anal. Mach. Intell. 33: 741-753.
- Colle, E., Rybarczyk Y., and Hoppenot P (2002).ARPH: An assistant robot for disabled people.IEEE Systems, Man and Cybernetics’02.Hammamet, Tunisia.
- Deng LY, Hsu DL, Lin TC, Tuan JS, Chang SM(2010). EOG-based human-computer interfacesystem development. Expert Syst. Appl. 37:3337-3343.
- Dynamically Reconfigurable FPAA AN221E04with Enhanced I/Ohttp://www.anadigm.com/_doc/DS030100-U006.pdf, last accessed July 05, 2013.
- Fathima, A., and Sanavullah, D (2008). AutonomusReconfiguration using FPAA for BandwitdhRecovery in Satellite Subsystems.International Journal of Computer Science andNetwork Security, VOL.8 No.7, pp.132-137.
- Gandhi T, Trikha M, Santhosh J, Anand S (2010).Development of an expert multitask gadgetcontrolled by voluntary eye movements.Expert Syst. Appl., 37: 4204-4211.
- Güven A, Kara S (2006). Classification of electro-oculogram signals using artificial neuralnetwork. Expert Syst. Appl., 31: 199-205.
- Harun H, Mansor W (2009). EOG signal detectionfor home appliances activation. In Proceedingsof the 5th International Colloquium on SignalProcessing and Its Applications, pp. 195-197,IEEE Press.

Journal of University of Duhok, Vol. 17, No.1 (Pure and Eng. Sciences), Pp 47-54, 2014
54
- Kherlopian AR, Gerrein JP, Yue M, Kim KE, KimJW, Sukumaran M, Sajda P (2006).“Electrooculogram based system for computercontrol using a multiple feature classificationmodel”, In Proceedings of the 28th IEEEEMBS Annual International Conference, IEEEPress. pp. 1295-1298.
- Kikuchi M, Fukushima K (2000). Patternrecognition with eye movement: a neuralnetwork model. In Proceedings of theInternational Joint Conference on NeuralNetworks, ACM Press. pp. 37-40.
- Krupiski R, Mazurek P (2009). Estimation of eyeblinking using biopotentials measurements forcomputer animation applications. In: Bolc L,Kulikowski JL, Wojciechowski K (eds.)ICCVG 2008. LNCS, 5337: 302-310.
- Lee J, Lee Y (1993). Saccadic eye-movementsystem modelling using recurrent neuralnetwork. In Proceedings of the InternationalJoint Conference on Neural Networks, pp. 57-60, IEEE Press.
- Lv Z, Wu XP, Li M, Zhang D (2010). A novel eyemovement detection algorithm for EOG drivenhuman computer interface. Pattern Recognit.Lett., 31: 1041-1047.
- Morales, D., Garcia, A., Castillo, E., Carvajal, M.,Banqueri, J. and Palma, A (2011). Flexible ecgacquisition system based on analog and digitalreconfigurable devices. Sensors and Actuators165, 261–270.
- Septanto H, Prihatmanto AS, Indrayanto A (2009).A computer cursor controlled by eye
movements and voluntary eye winks using asingle channel EOG. In Proceedings of theInternational Conference on ElectricalEngineering and Informatics, pp. 117-120,IEEE Press.
- Shuyan H, Gangtie Z (2009). Driver drowsinessdetection with eyelid related parameters bysupport vector machine. Expert Syst. Appl.,36: 7651-7658.
- Tsai JZ, Lee CK, Wu CM, Wu JJ, Kao KP (2008).A feasibility study of an eye-writing systembased on electrooculography. J. Med. Biol.Eng., 28: 39-46.
- Venkataramanan S, Prabhat P, Choudhury SR,Nemade HB, Sahambi JS (2005). Biomedicalinstrumentation based on electrooculogram(EOG) signal processing and application to ahospital alarm system. In Proceedings of the2nd International Conference on IntelligentSensing and Information Processing, pp. 535-540, IEEE Press.
- Yu M, Piao YJ, Kim YY, Kwon TK, Hong CU,Kim NG (2005). Study of the characteristic ofeye movement for visual improvement of theelderly. In Proceedings of the InternationalConference on Control, Automation andsystems.
نظام اكتساب اشارة العين بأستخدام االجهزة التناظرية القابلة العادة التشكيل برمجياً واستخدامها للسيطرة على حركة عربة المعوقين
الخالصةباالعتماد على االجهزة القابلة (EOG)تخطيط حركات العين الكهربائيةهذا البحث يقدم نظام اكتساب اشارة
مما يسهل العيناشارة الكتسابFPAAلقد استخدمت البوابات التناظرية القابلة للبرمجة . العادة التشكيل برمجياً ان . تخدام خمسة اقطاب حول العينينباسالعين اشارات استخلصت. التغيير ديناميكياً تقبلعملية تصميم تطبيقات مرنة
كشف االشارة المطلوبة لالمكبر ديناميكيا بحيث يكيف برمجيًا وبصورةافتهالقابلية على تغيير وظيالهالبوابات التناظرية. ارات الضعيفة المقترنة بضجيجلتقاط تلك االشالمادي للدائرة االلكترونية بنجاج وخصوصًا في االبناءمما يسهل عملية
االحتياجات تم انجاز النظام واختبار ادائه من اخالل استخدامه لقيادة عربة للمعاقين كنظام لمساعدة الناس من ذوي ويمكن استخدامها في العديد من كما واضحة العين بصورةلقد تمكن النظام المقترح من الحصول على اشارة . الخاصة
%.95التطبيقات حيث وصلت نسبة نجاحه الى

Journal of University of Duhok, Vol. 17, No.1 (Pure and Eng. Sciences), Pp 55-71, 2014
55
SEASONAL VARIATIONS OF RAW WATER OF TIGRISRIVER AND EFFECT ON QUALITY WATER PLANTS
LILYAN YAAQUB MATTI ALSAKAJCollege of Environmental science and technology, Mosul University-Iraq
(Received: August 4, 2013; Accepted for publication: June 2, 2014)
ABSTRACTThe study present an extensive investigation of physic-chemical parameters of water samples of Tigris
river at Baghdad. Water samples under investigations were collected from eight station during springseason(march, April, May), summer season( June, July, August) and autumn season (September, October- November)and winter season (December January, February) in the year 2008.
This study aimed at using 18 ecological parameters in evaluating the quality of the Tigris River forpublic usage, by choosing eight sampling sites along the river in Baghdad area. These parameters includedare Temperature 0C, Turbidity, pH value, Total hardness, Iron, Chlorides, EC, TDS, TSS, calcium,Sulfate, Nitrate, Fluoride, Total Alkalinity, Magnesium, DO, BOD5 and PO4
Parameters were used for calculating water quality seasonal variation in the Tigris River at study area.water temperature showed high seasonal variations, ranging from 12-17 °C in the winter, to 25.3-31.67°Cin the summer, pH values in all stations in Tigris River showed slightly alkaline, Conductivity distributionalong the river showed high values in the East Tigris, Rashed and Karam. Seasonally, the highestconductivity levels were observed in winter, Turbidity values in all stations in Tigris River were higher inthe autumn and winter during irrigation period, The lowest TH values were detected in Karkh for allseason while the highest value of TH at Rashed in autumn season, The calcium concentration values fallbetween 65 to 179.33 mg/l and the average is 122.165 mg/l. The magnesium concentration values fallbetween 29 to 39 mg/l and the average is 34 mg/l. the lowest chloride values were detected in winter,Chloride values varied from 32 to 113.87 mg/l, Total dissolved solids varied between (75 – 1324.7) mg/l inall study stations minimum of 75 mg/l in spring to a maximum of 1324.7 mg/l in Autumn , Seasonally, thehighest TSS values in all stations were observed in spring, while the lowest ones were detected in Summer, DO concentrations varied from 3.47 mg/l at Wethaba in autumn to 7.9 mg/l . Qadisiya in Summer, Thehighest BOD5 values in all stations except Karkh were observed in season. Sulfate values did not showlarge variations among stations in the same season, ranging from 190 mg/l at Karkh in winter to 405 mg/lat Al Qadisiya autumn, the highest NO3 values were observed in autumn in all stations. Al Karkh showedthe highest NO3 values.
The phenomenon of water quality degradation along Tigris was generally evident throughout theyear’s results. Therefore, the authorities should practice more efforts in controlling various activitiesalong the river bank. The urgent water management rules should be applied, enforcing waste-watertreatment systems among the factories and other activities
KEY WORDS: Environmental monitoring; seasonal variation; Water quality; Baghdad city, Tigris River.
INTRODUCTION
he city is located on a vast plain bisectedby the River Tigris. The Tigris splits
Baghdad in half, with the eastern half beingcalled 'Risafa' and the Western half known as'Karkh'. The land on which the city is built isalmost entirely flat and low-lying, being ofalluvial origin due to the periodic large floodswhich have occurred on the river.
Baghdad has a hot arid climates, in terms ofmaximum temperatures, one of the hottest cities
in the world. In the summer from June toAugust, the average maximum temperature is ashigh as 44 °C accompanied by blazing sunshine:rainfall is almost completely unknown at thistime of year. Temperatures exceeding 50 °C inthe shade are by no means unheard and even atnight temperatures in summer are seldom below24 °C. Because the humidity is very low (usuallyunder 10%) due to Baghdad's distance from themarshy Shatt al-Arab, dust storms from thedeserts to the west are a normal occurrenceduring the summer.
T
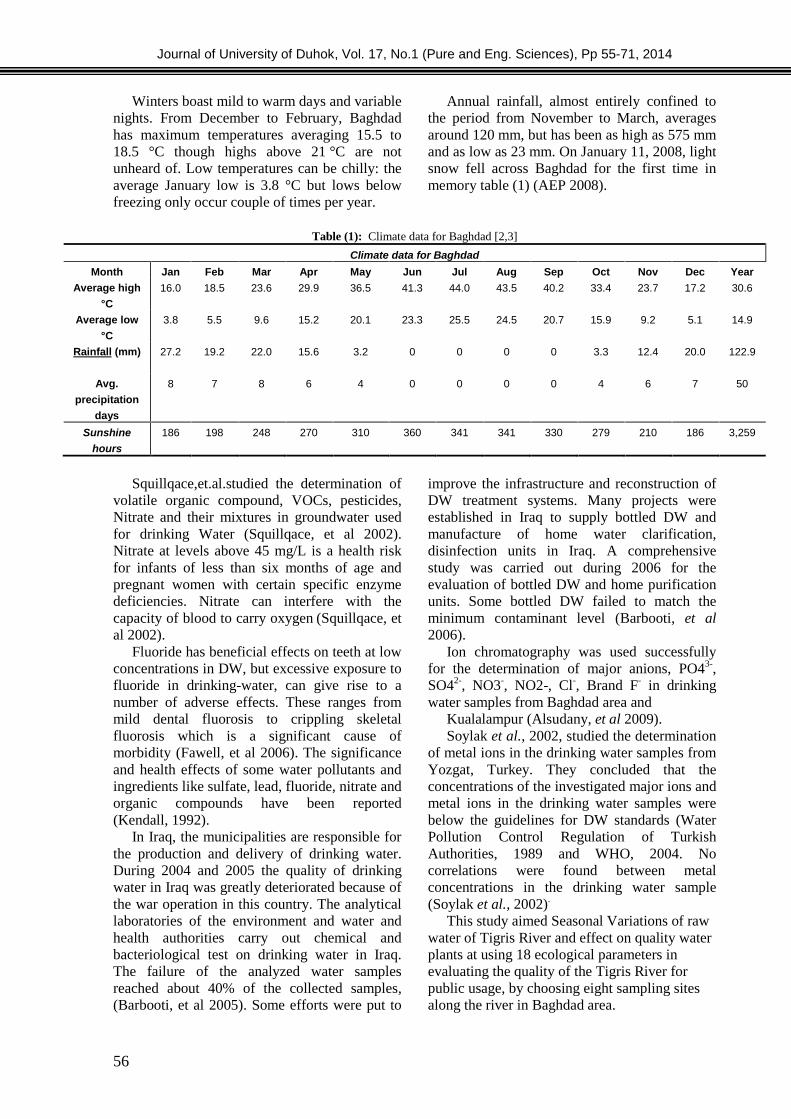
Journal of University of Duhok, Vol. 17, No.1 (Pure and Eng. Sciences), Pp 55-71, 2014
56
Winters boast mild to warm days and variablenights. From December to February, Baghdadhas maximum temperatures averaging 15.5 to18.5 °C though highs above 21 °C are notunheard of. Low temperatures can be chilly: theaverage January low is 3.8 °C but lows belowfreezing only occur couple of times per year.
Annual rainfall, almost entirely confined tothe period from November to March, averagesaround 120 mm, but has been as high as 575 mmand as low as 23 mm. On January 11, 2008, lightsnow fell across Baghdad for the first time inmemory table (1) (AEP 2008).
Table (1): Climate data for Baghdad [2,3]
Climate data for Baghdad
Month Jan Feb Mar Apr May Jun Jul Aug Sep Oct Nov Dec Year
Average high
°C
16.0 18.5 23.6 29.9 36.5 41.3 44.0 43.5 40.2 33.4 23.7 17.2 30.6
Average low
°C
3.8 5.5 9.6 15.2 20.1 23.3 25.5 24.5 20.7 15.9 9.2 5.1 14.9
Rainfall (mm) 27.2 19.2 22.0 15.6 3.2 0 0 0 0 3.3 12.4 20.0 122.9
Avg.
precipitation
days
8 7 8 6 4 0 0 0 0 4 6 7 50
Sunshine
hours
186 198 248 270 310 360 341 341 330 279 210 186 3,259
Squillqace,et.al.studied the determination ofvolatile organic compound, VOCs, pesticides,Nitrate and their mixtures in groundwater usedfor drinking Water (Squillqace, et al 2002).Nitrate at levels above 45 mg/L is a health riskfor infants of less than six months of age andpregnant women with certain specific enzymedeficiencies. Nitrate can interfere with thecapacity of blood to carry oxygen (Squillqace, etal 2002).
Fluoride has beneficial effects on teeth at lowconcentrations in DW, but excessive exposure tofluoride in drinking-water, can give rise to anumber of adverse effects. These ranges frommild dental fluorosis to crippling skeletalfluorosis which is a significant cause ofmorbidity (Fawell, et al 2006). The significanceand health effects of some water pollutants andingredients like sulfate, lead, fluoride, nitrate andorganic compounds have been reported(Kendall, 1992).
In Iraq, the municipalities are responsible forthe production and delivery of drinking water.During 2004 and 2005 the quality of drinkingwater in Iraq was greatly deteriorated because ofthe war operation in this country. The analyticallaboratories of the environment and water andhealth authorities carry out chemical andbacteriological test on drinking water in Iraq.The failure of the analyzed water samplesreached about 40% of the collected samples,(Barbooti, et al 2005). Some efforts were put to
improve the infrastructure and reconstruction ofDW treatment systems. Many projects wereestablished in Iraq to supply bottled DW andmanufacture of home water clarification,disinfection units in Iraq. A comprehensivestudy was carried out during 2006 for theevaluation of bottled DW and home purificationunits. Some bottled DW failed to match theminimum contaminant level (Barbooti, et al2006).
Ion chromatography was used successfullyfor the determination of major anions, PO43-,SO42-, NO3-, NO2-, Cl-, Brand F- in drinkingwater samples from Baghdad area and
Kualalampur (Alsudany, et al 2009).Soylak et al., 2002, studied the determination
of metal ions in the drinking water samples fromYozgat, Turkey. They concluded that theconcentrations of the investigated major ions andmetal ions in the drinking water samples werebelow the guidelines for DW standards (WaterPollution Control Regulation of TurkishAuthorities, 1989 and WHO, 2004. Nocorrelations were found between metalconcentrations in the drinking water sample(Soylak et al., 2002).
This study aimed Seasonal Variations of rawwater of Tigris River and effect on quality waterplants at using 18 ecological parameters inevaluating the quality of the Tigris River forpublic usage, by choosing eight sampling sitesalong the river in Baghdad area.

Journal of University of Duhok, Vol. 17, No.1 (Pure and Eng. Sciences), Pp 55-71, 2014
57
THE STUDY SITES
In this study, eight stations along Tigris Riverin Baghdad were chosen Fig (1): Karkh works isin the north of Baghdad on the west bank of theTigris. East Tigris treatment plant is locatedclose to the northern suburb of the cityapproximately (1Km) downstream of the northbridge , Karam treatment plant is located withinthe city on the west bank of the Tigris. Wethbatreatment plant is situated within the city area onthe east bank of the Tigris river downstream ofthe Sarafiya rail way bridge near the madenatAl-Tub, Qadisiya treatment plant is situatedwithin the city area on the west bank adjacent toUmm Al Qanazir land , the intake pollutedlocation and condition due it because a smallchannel located between the island and the westbank ,a short distance downstream from the AlKair river outlet into the river channel , Douratreatment plant, on the west bank of the river justdownstream of Dora power station, within thecity area, Rashed treatment plant is located closeto the present downstream limit of citydevelopment on the east bank of the riverbetween port of Al Rashed Army Comp and theriver , short distance downstream of Al Dorabridge .The area around the treatment plantincludes various industrial development.
Fig (1): Map of Iraq showing the sample sites on Tigris River (A. M. RABEE ET AL.2011)
Karkh
East Tigris
Karam Wethba
Qadisiya
Doura
Rashed
Wohda

Journal of University of Duhok, Vol. 17, No.1 (Pure and Eng. Sciences), Pp 55-71, 2014
58
MATERIALS AND METHODS
All data in research collected from laboratorieswater treatment plants, through 2008 year , the
data covered the physical and chemicalproperties of the water of the river Tigris at eight
water supply intakes these are Temperature,Turbidity, pH value, Total hardness, Iron ,
Chlorides , EC, TDS , TSS, Calcium, Sulfate,Nitrate, Fluoride, Total Alkalinity, Magnesium,Oxygen dissolved , BOD5 and PO4 table(2).
RESULTS & DISCUSSION
The spatial and temporal variations ofmonitored parameters in the surface waters ofthe Tigris River are shown in Figures (2 –19).During the study period, water temperatureshowed high seasonal variations, ranging from12-17 °C in the winter, 25.3-31.67 °C in thesummer table (5),Wethba showed high water
temperatures, while low water temperatures weredetected in Doura, Fig (2).
pH values in all stations in Tigris Rivershowed slightly alkaline. The lowest pH valueswere detected in Doura Fig (3). It is obvious thatthe pH was relatively stable among and withinstations during the year. It ranged between 7.8-8.16. Seasonal variation of the pH values did notshow significant differences, all the results are
NO. PARAMETERS UNITS DRINKING WATER
WHO Standard
Experimental value
(range)
HDL MPL
1 Temperature °C --- ----- 12-31.67
2 Turbidity NTU 5 10 0.497-90
3 pH value - 6.5 to 8.5 No relaxation 7.8-8.16
4 Total hardness (as
CaCO3)
mg/l 300 600 290.7-523.3
5 Iron mg/l 0.3 1.0 0.153- 2.23
6 Chlorides mg/l 250 1000 32 - 113.87
7 Total Dissolved Solids mg/l 500 2000 75 – 1324.7
8 Calcium mg/l 75 200 65 - 179.33
9 Sulphate mg/l 200 400 190-405
10 Nitrate mg/l 50 No relaxation 0.24 - 0.568
11 Fluoride mg/l 1.0 1.5 0.06 - 0.26
12 Total Alkalinity mg/l 200 600
13 Magnesium mg/l 30 150 29 -39
14 Oxygen Observed from
KMnO4 at 37°C in 3
hrs.
mg/l 3.0 No relaxation 3.47 - 7.9
15 Total Suspended
Solids
mg/l 20 150 26.83 - 131
16 EC µS/cm 250 607.16- 3269
17 BOD5 mg/l 10 40 …………..
18 PO4 mg/l 10 10 ………….
Table (2): The average values of physic- chemical parameters of Tigers River water at r HDL:Highest Desirable Limit; MPL; Maximum Permissible Limit

Journal of University of Duhok, Vol. 17, No.1 (Pure and Eng. Sciences), Pp 55-71, 2014
59
within the acceptable limits (6.5 – 8.5). Howeverthe WHO regulations do not include limits forthe pH values for drinking water. Europeanstandard includes a range of 6.5 – 9.5 for the pHof drinking water.
Conductivity distribution along the rivershowed high values in the East Tigris, Rashedand Karam. Seasonally, the highest conductivitylevels were observed in winter table (3).Conductivity values ranged from 607.16-to 3269µS/cm. Fig (4). The EC measurement of thesamples indicated that the raw watercharacterized by relatively high and fluctuatingEC values. The Iraqi standard does not includelimits for the EC values of drinking water.Meanwhile, the WHO and the Europeanstandards recommended value of EC is 250µS/cm. This matter needs to be studied tocorrelate the EC values with human health andto manage for the introduction of EC limitswithin the Iraqi Standard. The increase in EC isrelated to the increase in chloride and sulfateions.
Turbidity values varied from 0.497 at Karkhin summer table (5), to 90 NTU at Wohda inautumn table (6) .Turbidity values in all stationsin Tigris River were higher in the autumn andwinter during irrigation period Fig (5) .Autumnand Winter recorded the highest values, thiscould be attributed to presence of organic matterpollution, other effluents, runoff with a highsuspended matter content and heavy rain fall.The lower values re-corded in summer can bethat, at that time, all the tributaries had dried up,thus, reducing the influx of suspended matter.
From our experience, the water hardness ofthe Baghdad aqueduct of calcium carbonateequivalent dissolved in water. As for the stationsanalyzed for 2008, the water hardness is wavingbetween 290.7- 523.3 The lowest TH valueswere detected in Karkh for all season Fig (6),while the highest value of TH at Rashed inautumn season table 6 In theory this parametershould be more homogeneous but it is notinfluencing the properties of the drinking water.The only effect is on the cleaning performancesduring washing. It is interesting that the hardnessvalues for water samples taken in Turkey whichis located upstream of Tigris River rangesbetween 50 – 300 mg/l (Soylak, et al 2002).
The results of the major cations, Ca2+, Mg2+,concentrations are given in fig7, 8. The calciumconcentration values fall between 65 to 179.33mg/l and the average is mg/l. The magnesium
concentration values fall between 29 to 39 mg/Land the average is mg/l.
Chloride values varied from 32 to 113.87mg/l, Qadisiya and Wethaba showed highchloride concentrations, while the lowest valueswere observed in Karam ,Karkh and WohdaFig(9). Seasonally, the lowest chloride valueswere detected in winter table 3. Chloride valuesvaried from 32 to 113.87 mg/l.
The various levels of iron in differentsamples between 0.153- 2.23 mg/l Fig (10),original pH of the river water is between 7.5 and8.16. Corrosion of the pipes could partly explainthis observation, because flocculation is seldomperformed in Iraq by ferric chloride (FeCl3). Inany case, the relatively high levels of iron arenot impacting the quality of the drinking waterexcept the taste and the red residues on basins,showers, toilets.
Fluoride has beneficial effects on teeth at lowconcentrations in drinking water, but excessiveexposure to fluoride in drinking-water, can giverise to a number of adverse effects. These rangesfrom mild dental fluorosis to crippling skeletalfluorosis which is a significant cause ofmorbidity (Fawell, et al.,2006).The significanceand health effects of some water pollutants andingredients like sulfate, lead, fluoride, nitrate andorganic compounds have been reported(Kendall, 1992). Values varied from 0.06 to 0.26mg/l, Whoda and Rashed showed high fluorideconcentrations, while the lowest values wereobserved in Karam Fig (11). Seasonally, thelowest chloride values were detected in summertable (5) while the highest value autumn table(6).
Total dissolved solids varied between 75 –1324.7 mg/l in all study stations Fig (12) andranged from a minimum of 75 mg/l in springTable 4to a maximum of 1324.7 mg/l in autumntable (6) as average. The high dissolved solidsrecorded in autumn could be because ofdomestic effluent discharges and surface runofffrom the cultivated fields which might haveincreased the concentration of ions. Theobserved high concentration of dissolved solidsin the surface water is a pointer to the fact thatthere are intense anthropogenic activities alongthe course of the river and run-off with highsuspended matter content (UNESCO, WHO,UNEP, 2001).
Seasonally, the highest TSS values in allstations were observed in spring table (4), whilethe lowest ones were detected in summer table(5). TSS values varied from 26.83 to 131 mg/l.

Journal of University of Duhok, Vol. 17, No.1 (Pure and Eng. Sciences), Pp 55-71, 2014
60
Karam showed the highest TSS value in spring,while Karam exhibited the lowest one in autumnFig (13).
DO concentrations varied from 3.47 mg/l atWethaba in autumn to 7.9 mg/l.at Qadisiya insummer. DO values were higher in summer andautumn Tables (5, 6) all Stations above 3mg/l ofall season variation Fig 14. According to theUSDA, 1992, the level of oxygen depletiondepended primarily on the amount of addedwaste, the size, velocity and turbulence of thestream, the initial DO level in the water and inthe stream, and the temperature of the water.
BOD5 values varied from 3.6 mg/l at Karkhin winter to 60.7 mg/l at Wethba in autumn Fig(15). The highest values in all stations exceptKarkh were observed in season.. The high BOD5
value Table (6), may be due to discharge oforganic wastes (e.g. refuse, human and animalexcreta, soap, etc.) into the water, resulting inthe uptake of oxygen in the oxidative breakdownof these wastes (Abdul, et al 2009). It is obviousthat the BOD5 concentration decreases graduallyduring the river passage downstream of the river.This phenomenon can be attributed to the naturalself-purification of the river and the lack ofoutfalls along this stretch.
Sulfate values did not show large variationsamong stations in the same season, ranging from190 mg/l at Karkh in winter to 405mg/l atQadisiya Autumn Fig (16).People that are notused to drinking water with high levels of sulfatecan experience dehydration and diarrhoea.Babies are more sensitive to sulfate than adults.As a safety measure, water with a sulfate levelexceeding 400 ppm should not be used in thepreparation of baby food (WHO directives).Older children and adults become used to highsulfate levels after a few days. In any case, waterwith high sulfates should be avoided for therehydration of people with diarrhoea. To confirmthis hypothesis, it is necessary to carry out somechecks on the raw water. Only these analyseswill confirm the real origin of sulfates.Relatively high level of magnesium, if comparedwith the Calcium content, should maintain thesulfate in solution. This is the reason why theaddition of Calcium Hydroxide should help toremove the excess of sulfates.
NO3 values varied from 0.24 to 0.568 mg/lFig (17). Seasonally, the highest NO3 valueswere observed in autumn in all stations. Karkhshowed the highest NO3 values. The high levelsof nitrate recorded in winter might have beenbecause of surface runoff from agriculturalactivities into the river from the rains. All thenitrate values were within the “no effect” rangeof (0 – 6) mg/l for drinking water use (WRC,2003). This indicates that no adverse healtheffects were expected during the samplingmonths.
The phosphate values obtained is within thetolerable limits. The total phosphateconcentrations in study period varied between(0.001 - 0.30) mg/l Fig (18), with recorded highvalues in winter table (3), which suggest thatphosphorus is rarely found in highconcentrations in waters as it is actively taken upby plants. High concentrations of phosphates canindicate the presence of pollution and are largelyresponsible for eutrophic conditions (WHO,1998). The phosphate levels increased duringwinter due to agricultural runoff containingphosphate fertilizers as well as waste watercontaining detergents.
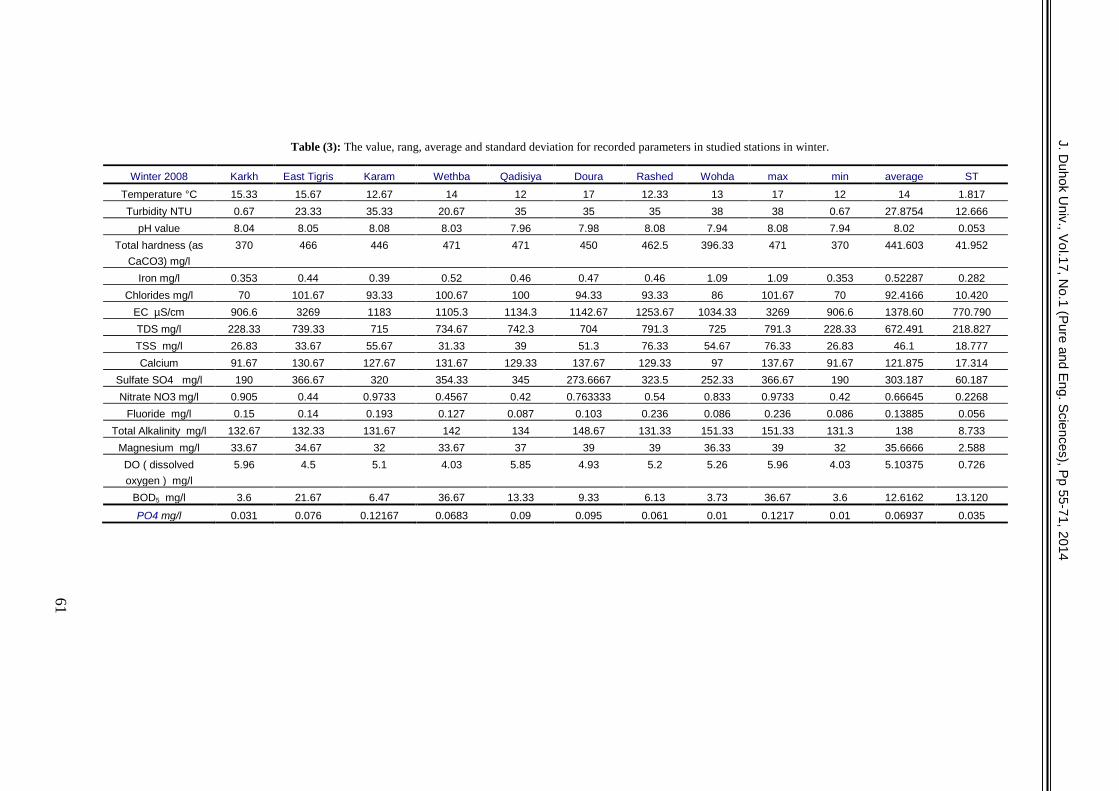
J. Du
ho
k Un
iv., Vo
l.17
, No
.1(P
ure
an
d E
ng
. Scie
nce
s), Pp
55-7
1,
20
14
Table (3): The value, rang, average and standard deviation for recorded parameters in studied stations in winter.
Winter 2008 Karkh East Tigris Karam Wethba Qadisiya Doura Rashed Wohda max min average ST
Temperature °C 15.33 15.67 12.67 14 12 17 12.33 13 17 12 14 1.817
Turbidity NTU 0.67 23.33 35.33 20.67 35 35 35 38 38 0.67 27.8754 12.666
pH value 8.04 8.05 8.08 8.03 7.96 7.98 8.08 7.94 8.08 7.94 8.02 0.053
Total hardness (as
CaCO3) mg/l
370 466 446 471 471 450 462.5 396.33 471 370 441.603 41.952
Iron mg/l 0.353 0.44 0.39 0.52 0.46 0.47 0.46 1.09 1.09 0.353 0.52287 0.282
Chlorides mg/l 70 101.67 93.33 100.67 100 94.33 93.33 86 101.67 70 92.4166 10.420
EC µS/cm 906.6 3269 1183 1105.3 1134.3 1142.67 1253.67 1034.33 3269 906.6 1378.60 770.790
TDS mg/l 228.33 739.33 715 734.67 742.3 704 791.3 725 791.3 228.33 672.491 218.827
TSS mg/l 26.83 33.67 55.67 31.33 39 51.3 76.33 54.67 76.33 26.83 46.1 18.777
Calcium 91.67 130.67 127.67 131.67 129.33 137.67 129.33 97 137.67 91.67 121.875 17.314
Sulfate SO4 mg/l 190 366.67 320 354.33 345 273.6667 323.5 252.33 366.67 190 303.187 60.187
Nitrate NO3 mg/l 0.905 0.44 0.9733 0.4567 0.42 0.763333 0.54 0.833 0.9733 0.42 0.66645 0.2268
Fluoride mg/l 0.15 0.14 0.193 0.127 0.087 0.103 0.236 0.086 0.236 0.086 0.13885 0.056
Total Alkalinity mg/l 132.67 132.33 131.67 142 134 148.67 131.33 151.33 151.33 131.3 138 8.733
Magnesium mg/l 33.67 34.67 32 33.67 37 39 39 36.33 39 32 35.6666 2.588
DO ( dissolved
oxygen ) mg/l
5.96 4.5 5.1 4.03 5.85 4.93 5.2 5.26 5.96 4.03 5.10375 0.726
BOD5 mg/l 3.6 21.67 6.47 36.67 13.33 9.33 6.13 3.73 36.67 3.6 12.6162 13.120
PO4 mg/l 0.031 0.076 0.12167 0.0683 0.09 0.095 0.061 0.01 0.1217 0.01 0.06937 0.035
61
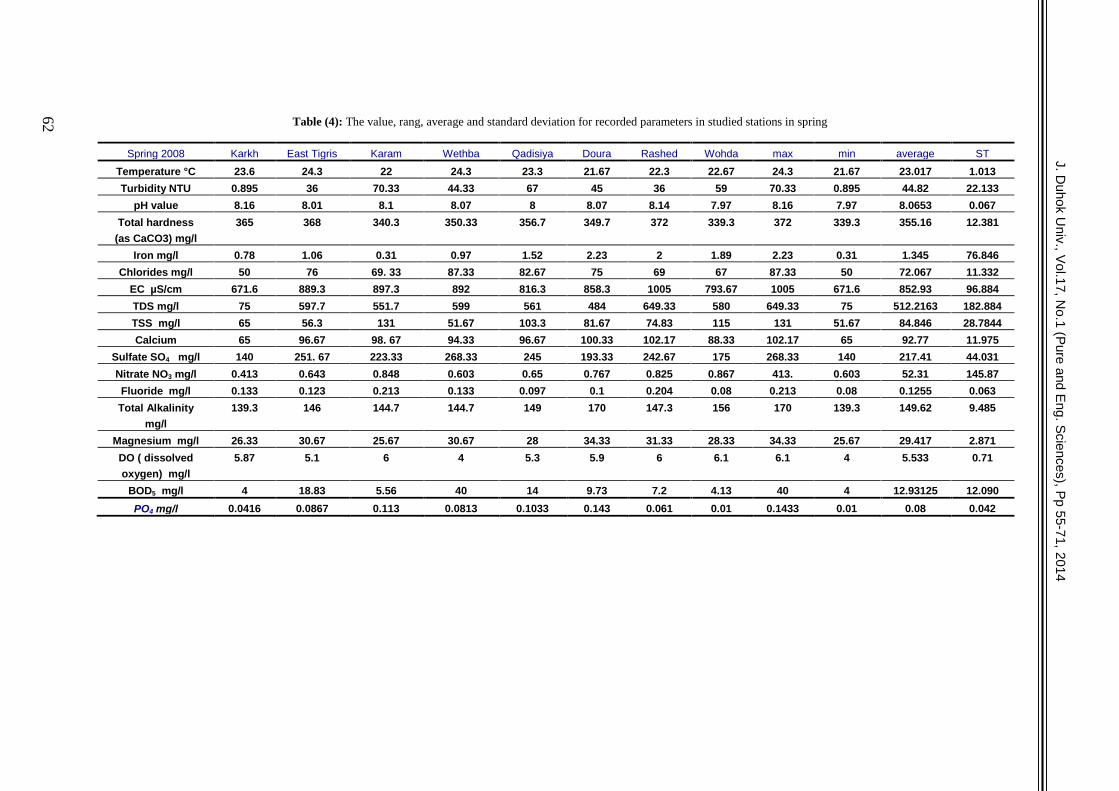
J. Du
ho
k Un
iv., Vo
l.17
, No
.1(P
ure
an
d E
ng
. Scie
nce
s), Pp
55-7
1,
20
14
Table (4): The value, rang, average and standard deviation for recorded parameters in studied stations in spring
Spring 2008 Karkh East Tigris Karam Wethba Qadisiya Doura Rashed Wohda max min average ST
Temperature °C 23.6 24.3 22 24.3 23.3 21.67 22.3 22.67 24.3 21.67 23.017 1.013
Turbidity NTU 0.895 36 70.33 44.33 67 45 36 59 70.33 0.895 44.82 22.133
pH value 8.16 8.01 8.1 8.07 8 8.07 8.14 7.97 8.16 7.97 8.0653 0.067
Total hardness
(as CaCO3) mg/l
365 368 340.3 350.33 356.7 349.7 372 339.3 372 339.3 355.16 12.381
Iron mg/l 0.78 1.06 0.31 0.97 1.52 2.23 2 1.89 2.23 0.31 1.345 76.846
Chlorides mg/l 50 76 69. 33 87.33 82.67 75 69 67 87.33 50 72.067 11.332
EC µS/cm 671.6 889.3 897.3 892 816.3 858.3 1005 793.67 1005 671.6 852.93 96.884
TDS mg/l 75 597.7 551.7 599 561 484 649.33 580 649.33 75 512.2163 182.884
TSS mg/l 65 56.3 131 51.67 103.3 81.67 74.83 115 131 51.67 84.846 28.7844
Calcium 65 96.67 98. 67 94.33 96.67 100.33 102.17 88.33 102.17 65 92.77 11.975
Sulfate SO4 mg/l 140 251. 67 223.33 268.33 245 193.33 242.67 175 268.33 140 217.41 44.031
Nitrate NO3 mg/l 0.413 0.643 0.848 0.603 0.65 0.767 0.825 0.867 413. 0.603 52.31 145.87
Fluoride mg/l 0.133 0.123 0.213 0.133 0.097 0.1 0.204 0.08 0.213 0.08 0.1255 0.063
Total Alkalinity
mg/l
139.3 146 144.7 144.7 149 170 147.3 156 170 139.3 149.62 9.485
Magnesium mg/l 26.33 30.67 25.67 30.67 28 34.33 31.33 28.33 34.33 25.67 29.417 2.871
DO ( dissolved
oxygen) mg/l
5.87 5.1 6 4 5.3 5.9 6 6.1 6.1 4 5.533 0.71
BOD5 mg/l 4 18.83 5.56 40 14 9.73 7.2 4.13 40 4 12.93125 12.090
PO4 mg/l 0.0416 0.0867 0.113 0.0813 0.1033 0.143 0.061 0.01 0.1433 0.01 0.08 0.042
62

J. Du
ho
k Un
iv., Vo
l.17
, No
.1(P
ure
an
d E
ng
. Scie
nce
s), Pp
55-7
1,2
01
4
Table (5): The value, rang, average and standard deviation for recorded parameters in studied stations in summer
Summer 2008 Karkh East Tigris Karam Wethba Qadisiya Doura Rashed Wohda max min average ST
Temperature °C 30.7 31.67 28.67 31.67 30 25.3 31.33 31 31.67 25.3 30.04 25.3
Turbidity NTU 0.497 37.33 25.33 24.33 26.67 27.33 25 59 59 0.497 28.18 0.497
pH value 8.03 8.02 8.1 8.04 7.9 7.88 8.07 7.97 8.1 7.88 8.001 7.88
Total hardness (as
CaCO3) mg/l 290.7 496.3 462.3 485.7 348.97 473.3 475.3 407 496.3 290.7 429.94 290.7
Iron mg/l 0.42 0.76 0.29 0.54 0.153 1.33 0.937 0.817 1.33 0.153 0.65 0.153
Chlorides mg/l 75 98 99 101 107 95.33 90 67 107 67 91.54 67
EC µS/cm 813.3 1120.7 1236.7 1110.3 1179.3 1194.3 1200.3 1023 1236.7 813.3 1109.74 813.3
TDS mg/l 722 746.7 727.67 767.7 759.3 707.3 831.3 733.3 831.3 707.3 749.41 707.3
TSS mg/l 34 52.7 52.5 45.67 56.3 47.67 51.83 45 56.3 34 48.21 34
Calcium 66.33 179.33 148 154.67 153.67 151.33 133.33 88.33 179.33 66.33 134.37 66.33
Sulfate SO4 mg/l 188.33 382 349.67 393 388. 33 253.33 315.33 175 393 175 305.62 175
Nitrate NO3 mg/l 0.33 0.26 0.507 0.267 0.24 0.43 0.395 0.87 523.33 0.24 65.79 0.24
Fluoride mg/l 0.14 0.143 0.177 0.153 0.123 0.113 0.223 0.06 0.223 0.06 0.14 0.06
Total Alkalinity mg/l 129 106 113 108 121 123 117.83 143 143 106 120.10 106
Magnesium mg/l 27 30 24.33 28.67 28 35 36.67 28.33 36.67 24.33 29.75 24.33
DO ( dissolved
oxygen ) mg/l 5.97 6.13 7.03 4.17 7.9 7 7 7.17 7.9 4.17 6.54 4.17
BOD5 mg/l 5.17 25.83 8.17 54.67 15.5 12.87 8 5.37 54.67 5.17 16.94 5.17
PO4 mg/l 0.045 0.06 0.073 0.051 0.088 0.043 0.083 0.01 0.088 0.01 0.056 0.01
63

J. Du
ho
k Un
iv., Vo
l.17
, No
.1(P
ure
an
d E
ng
. Scie
nce
s), Pp
55-7
1,2
01
4
Table 6. The value, rang, average and standard deviation for recorded parameters in studied stations in Autumm
Autumm 2008 Karkh East tigris Karam Wethba Qadisiya Doura Rashed Wohda max min average ST
Temperature °C 25.3 25.67 24.3 25.7 23.7 22 25 24.33 25.7 22 24.5 1.23
Turbidity NTU 0.63 53.33 51.33 54 50.33 46.67 50.33 90 90 0.65 49.58 24.12
pH value 8.1 7.96 8.03 7.85 7.84 7.8 8.06 7.94 8.1 7.8 7.9475 0.11
Total hardness (as
CaCO3) mg/l
310.67 513 455 516 519.7 490.7 523.3 367.3 523.3 310.67 461.95 80.48
Iron mg/l 0.68 0.78 0.34 0.75 0.27 1.5 0.5 0.81 1.5 0.27 0.70 0.38
Chlorides mg/l 82 104.33 101.33 103.67 113.67 100.33 99 88.67 113.67 82 99.12 9.77
EC µS/cm 891.67 1264.3 1324.7 1214 1277 1268.7 1283.3 1040.7 1324.7 891.67 1195.54 150.12
TDS mg/l 68.7 829.7 752.7 814.7 801 730 902 698.3 902 68.7 699.63 262.73
TSS mg/l 62 69.33 86.67 64 68.7 79.7 100.7 65 100.7 62 74.51 13.51
Calcium 71.33 150.33 155.33 153.33 156 150.67 158 88.67 158 71.33 135.45 34.63
Sulfate SO4 mg/l 211.67 405 349.67 403.33 389 277.33 365.33 261 405 211.67 332.79 73.28
Nitrate NO3 mg/l 0.3 0.346 0.648 0.343 0.26 0.47 0.47 0.49 568.33 0.26 71.42 200.78
Fluoride mg/l 0.14 0.14 0.23 0.18 0.097 0.117 0.26 0.076 0.26 0.076 0.15 0.064
Total Alkalinity mg/l 0.14 0.14 0.23 0.18 0.097 0.117 0.26 0.076 0.26 0.076 0.15 0.064
Magnesium mg/l 32.33 30.33 29 30.67 30.33 39 38.33 34 39 29 33 3.80
DO ( dissolved
oxygen ) mg/l
6.4 4.497 5.47 3.47 7.84 5.3 5.5 5.6 7.84 3.47 5.50 1.27
BOD5 mg/l 5.77 29.6 9.87 60.7 17.3 14.3 8.6 6.07 60.7 5.77 19.02 18.55
PO4 mg/l 0.047 0.06 0.07 0.067 0.12 0.04 0.07 0.01 0.12 0.01 0.065 0.03
64
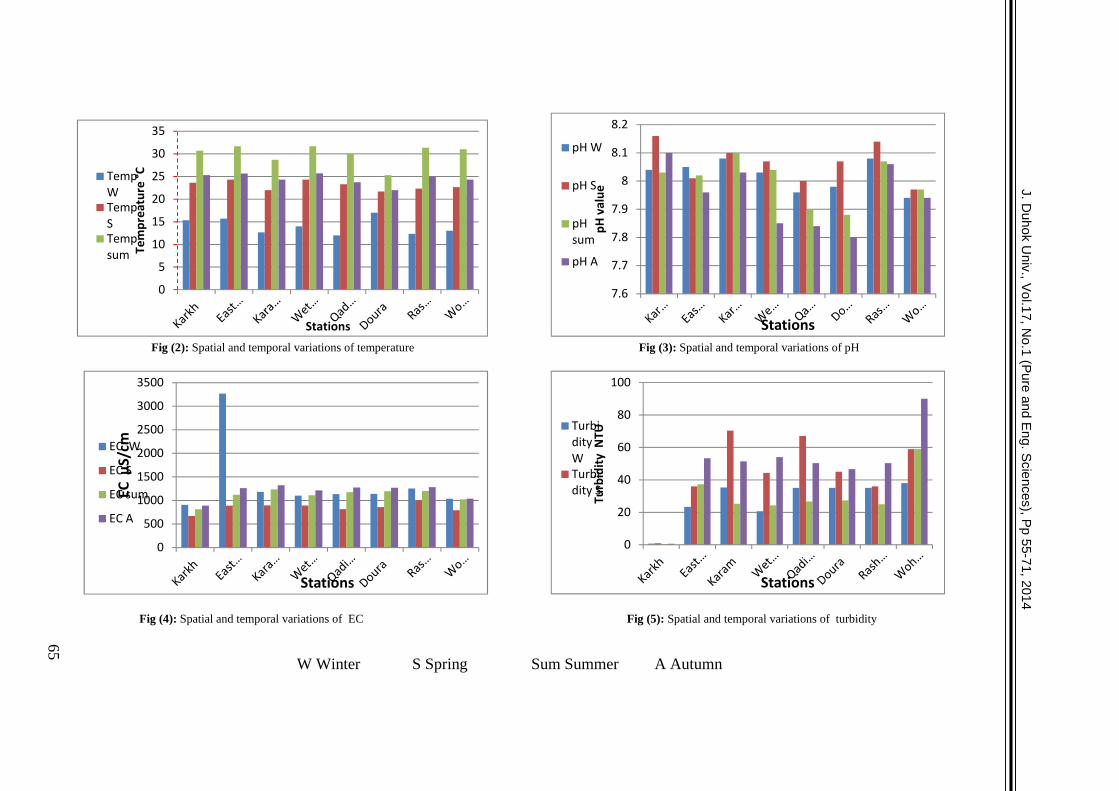
0
5
10
15
20
25
30
35Te
mpr
eatu
re°C
Stations
TempWTempSTempsum
7.6
7.7
7.8
7.9
8
8.1
8.2
pH v
alue
Stations
pH W
pH S
pHsum
pH A
0
500
1000
1500
2000
2500
3000
3500
EC µ
S/cm
Stations
EC W
EC S
EC sum
EC A
0
20
40
60
80
100
Turb
idity
NTU
Stations
TurbidityWTurbidity S
J. Du
ho
k Un
iv., Vo
l.17
, No
.1(P
ure
an
d E
ng
. Scie
nce
s), Pp
55-7
1,
20
14
Fig (2): Spatial and temporal variations of temperature Fig (3): Spatial and temporal variations of pH
Fig (4): Spatial and temporal variations of EC Fig (5): Spatial and temporal variations of turbidity
W Winter S Spring Sum Summer A Autumn
65

0
100
200
300
400
500
600
Tota
l har
dnes
s (as
CaC
O3)
mg/
l
Stations
hardness W
hardness S 0
50
100
150
200
Calc
ium
mg/
l
Stations
Calcium W
Calcium S
Calcium sum
Calcium A
05
1015202530354045
Mag
nesiu
m m
g/l
Stations
Magnesium WMagnesium SMagnesium sum
0
20
40
60
80
100
120
Chlo
rides
mg/
lStations
Chlorides W
Chlorides S
Chlorides sum
Chlorides A
J. Du
ho
kU
niv., V
ol.1
7, N
o.1
(Pu
re a
nd
En
g. S
cien
ces), P
p5
5-7
1,
20
14
Fig (6): Spatial and temporal variations of total hardness Fig (7): Spatial and temporal variations of Calcium
Fig (8): Spatial and temporal variations of Magnesium Fig (9): Spatial and temporal variations of Chlorides
66
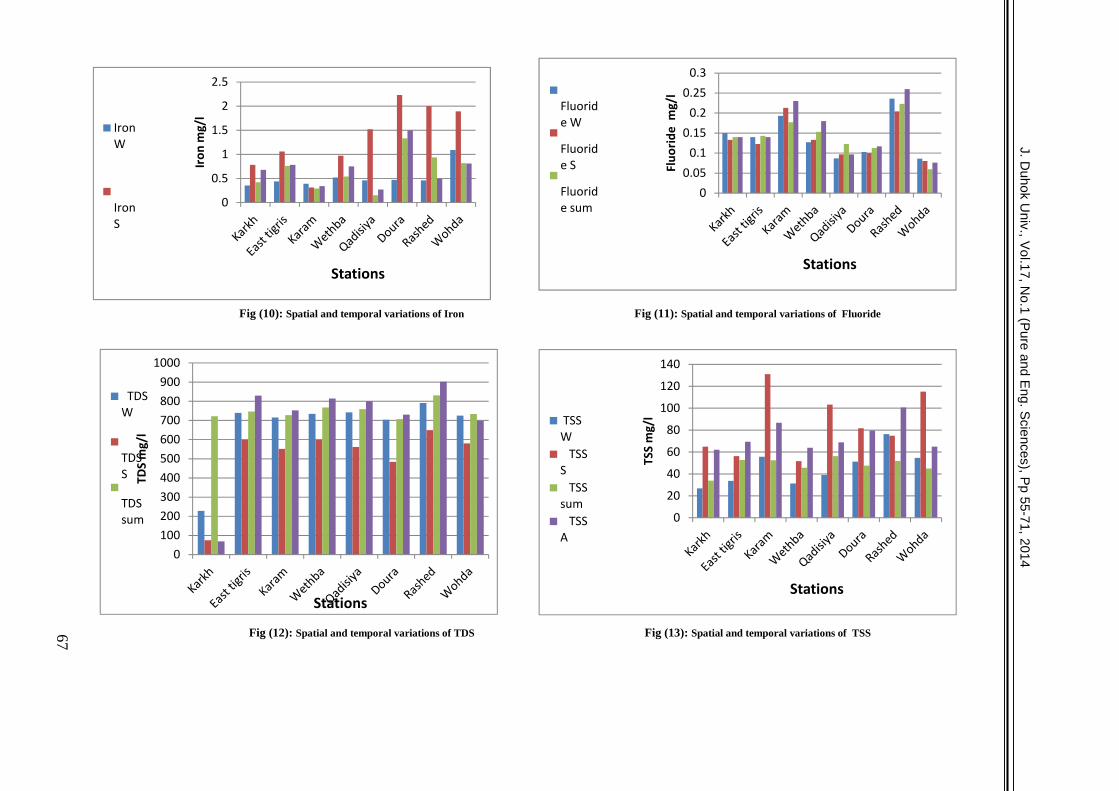
0
0.5
1
1.5
2
2.5
Iron
mg/
l
Stations
IronW
IronS
00.05
0.10.15
0.20.25
0.3
Fluo
ride
mg/
l
Stations
Fluoride W
Fluoride S
Fluoride sum
0100200300400500600700800900
1000
TDS
mg/
l
Stations
TDSW
TDSS
TDSsum 0
20
40
60
80
100
120
140
TSS
mg/
l
Stations
TSSW
TSSS
TSSsum
TSSA
J. Du
ho
k Un
iv., Vo
l.17
, No
.1(P
ure
an
d E
ng
. Scie
nce
s), Pp
55-7
1,
20
14
Fig (10): Spatial and temporal variations of Iron Fig (11): Spatial and temporal variations of Fluoride
Fig (12): Spatial and temporal variations of TDS Fig (13): Spatial and temporal variations of TSS67
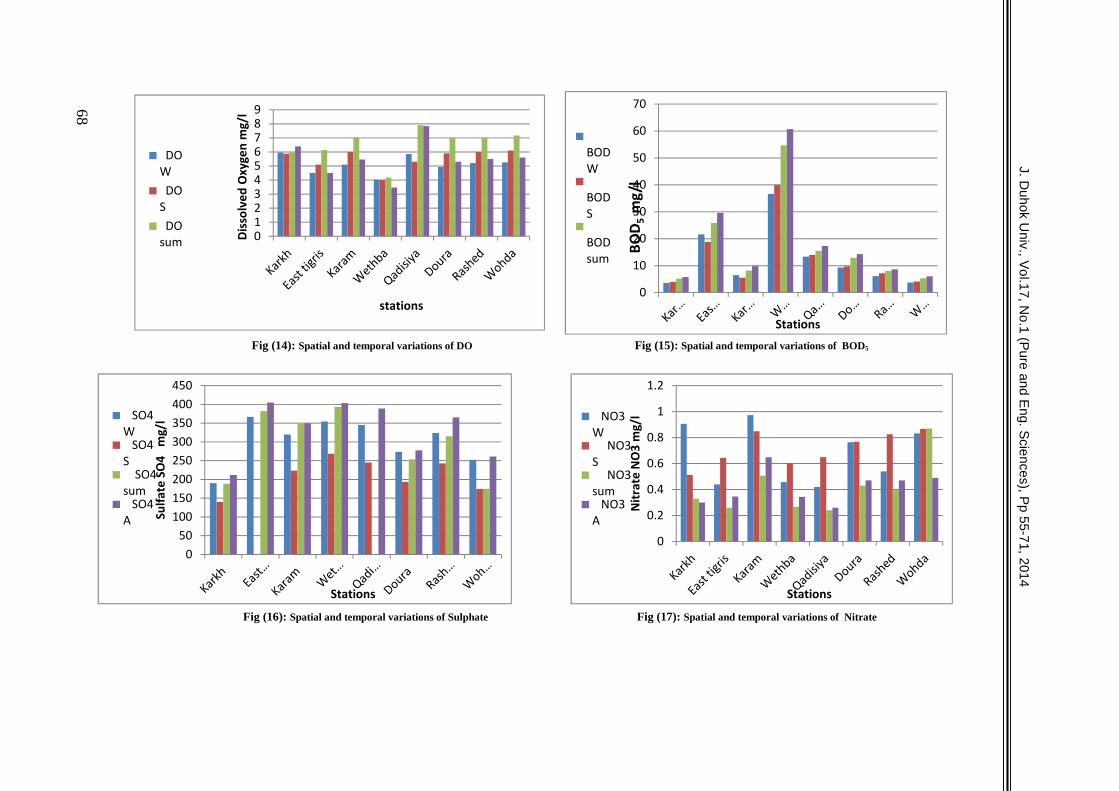
0123456789
Diss
olve
d O
xyge
n m
g/l
stations
DOWDO
SDO
sum
0
10
20
30
40
50
60
70
BOD 5
mg/
l
Stations
BODW
BODS
BODsum
050
100150200250300350400450
Sulfa
te S
O4
mg/
l
Stations
SO4W
SO4S
SO4sum
SO4A
0
0.2
0.4
0.6
0.8
1
1.2
Nitr
ate
NO
3m
g/l
Stations
NO3W
NO3S
NO3sum
NO3A
J. Du
ho
k Un
iv., Vo
l.17
, No
.1(P
ure
an
d E
ng
. Scie
nce
s), Pp
55-7
1,
20
14
Fig (14): Spatial and temporal variations of DO Fig (15): Spatial and temporal variations of BOD5
Fig (16): Spatial and temporal variations of Sulphate Fig (17): Spatial and temporal variations of Nitrate
68

00.020.040.060.08
0.10.120.140.16
Karkh Easttigris
Karam Wethba Qadisiya Doura Rashed Wohda
PO4
mg/
lStations
PO4 W
PO4 S
PO4sumPO4 A
020406080
100120140160180
Tota
l Alk
alin
ity m
g/l
Stations
Total Alkalinity W
Total Alkalinity S
Total AlkalinitysumTotal Alkalinity A
J. Du
ho
k Un
iv., Vo
l.17
, No
.1(P
ure
an
d E
ng
. Scie
nce
s), Pp
55-7
1,2
01
4
Fig (18): Spatial and temporal variations of PO4
Fig (19): Spatial and temporal variations of Total Alkalinity
69

Journal of University of Duhok, Vol. 17, No.1 (Pure and Eng. Sciences), Pp 55-71, 2014
70
CONCLUSION
water temperature showed high seasonalvariations, ranging from 12-17 °C in the winter,to 25.3-31.67°C in the summer , pH values in allstations in Tigris River showed slightly alkaline,Conductivity distribution along the river showedhigh values in the East Tigris, Rasheed andKaram. Seasonally, the highest conductivitylevels were observed in winter, Turbidity valuesin all stations in Tigris River were higher in theautumn and winter during irrigation period, Thelowest total hardness values were detected inKarkh for all season while the highest value ofTH at Rasheed in autumn season, The calciumconcentration values fall between 65 to 179.33mg/l and the average is mg/l The magnesiumconcentration values fall between 29 to 39 mg/land the average is 34 mg/l.
the lowest chloride values were detected inwinter ,Chloride values varied from 32 to 113.87mg/l, Total dissolved solids varied between 75 –1324.7 mg/l in all study stations minimum of 75mg/l in spring to a maximum of 1324.7 mg/l inautumn , Seasonally, the highest TSS values inall stations were observed in spring, while thelowest ones were detected in summer , DOconcentrations varied from 3.47 mg/l.atWethaba in autumn to 7.9 mg/l at Qadisiya insummar, The highest BOD5 values in all stationsexcept Karkh were observed in season., Sulfatevalues did not show large variations amongstations in the same season, ranging from 190mg/l at Karkh in winter to 405mg/l at AlQadisiya autumn, the highest NO3 values wereobserved in autumn in all stations. Al-Karkhshowed the highest NO3 values,
REFERENCES-(AFP) ,Afp.google.com, First snow for 100 years
falls on Baghdad, Afp.google.com.http://afp.google.com/article/ALeqM5huPkYk4bGVvo1Sa1tWeH-tgENiFw. Retrieved 2010-04-27.
- World Weather Information Service-Baghdad.http://worldweather.wmo.int/154/c01464.htm.Retrieved 2010-03-29.
- BBC-WeatherCentre-World Weather-AverageConditions - Baghdad,
http://www.bbc.co.uk/weather/world/city_guides/results.shtml?tt=TT002400. Retrieved 2010-05-06.
- Squillqace, J.; Scott, J. C., Moran, M. J.; Nolan, B.T. & Kolpin, D.W., VOCs, Pesticides, Nitrate,And Their Mixtures In Groundwater Used ForDrinking Water In The UnitedStates.Environmental Science and Technology,36. (2002), 1923-1930.
- Fawell, J.; Bailey, K.; Chilton, J.; Dahi, E.;Fewtrell, L. & Magara, Y., Fluoride inDrinking-water, WHO, TJ International (Ltd),Cornwall, UK. (2006).
- Kendall, P. ,Drinking Water Quality and Health,Food And Nutrition Series, No. 9.307,(1992).Colorado State University, CooperativeExtension. 10/92.www.colostate.edu/Depts/CoopExt.
- Barbooti, M. M., Hatam, N., Akram, B., Joseph, F.,Ibraheem, S. & Fadhil, A. ,The Quality OfDrinking Water In Baghdad Area After-TheWar, Proceedings of the 1st InternationalConference on Environmental Health in Iraq,Amman, (2005), 19-22.
- Barbooti, M. M., Jassem, I. A. & Kadhum, R.,Evaluation of DW purification units in Iraq,Report No. 261, (2006), Ministry ofEnvironment, Iraq.
- Alsudany, H. M. L., Al-Bayati, R. I. & Barbooti, M.M.,Determination of anions by ionchromatography in water samples of Baghdadcity, African Journal of Pure and Applchemistry, 3.(2009).165-169.
- Water Pollution Control Regulation of TurkishAuthorities (WPCRTA) (Su Kirliligi KontrolYonetmeligi), (1989), No:19919, T.C. ResmiGazete.
- World Health Organization (WHO), , Guidelines forDrinking Water Quality, Chap. 8,(2004).Geneva.
- Soylak, M.; Armagan Aydin, F.; Saracoglu, S.; Elci,L. & Dogan, M. Chemical Analysis ofDrinking Water Samples from Yozgat,Turkey, Polish Journal of EnvironmentalStudies, 11.(2002).151- 156.
- A. M. RABEE ET AL. Seasonal Variations ofSome Ecological Parameters in Tigris RiverWater at Baghdad Region, Iraq , Journal ofWater Resource and Protection, 2011, 3, 262-267 .
- World Health Organization, Guidelines fordrinking water quality-,Recommendations,2nd Ed. Geneva WHO, 1993.
www.lenntech.com/drinking-water-standards.htm.- UNESCO/WHO/UNEP,Water quality Assessment-
AGuide to Use Biota, Sediment and Water inEnvironmental Monitoring,” 2nd Edition,(2001), pp. 10-14.
- USDA (United States Department of Agriculture),“Agri-cultural Waste Management BuildingDesign Hand-book,” Soil ConservationService, Washington, DC, (1992).
- A. B. Abdul-Razak, R. E. M. Asiedu, and K. A. A.de-Graft-Johnson, “Assessment of the WaterQuality of the Oti River in Ghana,” WestAfrican Journal of Applied Ecology, Vol. 15,2009.
- WRC (Water Resources Commission), “Ghana RawWater Criteria and Guidelines,” DomesticWater, Vol. 1, CSIR-Water Research Institute,Ghana, (2003).
- WHO (World Health Organization), “Guidelines forDrinking Water Quality,” 2nd Edition,Geneva, (1998).

Journal of University of Duhok, Vol. 17, No.1 (Pure and Eng. Sciences), Pp 55-71, 2014
71
الخالصةتم .بغدادفينهر دجلةاياهعينات لوالبايولوجية والكيميائيةالفيزيائيةللمعاييرنطاق واسعتحقيقالدراسة الحالية
)يونيو، يوليو، أغسطس(الصيففصل، و )مايووأبريل و مارس(فصل الربيعخاللاتمحطثمانيةجمع عينات المياه من .2008عامفي)يناير وفبرايرديسمبر(فصل الشتاء و )أكتوبر حتي نوفمبر، سبتمبر(الخريففصلو
مياه نهر دجلة لالستخدام العام، عن طريق اختيار ثمانية نوعية معير في تقييم جودة 18الدراسة استخدامهدف هذه المعايير المدرجة هي درجة الحرارة، العكارة، قيمة الرقم . مواقع ألخذ العينات على طول النهر في منطقة بغداد
الكلية ، ،المواد الصلبةالمواد الصلبة الذائبةالهيدروجيني، العسرة والحديد والكلوريدات، التوصيل الكهربائي، الكالسيوم، كبريتات، نترات، الفلوريد، القاعدية، المغنيسيوم، االوكسجين المذاب، المتطلب االوكسجين الحيوي
.والفوسفاتدرجة حرارة ابدت .منطقة الدراسةفيدجلةفي نهرتغيرات الموسميةلنوعية المياهلحسابايير المعاستخدمت
فصل درجة مئوية في31،67-25،3فصل الشتاء،درجة مئوية في17-12، والتي تتراوحتتغيرات موسمية عاليةالماءقيم عالية لتوصيلية الكهربانية قاعدية قليلة،نهر دجلةالمحطات فيفي جميعالرقم الهيدروجيني قيموأظهرتالصيف،
كانت قيم فصل الشتاء، و فيلقيم التوصيلية أعلى مستوياتلوحظموسميا،الرشيد والكرامة، و ، دجلةشرقمحطة فية للعسرة الكلية اوطى قيم،الريفترةخاللوالشتاءفصل الخريفوفينهر دجلةالمحطات فيكلفيعالية العكورةقيم تركيز ، موسم الخريففيشيدالر في محطة للعسرة الكلية قيمةفي حين أن أعلىالمواسملجميعو الكرخفيمحطة
لتر/ملغم39-29المغنيسيومتركيزقيمة.لتر/ملغ122.165هوالمعدل و لتر/ملغم179.33–65بينالكالسيومترواحت لتر،/ملغم113.87–32كلوريدات، تباينت قيم فصل الشتاءللكلوريد فيقيةمأدنى.لتر/ملغ34معدلو
في لتر/ملغ75أدنى قيمةسجل الدراسةجميع محطاتفيلتر/ملغم (1324.7-75)بينالمواد الصلبة الذائبةقيمة في جميعالمواد الصلبة القيمأعلىلوحظت، موسميا، الخريففيلتر/ملغم1324.7و أقصى قيمةفصل الربيع
-.3منتراكيزتفاوتت، الصيففصل فيمنهاأقلسجل، في حين الربيعالمحطات في محطة فيلتر/ملغ477.9محطة باستثناءالمحطاتفي جميعللمتطلب البايولوجيأعلى قيموقد لوحظتالصيف،فيقادسيةالخريففيالوثبة
في الكرخفيلتر/ملغ190، بدءا مننفس الموسمالمحطات فيبيناختالفات كبيرةالكبريتاتقيملم تظهر.الكرخفي الخريففي فصلللنترات لوحظت قيمأعلىالخريف،في فصل القادسيةمحطة فيلتر/ملغ405إلىفصل الشتاء
.للنتراتالقيمأعلىالكرخأظهرت.المحطاتجميعيتعين على وبالتالي،.لهذا العامالنتائجعموما في جميع أنحاءواضحنهر دجلةعلى طولنوعية المياهتدهورظاهرةإدارة قواعدينبغي تطبيق.ضفة النهرالمختلفة على طولاألنشطةفي السيطرة علىالجهودالمزيد من ممارسةالسلطات
.وغيرها من األنشطةللمصانعمياه الصرف الصحينظم معالجة، وعزل المياه

Journal of University of Duhok, Vol. 17, No.1 (Pure and Eng. Sciences), Pp 72-80, 2014
72
SOIL TESTING FORECASTING USING TIME - SERIESANALYSIS TECHNIQUES
MUTHAINA .A. MUSTAFA
Dept. Environmental technologies, College of Environmental Science and Technology , University of Mosul-Iraq(Received: November 21, 2013 ; Accepted for publication: May 4, 2014)
ABSTRACT
Factor analysis is one of the most important methods usually used to identify the most importantmethods usually used to identify the most important factors affecting the phenomenon of forecasting soiltesting along a different periods of time, announced in this study. In this study, interpretation of thedifferent inter-related factor or variables related to soil investigation on testing all classifications alongdifferent soil depths are analyses. Soil metal compositions of each layer according to Iraqi Environmentduring the last two decades changed due to different circumstauses forced people to change their lifestyle, all behavior, and produced pollutions all soil chemical changes specially in effected agriculturalprediction.
For the above reasons, the open ion of uses born in mineral to predict soil future behavior using somewell-known methods such as Brown Double exponent ion and Box-Jenkins times analysis techniques.
INTRODUCTION
actor analysis is a mathematical processaimed at simplifying the links between
different variables entering in the analysis andaccess to common factors that describe therelationship between these variables.
the Approach to a statistical analysis ofmultiple data is related with each other atdifferent degrees from the link so that it startscalculating correlations between the number ofvariables to get the matrix of correlationsbetween these variables moving forward afterthat to analyze this matrix correlation universallyto get to the lowest possible number of axes orthe factors that enable to express the greatestcontrast between these variables, in the form ofan independent classifications list on the basis ofthe quality of the rating.(Wikipedi)
the Forecasting process propagated by themethod of Brown's Double ExponentialSmoothing Method, is one of the modalities ofthe exponential smoothing, to estimateparameters specific to the model whichrepresents the weights is equal and that is givenprevious observations and range values of theseparameters between zero and one. Values ofprimary for the purpose of starting the process offorecasting to select the optimum values is doneby minimizing the mean squares error or usinglogarithmic non-linear optimization to find thebest values and the most recent attribute values
having larger weights in the prediction ofthe previous observations. (Arsham,2002() Brocklebank,2003).
(Box & Jenkins) prediction method mainobjective is to find a suitable formula to predictso as to make Residuals very small byminimizing MSE. (Al-Tai ,2004)
CORRELATION IN THE TIME SERIES
Uses the estimate Autocorrelation and PartialAutocorrelation estimate Time series indetermining the appropriate model of the timeseries measures and the statistical relationshipbetween the series ViewsCan be illustrated as follows: (Al-Shakurji,2010)
AUTOCORRELATION ANALYSIS
describe autocorrelation functions as ameasure of linear relations between the timeseries is used in this study the relationshipbetween the present and past series and is knownas the autocorrelation function measure for thedegree of correlation between Views coming inthe time series {Xi: 1, 2, ---, n} the estimatorfunction the link can be estimated by thefollowing equation:
F
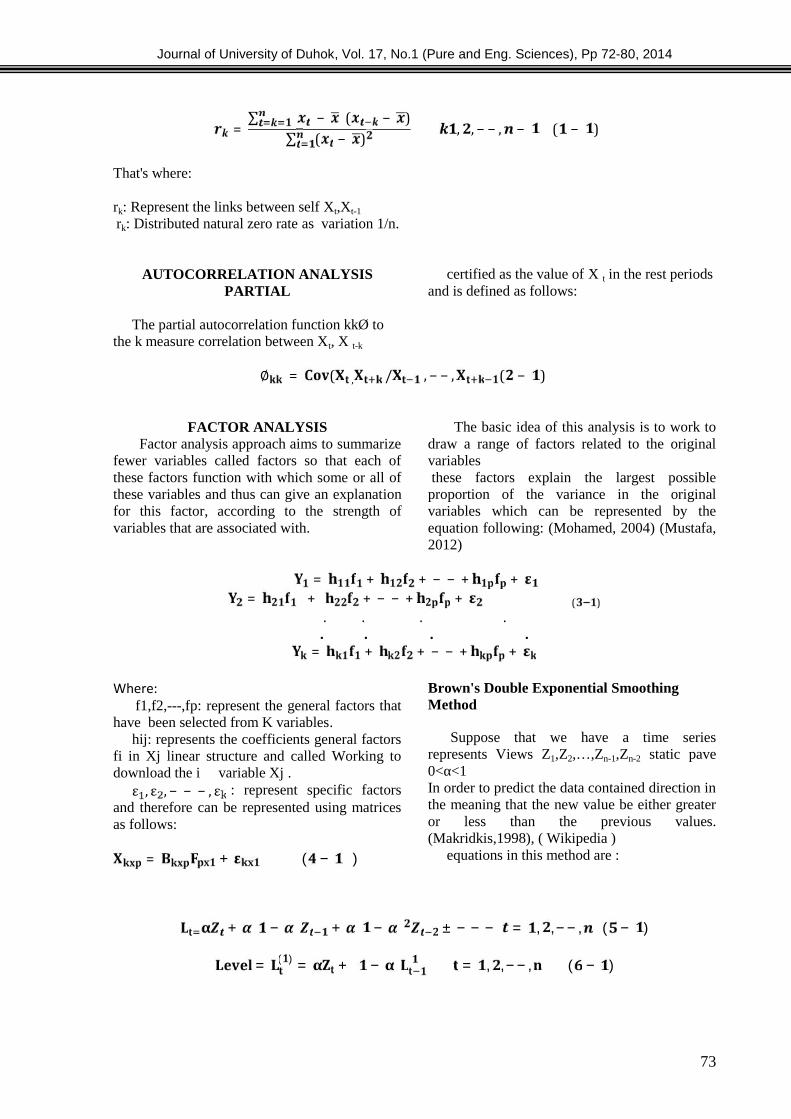
Journal of University of Duhok, Vol. 17, No.1 (Pure and Eng. Sciences), Pp 72-80, 2014
73
= ∑ − ( − )∑ ( − ) , , − − , − ( − )That's where:
rk: Represent the links between self Xt,Xt-1rk: Distributed natural zero rate as variation 1/n.
AUTOCORRELATION ANALYSISPARTIAL
The partial autocorrelation function kkØ tothe k measure correlation between Xt, X t-k
certified as the value of X t in the rest periodsand is defined as follows:
∅ = ( , / , − − , ( − )FACTOR ANALYSIS
Factor analysis approach aims to summarizefewer variables called factors so that each ofthese factors function with which some or all ofthese variables and thus can give an explanationfor this factor, according to the strength ofvariables that are associated with.
The basic idea of this analysis is to work todraw a range of factors related to the originalvariablesthese factors explain the largest possibleproportion of the variance in the originalvariables which can be represented by theequation following: (Mohamed, 2004) (Mustafa,2012) = + + − − + += + + − − + + ( )....
. . . .= + + − − + +Where:
f1,f2,---,fp: represent the general factors thathave been selected from K variables.
hij: represents the coefficients general factorsfi in Xj linear structure and called Working todownload the i variable Xj .ε , ε , − − − , ε : represent specific factorsand therefore can be represented using matricesas follows:= + ( − )
Brown's Double Exponential SmoothingMethod
Suppose that we have a time seriesrepresents Views Z1,Z2,…,Zn-1,Zn-2 static pave0<α<1In order to predict the data contained direction inthe meaning that the new value be either greateror less than the previous values.(Makridkis,1998), ( Wikipedia )
equations in this method are :
+ − + − ± − − − = , , − − , ( − )= ( ) = + − = , , − − , ( − )
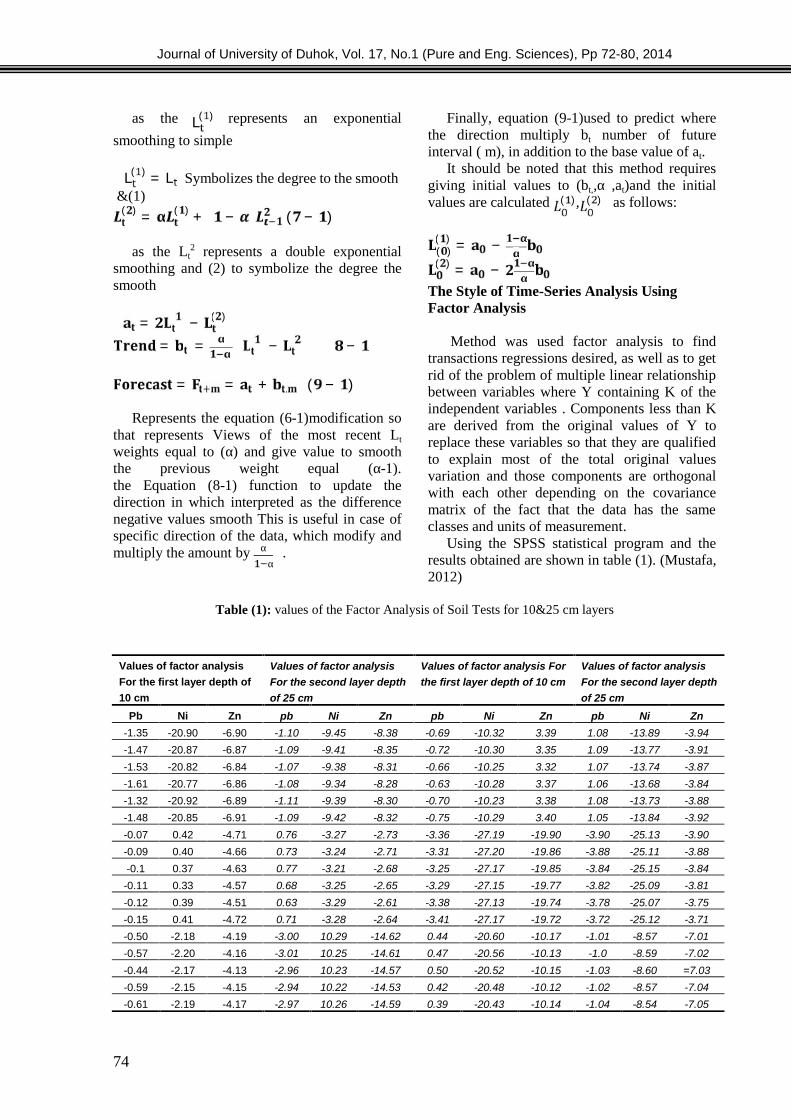
Journal of University of Duhok, Vol. 17, No.1 (Pure and Eng. Sciences), Pp 72-80, 2014
74
as the L( ) represents an exponentialsmoothing to simpleL( ) = L Symbolizes the degree to the smooth&(1)( ) = ( ) + − ( − )
as the Lt2 represents a double exponential
smoothing and (2) to symbolize the degree thesmooth = − ( )= = − −= = + . ( − )
Represents the equation (6-1)modification sothat represents Views of the most recent Ltweights equal to )α ( and give value to smooththe previous weight equal (α-1).the Equation (8-1) function to update thedirection in which interpreted as the differencenegative values smooth This is useful in case ofspecific direction of the data, which modify andmultiply the amount by α
α.
Finally, equation (9-1)used to predict wherethe direction multiply bt number of futureinterval ( m), in addition to the base value of at.
It should be noted that this method requiresgiving initial values to (bt,,α ,at)and the initialvalues are calculated ( ), ( ) as follows:
( )( ) = −( ) = −The Style of Time-Series Analysis UsingFactor Analysis
Method was used factor analysis to findtransactions regressions desired, as well as to getrid of the problem of multiple linear relationshipbetween variables where Y containing K of theindependent variables . Components less than Kare derived from the original values of Y toreplace these variables so that they are qualifiedto explain most of the total original valuesvariation and those components are orthogonalwith each other depending on the covariancematrix of the fact that the data has the sameclasses and units of measurement.
Using the SPSS statistical program and theresults obtained are shown in table (1). (Mustafa,2012)
Table (1): values of the Factor Analysis of Soil Tests for 10&25 cm layers
Values of factor analysisFor the second layer depthof 25 cm
Values of factor analysis Forthe first layer depth of 10 cm
Values of factor analysisFor the second layer depthof 25 cm
Values of factor analysisFor the first layer depth of10 cm
ZnNipbZnNipbZnNipbZnNiPb-3.94-13.891.083.39-10.32-0.69-8.38-9.45-1.10-6.90-20.901.35--3.91-13.771.093.35-10.30-0.72-8.35-9.41-1.09-6.87-20.87-1.47-3.87-13.741.073.32-10.25-0.66-8.31-9.38-1.07-6.84-20.82-1.53-3.84-13.681.063.37-10.28-0.63-8.28-9.34-1.08-6.86-20.77-1.61-3.88-13.731.083.38-10.23-0.70-8.30-9.39-1.11-6.89-20.92-1.32-3.92-13.841.053.40-10.29-0.75-8.32-9.42-1.09-6.91-20.85-1.48-3.90-25.13-3.90-19.90-27.19-3.36-2.73-3.270.76-4.710.42-0.07-3.88-25.11-3.88-19.86-27.20-3.31-2.71-3.240.73-4.660.40-0.09-3.84-25.15-3.84-19.85-27.17-3.25-2.68-3.210.77-4.630.37-0.1-3.81-25.09-3.82-19.77-27.15-3.29-2.65-3.250.68-4.570.33-0.11-3.75-25.07-3.78-19.74-27.13-3.38-2.61-3.290.63-4.510.39-0.12-3.71-25.12-3.72-19.72-27.17-3.41-2.64-3.280.71-4.720.41-0.15-7.01-8.57-1.01-10.17-20.600.44-14.6210.29-3.00-4.19-2.18-0.50-7.02-8.59-1.0-10.13-20.560.47-14.6110.25-3.01-4.16-2.20-0.57=7.03-8.60-1.03-10.15-20.520.50-14.5710.23-2.96-4.13-2.17-0.44-7.04-8.57-1.02-10.12-20.480.42-14.5310.22-2.94-4.15-2.15-0.59-7.05-8.54-1.04-10.14-20.430.39-14.5910.26-2.97-4.17-2.19-0.61
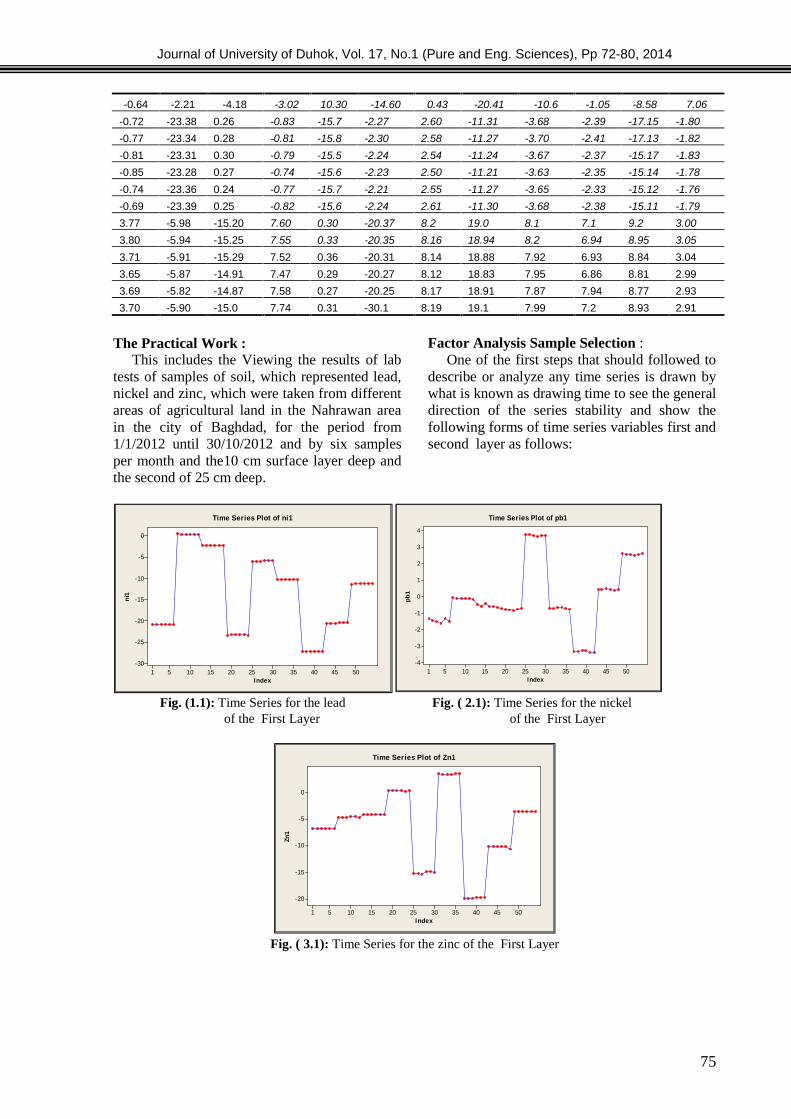
Journal of University of Duhok, Vol. 17, No.1 (Pure and Eng. Sciences), Pp 72-80, 2014
75
The Practical Work :This includes the Viewing the results of lab
tests of samples of soil, which represented lead,nickel and zinc, which were taken from differentareas of agricultural land in the Nahrawan areain the city of Baghdad, for the period from1/1/2012 until 30/10/2012 and by six samplesper month and the10 cm surface layer deep andthe second of 25 cm deep.
Factor Analysis Sample Selection :One of the first steps that should followed to
describe or analyze any time series is drawn bywhat is known as drawing time to see the generaldirection of the series stability and show thefollowing forms of time series variables first andsecond layer as follows:
Fig. (1.1): Time Series for the lead Fig. ( 2.1): Time Series for the nickelof the First Layer of the First Layer
Fig. ( 3.1): Time Series for the zinc of the First Layer
Index
pb
1
50454035302520151051
4
3
2
1
0
-1
-2
-3
-4
Time Series Plot of pb1
Index
ni1
50454035302520151051
0
-5
-10
-15
-20
-25
-30
Time Series Plot of ni1
Index
Zn1
50454035302520151051
0
-5
-10
-15
-20
Time Series Plot of Zn1
7.06-8.58-1.05-10.6-20.410.43-14.6010.30-3.02-4.18-2.21-0.64-1.80-17.15-2.39-3.68-11.312.60-2.27-15.7-0.830.26-23.38-0.72-1.82-17.13-2.41-3.70-11.272.58-2.30-15.80.81-0.28-23.34-0.77-1.83-15.17-2.37-3.67-11.242.54-2.24-15.5-0.790.30-23.31-0.81-1.78-15.14-2.35-3.63-11.212.50-2.23-15.6-0.740.27-23.28-0.85-1.76-15.12-2.33-3.65-11.272.55-2.21-15.7-0.770.24-23.36-0.74-1.79-15.11-2.38-3.68-11.302.61-2.24-15.6-0.820.25-23.39-0.693.009.27.18.119.08.2-20.370.307.60-15.20-5.983.773.058.956.948.218.948.16-20.350.337.55-15.25-5.943.803.048.846.937.9288.188.14-20.310.367.52-15.29-5.913.712.998.816.867.9518.838.12-20.270.297.47-14.91-5.873.652.938.777.947.8718.918.17-20.250.277.58-14.87-5.823.692.918.937.27.9919.18.19-30.10.317.74-15.0-5.903.70
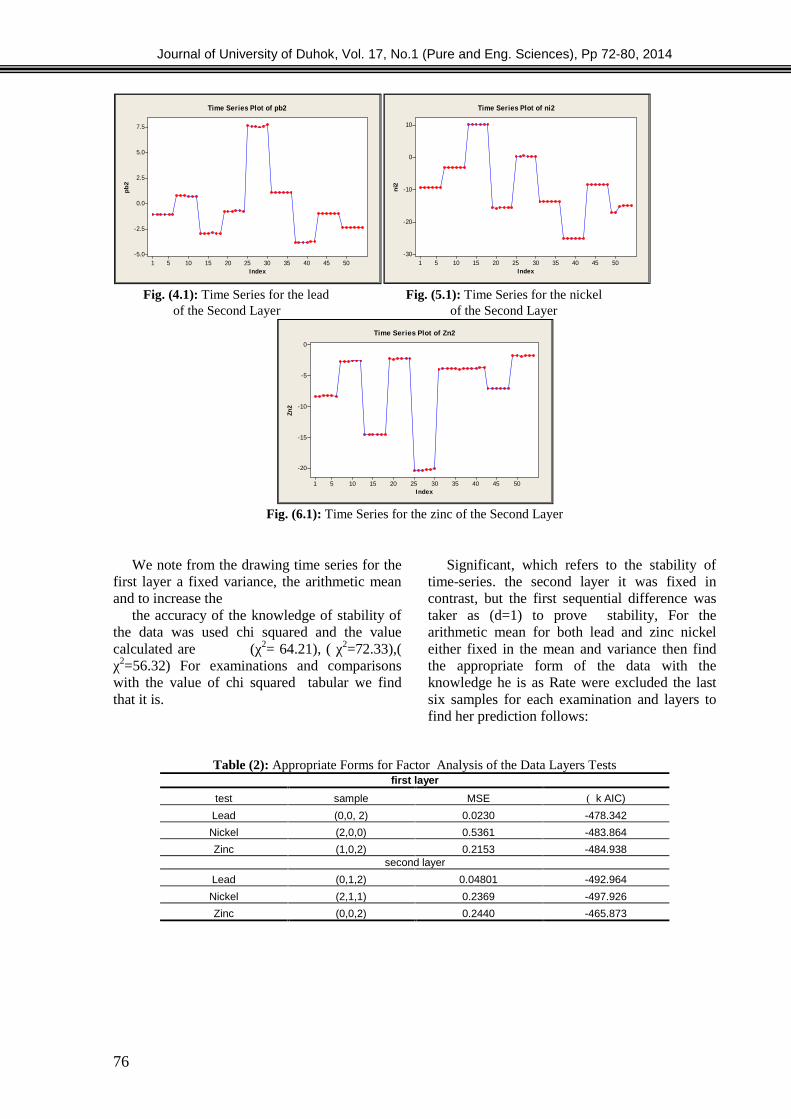
Journal of University of Duhok, Vol. 17, No.1 (Pure and Eng. Sciences), Pp 72-80, 2014
76
Fig. (4.1): Time Series for the lead Fig. (5.1): Time Series for the nickelof the Second Layer of the Second Layer
Fig. (6.1): Time Series for the zinc of the Second Layer
We note from the drawing time series for thefirst layer a fixed variance, the arithmetic meanand to increase the
the accuracy of the knowledge of stability ofthe data was used chi squared and the valuecalculated are (χ2= 64.21), ( χ2=72.33),(χ2=56.32) For examinations and comparisonswith the value of chi squared tabular we findthat it is.
Significant, which refers to the stability oftime-series. the second layer it was fixed incontrast, but the first sequential difference wastaker as (d=1) to prove stability, For thearithmetic mean for both lead and zinc nickeleither fixed in the mean and variance then findthe appropriate form of the data with theknowledge he is as Rate were excluded the lastsix samples for each examination and layers tofind her prediction follows:
Table (2): Appropriate Forms for Factor Analysis of the Data Layers Testsfirst layer
( k AIC)MSEsampletest-478.3420.0230(0,0, 2)Lead-483.8640.5361(2,0,0)Nickel-484.9380.2153(1,0,2)Zinc
second layer-492.9640.04801(0,1,2)Lead-497.9260.2369(2,1,1)Nickel-465.8730.2440(0,0,2)Zinc
Index
pb
2
50454035302520151051
7.5
5.0
2.5
0.0
-2.5
-5.0
Time Series Plot of pb2
Index
ni2
50454035302520151051
10
0
-10
-20
-30
Time Series Plot of ni2
Index
Zn2
50454035302520151051
0
-5
-10
-15
-20
Time Series Plot of Zn2
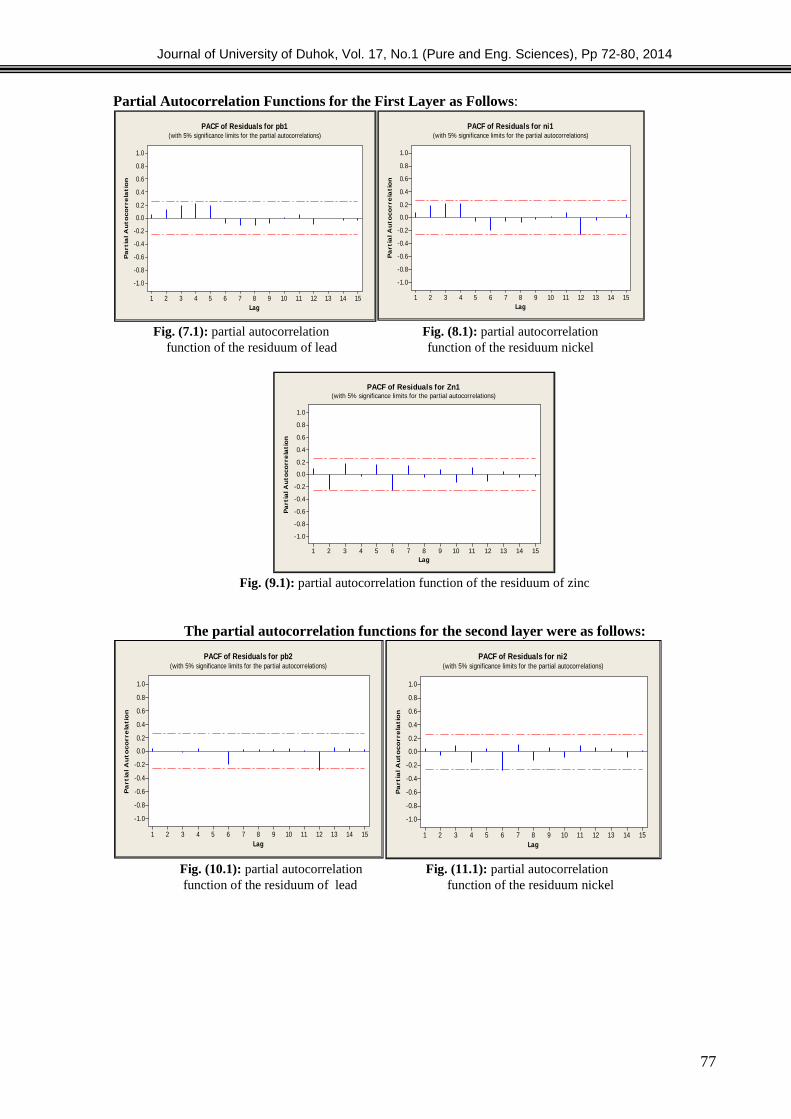
Journal of University of Duhok, Vol. 17, No.1 (Pure and Eng. Sciences), Pp 72-80, 2014
77
Partial Autocorrelation Functions for the First Layer as Follows:
Fig. (7.1): partial autocorrelation Fig. (8.1): partial autocorrelationfunction of the residuum of lead function of the residuum nickel
Fig. (9.1): partial autocorrelation function of the residuum of zinc
The partial autocorrelation functions for the second layer were as follows:
Fig. (10.1): partial autocorrelation Fig. (11.1): partial autocorrelationfunction of the residuum of lead function of the residuum nickel
Lag
Pa
rtia
lAu
toco
rre
lati
on
151413121110987654321
1.0
0.8
0.6
0.4
0.2
0.0
-0.2
-0.4
-0.6
-0.8
-1.0
PACF of Residuals for ni1(with 5% significance limits for the partial autocorrelations)
Lag
Pa
rtia
lA
uto
co
rre
lati
on
151413121110987654321
1.0
0.8
0.6
0.4
0.2
0.0
-0.2
-0.4
-0.6
-0.8
-1.0
PACF of Residuals for pb1(with 5% significance limits for the partial autocorrelations)
Lag
Pa
rtia
lAu
toco
rre
lati
on
151413121110987654321
1.0
0.8
0.6
0.4
0.2
0.0
-0.2
-0.4
-0.6
-0.8
-1.0
PACF of Residuals for Zn1(with 5% significance limits for the partial autocorrelations)
Lag
Pa
rtia
lA
uto
co
rre
lati
on
151413121110987654321
1.0
0.8
0.6
0.4
0.2
0.0
-0.2
-0.4
-0.6
-0.8
-1.0
PACF of Residuals for ni2(with 5% significance limits for the partial autocorrelations)
Lag
Pa
rtia
lA
uto
co
rre
lati
on
151413121110987654321
1.0
0.8
0.6
0.4
0.2
0.0
-0.2
-0.4
-0.6
-0.8
-1.0
PACF of Residuals for pb2(with 5% significance limits for the partial autocorrelations)

Journal of University of Duhok, Vol. 17, No.1 (Pure and Eng. Sciences), Pp 72-80, 2014
78
Fig. (12.1): partial autocorrelation function residuum of zinc
Estimate Transactions of the Factor AnalysisSamples ValuesMoments method has been used to find an
estimate of the factor analysis modelsparameters for each layer and using the programready Minitab Version(14) was reachedfollowing sample:Prediction equation for the lead of the first layer
ttt aaZ 11-t 421.0a0.6343.252Prediction equation of nickel of the first layer
tt aZ 1-t1-t z754.1z1.6735.463Prediction equation for zinc of the first layer
tt aZ 1-t1-t1-t z354.2a342.1a7.8422.252Prediction equation for the lead of the secondlayer
tt aZ 1-t1-t a754.2a0.7733.475Prediction equation of the second layer of nickel
ttt azZ 11-t1-t 798.0z334.0a5.4424.213Prediction equation for zinc of the second layer
tt aZ 1-t1-t a851.2a0.5632.385We test the hypothesis that the parameter wherewe selected sample (∅, ) are not moral differentfrom zero, use the (t) test as follows:t = θSn ORt = ∅Snas the:
:The estimated value for the moving averageparameter∅ :estimated value for the regression parameterself
: Parameter variation SMA:Self-regression parameter variation
The application on the first layer we get thefollowing results :The calculated value of the (t) test to lead (& ) were respectively (11.23,15.34) and thecalculated value to (t) test nickel ( & ) arerespectively (9.78,10.53) The calculated value ofthe (t) test zinc (∅ & ) was (12.77,13.22 ,15.65) Bycomparing the calculated value with the valuestabular to (t) test when the level of moral 95%degrees of freedom (n-1) reject the nullhypothesis that the parameters of the samplemodel is no different morally from zero testwas applied (t) test on the second layer. Thecalculated values of the (t) test to lead ( & )were respectively (10.13, 18.53)and thecalculated value to (t) test nickel(∅ ∅و & ) and (17.87 ,13.56,20.25,18.91)respectively , The calculated value of the (t) testzinc ( & ) was (13.54,21.32) comparedwith the calculated value from tables to (t) teston under moral level of 95% degrees of freedom(n-1)and reject the null hypothesis that theparameters of the proposed sample is nodifferent morally from zero.Find Predictions of the Values of FactorAnalysisAfter sample has been found appropriate foreach examination parameters moral tested ofthese samples , it was found that predictions ofthe values of the analysis factor using thesesamples for both layers to predict the rate ofthe last six samples for each test and each layerfor the year 2012 compared with the originalvalues as well as finding predictions for the year2013 in a method to smooth Brown andexponential way Box – Jenkins.
Lag
Part
ialA
utoc
orre
lati
on151413121110987654321
1.0
0.8
0.6
0.4
0.2
0.0
-0.2
-0.4
-0.6
-0.8
-1.0
PACF of Residuals for Zn2(with 5% significance limits for the partial autocorrelations)

Journal of University of Duhok, Vol. 17, No.1 (Pure and Eng. Sciences), Pp 72-80, 2014
79
Table (3): First Layer Soil tests Predictions for 2012
Table (4): Second Layer Soil tests Predictions for 2012
For the purpose of reaching a calculatedvalues to predict for the year 2014 calculationsaccurately been used sampling rate selected forthe first layer using Brown exponentialsmoothing through the use of system-readyMINITAB For the purpose of access to thevalues of prediction and calculators accuratelyhas been selected an
experience of all Combinations throughaverage error squares through th )β , α ( optimumvalues for the possible on an equation to predictthe time series and extract less (MSE) and then
get the parameters smooth 0.2), After the smoothprocess the data and compensationfor the value of a0=3.542& b0=0.326 =β(0.2) =α(
been getting on the values of prediction aswell as the method was used Box - Jenkins forsampling rate selected layer second so that beengetting in which the best values for theparameters and the lowest average error squaresthrough the use of the system ready MINITABand then it is the comparison between the twolayers to reach the best layer as follows:
Table(5): First Layer Soil tests Prediction Using Brown Method in 2013
Table( 6): second Layer Soil tests Prediction Using Box - JenkinsMethod in 2013
For comparison between the two layers Which is better, following standards were used:1-RMSE ( Root Mean Square Error )2-Mean Absolute Error(MAE)3-Mean Absolute percentage Error (MAPE)
monthsmaximum 95% trustinterval
Minimum 95% trustinterval
Value prediction ofLead
Value predictionof Nickel
Valueprediction of
ZincJan.2.543-3.76-1.22-10.03-8.92Feb.2.87-3.851.14-3.51-1.84Mar.2.66-392-3.54-8.14-13.23Apr.2.83-3.85-0.77-13.62-2.67May.2.96-3.216.131.01-21.45Jun.1.63-2.681.15-14.63-4.07Jul.1.94-2.57-4.01-27.21-2.64
Oug.1.82-2.63-0.86-9.12-8.04Seb.1.57-2.82-2.97-15.46-2.11
maximum 95% trust intervalMinimum 95% trust intervalThe actualvalue
Valueprediction
Examination
0.83-2.62-1.11-1.46Lead1.46-3.17-9.46-9.12Nickel2.67-3.21-8.38-7.29Zinc
maximum 95% trustinterval
Minimum 95%trust interval
The actualvalue
Valueprediction
Examination
1.65-2.78-1.48-0.96Lead1.53-2.45-20.81-22.65Nickel1.77-2.89-6.72-7.22Zinc
monthsmaximum 95%trust interval
Minimum 95%trust interval
Value predictionof Lead
Value predictionof Nickel
Value predictionof Zinc
Jan2.98-2.87-1.67-21.53-5.61Feb.2.76-2.56-0.211.06-3.93Mar.2.58-2.85-0.92-2.32-4.67Apr.2.84-2.98-0.46-20.120.84May.2.56-2.924.02-4.24-15.68Jun.1.77-1.77-1.03-9.313.89Jul.1.94-1.95-2.22-28.09-20.21
Oug.1.96-1.641.02-18.34-8.34Seb.1.87-1.763.11-12.2213.85

Journal of University of Duhok, Vol. 17, No.1 (Pure and Eng. Sciences), Pp 72-80, 2014
80
Table( 7): Statistical Standards for Both layers Included in the Study
is clearly from the above results, the second layer is better for the fact that the three statistical criteria are less.
CONCLUSIONS
1- The original time series of three tests the soilis un stationary and it is unfixed in variance,there is a difference in the arithmetic mean ofboth layers.2- after studying the autocorrelation function andpartial autocorrelation function tests for the firstlayer and the second layer, to determine theappropriate models. Showing significantparameters of the models suggested by theresults of t-test of the two layers.3- observed through the results to predict themean of the last six samples, the values of factoranalysis for the three tests for the first layer andthe second approach is that the results of theoriginal values were within the confidenceinterval specified.4-Through statistical criteria used was reachedthat the best layer is the second layer in whichthe concentration of heavy metals are few, aswell as the proportion of affected small erosionfactors and therefore is reflected positively onthe agricultural output..5- The method of (Box – Jenkins) proved itsefficiency in the possibility of time-series studyusing factor analysis to predict the testing soilthrough the use of computer applications andutilization optimally solve some of the complexissues in real life, especially in theenvironmental pollution.
REFERENCES- Mustafa .M. .Abdala (2012) : Comparison ofindependent components analysis and Fuzzy logicprediction in TIME SERIES, "Iraqi Journal ofStatistical Sciences, folder (12), number (21).- Al-Sukrge.Th. Younis. (2010) : The use of factoranalysis to predict the time series with the applicationon series Rainfall and relative humidity in the city ofMosul ", Tikrit magazine for Economic andAdministrative Sciences, Folder (6) Number (20).- Al-Tai .F .G. Ahmed (2004) : A comparative studybetween Box Jenkins methods and Adaptive filtering
method to predict ", unpublished Ph.D. thesis, Facultyof Computer Science and Mathematics, University ofMosul..- Mohamed, M. ,Bahjet, M.,(2004): "Using FactorAnalysis to Measure the key Factors Affecting thePerformance of The Students in the First UniversityDegree A Field Study Applied on The High instituteof Computer and Management at Port Said.- Brockle bank , John C. Dickey, David A. 2003"SAS for Forecasting and Time Series "SAS InstituteInc., Cary, NC, USA.- Arsham’s Hossein (2002): "Time Series Analysis
and Forecasting Techniques"http://ubmail.ubalt.edu/~harsham/stat-dataforconstructing amirror site .- Makridkis, S., Wheel Wright, S. and HYdman, R.(1998): "Forecasting Methods and Application",3rded. , john Wiley ,New york.
MAPEMAERMSELayers
2.290.4586.38First layer1.090.3965.06Second layer

Journal of University of Duhok, Vol. 17, No.1 (Pure and Eng. Sciences), Pp 81-94, 2014
81
CONCEPTS OF WATER MANAGEMENT AMONG RIPARIANCOUNTRIES (IRAQ - TURKEY - SYRIA) AND IT'SIMPACT ON WATER QUALITY AND QUANTITY
LILYAN YAAQUB MATTI ALSAKA
College of Environmental science and technology, Mosul University-Iraq
(Received: January 14, 2014 ; Accepted for publication: June 2, 2014)
ABSTRACTDemographically, the MENA region is enveloped in a period of fairly sweeping changes, all of which
will have major implications for water governance. The highly contentious Tigris-Euphrates River, sharedby upper riparian Turkey and downstream states Syria and Iraq, is one example. By 2050, Iraq'spopulation-and projected water needs-will soar, as the country grows 2.6 times its current size, itspopulation increase from 32.6 million to more than 83 million. Syria, which also depends on the Euphratesas an important economic lifeline, will see its population by mid-century grow 1.5 times its current size,from 22.5 million to 33.6 million. Combined, this population growth in Syria and Iraq will increase waterdemand for irrigation, industrial development, and domestic usage, placing pressure on Turkey to ensurean ample flow of water downstream throughout the year. As the effects of climate change lengthendrought and alter the time of snow melting and precipitation, tensions could easily flare throughout thebasin, as they have in the past.
The problems in Iraq are more pressing than in Turkey and Syria. Iraq is very dry and more flatmaking it prone to evaporation. Iraq has extremely dry periods, sometimes lasting up to six months fromMay to October. The temperature during this time can get up to 120 degrees Fahrenheit. The climate is amajor factor in producing high evaporation, but the artificial lakes upstream the dams, which have largeopen water areas that increase the quantity of evaporation and increase the pollutant concentration in thestorage water, also contributes in water losses from the system through evaporation.
Urbanization, industrialization, increase in population, and expansion in farming with usingtraditional irrigation systems, all these factors lead to increase water demand in these three countries.With the construction of many dams in Turkey and Syria, the quantities of water that enter Iraqdecreases with the execution of an ambitious water management plan for Turkey (GAP), the quantities ofwater will decrease more and more.
Key Word: Tigris-Euphrates River, quality, quantity, Iraq, GAP
INTRODUCTION
he water resources in Iraq areconcentrated in Tigris and the Euphrates
Rivers, which are representing together 98% ofthe water resources in the country (FAO, 1994).Euphrates and Tigris are two of the largest threerivers in the Middle East, figure (1). These tworivers play an extremely important role inproviding water for these areas. Within this area,just these two rivers together with the Nile areclassified as large by the world standards (Al-Hadithi, 1978). Euphrates and Tigris (with someof their tributaries) originate in the highlands ofTurkey, and flow through a region between 45º
N and 25º North latitude. Euphrates crossesSyria before flowing into Iraq and meeting
Tigris, which also crosses Syria, and togetherthey form Shat Al Arab in the south of Iraq,jointly flowing 190 km before pouring water intothe Gulf. Iraq is located between latitudes 29°and 38°N, and longitudes 39° and 49°E (a smallarea lies west of 39°E), encompassing 438,320km2. includes 924 km2 of inland waters and it isthe 58th largest country in theworld(http://en.wikipedia.org/wiki/Iraq#Geography Jon 2011.).
The Tigris and Euphrates rivers are the mainsources of water in Iraq with a river basin area of126,900 km2 for Tigris and 177,600 km2 forEuphrates without tributaries (Frenken, 2009).Both these rivers originate in the highlands ofTurkey and share their physical, climatic,hydrologic, and geomorphologic characteristics.
T

Journal of University of Duhok, Vol. 17, No.1 (Pure and Eng. Sciences), Pp 81-94, 2014
82
However, there are different perspectives on tohow treat these two river basins, and somespecialists the identified these rivers as twins.Thus, for purposes of integrated water resourcesmanagement, it is useful to treat them asbelonging to a single basin, tables (1, 2). (Kliot,1994).
Table (1): Length of the river reaches in the basin by country (in km) )(UNESCO, 2002)
River Turkey Syrian Arab
Republic
Iraq Iran Total
Euphrates 1,230 41% 710 24% 1,060 35% 0 0% 3,000
Tigris 400 22% 44 2% 1,418 76% 0 0% 1,862
Fig. (1): Tigris-Euphrates Rivers
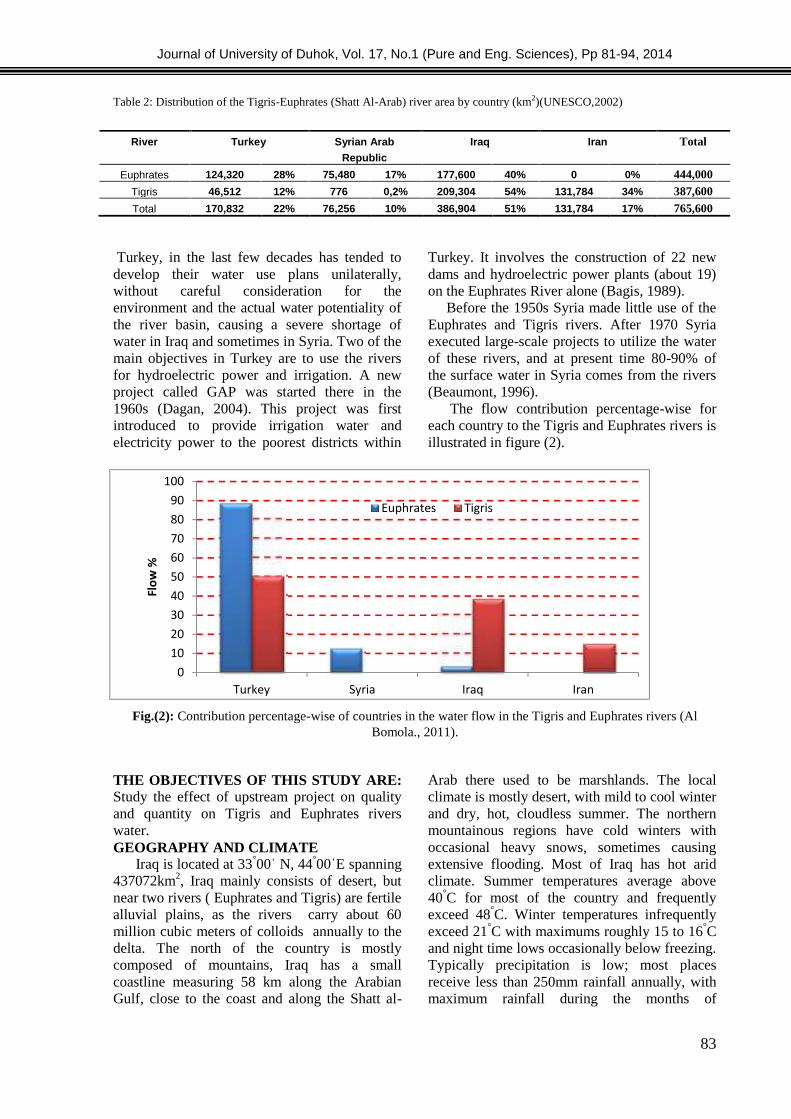
Journal of University of Duhok, Vol. 17, No.1 (Pure and Eng. Sciences), Pp 81-94, 2014
83
0102030405060708090
100
Turkey
Flow
%
Table 2: Distribution of the Tigris-Euphrates (Shatt Al-Arab) river area by country (km2)(UNESCO,2002)
Turkey, in the last few decades has tended todevelop their water use plans unilaterally,without careful consideration for theenvironment and the actual water potentiality ofthe river basin, causing a severe shortage ofwater in Iraq and sometimes in Syria. Two of themain objectives in Turkey are to use the riversfor hydroelectric power and irrigation. A newproject called GAP was started there in the1960s (Dagan, 2004). This project was firstintroduced to provide irrigation water andelectricity power to the poorest districts within
Turkey. It involves the construction of 22 newdams and hydroelectric power plants (about 19)on the Euphrates River alone (Bagis, 1989).
Before the 1950s Syria made little use of theEuphrates and Tigris rivers. After 1970 Syriaexecuted large-scale projects to utilize the waterof these rivers, and at present time 80-90% ofthe surface water in Syria comes from the rivers(Beaumont, 1996).
The flow contribution percentage-wise foreach country to the Tigris and Euphrates rivers isillustrated in figure (2).
Fig.(2): Contribution percentage-wise of countries in the water flow in the Tigris and Euphrates rivers (AlBomola., 2011).
THE OBJECTIVES OF THIS STUDY ARE:Study the effect of upstream project on qualityand quantity on Tigris and Euphrates riverswater.GEOGRAPHY AND CLIMATE
Iraq is located at 33°00ˈ N, 44°00ˈE spanning437072km2, Iraq mainly consists of desert, butnear two rivers ( Euphrates and Tigris) are fertilealluvial plains, as the rivers carry about 60million cubic meters of colloids annually to thedelta. The north of the country is mostlycomposed of mountains, Iraq has a smallcoastline measuring 58 km along the ArabianGulf, close to the coast and along the Shatt al-
Arab there used to be marshlands. The localclimate is mostly desert, with mild to cool winterand dry, hot, cloudless summer. The northernmountainous regions have cold winters withoccasional heavy snows, sometimes causingextensive flooding. Most of Iraq has hot aridclimate. Summer temperatures average above40°C for most of the country and frequentlyexceed 48°C. Winter temperatures infrequentlyexceed 21°C with maximums roughly 15 to 16°Cand night time lows occasionally below freezing.Typically precipitation is low; most placesreceive less than 250mm rainfall annually, withmaximum rainfall during the months of
River Turkey Syrian Arab
Republic
Iraq Iran Total
Euphrates 124,320 28% 75,480 17% 177,600 40% 0 0% 444,000Tigris 46,512 12% 776 0,2% 209,304 54% 131,784 34% 387,600Total 170,832 22% 76,256 10% 386,904 51% 131,784 17% 765,600
Journal of University of Duhok, Vol. 17, No.1 (Pure and Eng. Sciences), Pp 81-94, 2014
83
Syria Iraq Iran
Euphrates Tigris
Table 2: Distribution of the Tigris-Euphrates (Shatt Al-Arab) river area by country (km2)(UNESCO,2002)
Turkey, in the last few decades has tended todevelop their water use plans unilaterally,without careful consideration for theenvironment and the actual water potentiality ofthe river basin, causing a severe shortage ofwater in Iraq and sometimes in Syria. Two of themain objectives in Turkey are to use the riversfor hydroelectric power and irrigation. A newproject called GAP was started there in the1960s (Dagan, 2004). This project was firstintroduced to provide irrigation water andelectricity power to the poorest districts within
Turkey. It involves the construction of 22 newdams and hydroelectric power plants (about 19)on the Euphrates River alone (Bagis, 1989).
Before the 1950s Syria made little use of theEuphrates and Tigris rivers. After 1970 Syriaexecuted large-scale projects to utilize the waterof these rivers, and at present time 80-90% ofthe surface water in Syria comes from the rivers(Beaumont, 1996).
The flow contribution percentage-wise foreach country to the Tigris and Euphrates rivers isillustrated in figure (2).
Fig.(2): Contribution percentage-wise of countries in the water flow in the Tigris and Euphrates rivers (AlBomola., 2011).
THE OBJECTIVES OF THIS STUDY ARE:Study the effect of upstream project on qualityand quantity on Tigris and Euphrates riverswater.GEOGRAPHY AND CLIMATE
Iraq is located at 33°00ˈ N, 44°00ˈE spanning437072km2, Iraq mainly consists of desert, butnear two rivers ( Euphrates and Tigris) are fertilealluvial plains, as the rivers carry about 60million cubic meters of colloids annually to thedelta. The north of the country is mostlycomposed of mountains, Iraq has a smallcoastline measuring 58 km along the ArabianGulf, close to the coast and along the Shatt al-
Arab there used to be marshlands. The localclimate is mostly desert, with mild to cool winterand dry, hot, cloudless summer. The northernmountainous regions have cold winters withoccasional heavy snows, sometimes causingextensive flooding. Most of Iraq has hot aridclimate. Summer temperatures average above40°C for most of the country and frequentlyexceed 48°C. Winter temperatures infrequentlyexceed 21°C with maximums roughly 15 to 16°Cand night time lows occasionally below freezing.Typically precipitation is low; most placesreceive less than 250mm rainfall annually, withmaximum rainfall during the months of
River Turkey Syrian Arab
Republic
Iraq Iran Total
Euphrates 124,320 28% 75,480 17% 177,600 40% 0 0% 444,000Tigris 46,512 12% 776 0,2% 209,304 54% 131,784 34% 387,600Total 170,832 22% 76,256 10% 386,904 51% 131,784 17% 765,600
Journal of University of Duhok, Vol. 17, No.1 (Pure and Eng. Sciences), Pp 81-94, 2014
83
Iran
Table 2: Distribution of the Tigris-Euphrates (Shatt Al-Arab) river area by country (km2)(UNESCO,2002)
Turkey, in the last few decades has tended todevelop their water use plans unilaterally,without careful consideration for theenvironment and the actual water potentiality ofthe river basin, causing a severe shortage ofwater in Iraq and sometimes in Syria. Two of themain objectives in Turkey are to use the riversfor hydroelectric power and irrigation. A newproject called GAP was started there in the1960s (Dagan, 2004). This project was firstintroduced to provide irrigation water andelectricity power to the poorest districts within
Turkey. It involves the construction of 22 newdams and hydroelectric power plants (about 19)on the Euphrates River alone (Bagis, 1989).
Before the 1950s Syria made little use of theEuphrates and Tigris rivers. After 1970 Syriaexecuted large-scale projects to utilize the waterof these rivers, and at present time 80-90% ofthe surface water in Syria comes from the rivers(Beaumont, 1996).
The flow contribution percentage-wise foreach country to the Tigris and Euphrates rivers isillustrated in figure (2).
Fig.(2): Contribution percentage-wise of countries in the water flow in the Tigris and Euphrates rivers (AlBomola., 2011).
THE OBJECTIVES OF THIS STUDY ARE:Study the effect of upstream project on qualityand quantity on Tigris and Euphrates riverswater.GEOGRAPHY AND CLIMATE
Iraq is located at 33°00ˈ N, 44°00ˈE spanning437072km2, Iraq mainly consists of desert, butnear two rivers ( Euphrates and Tigris) are fertilealluvial plains, as the rivers carry about 60million cubic meters of colloids annually to thedelta. The north of the country is mostlycomposed of mountains, Iraq has a smallcoastline measuring 58 km along the ArabianGulf, close to the coast and along the Shatt al-
Arab there used to be marshlands. The localclimate is mostly desert, with mild to cool winterand dry, hot, cloudless summer. The northernmountainous regions have cold winters withoccasional heavy snows, sometimes causingextensive flooding. Most of Iraq has hot aridclimate. Summer temperatures average above40°C for most of the country and frequentlyexceed 48°C. Winter temperatures infrequentlyexceed 21°C with maximums roughly 15 to 16°Cand night time lows occasionally below freezing.Typically precipitation is low; most placesreceive less than 250mm rainfall annually, withmaximum rainfall during the months of
River Turkey Syrian Arab
Republic
Iraq Iran Total
Euphrates 124,320 28% 75,480 17% 177,600 40% 0 0% 444,000Tigris 46,512 12% 776 0,2% 209,304 54% 131,784 34% 387,600Total 170,832 22% 76,256 10% 386,904 51% 131,784 17% 765,600

Journal of University of Duhok, Vol. 17, No.1 (Pure and Eng. Sciences), Pp 81-94, 2014
84
0102030405060708090
100
J F M A M J J A S O N D
Mea
n an
nual
clim
ate
para
met
ers
Months
preciptation mm/year
relative humidity
average wind speed kg/hr
temperature °C
November to April. Rainfall during the summeris extremely rare except in the very north of thecountry (http://en.wikipedia.org/wiki/Iraq)
The climate in Turkey (upstream) ischaracterized by long harsh cold winters withabundant precipitation, where the temperatureincreases gradually from north to south. Winterrains are more excessive than the summer rains.Extremely cold temperatures of down to -45 °Coccur in the winter, while the hottest month inTurkey is August with a mean maximumtemperature of 24-28 °C (Beaumont, 1996) Theprevalent climate types in Syria (river basin part)and in Iraq (downstream) are the continental,
subtropical, and semi-arid types. The averagetemperatures in Iraq range from higher than 48°C in July and August to below freezing inJanuary,figure (3). Minimum temperature in thewinter season range from near freezing in thenorthern parts to 2 °C in the western desert andto 4 ° C in the alluvial plain of southern Iraq.Summer is dry and extremely hot with a shadetemperature of 43 °C during July and August,dropping at night to 26 °C. The winter in Iraq iscold while the summer is very hot resulting in ahigh rate of evaporation in the middle andsouthern part of the country which reaches 17mm per day during summer (Dagan, 2004).
Fig. (3): Mean annual climate parameters over Iraq (FAO. 1994)
HYDROLOGIC CHARACTERISTICAlmost the origin of all the major rivers and
tributaries crossing Iraq is located in Turkey andIran. Iraq only contributes with a tiny quantity offlow to the Euphrates River, however, on theTigris River, Iraq contributes the majority of thetotal flow via greater and lesser Zab, theAdhaim, and the Diyla River. Iraq contributes48.1% of water potential to the Tigris (sometributaries have their heads out of Iraq whichreduces the Iraq contribution) and 2%-3% to theEuphrates. Iraq has much greater control of thewater in the Tigris than it has of the Euphrates.Approximately more than 98% of theEuphrates flow originates outside Iraq comparedto only 52% of the Tigris flow.
The river is largely fed from the snowprecipitation over the upland of eastern Turkey,where the annual total precipitation is more than1000 mm, while the precipitation over Syria and
Iraq is much less than this quantity. The flow ofEuphrates is highly regulated and controlled by aseries of dams and reservoirs constructed byTurkey, Syria, and Iraq.
The Euphrates and the Tigris river hydrologyis to a large degree determined by the snow meltand is largely linked to the precipitation in thehighlands of Turkey (and to less extent in Iran,for some of the tributaries to Tigris River). Theannual flow of the
Euphrates River is highly seasonal. The valueexhibits a wide range, estimated to be between33% and 75% of the annual average flow, whichrange, from31 to 33 BCM (983 to 1046 m3/s).Turkey contributes with about 88%, and Syriacontributes with 10%, and the remaining 2%comes from Valleys inside Iraq (FAO, 1994).Precipitation in the river basin is confined towinter time from October through April, and alarge proportion of the total precipitation falls as

Journal of University of Duhok, Vol. 17, No.1 (Pure and Eng. Sciences), Pp 81-94, 2014
85
snow on the uplands, stay in solid state on themountain slopes until an increase in temperatureoccurs in early summer (April and May). Theriver flow during these two months is estimatedto be 42% of the annual total flow (Beaumont,1996) and (Shahin, 2007).
A schematic description of the hydrologicand water allocation schemes for Euphrates
River and its relationship with Tigris Riverwithin Iraq is shown in (diagram 1) Themanagement and operation of the whole systemis done in accordance with the water balance, theclimatic conditions (dry-wet year), and the damoperation policies (storage- release) in theupstream countries.
Diagram (1): Major reservoir systems in the Tigris-Euphrates watershed (improved from Kavvas et. al, 2006)
EFFECT OF THE UPSTREAM PROJECTThe dam projects of Turkey on the
Euphrates and Tigris River could affectnegatively on the irrigation and powerproduction in Iraq, as well as the environment,recreation, fisheries, and generate health hazards.The decrease in river flow rates and the effectsof drought and evaporation of water that isstored in reservoirs will cause deterioration inwater quality due to increasing concentration ofpollutants and salts in the remaining water. Whatmakes the quality of water worse is the relativeincrease in industrial wastewater, returnirrigation wastewater, and untreated sewagewater that reach the waterway, which has led tothe disqualification of 1.3 million acres in Iraq.(FAO, 1994).Dam Constructions and Conflict on the
Tigris and Euphrates before the GAPIn the case of the Tigris and Euphrates
rivers, the dams play an important role in
exacerbating conflict between the major riparianStates –Turkey, Syria and Iraq
- is clear. All three countries rely on thewaters of the Euphrates and Tigris for theiragriculture, energy and future development,table (3) (PWA, 2001).Dam Constructions and Conflict on the Tigrisand Euphrates together with GAP
Since the 1980s Turkey and Iraq havestarted to implement ambitious waterdevelopment schemes on both the Tigris and theEuphrates, transforming the river and the lives ofpeople who depend on it. Iraq completed thelarge multi-purposeMosul Dam
with a reservoir capacity of 10 BCM in thelate 1980s, and has started to construct the otherbig Samara dam
on the Tigris with a similar storage capacity.(Allan, 2000).
Table (3): Major Turkish and Syrian Dams that Reduce Downstream Flows

Journal of University of Duhok, Vol. 17, No.1 (Pure and Eng. Sciences), Pp 81-94, 2014
86
0102030405060708090
100
flow
BM
C
years
euphrates tigies total
(Global Food and Water Crises, 2012)
1-REDUCING THE FLOWCovering an area of 126,900 km2 and
177,600 km2 respectively, the Tigris and theEuphrates Rivers are the primary sources ofsurface water in Iraq. Historically, the riversplayed a central role in sustaining Iraq andcontributed to the birth and development offlourishing civilizations in the Fertile Crescent.In the last few years, however, water levels inIraq’s rivers have rapidly decreased to less thana third of their normal capacity. Water levelsmay fall further in the coming years due todeclining precipitation, gradual desertification,and upstream water use and damming. The long-term average annual precipitation in Iraq is equalto 216mm per year with high variability acrosstime and governorate. In 2011, 507.4mm ofwater fell in Suleimaniyah while only 65.3mmfell in Basrah. Lakes, reservoirs, and minorrivers are also experiencing diminished levels ofwater. If present conditions remain unchanged,
Iraq will experience a water shortage of over 33million cubic meters a year by 2015. The Tigrisand Euphrates Rivers, originating in Turkey andcrosses both Syria and Iraq, have experiencecross drastic reductions in water flows in recentyears due, primarily, to Turkish hydro-engineering and regional drought. This is ofsignificance for Iraq, which has historicallyprospered because of the rich agriculturalharvests based on water supplies source fromthese waterways. Turkish initiatives aimed atmassively expanding their exploitation of thewater from the two rivers have coincided withsevere droughts in the region and resulted in aburgeoning water-shortage crisis in Iraq.This problem threatens an environmentalcatastrophe. Political negotiations between thethree countries have so far fallen short ofreaching agreement on providing the necessaryincreases in flow rates to addressthe deteriorating situation in Iraq, Figure (4).
Fig. (4): Annual average flows via Euphrates & Tigris River in Iraqi during period (1990-2007).( (Jawad ,2003 Al Bomola., 2011).
Major Turkish and Syrian Dams that Reduce Downstream Flows
Atatürk (Turkey) Completed in 1990 on the Euphrates River
Almost led to armed conflict between Turkey and downstream countries Syria and Iraq
Ilisu (Turkey) Under construction on the Tigris River
Due for completion in 2015
Strongly opposed by Iraq due to projections of significant decreases in downstream flows
Tabqa (Syria) Completed in 1975 on the Euphrates River
Largest dam in Syria
Created severe objections from Iraq and almost led to armed conflict between the two nations
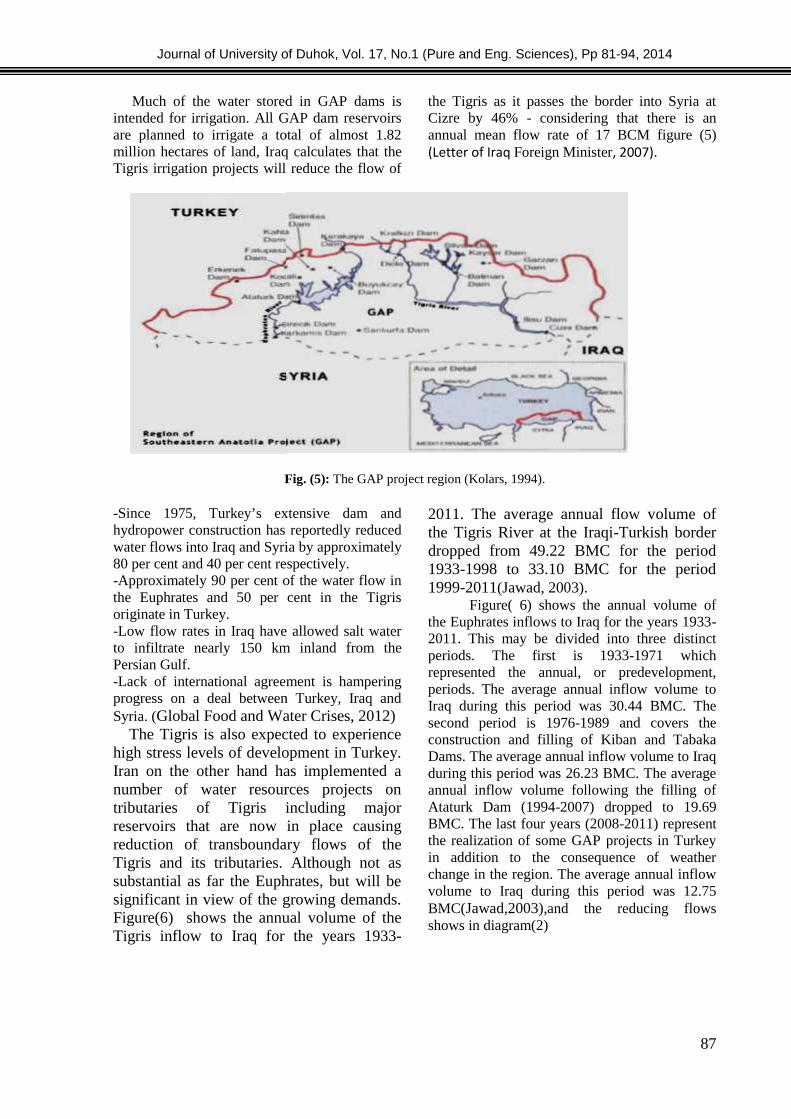
Journal of University of Duhok, Vol. 17, No.1 (Pure and Eng. Sciences), Pp 81-94, 2014
87
Much of the water stored in GAP dams isintended for irrigation. All GAP dam reservoirsare planned to irrigate a total of almost 1.82million hectares of land, Iraq calculates that theTigris irrigation projects will reduce the flow of
the Tigris as it passes the border into Syria atCizre by 46% - considering that there is anannual mean flow rate of 17 BCM figure (5)(Letter of Iraq Foreign Minister, 2007).
Fig. (5): The GAP project region (Kolars, 1994).
-Since 1975, Turkey’s extensive dam andhydropower construction has reportedly reducedwater flows into Iraq and Syria by approximately80 per cent and 40 per cent respectively.-Approximately 90 per cent of the water flow inthe Euphrates and 50 per cent in the Tigrisoriginate in Turkey.-Low flow rates in Iraq have allowed salt waterto infiltrate nearly 150 km inland from thePersian Gulf.-Lack of international agreement is hamperingprogress on a deal between Turkey, Iraq andSyria. (Global Food and Water Crises, 2012)
The Tigris is also expected to experiencehigh stress levels of development in Turkey.Iran on the other hand has implemented anumber of water resources projects ontributaries of Tigris including majorreservoirs that are now in place causingreduction of transboundary flows of theTigris and its tributaries. Although not assubstantial as far the Euphrates, but will besignificant in view of the growing demands.Figure(6) shows the annual volume of theTigris inflow to Iraq for the years 1933-
2011. The average annual flow volume ofthe Tigris River at the Iraqi-Turkish borderdropped from 49.22 BMC for the period1933-1998 to 33.10 BMC for the period1999-2011(Jawad, 2003).
Figure( 6) shows the annual volume ofthe Euphrates inflows to Iraq for the years 1933-2011. This may be divided into three distinctperiods. The first is 1933-1971 whichrepresented the annual, or predevelopment,periods. The average annual inflow volume toIraq during this period was 30.44 BMC. Thesecond period is 1976-1989 and covers theconstruction and filling of Kiban and TabakaDams. The average annual inflow volume to Iraqduring this period was 26.23 BMC. The averageannual inflow volume following the filling ofAtaturk Dam (1994-2007) dropped to 19.69BMC. The last four years (2008-2011) representthe realization of some GAP projects in Turkeyin addition to the consequence of weatherchange in the region. The average annual inflowvolume to Iraq during this period was 12.75BMC(Jawad,2003),and the reducing flowsshows in diagram(2)

Journal of University of Duhok, Vol. 17, No.1 (Pure and Eng. Sciences), Pp 81-94, 2014
88
desertification
Reduction
of arable lands
water supply
plant
0
20
40
60
80
100
120
1920 1930 1940 1950
Flow
BM
C
Annual inflows ofEuphrates riverAnnual inflows oftigris river
Figure 6: Annual Inflows of Tigris River and Euphrates River
Diagram2: shows the effect of reducing flow in rivers
2-DECREASED WATER QUALITYThe quality of the water or which release
from Turkey to Syria and Iraq will significantlydeteriorate to be of less quality than beforeentering the dam reservoirs within Turkey. Thisis due to increasing waste water entering riversfrom urban areas and increasing water use forirrigation.
The original planning for the GAP projectappears to have paid little attention to theproblem of return flows from irrigation schemes.Both Syria and Iraq fear that the result will beincreased levels of salinity in the waters of theTigris and Euphrates, a problem which will be
compounded by pesticide and fertilizer run-offand by increased sewage discharges from thenew urban centers that GAP is seeking tostimulate. Already before reaching Syria andIraq the water quality in the most large damreservoirs of GAP will be decreased enormously.So in Syria and Iraq the use of contaminatedwater in irrigation results in the transmission ofcontaminants to the irrigated plants andconsequently to humans, as well as increasingsoil salinity, reducing productivity andconverting areas of agricultural land into barrenland. The deterioration of water qualitydefinitely reduces the uses to which the water
Journal of University of Duhok, Vol. 17, No.1 (Pure and Eng. Sciences), Pp 81-94, 2014
88
Reducing the
Flow
Effect ON
water supply
plant
Power
generationreduction
Reduced flow
irrigation.
1950 1960 1970 1980 1990 2000years
Annual inflows ofEuphrates riverAnnual inflows oftigris river
Figure 6: Annual Inflows of Tigris River and Euphrates River
Diagram2: shows the effect of reducing flow in rivers
2-DECREASED WATER QUALITYThe quality of the water or which release
from Turkey to Syria and Iraq will significantlydeteriorate to be of less quality than beforeentering the dam reservoirs within Turkey. Thisis due to increasing waste water entering riversfrom urban areas and increasing water use forirrigation.
The original planning for the GAP projectappears to have paid little attention to theproblem of return flows from irrigation schemes.Both Syria and Iraq fear that the result will beincreased levels of salinity in the waters of theTigris and Euphrates, a problem which will be
compounded by pesticide and fertilizer run-offand by increased sewage discharges from thenew urban centers that GAP is seeking tostimulate. Already before reaching Syria andIraq the water quality in the most large damreservoirs of GAP will be decreased enormously.So in Syria and Iraq the use of contaminatedwater in irrigation results in the transmission ofcontaminants to the irrigated plants andconsequently to humans, as well as increasingsoil salinity, reducing productivity andconverting areas of agricultural land into barrenland. The deterioration of water qualitydefinitely reduces the uses to which the water
Journal of University of Duhok, Vol. 17, No.1 (Pure and Eng. Sciences), Pp 81-94, 2014
88
Reduced flow
irrigation.
Agricultural
production
2000 2010 2020
Figure 6: Annual Inflows of Tigris River and Euphrates River
Diagram2: shows the effect of reducing flow in rivers
2-DECREASED WATER QUALITYThe quality of the water or which release
from Turkey to Syria and Iraq will significantlydeteriorate to be of less quality than beforeentering the dam reservoirs within Turkey. Thisis due to increasing waste water entering riversfrom urban areas and increasing water use forirrigation.
The original planning for the GAP projectappears to have paid little attention to theproblem of return flows from irrigation schemes.Both Syria and Iraq fear that the result will beincreased levels of salinity in the waters of theTigris and Euphrates, a problem which will be
compounded by pesticide and fertilizer run-offand by increased sewage discharges from thenew urban centers that GAP is seeking tostimulate. Already before reaching Syria andIraq the water quality in the most large damreservoirs of GAP will be decreased enormously.So in Syria and Iraq the use of contaminatedwater in irrigation results in the transmission ofcontaminants to the irrigated plants andconsequently to humans, as well as increasingsoil salinity, reducing productivity andconverting areas of agricultural land into barrenland. The deterioration of water qualitydefinitely reduces the uses to which the water

Journal of University of Duhok, Vol. 17, No.1 (Pure and Eng. Sciences), Pp 81-94, 2014
89
can be put, even if it does not render the watercompletely unusable for human or agriculturalconsumption. This can create a shortage in watersupply,converting the quality problem intoaquantity problem (www.amarappeal.org,1994).Estimates vary, but one independent study haspredicted that insecticide levels in the Syrianportion of the Euphrates and its tributaries couldincrease by 35% ( Kolars ,et al,1991). Technicalstudies conducted by Iraq have also forecast adoubling of salinity levels in the Tigris as aresult of upstream irrigation in Turkey.Iraq alsobelieves that existing dam projects on the Tigrisand Euphrates will affect about 1.3millionhectares of agricultural land (40 per cent of theagricultural land available) as a result ofdeclining water quality. Turkey's RegionalAmbitions; Controlling the Water There are alsofears that the dams that Turkey has built - andintends to build - will enable Turkey to exercisecontrol over its downstream neighbors. Suchfears for an hydro hegemony by Turkey are notwithout foundation. The potential to hold waterback, which the GAP - even uncompleted -givesTurkey over its downstream neighbours, is huge.Turkey's three major dams on the Euphrates -Keban, Karakaya and Ataturk - have a storagecapacity (some 90-100 billion cubic metres ofwater), which greatly meets almost the threetime of annual flow of the Euphrates. If all damsin the Tigris Basin are built, Turkey will have astorage capacity of 22 BMC which is more thanthe annual mean flow of 17 BMC(Frenken,2009).
In Iraq, the quality of water used for drinkingand agriculture is poor and violates both IraqiNational Standards and World HealthOrganization guidelines. In 2010, the BiologicalOxygen Demand (BOD) representing the degreeof water pollution by organic materials—wasequal to 36.2 mg/L, more than three times thenational limit of 10 mg/L, indicating an alarmingincrease in water pollution, the BOD wasbetween (1.04-12.12). The Total Dissolved Salts(TDS) in the Euphrates’ river water increasedfrom 457 parts per million (ppm) in the 1980s to1200ppm in 2009 reflecting a quick deteriorationof incoming water, high pollution and salinityhad devastating effects on livestock, agriculture,and fishing in the Muthanna, Missan Basra, andWassit governorates(Al Bomola,2011).3-ISSUES OF WATER QUANTITY ANDQUALITY
From tables (4,5) and diagram (3) Appearthat water requirements generated from the
GAP causes most severe strains in the waters ofboth rivers, but most drastically affect on theflow in the Euphrates. With the completion ofthe Ataturk Dam in 1990, Turkey declared that itwill only guarantee a flow from its border equalto half the original flow of the river. Althoughthis represents the “minimum” amount that willbe provided from the Turkish border for use bySyria and Iraq, the more important issue will bethe discharge patterns established by Turkey.Power production will likely be maximizedduring the winter months, resulting in the peakdischarge from the dam occurring in the monthsof December – January. The river flow willconsequently be at a maximum during thesemonths as well, in contrast to the traditional peakdischarge months of April – May (Beaumont,1996). If the additional water released byTurkey during peak discharge periods is notadequately captured by both countries inreservoirs, they will be left with a significantshortage during periods of peak use by farmers.Even with reservoirs to hold such waters (LakeAssad, Lake Habbaniyah, etc), evaporation dueto the extreme temperatures will continue tostrain these resources. Furthermore, althoughirrigation is the primary culprit for the increasedwater demand, the increasing populations alongthe rivers and the potential increase in industriesrequiring significant water sources will placeadditional strain on water resources of the basin.The extensive use of water for irrigation andIndustrial use will also undoubtedly lead towater re-entering the river system with higherlevels of salinity, chemical content, and ingenerall untreated and contaminated state. Thisissue will most severely affect Iraq as they willbe the beneficiaries of such abuse by bothTurkey and Syria. Depending on the severity ofsuch use in the future, Iraq could potentiallyexperience drastic effects to their agriculturalindustry and on their ability to sustainpopulations and industry along the river.
CONCLUSION
The most important step toward solvingthe water issues of the Tigris-Euphrates riverbasin for all three riparian nations is to sit downto seriously negotiate the issues surrounding thewater resources of the basin. Turkeyunquestionably holds the most power in thissituation, but both Syria and Iraq have sharedinterests that, if presented as a common front,may have more weight in political negotiations.

Journal of University of Duhok, Vol. 17, No.1 (Pure and Eng. Sciences), Pp 81-94, 2014
90
Iraq has the most to gain from developing somekind of a formal agreement on water use in theregion as the historical heaviest user of aresource that will only continue to be consumedat an ever increasing rate upstream. The fact thatTurkey controls much less of the Tigris than the
Euphrates leaves the option of flow diversion asa possible solution to Iraq to supplementdecreases flow rate from the Euphrates.Challenges of increased salinity levels of thewater, As Iraq continues to stabilize and improveits infrastructure and economy,
Table (4): Some water quality parameters of Tigris and Euphrates rivers in 1981
River
test
Tigris (turkey & peshkhabur)1981
TigrisMosul cityUpper town
1981
TigrisMosul city
Lower town1981
EuphratesHaditha
1981
EuphratesRamadi
1981
Temperature C 12.5 19.5 19.5 19 19.5
pH 9 8.5 8.8 8.7 8.9
Conductivity umh 430 520 535 360 360
Turbidity(NTU) 25 75 56 35 40
Dissolved oxygen
concentration mg/l
5.7 5.1 5.3 5.4 6
Alkalinity mgCaCO3/l 131 133.5 138.2 103.5 105
Sodium concentration mg/l 11 23 18 32 15
Potassium concentration
mg/l
1.1 1.9 2.3 2.5 2.3
Calcium concentration mg/l 33.6 47.6 47.2 32.4 32.8
Magnesium concentration
mg/l
20.1 22.5 21.1 19.9 22.5
Nitrate concentration ug at
.N/l
41.5 44.4 43.9 39.9 35.3
Nitrite concentration ug at
.N/l
0.21 0.58 0.54 0.09 0.19
Silicate concentration ug at
Si /l
29.9 43.3 39.1 41.6 44.1
Orthophosphate
concentration ug at .p/l
0.29 0.9 0.36 0.61 0.27
Total number of
phytoplankton cells/l
199800 148160 555560 537080 814880

Journal of University of Duhok, Vol. 17, No.1 (Pure and Eng. Sciences), Pp 81-94, 2014
91
Table (5): Some water quality parameters of Tigris and Euphrates rivers in 2000
Rivertest
Tigris (Turkey &pesh khabur)2000
TigrisMosul cityUpper town
2000
TigrisMosul city
Lower town2000
EuphratesHaditha
2000
EuphratesRamadi
2000
Temperature C 12.2 19.95 19.45 19.6 19.9
pH 8.45 7.79 7.65 8.9 8.85
Conductivity umh 425 435 445 400 410
Turbidity(NTU) 35 89 105 55 100
Dissolved oxygen
concentration mg/l
5.3 5.5 5.8 5.3 5
Alkalinity mgCaCO3/l 140 230 250 146 155
Sodium concentration mg/l 15 26.5 28.4 38 22
Potassium concentration
mg/l
1.5 5.1 5.8 3.5 4.3
Calcium concentration mg/l 63.7 192 208 134 138
Magnesium concentration
mg/l
30 85 92 39 45
Nitrate concentration ug at
.N/l
85 182 215 40 135
Nitrite concentration ug at
.N/l
0.26 0.98 1. 4 0.18 0.2
Silicate concentration ug at
Si /l
30 32 45 46 51
Orthophosphate
concentration ug at .p/l
0.49 105 98 4.6 7
Total number of
phytoplankton cells/l
209100 150000 654560 648080 903280
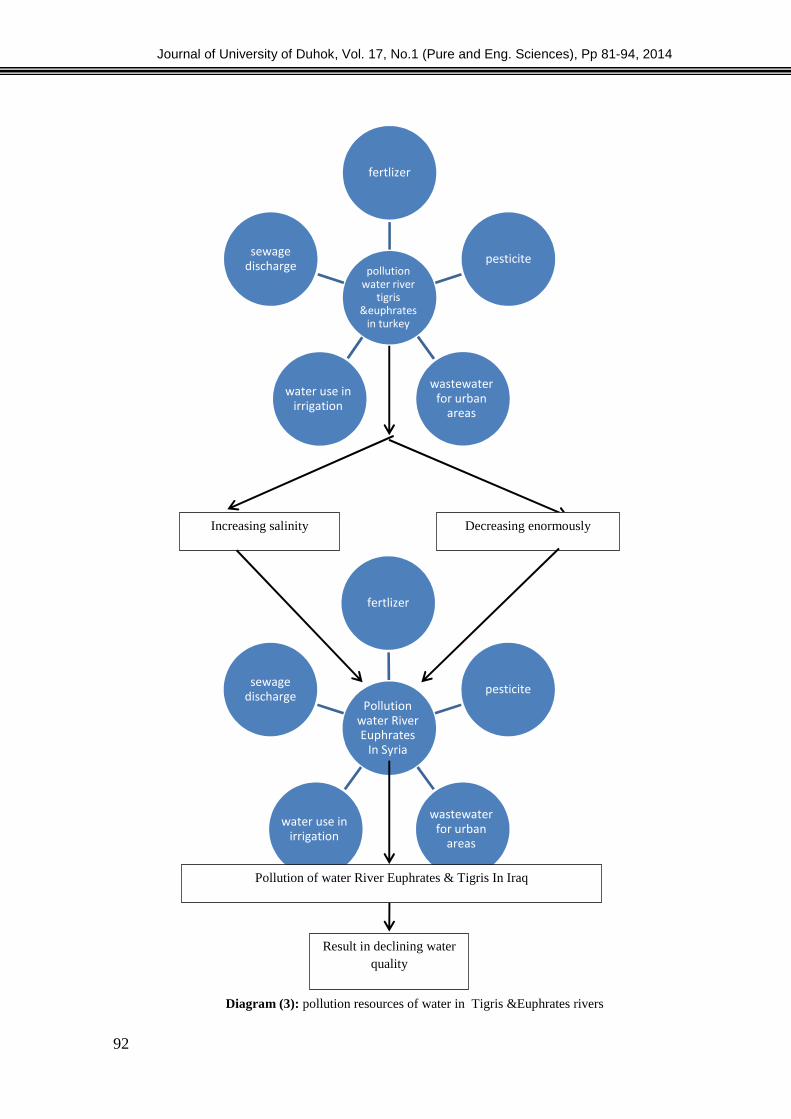
Journal of University of Duhok, Vol. 17, No.1 (Pure and Eng. Sciences), Pp 81-94, 2014
92
Pollutionwater RiverEuphrates
In Syria
fertlizer
pesticite
wastewaterfor urban
areas
water use inirrigation
sewagedischarge
Diagram (3): pollution resources of water in Tigris &Euphrates rivers
pollutionwater river
tigris&euphrates
in turkey
fertlizer
pesticite
wastewaterfor urban
areas
water use inirrigation
sewagedischarge
increasing water salinity
Increasing salinity Decreasing enormously
Pollution of water River Euphrates & Tigris In Iraq
Result in declining waterquality
Journal of University of Duhok, Vol. 17, No.1 (Pure and Eng. Sciences), Pp 81-94, 2014
93
REFERENCE- FAO. 1994. Country information brief, Iraq. FAO-
Representation in Iraq.- Al-Hadithi A.H., Optimal utilization of the water
resources of the Euphrates River in Iraq.Doctoral Dissertation. University of Arizona(1978).
-From Wikipedia, the free encyclopedia. Informationabout Iraq, available athttp://en.wikipedia.org/wiki/Iraq#Geography,retrieved 21 Jon 2011.
- Frenken, Karen, Irrigation in the Middle East regionin figures. AQUASTAT survey 2008, WaterReports, 34, Rome: FAO, (2009),ISBN9789251063163.
-Kliot, Nurit, Water Resources and Conflict in theMiddle East, London: Routledge, (1994), p.100.
- WATER RESOURCES INIRAQ,(1999)unesco.org/water/wwap/news/iraq.shtml
-Dagan, A. ,Development and Management of theEuphrates-Tigris Basin, InternationalHydropower Association and Department ofCivil Engineering, Middle East, TechnicalUniversity, Ankara, Turkey, Water ResourcesDevelopment, Vol. 20,No. 1, (2004), 15-33.
-Bagis, A.L.. South-eastern Anatolia Project—thecradle of civilization regenerated. Istanbul:Gelisim Yayinlari A.S(1989).
-Beaumont, P., Agricultural and environmentalchanges in the upper Euphrates catchment ofTurley and Syria and their political andeconomic implications. Applied Geography,vol. 16, no. 2,( 1996), 137-157.
-Shahin, Mamdouh, Water Resources andHydrometeorology of the Arab Region,Dorecht: Springer, ISBN 9781 402054143.(2007),P251.
-Kavvas, M.L, Chen, R.Z.Q., Anderson, M.L., OharaN., Yoon., A regional hdroclimatic data overthe watershed.( 2006).
- PWA ,Cited in Philip Williams and Associates: AReview of the Hydrological and Geomorphic
Impacts of the Proposed Ilisu Dam, Report forthe Corner House, San Francisco, July 2001.
-Turkish Ministry of Foreign Affairs, quoted in Allan,J.A., The Middle East Water Question:Hydropolitics and the Global Economy,I.B.Taurus, London, 2000, p.73.
-Global Food and Water Crises ,Tuesday, 28 August2012)http://www.futuredirections.org.au/publications/food-and-water-crisis.
- Letter of Iraq Foreign Minister Hosyar Zebari to theGerman Foreign Minister Walter Steinmeieron the 21st July 2007.
-Kolars, J., Problem of International RiverManagement. In: The case of the Euphrates,International Waters of the Middle East fromEuphrates-Tigris to Nile, Biswas, A.K. (Ed.).Oxford University Press, Oxford, (1994),pp:44-49.
-Jawad, Laith A. ,Impact of environmental change onthe freshwater fish fauna of Iraq InternationalJournal of Environmental Studies 60 (6),(2003),: 581-593.
- UN General Assembly, Situation of Human Rightsin Iraq, General Assembly Resolution1994/203,available from www.unhchr.ch . Forinformation on the persecution of the MarshArabs, see:www.amarappeal.org
- Al Bomola.A.H , TEMPORAL AND SPATIALCHANGES IN WATER QUALITY OF THEEUPHRATES RIVER – IRAQ, Avdelningenför Teknisk Vattenresurslära TVVR-11/5013,ISSN-1101-9824,(2011).
-Kolars, J. and Mitchell, W.A., The EuphratesRiver and the Southeast AnatoliaDevelopment Project", Southern IllinoisUniversity Press, Carbondale, 1991, cited inDaoudy, M., "The Development of theEuphrates and Tigris Basins: AnAssessment of Upstream Development(Turkey) on Downstream Riparians(Syria)", Submission to the WorldCommission on Dams, Presented at theAfrica/Middle-East Regional Consultation,December 1999, available fromwww.dams.org.

Journal of University of Duhok, Vol. 17, No.1 (Pure and Eng. Sciences), Pp 81-94, 2014
94
الخالصةجدال كبيراو .إدارة المياهآثار كبيرة علىسيكون لها، والتي تغييرات جذريةاالخيرة الى الفترةفيتعرضت منطقة الشرق األوسط،يموغرافياد
احتياجات، 2050بحلول عام مثال على ذلك ، والعراقا سوريتركياالفرات دجلة و حولمشاركة الدول االمتشاطئة لنهري سكانهافي اي الزيادة،الحاليضعف حجمها2.6السكاني لـ بسبب النمو، ترتفعفي العراقالمتوقعةالمياه السكان و
االقتصادية ،شريان الحياةباعتبارهعلى نهر الفراتأيضاتعتمدسوريا،.نسمةمليون 83كثر من مليون نسمة أل32.6من النمو ، هذا مليون نسمة 33.6-22.5، الحاليأضعاف حجمها1.5ينموبحلول منتصف القرنسكانهاسوف نرى
يضغط على، المحليواستخدام، والتنمية الصناعية، ألغراض الريالطلب على المياهوزيادةوالعراقفي سوريةالسكانيهطول و تساقط الثلوجوقتوتغييرالجفافوالمناخآثار تغيركما.على مدار السنةالمياهوافرة منتدفقلضمانتركيا
.ممكن ان يثير المشاكل كما في الماضياألمطار، مما وأكثر اماكنه مستويةةجداجاف وسوريا،العراقتركيامما كانت عليه فيإلحاحاهي أكثرفي العراقالمشاكل
درجة الحرارة.من مايو إلى أكتوبرستة أشهرلمدة تصل إلىطويلة، وأحيانا فترات جفافلديه.تبخرعرضة لله يجعلالبحيرات عالية، ولكنفي التبخرهو العامل الرئيسيالمناخ.درجة فهرنهايت120يمكن ان تصل إلى خالل هذا الوقت
، تخزينمياهفيالملوثاتزيادة تركيز و التبخركميةتزيد منكبيرةمياه مفتوحةهي مناطق، والتي السدودو الصطناعيةفي الزراعةوالتوسع، في عدد السكان، وزيادة لتحضر والتصنيع.التبخرنظامخاللمنفاقد من المياهفيأيضاويسهم
مع بناء العديد . كل هذه العوامل تؤدي إلى زيادة الطلب على المياه في هذه الدول الثالثالتقليدية الرينظمباستخداممن السدود في تركيا وسوريا، وكميات من المياه التي تدخل العراق يتناقص مع تنفيذ خطة طموحة إلدارة المياه تركيا
)GAP(فإن كميات المياه تنخفض أكثر وأكثر ،.

Journal of University of Duhok, Vol. 17, No.1 (Pure and Eng. Sciences), Pp 95-98, 2014
95
GROWTH OF SCINTILLATOR MATERIALS OF CERIUM DOPEDLANTHANUM BROMIDE SINGLE CRYSTALS VIA BRIDGMAN
TECHNIQUE
FARIS KOCHARY
Dept. of Physics, Faculty of Science, University of Duhok, Kurdistan Region, Iraq- Iraq
(Received: January 26, 2014; Accepted for publication: February 27, 2014)
ABSTRACTThe capability to distinguish between gamma rays with somewhat different energies by scintillation is
of extreme prominence for many applications such as medical imaging, X-rays astronomy, and gammarays spectroscopy. Lately, various halide scintillators such as cerium doped lanthanum bromide have beendiscovered. There is a great importance in sensitive scintillator materials for use in homeland security andmedical applications. These materials are very hygroscopic and therefore techniques are needed to reducetheir hygroscopic nature. A look for non-hygroscopic materials is needed to advance the scintillatorknowledge and technology. In this paper, I have had an attempt of a crystal growth for a new bulk singlecrystal of LaBr3:Ce from melt using vertical Bridgman-Stockbarger technique with good conditions suchas a growth rate of 10 mm a day. At the melting point of the mix, the occupied ampoule was lowered downover a temperature ramp of 10ºC/cm. The growth process via this technique is confirmed to beencouraging and hopeful for growing transparent LaBr3:Ce single crystals with good optical quality. Thiswork has been done at the Physics laboratory of Alabama Agricultural and Mechanical University(Normal, Alabama/USA). Outcomes of creation and crystal growth parameters shall be reported.
KEYWORDS: Scintillators, Halides, Bridgman Technique, Single Crystal Growth
1. INTRODUCTION
ecently, a lot of research is focusing onthe development of new and improved
scintillator detector crystals for use in detectionand spectroscopy of energetic photons (gammarays). The radiation detector requirements formany indicative ways vary significantly and arenot always met by commercially availablescintillators. Ideally, a scintillator should have ahigh light yield, a fast response time, a highdensity and atomic number. Obviously, there aremany other criteria, such as transparency of thematerial to its own emission, ease of crystalgrowth, stability in air, and the matching of thescintillation wavelength spectrum with thesensitivity curve of the light detectors. However,there is no material that meets all of thesecriteria and the choice of a particular scintillatoris often a compromise among these and otherfactors [1-5].
The continuing serious global threat is thespread of nuclear weapons. When examining thenuclear weapons, γ-ray spectrometers may helpvery well by recognizing the γ-ray and X-raysignatures of the greatly developed uranium andplutonium limited in them. The latest generalcautions on such bombs have highlighted the
necessity for a wider range checking ofdangerous and active materials such asmanufacturing and health waste. For examiningplaces, γ-ray spectrometers must have thesepreferred features: great detection efficiency,high energy resolution, easy movability,compressed size, light weightiness, and lowpower necessities [6]. Current γ-rayspectrometers have some deficiencies in thoseneeded properties. In the search for new andefficient scintillators, most efforts have beendirected to cerium-doped crystals. In the (300-6000) nm wavelength region, the fastscintillation emitted by trivalent cerium which isranged between (15-60) ns is well known for along period of time and in many cases, the lightoutput is high [7]. Because of the high densityand effective atomic number of LaBr3, LaBr3:Cewill eventually become the scintillator of choicein the near future if it can be easily grown intolarge single crystals. The LaBr:Ce scintillatorcrystals have the favorite characteristics for γ-rayspectrometers which meet nowadays requests.Here, the latest outcomes for growth of LaBr3:Cesingle crystals via vertical Bridgman-Stockbarger technique are reported.
R

Journal of University of Duhok, Vol. 17, No.1 (Pure and Eng. Sciences), Pp 95-98, 2014
96
2. EXPERIMENTAL
3.1 SYNTHESIS AND PURIFICATION OFTHE STARTING MATERIALS
Single crystals of cerium doped lanthanumbromide LaBr3:Ce crystallize in the hexagonalclose-packed structure (HCP) with atomicpacking factor of 0.74, coordination number of12, and space group P63/m [8]. Based on thisHCP crystal structure and other latticeparameters, the density of LaBr3 is 5.29 g/cm3
and it melts at about 783°C [9]. The lattice is notlayered and does not cleave easily and theeffective atomic number for LaBr3 is 46.9 [10].In fact, this atomic number is almost similar tosodium iodide with respect to energy detectionefficiency. LaBr3 is hygroscopic like NaI orRbGd2Br7, but react differently to moisture andair. It is seemed to be oxidized within momentsforming a whitish wet powder. It is thereforeessential that these crystals are sealed into aglass or quartz container to prevent hydrationand oxidation of the crystal surface. Thefollowing requirements are important inselecting a material for use in high performancegamma ray scintillator crystals:(a) High density and atomic number.(b) High light output.(c) Short decay time without afterglow.(d) Convenient emission wavelength.(e) Mechanical ruggedness.
(f) Radiation hardness and low cost [11-12].
The needed starting chemicals werecommercially available as powders, but since alarge amount of pure anhydrous lanthanumbromide material was needed for bulk crystalgrowth and because of the hygroscopic nature ofthis compound, I have synthesized it in thePhysics laboratory of Alabama Agricultural andMechanical University (Normal,Alabama/USA). Production of the anhydrousLaBr3 was carried out via ammonium halidemethod. After overcoming initial problems anddifficulties, I was capable of designing a newexperimental set up to build the anhydrouscompound by means of these two successivechemical reactions:
La2O3 + 12 (NH4)Br → 2(NH4)3LaBr6 + 6NH3 +3H2O
2(NH4)3LaBr6 → 2 LaBr3 + 6(NH4) Br
In our first batch, 81.45 g of 99.99% purelanthanum oxide procured from Alfa Aesar wasadded to react with 293.79 g of 99.9% pureammonium bromide from Cerac to form alanthanum bromide complex. The first reactionproceeded with reasonable speed and carried outat 250°C. Both ammonia and water have beenevaporated, Figure 1.
Fig. (1) A setup designed for the first step of synthesizing of anhydrous LaBr3
In order to move out the excess ammoniumbromide, a second reaction was carried out at atemperature of about 350ºC in vacuum. The
anhydrous LaBr3 was then effectivelysynthesized. The experimental set up shown inFigure 2 was made for this purpose.

Journal of University of Duhok, Vol. 17, No.1 (Pure and Eng. Sciences), Pp 95-98, 2014
97
Fig. (2) Scheme for the 2nd step of synthesizing anhydrous lanthanum bromide
After both reactions mentioned in above, Iwas able to synthesize about 189.3 g ofanhydrous lanthanum bromide. Initial tests ofmelting point and density were comparable tothe literature values. This material was then usedto grow bulk single crystals in a quartz tube of16 mm outside diameter.
3.2 CRYSTAL GROWTHAnhydrous LaBr3 and a small amount of
CeBr3 (0.5%) were loaded into a quartz ampoulein the glove box. A vacuum pump was attachedto the ampoule and the ampoule had beenevacuated to about 0.001 Torr. Almost after 3
hrs of evacuation, the ampoule was sealed by anoxygen torch. Throughout the whole sealingprocess, the mixture was kept cool by covering awet cloth around the ampoule. Because ofheating gained from the torch, this step wasnecessary to prevent any thermal decompositionof the mixture. In order to lower it down throughthe furnace, the upper part of the ampoule wasattached to a quartz nail. Single crystals ofcerium doped lanthanum bromide were thengrown. A photograph of the used verticalBridgman furnace is shown in Figure 3:
Fig. (3) Multi-zone vertical Bridgman furnace
The transparent high temperature resistancefurnace was fabricated from Thermcraft Inc.,with a furnace muffle size of 37 mm (id) × 405mm. For the scaling up of the growth method,the temperature ramp in the furnace was
dynamically adjusted. The used transparentfurnace could grow LaBr3:Ce crystals up to 3inches long and 1 inch diameter. Acomputerized motor was used to lower down theampoule at a rate of 10 mm a day. At the start of
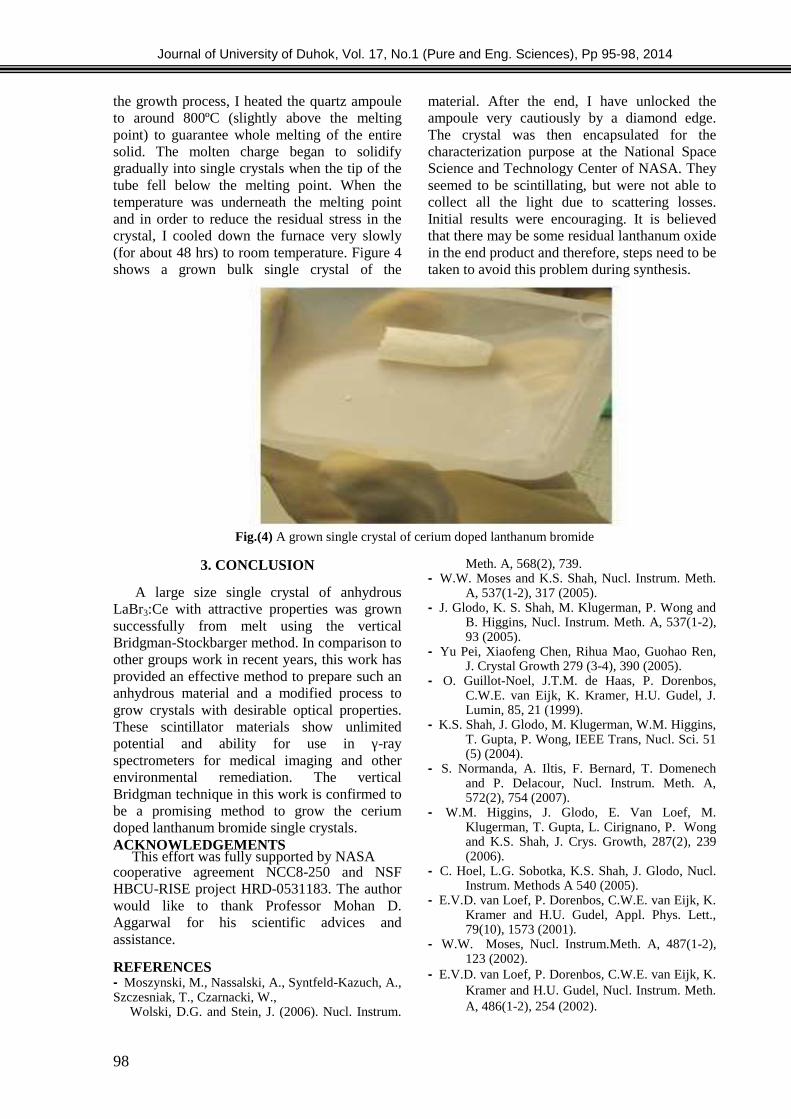
Journal of University of Duhok, Vol. 17, No.1 (Pure and Eng. Sciences), Pp 95-98, 2014
98
the growth process, I heated the quartz ampouleto around 800ºC (slightly above the meltingpoint) to guarantee whole melting of the entiresolid. The molten charge began to solidifygradually into single crystals when the tip of thetube fell below the melting point. When thetemperature was underneath the melting pointand in order to reduce the residual stress in thecrystal, I cooled down the furnace very slowly(for about 48 hrs) to room temperature. Figure 4shows a grown bulk single crystal of the
material. After the end, I have unlocked theampoule very cautiously by a diamond edge.The crystal was then encapsulated for thecharacterization purpose at the National SpaceScience and Technology Center of NASA. Theyseemed to be scintillating, but were not able tocollect all the light due to scattering losses.Initial results were encouraging. It is believedthat there may be some residual lanthanum oxidein the end product and therefore, steps need to betaken to avoid this problem during synthesis.
Fig.(4) A grown single crystal of cerium doped lanthanum bromide
3. CONCLUSION
A large size single crystal of anhydrousLaBr3:Ce with attractive properties was grownsuccessfully from melt using the verticalBridgman-Stockbarger method. In comparison toother groups work in recent years, this work hasprovided an effective method to prepare such ananhydrous material and a modified process togrow crystals with desirable optical properties.These scintillator materials show unlimitedpotential and ability for use in γ-rayspectrometers for medical imaging and otherenvironmental remediation. The verticalBridgman technique in this work is confirmed tobe a promising method to grow the ceriumdoped lanthanum bromide single crystals.ACKNOWLEDGEMENTS
This effort was fully supported by NASAcooperative agreement NCC8-250 and NSFHBCU-RISE project HRD-0531183. The authorwould like to thank Professor Mohan D.Aggarwal for his scientific advices andassistance.
REFERENCES Moszynski, M., Nassalski, A., Syntfeld-Kazuch, A.,Szczesniak, T., Czarnacki, W.,
Wolski, D.G. and Stein, J. (2006). Nucl. Instrum.
Meth. A, 568(2), 739. W.W. Moses and K.S. Shah, Nucl. Instrum. Meth.
A, 537(1-2), 317 (2005). J. Glodo, K. S. Shah, M. Klugerman, P. Wong and
B. Higgins, Nucl. Instrum. Meth. A, 537(1-2),93 (2005).
Yu Pei, Xiaofeng Chen, Rihua Mao, Guohao Ren,J. Crystal Growth 279 (3-4), 390 (2005).
O. Guillot-Noel, J.T.M. de Haas, P. Dorenbos,C.W.E. van Eijk, K. Kramer, H.U. Gudel, J.Lumin, 85, 21 (1999).
K.S. Shah, J. Glodo, M. Klugerman, W.M. Higgins,T. Gupta, P. Wong, IEEE Trans, Nucl. Sci. 51(5) (2004).
S. Normanda, A. Iltis, F. Bernard, T. Domenechand P. Delacour, Nucl. Instrum. Meth. A,572(2), 754 (2007).
W.M. Higgins, J. Glodo, E. Van Loef, M.Klugerman, T. Gupta, L. Cirignano, P. Wongand K.S. Shah, J. Crys. Growth, 287(2), 239(2006).
C. Hoel, L.G. Sobotka, K.S. Shah, J. Glodo, Nucl.Instrum. Methods A 540 (2005).
E.V.D. van Loef, P. Dorenbos, C.W.E. van Eijk, K.Kramer and H.U. Gudel, Appl. Phys. Lett.,79(10), 1573 (2001).
W.W. Moses, Nucl. Instrum.Meth. A, 487(1-2),123 (2002).
E.V.D. van Loef, P. Dorenbos, C.W.E. van Eijk, K.Kramer and H.U. Gudel, Nucl. Instrum. Meth.A, 486(1-2), 254 (2002).

Journal of University of Duhok, Vol. 17, No.1 (Pure and Eng. Sciences), Pp 99-107, 2014
99
NATURAL RADIOLOGICAL HAZARDOUS OF ROCKS IN DUHOKGOVERNORATE, KURDISTAN REGION, IRAQ
REVINK ALI RAMADHAN* and KHAIRI M-S. ABDULLAH**
* Dept. of Physics, College of Science, University of Duhok, Kurdistan Region-Iraq** Dept. of Water Resources, College of Engineering, University of Duhok, Kurdistan Region-Iraq
(Received: April 2, 2014; Accepted for publication: June 29, 2014)
ABSTRACTWe performed a study over the radiological impact on nine samples of natural rocks collected from
various areas in the Duhok governorate. The governorate is located in the northwest Kurdistan region ofIraq. NaI(TI) gamma ray spectrometer for 30000 sec per sample was utilized to detect the concentrationof radionuclide in rocked samples. The average activity concentration values of 226Ra, 232Th and 40Kobtained are 13.10 Bqkg-1, 5.20 Bqkg-1 and 134.32 Bqkg-1 respectively. Gray Clay stone, Limestone, Finesand, Silty clay and Marley shows relative high activity concentration whereas Chalky Limestone showlow activity concentration while other rock formations were moderate in radioactivity level. By utilizingthe standard analytical method the excess life time cancer risk and hazard indices were estimated. Theaverage values obtained for absorbed dose, annual effective dose equivalent (Indoor, Outdoor), hazardindices (external, internal), excess lifetime cancer risk, representative (alpha, gamma) indices and radiumequivalent are respectively 14.88 nGyh-1, 73 µSvy-1, 18.26 µSvy-1, 0.084, 0.120, 0.064×10⁻³, 0.115, 0.07 and31 Bqkg-1. After the values which obtained in this work are compared with corresponding worldpermissible values, it found that the values located below the standard limits for such environments. Therock from the study area provided no excessive exposure for the inhabitants and can be utilized asbuilding material without posing any radiological threat or harm to the public users.
KEYWORDS: NaI(TI) spectrometer, Rock sample, concentration, Hazard indices and Excess lifetime cancer risk.
INTRODUCTION
uman beings are always exposed tobackground radiation that stems both
from natural and artificial. Natural radioactivity,that is found in numerous geological formationfor instance: rocks, earth crust, , soils, plants, airand water, widespread in the environmentaround. Natural radioactive concentration mainlydepends on geographical and geologicalcondition and appears at various level in soils ofeach different geological area (UNSCEAR,2000). When rocks are disintegrated throughnatural process, radionuclides are carried to soilby rain and flows. In addition to the naturalsources; soil radioactivity is also affected byman-made activities (Ramasamy 2009 andSurinder et al. 2005).
Primordial radiation exposure originates fromthe terrestrial radio-nuclides, whose half-livesare tantamount to the age of the earth, and thesecondary radionuclides produced by theirradioactive decay. The naturally occurringradionuclides include the three radioactive decaychains originating with 238U, 232Th, and 235U and
single 40K. These radionuclides are ubiquitouslypresent in low concentrations in water and soilas a result of weathering and drift of rock(Okeyode and Oluseye 2010).
Radioactive elements found in rock and soilfrom the earth makes their way into our bodiesthrough the water we drink, food we eat, air webreathe which contains them. The largestcontributor to our daily exposure of radiation isthe natural radioactivity and the major form ofnatural radiation is Radon gas (Okeyode andAkanni 2009).
The long-term exposure to uranium andradium through inhalation has several healtheffects as chronic lung diseases, acuteleucopoenia, anemia and necrosis of the mouth.Radium causes cranial, nasal tumors and bone.Thorium exposure can cause bone, hepatic,pancreas, lung, leukemia and kidney cancers.Therefore, gamma dose rates and radio-nuclidesactivity concentrations should be monitored(Ramasamy 2009).
Knowledge of natural radioactivity present inrocks enables one to estimate any possibleradiological risk to mankind. Hence, the aim of
H

Journal of University of Duhok, Vol. 17, No.1 (Pure and Eng. Sciences), Pp 99-107, 2014
100
this study is to calculate the radioactivityconcentrations as well as the environmentaloutdoor the absorbed dose rate, annual effectivedose rate (Indoor, Outdoor), hazard indices(internal, external), excess life time cancer risk,gamma-index (Iγ, Iα) and radium equivalentactivity are also calculated.
STUDAY AREA
Duhok governorate lies in the far northwestof Iraq and forms the western governorate inIraqi Kurdistan Region. It confines with Turkeyfrom the north, Syria from the west, Erbilgovernorate from the east, and Ninevehgovernorate from the south. It is located at theintersection of longitude 43○ 00′ to the east andthe latitude 36○ 52′ in the north (Abdullah andRamadhan 2011).
It is a part of the mountain and semi-mountain that orientated from west to east, inphysiographic diversity from the middle andsouth of Iraq. The governorate is dividedadministratively into the following four districts:Duhok-district with area (1092) km
2, Sumel-
district with area (1327.7) km2, Zakho-district
with area (1521.51) km2, Akre-district with area
(6418) km2 and Amadi-district with area(2582.8) km
2.The climate of the Region is of
semi-arid type, designated as continental andsubtropical. The elevation is quite differentranging from lower than 300 to more than 1300meters above the sea level. (Dilshad 2008). Thegeological formations consisting of limestone,red beds of silt, hard clay stone with some bedsof siltstone and conglomerate and formation ofwell bedded chalky, partly dolomite limestonewith thin beds of yellowish-green marl(Abduljabbar 2003).
SAMPLE COIIECTION AND PREPARATION
According to the geological characteristics ofDuhok governorate as shown in Figure1,samples have been carefully collected from eachtype of the geological formations. A total of ninesamples have been collected (Table 1) whichrepresent the predominant rock formations ofDuhok. Measured samples were dried in an ovenat 110 C° till constant dry weight was obtained,crushed, sieved through 0.2-mm mesh tohomogenize them, stored in standard 1000 mlbeakers, dry weighed and stored for at least onemonth before counting in order to permit the in-
growth the production decay of thorium anduranium to achieve the equilibrium for 232Thand 238U with their respective progeny. While,important disequilibrium is uncommon in rocksolder than 106 years, and the 232Th series may beconsidered in equilibrium in most geologicalsurrounding (Tzortzis et al, 2003).
Fig 1: Locations of the rock samples in DuhokGovernorate.
SAMPLE COUNTING
For the radioactive concentration, thedetection assembly set up for this study consistof thallium activated sodium iodide 3″×3″ welltype NaI(Tl) detector, the photo multiplier tubeand multi-channel analyzer (MCA). The detectorwas surround in 6 cm lead shield. The countingtime of each sample was set to 30000 seconds.Background count was measured for the samelength of time. The net count was used forsubsequent analyses. As in energy calibration thesame multi source (155Eu, 137Cs and 22Na) gammarays standard sources are used to determineddetector efficiency. Both sources have knownactivity, energies and gamma decay fraction fγneeded in calibrated process. These data arefitted exponentially and plotted using EXCELprogram system, as shown in Figure 2, to get thefollowing relationship between the efficiencyand gamma energies.
iEE e 0015.0975.15
With R2=0.994Where E is the efficiency as a function of γ-
ray energies, Ei is γ-ray energies for nuclide iand R is standard deviation.
From the counting spectra, the specificactivity of 238U, 232Th and 40K was determined.The peak corresponds to 1460.8 keV for 40K,352 keV (214Pb) for 238U and 238.6 keV (212Pb)

Journal of University of Duhok, Vol. 17, No.1 (Pure and Eng. Sciences), Pp 99-107, 2014
101
for 232Th were considered in arriving at theactivity levels (Bq/kg).Calibration
y = 15.975e-0.0015x
R2 = 0.9944
0
2
4
6
8
10
12
14
16
0 500 1000 1500
Energy
Eff
ecie
ncy
Series1
Expon.(Series1)
Figure 2: Energy efficiency as a function of γ-ray energiesfor 3"×3" well type NaI(TI) detector.
RESULTS AND DISSCUTION1. Activity ConcentrationBased on the measured γ-ray counts (N
Ei) of
full width at half maximum (FWHM) photo-peaks of specified radio-nuclides in the
226Ra
and232
Th decay series and in a single40
K, theirspecific activity or activity concentrations(activity per unit mass) in samples can becalculated from the following equation(Abdullah and Ahmed 2012):
n
iEi
se BqKgA
nMC
1
1 )(1
Where )( Bqft
NA
E
EiEi
And NEi is the net peak area of a peak atenergy Ei, ε
Eis the energy detection efficiency
Εi, t is the counting life time = 30000s, f
γis
gamma fraction, Ms
is the mass in kg of themeasured rock samples, and n is number ofphoto-peaks, such that of
40K and the decay
series of238
U or 226Ra and232
Th (n=1).The specific activity (Bqkg-1) of 226Ra, 232Th
and 40K along with the mean values for the ninerock samples collected from Duhok governorateare presented in Table 1, The concentrations of226Ra ranged from 3.30 Bqkg-1 in chalkylimestone to 32.66 Bqkg-1 in gray limestone, theconcentration of 232Th ranges from 1.5 Bqkg-1 indolomitic limestone to 13.76 Bqkg-1 in silty claywhile the concentration of 40K ranges from 14Bqkg-1 in chalky limestone to 395 Bqkg-1 in siltyclay. The ratio radioactive concentrations, which
we found in different types of rocks depends onthe nature of the chemical elements such as (K+,Na+, Mg+, Ca+) and ratio of soil such as (sand,clay and silty) in the rocks. Where it is clear thatthe concentrations of 226Ra are higher than thatof 232Th for all samples except sample R6. Thisperhaps attributed to the fact that 226Ra ismoderately soluble in water and is found greaterabundantly than 232Th in atmosphere. Theaverage value of 226Ra, 232Th and 40K is 13.10Bqkg-1, 5.20 Bqkg-1 and 134.32 Bqkg-1
respectively. The obtained results for threeradionuclides are lower than the permissiblelevels of (35, 30 and 370) Bqkg-1 (UNSCEAR2000).
It is interesting to compare the meanconcentration of natural radioactivity in Duhokgovernorate region rock with the results fromdifferent parts of Iraq and other countries of theworld, as given in Table 2. In Sulaimany andMosul determined a higher activityconcentration of 226Ra, 232Th and 40K comparedto this study. While the comparison of the 226Rawith that of the worldwide shows that, ninecountries have higher values and one have lowervalues activity concentration of this radionuclidethan in the rock of the understudy region. It isfound that the average value of 232Th in thepresent study was less than reported for rock ofall countries. The comparison of 40K activityconcentration shows that the values of thisradionuclide in the rock of Nigeria, Turkey,Brazil, Egypt, Iran, Saudi Arabia and Wordaverage are higher than the present study meanvalue and may be as a result of its relativeabundance in the earth crust. All other countriesin comparison with present study have acomparable activity concentration values. Thevariations in the concentrations of theradioactivity in the rock of the various locationsof the world depend upon the geographical andgeological conditions of the area and the extentof fertilizer applied to the agriculture lands(Tzortzis et al. 2003).
2. Absorbed Dose RateRadiation exposure are measured in terms of
the quantity “absorbed dose rate”, which is equalto the energy deposited per unit mass in theirradiated medium. It is the major step forevaluating the health hazard and is expressed ingray (Gy). Nature of biological effect, clinicaleffects and radiological is directly related to theabsorbed dose rate (Ramasamy et al. 2010).
Factors of conversion published byUNSCEAR (2000) are utilized to calculate
Journal of University of Duhok, Vol. 17, No.1 (Pure and Eng. Sciences), Pp 99-107, 2014
102
the total dose rate (DR) (nGyh-1) in theequation below:
KThRa CCCDR 0417.0604.0462.0
The range of a calculated absorbed dose ratesgiven Table 3 is from 3.10 nGyh-1 to 29.31nGyh-1 with an average of 14.88 nGyh-1. Meanabsorbed dose rate for all samples is less than theworld average value 57 nGyh-1 (UNSCEAR2000).
3. Annual Effective Dose EquivalentThe annual effective dose equivalent (AEDE)
received outdoor by a member is calculated fromthe absorbed dose rate by applying doseconversion factor of 0.7 Sv/Gy and occupancyfactor for indoor and outdoor were 0.8(19/24)and 0.2(5/24) respectively (Al-Zahrani2012). AEDE was calculated from absorbeddose rate by using equation below :
31
11
108.07.08760)())((
SvGyh
nGyhDSvyIndoorAEDE
31
11
102.07.08760)())((
SvGyh
nGyhDSvyOutdoorAEDE
The calculated indoor and outdoor AEDEvalues are quoted in table 3. The average,minimum and maximum value for indoor andoutdoor is found to be 73 μSvy-1, 15.20 μSvy-1
and 143.78 μSvy-1 and 18.26 μSvy-1, 3.80 μSvy-1
and 35.95 μSvy-1 respectively. So, one can notethat the obtained value of indoor and outdoor isless than the average values of the world whichare (450 μSvy-1 for indoor and 70 μSvy-1 foroutdoor) (Avwiri et al. 2013).
4. Radiological Hazard IndicesThe gamma ray radiation hazard indices from
radionuclides in rock samples have beencalculated. Even though total specific activity ofradionuclides is calculated, it does not providethe exact indication about the total radiation risk.Also these hazard indices are used to select theright materials. Hazard Indices (Hex and Hin),represent the external and internal radiationhazards as given in Table 3 according to thefollowing criterion (Fares et al. 2012 andRamasamy et al. 2010).
1)4810259370
( KThRaxe
CCCH
1)4810259185
( KThRain
CCCH
The utmost value of Hex equal to unitycorresponds to the upper limit of Raeq (370Bqkg-1). The values of Hex for the studied rocksamples range from 0.018 to 0.161, with anaverage value of 0.084, are less than unity.While the values of Hin for the studied rockssamples range from 0.027 to 0.208 with anaverage value 0.120 are less than unity. Thisrefers that the outcome will not effected torespiratory disease for example: cancer andasthma and external diseases such aserythematic, cataracts and skin cancer (Osimobiet al. 2013).
5. Excess Lifetime Cancer RiskThis distribute with the possibility of
developing over a life-time at a specificexposure level. It is believed as a valuerepresenting the number of additional cancersregarded in a given number of people onexposure to a carcinogen at a given dose. ExcessLife-time Cancer Risk (ELCR) has beencalculated utilizing the equation below and isshown in Table 3.
RFDLAEDEELCR
Where effective dose equivalent is AEDE,the duration of life (70 years) is DL and fatalcancer risk per Sievert (Risk Factor) is RF. Forstochastic effects, a value of 0.05 Sv-1 for thepublic is used (Avwiri et al. 2012). The range ofELCR is 0.013×10⁻³ to 0.126×10⁻³ with anaverage of 0.064×10⁻³. The average ELCR forwhole samples is lower than the average of theworld 0.29 x 10⁻³ (Fares et al. 2012). Thisindicate that the probability of cancer productionby drillers and the audiences in general areunimportant. For that reason, operations ofdrilling and utilize of rocks as materials forbuilding is not creating any health problems onDuhok population.6. Gamma-index and Alpha-index
These are used to evaluate the hazard ofradiation related with the natural radionuclide ininvestigated samples specifically (Thabaynehand Jazzar 2012 and Laith et al. 2013). Therepresentative gamma index (Iγ) is as :
3000200300KThRa CCC
I
Journal of University of Duhok, Vol. 17, No.1 (Pure and Eng. Sciences), Pp 99-107, 2014
103
This gamma index is utilized as well toconnect the annual rate of dose because of thesurplus of external gamma radiation that causedby surface materials. It is an examination tool foridentifying materials, which may be healthy ofhealth concern when utilized for construction.(Osimobi et al. 2013).
The average values of Iγ calculated from themeasured specific activity of 232Th, 226Ra and 40Kthat are presented in Table 3. The calculatedvalues of Iγ for the studied samples are rangedbetween 0.025–0.230. While, for the types ofrock are fewer than the critical value of unity.The average calculated values of Iγ for thestudied samples values was 0.115 for all rocktypes which were lower than the critical value ofunity.
Several alpha indices are proposed to assessthe level of exposure, yet. This is due toinhalation of radon originating fromconstruction materials. The following formulawere used to determine the alpha index (Iα)(European Commission 1999).
200
1
BqkgC
I Ra
Where CRa is the 226Ra activity concentration,which is assumed in equilibrium with 238U. Theexemption recommendation and upper level ofactivity concentrations of 226Ra in constructionmaterials are 100 and 200 Bqkg-1, respectively,as proposed by the ICRP 1994. Theseconsiderations are reflected in the alpha index.The recommendation of upper limitconcentration of 226Ra is 200 Bqkg-1, for whichIα = 1.
The average computed Iα values for thestudied samples are given in Table 3 for thevaries types of rock and areas where they beencollected. The values of Iα ranged from (0.017 to0.163), with the mean value of 0.07. The valuesof Iα ranged between (0.017 and 0.163), with theaverage value of 0.07. For the safe use of amaterial in the building of housing, Iα should befewer than unity. The average computed valueswere equal unity.
7. Radium Equivalent ActivityRadium equivalent (Raeq), which is a commonindex, was utilized to compare materials specificactivities that containing 226Ra, 232Th and 40K bya single amount, which takes into account theradiation dangerous related. Availability ofactivity index a beneficial directive in regulating
the safety standard dwellings. The weighted sumof activities of the mentioned above naturalradionuclides represented radium equivalentactivity and is depend on the appreciation that 1Bqkg-1 of 226Ra, 0.7 Bqkg-1 of 232Th, and 13Bqkg-1of 40K produce the same dose rates ofradiation (Thabayneh and Jazzar 2012). Theradium equivalent activity is given as:
KThRaeq CCCRa 077.043.1
The world average of Raeq in soils is 89Bqkg-1 (UNSCEAR 1998). As reference, theallowed dose limit for public, which isrecommended by ICRP 1991, is 1.5 mSvy-1 orequivalent to 370 Bqkg-1. The average calculatedRaeq values are displayed in Table 3 for thedifferent types of rock and areas from wherethey were collected. The minimum (6.67 Bqkg-1)and the maximum (59.62 Bqkg-1) values of Raeqwere found in R2 and R6 rock kinds,respectively. The average 31 Bqkg-1 were almostlower than the limit value of 370 Bqkg-1
recommended by the Organization for EconomicCooperation and Development (Fares et al.2012).
CONCLUSION
NaI(TI) gamma ray spectrometer was used tomeasure the radioactivity of rock samplescollected from the Duhok governorate. 40k wasobserved to be relatively high compare to othertwo natural radio-nuclides, as it is the mostabundant radioactive element underconsideration. Moreover, the excessive use ofthe Potassium containing fertilizers in the areasadjacent to the sampling sites may contribute tothe higher values of 40K activity. The radio-nuclides were observed to be distributed at anirregular pattern, which could be attributed to themineralogy, carbonate content. The averageactivity concentrations of 232Th, 226Ra and 40Kare lower than the permissible levels of (30, 35and 370) Bqkg-1. Therefore no significant healththreat to human lives is anticipated and thesurrounding is safe radio logically. All obtainedvalues show that the average outdoorabsorbed dose rate, the annual effective doserate indoor-outdoor, radiological hazard indices(Hin -Hex), the excess lifetime cancer risk, gammaindices (Iγ), alpha indices (Iα) and radiumequivalent activities (Raeq) are within theacceptable limits. This implies that Duhok rockscan be used safely for construction of buildings.
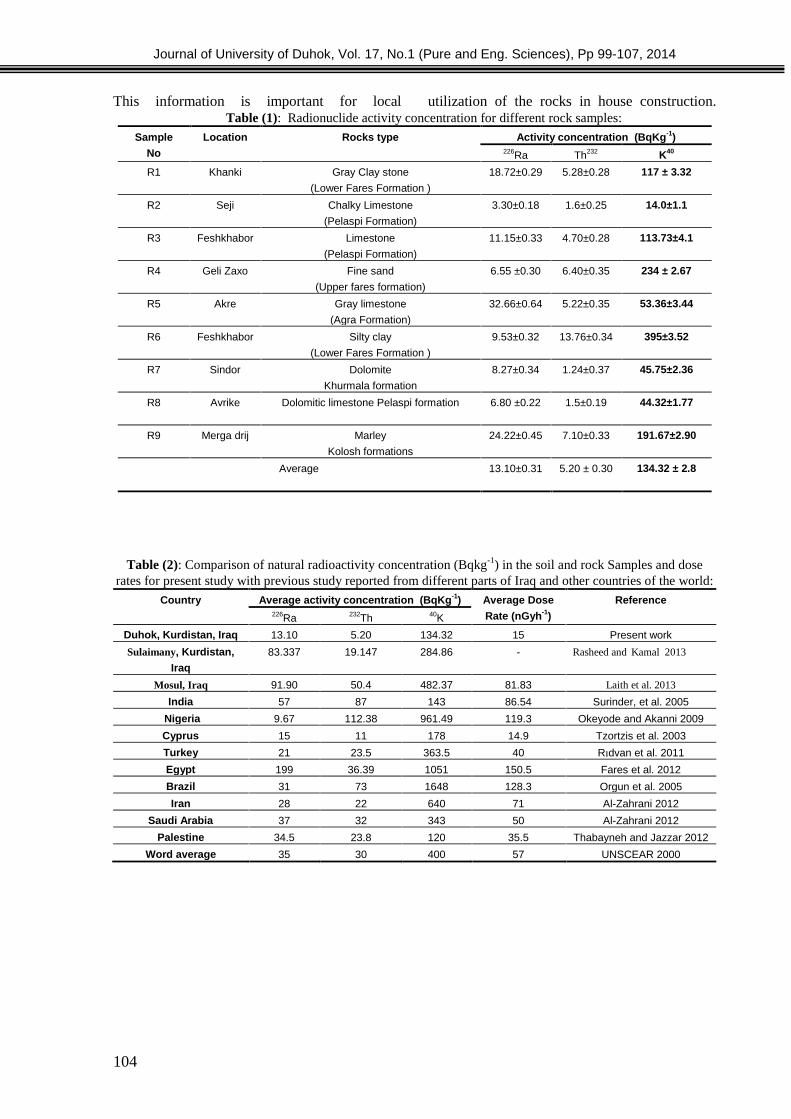
Journal of University of Duhok, Vol. 17, No.1 (Pure and Eng. Sciences), Pp 99-107, 2014
104
This information is important for local utilization of the rocks in house construction.Table (1): Radionuclide activity concentration for different rock samples:
Activity concentration (BqKg-1)Rocks typeLocationSample
No K40Th232226Ra
117 ± 3.325.28±0.2818.72±0.29Gray Clay stone
(Lower Fares Formation )
KhankiR1
14.0±1.11.6±0.253.30±0.18Chalky Limestone
(Pelaspi Formation)
SejiR2
113.73±4.14.70±0.2811.15±0.33Limestone
(Pelaspi Formation)
FeshkhaborR3
234 ± 2.676.40±0.356.55 ±0.30Fine sand
(Upper fares formation)
Geli ZaxoR4
53.36±3.445.22±0.3532.66±0.64Gray limestone
(Agra Formation)
AkreR5
395±3.5213.76±0.349.53±0.32Silty clay
(Lower Fares Formation )
FeshkhaborR6
45.75±2.361.24±0.378.27±0.34Dolomite
Khurmala formation
SindorR7
44.32±1.771.5±0.196.80 ±0.22Dolomitic limestone Pelaspi formationAvrikeR8
191.67±2.907.10±0.3324.22±0.45Marley
Kolosh formations
Merga drijR9
134.32 ± 2.85.20 ± 0.3013.10±0.31Average
Table (2): Comparison of natural radioactivity concentration (Bqkg-1) in the soil and rock Samples and doserates for present study with previous study reported from different parts of Iraq and other countries of the world:
Country Average activity concentration (BqKg-1) Average Dose
Rate (nGyh-1)
Reference226Ra 232Th 40K
Duhok, Kurdistan, Iraq 13.10 5.20 134.32 15 Present work
Sulaimany, Kurdistan,
Iraq
83.337 19.147 284.86 - Rasheed and Kamal 2013
Mosul, Iraq 91.90 50.4 482.37 81.83 Laith et al. 2013India 57 87 143 86.54 Surinder, et al. 2005
Nigeria 9.67 112.38 961.49 119.3 Okeyode and Akanni 2009
Cyprus 15 11 178 14.9 Tzortzis et al. 2003
Turkey 21 23.5 363.5 40 Rıdvan et al. 2011
Egypt 199 36.39 1051 150.5 Fares et al. 2012
Brazil 31 73 1648 128.3 Orgun et al. 2005
Iran 28 22 640 71 Al-Zahrani 2012
Saudi Arabia 37 32 343 50 Al-Zahrani 2012
Palestine 34.5 23.8 120 35.5 Thabayneh and Jazzar 2012
Word average 35 30 400 57 UNSCEAR 2000
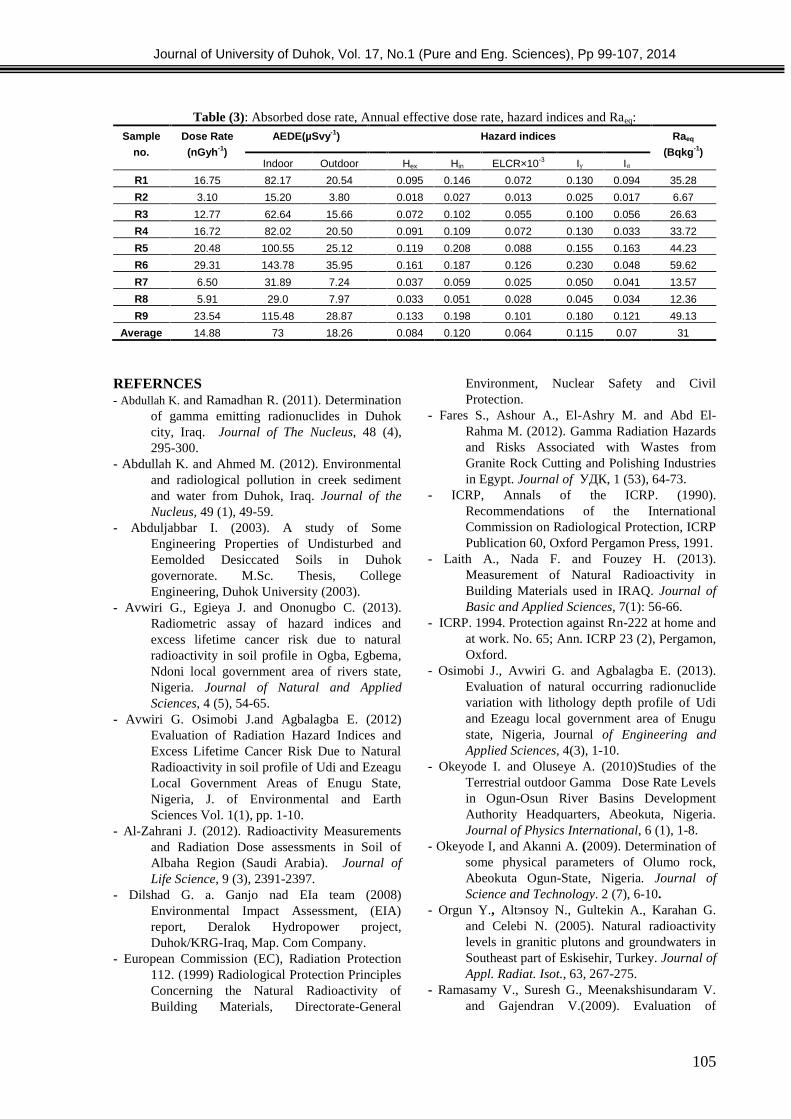
Journal of University of Duhok, Vol. 17, No.1 (Pure and Eng. Sciences), Pp 99-107, 2014
105
Table (3): Absorbed dose rate, Annual effective dose rate, hazard indices and Raeq:Sample
no.
Dose Rate
(nGyh-1)
AEDE(µSvy-1) Hazard indices Raeq
(Bqkg-1)Indoor Outdoor Hex Hin ELCR×10-3 Iγ Iα
R1 16.75 82.17 20.54 0.095 0.146 0.072 0.130 0.094 35.28
R2 3.10 15.20 3.80 0.018 0.027 0.013 0.025 0.017 6.67
R3 12.77 62.64 15.66 0.072 0.102 0.055 0.100 0.056 26.63
R4 16.72 82.02 20.50 0.091 0.109 0.072 0.130 0.033 33.72
R5 20.48 100.55 25.12 0.119 0.208 0.088 0.155 0.163 44.23
R6 29.31 143.78 35.95 0.161 0.187 0.126 0.230 0.048 59.62
R7 6.50 31.89 7.24 0.037 0.059 0.025 0.050 0.041 13.57
R8 5.91 29.0 7.97 0.033 0.051 0.028 0.045 0.034 12.36
R9 23.54 115.48 28.87 0.133 0.198 0.101 0.180 0.121 49.13
Average 14.88 73 18.26 0.084 0.120 0.064 0.115 0.07 31
REFERNCES- Abdullah K. and Ramadhan R. (2011). Determination
of gamma emitting radionuclides in Duhokcity, Iraq. Journal of The Nucleus, 48 (4),295-300.
- Abdullah K. and Ahmed M. (2012). Environmentaland radiological pollution in creek sedimentand water from Duhok, Iraq. Journal of theNucleus, 49 (1), 49-59.
- Abduljabbar I. (2003). A study of SomeEngineering Properties of Undisturbed andEemolded Desiccated Soils in Duhokgovernorate. M.Sc. Thesis, CollegeEngineering, Duhok University (2003).
- Avwiri G., Egieya J. and Ononugbo C. (2013).Radiometric assay of hazard indices andexcess lifetime cancer risk due to naturalradioactivity in soil profile in Ogba, Egbema,Ndoni local government area of rivers state,Nigeria. Journal of Natural and AppliedSciences, 4 (5), 54-65.
- Avwiri G. Osimobi J.and Agbalagba E. (2012)Evaluation of Radiation Hazard Indices andExcess Lifetime Cancer Risk Due to NaturalRadioactivity in soil profile of Udi and EzeaguLocal Government Areas of Enugu State,Nigeria, J. of Environmental and EarthSciences Vol. 1(1), pp. 1-10.
- Al-Zahrani J. (2012). Radioactivity Measurementsand Radiation Dose assessments in Soil ofAlbaha Region (Saudi Arabia). Journal ofLife Science, 9 (3), 2391-2397.
- Dilshad G. a. Ganjo nad EIa team (2008)Environmental Impact Assessment, (EIA)report, Deralok Hydropower project,Duhok/KRG-Iraq, Map. Com Company.
- European Commission (EC), Radiation Protection112. (1999) Radiological Protection PrinciplesConcerning the Natural Radioactivity ofBuilding Materials, Directorate-General
Environment, Nuclear Safety and CivilProtection.
- Fares S., Ashour A., El-Ashry M. and Abd El-Rahma M. (2012). Gamma Radiation Hazardsand Risks Associated with Wastes fromGranite Rock Cutting and Polishing Industriesin Egypt. Journal of УДК, 1 (53), 64-73.
- ICRP, Annals of the ICRP. (1990).Recommendations of the InternationalCommission on Radiological Protection, ICRPPublication 60, Oxford Pergamon Press, 1991.
- Laith A., Nada F. and Fouzey H. (2013).Measurement of Natural Radioactivity inBuilding Materials used in IRAQ. Journal ofBasic and Applied Sciences, 7(1): 56-66.
- ICRP. 1994. Protection against Rn-222 at home andat work. No. 65; Ann. ICRP 23 (2), Pergamon,Oxford.
- Osimobi J., Avwiri G. and Agbalagba E. (2013).Evaluation of natural occurring radionuclidevariation with lithology depth profile of Udiand Ezeagu local government area of Enugustate, Nigeria, Journal of Engineering andApplied Sciences, 4(3), 1-10.
- Okeyode I. and Oluseye A. (2010)Studies of theTerrestrial outdoor Gamma Dose Rate Levelsin Ogun-Osun River Basins DevelopmentAuthority Headquarters, Abeokuta, Nigeria.Journal of Physics International, 6 (1), 1-8.
- Okeyode I, and Akanni A. (2009). Determination ofsome physical parameters of Olumo rock,Abeokuta Ogun-State, Nigeria. Journal ofScience and Technology. 2 (7), 6-10.
- Orgun Y., Altэnsoy N., Gultekin A., Karahan G.and Celebi N. (2005). Natural radioactivitylevels in granitic plutons and groundwaters inSoutheast part of Eskisehir, Turkey. Journal ofAppl. Radiat. Isot., 63, 267-275.
- Ramasamy V., Suresh G., Meenakshisundaram V.and Gajendran V.(2009). Evaluation of

Journal of University of Duhok, Vol. 17, No.1 (Pure and Eng. Sciences), Pp 99-107, 2014
106
Natural Radionuclide Content in RiverSediments and Excess Lifetime Cancer RiskDue to Gamma Radioactivity. Journal ofEnvironmenal and Earth Sciences, 1 (1), 6-10.
- Ramasamy V., Suresh G., Venkatachalapathy R.,Ponnusamy V. and MeenakshisundaramV.(2010). Magnetic Susceptibility andRadiological Hazardous Nature of the RiverSediments-Spectroscopical Approach. Journalof Acta Physica Polonica, 118 (4), 701-711.
- Rasheed M. and Kamal O. (2013). Measurement ofNatural Radioactivity in Soil Collected fromthe Eastern of Sulaimany Governorate inKurdistan–Region, Iraq. Journal of Scienceand Technology, 3 (7), 749-757.
- Rıdvan B., Hu¨seyin A. and Mustafa E. (2011).Radioactivity measurements and radiationdose assessments due to natural radiation inKarabu¨k (Turkey), Journal of RadioanalNucl. Chem, 289, 297-302.
- Surinder S., Asha R. and Rakesh K (2005). 226Ra,232Th and 40K analysis in soil samples from
some areas of Punjab and Himachal Pradesh,India using gamma ray spectrometry. Journalof Radiat. Measurements, 39, 431–439.
- Tzortzis M., Tsertos H., Christofider S.,Christodoulides G. (2003). Gamma-raymeasurements of naturally occurringradioactive samples from Cyprus characteristicgeological rocks. Journal of Radiat.Measurements, 37, 221-229.
- Thabayneh K. and Jazzar M. (2012). Naturalradioactivity levels and estimation of radiationexposure in environmental soil samples fromTulkarem province-Palestine. Journal of soilscience, 2, 7-16.
- UNSCEAR. 2000. Sources and Effects of IonizingRadiation. Report to General assembly, withScientific Annexes, United Nations, NewYork.
- UNSCEAR. (1988). Sources Effects and Risk ofIonizing Radiation. United Nations ScientificCommittee on the Effects of AtomicRadiation., New York.
الخطورة اإلشعاعية الطبيعية للصخور في محافظة دهوك، اقليم كردستان، العراقالخالصة
من الصخور الطبيعية التي تم جمعها من مناطق مختلفة في أجرينا دراسة حول مدى تأثير اإلشعاع في تسع عينات تم قياس تركيزات النويدات . في الشمال الغربي من العراقتقع محافظة دهوك في إقليم كردستان . محافظة دهوك
ة ان معدل الفعالي.ثانية لكل عينة30000لمدة مطيافية اشعة كاما NaI(TI)المشعة في العينات الصخرية باستخدام ,(لكل من النويدات االرضية, 134.32 , 5.20)Bqkg-1(13.10النوعية للنويدات المشعة ذات قيم 226Ra232Th ,40K (
الطين الغريني و مارلي تظهرالنسبية تركيز نشاط ,الرمل الرفيع,الحجر الجيري ,الحجرالرمادي الطيني . على التواليشيري تظهر انخفاضا بتركيز النشاط بينما كانت التكوينات الصخرية األخرى عالية بينما في حالة الحجر الجيري الطبا
قدرت مؤشرات الخطر و يزيد من مخاطر االصابة بالسرطان مدى الحياة . معتدلة في مستوى النشاط اإلشعاعيالمعدل السنوي الجرعة الممتصة و القيم التي تم الحصول عليها عن متوسط . باستخدام الطريقة التحليلية القياسية
، يزيد خطر االصابة بسرطان عمر ) الخارجية والداخلية ( ، ومؤشرات الخطر) في الهواء الطلق وداخل(للجرعة المكافئة 14.88nGyhr-1,μSvy-1و الراديوم يعادل على التوالي ) كاماألفا و(، مؤشرات 73, μSvy-1 18.26 ,, 0.12 ,
0.084× 0.06410-30,115 القيم، عندما قارنت بقيمهم الجائزة العالميا، تبين بأنها كانت . 31Bqkg-1و 0.07, ,الصخور من منطقة الدراسة لم تتعرض بشكل بما يؤثرعلى السكان ويمكن َأن . تحت الحدود القياسية لتلك البيئات.ل أي تهديد َأو أذى إشعاعي إلى المستعملين لهذه المادة من العامةيتستعمل كمادة إنشائية بدون ان تشك

Journal of University of Duhok, Vol. 17, No.1 (Pure and Eng. Sciences), Pp 99-107, 2014
107
NaI(TI)30000 13.10(134.32, 5.20,Bqkg-1
, 226Ra)232Th40K
14.88nGyhr-1 18.26μSvy-1 73μSvy-1, 0.12 , 0.0840.064103- ×0,115 , 0.0731. Bqkg-1

Journal of University of Duhok, Vol. 17, No.1 (Pure and Eng. Sciences), Pp 108-118, 2014
108
ANATOMICAL AND PALYNOLOGICAL STUDIES OF Cissus QuadrangularisAND Cayratia Geniculata (VITACEAE AND Leea Angulata (LEEACEAE)
CHNAR NAJMADDIN
Dept of Biology, Collage of Sciences, University of Salahaddin, Kurdistan Region-Iraq
(Received: May 4, 2014; Accepted for publication: August 19, 2014)
ABSTRACTThis study was conducted to evaluate anatomical comparison between three species belonging to two
families (Vitaceae and Leeaceae). Two genera of the family Vitaceae (Cissus quadrangularis and Cayratiageniculata) and one species of Leeaceae family (Leea angulata) were investigated. Anatomically it has beenshown that the shape of stem, petiole, midrib, margin and lamina were different. There were druses andraphid crystals in stem, petiole, midrib, margin of Cissus quadrangularis and Cayratia geniculata,however, in Leea angulata there was only druses crystals, except in lamina of Cissus quadrangularis,Cayratia geniculata and Leea angulata in which there were druses and raphid crystals. Leaf epidermis ofCissus quadrangularis, Cayratia geniculata and Leea angulata were investigated by using light microscopeand scanning electron microscope. The shapes of leaf epidermal cells were usually polygonal; the types ofanticlinal walls are straight and arched. The stomatal apparatus presented on the both side of the leaf(abaxial and adaxial). Cissus quadrangularis and Cayratia geniculata had different types of stomatalapparatus such as cyclocytic and hemiparacytic, and Leea angulata had anisocytic type.
KEY WORDS: Vitaceae, Leeaceae, Cissus quadrangularis, Cayratia geniculata, Leea angulata, stomata types.
INTRODUCTION
itaceae family includes woody climbers,sometimes vines, trees, and also involve
shrubs and succulents (Timmons et al., 2007;Najmaddin, 2011 a,c). Cissus quadrangularis isclimbing herb, excluding wings, fleshy,quadrangular with wings at the angles, broad,glabrous or pubescent; tendrils present andfrequently leafless. The leaves are simple, fleshyand glabrous or sparingly pubescent and leaf-opposed cyme. The few flowered, cymesaxillary, fruits are red when ripe and seeds aresmooth with single dorsal crest (Wild andDrummond, 1966; Valkenburg andBunyapraphtsara, 2002). Cayratia geniculata iswoody, branches terete, slightly flattened,pubescent; tendrils bifurcate. The leaves aretrifoliolate, fruits are berry nearly globose andsemiglobose seeds (Valkenburg andBunyapraphtsara, 2002; Lian-Mei, 2007).
Leeaceae includes shrubs, stem is unarmed,tendrils absent (Wen, 2007). Leea angulata is aweak strangler and bushy shrub. The leaves arepinnate with numerous leaflets and bearinggreenish-white flowers that developed into lead-grey berries (Lok et al., 2011).
The stomata apertures in the epidermis,bounded by two guard cells, their main functionis to allow gases as carbone dioxide, watervapours and oxygen to move rapidly into and outof the leaf (Perveen et al. 2007; Tay andFurukawa 2008; Najmaddin 2011 b, c). On thebasis of arrangement of the epidermal cellneighbouring the guard cell (subsidary cells),more than 25 main types of stomata in dicotshave been recognized (Perveen et al, 2007).
MATERIALS AND METHODS
Plant materials were collected from the fieldin Malaysia (UKM) and fixed in a mixture offormalin, alcohol and glacial acetic acid(Fathulla and Duhoky, 2008). Transversesections through the middle region of petiolesand midribs were made on the sliding microtome(Richard Jung or Leica Histolide 200) andstained in Safranin and Alcian Green. Followingdehydration in an alcohol series the sectionswere mounted in Euparal (Johansen, 1940).Images were captured using a Video Camera(JVC) attached to a leica diaplan microscopeusing analysis docu software. Epidermal peelswere prepared by mechanical scraping stained,dehydrated and mounted on the same way. Forpollen morphological studies, the pollens
V

Journal of University of Duhok, Vol. 17, No.1 (Pure and Eng. Sciences), Pp 108-118, 2014
109
gathered from open flowers or mature flowerbuds and prepared for light microscope (LM) bymethods described by Erdtman (1952) and werewashed three times with phosphate buffersolution (PBS) 85%, the samples laterdehydrated using series of aceton concentrationpercentages ranging from 50, 70, 80, 85, 90,95% and three times in 100% aceton for 30mineach, dried at critical point, coated with gold in asputter coater and were observed under a PhilipsXL30 Scanning Electron Microscope (SEM), at10 to 20 KV according to magnificationrequirements.
RESULTSAnatomical descriptionT.S stems
In Vitaceae the outline in TS is differentbetween species. It varies from adaxial andabaxial surfaces with long lateral projectionsadaxially and abaxially as in Cissusquadrangularis (A) to subcircular as in Cayratiageniculata (B) while in Leea angulata (D) isrounded. Collenchyma cells are present in thecortex beneath the epidermis in Cayratiageniculata and Leea angulata, while in Cayratiageniculata collenchyma cells exist below fivelayers of parenchyma cells. Secretory canals anddruses are present in all genera. Trichomes arepresent in Cayratia geniculata and aremulticellular non-glandular (Figure 1).
Fig. (1): TS of stems: A. Cissus quadrangularis, B. Cayratia geniculata, C. TS of Cayratia geniculata stemshowing trichomes, D. Leea angulata, E. vascular bundle, s: secretory canal, d: druses, c: collenchyma cells, f:
fibres, v: vascular bundles, trichomes (large black arrow), ad: adaxial surface, ab: abaxial surface, phloem(irregular small black arrow), x: xylem.
A
DC
B
s
s
s
f
f
f
c
cc
d
d
dd
v
vv
ad
ab
fX
E
d

Journal of University of Duhok, Vol. 17, No.1 (Pure and Eng. Sciences), Pp 108-118, 2014
110
T.S petiolesCollenchyma cells present in the cortex
beneath the epidermis in Cayratia geniculata (B)and Leea angulata (D), while in Cissusquadrangularis (A) collenchyma cells existbelow five layers of parenchyma cells. Drusesare present in the cortex, near vascular bundleand pith. The arrangement of vascular tissue
system is closed and a fibrous layer occurs nextto the phloem tissue which is present in bothgenera. Secretory cells are present, accessoryvascular bundles are present in Leea angulata(B) but absent in Cissus quadrangularis (A) andCayratia geniculata (B). Trichomes are presentin Cayratia geniculata and are multicellular non-glandular (Figure 2).
Fig. (2): TS of petioles: A. Cissus quadrangularis, B. Cayratia geniculata, C. TS of Cayratia geniculata petioleshowing trichomes, D. Leea angulata, E. vascular bundle, s: secretory canal, d: druses, r: raphides, c:
collenchyma cells, f: fibres, v: vascular bundles, trichomes (large black arrow), accessory vascular bundle (smallblack arrow), phloem (irregular small black arrow), X: xylem.
A
f
C
cc
c
D
B
v
s
s
s
f
f
v
v
d
d
d
rv
f
X
d
E
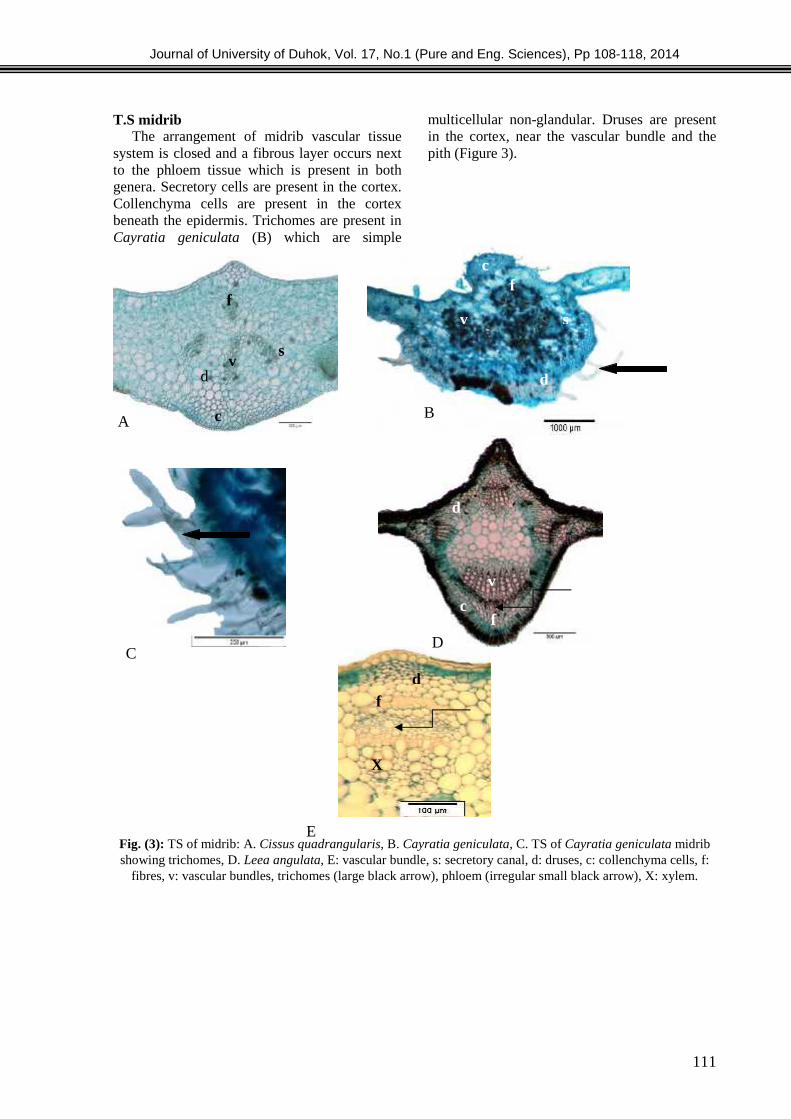
Journal of University of Duhok, Vol. 17, No.1 (Pure and Eng. Sciences), Pp 108-118, 2014
111
T.S midribThe arrangement of midrib vascular tissue
system is closed and a fibrous layer occurs nextto the phloem tissue which is present in bothgenera. Secretory cells are present in the cortex.Collenchyma cells are present in the cortexbeneath the epidermis. Trichomes are present inCayratia geniculata (B) which are simple
multicellular non-glandular. Druses are presentin the cortex, near the vascular bundle and thepith (Figure 3).
Fig. (3): TS of midrib: A. Cissus quadrangularis, B. Cayratia geniculata, C. TS of Cayratia geniculata midribshowing trichomes, D. Leea angulata, E: vascular bundle, s: secretory canal, d: druses, c: collenchyma cells, f:
fibres, v: vascular bundles, trichomes (large black arrow), phloem (irregular small black arrow), X: xylem.
D
AB
C
f
ff
c
c
c
d
s
s
s
v
v
v
d
d
E
f
X
d

Journal of University of Duhok, Vol. 17, No.1 (Pure and Eng. Sciences), Pp 108-118, 2014
112
T.S laminaIn all species the palisade consists of two
layers of cells; both raphides and druses arepresent while only raphides are present in the
spongy mesophyll layer. Trichomes are presentin Cayratia geniculata (B) which are simple andglandular multicellular (Figure 4).
Fig. (4): TS of lamina: A. Cissus quadrangularis, B. Cayratia geniculata, C. Leea angulata, d: druses, r:raphides, e: epidermis, p: palisade layer, sp: spongy layer, trichomes (large black arrow).
T.S marginThe shape of the margin is straight in Cissus
quadrangularis (A), pointing slightlydownwards in Cayratia geniculata (B) and
rounded pointing downwards in Leea angulata(D). Trichomes are present in Cayratiageniculata (B) which are simple multicellularnon-glandular (Figure 5).
A
C
r
d r d
d r
B
sp
sp
p
p p
e
ee
sp
A
C
B
d
d
d
r

Journal of University of Duhok, Vol. 17, No.1 (Pure and Eng. Sciences), Pp 108-118, 2014
113
Fig. (5): TS of margin: A. Cissus quadrangularis, B. Cayratia geniculata, C Leea angulata, d: druses, r:raphides, e: epidermis, trichomes (large black arrow).
StomataThe cuticle is striate (striped or granular)
depending on the species. Adaxial anticlinalwalls are straight or straight to wavy. Theabaxial anticlinal wall is straight or straight to
wavy; stomata are present in some speciesadaxially as in Cissus quadrangularis and Leeaangulata. Stomata are cyclocytic (A,B,C),hemiparacytic (D,E,F) in Vitaceae andanisocytic in Leea (G,H) (Figure 6).
Fig. (6): leaf abaxial and adaxial surface showing the stomata and the cuticle layer. A. Cissus quadrangularisLM of adaxial epidermis, B. Cissus quadrangularis LM of abaxial epidermis, C. Cissus quadrangularis SEM of
abaxial epidermis, D. Cayratia geniculata LM of adaxial, E. Cayratia geniculata LM of abaxial epidermis, F.Cayratia geniculata SEM of abaxial epidermis, G. Leea angulata LM of adaxial epidermis, H. Leea angulata
LM of abaxial epidermis, stomata (large white arrow), cu: cuticle layer.
cu
cu
A B
C
G
FE
D
H

Journal of University of Duhok, Vol. 17, No.1 (Pure and Eng. Sciences), Pp 108-118, 2014
114
Flower: Flowers are hermaphroditic, calyx-5, petal-5. In Leeaceae petals or corolla at the base fusedwith stamen (C,D), while in Vitaceae the petals are free (A,B) (Figure 7).
Fig. (7): flowers. A and B. Vitaceae flower, C and D. Leeaceae flower, CO: corolla, st: stamen
Pollen grainsVitaceae pollen grains are tricolpate. The
shape in equatorial view prolate as in Cissusquadrangularis and Cayratia geniculata(A,B,C), while in Leea angulata pollen graintricolporate and equatorial view is triangular(D,E) (Figure 8). The shape, aperture, size andsculpture ornamentation of the pollen grains aregood characters for differentiating between thegenera as shown in the (Table 1).
in Vitaceae the pollen grains are circular inpolar view and prolate in equatorial view as inCissus quadrangularis (A) and circular in polarview and subprolate in equatorial view as inCayratia geniculata (B,C), while in Leeaangulata (D,E) the shape of the grain is trigonalin equatorial view and subprolate in polar viewhowever, the size varies between genera e.gCayratia geniculata pollen is bigger (0.781μm)
than Cissus quadrangularis (0.659μm) and theporus is absent, while in Leea angulata the sizeis (1.087μm) and the porus or pore is present.There are certain characters present in certainspecies only such as the clava which is a longexine element more than 1 μm in diameter inCissus quadrangularis (A).
A
DC
B
CO
CO
CO
CO
stst
stst

Journal of University of Duhok, Vol. 17, No.1 (Pure and Eng. Sciences), Pp 108-118, 2014
115
Fig. (8): Pollen grains. A. equatorial view of Cissus quadrangularis (LM), B. equatorial view of Cayratiageniculata (LM), C. polar and equatorial view of Cayratia geniculata (SEM), D. equatorial view of Leea
angulata (LM), E. polar and equatorial view of Leea angulata (SEM), colpus (irrigular black arrow), porus(irrigular white arrow) .
Table (1): Pollen grains feature
Species Polar
view
Equatorial
view
P/E Porus Clava
Cissus quadrangularis circular prolate 0.659 absent present
Cayratia geniculata circular subprolate 0.781 absent absent
Leea angulata subprolate trigonal 1.087 present absent
DISCUSSION
The results of the present investigationshowed that both Vitaceae and Leeaceae possessa few common characters such as the presence ofdruses and secretory cells as has been reportedby Metcalfe and Chalk (1950). According to
them the secretory cells with amorphouscontents which are probably mucilaginous andtanniniferous are widely distributed in theparenchymatous tissues, and has also been foundin Leea angulata, Vitis vinifera and probably inother genera and species. Both families have theclosed vascular tissue system. When comparing
A
E
DC
B

Journal of University of Duhok, Vol. 17, No.1 (Pure and Eng. Sciences), Pp 108-118, 2014
116
species based on a particular organ though,certain characters may be useful in confirmingthe species. The presence or absence of raphidesin the stems, petioles midribs and lamina,raphides and druses in parenchymatous cellsobserved near the vascular bundle, beneath theepidermis as well as in the pith of stems arecharacteristic of the Vitaceae. In Leeaceae theyare only present in the lamina. Raphides,however, have also been observed in themesophyll tissue in the Leeaceae, as reported byMetcalfe and Chalk (1950) and Wen (2007).
The outlines of the stems and petioles as wellas the pattern of vascular bundle arrangementdiffer between species and between bothfamilies. The present investigation revealed thatthe stem and petiole of Vitaceae and Leeaceaevary in shapes. The structure of the stem andpetiole thus provides some useful characters foruse in the identification of species. The presenceof accessory vascular bundles in Leea angulataand absence in Cissus quadrangularis andCayratia geniculata. According to Metcalfe andChalk (1950) the petiole in transverse sections,exhibit a ring of isolated bundles, accompaniedby two or less, cortical bundles on either side ofthe groove in the adaxial surface of the petiole insome species of Vitis, Leea and Tetrastigma.
Trichomes occur on the nodes and/orinternodes of Vitis berlandieri and Vitis rupestrisespecially Vitis riparia and Vitis rupestris(Swanepoel 1984). Based on this Swanepoel(1984) constructed a key partly based on thepresence of different trichome types on the shootof 33 species of Vitis species. According toLombardi (2007), glandular or nonglandulartrichomes in Vitaceae are commonly present.They are very important for speciesidentification, while Metcalfe and Chalk (1950)reported the trichomes to be unicellular 2-armedwith or without stalks, notably in certain speciesof Cissus. These studies showed that simplemulticellular non-glandular and glandulartrichomes are present in Cayratia geniculataprovide additional characters for identification.Trichome morphology when combined withother characters this character is can be helpfulfor identifying the species.
Mechanical collenchyma tissues in the stem,petiole and midrib were observed. The presentinvestigation revealed that the stem and petiolesof Cissus quadrangularis, Cayratia geniculataand Leea angulata. The vascular bundle isclosed, a fibrous layer occurs next to the phloem
tissue and secretory cells there are present inboth families.
The present study further revealed that themidribs are characteristics by the outline of theadaxial surface which is slightly humped and arcto subcircular shape surface of the abaxial andthe presence of collenchyma in both epidermislayers, while in Leea angulata the midrib ischaracteristic by the outline of the adaxialsurface which is long humped by "V" shapesurface of the abaxial and the presence ofcollenchyma in both epidermis layers. Thevascular bundle is closed and the druses andraphides are present in Vitaceae and absent inLeea, while in Leea the raphides only present inlamina. However, the present study showed thatthe margin of the species were straight andslightly downwards with rounded or tapering tip.The druses and secretory cells are present. Inaddition, mesophyll layer contains calciumoxalate (druses) crystals and mucilage cells orsecretory cells with raphides in bundle. Similary,this has also be reported in a study by Metcalfeand Chalk (1950), mucilaginous idioblasts in themesophyll of leaf and cortex of the stem whichwas absent in the epidermis (Kannabiran andPragasam, 1994).
The petiole, midrib, margin and laminaoutline of these sections is smooth, while inCayratia geniculata the trichomes are presentand multicellular glandular and non glandularwhich is an important feature in determining thecultivars. The trichome complement of aparticular organ can consist entirely ofunbranched or branched hairs (Lombardi, 2007).
Vitaceae leaf epidermal characters have beenstudied by Ren et al. (2003) using light and scanelectron microscope. The shape of leafepidermal cells was irregular or polygonal; theanticlinal walls are straight, arched or sinuolatewhich are in conformity with the leaf epidermalcell of the present study. However, the presentstudy reveals that leaf epidermis has anomocyticand are in conformity with Ren et al. (2003);Kannabiran and Pragasam (1994).
The flower of Vitis sp. has complex organ,arranged between 4 to 5 mm, bisexual, 5-numerous, pedicels mostly umbellate clustered(Townsend and Guest, 1980 and Al-Saady,1982). However, the symmetry of the flower ispentamerous while Ampelopsis, Cayratia andCissus have tetramerous flowers; herefore, theymay have closely related features (Patil, 1998).Vitaceae stenopalynous in nature and ischaracterized by three colporate grains.

Journal of University of Duhok, Vol. 17, No.1 (Pure and Eng. Sciences), Pp 108-118, 2014
117
However, sufficient variation is found betweenpollen shape class and exine pattern. Base onthis features the family divided into three pollentypes, V. parvifolia type, V. jacqumontii andAmpelopsis vitifolia subsp., hazaraganjiensistype (Perveen and Qaiser, 2008). The shape andaperture of the pollen grains are good charactersfor differentiating between the genera in theVitaceae as shown in the Table 1, in Vitaceaethe pollen grains are prolate, while in Leeaceaeare triangular. Intergeneric variations in thepollen structure have been observed in manyother families. The pollen grains of the specieswere studied using scan electron microscopewhich show Vitaceae pollen grains consist ofisopolar and tricolporate, and mostly sub-prolateor prolate to prolatespheroidal (Perveen andQaiser, 2008; Marasali et al., 2005; Inceoglu etal., 2000), exine foveolate-rugulate at themesocolpia and distincly reticulate towards thepoles and at the poles (Inceoglu et al., 2000).Pollen grains of the grapevine have beenreported to be normally three zoncolporate,spheroidal to prolate with very long, narrow,slightly slit but distinctly sunken ectoaperture orcolpus (Gallardo et al,. 2009 and Maria et al,.1994 and Inceogul et al,. 2000). The colpi in theequatorial zone they are usually wide and deep,while in the polar zone they are narrower(Roytchev et al. 1994) and the exine is reticulate(Erdtman, 1952). The pollen grains in Leeaspecies are triangular in shape and tricolporate.Patil (1998) used the pollen grain characters toisolate the position of Leea to a separate familyLeeaceae.
CONCLUSIONS
The anatomical evaluation of the species ofVitacece was reported. The result shows thatdruses and raphid crystals were present inVitaceae, while raphides were present in Leeaonly in lamina. Leaf epidermal cells in Vitaceaewere straight or straight to wavy; stomata arepresent in some species adaxially as in Cissusquadrangularis and Leea angulata. Stomata arecyclocytic, hemiparacytic in Vitaceae andanisocytic in Leea. The trichomes were presentin epidermis in Cayratia geniculata. Vitaceaepollen grains are tricolpate. The shape inequatorial view prolate as in Cissusquadrangularis and Cayratia geniculata, whilein Leea angulata pollen grain tricolporate andequatorial view is triangular.
ACKNOWLEDGEMENTSI would like to express my gratitude and
sincere thanks to all who help me to completethis research.
REFERENCES- Al-Saadi, I.H.M. (1982). Cultivation and Production
of the grapevine. Mausel, Iraq: published inMinistry of Higher education and ScientificResearch, Mausel University.
- Erdtman, G. (1952). Pollen morphology and planttaxonomy. Angiosperm (An introduction topalynology. I), stockholm: Almqvist and Wiksells.- Fathulla, C.N. and Duhoky, M.M.S. (2008).Biological and anatomical study of different Cuscutaspecies. 1st Kurdistan Conference on BiologicalSciences, Jur. Doh. Univ., 11(1): 22-39.- Gallardo, A., Ocete, R., Lopez, M.A., Lara, M. andRivera, D. (2009). Assessment of pollen dimorphismin populations of Vitis vinifera L. subsp. sylvestris(Gmelin) Hegi in Spain. Vitis, 48 (2):59-62.- Inceogul, O., Pinar, N.M. and Oybank-Donmez, E.(2000). Pollen Morphology of wild Vitis sylvestrisGmelin (Vitaceae). Tur. Jou. of Bot., 24:147-150.- Johansen, D.A. (1940). Plant microtechnique. NewYourk: MC Graw,Hill.- Kannabiran, B. and Pragasam, A. (1994). Foliarepidermal features of Vitaceae and taxonomicposition of Leea. Jou. of In. Bot. Soc., 73: 81-87.- Lian-Meri, X.Q.W. 2007. Cayratia geniculata.Flora of China Vol. 12:184, 345.- Lok, A.F.S.L., Ang, W.F., Ng, B.Y.Q., Suen, S.M.,Yeo, C.K., and Tan, H.T.W. (2011). Leea L.(Vitaceae) of Singapore. Nat. In Sing., 4:55-71.- Lombardi, J. A. (2007). Systematic of Vitaceae inSouth America. Can. Jou. Bot., 85, p: 712- 721.- Marasali, B., Pinar, M. and Buyukkartal, N. (2005).Palynological study on the pollen grains of selectedTurkish grape (Vitis vinifera L.) cultivars. Tur. Jou. ofAgri. and For., 29:75-81.- Maria, F.C.S.S., Villota, P.D.L. and Tortola, M.E.T.(1994). Palynological study of the pollen grain ofVitis vinifera L. cultivars. Some aspects ofsculpturing and pollination. Vitis, 33:57-61.- Metcalfe, C.R., and Chalk, L. (1950). Anatomy ofthe dicotyledons. Clarendon Press, Oxford. Vol. 2:413-419.- Najmaddin, C., Hussin, K. and Maideen, H.(2011a). Comparative Anatomical Study betweenCayratia mollissima, Pterisanthe,s caudigera(Vitaceae) and Leea indica (Leeaceae). Ame. Jou.App. Sc., 8 (9): 839-842.- Najmaddin, C., Hussin, K. and Maideen, H.(2011b). Comparative study on the anatomy andpalynology of the three variety of Vitis vinifera

Journal of University of Duhok, Vol. 17, No.1 (Pure and Eng. Sciences), Pp 108-118, 2014
118
(family Vitaceae). Afr. Jou. Biot.,10 (74):16866-16874.- Najmaddin, C., Hussin, K. and Maideen, H.(2011c). Anatomical comparison between Cissusrepens, Cayratia japonica (Vitaceae) and Leeaaequata (Leeaceae). Jou. Duh. Uni., 14 (1):290-298.- Patil, S.G. (1998). Inter-generic variations in pollengrains of the family Vitaceae and their taxonomicsignificance. Jou. of the Ind. Bot. Soc., 77:99-102.- Perveen, A., Abid, R. and Fatima, R. (2007).Stomatal types of some dicots within flora ofKarachi, Pakistan. Pak. J. Bot., 39(4): 1017-1023.- Perveen, A. and Qaiser, M. (2008). Pollen flora ofPakistan-LVII. Vitaceae. Pak. Jou.of Bot., 40 (2):501- 506.- Ren, H., Pan, K-Y., Chen, Z-D. and Ren-QingWang, R-Q. (2003). Structural characters of leafepidermis and their systematic significance inVitaceae. Acta Phyto.taxo. Sin., 41 (6): 531-544.- Roytchev, V., Terziisky, D., Dimova, D. andKarageorgiev, S. (1994). Scanning electronmicroscopy study of pollen morphology in seedlessgrape (Vitis vinifera L.) cultivars. Vitis, 33:105-108.- Swanepoel, J.J., Delaharpe, A.C., and Orffer, C.J.(1984). A Comparative anatomical study of thegrapevine shoot: I epidermis. Sou. Afri. Jou. Eno. andViti., 5 (2):51-57.
- Tay, A., and Furukawa,A. (2008). Variations in leafstomata density and distribution of 53 Vine species inJapan. Plant species Biology 23, 2-8.- Timmons, S.A., Posluszny, U. and Gerrath, J.M.(2007). Morphological and anatomical developmentin the Vitaceae. X. Comparative ontogeny andphylogenetic implications of Cissus quadrangularisL. Can. J. Bot., Vol. 85: 860-872.- Townsend, C.C. and Guest, E. (1980). Flora of Iraqpart 1 ed. Baghdad, Iraq: Ministry of Agriculture andAgrarian Reform of Iraq. Vol. 4. pp. 443-450.
Valkenburg, J.L.C.H.V. and Bunyapraphatsara, N.(2002). Plant Resources of South-East Asia.Medicinal and poisonous plants 2. Bogor, Indonesia:Prosea Foundation, Bogor, Indonesia 2 ed. Vol. 12.pp. 439-230.- Wen, J. (2007). The Families and Genera ofVascular Plants; Leeaceae. Leeaceae Dumortier,Anal. Fam. Pl.: 27 (1829), nom. Cons. Springer-verlag Berlin Heidelberg Vol.9. p. 221- 225.- Wild, H., and Drummond, R.B. (1966). Vitaceae.Flora zambesiaca Vol 2,2.

Journal of University of Duhok, Vol. 17, No.1 (Pure and Eng. Sciences), Pp 119-125, 2014
119
CONCRETE SURFACE SEALANTS: A COMPARATIVE STUDY
KHALID M.SHAHEEN and LEENA J.SEDEEQ
Dept. of Building & Construction Technology Engineering Technical College, Mosul-Iraq
(Received: June 4, 2014; Accepted for publication: October 12, 2014)
ABSTRACTThis study investigates the ability of reducing water absorption of concrete surfaces by using powdered
one component acrylic and tar epoxy. The effect of these waterproofing materials on concrete propertiessuch as splitting, flexural strength was also studied. The mixing ratio of powdered one component acrylicto water of 1.5:1, and The mixing ratio of tar: epoxy of1:1, both achieved 100% waterproofing for theconcrete surfaces. Maximum splitting and flexural strength were also obtained at these mixing ratios forthe indicated materials. The influence of acidic solutions on the waterproofing materials was also studied.
KEYWORDS: Acrylic Coatings, Tar Epoxy, Initial Surface Absorption.
INTRODUCATION
ike any other material, concrete issubject to deterioration due to different
factors. Among the factors leading to thedeterioration of concrete structures are: fireevents, humidity, water absorption, concreteporosity, corrosion of reinforcement, andclimatic conditions, especially acid rain. It isessential that concrete be capable ofwithstanding the conditions for which it has beendesigned through the life of the structure withoutsignificant deterioration[1]. Water ingress is animportant factor that enhances deterioration ofconcrete [2]. The surface of the concrete is thefirst line of defence against the ingress of waterand aggressive agents into the concrete. There isan increasing awareness to this subject due to itsserious consequences on mechanical propertiesof the concrete and performance of the relatedstructures. One laboratory test that is usuallyused in evaluating the magnitude of wateringress into concrete is the initial surfaceabsorption test (ISAT). The details of the test arepresented in B.S. 1881: Part 5: 1970,[3].Prolonging the service life of concretestructures through the use of waterproof coatingshas been emphasized [4, 5]. Also theperformance of the coated concrete againstchemically aggressive environments is generallybetter than the performance of the uncoatedconcrete [6]. This paper focuses on theeffectiveness of powdered one componentacrylic of different mixing ratios with water anddifferent mixing ratios of tar: epoxy on water
absorption of concrete surface. The effects ofpowdered one component acrylic coating andtar: epoxy on the flexural and splitting strengthwere also investigated and the degree of theiraffectedness by action of acidic solution.
METHODOLOGYFabricating The Isat Apparatus:
The first step in the experimental work wasthe fabrication of an apparatus for initial surfaceabsorption test, shown in (Figure1), Theapparatus was fabricated by the researchersaccording to British Standard BS 1881: Parts5:1970 [3].
MATERIALSThe Concrete Mix Ingredients:
Coarse Aggregate: The coarse aggregateused was river bed gravel obtained from theTigris river (Mosul/Iraq). The maximumaggregate size used was 20 mm. Table 1 showsthe sieve analysis of the gravel according to theIraqi Standard Specifications No.45/1984 [7].
Table (1): Sieve Analysis of GravelTotal limits (Iraqi
Standard
Specification
No.45/1984)
Weight
Passing
(%)
Sieve Size
.S.(mm)
95-10010020
30-604310
0-100.55
Fine Aggregate (Sand): The sand used in thisstudy was natural sand supplied from Kanhash
L

Journal of University of Duhok, Vol. 17, No.1 (Pure and Eng. Sciences), Pp 119-125, 2014
120
region (Mosul). This type of sand conforms tothe Iraqi Standard Specifications No.45/ 1984limits [7], as shown in Table 2.
Table (2): Sieve Analysis of the SandTotal limits
(Iraqi Standard
Specification
No.45/1984)
Weight Passing(%)Sieve Size
B.S.
90-1001004.75 mm
75-100812.36 mm
55-90661.18 mm
35-5952600µ
8-3024300µ
0-107150µ
Cement: Ordinary Portland cement produced byBadoosh Factory (Mosul) was used as thebinding material. Table 3 shows the Chemicalcomposition of the cement used [8]
Table (3): The Chemical composition of the cementused
Mg
o
So
3
Al2
o3
Fe2
o3
Sio
2
CaoMain
Oxide
3.6
2
2.6
5.8
9
2.6
7
21.3
1
62.2
%
Max.
5%
Max.
2.8
%
___
___
___
___
Iraq
iSta
nd
ard
Sp
ecif
icat
ion
No
.5/1
984
Water: Potable water was used in this study forboth mixing and curing.
COATING MATERIALS:
The Primer:. It is a liquid agent used to improvethe property of adhesion of the top layer ofcement concrete surface. It is usually applied tothe surface by a normal brush, a roller brush orby a sprayer. The concrete surface has to be freefrom oil, grease, dust, and any foreign materialsbefore applying the prime. In order to avoidseparation of the coating. Each coating used inthis study has a specific Primer to be usedwith it, Figures2 and 3 show the primer usedin this study.
Powdered One Component Acrylic: It is awater soluble powder used with differentdissolution ratios. The powder and the water aremixed together until a homogenous mixture isobtained. Figure 4 shows the one componentacrylic (Powder).Tar Epoxy: Tar epoxy is generally an amine orpolyamide epoxy modified with tar pitch resin toproduce a high-build film that has good chemicalresistance and excellent water resistance.
Table (4): Technical Data Sheet for WaterproofingMaterials
Materials Physical Properties
Co
lor
Ten
sile
str
eng
th
(MP
a)
Sh
elf
life
(M
on
ths)
Vis
cosi
ty (
Cp
)
Sp
ecif
ic G
ravi
ty
(gm
/cm
3)
Elo
ng
atio
n %
Powder
One
Component
acrylic
gra
y
43
24
2500-
3500
1.7
-1.9
218
Tar Epoxy
bla
ck
60
24
2150-
3100
1.5
-1.7
360
Concrete Mix Proportions: A predeterminedcompressive strength of 35 MPa was decided forthe resulting concrete at the age of 28 days.Accordingly, the mix proportions obtainedthrough the British mix design method were (1:1.92: 2.95) with w/c of 0.47. The cement contentof the mix was 380 Kg/m3.Mixing, Casting, and Curing of ConcreteSpecimens:A mechanical tilting mixer of acapacity of 134 liters was used for mixing theingredients of the concrete. The interior surfaceof the mixer was cleaned and moistened beforeplacing the materials. Mixing and casting werecarried on according to ASTM C192 [9].Curingwas accomplished according to ASTM C511[10].Normal structural concrete will be used inthis investigation.Preparation of Concrete Specimens Surface:The service life of a coating depends on thedegree of surface preparation achieved as muchas it depends on application [11]. Preparation ofthe specimens surface involves cleaning of thesurface, removal of ridges and then drying of the

Journal of University of Duhok, Vol. 17, No.1 (Pure and Eng. Sciences), Pp 119-125, 2014
121
surface to be coated. Drying the sample to becoated is a very important step because themoisture will prevent adhesion of the coating tothe surface.Application of Coatings:Application of Primer: After preparing of \\coated with a layer of primer that is used withcoatings using a roller brushApplication of Powdered One ComponentAcrylic coating: Different ratios of water andpowdered acrylic were mixed together until ahomogeneous mixture was obtained. The coatingwas then applied on the concrete surface using aroller brush and pinlevler.Tar Epoxy: Here again the surfaces ofspecimens were prepared and coated with thespecific primer that was used in case of tar basedmaterials. The tar was mixed with epoxy untilthe homogeneous mixture was obtained. Then,the surface was coated with a layer of themixture also using a roller and pinleveler. Thetwo mixing ratios of tar: epoxy used are 1:0.5and 1:1.Table 4 shows the specifications ofcoating of the concrete specimens and the givensymbol to each type of coating.
Table 5: Coating specifications of the concretespecimens
DescriptionSpecimens
Specimens of concrete without
coating
A
Specimens of concrete coated with
powdered one component acrylic in
mixing with water is 1:1
B
Specimens of concrete coated with
powdered one component acrylic in
mixing with water is 1.5:1
C
Specimens of concrete coated with
tar: epoxy with ratio1:0.5
D
Specimens of concrete coated with
tar: epoxy with ratio1:1
E
The Testing Procedure: The tests performed onthe concrete specimens a long with the relatedstandards are given in Table 5. In each test threespecimens were used and the average value wascalculated.
Table (6): The tests performed on the concretespecimens
Test Shape and
dimension
of molds used
Standards
Slump test ------------------ ASTM (C143-98)
[12]
Initial
surface
absorption
test
(ISAT)
Cube: 100mm
x100mm x
100mm.
BS 1881: Parts
5:1970 [3]
Flexural
strength
Beam: 100mmx
100mm
x400mm.
ASTM (C 78-94)
[14]
Splitting
tensile
strength
Cylinder:
100mm ,
200mm.
ASTM (C 496-96)
[15]
Resistance
to acid
attack
Cube: 100mm x
100mm
x100mm.
------------------
Fig. (1): An Image Showing the ISAT Apparatus
Fig. (2) The Primer Used With Acrylic Coating

Journal of University of Duhok, Vol. 17, No.1 (Pure and Eng. Sciences), Pp 119-125, 2014
122
Fig. (3) Powdered One Component Acrylic
Fig. (4) Tar Epoxy
RESULTS AND DISCUSSIONSSlump test:
The predetermined slump value for theconcrete was 70 mm.Initial surface absorption test (ISAT):
The results of the ISAT for the referenceconcrete sample A and the coated concretesamples B, C ,D and E are shown in Figures6,7,8,9 and10, respectively. The ISA valuescorresponding to each type of waterproofcoatings are as shown below:Powdered one component acrylic: Figure 7suggests that the ISA values for the specimenscoated with powdered one component acrylicwere between 645 -137 ml/m2.s *10-3 for thetime range of 10 – 120 minutes. These valueswere for acrylic: water mixing ratio of 1:1 The1.5:1 mixing ratio had zero initial surfaceabsorption, as shown in Figure 8, as a result ofincreasing the fine material (the acrylic powder)
in the coating mix. This led to high degree ofpolymerization which means more densecoating.Tar Epoxy: The tar epoxy coating was tried intar: epoxy ratios of 1:0.5 and 1:1 thecorresponding ISA graphs are shown in Figures9 and 10, respectively. The results given inFigure 10 show that the 1:1 mixing ratio resultedin zero ISA values at all exposure times.Weight Loss: Results of weight loss which wascalculated by the related equation are WeightLoss (%) = [(m1-m2)/m1] X100 illustrated inFigures 11-13 at the exposure time of 56, 90,and120 days . The above results show that thepercentage of weight loss for all the coatedconcrete specimens exposed to sulfuric acidsolution was less than that of the uncoatedspecimens, especially at early ages. This meansthat all waterproofing coatings used have a goodresistance to the action of the acidic solution butwith varying degrees.The tar:epoxy with ratio 1:1, in particular, wasless affected by the acidic solution. This can beattributed to the high degree of polymerizationof the coating.Splitting Tensile Strength (Indirect, BrazilianTest):The splitting tensile strength results for thespecimens at 28 days are shown in Figure14.Figure 15 demonstrated the percentageincrease in splitting strength in coated specimenscompared to the uncoated specimen A.From the above results one can outline thefollowing observations concerning the splittingtensile strength values obtained:1. It can be observed that all coated specimenshave splitting tensile strength more than theuncoated specimens. This is due to the use ofacrylic coatings and tar epoxy which have goodtensile strength and high ductility thusimproving the performance of the coatedconcrete relative to the uncoated specimen A.The powdered one component acrylic: waterratio of 1.5:1 it gave the highest splittingstrength. This may be due to that the higheracrylic content results in higher plasticity of thecoating.Two different ratios of tar: epoxy that are, 1:0.5and 1:1 were tried. Although the difference insplitting tensile strength was not big but themixing ratio of 1:1 gave a higher result. The tarand epoxy gives good flexibility when mixedtogether

Journal of University of Duhok, Vol. 17, No.1 (Pure and Eng. Sciences), Pp 119-125, 2014
123
Flexural strength (modulus of rupture):Figure 16 shows the results of the flexuralstrength at 28 days. Figure 17 demonstrates thepercentage increase in flexural strength in coatedspecimens compared to the uncoated specimenThe same discussion presented concerningsplitting strength can be applied to the flexuralstrength.
Fig. (6) ISA vs. Time for Specimen A at 28 Days
Fig. (7) ISA vs. Time for Specimen B at 28 Days
Fig. (8) ISA vs. Time for Specimen C at 28 Days
Fig. (9) ISA vs. Time for Specimen D at 28 Days
Fig. (10) ISA vs. Time for Specimen E
Fig. (11) Percentage of Weight Loss for all Specimens 56Days
Fig. (12) Percentage of Weight Loss for all Specimens 90Days
0
2000
4000
6000
8000
0 50 100
ISA
,(ml /
m2.
s) *
1o- 3
Time elapsed , (min.)
0
200
400
600
800
0 50 100ISA,
(ml /
m2.
s) *
10-3
Time elapsed, (min.)
0
0.2
0.4
0.6
0.8
1
0 50 100ISA,
(ml /
m2 .s
) *1
0-3
Time elapsed, (min.)
Journal of University of Duhok, Vol. 17, No.1 (Pure and Eng. Sciences), Pp 119-125, 2014
123
Flexural strength (modulus of rupture):Figure 16 shows the results of the flexuralstrength at 28 days. Figure 17 demonstrates thepercentage increase in flexural strength in coatedspecimens compared to the uncoated specimenThe same discussion presented concerningsplitting strength can be applied to the flexuralstrength.
Fig. (6) ISA vs. Time for Specimen A at 28 Days
Fig. (7) ISA vs. Time for Specimen B at 28 Days
Fig. (8) ISA vs. Time for Specimen C at 28 Days
Fig. (9) ISA vs. Time for Specimen D at 28 Days
Fig. (10) ISA vs. Time for Specimen E
Fig. (11) Percentage of Weight Loss for all Specimens 56Days
Fig. (12) Percentage of Weight Loss for all Specimens 90Days
100 150
Time elapsed , (min.)
100 150
Time elapsed, (min.)
100 150
Time elapsed, (min.)
0
50
100
150
0 50 100
ISA,
(ml /
m2 .s
) *10
-3
Time elapsed, (min.)
0
0.2
0.4
0.6
0.8
1
0 50 100ISA,
(ml /
m2 .s
) *1
0-3
Time elapsed, (min.)
Journal of University of Duhok, Vol. 17, No.1 (Pure and Eng. Sciences), Pp 119-125, 2014
123
Flexural strength (modulus of rupture):Figure 16 shows the results of the flexuralstrength at 28 days. Figure 17 demonstrates thepercentage increase in flexural strength in coatedspecimens compared to the uncoated specimenThe same discussion presented concerningsplitting strength can be applied to the flexuralstrength.
Fig. (6) ISA vs. Time for Specimen A at 28 Days
Fig. (7) ISA vs. Time for Specimen B at 28 Days
Fig. (8) ISA vs. Time for Specimen C at 28 Days
Fig. (9) ISA vs. Time for Specimen D at 28 Days
Fig. (10) ISA vs. Time for Specimen E
Fig. (11) Percentage of Weight Loss for all Specimens 56Days
Fig. (12) Percentage of Weight Loss for all Specimens 90Days
100 150
Time elapsed, (min.)
100 150
Time elapsed, (min.)
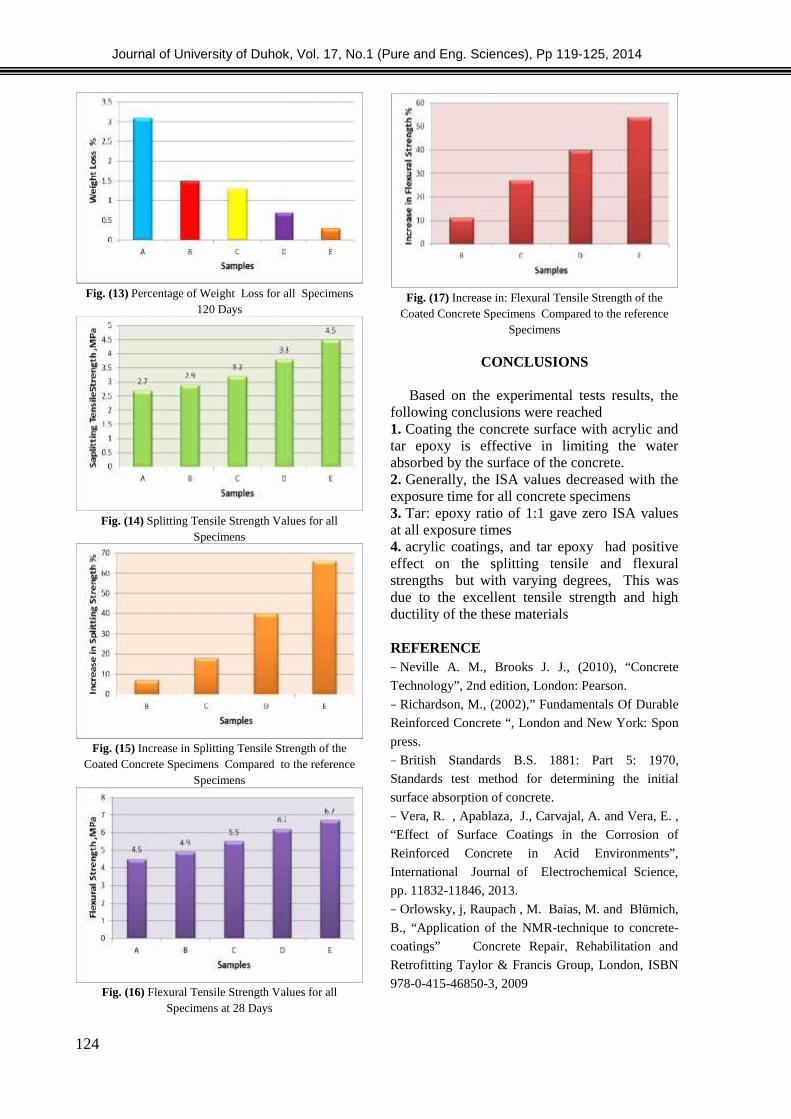
Journal of University of Duhok, Vol. 17, No.1 (Pure and Eng. Sciences), Pp 119-125, 2014
124
Fig. (13) Percentage of Weight Loss for all Specimens120 Days
Fig. (14) Splitting Tensile Strength Values for allSpecimens
Fig. (15) Increase in Splitting Tensile Strength of theCoated Concrete Specimens Compared to the reference
Specimens
Fig. (16) Flexural Tensile Strength Values for allSpecimens at 28 Days
Fig. (17) Increase in: Flexural Tensile Strength of theCoated Concrete Specimens Compared to the reference
Specimens
CONCLUSIONS
Based on the experimental tests results, thefollowing conclusions were reached1. Coating the concrete surface with acrylic andtar epoxy is effective in limiting the waterabsorbed by the surface of the concrete.2. Generally, the ISA values decreased with theexposure time for all concrete specimens3. Tar: epoxy ratio of 1:1 gave zero ISA valuesat all exposure times4. acrylic coatings, and tar epoxy had positiveeffect on the splitting tensile and flexuralstrengths but with varying degrees, This wasdue to the excellent tensile strength and highductility of the these materials
REFERENCE- Neville A. M., Brooks J. J., (2010), “ConcreteTechnology”, 2nd edition, London: Pearson.- Richardson, M., (2002),” Fundamentals Of DurableReinforced Concrete “, London and New York: Sponpress.- British Standards B.S. 1881: Part 5: 1970,Standards test method for determining the initialsurface absorption of concrete.- Vera, R. , Apablaza, J., Carvajal, A. and Vera, E. ,“Effect of Surface Coatings in the Corrosion ofReinforced Concrete in Acid Environments”,International Journal of Electrochemical Science,pp. 11832-11846, 2013.- Orlowsky, j, Raupach , M. Baias, M. and Blümich,B., “Application of the NMR-technique to concrete-coatings” Concrete Repair, Rehabilitation andRetrofitting Taylor & Francis Group, London, ISBN978-0-415-46850-3, 2009

Journal of University of Duhok, Vol. 17, No.1 (Pure and Eng. Sciences), Pp 119-125, 2014
125
- Aguiar, J., Camoes, A, and Moreira, P.,“Coating forConcrete Protection against AggressiveEnvironments” ,Journal of Advanced TechnologyVol.6.No.1,PP. 243-250,2008.- Iraqi Standard Specification No.45, "sieve analysisof aggregate", 1984.- Cement Badoosh factory, Personal communication.- American Society for Testing and Materials. ASTMC 192-98, Standard test method for curing concretetest specimens in the laboratory. ASTM Standards2004.- American Society for Testing and Materials. ASTMC 511-98, Standard test method for casting concretetest specimens in the laboratory. ASTM Standards2004.- Petrie .E, (2000), “Handbook of Adhesives andSealants”, McGraw Hill.
- American Society for Testing and Materials. ASTMC 143-98, Standard test method for slump ofhydraulic-cement concrete. Standards 2004.- British Standard B.S., "Method for Determinationof compressive strength of concrete cubes", part 116,1983.- American Society for Testing and Materials. ASTMC 78-94, Standard test method for flexural strength ofconcrete (using simple beam with third-Pointloading).Standards 2004.- American Society for Testing and Materials.
ASTMC 496-96, Standard test method forsplitting tensile strength of cylindricalconcrete specimens. Standard 2004.
Journal of University of Duhok, Vol. 17, No.1 (Pure and Eng. Sciences), Pp 126-136, 2014
126
SIMULATION MODELS FOR BEKHMA RESERVOIR OPERATION SYSTEM(COMPARISON STUDY)
MAHDI DAWOOD, KAMEL A. ALMOHSEEN and SHAKER A. JALIL
Dept. Of Water resource Engineering, Faculty of Engineering, University of Duhok, Kurdistan Region-IraqDept. Of Dams and Water resource Engineering, College of Engineering, University of Mosul-Iraq
Dept. Of Water resource Engineering, Faculty of Engineering, University of Duhok, Kurdistan Region-Iraq
(Received: March 18, 2014; Accepted for publication: December 3, 2014)
ABSTRACTSimulation procedures have been developed to test the performance of Bekhma reservoir system using
two simulation models viz: HEC-ResSim (Model-I) and Simulink based technique (Model-II). In the presentstudy being reported, one of the simulations modeling process requirement is to disaggregate the monthlyinflow data into daily based data, and as far as the demand from Bekhma reservoir is of concern, a constantvalue of 332m3/sec has been proposed based on the achievement of high reliability level in Model-I and 318m3/sec for the same reliability in Model-II. In order to test the performance of the reservoir system ingenerating hydroelectric power, the same set of data have been introduced to both models , the averagepower generated by first model was 510.3 MW while the second was 495.9 MW which they are closed to eachother . In addition the current research work is considered as an opportunity to check the capability ofSimulink approach in modeling water resource systems in general and reservoir systems in particular.
1. INTRODUCTION
he optimum utilization of our limitedsupply of water resources is becoming the
central point in planning, operation andmanagement of all water resources projects. Theever growing population of the world and thelimited resources of land and water are imposinggreat constraints on food production and itsavailability.
Reservoirs are considered the majorcomponents of any water resource system. Thepublic perceptions and needs, objectives andnumerous other factors that affect reservoiroperation change over time. Consequently,operating procedures should be periodicallyreevaluated and modified whenever changingconditions so warrant. However, there is nostandard format for specifying reservoir systemoperating rules applicable to all situations(AlMohseen, K. A. 2003).
Each reservoir system has its own unique set ofaspects and a variety of measures may be used todefine its operating rules in order to attainsituations. Each reservoir system has its ownunique set of aspects and a variety of measuresmay be used to define its operating rules in orderto attain a defined goal (Al-Mohseen,2003).Additionally, any reservoir model should beable to evaluate the quality of its solutions and
compute values of explicitly defined performancemeasures as a function of the sought storagecapacity/water release policy, (Wurbs, 1996).This can be done by means of simulation models.
2. SIMULATION MODELS
Simulation seeks to mimic the operation of a realsystem. It is a modeling technique that is used toapproximate the behavior of a system oncomputer, representing all the characteristics ofthe system largely by a mathematical conceptsbased on well known hydrological equation ofmass balance of reservoir inflows, outflows andstorage fluctuations. There are several readilyavailable, well-documented, generalized computerprograms for reservoir system simulation. Theseinclude HEC-5, SSARR, MIT Simulation Models,and several Texas Department of Water Resourcesmodels. Other well-known simulation modelswere developed primarily for specific reservoirsystems such as the California Central ValleyProject or Tennessee Valley Authority systems(Wurbs, 1985). The earliest simulation modeldealing with operational study, and developed fora system of six reservoirs on Missouri River, wasmade in 1953 by U.S. Army Corps of Engineers,(Hall and Dracup, 1970). According to (Wurbs,1985), simulation, with either deterministic orsynthetically generated stochastic hydrologic
T
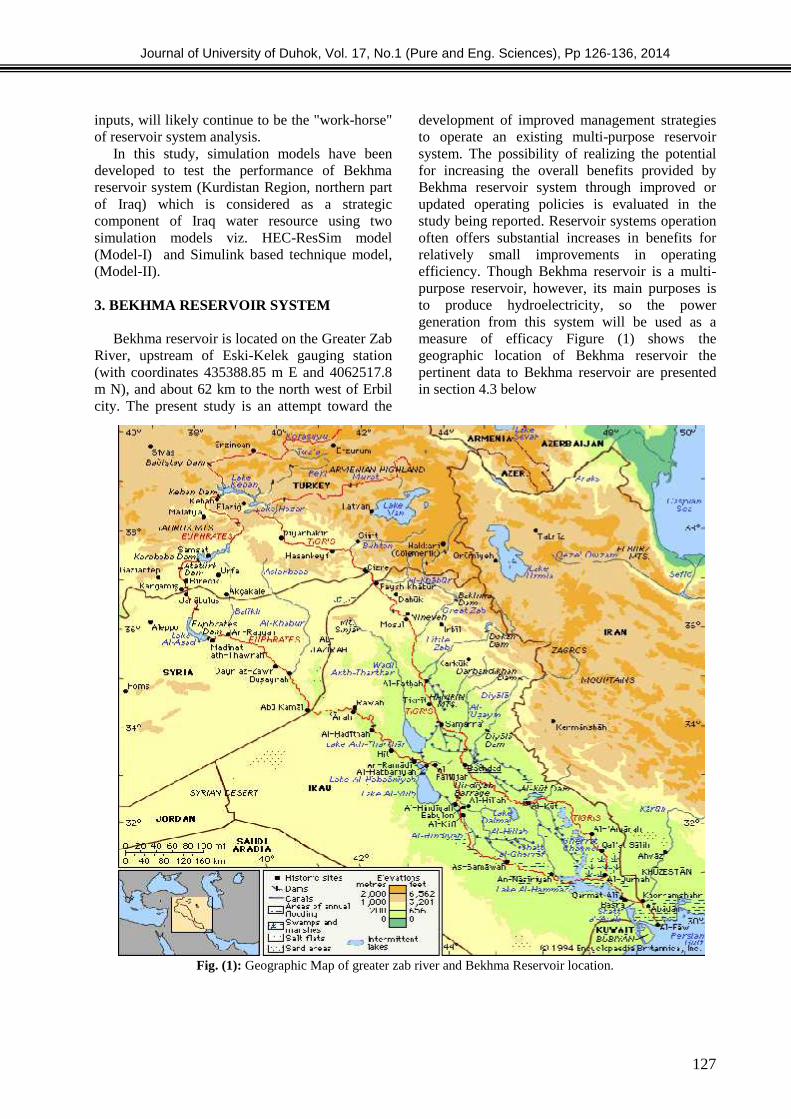
Journal of University of Duhok, Vol. 17, No.1 (Pure and Eng. Sciences), Pp 126-136, 2014
127
inputs, will likely continue to be the "work-horse"of reservoir system analysis.
In this study, simulation models have beendeveloped to test the performance of Bekhmareservoir system (Kurdistan Region, northern partof Iraq) which is considered as a strategiccomponent of Iraq water resource using twosimulation models viz. HEC-ResSim model(Model-I) and Simulink based technique model,(Model-II).
3. BEKHMA RESERVOIR SYSTEM
Bekhma reservoir is located on the Greater ZabRiver, upstream of Eski-Kelek gauging station(with coordinates 435388.85 m E and 4062517.8m N), and about 62 km to the north west of Erbilcity. The present study is an attempt toward the
development of improved management strategiesto operate an existing multi-purpose reservoirsystem. The possibility of realizing the potentialfor increasing the overall benefits provided byBekhma reservoir system through improved orupdated operating policies is evaluated in thestudy being reported. Reservoir systems operationoften offers substantial increases in benefits forrelatively small improvements in operatingefficiency. Though Bekhma reservoir is a multi-purpose reservoir, however, its main purposes isto produce hydroelectricity, so the powergeneration from this system will be used as ameasure of efficacy Figure (1) shows thegeographic location of Bekhma reservoir thepertinent data to Bekhma reservoir are presentedin section 4.3 below
Fig. (1): Geographic Map of greater zab river and Bekhma Reservoir location.

Journal of University of Duhok, Vol. 17, No.1 (Pure and Eng. Sciences), Pp 126-136, 2014
128
1932 January February March April May June July August September October November December Mean
1 241.7 466.3 651.8 763.2 669.1 379.8 175.7 106.8 109.1 133.1 131.9 133.2 330.142 351.1 581.5 722 804.4 533.8 225.7 125.7 87.8 130.3 135.8 128 138.4 330.383 351.1 581.5 722 804.4 533.8 225.7 125.7 87.8 130.3 135.8 128 138.4 330.384 351.1 581.5 722 804.4 533.8 225.7 125.7 87.8 130.3 135.8 128 138.4 330.385 351.1 581.5 722 804.4 533.8 225.7 125.7 87.8 130.3 135.8 128 138.4 330.386 351.1 581.5 722 804.4 533.8 225.7 125.7 87.8 130.3 135.8 128 138.4 330.387 351.1 581.5 722 804.4 533.8 225.7 125.7 87.8 130.3 135.8 128 138.4 330.388 351.1 581.5 722 804.4 533.8 225.7 125.7 87.8 130.3 135.8 128 138.4 330.389 351.1 581.5 722 804.4 533.8 225.7 125.7 87.8 130.3 135.8 128 138.4 330.3810 351.1 581.5 722 804.4 533.8 225.7 125.7 87.8 130.3 135.8 128 138.4 330.3811 351.1 581.5 722 804.4 533.8 225.7 125.7 87.8 130.3 135.8 128 138.4 330.3812 351.1 581.5 722 804.4 533.8 225.7 125.7 87.8 130.3 135.8 128 138.4 330.3813 351.1 581.5 722 804.4 533.8 225.7 125.7 87.8 130.3 135.8 128 138.4 330.3814 351.1 581.5 722 804.4 533.8 225.7 125.7 87.8 130.3 135.8 128 138.4 330.3815 351.1 581.5 722 804.4 533.8 225.7 125.7 87.8 130.3 135.8 128 138.4 330.3816 351.1 581.5 722 804.4 533.8 225.7 125.7 87.8 130.3 135.8 128 138.4 330.3817 351.1 581.5 722 804.4 533.8 225.7 125.7 87.8 130.3 135.8 128 138.4 330.3818 351.1 581.5 722 804.4 533.8 225.7 125.7 87.8 130.3 135.8 128 138.4 330.3819 351.1 581.5 722 804.4 533.8 225.7 125.7 87.8 130.3 135.8 128 138.4 330.3820 351.1 581.5 722 804.4 533.8 225.7 125.7 87.8 130.3 135.8 128 138.4 330.3821 351.1 581.5 722 804.4 533.8 225.7 125.7 87.8 130.3 135.8 128 138.4 330.3822 351.1 581.5 722 804.4 533.8 225.7 125.7 87.8 130.3 135.8 128 138.4 330.3823 351.1 581.5 722 804.4 533.8 225.7 125.7 87.8 130.3 135.8 128 138.4 330.3824 351.1 581.5 722 804.4 533.8 225.7 125.7 87.8 130.3 135.8 128 138.4 330.3825 351.1 581.5 722 804.4 533.8 225.7 125.7 87.8 130.3 135.8 128 138.4 330.3826 351.1 581.5 722 804.4 533.8 225.7 125.7 87.8 130.3 135.8 128 138.4 330.3827 351.1 581.5 722 804.4 533.8 225.7 125.7 87.8 130.3 135.8 128 138.4 330.3828 351.1 581.5 722 804.4 533.8 225.7 125.7 87.8 130.3 135.8 128 138.4 330.3829 351.1 581.5 722 804.4 533.8 225.7 125.7 87.8 130.3 135.8 128 138.4 330.3830 351.1 722 804.4 533.8 225.7 125.7 87.8 130.3 135.8 128 138.4 307.5531 351.1 722 533.8 125.7 87.8 135.8 138.4 299.23Sum 10774.7 16748.3 22,311.80 24,090.80 16,683.10 6,925.10 3,946.70 2,740.80 3,887.80 4,207.10 3,843.90 4,285.20 3,885.33
4. DATA PREPARATION4.1 Inflow Time Series
The means monthly flow at dam site isavailable over the period January 1st 1932 toDecember 1st 2004, i.e. (876) mean monthly flowrecords. But the proposed Model-I requires theinflow data to be presented on daily basis.Consequently, the monthly data has beensubjected to a disaggregation procedures toconvert them to daily data (26633 days) using atool available in HEC-ResSim program. figure (2)
shows part of inflow disaggregation (during year1932), obtained from HEC-ResSim simulationprogram, and figure (3) depicts the daily inflowinto Bekhma Reservoir for the period January 1st1932 to December 1st 2004 after beingdisaggregated
Fig. (2): daily Inflow into Reservoir (during year 1932) after disaggregation by HEC-ResSim program
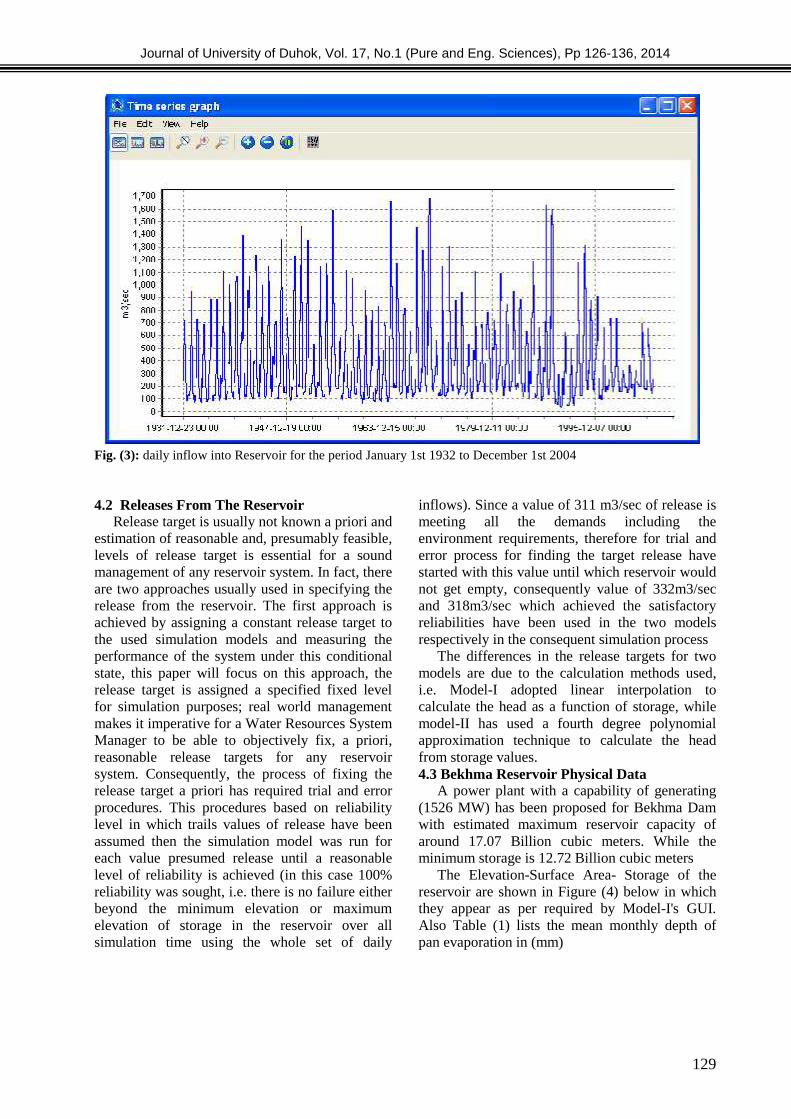
Journal of University of Duhok, Vol. 17, No.1 (Pure and Eng. Sciences), Pp 126-136, 2014
129
Fig. (3): daily inflow into Reservoir for the period January 1st 1932 to December 1st 2004
4.2 Releases From The ReservoirRelease target is usually not known a priori and
estimation of reasonable and, presumably feasible,levels of release target is essential for a soundmanagement of any reservoir system. In fact, thereare two approaches usually used in specifying therelease from the reservoir. The first approach isachieved by assigning a constant release target tothe used simulation models and measuring theperformance of the system under this conditionalstate, this paper will focus on this approach, therelease target is assigned a specified fixed levelfor simulation purposes; real world managementmakes it imperative for a Water Resources SystemManager to be able to objectively fix, a priori,reasonable release targets for any reservoirsystem. Consequently, the process of fixing therelease target a priori has required trial and errorprocedures. This procedures based on reliabilitylevel in which trails values of release have beenassumed then the simulation model was run foreach value presumed release until a reasonablelevel of reliability is achieved (in this case 100%reliability was sought, i.e. there is no failure eitherbeyond the minimum elevation or maximumelevation of storage in the reservoir over allsimulation time using the whole set of daily
inflows). Since a value of 311 m3/sec of release ismeeting all the demands including theenvironment requirements, therefore for trial anderror process for finding the target release havestarted with this value until which reservoir wouldnot get empty, consequently value of 332m3/secand 318m3/sec which achieved the satisfactoryreliabilities have been used in the two modelsrespectively in the consequent simulation process
The differences in the release targets for twomodels are due to the calculation methods used,i.e. Model-I adopted linear interpolation tocalculate the head as a function of storage, whilemodel-II has used a fourth degree polynomialapproximation technique to calculate the headfrom storage values.4.3 Bekhma Reservoir Physical Data
A power plant with a capability of generating(1526 MW) has been proposed for Bekhma Damwith estimated maximum reservoir capacity ofaround 17.07 Billion cubic meters. While theminimum storage is 12.72 Billion cubic meters
The Elevation-Surface Area- Storage of thereservoir are shown in Figure (4) below in whichthey appear as per required by Model-I's GUI.Also Table (1) lists the mean monthly depth ofpan evaporation in (mm)
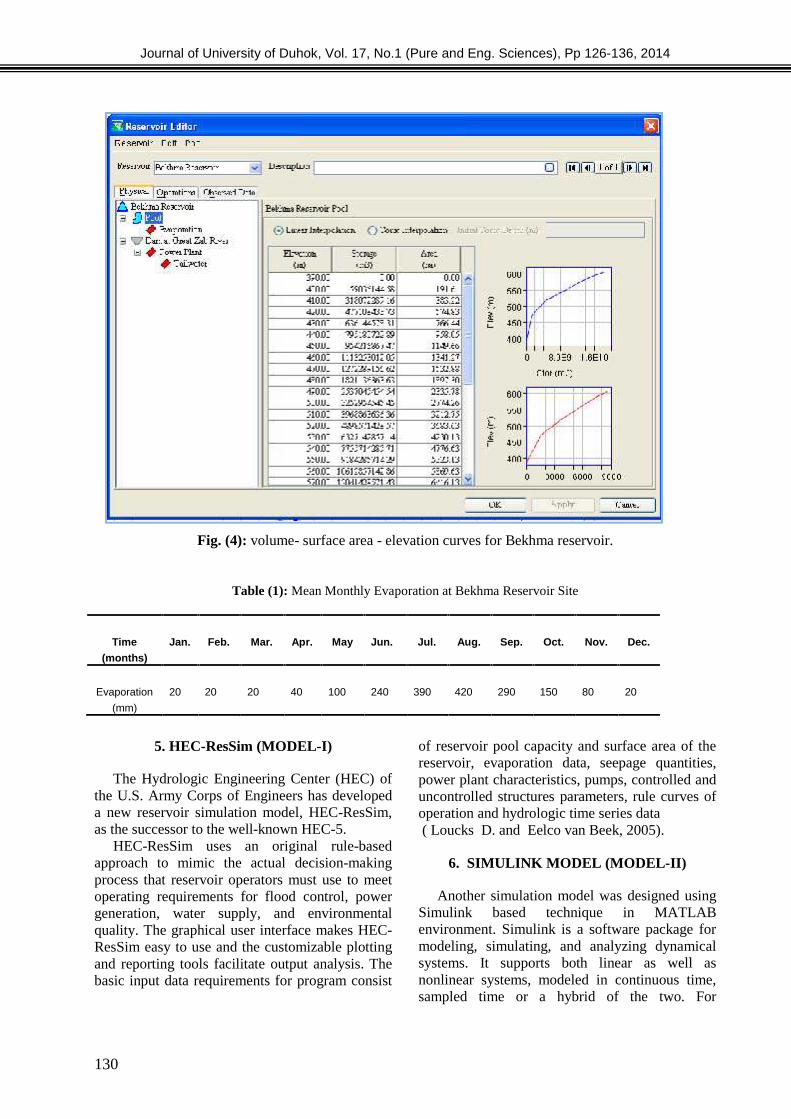
Journal of University of Duhok, Vol. 17, No.1 (Pure and Eng. Sciences), Pp 126-136, 2014
130
Fig. (4): volume- surface area - elevation curves for Bekhma reservoir.
Table (1): Mean Monthly Evaporation at Bekhma Reservoir Site
Time
(months)
Jan. Feb. Mar. Apr. May Jun. Jul. Aug. Sep. Oct. Nov. Dec.
Evaporation
(mm)
20 20 20 40 100 240 390 420 290 150 80 20
5. HEC-ResSim (MODEL-I)
The Hydrologic Engineering Center (HEC) ofthe U.S. Army Corps of Engineers has developeda new reservoir simulation model, HEC-ResSim,as the successor to the well-known HEC-5.
HEC-ResSim uses an original rule-basedapproach to mimic the actual decision-makingprocess that reservoir operators must use to meetoperating requirements for flood control, powergeneration, water supply, and environmentalquality. The graphical user interface makes HEC-ResSim easy to use and the customizable plottingand reporting tools facilitate output analysis. Thebasic input data requirements for program consist
of reservoir pool capacity and surface area of thereservoir, evaporation data, seepage quantities,power plant characteristics, pumps, controlled anduncontrolled structures parameters, rule curves ofoperation and hydrologic time series data( Loucks D. and Eelco van Beek, 2005).
6. SIMULINK MODEL (MODEL-II)
Another simulation model was designed usingSimulink based technique in MATLABenvironment. Simulink is a software package formodeling, simulating, and analyzing dynamicalsystems. It supports both linear as well asnonlinear systems, modeled in continuous time,sampled time or a hybrid of the two. For
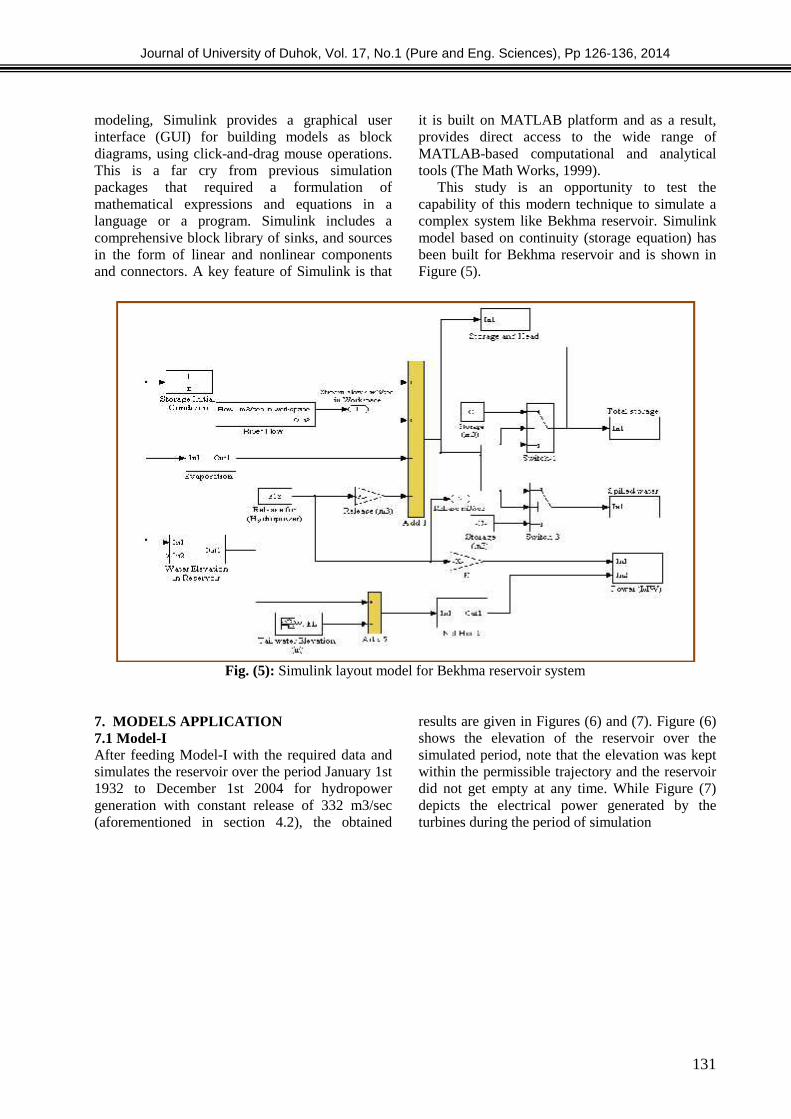
Journal of University of Duhok, Vol. 17, No.1 (Pure and Eng. Sciences), Pp 126-136, 2014
131
modeling, Simulink provides a graphical userinterface (GUI) for building models as blockdiagrams, using click-and-drag mouse operations.This is a far cry from previous simulationpackages that required a formulation ofmathematical expressions and equations in alanguage or a program. Simulink includes acomprehensive block library of sinks, and sourcesin the form of linear and nonlinear componentsand connectors. A key feature of Simulink is that
it is built on MATLAB platform and as a result,provides direct access to the wide range ofMATLAB-based computational and analyticaltools (The Math Works, 1999).
This study is an opportunity to test thecapability of this modern technique to simulate acomplex system like Bekhma reservoir. Simulinkmodel based on continuity (storage equation) hasbeen built for Bekhma reservoir and is shown inFigure (5).
Fig. (5): Simulink layout model for Bekhma reservoir system
7. MODELS APPLICATION7.1 Model-IAfter feeding Model-I with the required data andsimulates the reservoir over the period January 1st1932 to December 1st 2004 for hydropowergeneration with constant release of 332 m3/sec(aforementioned in section 4.2), the obtained
results are given in Figures (6) and (7). Figure (6)shows the elevation of the reservoir over thesimulated period, note that the elevation was keptwithin the permissible trajectory and the reservoirdid not get empty at any time. While Figure (7)depicts the electrical power generated by theturbines during the period of simulation
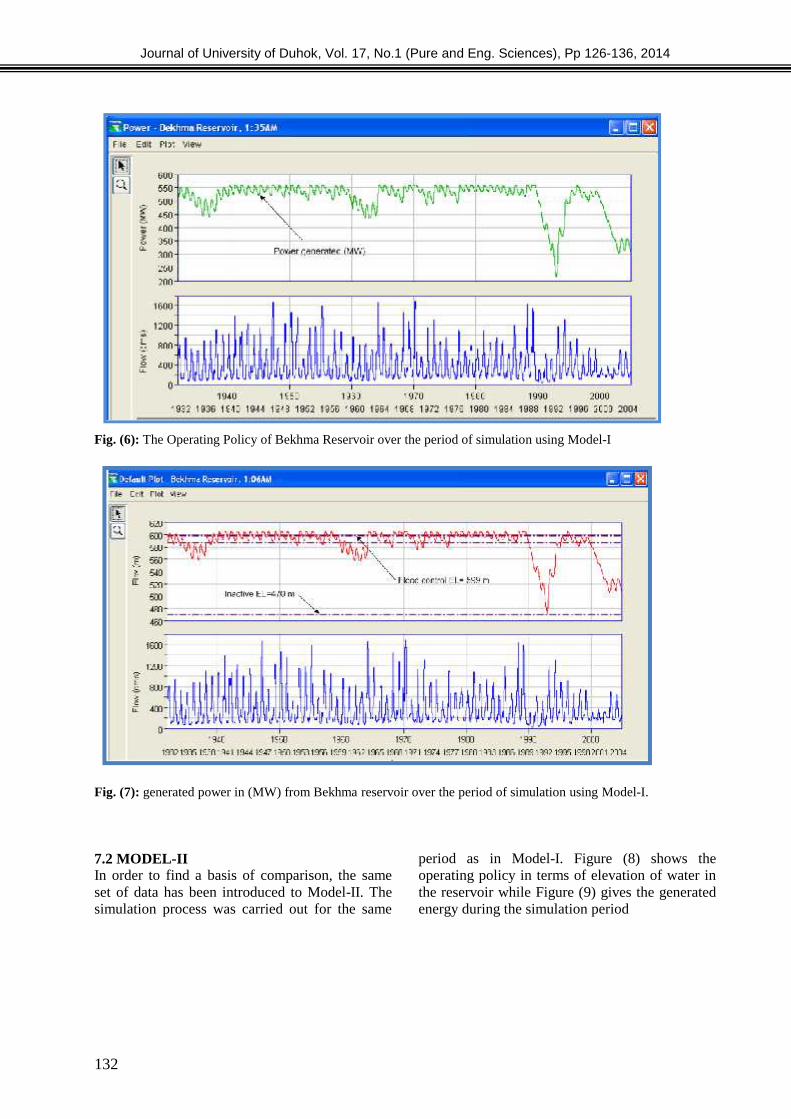
Journal of University of Duhok, Vol. 17, No.1 (Pure and Eng. Sciences), Pp 126-136, 2014
132
Fig. (6): The Operating Policy of Bekhma Reservoir over the period of simulation using Model-I
Fig. (7): generated power in (MW) from Bekhma reservoir over the period of simulation using Model-I.
7.2 MODEL-IIIn order to find a basis of comparison, the sameset of data has been introduced to Model-II. Thesimulation process was carried out for the same
period as in Model-I. Figure (8) shows theoperating policy in terms of elevation of water inthe reservoir while Figure (9) gives the generatedenergy during the simulation period

Journal of University of Duhok, Vol. 17, No.1 (Pure and Eng. Sciences), Pp 126-136, 2014
133
.Fig. (8): the Operating Policy of Bekhma reservoir over the period of simulation using Model-II
Fig. (9): generated power in (MW) over the period of simulation using Model-II.
8. RESULTS AND DISCUSSIONS
Optimal controlled water release and hydropowergenerated characteristics in Daily produced fromboth models simulations are present in
Table(2),while Figure (10), graph showing resultsof the power (MW) produced from simulations ofthe reservoir during the period from (01 January1932 to 01 December 2004).

Journal of University of Duhok, Vol. 17, No.1 (Pure and Eng. Sciences), Pp 126-136, 2014
134
Table(2): hydropower generation characteristics results from both simulation models.
Fig.(10): generated power produced by both simulation models from Bekhma rreservoir during the period (01January 1932 to 01 December 2004).
The daily (26633 days) operation rule curves(policy operation) obtained from both models arepresented in figures (6 through 8 ) above, thesedata is relatively large and difficult to be analyzed, consequently, hard work has been devoted toextract the average monthly operation policy for
Bekhma Reservoir. The monthly operation rulecurves (operating polices) obtained from bothmodels are calculated and presented in figure (11)based on water elevation in the reservoir. Notethat close operating policies have been result fromboth models.
Models
Average Power
Generated in (Mw)
Max. Power
Generated in
(Mw)
Min. Power
Capacity in
( Mw)
HEC-ResSim (Model- I) 510.3 556.13 213.4
Matlab -Simulink Technique (Model- II) 495.9 532.00 203.5
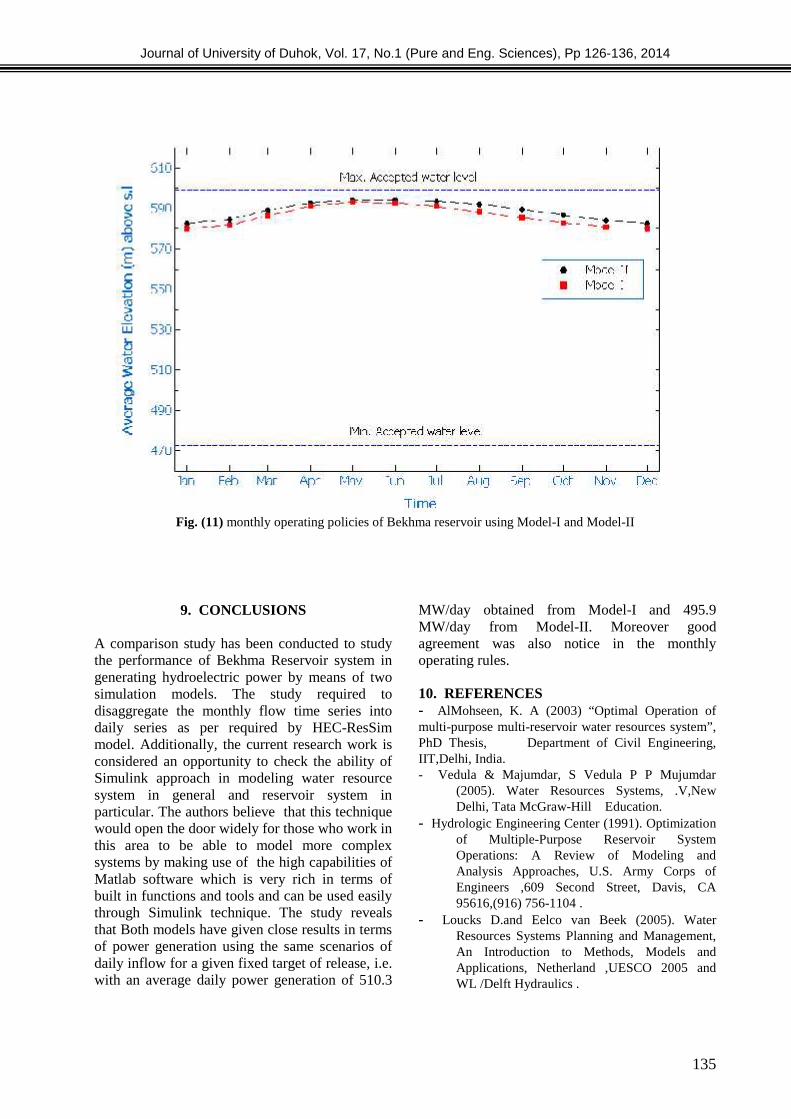
Journal of University of Duhok, Vol. 17, No.1 (Pure and Eng. Sciences), Pp 126-136, 2014
135
Fig. (11) monthly operating policies of Bekhma reservoir using Model-I and Model-II
9. CONCLUSIONS
A comparison study has been conducted to studythe performance of Bekhma Reservoir system ingenerating hydroelectric power by means of twosimulation models. The study required todisaggregate the monthly flow time series intodaily series as per required by HEC-ResSimmodel. Additionally, the current research work isconsidered an opportunity to check the ability ofSimulink approach in modeling water resourcesystem in general and reservoir system inparticular. The authors believe that this techniquewould open the door widely for those who work inthis area to be able to model more complexsystems by making use of the high capabilities ofMatlab software which is very rich in terms ofbuilt in functions and tools and can be used easilythrough Simulink technique. The study revealsthat Both models have given close results in termsof power generation using the same scenarios ofdaily inflow for a given fixed target of release, i.e.with an average daily power generation of 510.3
MW/day obtained from Model-I and 495.9MW/day from Model-II. Moreover goodagreement was also notice in the monthlyoperating rules.
10. REFERENCES- AlMohseen, K. A (2003) “Optimal Operation ofmulti-purpose multi-reservoir water resources system”,PhD Thesis, Department of Civil Engineering,IIT,Delhi, India.- Vedula & Majumdar, S Vedula P P Mujumdar
(2005). Water Resources Systems, .V,NewDelhi, Tata McGraw-Hill Education.
- Hydrologic Engineering Center (1991). Optimizationof Multiple-Purpose Reservoir SystemOperations: A Review of Modeling andAnalysis Approaches, U.S. Army Corps ofEngineers ,609 Second Street, Davis, CA95616,(916) 756-1104 .
- Loucks D.and Eelco van Beek (2005). WaterResources Systems Planning and Management,An Introduction to Methods, Models andApplications, Netherland ,UESCO 2005 andWL /Delft Hydraulics .

Journal of University of Duhok, Vol. 17, No.1 (Pure and Eng. Sciences), Pp 126-136, 2014
136
- Klipsch, D. J (2009). Reservoir operationsmodeling with HEC-ResSim , HydrologicEngineering Center, U.S. Army Corps ofEngineers Davis, CA. 530-756-1104 .
- Joan D.Klipsch.Mariln B. Hurst (2007). HEC-ReSim,Reservoir System Simulation UserManual ,version 3.0 U.S. Army Corps ofEngineers ,609 Second Street, Davis, CA95616-4687.
- S.K. JAIN and V.P. SINGH.(2003). WaterResources Systems Planning and Management,Elsevier Science B.V. Amsterdam, theNetherlands.
- AlMohseen, K. A(2008). "Operation of AlaziziyaEvaporation Pond Using Simulink Trechnique",Alrafiden Engineering Journal, College ofEngineering, Mosul University, Vol.16, No.3,Iraq.
- Steven T. Karris (2008). Introduction to Simulinkwith Engineering Applications Second EditionOrchard Publications.
- The Math Works, Simulink® Control Design™ (2011). User’s Guide, The Math Works, Inc.3 AppleHill Drive Natick, MA 01760-2098.
- The Math Works. (1999 ). Simulink ,DynamicSystem Simulation for Matlab, Using SimulinkVersion 3, The MathWorks, Inc. 24 Prime ParkWay Natick, MA 01760-1500.
- Mohammad Karamouz,FerencSzidarovszky,Banafsheh Zahraie (2003) WaterResources Systems Analysis ,United States ofAmerica, TC409.K37 2003 333.91—dc21, ACRC Press Company, Lewis publishers.
- Ladislav Votruba, Vojtech broza(1989). watermanagement in reservoirs, Elsevier SciencePublishers B.V. Sara Burgerhartstraat 25, P.O.Box 211, 1000 AE Aamsterdam, theNetherlands.
- Slobodan P. Simonovic (2008). Managing WaterResources ,Methods and Tools for a SystemsApproach, UNESCO Publishing 7, place deFontenoy, 75352 Paris 07 SP, France.
- Thomas A, McMahon& Russel G.Mein (1978).Reservoir capacity And Yield, Elsevier ScienceB.V. 335 Jan van Galenstraat, Amsterdam, theNetherlands.
- B. Roffel· B. H. Betlem (2004). Advanced PracticalProcess Control, Springer-Veriag BerlinHeidelberg.
- Qibo Mao • Stanislaw Pietrzko(2013). Control ofNoise and Structural Vibration, A ATLAB®-Based Approach, Springer-Verlag London .