Journal of Alloys and Compounds - NuVant
10
Electrochemical performances of Li-rich layered-layered Li 2 MnO 3 - LiMnO 2 solid solutions as cathode material for lithium-ion batteries Rakesh Saroha a , Amit Gupta b , Amrish K. Panwar a, * a Department of Applied Physics, Delhi Technological University, New Delhi,110042, India b Department of Mechanical Engineering, Indian Institute of Technology Delhi, New Delhi,110016, India article info Article history: Received 19 September 2016 Received in revised form 12 November 2016 Accepted 15 November 2016 Available online 15 November 2016 Keywords: Layered-layered nanocomposite Sol-gel Electrochemical performance abstract In this work a series of Li-rich layered-layered solid solution of Li 2 MnO 3 -LiMnO 2 [Li[Li (1x)/3 Mn (xþ2)/3 ]O 2 ; x ¼ 0.0, 0.1, 0.3 and 0.5] nanocomposite structure were successfully synthesized using sol-gel technique. All the synthesized compositions exhibit the main characteristics peaks of m-Li 2 MnO 3 and could be indexed to the C2/m space group except some weak diffraction peaks located around 20e30 which can be attributed to the superlattice structure originate due to the ordering of Mn ion into Li-Mn layers and are typically observed for Li-rich based materials. CV results show that pristine LMO possesses weak anodic peak around 4.7 V and no symmetric cathodic peak in the voltage window of 2.0e4.8 V. Among all the synthesized compositions, x ¼ 0.3 (LMO3) delivers highest specific discharge capacity and best rate and cycling performances at all values of current densities. The LMO3 composition delivers an initial discharge capacity of 177 ± 5 mAhg 1 at a current density of 10 mA/g in the voltage range of 2.0e4.8 V and holds nearly 97% of the initial discharge capacity after 120 charge/discharge cycles at the same current density. © 2016 Elsevier B.V. All rights reserved. 1. Introduction Single layered-type transition metal oxide cathode materials such as ABO 2 /AB 2 O 3 , spinel-type cathodes such as AB 2 O 4 and olivine-type cathodes materials such as ABXO 4 (A ¼ Li, B ¼ transition metal, X ¼ P, Si, etc.) have been extensively studied in order to have high energy density electrode material. Apart from advantages possesses by these materials their disadvantages are also evident. For ABO 2 -type cathode materials such as LiCoO 2 and LiNiO 2 , higher cost, toxic nature and poor thermal stability remain important points of concerns [1,2]. In AB 2 O 4 -type cathodes such as LiMn 2 O 4 , capacity fading due to the dissolution of manganese ions and Jahn-Teller distortion hindered their widespread applications [3,4]. Furthermore, poor electronic conductivity and sluggish lithium ion diffusion in olivine-type cathode materials such as LiFePO 4 restrict their use in automotive industry [5e7]. Layered- layered solid solutions of type AB 2 O 3 -ABO 2 have become attrac- tive cathode materials for lithium-ion batteries due to their high reversible capacity of 250 mAhg 1 with lower cost, structural sta- bility and better safety as compared to the currently used commercial LiCoO 2 cathode [8]. Layered oxide Li[Li 1/3 Mn 2/3 ]O 2 (commonly written as Li 2 MnO 3 ) possess AB 2 O 3 -type monoclinic structure (C2/m space group) and high theoretical capacity up to 458 mAhg 1 [9e11]. However, it is electrochemically inactive in the typical voltage range 2.2e4.4 V vs. Li þ /Li as all Mn atoms exist in þ4 valence. Due to this, it is hard to oxidize beyond Mn 4þ in an octa- hedrally coordinated environment and therefore, no lithium can be easily removed from the Li 2 MnO 3 phase [2,3,8,9,11]. Furthermore, it requires a high cut-off voltage (~4.8 V vs. Li þ /Li) during the initial charging process to activate Li 2 MnO 3 by removing Li 2 O from the electrode active material according to the following reaction [2,9,10,12,13]: Li 2 MnO 3 / xLi 2 O þ (1 x)MnO 2 (1) Li 2 MnO 3 also shows poor cycling performance which is due to the structural transition from layered structure to the spinel structure during charging/discharging process [14]. Therefore, rigorous research efforts are on-going to find optimized electrode materials containing Li 2 MnO 3 along with two or three components [2,3,8e12,15e19]. In this work, Li 2 MnO 3 has been integrated with another Mn-based layered cathode LiMnO 2 in order to have lithium rich layered-layered solid solutions. LiMnO 2 crystallizes in two * Corresponding author. E-mail address: [email protected] (A.K. Panwar). Contents lists available at ScienceDirect Journal of Alloys and Compounds journal homepage: http://www.elsevier.com/locate/jalcom http://dx.doi.org/10.1016/j.jallcom.2016.11.199 0925-8388/© 2016 Elsevier B.V. All rights reserved. Journal of Alloys and Compounds 696 (2017) 580e589
Transcript of Journal of Alloys and Compounds - NuVant

lable at ScienceDirect
Journal of Alloys and Compounds 696 (2017) 580e589
Contents lists avai
Journal of Alloys and Compounds
journal homepage: http: / /www.elsevier .com/locate/ ja lcom
Electrochemical performances of Li-rich layered-layered Li2MnO3-LiMnO2 solid solutions as cathode material for lithium-ion batteries
Rakesh Saroha a, Amit Gupta b, Amrish K. Panwar a, *
a Department of Applied Physics, Delhi Technological University, New Delhi, 110042, Indiab Department of Mechanical Engineering, Indian Institute of Technology Delhi, New Delhi, 110016, India
a r t i c l e i n f o
Article history:Received 19 September 2016Received in revised form12 November 2016Accepted 15 November 2016Available online 15 November 2016
Keywords:Layered-layered nanocompositeSol-gelElectrochemical performance
* Corresponding author.E-mail address: [email protected] (A.K. Pan
http://dx.doi.org/10.1016/j.jallcom.2016.11.1990925-8388/© 2016 Elsevier B.V. All rights reserved.
a b s t r a c t
In this work a series of Li-rich layered-layered solid solution of Li2MnO3-LiMnO2 [Li[Li(1�x)/3Mn(xþ2)/3]O2;x ¼ 0.0, 0.1, 0.3 and 0.5] nanocomposite structure were successfully synthesized using sol-gel technique.All the synthesized compositions exhibit the main characteristics peaks of m-Li2MnO3 and could beindexed to the C2/m space group except some weak diffraction peaks located around 20e30� which canbe attributed to the superlattice structure originate due to the ordering of Mn ion into Li-Mn layers andare typically observed for Li-rich based materials. CV results show that pristine LMO possesses weakanodic peak around 4.7 V and no symmetric cathodic peak in the voltage window of 2.0e4.8 V. Among allthe synthesized compositions, x ¼ 0.3 (LMO3) delivers highest specific discharge capacity and best rateand cycling performances at all values of current densities. The LMO3 composition delivers an initialdischarge capacity of 177 ± 5 mAhg�1 at a current density of 10 mA/g in the voltage range of 2.0e4.8 Vand holds nearly 97% of the initial discharge capacity after 120 charge/discharge cycles at the samecurrent density.
© 2016 Elsevier B.V. All rights reserved.
1. Introduction
Single layered-type transition metal oxide cathode materialssuch as ABO2/AB2O3, spinel-type cathodes such as AB2O4 andolivine-type cathodes materials such as ABXO4 (A ¼ Li,B¼ transition metal, X¼ P, Si, etc.) have been extensively studied inorder to have high energy density electrode material. Apart fromadvantages possesses by these materials their disadvantages arealso evident. For ABO2-type cathode materials such as LiCoO2 andLiNiO2, higher cost, toxic nature and poor thermal stability remainimportant points of concerns [1,2]. In AB2O4-type cathodes such asLiMn2O4, capacity fading due to the dissolution of manganese ionsand Jahn-Teller distortion hindered their widespread applications[3,4]. Furthermore, poor electronic conductivity and sluggishlithium ion diffusion in olivine-type cathode materials such asLiFePO4 restrict their use in automotive industry [5e7]. Layered-layered solid solutions of type AB2O3-ABO2 have become attrac-tive cathode materials for lithium-ion batteries due to their highreversible capacity of 250 mAhg�1 with lower cost, structural sta-bility and better safety as compared to the currently used
war).
commercial LiCoO2 cathode [8]. Layered oxide Li[Li1/3Mn2/3]O2(commonly written as Li2MnO3) possess AB2O3-type monoclinicstructure (C2/m space group) and high theoretical capacity up to458mAhg�1 [9e11]. However, it is electrochemically inactive in thetypical voltage range 2.2e4.4 V vs. Liþ/Li as all Mn atoms exist inþ4valence. Due to this, it is hard to oxidize beyond Mn4þ in an octa-hedrally coordinated environment and therefore, no lithium can beeasily removed from the Li2MnO3 phase [2,3,8,9,11]. Furthermore, itrequires a high cut-off voltage (~4.8 V vs. Liþ/Li) during the initialcharging process to activate Li2MnO3 by removing Li2O from theelectrode active material according to the following reaction[2,9,10,12,13]:
Li2MnO3 / xLi2O þ (1 � x)MnO2 (1)
Li2MnO3 also shows poor cycling performance which is due tothe structural transition from layered structure to the spinelstructure during charging/discharging process [14]. Therefore,rigorous research efforts are on-going to find optimized electrodematerials containing Li2MnO3 along with two or three components[2,3,8e12,15e19]. In this work, Li2MnO3 has been integrated withanother Mn-based layered cathode LiMnO2 in order to have lithiumrich layered-layered solid solutions. LiMnO2 crystallizes in two

R. Saroha et al. / Journal of Alloys and Compounds 696 (2017) 580e589 581
forms: orthorhombic (o-LiMnO2, Pmnm Symmetry) andmonoclinic(m-LiMnO2, C2/m Symmetry) and shows a high theoretical capacityof around 290 mAhg�1 and better cyclability when operated be-tween 2.0 and 4.5 V vs. Liþ/Li [9,14,20].
The motive behind the present work is to study the physico-chemical and electrochemical performances of the lithium richMn-based layered-layered solid solutions of Li2MnO3-LiMnO2. Theresearch work reported on solid solution in this investigation hasnot been explored in the past. Although, there are reports onvarious solid-solution system which have been investigated pre-viously like Li2MnO3-LiMO2 (M ¼ Ni1/3Mn1/3Co1/3, Ni1/2Mn1/2) [21],Li1þx(Ni0.3Mn0.7-yTiy)1�xO2, 0 < x < 1/3, y ¼ 0, 0.1, 0.2 [22],xLi2MnO3�(1�x) LiNi2/3Co1/6Mn1/6O2 [23], 0.5Li2MnO3-0.5Li(Mn0.375Ni0.375Co0.25O2) [24] etc. Apart from these reportedworks several attempts has also beenmade to synthesize and studyelectrochemical performances of some Li-rich manganese-basedcompositions using different methods [25,26] and morphology[27e29] etc. All the synthesized compositions in this work havebeen prepared using the sol-gel route and were examined using X-ray diffraction (XRD) for phase analysis, scanning electron micro-scopy (SEM) for microstructural investigation and Fourier-transform infrared spectroscopy (FTIR) for vibrational modesanalysis. Electrochemical characterizations of as-prepared compo-sitions were carried out to study electrochemical performance andlithium ion kinetics.
2. Experimental
2.1. Material preparation
Stoichiometric amounts of lithium acetate dihydrate (CH3COO-Li.2H2O, Sigma-Aldrich, ~99%) and Manganous acetate ((CH3COO)2Mn.4H2O, Fisher Scientific, 99%) were used as precursors for thedevelopment of solid solutions of Li2MnO3-LiMnO2 [Li(Li(1�x)/
3Mn(xþ2)/3)O2; x ¼ 0.0, 0.1, 0.3 and 0.5] using sol-gel technique.Citric acid (Sigma-Aldrich,�99.5%) was used as a chelating agent. Adispersed solution of all the precursors in deionized water wasprepared with continuous stirring and then added to citric acidsolution one by one. The pH value of the resulting solution wasmaintained between 6 and 7 using ammonia solution. The resultingsolution of citric acid and precursors was heated at 70 �C at400 rpm with continuous stirring until a transparent gel was ob-tained. The gel thus obtained was dried at 120 �C for 5 h in a vac-uum oven to obtain xerogel. The yielded powders were regroundtogether using pestle mortar and again heated at 600 �C for 3 h inair and then finally calcined at 900 �C for 12 h in air and thenallowed to cool normally up to room temperature. The powdersthus obtained for x ¼ 0.0, 0.1, 0.3 and 0.5 were abbreviated as LMO,LMO1, LMO3 and LMO5, respectively. The heating rate of thefurnace was kept at 5 �C min�1.
2.2. Material characterization
Synthesized samples were characterized using RIGAKUmake X-ray diffractometer coupled with CuKa1 radiation (l ¼ 1.540 Å) forquantitative analysis of crystal structure and phase composition ofthe synthesized structures. The XRD data was collected over anangular range of 10e70� with a step size of 0.02�. Rietveld refine-ment of LMO sample was performed using ‘X'pert high score plus'software in order to obtain quantitative information about struc-tural parameters. The microstructural characterization of the pre-pared samples was carried out using HITACHI make S-3700Nscanning electronmicroscope working at 15 kV. The as-synthesizedsamples weremixedwith 2.5 wt% of polyvinyl alcohol (PVA) binder,pressed into round pellets with 10 mm diameter by applying
pressure of 5 tons using a hydraulic press and then heated at 250 �Cfor 2 h in air to remove PVA. In order to make electrical contacts,silver (Ag) paste was applied on both sides of pellets and then driedat 150 �C for 1 h in air to remove moisture content. A two-pointprobe setup (AGILENT 4284A) was used to calculate the elec-tronic conductivity of the synthesized samples. Conductivitymeasurements were done at a bias voltage of 1.0 V and the fre-quency range was kept from 20 Hz to 1 MHz. The electronic con-ductivity (s) can be calculated using the following equation;
s ¼ 1R
�LA
�(2)
where R is the resistance of the sample (U), L and A is thickness(cm) and cross-sectional area (cm2) of the circular disc,respectively.
2.3. Electrode preparation and electrochemical characterization
For the electrochemical studies, two electrode coin half-cells(CR2032) were assembled. The working electrodes were preparedby dissolving 70wt% active material, 15 wt% super P as a conductivecarbon and 15 wt% polyvinylidene difluoride (PVDF) as a binder inN-methyl-2-pyrrolidinone (NM2P) as a solvent. This results in theuniform mixing of the active materials which were stirred for 10 h.Thus obtained slurry was uniformly coated on Al foil current col-lector using the “doctor blade” technique and further dried out at80 �C in a vacuum oven for overnight to evaporate the solvent. Thencircular electrodes with diameter 19 mm were punched andweighed. The electrodes were then dried up under vacuum at 60 �Cand finally brought inside the Mbraun make glove box having O2and H2O level �0.5 ppm. The coin cells (CR2032) were assembledfor electrochemical studies of the synthesized samples withmetallic lithium as both counter and reference electrode and amicroporous polypropylene sheet Celgard 2400 used as a separator.The electrolyte used was 1 M LiPF6 in EC: DMC 1:1 v/v. Cyclic vol-tammetry (CV) experiments were carried out over the potentialrange of 2.0e4.8 V (vs. Li/Liþ metal). The galvanostatic charge/discharge (GCD) performance test, rate capability at different C-rates and Electrochemical Impedance Spectroscopy (EIS) using anAC voltage pulse of 5 mV in the frequency range of 10 mHz-10 kHzwere performed. All the electrochemical tests were performedusing EZstat-pro Nuvant systems Inc. (U.S.A) cell test system at298 K.
3. Results and discussion
3.1. Structural and morphological analysis
The XRD patterns of the as-synthesized compositions are shownin Fig. 1. The pristine Li2MnO3 (LMO) shows diffraction peaks whichcorrespond to the m-Li2MnO3 and could be assign to C2/m spacegroup (Reference Code: 01-084-1634). The sharp and intense peaksindicate the crystalline nature of all the synthesized compositions.Even composite solid-solutions i.e. Li[Li(1�x)/3Mn(xþ2)/3]O2 (x ¼ 0.1,0.3 and 0.5) still shows the main characteristics peaks of m-Li2MnO3, indicating that the layered structure of the synthesizedsamples is still preserved. The (001) diffraction peaks of the syn-thesized compositions (shown in the magnified XRD image) clearlyshows slight shifts towards higher 2q angle suggesting a minorshrink of the unit cell and decrease in lattice parameters. On theother hand, weak diffraction peaks located around 20e30� can beattributed to the superstructure ordering of the lattice which iscaused by the arrangement of Mn ion into Li-Mn layers and areobserved for Li-rich based materials [1,28,30e32]. However, the

Fig. 1. XRD patterns of solid solution compositions of Li2MnO3-LiMnO2.
Fig. 2. Rietveld refined XRD pattern of pristine Li2MnO3 (LMO).
R. Saroha et al. / Journal of Alloys and Compounds 696 (2017) 580e589582
intensity of these superlattice peaks become weaker on changingthe value of x from 0.1 to 0.5 which indicates that the local orderingof Li/Mn has been reduced. In addition, the peak around 37� splitsinto two peaks i.e. (2 01) and (130), which can also be indexed to C2/m space group with a high degree of crystallinity. Similarly, thepeak around 45� also depicts the same results. However, the in-tensity of these doublets gets faded with an increase in x. Thesplitting of peaks located at 59� and 65� for all values of x has alsobeen noticed which indicates the presence of spinel phase [15].Rietveld refinement was performed for the pristine LMO synthe-sized sample to obtain quantitative structural information of thecrystal lattice structure using ‘X'pert high score plus' software. Theobserved XRD pattern along with calculated and difference patternfor original LMO sample are shown in Fig. 2. No background sub-traction and data smoothening were done before refinement. Thestarting atomic position coordinates for pristine LMO were takenfrom somewhere else [33]. The structural refinement results indi-cate that the goodness of fitting factor i.e. c2 for primitive LMO isaround 4.5% which demonstrates that the results are reliable. Thecrystal structure generated after refinement has been displayed inthe inset of Fig. 2 where Li and Mn atoms are surrounded by Oatoms to form LiO6 and MnO6 octahedra. The lattice parametersobtained from refinement for bare LMO are: a ¼ 4.928 Å,b ¼ 8.522 Å and c ¼ 5.022 Å. The average crystallite size for pristineLMO was calculated to be 54 nm using Scherrer's formula d ¼ kl/bcos q, where d is the mean crystallite size, k is the constantparameter of shape factor (0.94), l is the wavelength of X-ray(0.154 nm), b is the full-width half maximum corresponding to(001) peak and q is the corresponding angle of Bragg diffraction.These results suggest that the variation in x not only increase thecrystallinity of the synthesized samples but also induce phasetransformation to some extent.
The effect of variation in x value on the morphologies of Li[Li(1�x)/3Mn(xþ2)/3]O2 (x ¼ 0.0, 0.1, 0.3 and 0.5) composites areshown in Fig. 3(a)-(d). All prepared samples display nearly samemorphology with plate-like and relatively spherical grains. The
average grain size of LMO, LMO1, LMO3 and LMO5 composites werefound to be around 0.45, 0.3, 0.5 and 0.45 mm, respectively.Therefore, the average grain sizes of the composites were distrib-uted in a range of 300e450 nm. SEM images also show that thesynthesized nanocomposites possess dispersed grains with littleaggregation.
Among all synthesized samples, the pristine LMO and LMO3compositions are chosen to investigate the morphological proper-ties further. Fig. 4(A) and (B) shows the TEM/HRTEM images of theLMO and LMO3 synthesized samples. TEM image of pristine LMO(Fig. 4(A)) sample indicates that the particles are homogeneously

Fig. 3. SEM micrographs of Li2MnO3-LiMnO2 synthesized compositions (a) LMO; (b) LMO1; (c) LMO3; (d) LMO5.
R. Saroha et al. / Journal of Alloys and Compounds 696 (2017) 580e589 583
distributed with little agglomeration. It can also be observed fromTEM image that the particles are nearly spherical and possessnearly uniform size. The average particle size was calculated usingImageJ software and observed to be 170 nm for LMO composition.HRTEM image (inset of Fig. 4(A)) clearly indicates that the sample iswell crystallinewith uniformly spaced lattice fringes. The interlayerspacing of pristine LMO sample was observed to be 0.472 nmwhichcorresponds to (001) plane of the monoclinic structure of synthe-sized LMO composition. Likewise, TEM image oF LMO3 composi-tion (Fig. 4(B)) also reveals the spherical morphology of thesynthesized composition with slight agglomeration. The averageparticle size for LMO3 composition was calculated to be 220 nm.HRTEM image (inset of Fig. 4(B)) for LMO3 composition also revealsthe crystalline nature of the sample with uniformly spaced latticefringes. The interlayer spacings of LMO3 compositionwere found tobe 0.470 and 0.475 nm which again corresponds to (001) plane ofthe monoclinic structure. The obtained TEM/HRTEM results arewell synchronized with XRD and SEM results.
3.2. Cation environment study-FTIR
FTIR spectroscopy proves to be an appropriate and dominanttechnique for the structural evaluation and to study local envi-ronment of the cations in the crystal lattice of close-packed oxygenatoms. Vibrational modes are generally assigned to the motion ofcations with respect to an oxygen atom. The local cation environ-ment of synthesized compositions in the range of 400e600 cm�1
has been studied using FTIR spectroscopy and results are displayedin Fig. 5. It can be observed from FTIR graph that the spectrum of allsynthesized samples shows nearly similar features. In the spectrumof LMO, four bands located around 520 cm�1 (weak band),465 cm�1 (slightly broad peak), 430 cm�1 (sharp band) and at417 cm�1 (less intense band) can be observed. These four IR activemodes are assigned to the stretching and bending vibrations ofoctahedrally coordinated molecule of MnO6 in Li[Li(1�x)/3Mn(xþ2)/3]O2 matrix [32,34]. The weak band located at 520 cm�1 slightly
moves towards higher wavenumber side for LMO1, LMO3 andLMO5 compositions which may be attributed to the variation in Liand Mn amount in Li[Li(1�x)/3Mn(xþ2)/3]O2 solid solution which in-duces a difference in the local cation environment. Similarly, theband at 412 cm�1 shift towards lower wavenumber side for LMO3and LMO5which confirms that the local environment of the cationshas been changed.
3.3. Electronic conductivity measurements
Electronic conductivity gives the direct measurement of theelectron kinetics and hence, the electrochemical properties of thematerial. Fig. 6 displays the AC electrical resistance measurementfor the as-synthesized compositions. The frequency range for thedata collection was kept from 20 Hz to 1 MHz. From Fig. 6 it can beseen that all the compositions display depressed semicircle whoseintercept at x-axis gives the AC resistance of the cathode activematerial. It can be seen that excluding LMO3 sample all the com-positions have AC resistance in megaohm. The AC conductivityvalues for the samples LMO, LMO1, LMO3 and LMO5 were found tobe 10.1 � 10�9, 10.8 � 10�9, 1.65 � 10�7 and 9.36 � 10�9 S/cm,respectively. Therefore, among all the synthesized samples LMO3shows the highest AC conductivity and hence, superior electro-chemical performances are expected from LMO3 composition ascompared to other synthesized samples.
3.4. Electrochemical performance of Li2MnO3-LiMnO2 solidsolutions
Cyclic voltammetry measurements give an insight into theelectrochemical reactions taking place during the charging-discharging process. Fig. 7 displays the CV results of the as-synthesized samples in the voltage window of 2.0e4.8 V. Thedata for the CV measurement was collected at a scan rate of 0.05mVs�1. It can be observed from Fig. 6 that pristine LMO possessweak anodic peak around 4.7 V and no symmetric cathodic peak. It

Fig. 4. TEM and HRTEM images of the synthesized compositions (A) LMO; (B) LMO3.
Fig. 5. FTIR spectrum of the synthesized compositions in the wavenumber range of400e600 cm�1.
R. Saroha et al. / Journal of Alloys and Compounds 696 (2017) 580e589584
indicates the loss of lattice oxygen along with lithium extractionfrommonoclinic crystal structure as given by eq. (1) [33]. Therefore,CV result indicates that the activation of primitive LMO will takeplace at 4.7 V and this process will not be reversible. However, forLMO1, LMO3 and LMO5 compositions the intensity of the peak at4.7 V decreases significantly which indicates that the redox reac-tionmechanism is different from LMO.Moreover, MnO2 obtained ineq. (1) is assumed to be electrochemically active and formed spinelstructure during Li-intercalation. The samples with x > 0 i.e. LMO1,LMO3 and LMO5 shows a redox couple around 3.0/2.8 V, 4.1/4.0 Vand anodic peak around 2.1 V. The redox couple at 4.1/4.0 can beattributed to insertion of lithium ion at vacant 8a tetrahedral sitesof the spinel structure formed by MnO2 [9]. Likewise, the emer-gence of redox couple at 3.0/2.8 V is due to intercalation of Li-ion at16c octahedral sites of the spinel structure [33]. The origin of anodicpeak around 2.1 V can be attributed to structural modification ofthe material which generally take place due to high upper voltagelimit and can be assigned to spinel Mn4þ/Mn3þ redox couple [35].When charged at higher voltage, transition metal dissociation takesplace which leads to phase transformation from layered to spinelstructure. However, the intensity of these redox couples was found
to vary with x. This phenomenon may be correlated to the man-ganese dissolution which originated due to Jahn-Teller distortionand leads to change in oxidation state of Mn in the composition [9].The average oxidation states of Mn in LMO, LMO1, LMO3 and LMO5were calculated to be 4.0, 3.85, 3.61 and 3.40, respectively accord-ing to the redox titration method [27]. As average oxidation state ofMn changes from 4.0 to 3.4, Jahn-Teller distortion leads to disso-ciation of Mn3þ to Mn4þ andMn2þ which results in active mass lossand a decrease in intensity [9]. This change of oxidation state isgenerally expressed in terms of the transformation of the layer-to-spinel structure as predicted by XRD (splitting of peaks at 2q ¼ 59�
and 65�). The presence of shoulder peaks at 4.04, 3.98, 3.93 and3.96 V also indicates the existence of small spinel phase due toelectrochemical active MnO2. Therefore, the above results clearlyindicate the coexistence of spinel structure along with layeredstructure while the redox process observed at 2.8 V and 4.1 V forLMO1, LMO3 and LMO5 samples will lead to stable capacity andcyclic performances.
Fig. 8 shows the initial charge-discharge capacity curves of Li[Li(1�x)/3Mn(xþ2)/3]O2 (x ¼ 0.0, 0.1, 0.3 and 0.5) solid solution at acurrent density of 10 mA/g and in a voltage window of 4.8e2.0 V.The initial discharge capacities for composites LMO, LMO1, LMO3and LMO5 were found to be 81 ± 5, 97 ± 5, 177 ± 5 and71 ± 5 mAhg�1, respectively. It can be observed that as x value in-creases capacity increases, goes maximum for LMO3 and then de-creases for LMO5. For all composite samples, a sloping voltageplateau above 4.5 V can be seen in the charging curves. However, nodischarge plateau was observed above 4.5 V for the compositesamples which is associated with the oxidation of O2- ions andelectrochemical activation of Li2MnO3 by irreversible removal ofoxygen from the lattice. Moreover, the charge-discharge profile ofthe LMO1, LMO3 and LMO5 samples exhibits three voltage plateausaround 4.25 V, 2.87 V and 2.25 V. The voltage plateaus around4.25 V and 2.87 V originate due to change in oxidation state of Mnion during charging-discharging. The length of voltage plateau at4.25 V, 2.87 V and 2.25 V increases with increase in the value of x,reaching amaximum for LMO3 and then decreases for LMO5whichis possibly due to Jahn-Teller distortion as predicted in CV results.Among all the four samples, the LMO3 composition gives thehighest discharge capacity and the composition LMO5 delivers the

Fig. 6. AC conductivity measurements of synthesized solid solutions in the frequency range of 20 Hze1MHz.
Fig. 7. Cyclic Voltammograms of the Li(Li(1�x)/3Mn(xþ2)/3)O2 samples at a scan rate of0.05 mVs�1. Fig. 8. 1st charge/discharge curves of solid solution samples at a current density of
10 mA/g (icharge ¼ idischarge).
R. Saroha et al. / Journal of Alloys and Compounds 696 (2017) 580e589 585
least charge-discharge capacity. These results indicate superiorlithium ion kinetics and excellent reactivity for LMO3 sample.Fig. 9(a)-(d) shows the charge/discharge capacity curves of LMO,LMO1, LMO3 and LMO5, respectively for 1st, 2nd, 10th and 50thcycle at 10 mA/g. From Fig. 9(a), it can be observed that dischargecapacity of LMO composition at the 50th cycle is much greater ascompared to 1st cycle. This is due to activation of LMO compounddue to the removal of O2� along with lithium extraction whichcauses an increase in the length of voltage plateau around 3.2 V.
However, for LMO1 (Fig. 9(b)), LMO3 (Fig. 9(c)) and LMO5 (Fig. 9(d))compositions the charge/discharge profiles for 1st, 2nd, 10th and50th cycle remains nearly same. These results indicate that theintegrity of the synthesized compositions remains unchangedduring cycling.
Fig. 10(a)-(d) shows the charge/discharge curves of the synthe-sized samples at different current densities (10e1000mA/g) for theinitial cycle. It can be observed from Fig. 10 that among all thesynthesized samples LMO3 (Fig. 10(c)) delivers the highest specific

Fig. 9. Charge/Discharge profiles of the prepared compositions for 1st, 2nd, 10th and 50th cycle at 10 mA/g: (a) LMO; (b) LMO1; (c) LMO3; (d) LMO5.
Fig. 10. Initial charge/discharge curves of the synthesized compositions at various current densities: (a) LMO; (b) LMO1; (c) LMO3; (d) LMO5.
R. Saroha et al. / Journal of Alloys and Compounds 696 (2017) 580e589586

Fig. 11. Performance of Li(Li(1�x)/3Mn(xþ2)/3)O2 solid solution samples: (A) Rate per-formance at different current densities (icharge ¼ idischarge); (b) Cycling performance atcurrent density of 10 mA/g for 120 charge/discharge cycles.
Fig. 12. Rate capability of the synthesized compositions as a function of x in Li(Li(1�x)/
3Mn(xþ2)/3)O2.
R. Saroha et al. / Journal of Alloys and Compounds 696 (2017) 580e589 587
discharge capacity at all current densities. LMO3 shows an initialdischarge capacity of 177 (±5) mAh/g at 10 mA/g and deliversnearly 37% of the capacity at a high current density of 1 A/g. On theother hand, LMO5 (Fig. 10(d)) shows the least specific dischargecapacity at all current densities because of its low conductivity.
Fig. 11(a) shows the stepwise rate performance of the Li[Li(1�x)/
3Mn(xþ2)/3]O2 compositions at current densities of 10e1000 mA/g(10 mA/g ¼ 0.05C). It can be observed that the composition LMO3delivers the highest discharge capacity at all current densities. Theinitial discharge capacities for composites LMO, LMO1, LMO3 and
Table 1Electrochemical performance of synthesized compositions at different C-rates and cyclin
Samples Ra (%)
0.05C (±5) (mAhg�1) 0.1C 0.25C 0.5
LMO 81 144.4 128.3 11LMO1 97 84.5 81.4 72LMO3 177 84.7 70.6 62LMO5 71 98.8 90.1 78
a Capacity retention ratios of samples at different C-rates as compared to 0.05C.b Capacity retention rates of samples compared to the 1st cycle at 0.05C.
LMO5 were found to be 81 ± 5, 97 ± 5, 177 ± 5 and 71 ± 5 mAhg�1,respectively at 10 mA/g. However, the discharging capacity valuesfor LMO were found to increase continuously from 81 mAhg�1 forthe 1st cycle to 133 mAhg�1 for 5th discharge cycle which is due tothe activation of Li2MnO3 as given by eq. (1). Moreover, LMO5composite possesses the lowest discharge capacities even at lowcurrent densities but delivers fairly better discharge capacity valuesat high current rates as compared to the pristine LMO and LMO1composites. Table 1 compares the discharge capacity values at eachcurrent density with respect to 10 mA/g rate. LMO3 displayshighest discharge capacity and retains ~37% of its capacity valueeven at the high current rate of 5C (1A/g). The loss of capacity athigh current densities can be linked to the large polarization effectsof the composites which hindered lithium ion kinetics. Fig. 11(b)displays the cycling stability of the synthesized composites at10 mA/g current density for 120 charge-discharge cycles at roomtemperature. It is evident from Fig.11(b)) and Table 1 that except forLMO3 composite sample, discharge capacity at 120th cycle comesout to be more as compared to 1st cycle for LMO, LMO1 and LMO5composition. LMO3 shows an initial discharge capacity of 177(±5)mAhg�1 at 10 mA/g and retains nearly 97% of its capacity after 120charge/discharge cycles at same current density.
Fig. 12 depicts the dependence of the rate performance on thevariation of x. From the Figure, it can be observed that at low C-rates, the difference in electrochemical properties is mainly due tothe change in oxidation state of Mn ionwhich subsequently leads tomanganese dissolution and inferior capacity performance. Underhigh C-rates, the alteration in discharge capacities is predominantlydue to increase in polarization potential of the cathode active ma-terial which leads to poor discharge capacity values.
g capability at 0.05C-rate (10 mA/g).
5C 0.05C (±5) (mAhg�1)
C 2.5C 1st 120th Rb (%)
6.0 55.5 6.1 81 144 177.7.1 32.9 20.6 97 105 108.2.1 50.8 37.2 177 172 97.1.8 83.0 67.6 71 72 101.4
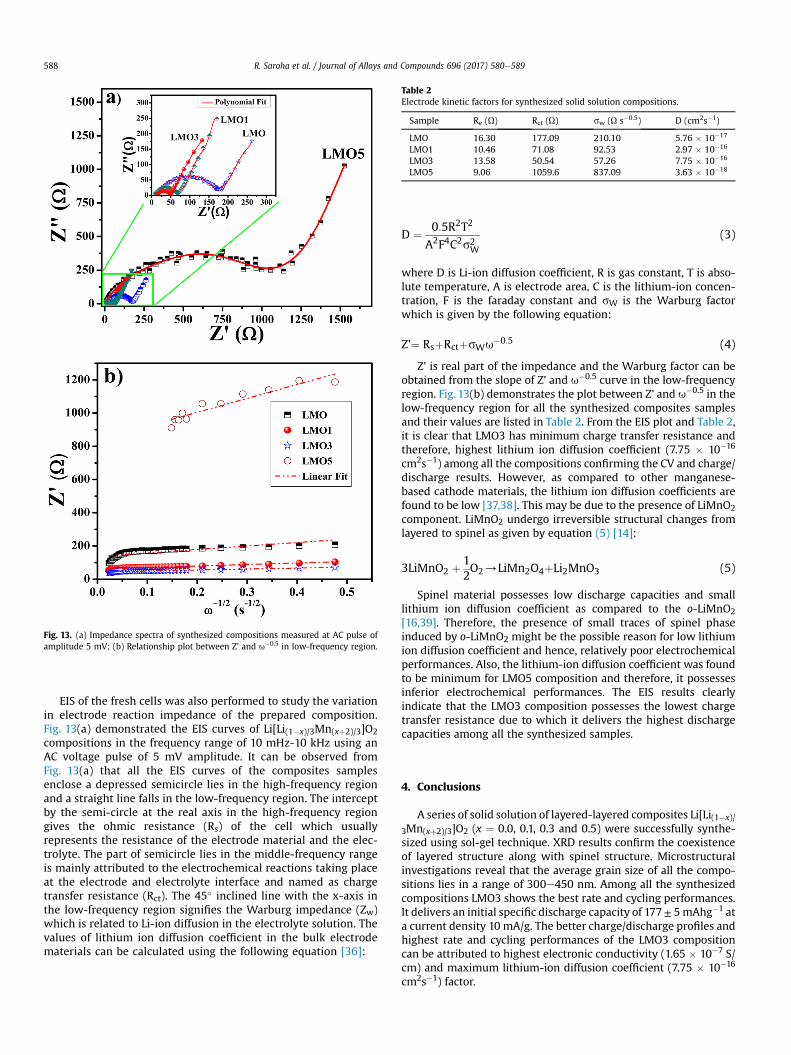
Fig. 13. (a) Impedance spectra of synthesized compositions measured at AC pulse ofamplitude 5 mV; (b) Relationship plot between Z’ and u�0.5 in low-frequency region.
Table 2Electrode kinetic factors for synthesized solid solution compositions.
Sample Re (U) Rct (U) sw (U s�0.5) D (cm2s�1)
LMO 16.30 177.09 210.10 5.76 � 10�17
LMO1 10.46 71.08 92.53 2.97 � 10�16
LMO3 13.58 50.54 57.26 7.75 � 10�16
LMO5 9.06 1059.6 837.09 3.63 � 10�18
R. Saroha et al. / Journal of Alloys and Compounds 696 (2017) 580e589588
EIS of the fresh cells was also performed to study the variationin electrode reaction impedance of the prepared composition.Fig. 13(a) demonstrated the EIS curves of Li[Li(1�x)/3Mn(xþ2)/3]O2compositions in the frequency range of 10 mHz-10 kHz using anAC voltage pulse of 5 mV amplitude. It can be observed fromFig. 13(a) that all the EIS curves of the composites samplesenclose a depressed semicircle lies in the high-frequency regionand a straight line falls in the low-frequency region. The interceptby the semi-circle at the real axis in the high-frequency regiongives the ohmic resistance (Rs) of the cell which usuallyrepresents the resistance of the electrode material and the elec-trolyte. The part of semicircle lies in the middle-frequency rangeis mainly attributed to the electrochemical reactions taking placeat the electrode and electrolyte interface and named as chargetransfer resistance (Rct). The 45� inclined line with the x-axis inthe low-frequency region signifies the Warburg impedance (Zw)which is related to Li-ion diffusion in the electrolyte solution. Thevalues of lithium ion diffusion coefficient in the bulk electrodematerials can be calculated using the following equation [36]:
D ¼ 0:5R2T2
A2F4C2s2W
(3)
where D is Li-ion diffusion coefficient, R is gas constant, T is abso-lute temperature, A is electrode area, C is the lithium-ion concen-tration, F is the faraday constant and sW is the Warburg factorwhich is given by the following equation:
Z’¼ RsþRctþsWu�0:5 (4)
Z’ is real part of the impedance and the Warburg factor can beobtained from the slope of Z’ and u�0.5 curve in the low-frequencyregion. Fig. 13(b) demonstrates the plot between Z’ and u�0.5 in thelow-frequency region for all the synthesized composites samplesand their values are listed in Table 2. From the EIS plot and Table 2,it is clear that LMO3 has minimum charge transfer resistance andtherefore, highest lithium ion diffusion coefficient (7.75 � 10�16
cm2s�1) among all the compositions confirming the CV and charge/discharge results. However, as compared to other manganese-based cathode materials, the lithium ion diffusion coefficients arefound to be low [37,38]. This may be due to the presence of LiMnO2component. LiMnO2 undergo irreversible structural changes fromlayered to spinel as given by equation (5) [14]:
3LiMnO2 þ12O2/LiMn2O4þLi2MnO3 (5)
Spinel material possesses low discharge capacities and smalllithium ion diffusion coefficient as compared to the o-LiMnO2[16,39]. Therefore, the presence of small traces of spinel phaseinduced by o-LiMnO2 might be the possible reason for low lithiumion diffusion coefficient and hence, relatively poor electrochemicalperformances. Also, the lithium-ion diffusion coefficient was foundto be minimum for LMO5 composition and therefore, it possessesinferior electrochemical performances. The EIS results clearlyindicate that the LMO3 composition possesses the lowest chargetransfer resistance due to which it delivers the highest dischargecapacities among all the synthesized samples.
4. Conclusions
A series of solid solution of layered-layered composites Li[Li(1�x)/
3Mn(xþ2)/3]O2 (x ¼ 0.0, 0.1, 0.3 and 0.5) were successfully synthe-sized using sol-gel technique. XRD results confirm the coexistenceof layered structure along with spinel structure. Microstructuralinvestigations reveal that the average grain size of all the compo-sitions lies in a range of 300e450 nm. Among all the synthesizedcompositions LMO3 shows the best rate and cycling performances.It delivers an initial specific discharge capacity of 177± 5mAhg�1 ata current density 10 mA/g. The better charge/discharge profiles andhighest rate and cycling performances of the LMO3 compositioncan be attributed to highest electronic conductivity (1.65 � 10�7 S/cm) and maximum lithium-ion diffusion coefficient (7.75 � 10�16
cm2s�1) factor.

R. Saroha et al. / Journal of Alloys and Compounds 696 (2017) 580e589 589
Acknowledgments
Authors are thankful to SERB and FIST, Department of Scienceand Technology (DST), New Delhi for financial support to carry outthis work under the project grants Nos.: SR/FTP/PS-039/2011 andSR/FST/PSI-164/2011(C), respectively.
References
[1] Y. Sun, Y. Shiosaki, Y. Xia, H. Noguchi, The preparation and electrochemicalperformance of solid solutions LiCoO2eLi2MnO3 as cathode materials forlithium ion batteries, J. Power Sources 159 (2006) 1353e1359.
[2] D. Kim, J. Gim, J. Lim, S. Park, J. Kim, Synthesis of xLi2MnO3$(1�x) LiMO2 (M¼Cr, Mn, Co, Ni) nanocomposites and their electrochemical properties, Mater.Res. Bull. 45 (2010) 252e255.
[3] C. Park, S. Kim, I.R. Mangani, J. Lee, S. Boo, J. Kim, Synthesis and materialscharacterization of Li2MnO3eLiCrO2 system nanocomposite electrode mate-rials, Mater. Res. Bull. 42 (2007) 1374e1383.
[4] M.M. Thackeray, Y. Shao-Horn, A.J. Kahaian, K.D. Kepler, E. Skinner,J.T. Vaughey, S.A. Hackney, Structural fatigue in spinel electrodes in highvoltage (4 V) Li/LixMn2O4 cells, Electrochem. Solid-State Lett. 1 (1998) 7e9.
[5] J. Li, Q. Qu, L. Zhang, L. Zhang, H. Zheng, A monodispersed nano-hexahedralLiFePO4 with improved power capability by carbon-coatings, J. AlloysCompd. 579 (2013) 377e383.
[6] Q. Liu, W. Liu, D. Li, H. Chen, Z. Wang, LiFe1�x(Ni0.98Co0.01Mn0.01)xPO4/C (x¼0.01, 0.03, 0.05, 0.07) as cathode materials for lithium-ion batteries, Electro-chim. Acta 184 (2015) 143e150.
[7] S.-X. Zhao, H. Ding, Y.-C. Wang, B.-H. Li, C.-W. Nan, Improving rate perfor-mance of LiFePO4 cathode materials by hybrid coating of nano-Li3PO4 andcarbon, J. Alloys Compd. 566 (2013) 206e211.
[8] Y. Wu, A. Manthiram, Structural stability of chemically delithiated layered(1�z)Li[Li1/3Mn2/3]O2ezLi[Mn0.5�yNi0.5�yCo2y]O2 solid solution cathodes,J. Power Sources 183 (2008) 749e754.
[9] Q. Zhang, T. Peng, D. Zhan, X. Hu, Synthesis and electrochemical property ofxLi2MnO3$(1�x)LiMnO2 composite cathode materials derived from partiallyreduced Li2MnO3, J. Power Sources 250 (2014) 40e49.
[10] D. Mori, H. Sakaebe, M. Shikano, H. Kojitani, K. Tatsumi, Y. Inaguma, Synthesis,phase relation and electrical and electrochemical properties of ruthenium-substituted Li2MnO3 as a novel cathode material, J. Power Sources 196(2011) 6934e6938.
[11] S. Kim, C. Kim, J.-K. Noh, S. Yu, S.-J. Kim, W. Chang, W.C. Choi, K.Y. Chung, B.-W. Cho, Synthesis of layeredelayered xLi2MnO3$(1�x)LiMO2 (M¼ Mn, Ni, Co)nanocomposite electrodes materials by mechanochemical process, J. PowerSources 220 (2012) 422e429.
[12] W. West, R. Staniewicz, C. Ma, J. Robak, J. Soler, M. Smart, B. Ratnakumar,Implications of the first cycle irreversible capacity on cell balancing forLi2MnO3eLiMO2 (M¼ Ni, Mn, Co) Li-ion cathodes, J. Power Sources 196 (2011)9696e9701.
[13] J. Li, S. Jeong, R. Kloepsch, M. Winter, S. Passerini, Improved electrochemicalperformance of LiMO2 (M¼ Mn, Ni, Co)eLi2MnO3 cathode materials in ionicliquid-based electrolyte, J. Power Sources 239 (2013) 490e495.
[14] J. Molenda, M. Ziemnicki, J. Marzec, W. Zajac, M. Molenda, M. Bu�cko, Elec-trochemical and high temperature physicochemical properties of ortho-rhombic LiMnO2, J. Power Sources 173 (2007) 707e711.
[15] C. Yu, G. Li, X. Guan, J. Zheng, L. Li, T. Chen, Composites Li2MnO3$LiMn1/3Ni1/3Co1/3O2: optimized synthesis and applications as advanced high-voltagecathode for batteries working at elevated temperatures, Electrochim. Acta81 (2012) 283e291.
[16] Z. Su, Z. Lu, X. Gao, P. Shen, X. Liu, J. Wang, Preparation and electrochemicalproperties of indium-and sulfur-doped LiMnO2 with orthorhombic structureas cathode materials, J. Power Sources 189 (2009) 411e415.
[17] K.G. Gallagher, S.-H. Kang, S.U. Park, S.Y. Han, xLi2MnO3$(1�x) LiMO2 blendedwith LiFePO4 to achieve high energy density and pulse power capability,J. Power Sources 196 (2011) 9702e9707.
[18] J.-H. Lim, H. Bang, K.-S. Lee, K. Amine, Y.-K. Sun, Electrochemical character-ization of Li2MnO3eLi[Ni1/3Co1/3Mn1/3]O2eLiNiO2 cathode synthesized via co-precipitation for lithium secondary batteries, J. Power Sources 189 (2009)571e575.
[19] H. Shu, X. Wang, Q. Wu, B. Hu, X. Yang, Q. Wei, Q. Liang, Y. Bai, M. Zhou, C. Wu,Improved electrochemical performance of LiFePO4/C cathode via Ni and Mnco-doping for lithium-ion batteries, J. Power Sources 237 (2013) 149e155.
[20] E.M. Jin, B. Jin, Y.-S. Jeon, K.-H. Park, H.-B. Gu, Electrochemical properties ofLiMnO2 for lithium polymer battery, J. Power Sources 189 (2009) 620e623.
[21] L. Song, Z. Tang, Y. Chen, Z. Xiao, L. Li, H. Zheng, B. Li, Z. Liu, Structural analysisof layered Li2MnO3eLiMO2 (M¼ Ni1/3Mn1/3Co1/3, Ni1/2Mn1/2) cathode mate-rials by Rietveld refinement and first-principles calculations, Ceram. Int. 42(2016) 8537e8544.
[22] M. Tabuchi, H. Kageyama, K. Takamori, Y. Imanari, K. Nakane, Synthesis andelectrochemical characterization of Ni-and Ti-substituted Li2MnO3 positiveelectrode material using coprecipitationehydrothermalecalcination method,Electrochim. Acta 210 (2016) 105e110.
[23] J. Shojan, V.R. Chitturi, J. Soler, O. Resto, W.C. West, R.S. Katiyar, High energyxLi2MnO3e(1�x) LiNi2/3Co1/6Mn1/6O2 composite cathode for advanced Li-ionbatteries, J. Power Sources 274 (2015) 440e450.
[24] J. Patra, P.P. Dahiya, C.-J. Tseng, J. Fang, Y.-W. Lin, S. Basu, S.B. Majumder, J.-K. Chang, Electrochemical performance of 0.5Li2M-nO3e0.5Li(Mn0.375Ni0.375Co0.25)O2 composite cathode in pyrrolidinium-basedionic liquid electrolytes, J. Power Sources 294 (2015) 22e30.
[25] C. Hou, Y. Oaki, E. Hosono, H. Lin, H. Imai, Y. Fan, F. Dang, Bio-inspired syn-thesis of xLi2MnO3-(1�x)LiNi0.33Co0.33Mn0.33O2 lithium-rich layered cathodematerials, Mater. Des. 109 (2016) 718e725.
[26] A. Vu, Y. Qin, C.-K. Lin, A. Abouimrane, A.K. Burrell, S. Bloom, D. Bass, J. Bare~no,I. Bloom, Effect of composition on the voltage fade phenomenon in lithium-,manganese-rich xLiMnO3$(1�x)LiNiaMnbCocO2: a combinatorial synthesisapproach, J. Power Sources 294 (2015) 711e718.
[27] F. Yang, Q. Zhang, X. Hu, T. Peng, Synthesis of layered xLi2MnO3$(1�x)LiMnO2nanoplates and its electrochemical performance as Li-rich cathode materialsfor Li-ion battery, Electrochim. Acta 165 (2015) 182e190.
[28] B. Li, Y. Yu, J. Zhao, Facile synthesis of spherical xLi2MnO3$(1�x)Li(Mn0.33-Co0.33Ni0.33)O2 as cathode materials for lithium-ion batteries with improvedelectrochemical performance, J. Power Sources 275 (2015) 64e72.
[29] G. Xu, J. Li, X. Li, H. Zhou, X. Ding, X. Wang, F. Kang, Understanding theelectrochemical superiority of 0.6Li[Li1/3Mn2/3]O2-0.4Li[Ni1/3Co1/3Mn1/3]O2nanofibers as cathode material for lithium ion batteries, Electrochim. Acta 173(2015) 672e679.
[30] M. Tabuchi, Y. Nabeshima, T. Takeuchi, K. Tatsumi, J. Imaizumi, Y. Nitta, Fecontent effects on electrochemical properties of Fe-substituted Li2MnO3positive electrode material, J. Power Sources 195 (2010) 834e844.
[31] C. Miao, P. Bai, Q. Jiang, S. Sun, X. Wang, A novel synthesis and character-ization of LiFePO4 and LiFePO4/C as a cathode material for lithium-ion battery,J. Power Sources 246 (2014) 232e238.
[32] X. Dong, Y. Xu, L. Xiong, X. Sun, Z. Zhang, Sodium substitution for partiallithium to significantly enhance the cycling stability of Li2MnO3 cathodematerial, J. Power Sources 243 (2013) 78e87.
[33] S. Basu, P.P. Dahiya, M. Akhtar, S.K. Ray, J.K. Chang, S.B. Majumder, High en-ergy density layered-spinel hybrid cathodes for lithium ion rechargeablebatteries, Mater. Sci. Eng. B 213 (2016) 148e156.
[34] Y. Li, Y. Makita, Z. Lin, S. Lin, N. Nagaoka, X. Yang, Synthesis and character-ization of lithium manganese oxides with core-shell Li4Mn5O12@Li2MnO3structure as lithium battery electrode materials, Solid State Ionics 196 (2011)34e40.
[35] J. Pires, L. Timperman, A. Castets, J.S. Pe~na, E. Dumont, S. Levasseur,R. Dedryv�ere, C. Tessier, M. Anouti, Role of propane sultone as an additive toimprove the performance of a lithium-rich cathode material at a high po-tential, RSC Adv. 5 (2015) 42088e42094.
[36] J. Lin, D. Mu, Y. Jin, B. Wu, Y. Ma, F. Wu, Li-rich layered composite Li[Li0.2Ni0.2Mn0.6]O2 synthesized by a novel approach as cathode material forlithium ion battery, J. Power Sources 230 (2013) 76e80.
[37] P. Suresh, A.K. Shukla, N. Munichandraiah, Characterization of Zn-and Fe-substituted LiMnO2 as cathode materials in Li-ion cells, J. Power Sources 161(2006) 1307e1313.
[38] K.M. Shaju, G.V.S. Rao, B.V.R. Chowdari, EIS and GITT studies on oxide cath-odes, O2-Li(2/3)þx(Co0.15Mn0.85)O2 (x¼ 0 and 1/3), Electrochim. Acta 48 (2003)2691e2703.
[39] H. Zhao, S. Liu, X. Liu, M. Tan, Z. Wang, Y. Cai, S. Komarneni, OrthorhombicLiMnO2 nanorods as cathode materials for lithium-ion batteries: synthesisand electrochemical properties, Ceram. Int. 42 (2016) 9319e9322.


![Journal of Alloys and Compounds - nimte.ac.cn...thermal transport properties between magnetic refrigerants and heat-exchange medium [24]. Therefore, the Fe-based glassy alloys with](https://static.fdocuments.in/doc/165x107/60d2bd31873414242c6a7eb3/journal-of-alloys-and-compounds-nimteaccn-thermal-transport-properties-between.jpg)


![Journal of Alloys and Compounds - · PDF file Journal of Alloys and Compounds 509 (2011) ... a College of Math and Physics, ... the below formula [17]:](https://static.fdocuments.in/doc/165x107/5aa05da77f8b9a62178e072c/journal-of-alloys-and-compounds-journal-of-alloys-and-compounds-509-2011-.jpg)