Jotun Paints – Product Life Cycle Assessment - The Future Build
46
1 Jotun Paints – Product Life Cycle Assessment Prepared for: Ganesh Nayak and Vinayak Kumar (Jotun Abu Dhabi L.L.C.) Date: December 2008
Transcript of Jotun Paints – Product Life Cycle Assessment - The Future Build

1
Jotun Paints – Product Life Cycle Assessment
Prepared for: Ganesh Nayak and Vinayak Kumar (Jotun Abu Dhabi L.L.C.) Date: December 2008
2
Jotun Abu Dhabi LLC www.jotun.com
Client
dcarbon8 Ltd www.dcarbon8.com
Consultant
Henna Jain (Consultant), dcarbon8 Ltd
Document Preparation Signature
Tony Siantonas (Associate), dcarbon8 Ltd
Document Checking Signature
Andrew Marris (Managing Director), dcarbon8 Ltd
Document Authorisation Signature

3
EXECUTIVE SUMMARY
Project Overview
Jotun Paints, Abu Dhabi is an international manufacturer and supplier of paints, coatings and powder coatings with products ranging from decorative paints for the home to antifouling coatings for ships. Jotun Abu Dhabi manufactures two different kinds of paints - solvent based and water based.
Dcarbon8 was commissioned to carry out Life Cycle Assessment (LCA) for each of these paints and compare the environmental performance of the two systems. Penguard HB White, Penguard Texo White and Durathane White are solvent based and Jotashield Alkali Resistant Primer White and Jotashield Thermo White are water based.
This product carbon footprint report measures the climate change impact of the five paints manufactured by Jotun Paints, Abu Dhabi in the calendar year 2007. The methodologies used for analysis are IPCC (2007) Global Warming Potential (GWP) emissions factors for a 100-year timescale and Eco-indicator 99 ‘Ecopoints’.
Methodology
Measurement took place according to the Planet Positive Protocol Product Carbon Footprint Methodology, based on ISO 14044:2006 - Environmental Management - Life cycle assessment. The assessment covers all raw materials from cradle to factory gate, delivery to factory, factory activities and end of life management of products.
The functional unit to be reported on is one litre of paint manufactured in the calendar year of 2007.
Results – Carbon Calculation
Over this period and boundary, the emissions per litre from cradle to grave are as shown in Table1.

4
Eco-Indicator Impacts Value (AU) per litre
Climate Change Impacts (kg CO2e) per litre
Penguard HB 0.74 7.87
Penguard Texo 0.66 6.91
Durathane white 0.65 7.35
Jotashield Alkali 0.21 2.66
Jotashield Thermo 0.19 2.33
Table 1: Emissions per paint per functional unit (one litre) from cradle to grave.
Results – Carbon Reductions
Opportunities for GHG reductions in the embodied carbon footprint, in order of priority, include:
• Consider a take-back scheme for paint that is not used by customers. This can either be resold or recycled.
• Consider using pure acrylic resins that are naturally biodegradable.
• Consider alternates for pigments such as titanium dioxide - BIPHOR in water-based paints and plant derivatives, clay or earth pigments for solvent-based paints.
• Consider shifting more solvent-based paints to water-based as the as the embodied carbon of a solvent-based paint is approximately three times that of a water-based paint.
• Consider sourcing raw materials locally as their delivery also affects the total carbon footprint of the paint.
Sensitivity analysis done at 95% confidence level shows the error percentage for each paint as below.

5
Climate Change
Impacts (kg CO2e) per
litre
-95% confidence
(%)
+95% confidence
(%)
Range of Climate Change
Impacts (kg CO2e) per
litre
Penguard HB 7.87 8 12 7.24 – 8.81
Penguard Texo 6.91 12 26 6.08 – 8.71
Durathane white 7.35 5 8 7.33 – 7.94
Jotashield Alkali 2.66 21 47 2.10 – 3.91
Jotashield Thermo 2.33 11 21 2.07 – 2.82
Table 2: Sensitivity Analysis at 95% confidence interval.
Recommendations
dcarbon8 highlights the following recommendations, firstly regarding strategic sustainable procurement, and secondly regarding further work on this project.
Strategic Level
• Integrating overall Jotun sustainability priorities and principles into a procurement policy for Jotun products.
• Setting timetabled, prioritised targets. Sustainable procurement is commonly a slow process, and this report can be used as a proxy to the most environmentally harmful materials and how to target reductions against them.
• Integrating requirements for Environmental Product Declarations (EPDs – these are certified, supplier-specific emissions factors such as those provided in this report) for prioritised materials as part of the tender process. This can equally require demonstrable on site environmental management for all suppliers, such as the measurement and active reduction of water, energy, carbon and waste.

6
Product Level
• Full consultation undertaken with the product design team for sustainable materials enabling decisions to be fully informed and confidently reported upon.
• Engage with the product specific supply chain to provide low carbon materials to be sourced.
This project has provided interesting results on forming embodied carbon benchmarks for Jotun Paints, and it is hoped the results will allow the achievement of full supply chain carbon reductions in the future.

7
TABLE OF CONTENTS
EXECUTIVE SUMMARY ........................................................................................... 3 TABLE OF CONTENTS ............................................................................................. 7 INTRODUCTION ........................................................................................................ 8
Overview of Jotun Paints ................................................................................................. 8
Product Lifecycle .............................................................................................................. 8
CALCULATION METHODOLOGY .......................................................................... 10 Goal .................................................................................................................................. 10
Scope ................................................................................................................................ 10
EMISSIONS CALCULATION .................................................................................. 13 RESULTS ................................................................................................................ 15
Product Description ........................................................................................................ 15
Electricity ......................................................................................................................... 16
Packaging ........................................................................................................................ 17
Delivery ............................................................................................................................ 17
Application/Use/Expected Lifetime ............................................................................... 17
Sustainability Recommendations .................................................................................. 37
Next steps & Further Research ...................................................................................... 38
Sensitivity Analysis ......................................................................................................... 39
CONCLUSION ......................................................................................................... 42 REFERENCES & NOTES ........................................................................................ 43 APPENDIX ............................................................................................................... 44

8
INTRODUCTION
Overview of Jotun Paints
Jotun Paints, Abu Dhabi, UAE is an international manufacturer and supplier of paints, coatings and powder coatings with products ranging from decorative paints for the home to antifouling coatings for ships. This product carbon footprint report measures the climate change and overall environmental impact of each of the five paints manufactured by Jotun Paints, Abu Dhabi in the year 2007. Three of these paints – Penguard HB White, Penguard Texo White and Durathane White – are solvent based and two paints – Jotashield Alkali Resistant Primer and Jotashield Thermo White – are water based.
Jotun’s corporate SHE strategy comprehensively covers essential actions to minimize environmental impact of manufacturing paint such as phasing out hazardous materials, controlling emissions, treating wastes to local authority requirements before release, etc. This study also demonstrates Jotun’s commitment to making further reductions in global Greenhouse Gas (GHG) emissions by adopting sustainability initiatives associated with manufacturing paint (i.e. embodied carbon).
It is important to realise in this case that Jotun does not have complete ownership of GHG emissions (as Scope 1 or 2 emissions under the GHG Protocol), since apart from the manufacture stage, upstream and downstream impacts belong to other organisations. Therefore, a supply chain assessment is essential to demonstrate the full breadth of carbon impacts.
Product Lifecycle
Electricity and fuels are required throughout a product’s lifecycle. This begins with the initial extraction and refining of raw materials, through to their delivery, factory manufacture, delivery to customers and final disposal at end of life.
A large range of environmental impacts result through this lifecycle, from the toxicological and health effects of airborne emissions, to the societal and biodiversity impacts of these activities. Alongside these, the broad ranging impacts of climate change have come to the forefront of political, legislative and commercial agendas.
This impact assessment project measures the gases with a global warming potential, measured in carbon dioxide equivalent (CO2e), resulting from the full life cycle of Jotun paint in the calendar year of 2007 as well as the emissions as a result of delivery of the product to

9
the customer and emissions of compounds during application. This is known as “embodied carbon”, and allows the total emissions from this lifecycle to be expressed as a function of each product unit manufactured per year.
A second methodology is employed to generate a ‘single score’ for environmental performance. Scores are based on an impact assessment methodology that transforms data covering 11 environmental impacts into damage scores aggregated and normalised to one single score. Environmental impacts assessed are as follows: carcinogens, respiratory organics, respiratory inorganics, climate change, radiation, ozone layer, ecotoxicity, acidification/eutrophication, land use, minerals and fossil fuels. The final score has no units and is used for comparison purposes only. A higher score indicates a greater environmental impact and likewise a lower score indicates a lower environmental impact.
This type of assessment is known as a Life Cycle Assessment (LCA).
10
CALCULATION METHODOLOGY
Goal
The goal of this product carbon footprint is to provide a detailed, quantified embodied carbon footprint and a single score to quantify impacts ranging from carcinogens to fossil fuel use, for Jotun Paints, in strict accordance with the Planet Positive Protocol. This will allow carbon footprint figures to be disclosed to all stakeholders, from shareholders to company employees and the higher supply chain.
Scope
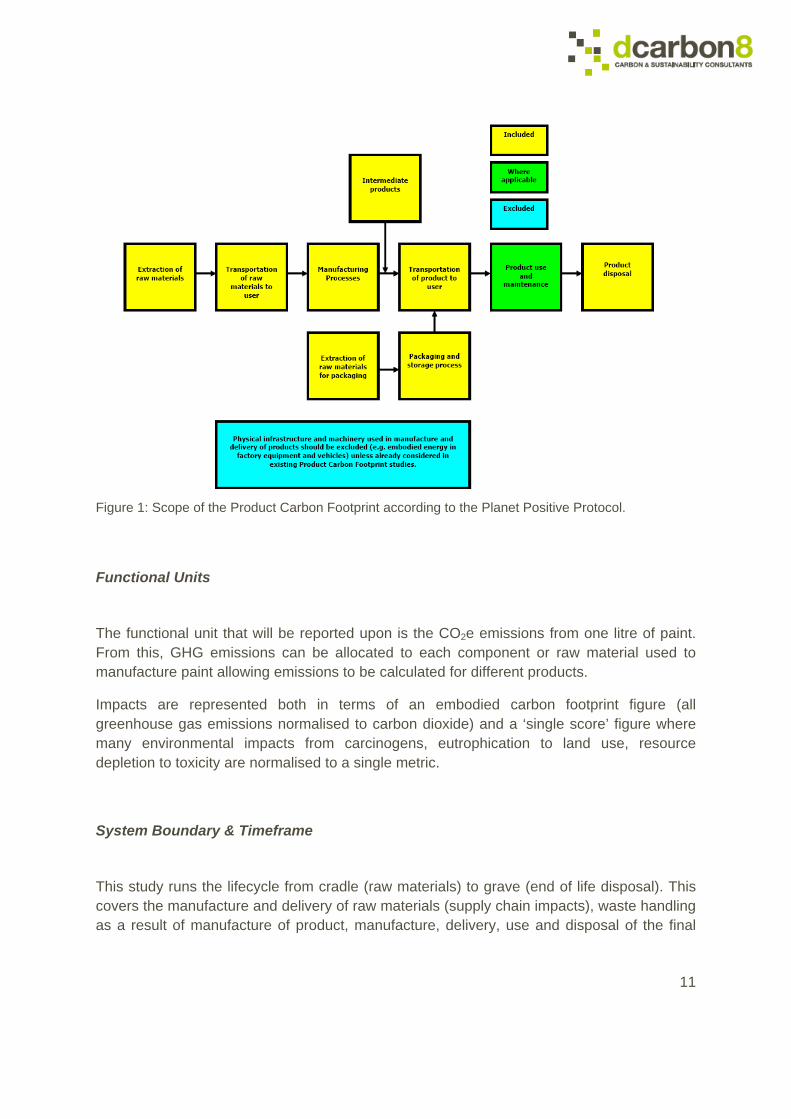
The scope of this life cycle analysis is from cradle to grave, covering the stages in yellow in Figure 3 below. Product disposal is based on 2008 end of life disposal scenarios. All specific materials and deliveries from direct suppliers are included. Manufacturing energy (electricity, gas etc) used in the factory is then measured. The materials, delivery and transportation of product packaging are also incorporated as well as emissions of compounds during application.
11
Figure 1: Scope of the Product Carbon Footprint according to the Planet Positive Protocol.
Functional Units
The functional unit that will be reported upon is the CO2e emissions from one litre of paint. From this, GHG emissions can be allocated to each component or raw material used to manufacture paint allowing emissions to be calculated for different products.
Impacts are represented both in terms of an embodied carbon footprint figure (all greenhouse gas emissions normalised to carbon dioxide) and a ‘single score’ figure where many environmental impacts from carcinogens, eutrophication to land use, resource depletion to toxicity are normalised to a single metric.
System Boundary & Timeframe
This study runs the lifecycle from cradle (raw materials) to grave (end of life disposal). This covers the manufacture and delivery of raw materials (supply chain impacts), waste handling as a result of manufacture of product, manufacture, delivery, use and disposal of the final
12
product (downstream, customer impacts). Following the average 10 year product lifetime, the product is then assumed to be landfilled.
The period of this Life Cycle Analysis is the calendar year of 2007.
Exclusions
The following exclusions have been made from this LCA:
• Upkeep of roads, ports and airports involved in transportation
• Capital goods (machinery, transportation equipment etc)
• Replacement of machinery parts for equipment used in the manufacturing of the product
• Carbon sequestration by natural products (e.g. timber)
• Packaging materials reused many times such as pallets, steel drums etc.
Assumptions and Limitations
All assumptions and limitations are stated within the data results. Close consideration was given to two important areas of accuracy; (1) annual supplier material quantities and (2) CO2e emissions factors.
It is assumed that upon application, curing of the paint occurs as a result of evaporation of all the solvent and/or water in the paint.
Additionally, the LCA includes transportation of the paint from the premises of Jotun Paints to Masdar. Hence, the results of this LCA are limited to UAE only and will not be indicative of the carbon impact of the product outside the UAE.
In accordance with the Planet Positive Protocol, any use of emissions factors for wood disregarded the biogenic uptake of carbon dioxide absorbed by wood during tree growth. Electricity emissions are based on country specific electricity fuel mixes.

13
EMISSIONS CALCULATION
Climate Change
The calculation methodology uses IPCC (2007) Global Warming Potential (GWP) emissions factors for a 100-year timescale. The carbon footprint measurement covers the six principle Kyoto gases – carbon dioxide (CO2) sulphur hexafluoride (SF6), methane (CH4), nitrous oxide (N2O), hydrofluorocarbons (HFCs) and perfluorocarbons (PFCs). As each of these gases has differing Global Warming Potential, the final figure is expressed in carbon dioxide equivalent (CO2e).
Modelling took place using Life Cycle Analysis software SimaPro. Material, fuel and energy processes use the EcoInvent database (v2.0, 2008), containing 4,000 unit and system processes. The sources of emissions factors are clearly stated at all times and are selected according the following order of decreasing importance:
• Source and facility specific emissions factors
• Regional/national emissions factors
• Generic industry standard emissions factors
Data on quantities of materials and relative amounts of corresponding energy are based on direct measurements (for example transportation distance) and overall manufacturing energy requirements in 2007. This can then be split down to give specific CO2e emissions for product types.
Eco-Indicator ‘Ecopoints’
The calculation methodology used to generate a ‘single score’ for environmental performance was Eco-indicator 99 ‘Ecopoints’. Again, modelling took place using Life Cycle Assessment software SimaPro.
Scores are based on an impact assessment methodology that transforms data covering 12 environmental impacts into damage scores which can be aggregated and normalised to one single score. Environmental impacts assessed are as follows: carcinogens, respiratory organics, respiratory inorganics, climate change (GHGs), radiation, ozone depleting substances, ecotoxicity, acidification, eutrophication, land use, minerals and fossil fuels.

14
The final score has normalised units known as ‘Ecopoints’ and hence is used for comparison purposes only. A higher score indicates a greater environmental impact and likewise a lower score indicates a lower environmental impact.
The calculations for the product LCA required the following steps:
1. The operations/technical manager at Jotun was provided with a detailed spreadsheet for data collection. This included all the information that would be necessary for the LCA of each paint such as raw materials, delivery, electricity consumption etc.
2. Total masses in kilograms of each raw material (including packaging) were collected from a member of the technical team at Jotun Paints.
3. For each raw material, the manufacturer location and delivery method were noted.
4. The carbon dioxide equivalent emissions factors for the delivery of the materials were applied according to the distance travelled and the vehicle type. These are based on emissions per tonne kilometre.
5. The disposal method was noted in detail for each waste material.
6. Energy associated with manufacture of each product was collected.
7. Factory data accuracy was assessed by comparing the mass of ordered raw materials (inputs) to the mass all product units and waste (outputs). This ensures the emissions for all materials and waste streams are accounted for.
8. The distance for delivery of the final product was given as 33km.
9. The lifetime of the product is given to be 10 years, after which all products were assumed to be landfilled at the end of life.
10. All solvent was assumed to evaporate and enter the atmosphere during application and curing of paint.
11. All emissions to air, water and soil were captured by inputting all data into SimaPro.
12. IPCC (2007) and Eco-Indicator methodologies were modelled to assess and quantify environmental impacts associated with all emissions of matter.
13. Due to the detailed level of data collected, the LCA was performed such that the final impacts could be allocated among each material.

15
RESULTS
Product Description
This study assesses five products of Jotun Paints (Abu Dhabi), three of which are solvent-based – Penguard HB, Penguard Texo and Durathane White and the other two water-based – Jotashield Alkali Resistant Primer and Jotashield Thermo. Table 3 shows the raw materials used for each paint.
Material Function
Penguard HB
Penguard Texo
Durathane White
Jotashield Alkali Resistant Primer
Jotashield Thermo
Resin
- -
Solvent
Thickener
Additive
Pigment
Extender -
-
-
Binder - - -
Filler - - - -
Table 3: Raw materials used by Jotun Paints for the manufacture of each paint.
16
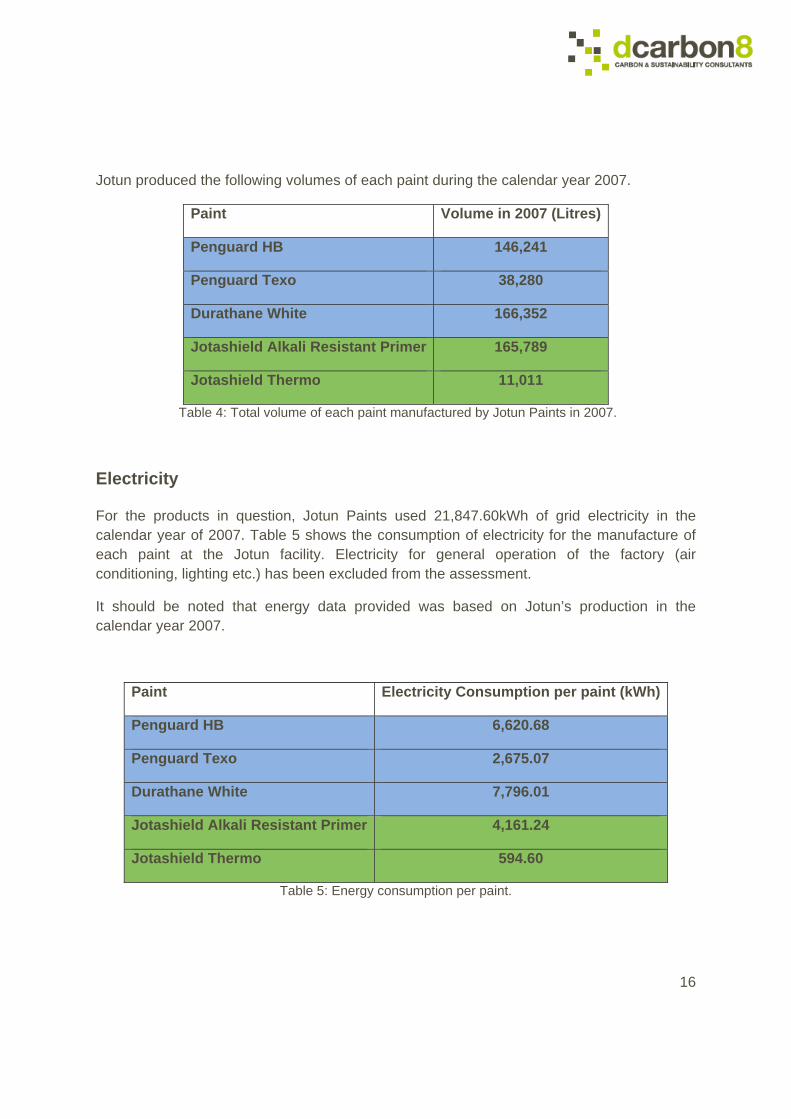
Jotun produced the following volumes of each paint during the calendar year 2007.
Paint Volume in 2007 (Litres)
Penguard HB 146,241
Penguard Texo 38,280
Durathane White 166,352
Jotashield Alkali Resistant Primer 165,789
Jotashield Thermo 11,011
Table 4: Total volume of each paint manufactured by Jotun Paints in 2007.
Electricity
For the products in question, Jotun Paints used 21,847.60kWh of grid electricity in the calendar year of 2007. Table 5 shows the consumption of electricity for the manufacture of each paint at the Jotun facility. Electricity for general operation of the factory (air conditioning, lighting etc.) has been excluded from the assessment.
It should be noted that energy data provided was based on Jotun’s production in the calendar year 2007.
Paint Electricity Consumption per paint (kWh)
Penguard HB 6,620.68
Penguard Texo 2,675.07
Durathane White 7,796.01
Jotashield Alkali Resistant Primer 4,161.24
Jotashield Thermo 594.60
Table 5: Energy consumption per paint.

17
Packaging
The packaging of raw material arriving at Jotun consists of metal drums, wooden pallets, plastic tote and paper or cardboard. Of these only cardboard is landfilled at a municipal approved site and hence is included in the life cycle assessment of the paint. Other packaging is reused several times before it is recycled or disposed. Consequently, the embodied carbon of packaging material other than cardboard is excluded from the assessment as its contribution to the final carbon footprint is extremely small. This exclusion is acceptable in the Planet Positive protocol, which states that components contributing to less than 2 per cent of total inputs may be excluded.
Delivery
The final product is delivered 33km from the manufacturing site of Jotun Paints by a 16-32 tonne lorry.
Application/Use/Expected Lifetime
Upon application of paint and its curing all the solvent and/or water is evaporated. During its 10 year lifetime, the paint does not produce any carbon emissions. As a result, emissions during product use were not considered. (When a product uses energy such as a television or a building, operational lifetime is commonly a more important consideration.)
Embodied Carbon Impacts - Results
Overall Results
Table 6 and Figure 1 below show values for the climate change impact and aggregated environmental impacts (Eco-Indicator) associated with each of the products.

18
Eco-Indicator Impacts Value (AU)
Climate Change Impacts (kg CO2e)
Penguard HB 0.74 7.87
Penguard Texo 0.66 6.91
Durathane white 0.65 7.35
Jotashield Alkali 0.21 2.66
Jotashield Thermo 0.19 2.33
Table 6: Overall environmental impact values of all 5 Jotun products for comparison per litre
Figure 2: Overall environmental impact values of all 5 Jotun products for comparison.
Comparison between Systems
The average values of all products belonging to each system (organic solvent and water based) are presented below in Table 7 and Figure 2 to give an indication of their comparative environmental performance.

19
Eco-Indicator Impacts Value
(AU)
Climate Change Impacts (kg CO2e)
Organic solvent system 0.68 7.38
Water based system 0.20 2.50
Table 7: Average values for each system for comparison per litre.
Figure 3: Average values for each system for comparison.
Climate Change Impacts per Component
Table 8 and Figures 4 – 8 demonstrate the split of total embodied carbon between major components of the paints. This includes life cycle stages of raw material acquisition and processing (including packaging), delivery to factory. Energy use and waste created during manufacture, application and end of life are included in the total.

20
Peng
uard
HB
whi
te
Peng
uard
Tex
o w
hite
Dur
atha
ne w
hite
Jota
shie
ld A
lkal
i R
esis
tant
Prim
er
whi
te
Jota
shie
ld T
herm
o w
hite
Solvent- Climate Change Impact (kg CO2e)
0.50
0.19
0.48
<0.01
<0.01
Pigment- Climate Change Impact (kg CO2e)
2.73
1.83
1.39
0.28
0.53
Additives- Climate Change Impact (kg CO2e)
0.01
<0.01
0.03
0.19
0.25
Extender- Climate Change Impact (kg CO2e)
n/a <0.01
n/a 0.09
n/a
Thickener- Climate Change Impact (kg CO2e)
0.01 0.09 <0.01 0.40 0.06
Resin/Binder- Climate Change Impact (kg CO2e)
3.20
3.53
4.47
0.32
0.61
Filler- Climate Change Impact (kg CO2e) n/a n/a n/a n/a 0.11
TOTAL (inc. energy, final delivery, waste, disposal) (kg CO2e)
7.87 6.91 7.35 2.66 2.33
Table 8: Total embodied carbon break down per component for each product.

21
Figure 4: Penguard HB White Total embodied carbon break down per component.
Figure 5: Penguard Texo White Total embodied carbon break down per component.
7.87 kg CO2e
6.91 kg CO2e

22
Figure 6: Durathane White Total embodied carbon break down per component.
Figure 7: Jotashield Alkali Resistant Primer White Total embodied carbon break down per component.
7.35 kg CO2e
2.66 kg
CO2e
23
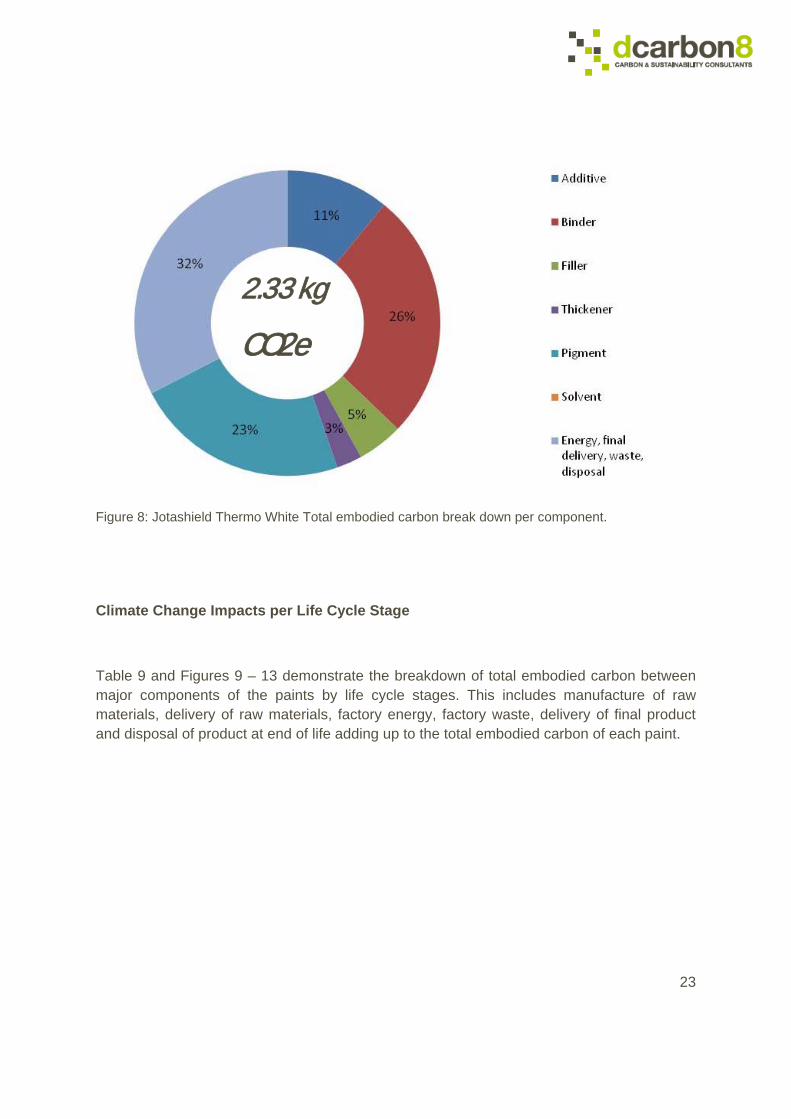
Figure 8: Jotashield Thermo White Total embodied carbon break down per component.
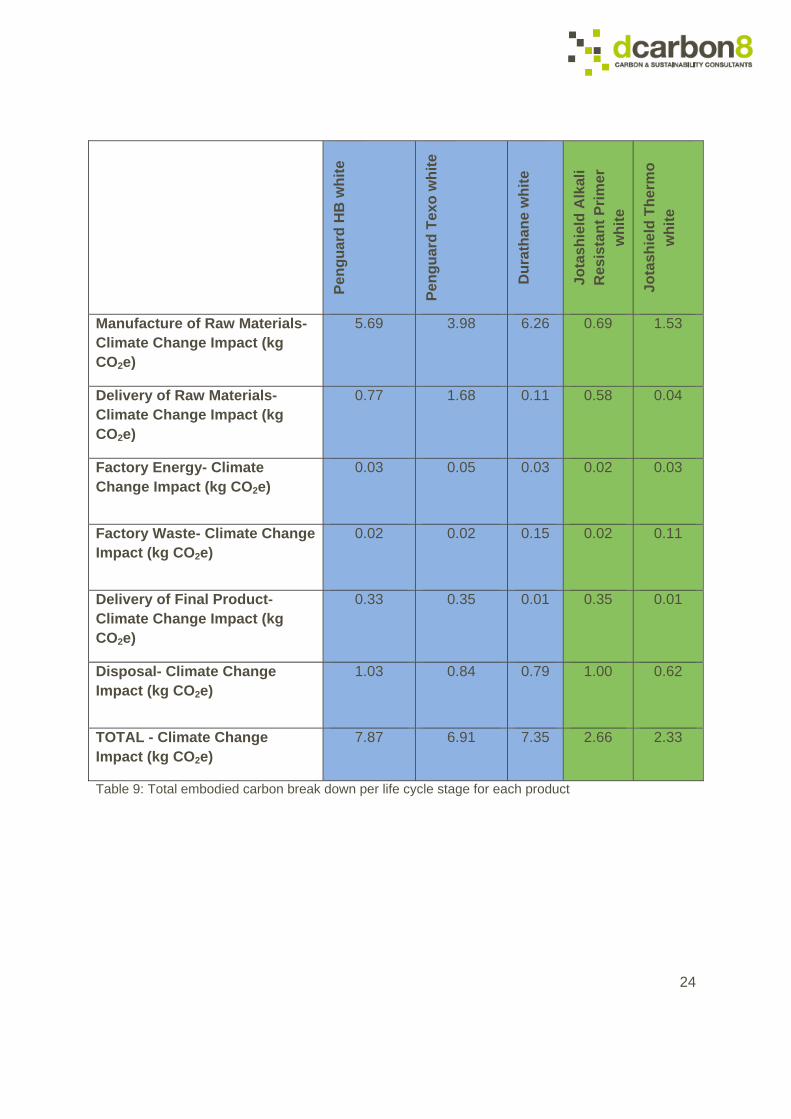
Climate Change Impacts per Life Cycle Stage
Table 9 and Figures 9 – 13 demonstrate the breakdown of total embodied carbon between major components of the paints by life cycle stages. This includes manufacture of raw materials, delivery of raw materials, factory energy, factory waste, delivery of final product and disposal of product at end of life adding up to the total embodied carbon of each paint.
2.33 kg
CO2e
24
Peng
uard
HB
whi
te
Peng
uard
Tex
o w
hite
Dur
atha
ne w
hite
Jota
shie
ld A
lkal
i R
esis
tant
Prim
er
whi
te
Jota
shie
ld T
herm
o w
hite
Manufacture of Raw Materials- Climate Change Impact (kg CO2e)
5.69
3.98
6.26
0.69
1.53
Delivery of Raw Materials- Climate Change Impact (kg CO2e)
0.77
1.68
0.11
0.58
0.04
Factory Energy- Climate Change Impact (kg CO2e)
0.03
0.05
0.03
0.02
0.03
Factory Waste- Climate Change Impact (kg CO2e)
0.02
0.02
0.15
0.02
0.11
Delivery of Final Product- Climate Change Impact (kg CO2e)
0.33
0.35
0.01
0.35
0.01
Disposal- Climate Change Impact (kg CO2e)
1.03
0.84
0.79
1.00
0.62
TOTAL - Climate Change Impact (kg CO2e)
7.87 6.91 7.35 2.66 2.33
Table 9: Total embodied carbon break down per life cycle stage for each product

25
Figure 9: Penguard HB White Total embodied carbon break down per life cycle stage.
Figure 10: Penguard Texo White Total embodied carbon break down per life cycle stage.
7.87 kg CO2e
6.91 kg CO2e

26
Figure 11: Durathane White Total embodied carbon break down per life cycle stage.
Figure 12: Jotashield Alkali Resistant Primer White Total embodied carbon break down per life cycle stage.
7.35 kg CO2e
2.66 kg
CO2e

27
Figure 13: Jotashield Thermo White Total embodied carbon break down per life cycle stage.
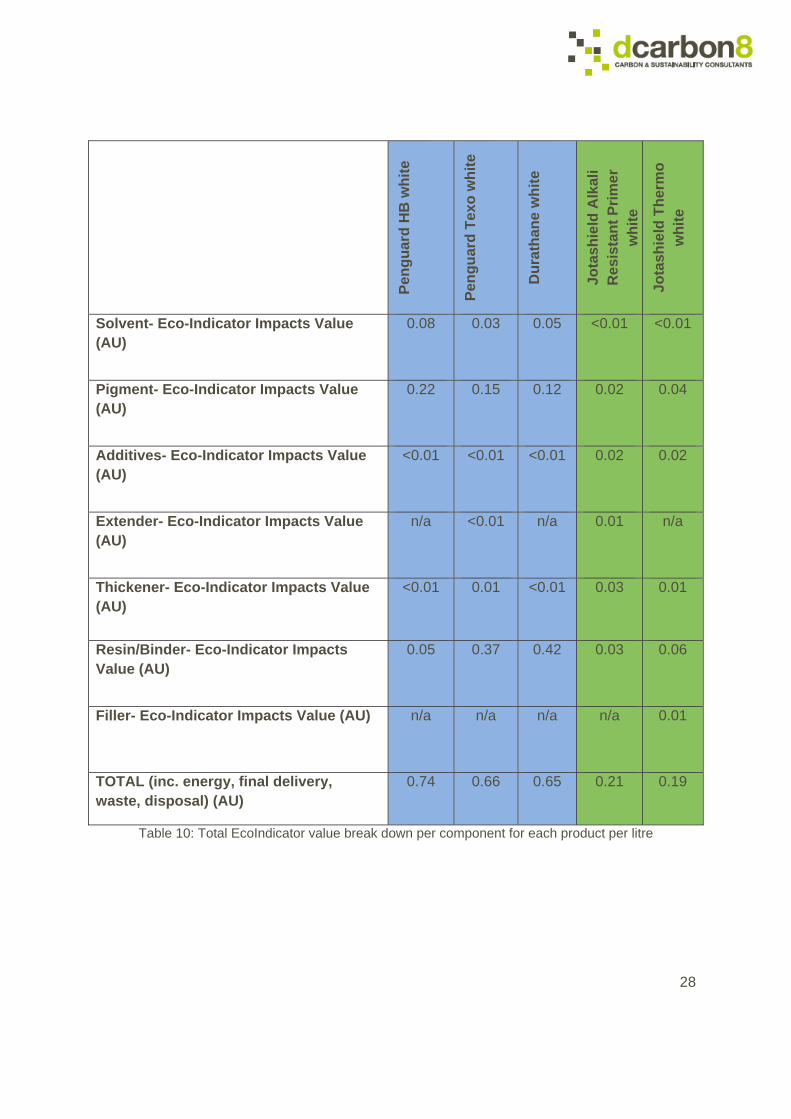
EcoIndicator Environmental Impacts per Component
Table 10 and Figures 14 – 18 demonstrate the split of total EcoIndicator value between major components of the paints. This includes life cycle stages of raw material acquisition and processing (including cardboard packaging), delivery to factory. Energy use and waste created during manufacture, application and end of life are included in the total.
2.66 kg
CO2e
28
Peng
uard
HB
whi
te
Peng
uard
Tex
o w
hite
Dur
atha
ne w
hite
Jota
shie
ld A
lkal
i R
esis
tant
Prim
er
whi
te
Jota
shie
ld T
herm
o w
hite
Solvent- Eco-Indicator Impacts Value (AU)
0.08
0.03
0.05
<0.01
<0.01
Pigment- Eco-Indicator Impacts Value (AU)
0.22
0.15
0.12
0.02
0.04
Additives- Eco-Indicator Impacts Value (AU)
<0.01
<0.01
<0.01
0.02
0.02
Extender- Eco-Indicator Impacts Value (AU)
n/a <0.01
n/a 0.01
n/a
Thickener- Eco-Indicator Impacts Value (AU)
<0.01 0.01 <0.01 0.03 0.01
Resin/Binder- Eco-Indicator Impacts Value (AU)
0.05
0.37
0.42
0.03
0.06
Filler- Eco-Indicator Impacts Value (AU) n/a n/a n/a n/a 0.01
TOTAL (inc. energy, final delivery, waste, disposal) (AU)
0.74 0.66 0.65 0.21 0.19
Table 10: Total EcoIndicator value break down per component for each product per litre
29
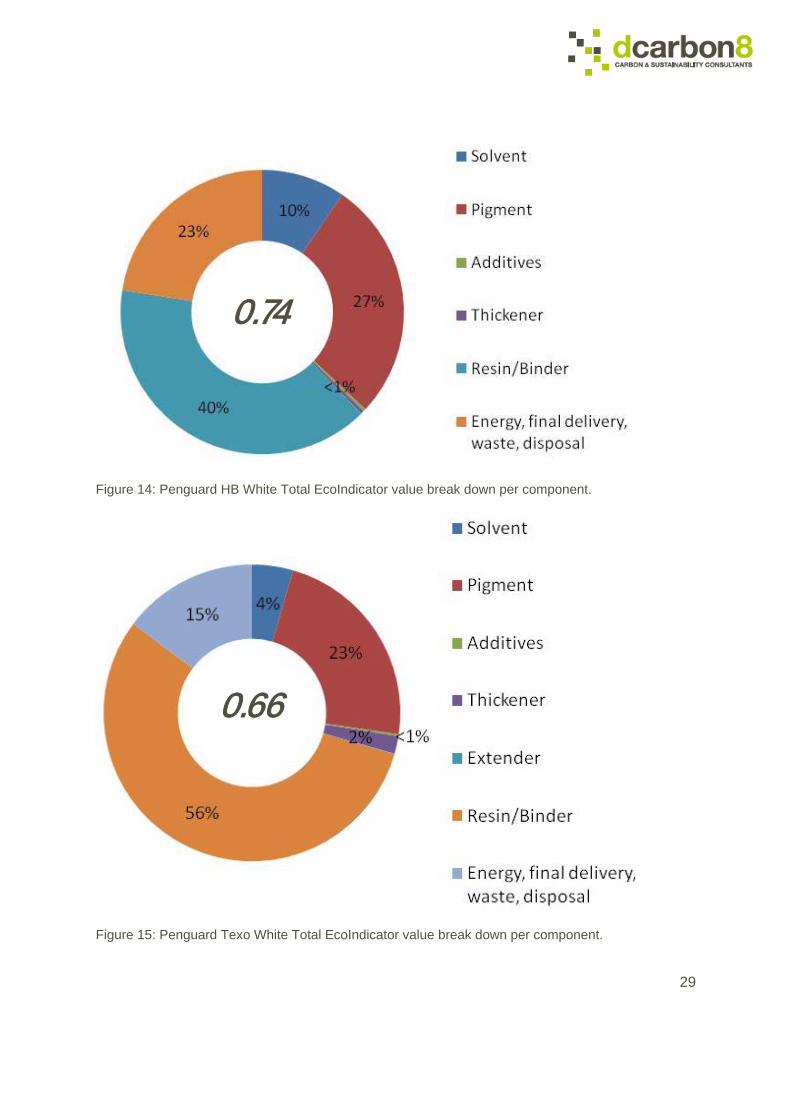
Figure 14: Penguard HB White Total EcoIndicator value break down per component.
Figure 15: Penguard Texo White Total EcoIndicator value break down per component.
0.74
0.66

30
Figure 16: Durathane White Total EcoIndicator value break down per component.
Figure 17: Jotashield Alkali Resistant Primer White Total EcoIndicator value break down per component.
0.65
0.21
31
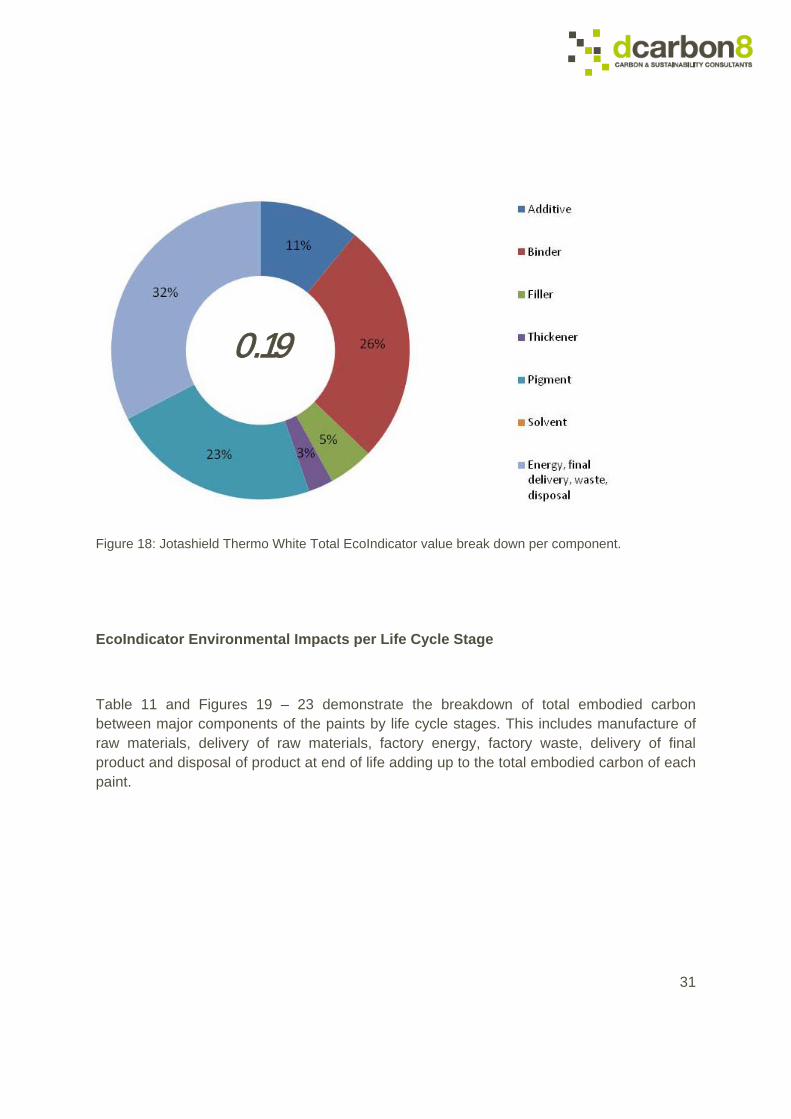
Figure 18: Jotashield Thermo White Total EcoIndicator value break down per component.
EcoIndicator Environmental Impacts per Life Cycle Stage
Table 11 and Figures 19 – 23 demonstrate the breakdown of total embodied carbon between major components of the paints by life cycle stages. This includes manufacture of raw materials, delivery of raw materials, factory energy, factory waste, delivery of final product and disposal of product at end of life adding up to the total embodied carbon of each paint.
0.19

32
Peng
uard
HB
whi
te
Peng
uard
Tex
o w
hite
Dur
atha
ne w
hite
Jota
shie
ld A
lkal
i R
esis
tant
Prim
er
whi
te
Jota
shie
ld T
herm
o w
hite
Manufacture of Raw Materials- Eco-Indicator Impacts Value (AU)
0.55 0.41 0.58 0.06 0.13
Delivery of Raw Materials- Eco-Indicator Impacts Value (AU)
0.01 0.15 0.01 0.05 0.01
Factory Energy- Eco-Indicator Impacts Value (AU)
<0.01 <0.01 <0.01 <0.01 <0.01
Factory Waste- Eco-Indicator Impacts Value (AU)
<0.01 <0.01 0.01 0.001 0.01
Delivery of Final Product- Eco-Indicator Impacts Value (AU)
0.03 0.03 <0.01 <0.01 <0.01
Disposal- Eco-Indicator Impacts Value (AU)
0.07 0.05 0.05 0.07 0.04
TOTAL - Eco-Indicator Impacts Value (AU)
0.74 0.66 0.64 0.21 0.18
Table 11: Total EcoIndicator value break down per life cycle stage for each product.

33
Figure 19: Penguard HB White Total EcoIndicator value break down per life cycle stage.
Figure 20: Penguard Texo White Total EcoIndicator value break down per life cycle stage.
0.74
0.66

34
Figure 21: Durathane White Total EcoIndicator value break down per life cycle stage.
Figure 22: Jotashield Alkali Resistant Primer White Total EcoIndicator value break down per life cycle stage.
0.65
0.21

35
Figure 23: Jotashield Thermo White Total EcoIndicator value break down per life cycle stage.
0.19
36
ANALYSIS & DISCUSSION
The life-cycle assessment of the five paints using the IPCC (2007) methodology shows that the total carbon footprint of solvent-based paints is about three times the total carbon footprint of water-based paints. This is due to the use of organic solvents in comparison to use of water.
For life cycle assessment by life cycle stages, manufacture of raw materials accounts for an average of 72 percent of the total carbon footprint of solvent-based paints. This can be attributed to Jotun’s use of highly energy intensive raw materials particularly resins and organic solvents. This is followed by disposal of paint at end of life accounting for an average of 12 percent of the total carbon footprint. Other life cycle stages such as delivery of raw materials, energy consumed during manufacture, disposal of factory waste and delivery of the paints have fairly low contributions to the total carbon footprint of the paint.
Among the water-based paints, Jotashield Thermo White follows the same pattern as that of solvent-based paints. In other words, for Jotashield Thermo White, 66 percent of the total carbon footprint is attributed to raw material manufacture and 26 percent to disposal at end of life. Jotashield Alkali Resistant Primer White, on the other hand, emits more carbon during disposal (38 percent) followed by manufacture of raw materials (26 percent) of the total carbon footprint. The difference in pattern of the two water-based paints can be attributed to additional requirement of raw material i.e. fillers for Jotashield Thermo White and none is required for Jotashield Alkali Resistant Primer White.
For life cycle assessment by component such as solvent, resin, thickener etc, most (~48 percent) of the total carbon footprint is attributed to resins followed by pigment (~30 percent) for solvent-based paints. Among the water-based paints, energy, final delivery and waste disposal contribute most (~42 percent) to the total carbon footprint followed by binder (average ~19 percent).
The overall analysis of the five paints using Ecoindicator methodology follows the same pattern as that of IPCC (2007) i.e. the total footprint of solvent-based paints is about three times that of water-based paints, which is due to the use of organic solvents versus the use of water. Looking at the assessment in terms of life cycle stages shows that raw material manufacture contributes significantly, average of 75 percent, to the total footprint of solvent –based paints. Jotashield Thermo White, water-based paint, has the same pattern as that of solvent-based paints and raw material manufacture contributes 72 percent to its total footprint. Jotashield Alkali Resistant Primer White has more contributions (30 percent) from disposal of the paint at end of life closely followed by contributions from raw material manufacture. Results obtained from Ecoindicator analysis follow the same pattern as that of IPCC (2007).

37
Analysing the results by component, largest contributions from resins are seen in Penguard HB White and Penguard Texo White. Further analysis of the 11 impacts considered in Ecoindicator shows high dependence on fossil fuels for the manufacture of resins. For Durathane White, Jotashield Alkali Resistant Primer White and Jotashield Thermo White largest contribution to the total footprint comes from energy use during manufacture of paint, disposal of waste from raw material packaging and from manufacturing of paint, delivery of the final product to customer and finally disposal of paint at the end of its life. Again, energy use is heavily dependent on the use of fossil fuels.
An analysis of the contribution of each raw material of the paint to the total carbon footprint is presented in the Appendix.
Sustainability Recommendations
Strategic Level
It is important to remember that carbon is but one sustainability impact among many, which range from ecotoxicity and eutrophication to ethical sourcing and cost effectiveness. Overall, driving down carbon is a single factor in sustainable procurement, for which strategic recommendations are as follows:
• Integrating Jotun’s overall sustainability priorities and principles into a procurement policy for products. This can include sustainable sourcing workshops and decision-making frameworks for procurement, product and sustainability managers.
• Setting timetabled, prioritised targets. Sustainable procurement is commonly achieved slowly, and this report can be used as a proxy to the most environmentally harmful materials and how to target reductions against them.
• Integrating requirements for Environmental Product Declarations (EPDs) or product carbon footprints for prioritised materials as part of the tender process. EPDs are certified LCAs for products ensuring a high quality study and supplier specific emission factors (such as this report). This requirement can equally demand on site environmental management for all suppliers, such as the measurement and active reduction of water, energy, carbon and waste.
Product Level
Following the steps set out at a strategic level, the following product level recommendations are made:
38
• Consider a take-back scheme for paint that is not used by customers. This can either be resold or recycled.
• Consider using pure acrylic resins that are naturally biodegradable.
• Consider alternatives for pigments such as titanium dioxide, such as BIPHOR in water-based paints and plant derivatives, or clay or earth pigments for solvent-based paints.
• Consider shifting the solvent-based paints to water-based as the embodied carbon of a solvent-based paint is three times that of a water-based paint.
• Consider sourcing raw materials locally as their delivery also impacts the total carbon footprint of the paint.
• For products still at the design and specification stage, full consultation should be undertaken with the design team for sustainable materials. This enables decisions to be fully informed and confidently reported upon.
• Jotun Paints should engage with its immediate supply chain to provide low carbon materials.
• Learning and data from this assessment should be shared with Jotun’s product research team, and the results rolled onto new products to ensure continual integration of sustainability within products.
Next steps & Further Research
Since the life cycle assessment of the paints shows that raw material manufacturing, particularly resins and energy consumption at different stages of paint manufacture contribute highly to the total footprint of each paint, it is recommended that Jotun considers incorporating certain measures to curb the impact on the environment. These measures should cover:
• Requiring life cycle assessment of resins that are used to manufacture Jotun paints
• Increasing waste recycling rates and diversion from landfill
• Electricity sub-metering for various products
39
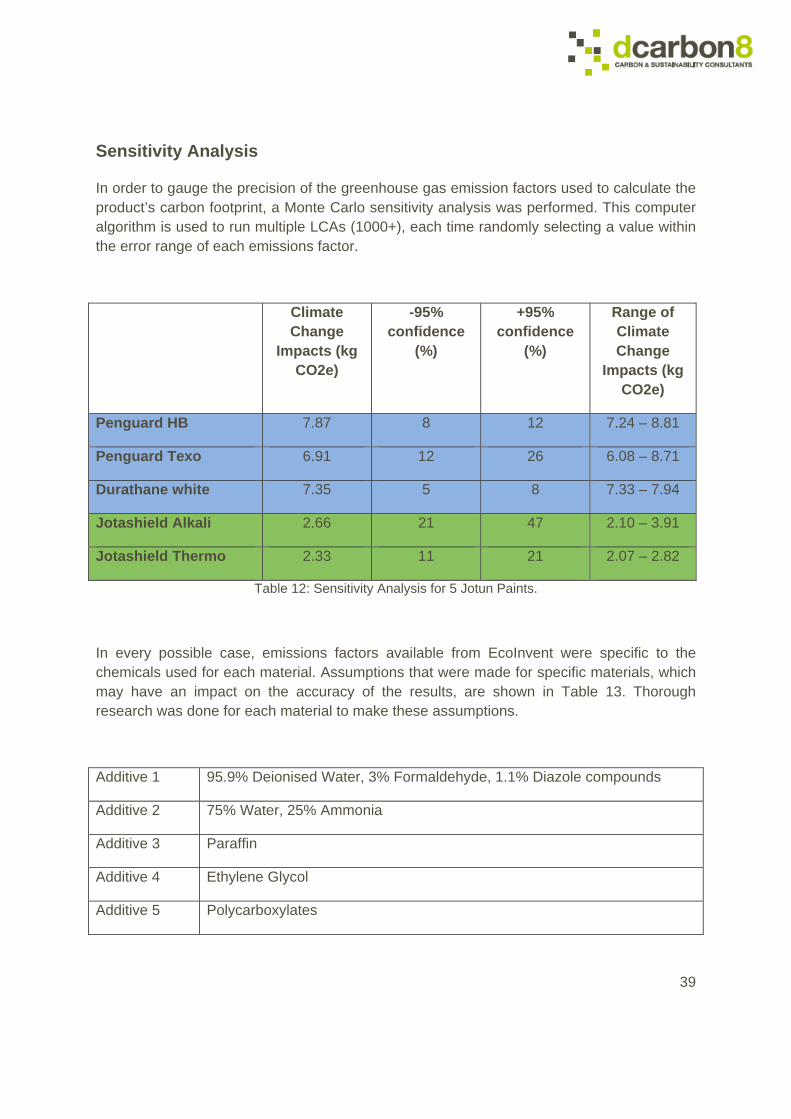
Sensitivity Analysis
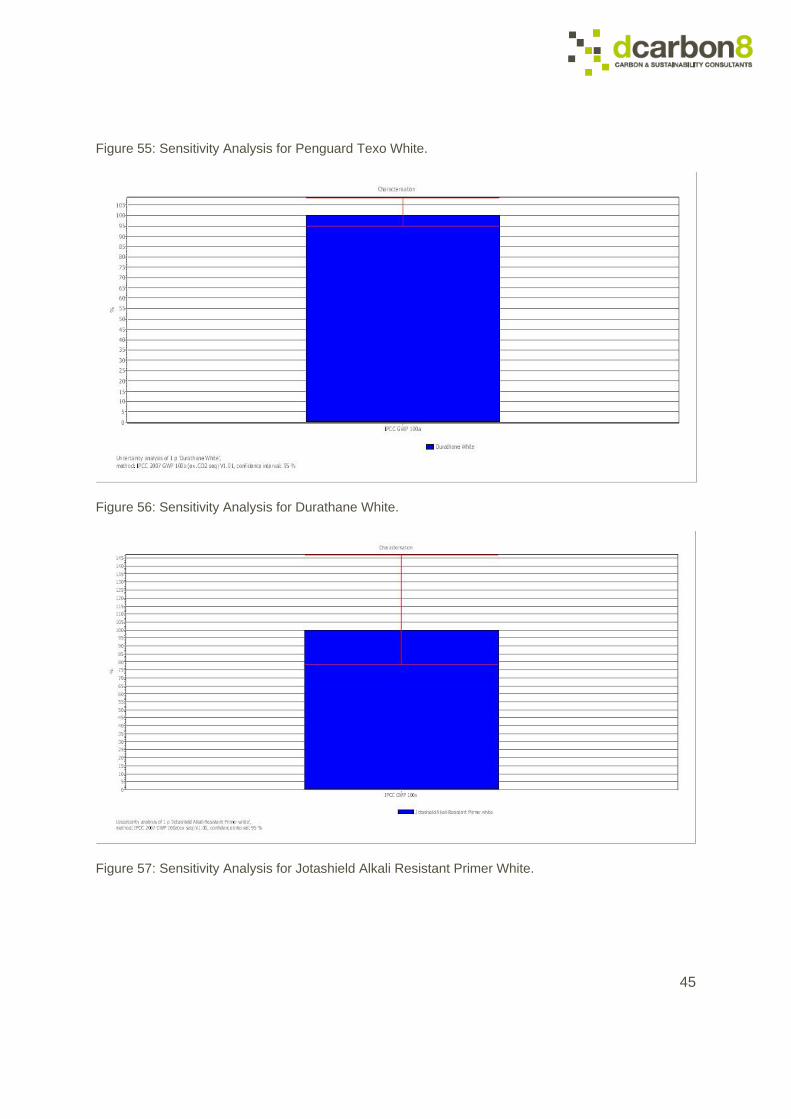
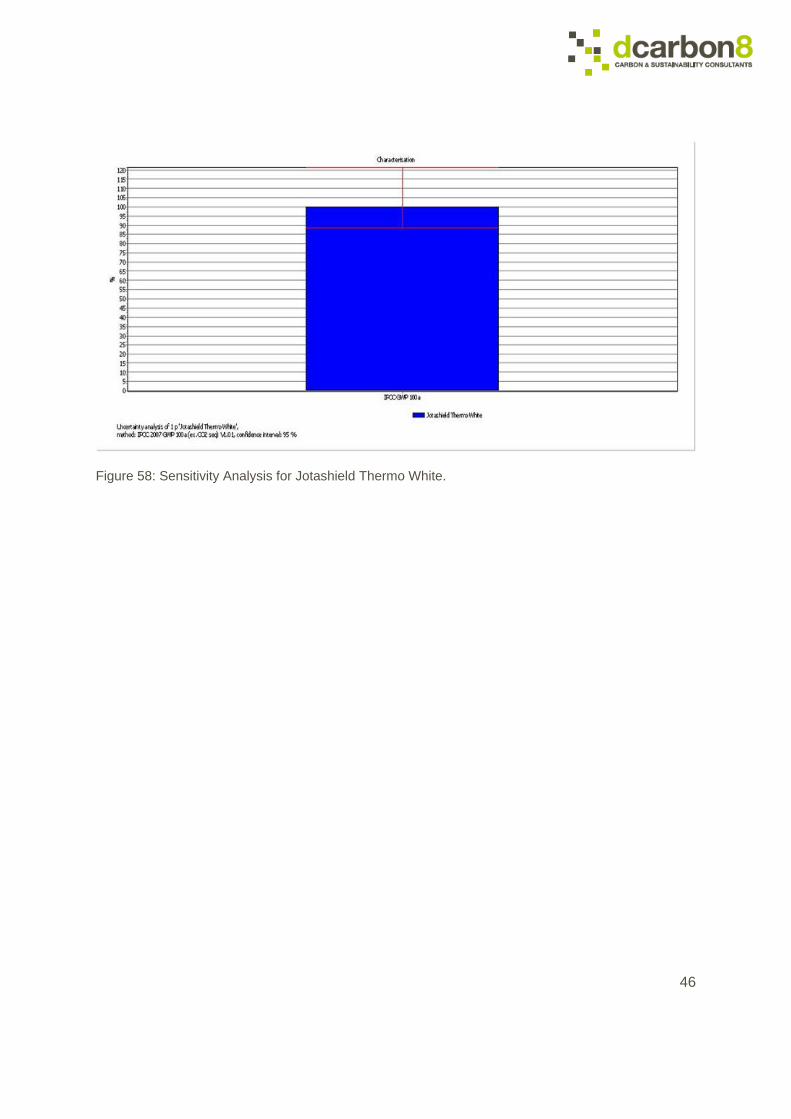
In order to gauge the precision of the greenhouse gas emission factors used to calculate the product’s carbon footprint, a Monte Carlo sensitivity analysis was performed. This computer algorithm is used to run multiple LCAs (1000+), each time randomly selecting a value within the error range of each emissions factor.
Climate Change
Impacts (kg CO2e)
-95% confidence
(%)
+95% confidence
(%)
Range of Climate Change
Impacts (kg CO2e)
Penguard HB 7.87 8 12 7.24 – 8.81
Penguard Texo 6.91 12 26 6.08 – 8.71
Durathane white 7.35 5 8 7.33 – 7.94
Jotashield Alkali 2.66 21 47 2.10 – 3.91
Jotashield Thermo 2.33 11 21 2.07 – 2.82
Table 12: Sensitivity Analysis for 5 Jotun Paints.
In every possible case, emissions factors available from EcoInvent were specific to the chemicals used for each material. Assumptions that were made for specific materials, which may have an impact on the accuracy of the results, are shown in Table 13. Thorough research was done for each material to make these assumptions.
Additive 1 95.9% Deionised Water, 3% Formaldehyde, 1.1% Diazole compounds
Additive 2 75% Water, 25% Ammonia
Additive 3 Paraffin
Additive 4 Ethylene Glycol
Additive 5 Polycarboxylates

40
Additive 6 Formaldehyde, production mix
Additive 7 60% Heptane, 40% Naphtha
Additive 8 Acrylic binder, 34% in water
Additive 9 Light fuel Oil
Additive 10 Methylene diphenyl diisocyanate
Additive 11 40% Naphtha, 60% Ammonium Nitrate
Additive 12 Dimethylpolysiloxane copolymer
Additive 13 30% Xylene, 65% polycarboxylates, 5% methyl ethyl ketone
Additive 14 Polyester resin
Additive 15 Silicone product
Additive 16 3% Lithium Chloride, 30% N-methyl-2-pyrrolidone, urea ammonium nitrate
Additive 17 Sodium tripolyphosphate
Additive 18 70.5% Alkylbenzene sulfonate, 10% Propylene glycol, 7% Dipropylene glycol monomethyl ether, 12.5% Methyl acetate
Binder 81% Vinyl Chloride, 9% Vinyl Acetate
Filler Glass tube, borosilicate
Pigment Zeolite powder
Resin 1 Urea formaldehyde resin
Resin 2 75% Xylene, 25% Ethylbenzene
Resin 3 Epoxy Resin
Thickener 1 Carboxymethyl cellulose
Thickener 2 Lubricating Oil
Thickener 3 Latex
Table 13: Assumptions for materials used where exact raw material was not available in EcoInvent.

41
Additionally, a UAE specific scenario was created for electricity consumption for the manufacturing of paints. For disposal of paint at end of life, landfill scenario for Switzerland was used as this was the only scenario available in the database.

42
CONCLUSION
This life cycle impact analysis demonstrates the total carbon dioxide equivalent emissions impact of paints manufactured by Jotun Paints, Abu Dhabi from cradle to grave. Three of these paints are solvent based – Penguard HB White, Penguard Texo White and Durathane White; Two other paints that are analysed are water-based paints – Jotashield Alkali Resistant Primer White and Jotashield Thermo White.
The carbon footprint of solvent-based paints is approximately three times that of water-based paints. Among the solvent-based paints and Jotashield Thermo White, a water-based paint, manufacture of raw materials contributes most to the total footprint followed by the end of life disposal of the paint. In the case of Jotashield Alkali Resistant Primer White, water-based paint, end of life disposal of the paint contributes heavily towards the total footprint followed by raw material manufacture. Carbon emissions resulting from delivery of raw material, packaging waste from raw materials, energy consumption attributed to the manufacture of each paint, and delivery of the final product contribute much less to the total footprint for each paint.
Therefore, any decision-making regarding climate change impacts should consider reducing carbon emissions from raw material used which would entail engaging the supply chain to use low carbon materials to produce raw materials for Jotun as well as liaising with Jotun’s product research team to consider the use of alternative, low carbon material for paint manufacture. Clearly, the transition from organic solvent-based paints to water-based paints would significantly reduce the overall carbon footprint paint products. Additionally, Jotun can also initiate a take-back scheme for paint that is not used by the customer, which can be resold or recycled.
Assessing options based on the environment and society as well as economics will ensure sustainable procurement is at the heart of decision-making. This commitment can result in the entire supply chain taking responsibility for climate change impacts rather than just the purchaser.

43
REFERENCES & NOTES
Amato, A., Brimacombe, L. and Howard, N. (1996) Development of a quantitative methodology for assessing embodied energy of recyclable and reusable materials/products. Ironmaking and Steelmaking, 23 (3) 235-241
Cole, R. and Kernan, P. (1996) Life-cycle energy use in office buildings, Building and Environment 31 (4) 307-317
Planet Positive – For more information, visit http://www.dcarbon8.com/supply-chain-network/planetpositive/protocol.php Planet Positive is a mark of certification for carbon management, ensuring that measurement, reduction, offsetting and transparent reporting of impacts is taken for businesses, products and services. For more information on Bath University’s Inventory of Carbon and Energy, please visit http://people.bath.ac.uk/cj219/

44
APPENDIX
Sensitivity Analysis
Figure 54: Sensitivity Analysis for Penguard HB White.
45
Figure 55: Sensitivity Analysis for Penguard Texo White.
Figure 56: Sensitivity Analysis for Durathane White.
Figure 57: Sensitivity Analysis for Jotashield Alkali Resistant Primer White.
46
Figure 58: Sensitivity Analysis for Jotashield Thermo White.