JORDAN HUMAN - jo.undp.org · JORDAN HUMAN DEVELOPMENT REPORT 2015 3 Jordan Human Development...
182
Empowered lives. Resilient nations. REGIONAL DISPARITIES JORDAN HUMAN DEVELOPMENT REPORT 2015
Transcript of JORDAN HUMAN - jo.undp.org · JORDAN HUMAN DEVELOPMENT REPORT 2015 3 Jordan Human Development...

Empowered lives. Resilient nations.
R E G I O N A L D I S P A R I T I E S
JORDANHUMANDEVELOPMENTREPORT 2015


JORDAN HUMAN DEVELOPMENT REPORT 2015
RegionalDisparities


JORDAN HUMAN DEVELOPMENT REPORT 2015 1
Jordan Human Development Report 2015: Regional Disparities
Project Board Members
National Reviewers
Mukhallad Omari, Ministry of Planning and International Cooperation
Zena Ali Ahmad, UNDP-Jordan
Mohammad Nabulsi, Economic and Social Council
Mukhallad Omari, Ministry of Planning and International Cooperation
Basem Kanan, Ministry of Planning and International Cooperation
Diya Elfadel, UNDP-Jordan
Zein Soufan, Ministry of Planning and International Cooperation
Orouba Al-Sabbagh, Ministry of Planning and International Cooperation
Raedah Frehat, Jordanian National Commission for Women
Junnara Murad, Development and Employment Fund
Ahmad Al-Qubelat, Department of Statistics
Maisoon Amarneh, Jordan Economic and Social Council
Osama Al-Salaheen, Ministry of Social Development
Reem Al-Zaben, Jordanian Hashemite Fund for Human Development
Ali Al-Metleq, The Higher Population Council
Laith Al-Qasem
Abdelbaset Al-Thamnah, Department of Statistics

JORDAN HUMAN DEVELOPMENT REPORT 2015 2
Jordan Human Development Report 2015: Regional Disparities
International reviewers
Consultants
Survey Team
Selim Jahan, Director, Human Development Report Office
Jon Hall, Policy Specialist, National Human Development Reports, UNDP
Core Team of Writers
Khalid W. Al-Wazani- Chief Researcher and Team
Leader (Issnaad Consulting)
Ahmad AL-Shoqran, Report Coordinator (IssnaadConsulting)
Ibrahim Aljazy
Alaa Bashaireh
Other Participating Experts
Fawaz Al-Momani Abdallah Ababneh
Abdelbaset Al-Thamnah Fairouz Aldahmour
Mohammad Bani Salameh Naser Abu Zayton
Hani Kurdi Mohammad Nassrat
Salma Nims
Naser Abu Zayton Taqwah Saleh
Ebtisam Abdullah
Issnaad Consulting Management advisory services
Ahmad Hindawi Lara Khozouz
Lana Mattar
Taqwah Saleh

JORDAN HUMAN DEVELOPMENT REPORT 2015 3
Jordan Human Development Report 2015: Regional Disparities
International reviewers
Consultants
Survey Team
Selim Jahan, Director, Human Development Report Office
Jon Hall, Policy Specialist, National Human Development Reports, UNDP
Core Team of Writers
Khalid W. Al-Wazani- Chief Researcher and Team
Leader (Issnaad Consulting)
Ahmad AL-Shoqran, Report Coordinator (IssnaadConsulting)
Ibrahim Aljazy
Alaa Bashaireh
Other Participating Experts
Fawaz Al-Momani Abdallah Ababneh
Abdelbaset Al-Thamnah Fairouz Aldahmour
Mohammad Bani Salameh Naser Abu Zayton
Hani Kurdi Mohammad Nassrat
Salma Nims
Naser Abu Zayton Taqwah Saleh
Ebtisam Abdullah
Issnaad Consulting Management advisory services
Ahmad Hindawi Lara Khozouz
Lana Mattar
Taqwah Saleh
Event
Jordan Human Development Report 2015: Regional Disparities
No.Organizations
No.Participants
WorkshopsWorkshop on education and youth indicators at the provincial level, with afocus on Irbid province (Irbid)
Workshop on health issues at the provincial level, with a focus on Irbid province (Irbid)Workshop on women's issues at the provincial level, with a focus on Irbidprovince (Irbid)
Workshop on poverty and unemployment at the provincial level, with afocus on Irbid province (Irbid)Workshop on good governance, anti-corruption, the judicial system,decentralization, and citizen participation (Irbid)
Workshop on education and youth indicators at the provincial level, with afocus on the capital province (Amman)
Workshop on health issues at the provincial level, with a focus on thecapital province (Amman)
Workshop on women's issues at the provincial level, with a focus on thecapital province (Amman)Workshop on poverty and unemployment at the provincial level, with afocus on the capital province (Amman)Workshop on good governance, anti-corruption, the judicial system,decentralization, and citizen participation (Amman)
Workshop on human rights and the rule of law at the country level, with afocus on Ma'an province (Ma'an)
Workshop on education and youth indicators at the provincial level, with afocus on Ma'an province (Ma'an)
Workshop on health issues at the provincial level, with a focus on theMa'an province (Ma'an)Workshop on women's issues at the provincial level, with a focus on theMa'an province (Ma'an)Workshop on poverty and unemployment at the provincial level, with afocus on Ma'an province (Ma'an)
Interviews
25 10
21 12
20 13
18 12
27 8
30 15
22 13
25 12
27 15
27 15
24 5
23 4
24 5
25 7
25 6
Mounther Al- Sharé - President of Economic and Social Council
Mosa Brezat- Head of National Centre for Human Rights
Haifa Al-Najar- A member of Senate House
Mazen Odeh- Secretary General/ Economic and Social Council
Sawsan Al-Majali- Head of The Higher Population Council

JORDAN HUMAN DEVELOPMENT REPORT 2015 4
Acronyms 11
Chapter One: Human Development Trends in Jordan 13
Introduction 15
Jordan’s HDI in a Regional Context 16
Large Disparities in Human Development Across Governorates 20
Inequality Limits Human Development Progress 24
Gender Dimensions of Human Development: The Gender Inequality Index 26
Gender Dimensions of Human Development: The Gender Development Index 27
The Multidimensional Poverty Index 29
Declining Poverty but Gaps Still Evident 30
Deep Poverty Pockets Are Still Present Across Governorates 34
Significant Improvements in Gender Disparities, But Gaps Remain 36
Disparities Across Governorates and Regions is a Threat to Progress 37
The Syrian Refugee Crisis has Aggravated Regional Disparities 40
In Conclusion: Much Progress, But Still a Long Way to Go 43
Remainder of the Report 44
Chapter Two: Education 45
Introduction 47
Jordan’s Educational Infrastructure 47
Jordan’s Education System 49
Knowledge-Based Education in Jordan 54
Educational and Regional Disparities 57
Public-Private Partnerships in Education: Funding Quality, and Disparities 60
Table of Content

JORDAN HUMAN DEVELOPMENT REPORT 2015 5
Chapter Three : Health 63
Introduction 65
Public-Private Partnerships in Health Services: Funding, Quality, and Disparities 68
Health Care and Human Development: Youth and Gender Dimensions 70
Regional Health Disparities in Jordan 71
Chapter Four: Employment and Livelihood 77
Introduction 79
The Role of MSMEs in Employment and Livelihood 81
Women’s Participation and Employment 84
Employment, Livelihood and Regional Disparities 86
Chapter Five: Youth 91
Introduction 93
Distribution of the Population by Age and Gender 93
Distribution of the Population by Age and Educational Level 94
Distribution of Youth (15-24 years old) by Educational Level and Region 96
Distribution of Jordanian Youth by Educational Level and Governorate 98
Distribution of Jordanian Youth by Educational Level and Economic Activity 102
Distribution of Working Youth Population by Educational Level and Specialization 103
Distribution of Youth by Educational Level and Geographical Location 106
Enabling Jordanian Youth to Participate in the Economic, Social, and Political Life 108
Youth and Poverty 110
Chapter Six: Women and Disparities 113
Introduction 115
Women in the Labor Market 115
Women in the Labor Market: Formal and Informal Discrimination 116
Women in a Socio-Economic and Political Context 119
Women and Regional Disparities 124

JORDAN HUMAN DEVELOPMENT REPORT 2015 6
Chapter Seven: The Justice System and State Capacity 129
Introduction 131
The Judicial System: Independence and Transparency 131
Settling Disputes in Jordan 132
Description of the Judicial Authority’s Institutional Framework 134
Judicial Council 138
Courts in Jordan 138
Constitutional Court 142
Human Rights 142
Opportunities in Relation to the Judicial Authority’s Legislative and Institutional Framework 145
State Involvement 146
The Stability of Law 147
Access to Justice 147
Chapter Eight: Good Governance, Decentralization, and Participation 149
Introduction 151
Good Governance in Jordan: The International Context 151
Good Governance, Decentralization, Transparency, and Participation 155
Chapter Nine: Conclusions and Policy recommendations 159
Conclusions 161
Recommendations 164
Annexes 167
Annex (1) Chapter Nine Tabels 168
Annex (2) Survey Questionnaire 170
References 173

JORDAN HUMAN DEVELOPMENT REPORT 2015 7
Tables
Table (1-1): Table 1.1. HDI Values for Arab States, 2013 and 2014 17
Table (1-2): Jordan’s HDI dimensions in relation to other Arab States in the high human development group 18
Table (1-3): Jordan’s HDI and its Components, 1980-2014 19
Table (1-4): Life Expectancy Index by Governorate, 2014 22
Table (1-5): Income Index by Governorate, 2014 23
Table (1-6): Education Index by Governorate, 2014 23
Table (1-7): Governorate, 2014 24
Table (1-8): Jordan’s IHDI, 2013 and 2014 25
Table (1-9): Jordan’s GII and those of selected countries and groups, 2013 and 2014 26
Table (1-10): The GDI and its components: Jordan and selected countries and groups 28
Table (1-11): Multidimensional Poverty in Jordan, 2009 and 2012 30
Table (1-12): Annual Value of Abject, Non-food and Absolute Poverty Lines 2010 (JD) 30
Table (1-13): Poverty Rates by Governorate 31
Table (1-14): Poverty Rates in Districts and Poor Sub-Districts 35
Table (1-15): Population distribution and density by governorate, 2013 38
Table (1-16): Some characteristics of Syrian refugees and residents in Jordan (as of early 2014) 41
Table (1-17): Syrian Refugees: Distribution by location (as of early 2014) 42
Table (1-18): Syrian Refugees: Relative distribution by location 42
Table (2-1): Distribution of schools by authority and gender in Jordan, 2012-2013 48
Table (2-2): Distribution of schools by authority, education cycle and gender in Jordan, 2012-2013 48
Table (2-3): Distribution of class units by authority, education cycle and gender in Jordan, 2012-2013 49
Table (2-4): Distribution of kindergarten students by authority and gender, 2012-2013 49
Table (2-5): Distribution of students enrolled in basic education by authority and gender in Jordan, 2012-2013 50
Table (2-6): Distribution of dropouts and repeaters in basic education by grade and gender in Jordan, 2012-2013 51
Table (2-7): Distribution of secondary education students by authority and gender in Jordan, 2012-2013 52
Table (2-8): Distribution of dropouts and repeaters in secondary education by grade and gender in Jordan, 2012-2013 52
Table (2-9): Distribution of vocational students by gender, 2011-2012 53
JORDAN HUMAN DEVELOPMENT REPORT 2015 8
Table (2-10): Students enrolled at jordanian universities by degree and gender, 2012-2013 54
Table (2-11): Average number of students per class unit and per teacher by governorate, 2012-2013 60
Table (4-1): Labor market status of Jordanian population aged 15+ by gender and educational level (%), 2013 84
Table (4-2): Number of active establishments by governorate and employment size, 2011 88
Table (5-1): Distribution of the Jordanian population by age group and gender 93
Table (5-2): Distribution of the Jordanian population by educational level and gender 94
Table (5-3): Percentage Distribution of the Jordanian population by age, gender, and educational level 95
Table (5-4): Distribution of Jordanian youth by educational level, gender, and region 96
Table (5-5): Distribution of Jordanian youth by educational qualification, gender, and governorate 98-99
Table (5-6): Distribution of Jordanian youth by educational level and specialization 104
Table (5-7): Distribution of Jordanian youth by educational level, gender, and beneficiaries of loans from the development and employment Fund 109
Table (5-8): Summary of educational indicators for youth 110
Table (5-9): Distribution of Jordanian youth by poverty segments 111
Table (6-1): Unemployment rate by governorate and gender (2013) 117
Table (6-2): Economic activity rates by governorate and gender (2013) 118
Table (6-3): Educational level of the population in Jordan by gender (2013) 119
Table (6-4): Number of female students in academic and in vocational secondary education (2011-2012) 120
Table (6-5): TVET training courses by gender among youth aged 16-26 121
Table (6-6): Indicators Used in the Gender Regional Equality Index by gender and governorate, 2013 127
Table (8-1): Results on Good Governance and Anti-corruption 155
Table (8-2): Results on Decentralization 156
Table (8-3): Results on Rule of Law and the Judiciary System 157
Table (8-4): Results on Participation 157

JORDAN HUMAN DEVELOPMENT REPORT 2015 9
Figures
Figure (1.1): Population Distribution by Age Groups 16
Figure (1-2): HDI Trends: 1985-2014 19
Figure (1- 3): HDI by Governorate, 2014 22
Figure (1-4): Poverty Gap by Governorate, 2010 32
Figure (1-5): Monetary Value of Poverty Gap by Governorate, 2010 (million JD) 32
Figure (1-6): Poverty Severity Index by Governorate, 2010 33
Figure (1-7): Poverty Trends from 2006 to 2010 33
Figure (1-8): Household average annual income by governorate, 2010 (JD) 38
Figure (1-9): Income Inequality (Gini Coefficient) by Governorate, 2010 39
Figure (1-10): Proportion of Households Below the Average of the QLI distribution by Governorate, 2010 40
Figure (2-1): Education Ladder 47
Figure (2-2): Distribution of of schools by governorate, 2012-2013. 57
Figure (2-3): Distance to primary and secondary school by governorate, 2010 58
Figure (2-4): Distribution of class units by governorate, 2012-2013. 59
Figure (2-5): Overcrowding in Classrooms in basic and secondary education by governorate, 2010 59
Figure (2-6): Key partners of the Jordanian education initiative 61
Figure (3-1): Household OOP spending by governorate and Country Average, 2010 (JD) 68
Figure (3- 2): Per Capita OOP payments by governorates, country average, and urban/rural areas, 2010 (JD) 69
Figure (3-3): Distance to maternity and childhood health Centers 71
Figure (3-4): Child Mortality Jordan, 2012 72
Figure (3-5): Health index by governorate 74
Figure (3-6): Quality of Life Index based on distance to public/military hospitals by governorate 75
Figure (3-7): Quality of Life Index based on distance to health centers by governorate 75
Figure (3-8): Smoking Index by Governorate 76

JORDAN HUMAN DEVELOPMENT REPORT 2015 10
Figure (4-1): Distribution of Economic Establishments by governorate and company size (%) of total number of establishments in each category 87
Figure (4-2): Numbers of MSMEs by Governorate 87
Figure (5-1) Gender and Age Structure, 2013 94
Figure (5-2): Distribution of Jordanian youth by educational level and gender 95
Figure (5-3): Distribution of Jordanian youth by educational level and region 97
Figure (5-4): Distribution of Jordanian youth by educational level in the southern governorates 100
Figure (5-5): Distribution of Jordanian youth by educational level in the northern governorates 100
Figure (5-6): Distribution of Jordanian youth by educational level in the central governorates 101
Figure (5-7): Distribution of Jordanian economically inactive youth by educational level 102
Figure (5-8): Distribution of Jordanian youth by educational level and activity 103
Figure (5-9): Distribution of Jordanian youth by educational level and specialization 105
Figure (5-10): Distribution of Jordanian youth by educational level and urban/rural areas 106
Figure (5- 11): Distribution of Jordanian youth in urban areas by educational level 107
Figure (5-12): Distribution of Jordanian youth in rural areas by educational level 107
Figure (6-1): Average labor force participation rates in Jordan, the Southern Eastern and Mediterranean region (SEMED), and in middle income countries 116
Figure (6-2): Females with elementary Elementary Education or less by age group 120
Figure (6-3): Domestic Violence by Governorate 123
Figure (6-4): Regional Gender Equality Index – Women’s Empowerment Map, 2013 126
Figure (8-1): Jordan, 1996-2013, Aggregate Indicator: Voice & Accountability 152
Figure (8-2): Jordan, 1996-2013, Aggregate Indicator: Political Stability and Absence of Violence 152
Figure (8-3): Jordan, 1996-2013, Aggregate Indicator: Government Effectiveness 153
Figure (8-4): Jordan, 1996-2013, Aggregate Indicator: Regulatory Quality 153
Figure (8-5): Jordan, 1996-2013, Aggregate Indicator: Rule of Law 154
Figure (8-6): Jordan, 1996-2013, Aggregate Indicator: Control of Corruption 154

JORDAN HUMAN DEVELOPMENT REPORT 2015 11
AFR Adolescent Fertility Rate
CBN Cost of Basic Needs
CIP Civil Insurance Program
DOS Department of Statistics
ERFKE Education Reform for Knowledge Economy
EUS Employment and Unemployment Survey
GII Gender Inequality Index
GDI Gender Development Index
GDP Gross Domestic Product
GGI Gender Gap Index
GNI Gross National Income
GoJ Government of Jordan
HCAC Health Care Accreditation Council
HDI Human Development Index
HDR Human Development Report
HEIS Household Expenditure and Income Survey
IHDI Inequality-adjusted Human Development Index
IMF International Monetary Fund
JHCO Jordan Hashemite Charity Organization
JOD/JD Jordanian Dinar
JNCW Jordan National Commission for Women
MDGs Millennium Development Goals
MDI Multidimensional Index
MENA Middle East and North Africa
MMR Maternal Mortality Ratio
Acronyms

JORDAN HUMAN DEVELOPMENT REPORT 2015 12
MoE Ministry of Education
MoH Ministry of Health
MoHESR Ministry of Higher Education and Scientific Research
MoL Ministry of Labor
MoPIC Ministry of Planning and International Cooperation
MSMEs Micro, Small, and Medium Enterprises
NES National Employment Strategy
PPP Purchasing Power Parity
PRS Poverty Reduction Strategy
PSD Police Service Department
QLI Quality of Life Index
SMEs Small and Medium Enterprises
SSC Social Security Corporation
TVET Technical and Vocational Education and Training
VTC Vocational Training Corporation
UNESCO United Nations Educational, Scientific, and Cultural Organization
UNHCR United Nations Higher Commission for Refugees
UNRWA United Nations Relief and Works Agency for Palestine Refugees in the Near East
WB World Bank

JORDAN HUMAN DEVELOPMENT REPORT 2015 13
Empowered lives. Resilient nations.
PATTERNSOF HUMAN
DEVELOPMENT

JORDAN HUMAN DEVELOPMENT REPORT 2015 14
CHAPTER 1HUMAN DEVELOPMENT TRENDSIN JORDAN

JORDAN HUMAN DEVELOPMENT REPORT 2015 15
IntroductionThe Human Development Index (HDI) emphasizes the fact that people and their capabilities are the key criteria for evaluating a country’s development progress. The HDI can be used to answer questions, such as “how is it that two countries with the same level of GNI per capita have different human development outcomes”? Answers to these types of questions yield important analytical insights and can inform, and improve, government policies and priorities. Before drawing conclusions however, the full range of human development indicators has to be carefully analyzed in order to expose any socio-economic gaps between different regions or groups of people within a country.
Categorized as an “upper-middle-income” country, Jordan’s HDI rank is fair and reasonable, but there is still room for improvement. The most recent Human Development Report (2015) calculated an HDI value of 0.745 for Jordan, which ranked it as number 80 out of 188 countries. This value placed Jordan in the high human development category. This HDI value is just above the average (0.744) for countries in the high human development category and significantly higher than the average (0.686) for Arab States.
Another index, the Inequality-adjusted Human Development Index (IHDI), measures how a country’s achievements are distributed among the population by discounting the average for each dimension of the HDI according to its level of inequality. The IHDI value is equal to the HDI value when a country has perfect equality, but falls below the HDI as inequality rises. Thus, the IHDI measures the level of human development when inequality is taken into account. Jordan’s IHDI value was 0.625 in 2014, which means that the average loss in HDI due to inequality was 16.5 percent. This is considerably lower than the average for
Arab States (25.4 percent), which indicates that Jordan enjoys higher equality than other Arab States.
Based on available data, this National Human Development Report (NHDR) will discuss and analyze disparities in Jordan by region, age, gender, and socio-economic status. While regional changes in the political and socio-economic context, particularly the Syrian crisis, have contributed to some of Jordan’s disparities, this report identifies more deep-rooted causes of inequality.
Jordan’s population is very young; over 70 percent are under 30 years old, which creates an opportunity for the country to benefit from its demography (Figure 1.1). The population is distributed among three main areas/regions: north, center, and south, each of which comprise four governorates. Each governorate has its own system of governance. 63 percent of the total population live in the four central governorates: Amman, Zarqa, Balqa, and Madaba. 28 percent live in the northern governorates: Irbid, Mafraq, Jarash, and Ajloun. Only nine percent of Jordan’s population inhabit the southern governorates: Aqaba, Ma’an, Karak, and Tafila. The center region takes up 16.2 percent of Jordan’s total area, the northern region 32.6 percent, and the southern region 51.2 percent.
In both 2013 and 2014, Jordan’s HDI value outperformed the average value for countries in the high human development group as well as the average for Arab countries.

JORDAN HUMAN DEVELOPMENT REPORT 2015 16
Jordan’s HDI in a Regional ContextJordan ranked number 77 on the HDI in 2013 with a value of 0.745. Even though the HDI value had increased by 0.003 points in 2014, its global ranking fell to 80, which indicates that several countries have been more effective in its efforts to promote human development. In both years, Jordan was categorized as a high human development country (HDI values from 0.700 to 0.799).
The 2013 and 2014 HDIs were calculated for 19 Arab countries1 and Jordan ranked among the top 10. In 2013, Jordan ranked number 9 and in 2014, it ranked number 8. In both years, Qatar was the highest ranking Arab country (HDI values of 0.851 and 0.850 respectively). There were six other Arab countries that ranked higher than Jordan in both years: Saudi Arabia, the United Arab Emirates, Bahrain, Kuwait, Oman, and Libya (2013) 2. In 2014, Lebanon also scored higher than Jordan. (Table 1.1)
Figure (1.1): Population Distribution by Age Groups
Source: Ministry of Planning and International Cooperation – The Hashemite Kingdom of Jordan 2015a
The Opportunity of a Young Population
Population breakdown by age group,2012
Population breakdown by age group,2035
80+75-7970-7465-6960-6454-5950-5445-49
35-3930-3420-2425-2915-1910-14
5-90-4
40-44
80+75-7970-7465-6960-6454-5950-5445-49
35-3930-3420-2425-2915-1910-14
5-90-4
40-44
MaleFemale

JORDAN HUMAN DEVELOPMENT REPORT 2015 17
Even though Jordan’s global ranking fell from 2013 to 2014, its HDI values were higher than the average for countries in the high human development category (0.735 and 0.744 respectively), as well as the average for Arab countries (0.682 and
0.686 respectively). However, Jordan’s HDI value was lower than that of two other Arab countries in the high human development group (Libya and Oman in 2013; and Oman and Lebanon in 2014). (Table 1.2).
HDI 2013 HDI 2014
Algeria 0.717 95 11 0.736 83 9
Bahrain 0.815 44 4 0.824 45 4
Djibouti 0.467 170 19 0.470 168 19
Egypt 0.682 110 13 0.690 108 12
Iraq 0.642 120 15 0.654 121 14
Jordan 0.745 77 9 0.748 80 8
Kuwait 0.814 46 5 0.816 48 5
Lebanon 0.765 65 8 0.769 67 7
Libya 0.784 55 6 0.724 94 10
Morocco 0.617 129 16 0.628 126 15
Oman 0.783 56 7 0.793 52 6
Qatar 0.851 31 1 0.850 32 1
Saudi Arabia 0.836 34 2 0.837 39 2
State of Palestine 0.686 107 12 0.677 113 13
Sudan 0.473 166 18 0.479 167 18
Syrian Arab Republic 0.658 118 14 0.594 134 16
Country
Table (1-1): HDI Values for Arab States, 2013 and 2014
HDIValue
Global HDIRank
Arab StatesRank
HDI Value
Global HDIRank
Arab StatesRank
Tunisia 0.721 90 10 0.721 96 11
United Arab Emirates 0.827 40 3 0.835 41 3
Yemen 0.500 154 17 0.498 160 17
Sources: United Nations Development Programme (UNDP) 2014a, 2015

JORDAN HUMAN DEVELOPMENT REPORT 2015 18
The HDI value and the rank of a country are based on the HDI indicators. The different indicators of the HDI are presented in Table 1.2, which enables a comparison between all Arab countries in the high human development category. For example, in 2013, the life expectancy at birth was 80 years in Lebanon, 73.9 years in Jordan, and 70.2 years in all Arab countries on average. Furthermore, Jordan had the second lowest per capita GNI (PPP US$) in both 2013 and 2014; in both years, its GNI per capita was lower than the average for Arab countries and all countries globally in the high HDI category. On the other hand, the life
expectancy at birth was approximately the same as for all countries in the high HDI category and higher than those of the Arab countries in this group. This observation also holds true for expected years of schooling; Jordan’s mean years of schooling exceed both the average for all countries globally and for Arab countries in the HDI category. Based on this data, it seems that Jordan’s per capita GNI best explains its comparatively low HDI ranking among the high human development countries.
Jordan’s HDI value has changed over the years. It rose significantly from 0.587 in
Country HDIValue
HDIRank
Life Expectancy at Birth (Years)
(2013)
Expected Years of Schooling
(2012)
Mean Years of schooling
(2014)GNI per capita
(2014, 2011 PPP US$)
HDI 2014
Country HDIValue
HDIRank
Table (1-2): Jordan’s HDI dimensions in relation to other ArabStates in the high human development group
Life Expectancy at Birth (Years)
(2014)
Expected Years of Schooling
(2014)
Mean Years of schooling
(2014)GNI per capita
(2014, 2011 PPP US$)
Jordan
Oman
Libya
Lebanon
Tunisia
Algeria
High HDI category
All Arab Countries
0.748
0.793
0.724
0.769
0.721
0.736
0.744
0.686
80
51
94
67
96
83
-
-
74.0
76.8
71.6
79.3
74.8
74.8
75.1
70.6
13.5
13.6
14.0
13.8
14.6
14.0
13.6
12.0
9.9
8.0
7.3
7.9
6.8
7.6
8.2
6.4
11,365
34,858
14,911
16,509
10,404
13,054
13,961
15,722
HDI 2013
Jordan
Oman
Libya
Lebanon
Tunisia
Algeria
High HDI category
All Arab Countries
0.745
0.783
0.784
0.765
0.721
0.717
0.735
0.682
77
56
55
65
90
95
-
-
73.9
76.7
75.3
80
75.9
71
74.5
70.2
13.3
13.6
16.1
13.2
14.6
14
13.4
11.8
9.9
6.8
7.5
7.9
6.5
7.6
8.1
6.3
11,337
42,191
21,666
16,263
10,440
12,555
13,231
15,817
Note: “*” most recent available yearSource: United Nations Development Programme (UNDP) 2014a, 2015

JORDAN HUMAN DEVELOPMENT REPORT 2015 19
1980 to 0.744 in 2010, remained at the same value in 2011, and then rose slowly again to 0.748 in 2014 (Figure 1.2). This represents an increase of 27.4 percent, or about 0.8 percent
annually. However, the growth of its HDI that Jordan experienced during the last three decades has come to an end, which should be a priority concern for policy makers.
Jordan’s performance in the three HDI indicators from 1980 to 2014 is presented in Table 1.3.
Figure (1-2): HDI Trends: 1985-2014
Table (1-3): Jordan’s HDI and its Components, 1980-2014
HDI Value
HDI Rank
Life Expectancy atBirth (Years )
GNI per capita(2011 PPP US$)Year
1980
1985
1990
1995
2000
2005
2010
2011
2012
2013
2014
0.587
0.616
0.622
0.688
0.705
0.733
0.744
0.744
0.744
0.745
0.748
66.2
68.3
69.9
70.9
71.7
72.6
73.4
73.6
73.7
73.9
74.0
11.9
12
11.7
12.1
12.7
13.8
13.4
13.3
13.3
13.3
13.5
3.1
4
5.1
9.3
9.5
9.7
9.9
9.9
9.9
9.9
9.9
7,828
8,678
6,655
7,205
7,776
9,497
11,208
11,222
11,232
11,337
11,365
Source: United Nations Development Programme (UNDP) 2015
Expected Years ofSchooling (Years)
Mean Years ofSchooling (Years)
0.740
0.720
0.700
0.680
0.660
0.640
0.620
0.600
0.5801980 1985 1990 2000 2010 2011 2012 2013 2014
Source: Based on data from the United Nations Development Programme (UNDP) 2014a, 2015

JORDAN HUMAN DEVELOPMENT REPORT 2015 20
Jordan’s life expectancy at birth increased by 7.8 years from 1980 to 2014; that is, from 66.2 years to 74.0 years. Averaged over the entire 34 years, this amounts to an annual increase of 0.23 years, which is more or less the norm for countries at Jordan’s level of development. The rise in life expectancy at birth reflects improvements in the quality of healthcare, public health facilities, nutrition, sanitation, clean drinking water, and the decline in infant mortality. Expected years of schooling rose by 1.6 years, while the mean years of schooling increased by 6.8 years, reflecting improvements in access to education. GNI per capita grew by 44.8 percent during the same time and is an indication of the extent to which employment opportunities and decent jobs have been created in the economy.
Large Disparities in Human Development Across GovernoratesTracking disparities is a difficult task given the scarcity of data on education indicators by governorate. Data on expected years, and mean years, of schooling is not available. Consequently, data on the gross enrollment ratio and the adult literacy rate was used as substitute for the computation of the HDI for 2009 and prior. The income index is based on per capita income for 2014 in PPP dollars. Data on life expectancy at birth across governorates is available and a standard methodology is used to calculate the life expectancy index. Box 1.1 explains the HDI methodology in detail.
Box (1.1): How the Human Development Index was calculated for the twelve Governorates
Once the minimum and maximum values for each indicator of the HDI have been identified, the dimension indices are calculated as:
Dimension index = actual value-minimum value maximum value-minimum value
Life Expectancy Index
Data for the minimum and maximum life expectancy at birth comes from life tables, which are available by governorate. The latest life tables published in 2014 have been used.
No standard minimum and maximum values for life expectancy was used to calculate the life expectancy index. Instead, the minimum and maximum value for each governorate were used as the goal posts for a specific governorate.
Education IndexData on the mean and expected years of schooling are not available by governorate; gross enrollment ratio and adult (15 years and over) literacy rates were used instead. Because of the scarcity of data for 2014, data from 2011 has been used. No significant changes in the literary rates are expected to have taken place between these years. The goal posts for minimum and maximum values for both indicators are 0 and 100 respectively. Two-thirds weight was allocated to adult literacy rate and one-third to gross enrollment ratio.
Income IndexBecause of the unavailability of per capita income data by governorate, the following procedure was adopted:
1. Calculate average per capita income for the year 2010 by governorate from the household income and expenditure survey (2010 was the latest issued HEIS)
2. Update per capita income from step 1 using the compound annual growth rate of inflation for the previous five years (2010-2014)
3. Set minimum and maximum values of per capita income across governorates to 100 and 40,000 JD respectively.
To calculate the per capita income in PPP US dollars, a multiplying factor of 3.88216 was used. The Income Index is then calculated using the logarithm of the actual values:
log (GDP) - log (100) log (4000) - log (100)
Human Development Index HDI = Life Expectancy Index+Education Index +Income Index
3

JORDAN HUMAN DEVELOPMENT REPORT 2015 21
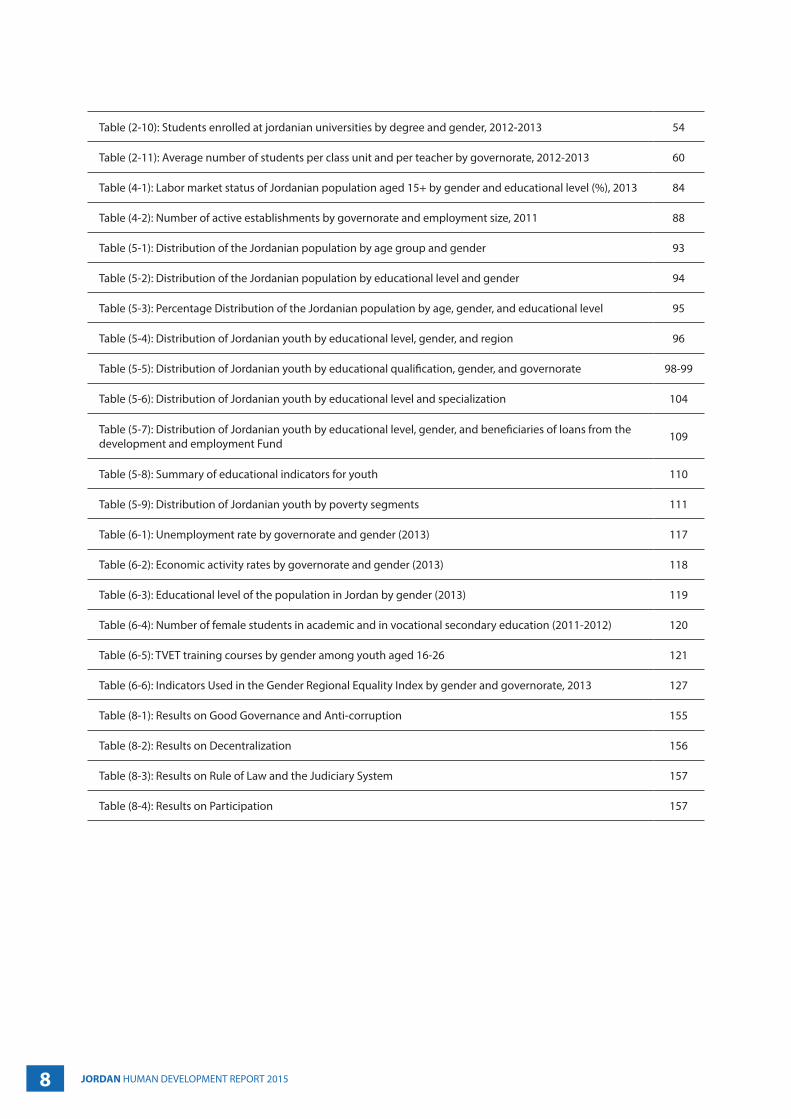
The Life Expectancy Index: Based on data from life tables, the minimum value ranges from 22.86 years in Tafila to 24.2 years in Ajlune and Balqa. The maximum attainable life expectancy varies from 82 years in Tafila to 86 years in Ajlune and Balqa. The actual life expectancy was lowest in Tafila, at 72 years, and highest in Ajlun, at 75.3 years. An important reason for life expectancy gaps, both maximum attainable and actual, is disparities in the quality of healthcare, and to some extent access to healthcare, across governorates.
The Education Index: As noted above, the data required to calculate this dimension is not available by governorate. Instead, the ratio of adult literacy (age 15 and above) and the gross enrollment ratio for basic and secondary education have been used. The ratio of adult literacy was calculated using the illiteracy rate (100 minus illiteracy rate), while gross enrollment represents the total number of students enrolled in basic and secondary education compared to the total number of youth aged 6-18 years. The education index is a weighted average of the adult literacy index (two-thirds) and the gross enrollment index (one-third).
Based on these equations, the education index value is lowest in Ma’an, Tafila, and Karak: 0.580, 0.592, and 0.593 respectively. This could be attributed to the high illiteracy rate in these three governorates which, in turn, is a function of lack of access to high quality educational facilities. The value is highest in Mafraq, Amman, and Zarqa: 0.635, 0.633, and 0.626 respectively. These results suggest that government programmes need to target governorates that are at the bottom of the education index, particularly those with low gross enrollment rates and high adult illiteracy rates.
The GNI Index: This index measures the standard of living, or the actual command over resources, in a given area. Because of the lack of data on the GNI at the governorate level, the same methodology and data used in Jordan’s 2011 National Human Development Report has been used for this report; that is, the average per capita income by governorate generated from the 2010 Household Income and Expenditure Survey (HIES), adjusted to the average rate of inflation from 2010 to 2014. The maximum and minimum income per governorate were also derived from this survey and adjusted to inflation. The main purpose of the adjustment is to reflect nominal income in 2014 instead of nominal income in 2010. The average per capita income in PPP dollars was calculated by multiplying income per person by the “PPP US dollar factor” for Jordan. Finally, the income index was calculated by using the standard methodology used to calculate the GNI on a national level, that is, the methodology employed by the Global Human Development Report. The GNI index is highest for Amman (0.741) and lowest for Mafraq (0.651), reflecting the highest and lowest per capita income in these two governorates. The GNI index varies for the other governorates, from 0.664 in Ma’an to 0.690 in Karak.
The HDI is then calculated by taking the mean of the three dimensional indices which, therefore, presents average achievements in the three dimensions of human development. In 2014, Amman had the highest HDI value (0.741) and Ma’an the lowest (0.683). With an HDI value of 0.703, Zarqa ranks second among the twelve governorates, while Irbid (0.700) ranks third. (Figure 1.3, Tables 1.4, 1.5, 1.6 and 1.7)
JORDAN HUMAN DEVELOPMENT REPORT 2015 22
Figure (1- 3): HDI by Governorate, 2014
Table (1-4): Life Expectancy Index by Governorate, 2014
Amman
Balqa
Zarqa
Madaba
Irbid
Mafraq
Jarash
Ajlun
Karak
Tafilea
Ma’an
Aqaba
Jordan
23.86
24.2
23.97
22.96
23.86
23.41
23.75
24.2
23.63
22.86
23.29
23.18
23.86
85
86
85
83
85
84
84
86
84
82
84
83
86
74.4
75.3
74.7
72.2
74.4
73.3
74.1
75.3
73.9
72
73
72.7
74.4
0.827
0.827
0.831
0.827
0.827
0.823
0.836
0.827
0.833
0.831
0.826
0.828
0.820
Governorate Minimum Maximum Actual LE Index
Source: Information from the Ministry of Planning and International Cooperation
0.740
0.730
0.720
0.710
0.700
0.690
0.680
0.670
0.660
0.650
AmmanBalqa
Zarqa
MadabaIrb
id
Mafraq
JarashAjlu
nKarak
TafielaMa'an
JordanAqaba

JORDAN HUMAN DEVELOPMENT REPORT 2015 23
Amman
Balqa
Zarqa
Madaba
Irbid
Mafraq
Jarash
Ajlun
Karak
Tafilea
Ma’an
Aqaba
Jordan
8,466.3
5,404.8
5,468.7
5,078.1
5,706.3
4,956.7
5,526.6
5,191.2
6,247.1
5,622.8
5,354.4
5,487.9
6,655.2
100.0
100.0
100.0
100.0
100.0
100.0
100.0
100.0
100.0
100.0
100.0
100.0
100.0
40,000.0
40,000.0
40,000.0
40,000.0
40,000.0
40,000.0
40,000.0
40,000.0
40,000.0
40,000.0
40,000.0
40,000.0
40,000.0
0.741
0.666
0.668
0.656
0.675
0.651
0.670
0.659
0.690
0.673
0.664
0.668
0.701
Governorate PPP US$Minimum per
capita income, US$ 2014
Maximum per capita income US$
2014Income Index
Source: Information from the Ministry of Planning and International Cooperation
Table (1-5): Income Index by Governorate, 2014
Amman
Balqa
Zarqa
Madaba
Irbid
Mafraq
Jarash
Ajlun
Karak
Tafilea
Ma’an
Aqaba
Jordan
0.77
0.72
0.70
0.80
0.76
0.97
0.69
0.71
0.76
0.72
0.72
0.68
0.76
0.00769
0.00720
0.00701
0.00799
0.00764
0.00966
0.00685
0.00706
0.00758
0.00717
0.00724
0.00684
0.00755
0.946
0.902
0.935
0.908
0.920
0.948
0.906
0.902
0.885
0.884
0.866
0.903
0.923
0.633
0.604
0.626
0.608
0.616
0.635
0.606
0.604
0.593
0.592
0.580
0.604
0.618
Governorate Gross Enrollment Ratio
Gross Enrollment Index Education Index
Source: Information from the Ministry of Planning and International Cooperation
Table (1-6): Education Index by Governorate, 2014
Adult Literacy Index

JORDAN HUMAN DEVELOPMENT REPORT 2015 24
Inequality Limits Human Development ProgressThis IHDI takes inequality in the three dimensions of the HDI into consideration by “discounting” each dimension’s average value according to its level of inequality. The difference between the HDI and the IHDI can be expressed in percentage terms as an overall loss, or as the coefficient, of human inequality. Because there are only three dimensions, the difference between the two (overall loss and coefficient of human inequality) is small.
Adjusting for inequality led to a decline in the value of Jordan’s HDI for both 2013 and 2014. The loss in 2013 was 18.6 percent but fell to 16.5 percent in the following year (Table 1.8). The coefficient for human inequality is almost exactly the same – 18.5 and 16.4, respectively. The loss in human development is higher in Lebanon, another Arab country in the high human development group;
20.8 percent both years. When comparing Jordan to the average for all Arab countries for which data is available (19), its numbers stand out even more. In both 2013 and 2014, the average human development loss caused by inequality was approximately 25 percent for the 19 Arab countries and around 19.5 percent for all countries in the high human development category.
Amman
Balqa
Zarqa
Madaba
Irbid
Mafraq
Jarash
Ajlun
Karak
Tafiela
Ma'an
Aqaba
Jordan
0.827
0.827
0.831
0.827
0.827
0.823
0.836
0.827
0.833
0.831
0.826
0.828
0.820
0.633
0.604
0.626
0.608
0.616
0.635
0.606
0.604
0.593
0.592
0.580
0.604
0.618
0.741
0.666
0.668
0.656
0.675
0.651
0.670
0.659
0.690
0.673
0.664
0.668
0.701
0.729
0.693
0.703
0.691
0.700
0.698
0.697
0.690
0.698
0.692
0.683
0.694
0.708
Governorate Life expectancy index Education index GNI index
Source: Information from the Ministry of Planning and International Cooperation
Table (1-7): Governorate, 2014
HDI Value
Jordan’s Human Inequality coefficient, which measures loss caused by inequality across the three human development dimensions, declined from 18.5 in 2013 to 16.4 in 2014. The average value for Arab countries was above 24 in both years.

JORDAN HUMAN DEVELOPMENT REPORT 2015 25
In Jordan, the 2013 inequality loss in the education dimension (22.4 percent) was larger than for both of the other two dimensions. In 2014, the loss was largest for the income dimension (20.5 percent), which had declined slightly from the previous year (21.1 percent). In both years, the loss caused by inequality was smallest for the life expectancy dimension (11.9 percent both years). Lebanon’s loss was also lowest for the life expectancy dimension, but was even lower than Jordan’s (6.7 percent in both years). Jordan’s loss caused by income inequality was 21.1 percent in 2013, but fell to 20.5 percent in 2014. The coefficient of human inequality is about 4 percentage
points lower in Jordan than in Lebanon. So while the HDI was higher in Lebanon than in Jordan in 2014, Lebanon had higher inequality – to such an extent that Jordan’s IHDI (0.625) exceeded Lebanon’s (0.609).
Analyzing the average for all 19 Arab countries for which data is available, the loss in two of the three human development dimensions is larger than Jordan’s. The loss in life expectancy at birth and education was over 17 and 38 percent in 2013 and 2014 respectively. On the other hand, the level of income inequality is higher in Jordan than the average for all Arab countries (over 20 percent compared to over 17 percent for both years) (Table 1.8).
2014
IHDI Value
Overall Loss (%)
Table (1-8): Jordan’s IHDI, 2013 and 2014
Coefficient of Human
Inequality (%)
Inequality in life expectancy (%)
Inequality in education (%)
Inequality in income (%)
Jordan
Lebanon
High HDI category
Arab Countries
16.5
20.8
19.4
25.4
16.4
20.2
19.0
24.7
11.9
6.7
10.7
17.4
16.9
24.1
16.8
38.9
20.5
30.0
29.4
17.7
Source: United Nations Development Programme (UNDP) 2014a, 2015
0.625
0.609
0.600
0.512
2013
Jordan
Lebanon
High HDI category
Arab Countries
18.6
20.8
19.7
24.9
18.5
20.3
19.3
24.2
11.9
6.7
10.7
17.4
22.4
24.1
17.4
38
21.1
30
29.9
17.3
0.607
0.606
0.590
0.512

JORDAN HUMAN DEVELOPMENT REPORT 2015 26
Gender Dimensions of Human Development: The Gender Inequality Index The Gender Inequality Index (GII) measures gender inequality in three dimensions of human development: reproductive health, empowerment, and economic status. It shows the human development costs of gender inequality in these three dimensions. The value of the GII ranges between 0 and 1, where 0 represents full gender equality and 1 represents full gender inequality. Thus, lower GII values indicate less inequality between the genders, and vice versa.
Jordan’s GII declined slightly from 0.488 in 2013 to 0.473 in 2014. This is true for Libya, Oman, Lebanon, and Tunisia as well who also experienced increased gender equality. The decline was steep in Oman, falling from 0.348 to 0.275 (Table 1.9). Of the five countries presented in the table, the GII was highest in Jordan and lowest in Libya in both 2013 and 2014. Evidently, when compared to the other four Arab countries in the table, Jordan needs to do a lot more to strengthen gender equality in the country.
2013
2014Female MaleFemale Male
GII value
GII Rank
Maternal Mortality
ratio
Adolescentbirth rate
(births per1,000 women
ages 15-19)
Female share of Seats in
Parliament (%)
Labor ForceParticipation
Rate (%)
Population with at Least Secondary
Education (%)
Jordan
Libya
Oman
Lebanon
Tunisia
High HDI category
Arab Countries
0.473
0.134
0.275
0.385
0.240
0.310
0.537
102
27
53
78
48
-
-
50
15
11
16
46
41
155
26.5
2.5
10.6
12.0
4.6
28.8
45.4
11.6
16.0
9.6
3.1
31.3
20.6
14.0
66.6
76.4
82.6
70.9
70.9
77.2
75.3
69.5
55.5
47.2
53.0
32.8
60.6
34.7
15.6
30.0
29.0
23.3
25.1
57.0
23.2
78.5
41.9
57.1
55.4
46.1
69.5
47.6
Table (1-9): Jordan’s GII and those of selected countries and groups, 2013 and 2014
Source: United Nations Development Programme (UNDP) 2014a, 2015
Jordan
Libya
Oman
Lebanon
Tunisia
High HDI category
Arab Countries
0.488
0.215
0.348
0.413
0.265
0.315
0.545
101
40
64
80
48
-
-
63
58
32
25
56
42
164
26.5
2.5
10.6
12
4.6
26.4
43.9
12
16.5
9.6
3.1
26.7
18.8
13.8
66.2
76.4
81.8
70.5
70.6
77.1
73.2
69.5
55.6
47.2
38.8
32.8
50.2
33.9
15.3
30
28.6
22.8
25.1
57
24.7
78.5
44
57.1
38.9
46.1
69.1
46.7
JORDAN HUMAN DEVELOPMENT REPORT 2015 27
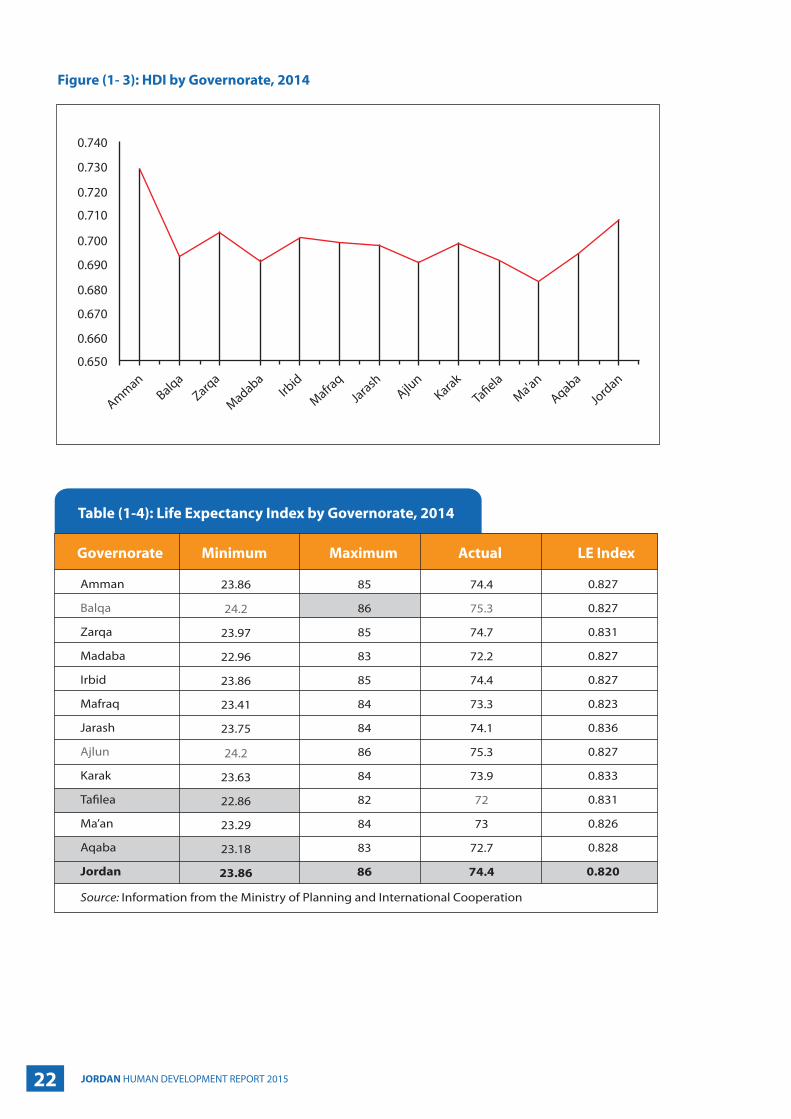
Looking at all countries in the high HDI group, the average GII was 0.310 in 2013 and 0.315 in 2014, which is much lower than Jordan’s GII for the same years. On the other hand, Jordan performs significantly better when compared to all 19 Arab countries for which data is available. The average value of the GII for these 19 Arab countries in 2013 was 0.537, which was significantly higher than Jordan’s (0.473).
Inequality across the three dimensions of the GII – reproductive health, empowerment, and economic status – varies. In regards to the health dimension, the maternal mortality ratio (women who died from pregnancy related causes) fell from 63 per 100,000 in 2013 to 50 per 100,000 in 2014, while the adolescent birth rate remained unchanged at 26.5. In terms of empowerment, the female share of parliamentary seats fell slightly (from 12.0 to 11.6 percent), while the share of females and males with at least secondary education stayed the same for both years; however, the proportion of males was 9 percentage points higher. There was a marginal rise in labor force participation rates for both genders in 2014, but the male rate was 4.3 times larger than the female rate (15.6 percent compared to 66.6 percent in 2014 and essentially the same in 2013).
The maternal mortality ratio is higher in Jordan than in Libya, Oman, Lebanon, and Tunisia: 50, compared to Tunisia’s second highest ratio of 46 in 2014. The adolescent birth rate is significantly higher in Jordan than in these four countries: 26.5, compared to Lebanon’s second highest rate of 12.0 in 2014. Jordan performs much better when it comes to females’ share of seats in parliament; of the five Arab countries in the table, it has the third largest female share (11.6 percent), with Tunisia topping the list (31.3 percent).
In terms of secondary education by gender, the rate was somewhat higher for males across all countries in 2104 – by an average of around 4.2 percent in Oman, Lebanon and Tunisia, and 9 percentage points in Jordan in favor of males. Interestingly, there is a reverse gender gap in Libya: 13.6 percentage points more females have at least secondary education than males.
The largest gender gap is in labor force participation rates. For Jordan, Libya, Oman, Lebanon, and Tunisia, the average participation rate for working-age females (ages 15 and older) was 24.6 percent compared to 73.5 percent for males in 2014. Jordan has the lowest female labor force participation rate (15.6 percent) and Tunisia the highest (25.1 percent). Jordan also has the lowest male labor force participation rate (66.6 percent); Oman has the highest (82.6 percent). Averaged across all Arab countries, the 2014 female labor force participation rate was 23.2 percent, compared to 75.3 percent for males.
Gender Dimensions of Human Development: The Gender Development Index The Gender Development Index (GDI) measures gender inequality in three basic dimensions of human development: health, measured by female and male life expectancy at birth; education, measured by female and male expected years of schooling, and female and male mean years of schooling; and standard of living, measured by female and male estimated earned income. In effect, the GDI is the female HDI as a percentage of the male HDI.

JORDAN HUMAN DEVELOPMENT REPORT 2015 28
2014
GD
I: Ra
tioof
fem
ale
to m
ale
HD
I
GD
I Ran
kH
uman
Dev
elop
men
t In
dex
Life
Exp
ecta
ncy
at B
irth
(Yea
rs)
Expe
cted
Year
s o
f Sch
oolin
g (Y
ears
)
Jord
an
Liby
a
Leba
non
Tuni
sia
Hig
h H
DI c
ateg
ory
Stat
es
0.67
4
0.69
9
0.71
8
0.67
1
0.72
4
0.61
1
0.7
84
0.73
6
0.80
0
0.75
1
0.75
9
0.71
9
0.8
60
0.95
0
0.89
9
0.89
4
0.95
4
0.84
9
5 2 5 5 - -
72.4
68.9
77.6
72.5
72.8
68.8
75.8
74.6
81.3
77.3
77.4
72.7
10.5
7.0
8.2
7.8
8.5
6.9
13.7
14.3
13.6
15.0
13.8
11.6
9.3
7.7
7.6
5.9
7.7
4.9
18,8
31
22,3
92
25,3
91
16.1
59
17.4
43
24.9
85
3,58
7
7,42
7
7,33
4
4,74
8
10,4
07
5,68
6
13.3
13.8
13.9
14.0
13.4
12.3
Tabl
e (1
-10)
: The
GD
I and
its c
ompo
nent
s: Jo
rdan
and
sele
cted
coun
trie
s and
gro
ups
Fem
ale
Mal
e
Mea
n Ye
ars o
f sc
hool
ing
(Yea
rs)
GN
I per
cap
ita (2
011
PPP
US$
)
Fem
ale
Mal
eFe
mal
eM
ale
Fem
ale
Mal
e
2013
Jord
an
Liby
a
Leba
non
Tuni
sia
Hig
h H
DI c
ateg
ory
Stat
es
0.65
8
0.74
9
0.71
5
0.66
9
0.71
0
0.62
6
0.7
81
0.80
5
0.79
4
0.75
1
0.75
0
0.72
2
0.8
42
0.93
1
0.9
0.89
1
0.94
6
0.86
6
130
93 110
116 - -
72.3
73.5
78.1
73.6
72.3
68.4
75.6
77.3
82.3
78.3
76.8
72.2
10.4
7.5
8.2
7.5
8.5
6.7
13.5
16.4
13 15 13.4
12.1
9.4
7.5
7.6
5.5
7.5
4.9
19,4
59
32,6
78
25,0
38
16,2
26
16,9
66
23,1
69
2,87
5
10,6
49
7,19
9
4,75
1
9,42
6
6,99
1
13.1
15.9
13.3
14 13.1
12.8
Fem
ale
Mal
e
Not
e: T
he ra
nkin
g sc
hem
e fo
r 201
4 is
diff
eren
t fro
m th
at fo
r 201
3. In
201
3, c
ount
ries w
ere
grou
ped
base
d on
the
valu
e of
the
GD
I; in
201
4, c
ount
ries w
ere
divi
ded
into
five
gro
ups b
y ab
solu
te d
evia
tion
from
gen
der p
arity
in H
DI v
alue
s.So
urce
: Uni
ted
Nat
ions
Dev
elop
men
t Pro
gram
me
(UN
DP)
201
4a, 2
015

JORDAN HUMAN DEVELOPMENT REPORT 2015 29
Jordan’s female HDI was 0.674 in 2014 and 0.658 in 2013; the male HDI was 0.784 and 0.781 respectively. The ratio of the female-to-male HDI yields a GDI of 0.860 in 2014 and 0.842 in 2013, which is a positive development towards increased gender equality across the three dimensions of human development. Jordan’s 2014 GDI ranked it 130 out of 187 countries. The ranking methodology for 2014 was different than previous years. Countries were divided into five groups based on the absolute deviation from gender parity in HDI values, with larger deviations indicating larger inequality and vice versa.3 Countries with the largest deviations fell into group 5, and those with the smallest into group 1. This methodology places Jordan in group 5 (Table 1.10).
For the four Arab countries included in the table, the average female and male HDI were 0.691 and 0.768 in 2014, and 0.698 and 0.783 in 2013. The GDI was 0.901 in 2014 and 0.891 in 2013; higher than Jordan’s GDI in both years. The average GDI for all Arab countries fell from 0.866 in 2013 to 0.849 in 2014. On the contrary, the average GDI for all countries globally in the high human development group rose slightly from 0.946 in 2013 to 0.954 in 2014; both values are higher than Jordan’s. This data shows that gender inequality is higher in Jordan than in the three other Arab countries in Table 1.10, higher than the average value of all Arab countries, and higher than the average value of all countries in the high human development group. This should be a major policy concern for the Jordanian authorities.
The Multidimensional Poverty IndexMost measurements of poverty are based on income or consumption. These metrics reveal an important dimension of deprivations but still provide an incomplete picture as people can be deprived in ways that are unrelated to income. For example, they may suffer from low education and few skills, poor health, low nutrition intake,
poor sanitation, and low quality of drinking water. The concept of multi-dimensional poverty represents an attempt to capture some of these “broader aspects of poverty.”4 The Multidimensional Poverty Index (MPI) identifies multiple deprivations at the household and individual level in health, education, and standard of living.5 It uses micro data from household surveys, and—unlike the Inequality-adjusted Human Development Index—all the indicators needed to construct the measure must come from the same survey. Each person in a given household is classified as poor or non-poor depending on the number of deprivations his or her household experiences. This data is then aggregated into a national measure of poverty. The MPI reflects both the prevalence of multidimensional deprivation, and its intensity—how many deprivations people experience at the same time. It can be used to create a comprehensive picture of people living in poverty, and permits comparisons both across countries and regions, as well as between ethnic groups, urban and rural areas, or other key household and community characteristics within countries. The MPI offers a valuable complement to income-based poverty measures.
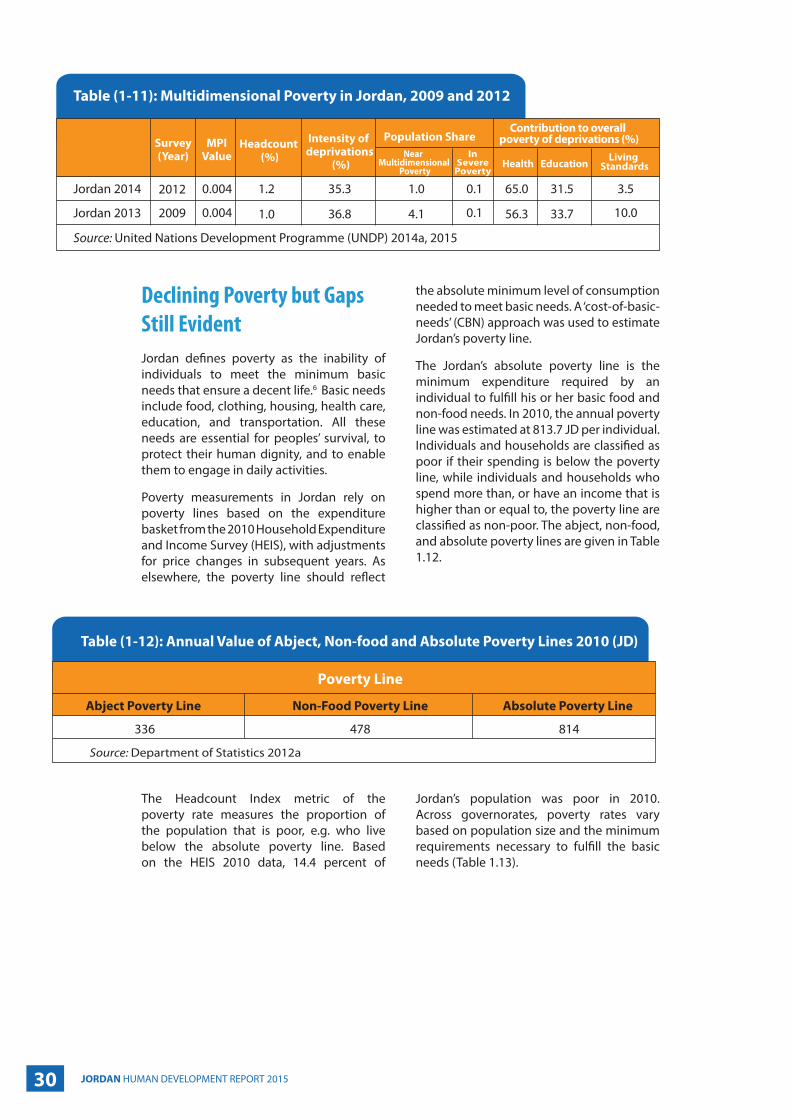
Jordan’s MPI has remained unchanged at 0.004 between 2009 and 2012 (Table 1.11), but the relative contributions of the education, health, and standard of living dimensions have changed. While health represented 56.3 percent of multidimensional poverty in 2009, this proportion grew to 65.0 percent in 2012. On the other hand, the relative importance of both education and standard of living has declined: the former from 33.7 percent to 31.5 percent, and the latter from 10.0 percent to 3.5 percent.
While the headcount of people living in multidimensional poverty increased slightly (from 1.0 percent to 1.2 percent), the intensity of deprivation fell by about 1.5 percentage points. The share of the population living near multidimensional poverty dropped sharply (from 4.1 percent to 1.0 percent), but the very small proportion living in severe poverty remained unchanged at 0.1 percent.
JORDAN HUMAN DEVELOPMENT REPORT 2015 30
The Headcount Index metric of the poverty rate measures the proportion of the population that is poor, e.g. who live below the absolute poverty line. Based on the HEIS 2010 data, 14.4 percent of
Jordan’s population was poor in 2010. Across governorates, poverty rates vary based on population size and the minimum requirements necessary to fulfill the basic needs (Table 1.13).
Declining Poverty but Gaps Still Evident Jordan defines poverty as the inability of individuals to meet the minimum basic needs that ensure a decent life.6 Basic needs include food, clothing, housing, health care, education, and transportation. All these needs are essential for peoples’ survival, to protect their human dignity, and to enable them to engage in daily activities.
Poverty measurements in Jordan rely on poverty lines based on the expenditure basket from the 2010 Household Expenditure and Income Survey (HEIS), with adjustments for price changes in subsequent years. As elsewhere, the poverty line should reflect
the absolute minimum level of consumption needed to meet basic needs. A ‘cost-of-basic-needs’ (CBN) approach was used to estimate Jordan’s poverty line.
The Jordan’s absolute poverty line is the minimum expenditure required by an individual to fulfill his or her basic food and non-food needs. In 2010, the annual poverty line was estimated at 813.7 JD per individual. Individuals and households are classified as poor if their spending is below the poverty line, while individuals and households who spend more than, or have an income that is higher than or equal to, the poverty line are classified as non-poor. The abject, non-food, and absolute poverty lines are given in Table 1.12.
Jordan 2014 2012 0.004
Table (1-11): Multidimensional Poverty in Jordan, 2009 and 2012
Survey(Year)
MPIValue
1.2 35.3 1.0 0.1
0.1
65.0 31.5 3.5
Jordan 2013
Headcount (%)
Intensity of deprivations
(%)
2009 0.004 1.0 36.8 4.1
Population ShareNear
Multidimensional Poverty
InSevere
PovertyHealth Education
Contribution to overall poverty of deprivations (%)
Living Standards
56.3 33.7 10.0
Source: United Nations Development Programme (UNDP) 2014a, 2015
Abject Poverty Line
336
Non-Food Poverty Line
478
Absolute Poverty Line
814
Poverty Line
Source: Department of Statistics 2012a
Table (1-12): Annual Value of Abject, Non-food and Absolute Poverty Lines 2010 (JD)

JORDAN HUMAN DEVELOPMENT REPORT 2015 31
Amman
Balqaa
Zarqa
Madaba
Irbid
Mafraq
Jerash
Ajloun
Karak
Tafila
Ma’an
Aqaba
Jordan
11.4
20.9
14.1
15.1
15.0
19.2
20.3
25.6
13.4
17.2
26.6
19.2
14.4
30.6
9.7
14.6
2.7
18.7
6.2
1.4
4.3
3.6
1.6
3.5
3.0
100
268,545
85,494
128,055
23,347
163,933
54,570
11,998
37,752
31,582
14,244
30,966
26,104
876,590
36,892
12,169
17,866
2,704
22,381
6,994
1,786
5,232
3,900
1,772
3,882
3,417
118,995
Poverty rate (%) Share of poor people(%)
No. of poor individuals
No. of poor Households
Table (1-13): Poverty Rates by Governorate
Source: Department of Statistics 2012a
Based on this data, the poverty rate was lowest in Amman and Karak, at 11.4 percent and 13.4 percent respectively. The poverty rate was highest in Ma’an (26.6 percent) and Ajloun (25.6 percent). 30.6 percent of poor people live in Amman, the governorate with the largest proportion of the population, and 18.7 percent live in Irbid. That is, almost half of all poor people in Jordan live in Amman and Irbid.
Another poverty measure is the poverty gap metric, which estimates the “depth” of poverty; that is, how far, on average, the poor are from the poverty line. Using this metric, the poverty gap reflects the monetary gap needed to move the poor from their position below the poverty line up to the poverty line itself. At the national level, Jordan’s poverty gap was 3.6 percent in 2010. On the governorate level, Ma’an recorded the highest poverty gap of 8.3 percent, followed by Ajloun with 6.3 percent. The lowest poverty gaps are in Jerash and Amman with
1.2 percent and 2.7 percent respectively. In monetary terms, the amount needed to fill the poverty gap in 2010 was 176.8 million JD. Figures 1.4 and 1.5 show the poverty gap and the monetary value of the poverty gap by governorate (in JD) respectively.
The lowest poverty rates are observed in Amman and Karak, where 11.4 percent and 13.4 percent of the population, respectively, are poor; they subsist below the national poverty line. In contrast, the highest poverty rates are found in Ma’an (25.5 percent) and Ajloun (25.6 percent).

JORDAN HUMAN DEVELOPMENT REPORT 2015 32
Figure (1-4): Poverty Gap by Governorate, 2010
Figure (1-5): Monetary Value of Poverty Gap by Governorate, 2010 (million JD)
2.7
5.9
3.4 3.7 3.6
5.6
1.2
6.3
3.7 3.5
8.3
4.3 3.6
AmmanBalqa
Zarqa
MadabaIrb
id
Mafraq
JarashAjlu
nKarak
TafielaMa'an
KingdomAqaba
Source: Department of Statistics 2012a
51.419.7 24.8
4.7
32.212.9 1.7 7.5 7 2.3 7.8 4.8
176.8
AmmanBalqa
Zarqa
MadabaIrb
id
Mafraq
JarashAjlu
nKarak
TafielaMa'an
KingdomAqaba
Source: Department of Statistics 2012a
The poverty severity index, which measures the extent of variation in the degree of poverty among the poor themselves, is calculated as the arithmetic mean of the square of poverty gaps.7 Higher values of this metric indicate greater inequality among the poor, and vice versa. Jordan’s national poverty severity index reached 1.21
percent in 2010. By governorate, Jerash had the smallest variation among the poor with a poverty severity rate of 0.27 percent, while Ma’an recorded the highest variation with a poverty severity rate of 3.36 percent. Figure 1.6 shows the variation of poverty severity across governorates.

JORDAN HUMAN DEVELOPMENT REPORT 2015 33
Figure (1-6): Poverty Severity Index by Governorate, 2010
AmmanBalqa
Zarqa
MadabaIrb
id
Mafraq
JarashAjlu
nKarak
TafielaMa'an
KingdomAqaba
0.86
2.11.17 1.04 1.18
2.24
0.27
1.951.31
0.85
3.36
1.48 1.21
Source: Department of Statistics 2012a
Looking at the trajectory of poverty over time, available data indicates that the poverty rate fell slightly, by 0.8 percentage points, between 2006 and 2008, but that there was a substantial decline (5 percentage points) between 2008 and 2010 (Figure 1.7)8
This trend appears consistent with macroeconomic trends, including real per capita GDP developments. The growth of both real per capita GDP and real GDP has pushed down the national poverty rate.
Before ending this section, it should be noted that Jordan adopted a new methodology in 2012 to derive the national poverty line and monitor the annual poverty rate. Because this data is updated at frequent intervals9, a quarterly profile of poverty can be constructed, which provides new insights into the dynamics of poverty in Jordan from one quarter to another. The imputation uses data from the HEIS and the Employment and Unemployment Survey (EUS). The main reason behind adopting the
new methodology is the interest from the Government of Jordan to better understand the extent and determinants of poverty among different subgroups in the population and to help assess the effectiveness of policy interventions. The preliminary estimates are encouraging. These numbers add a new dimension to poverty trends in the rapidly changing social-economic situation and could help the authorities get a better handle on the effectiveness of policies deployed to drive down poverty.
Figure (1-7): Poverty Trends from 2006 to 2010
20.3% 19.5% 14.4%
201020082006
Source: Calculation from Department of Statistics - The Hashemite Kingdom of Jordan 2010 ,2008 ,2006a
JORDAN HUMAN DEVELOPMENT REPORT 2015 34
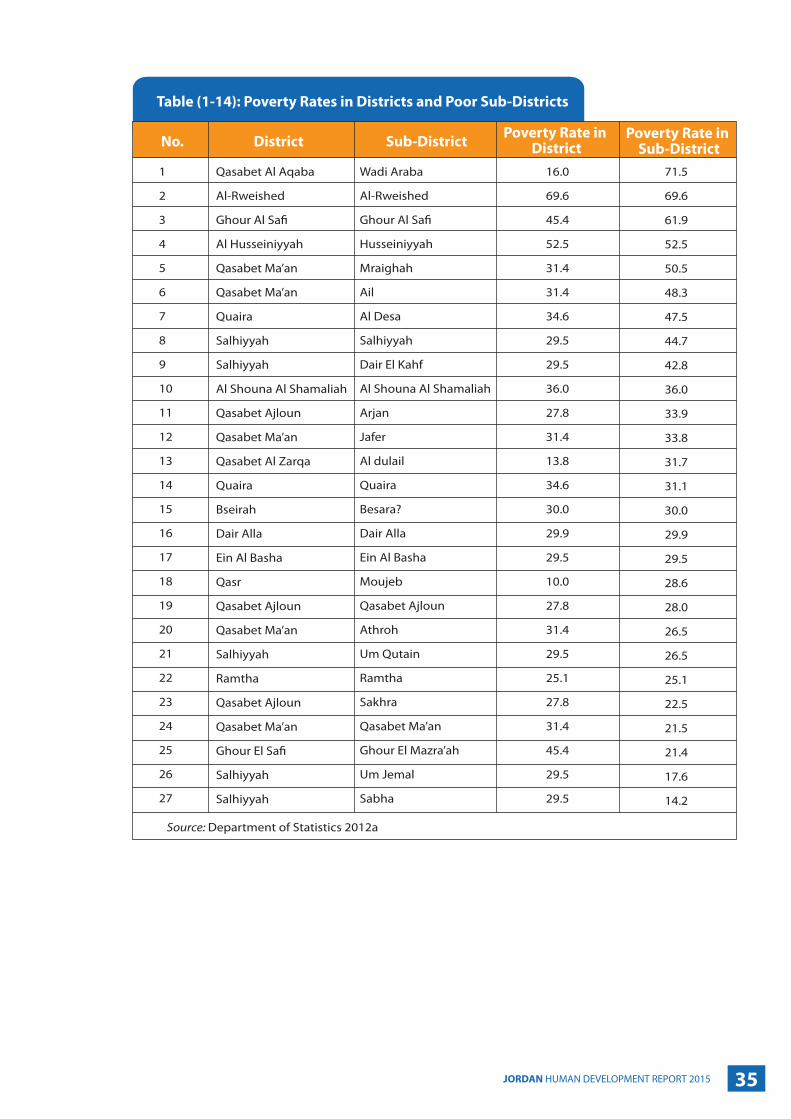
Deep Poverty Pockets Are Still Present Across GovernoratesAs part of its efforts to target regions lagging behind in human development, the Government categorizes a sub-district as a “poverty pocket” if it has a poverty rate of 25 percent or higher. Looking at the district level, all poor districts (poverty rate of at least 25 percent) are identified, and poor and non-poor sub districts are included in a poor district. A total of 24 poor sub-districts have been identified in these poor districts. In addition, there are three poor sub-districts located within non-poor districts, which brings the total number of poor sub-districts in the country to 27, distributed across all governorates. There are 6 poor sub-districts each in Ma’an and Mafraq; 3 each in Ajloun, Aqaba and Karak; 2 each in Balqaa and Irbid; and 1 each in Tafileh and Zarqa.
Identifying sub-districts of extreme poverty will enable targeted interventions by all stakeholders, including the government and civil society organizations, both local and international. Another advantage is that all poor people will have equal access to interventions designed to reduce the severity of poverty in the “poverty pocket” sub-districts. Meanwhile, all programs existing in the 14 sub-districts with poverty pockets in 2008 will continue in order to ensure that they no longer have to be classified as poor sub-districts for two consecutive periods.
The data on poorest sub-districts in 2010 reveal that 22 of the 27 poor sub-districts have poverty rates that are higher than 25 percent (Table 1.14). The highest poverty rate is observed in the sub-district of Wadi Araba, where 71.5 percent of the population lives in extreme poverty. The lowest poverty rate is seen in Al Ramtha sub-district, where 25.1 percent of the population is poor. Although these 27 sub-districts are distributed among all governorates, their overall rate of poverty was 31.6 percent, which is equivalent to 261,300 people. The extremely poor people in these sub-districts comprise 13.6 percent of Jordan’s overall population.
JORDAN HUMAN DEVELOPMENT REPORT 2015 35
Table (1-14): Poverty Rates in Districts and Poor Sub-Districts
1
2
3
4
5
6
7
8
9
10
11
12
13
14
15
16
17
18
19
20
21
22
23
24
25
26
27
Qasabet Al Aqaba
Al-Rweished
Ghour Al Safi
Al Husseiniyyah
Qasabet Ma’an
Qasabet Ma’an
Quaira
Salhiyyah
Salhiyyah
Al Shouna Al Shamaliah
Qasabet Ajloun
Qasabet Ma’an
Qasabet Al Zarqa
Quaira
Bseirah
Dair Alla
Ein Al Basha
Qasr
Qasabet Ajloun
Qasabet Ma’an
Salhiyyah
Ramtha
Qasabet Ajloun
Qasabet Ma’an
Ghour El Safi
Salhiyyah
Salhiyyah
Wadi Araba
Al-Rweished
Ghour Al Safi
Husseiniyyah
Mraighah
Ail
Al Desa
Salhiyyah
Dair El Kahf
Al Shouna Al Shamaliah
Arjan
Jafer
Al dulail
Quaira
Besara?
Dair Alla
Ein Al Basha
Moujeb
Qasabet Ajloun
Athroh
Um Qutain
Ramtha
Sakhra
Qasabet Ma’an
Ghour El Mazra’ah
Um Jemal
Sabha
16.0
69.6
45.4
52.5
31.4
31.4
34.6
29.5
29.5
36.0
27.8
31.4
13.8
34.6
30.0
29.9
29.5
10.0
27.8
31.4
29.5
25.1
27.8
31.4
45.4
29.5
29.5
71.5
69.6
61.9
52.5
50.5
48.3
47.5
44.7
42.8
36.0
33.9
33.8
31.7
31.1
30.0
29.9
29.5
28.6
28.0
26.5
26.5
25.1
22.5
21.5
21.4
17.6
14.2
No. District Sub-District Poverty Rate in District
Poverty Rate in Sub-District
Source: Department of Statistics 2012a
Table (1-13): The poverty rate in Poverty Pockets, 2010

JORDAN HUMAN DEVELOPMENT REPORT 2015 36
Significant Improvements in Gender Disparities, But Gaps Remain The status of Jordanian women has improved in recent years, especially when it comes to access to education and health care, and legislation intended to protect women’s rights both inside the home and at the workplace. The revision of the Social Security Law, in particular, has extended social protection to housewives, introduced maternity insurance and provided greater equality in retirement benefits. Jordan has invested heavily in health and education – about 10 per cent of its GDP – which benefits all citizens. The female school enrollment rose across all income groups, child health indicators – such as immunization and infant mortality rates – have improved, and fertility rates have declined, which indicates an improved health status of women. In addition, the representation of women in decision making and leadership positions in the political sphere is greater today, largely because of the increased quota for females in parliaments10 from 6 to 15. Women have also been appointed to various leadership positions.
Despite these significant steps, women’s economic and social opportunities are still smaller than men’s. This inequality stems from discriminatory legislation and entrenched patriarchal norms that curtail women’s freedom and autonomy. However, Jordan has put in place a framework to develop and implement gender policies which is overseen by the Jordan National Commission for Women (JNCW). The JNCW is a quasi-governmental body mandated by the Government of Jordan (GoJ) to improve the participation of women in the economic, social, and political life of the Jordan. To track compliance, a plan to monitor gender-related policies has been developed and included in the National Strategy on Women prepared by the JNCW. Unfortunately, JNCW’s impact is undermined by a lack of resources allocated to policy implementation. This is largely because activities in the National Strategy on Women are not directly funded from the public purse (government budget) and must often be
funded through line agencies that may not have the available resources. There is thus a disjuncture between responsibilities and the resources necessary to ensure the fulfillment of those responsibilities.
A recent report on the status of gender mainstreaming in the public sector, including institutions such as ministries, departments, and other government agencies, identified the following:
• Females account for 44.9 percent of all employed in the public sector
• Women represent 56.5 percent of all employees in human resources; 49.8 percent in health, environment, and social work; 30.7 percent in legislation and supervision; 29.5 percent in finance; 28.7 percent in the economic sector; 27.2 percent in culture and media; 26.4 percent in public affairs; 23.8 percent in infrastructure and telecommunications; 18.9 percent in natural resources; 17.5 percent in transport; and, 7.7 percent in religious and Islamic affairs.
• The share of female employees exceed that of males in three ministries: the Ministry of education (58 percent), the Ministry of Health, and the Ministry of Social Development (51 percent in each of the latter two).
• More than a fifth (22.22 percent) of all government ministries and other entities have units specializing in gender issues.
The Gender Gap Index (GGI)11 ranks countries according to their gender gap; their scores can be interpreted as the percentage of inequality between males and females. The GGI assesses countries on how well resources and opportunities are divided between males and females, regardless of the overall size of these resources and opportunities. The GGI examines the gender gap in four fundamental categories: (i) economic participation and opportunity (salaries, participation levels, and access to high-skilled employment); (ii) educational attainment (access to basic and higher level education); (iii) political empowerment (representation in decision-making bodies); and (iv) health and survival (life expectancy and sex ratio).

JORDAN HUMAN DEVELOPMENT REPORT 2015 37
According to the Global Gender Index 2014, Jordan’s GGI score was 0.597,12 which ranks Jordan 134 out of the 142 countries for which the index is calculated. The index on economic participation and opportunity places Jordan even lower, at a ranking of 140. The ranking on the sub-index for female labor force participation rate is also very low, 139, as well as the index on the estimated earned income (PPP US$) for females, on which Jordan ranks number 137. In terms of higher occupations, such as legislators, senior officials and managers, the gender gap is narrower, and Jordan ranks 119. For professional and technical workers, Jordan ranks number 111. In regards to wage equality, Jordan obtains a relatively good rank of 74. The issue of women’s employment has gained greater legitimacy as a result of activities led by female members of the royal family and royal NGOs.
Jordan’s ranking on the educational attainment index is much higher than on the index for economic participation and opportunity: 74. On the sub-indices for enrollment in secondary and tertiary education, Jordan ranked number one out of 142 countries, and on the index for primary education enrollment, Jordan ranked 104. On the sub-index for literacy rates, which is a summary index of educational outcomes, Jordan ranked 69.
With its score on the index of political empowerment, Jordan ranks 119. The score on this index is a function of the gender gap in: (1) high political decision-making positions (parliamentary positions), on which Jordan obtains a ranking of 107; (2) ministerial positions, on which Jordan ranks 98; and (3) heads of state (looking at the heads of state in the last 50 years), where Jordan ranks 64.
Finally, Jordan ranks 127 on the sub-index for health and survival. On the two sub-indices, sex ratio at birth (female/male) and healthy life expectancy, Jordan ranks 94 and 134, respectively. In order to discuss this more in detail, this National Human Development Report devotes a full chapter (Chapter 6) to gender disparities in Jordan.
Disparities Across Governorates and Regions is a Threat to ProgressJordan is divided into 12 governorates, according to the Administrative Divisions Order of the Ministry of Interior. These governorates are located in three regions: the North Region, the Central Region and the South Region. These three geographical regions are not based on area or population size, but rather by geographical connectivity and distance between population centers. Current regional disparities are mainly a result of demographic disparities (population size), distribution of wealth/income, and opportunities (or lack thereof ) for employment.
Jordan had a population of 6.5 million in 2013 (Table 1.15). Out of these, 82.6 percent lived in urban areas. 39 percent of the Jordan’s population are residents of Amman, 94 percent of whom live in urban areas. Another 18 percent of the population live in Irbid, where the urbanization rate is 83 percent. Zarqa has 15 percent of Jordan’s population, 95 percent of which are urban residents. Differences in urban density across governorates explain some of the disparities in education, healthcare, and other social and public services.
Data from the 2010 Household Expenditure and Income Survey reveal that the average annual income for a household with 5.4 members was 8,843 JD, which translated to an income of 1,637.6 JD per household member. By governorate, the average annual income was highest in Amman (10,670 JD), and lowest in Madaba (6,912 JD) and Balqaa (7,095 JD). Figure 1.8 presents a more complete picture of the household average annual income for 2010.
The nation-wide female labor force participation rate is very low. The Global Gender Gap Report from 2014 ranks Jordan as number 139 out of 142 countries.

JORDAN HUMAN DEVELOPMENT REPORT 2015 38
Table (1-15): Population distribution and density by governorate, 2013
Amman
Balqaa
Zarqa
Madaba
Irbid
Mafraq
Jerash
Ajloun
Karak
Tafila
Ma’an
Aqaba
Jordan
2,528,500
437,500
972,900
163,300
1,162,300
306,900
195,900
150,200
254,700
91,400
124,100
142,300
6,530,000
39
7
15
3
18
5
3
2
4
1
2
2
100
333.6
390.5
204.3
173.8
739.5
11.6
478
357.9
72.9
41.4
3.8
20.6
73.5
Governorate Total Population Population Share (%)
Population Density (p/km2)
Source: Department of Statistics - The Hashemite Kingdom of Jordan 2013a
Figure (1-8): Household average annual income by governorate, 2010 (JD)
Source: Calculation from Department of Statistics - The Hashemite Kingdom of Jordan 2010a
AmmanBalqa
Zarqa
MadabaIrb
id
Mafraq
JarashAjlu
nKarak
TafielaMa'an
KingdomAqaba
10,670
7,095 7,254 6,9127,951
7,2737,948 7,712
8,7547,359 7,649 7,516
8,842
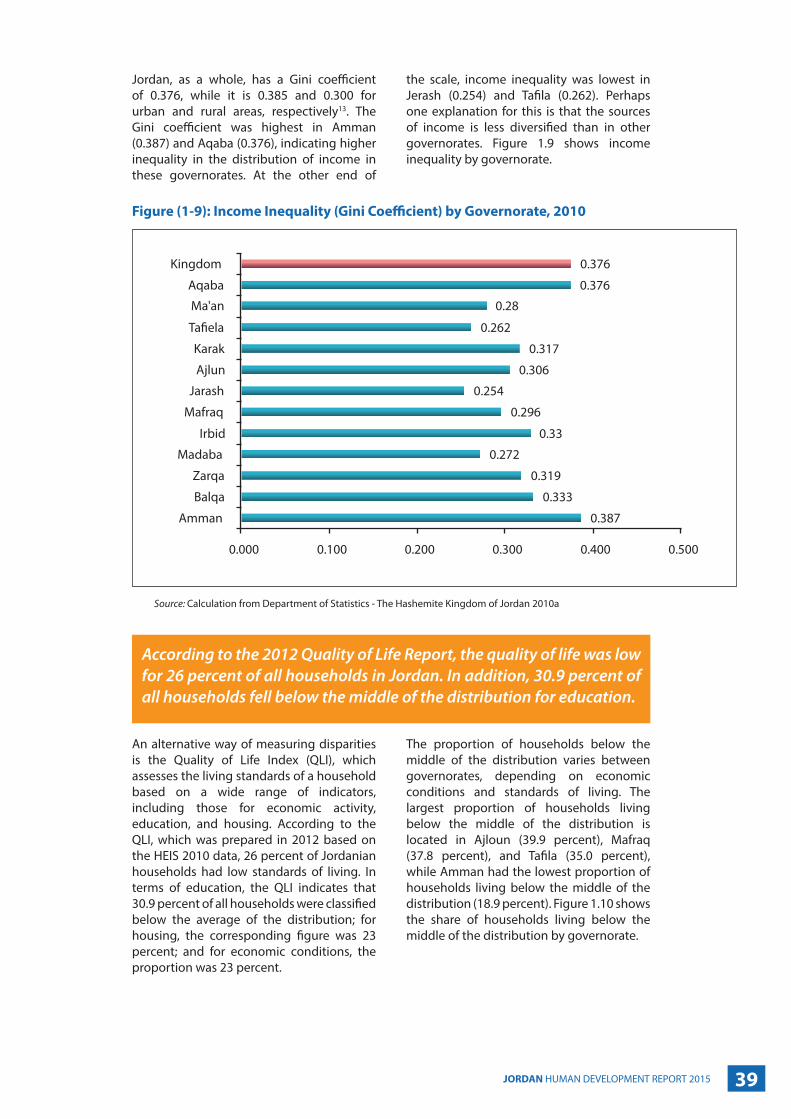
JORDAN HUMAN DEVELOPMENT REPORT 2015 39
Jordan, as a whole, has a Gini coefficient of 0.376, while it is 0.385 and 0.300 for urban and rural areas, respectively13. The Gini coefficient was highest in Amman (0.387) and Aqaba (0.376), indicating higher inequality in the distribution of income in these governorates. At the other end of
the scale, income inequality was lowest in Jerash (0.254) and Tafila (0.262). Perhaps one explanation for this is that the sources of income is less diversified than in other governorates. Figure 1.9 shows income inequality by governorate.
Figure (1-9): Income Inequality (Gini Coefficient) by Governorate, 2010
0.376
0.3760.28
0.262
0.317
0.3060.254
0.296
0.330.272
0.319
0.333
0.387
0.000 0.100 0.200 0.300 0.400 0.500
Kingdom
AqabaMa'an
Tafiela
Karak
AjlunJarash
Mafraq
IrbidMadaba
Zarqa
Balqa
Amman
Source: Calculation from Department of Statistics - The Hashemite Kingdom of Jordan 2010a
An alternative way of measuring disparities is the Quality of Life Index (QLI), which assesses the living standards of a household based on a wide range of indicators, including those for economic activity, education, and housing. According to the QLI, which was prepared in 2012 based on the HEIS 2010 data, 26 percent of Jordanian households had low standards of living. In terms of education, the QLI indicates that 30.9 percent of all households were classified below the average of the distribution; for housing, the corresponding figure was 23 percent; and for economic conditions, the proportion was 23 percent.
The proportion of households below the middle of the distribution varies between governorates, depending on economic conditions and standards of living. The largest proportion of households living below the middle of the distribution is located in Ajloun (39.9 percent), Mafraq (37.8 percent), and Tafila (35.0 percent), while Amman had the lowest proportion of households living below the middle of the distribution (18.9 percent). Figure 1.10 shows the share of households living below the middle of the distribution by governorate.
According to the 2012 Quality of Life Report, the quality of life was low for 26 percent of all households in Jordan. In addition, 30.9 percent of all households fell below the middle of the distribution for education.

JORDAN HUMAN DEVELOPMENT REPORT 2015 40
One possible explanation for these high numbers is the Syrian crisis, which has resulted in a massive influx of refugees to Jordan beginning in March 2011. The number of refugees increased from 1,500 persons at the end of 2011 to over 1.4 million persons by the end of November 2014. From a human development perspective, the humanitarian requirements for such a huge influx of people are mainly good shelter, child protection, healthcare, education, nutrition, protection of women, and local host communities’ acceptance and engagement. Fortunately, financial support and in-kind assistance to deal with the crisis has been coming from both the formal and informal sectors. Even so, both UNHCR and the Government of Jordan have pointed out the inadequate size of assistance given the magnitude of the crisis. In addition, some studies criticized informal sector organizations for being unorganized, lacking adequate coordination, and for being unresponsive in certain cases. More details on the Syrian refugee crisis will be discussed in the last section of this chapter.
Even before the Syrian crisis began however, the GoJ made a comprehensive effort to mitigate regional disparities: it developed 12 development plans, one for each governorate for 2013-2016. The total cost of these development plans is estimated at 5.866 billion JD, including 4.694 billion JD for projects and government programmes
already committed to and those who will be included in the budget for the duration of the plan. The GoJ will meet all costs necessary to ensure that the governorate development plans are successful.
Beyond these plans, the World Bank currently provides support to several programmes that are intended to address socio-economic gender imbalances and improve access to justice. Several other donors currently have projects that focus on gender issues.
The Syrian Refugee Crisis has Aggravated Regional DisparitiesIt is impossible to discuss human development challenges and regional disparities in Jordan without addressing the implications of the Syrian refugee crisis.14 According to official Jordanian data, the number of Syrian refugees and Syrian migrants residing in either official camps or outside of camps in the Jordan reached around 230,000 by the end of 2012, but rose to over 550,000 by the end of 2013 (officially registered refugees).15 The latest official data show that the total number of Syrians residing in Jordan, refugees and non-refugees, was around 1.4 million at the end of 2014.
Figure (1-10): Proportion of Households Below the Average of the QLI distribution by Governorate, 2010
AmmanBalqa
Zarqa
MadabaIrb
idMafra
qJarash
Ajlun
KarakTafiela
Ma'anAqaba
39.9 37.834.6
32.228.6 28.4 26.9 26.9 25.6
18.9
3235
Source: Department of Statistics - The Hashemite Kingdom of Jordan 2012b.

JORDAN HUMAN DEVELOPMENT REPORT 2015 41
Over half of the refugees at the end of 2013 were females. If children aged 11 years and younger are included, then that figure rises to over 70 percent. 17 percent of these refugees are under 5 years old and another 21 percent between the ages of 5-11. Thus, about 38 percent of the Syrian refugees were children. But the largest proportion of refugees, 29 percent, were between 18-35 years. Only 3.5 percent were 60 years and above (Table 1.15). The extent of the challenges posed by the large number of refugees, including the overwhelming share of females and children younger than 12 years old, cannot be underestimated – from the challenges of providing social protection, health, education and social care, to basic commodities such as gas and bread. Because these services are already distributed unequally among governorates, as this NHDR will demonstrate, the huge additional demand caused by the refugee crisis has serious implications, including a worsening of current regional disparities. The sudden growth of Jordan’s population will certainly pose a challenge to human development. The following may be noted:16
• Education: the huge influx of Syrian refugees will affect the education sector because it increases class sizes and has led to a two-shift school schedule that has cut class time by almost 20 percent. Needless to say, this will aggravate regional disparities in the education system across governorates and widen disparities between Amman and other governorates.
• Infrastructure: the sudden, unexpected increase of Jordan’s population has overstretched the country’s infrastructure and led to an erosion of its quality. The cost of maintaining and
improving the infrastructure is thus an additional burden that Jordan has to confront
• Bordering cities: cities in the north (Mafraq and Irbid) host a large fraction of refugees, which imposes a heavier tax on their socio-economic development. To date, these governorates have not received adequate assistance to cope with the challenges and costs of hosting Syrian refugees.
From the beginning of the crisis, Jordan has coordinated with UNHCR. The first wave of Syrian refugees began with a few Syrian families seeking shelter with Jordanian families in bordering towns, especially Ramtha. Shortly after, the Al Za’atari Camp was established in Mafraq, followed by two other main camps in the city of Azraq.
Data obtained from the PSD and Jordan Hashemite Charity Organization (JHCO), displayed in Tables 1.16 and 1.17, show the numbers, distribution and locations of Syrian refugees as of early 2014. This data covers all persons entering Jordan, including those who entered through official entry points as well as those who entered through non-official entry points along the 375 km-long border. Around 81 percent of the refugees who do not live in refugee camps are located in Amman and the two governorates that border to Syria, namely Mafraq (35 percent) and Irbid (21 percent). This means that Mafraq and Irbid host over 56 percent of the Syrian refugees who do not live in refugee camps, which impose a huge burden on public service and infrastructure. Official data, as well as data from the JHCO, show that the average Syrian refugee family is composed of 5.8 persons, which is not far from Jordan’s average of 5.6.
Females
Males
Total
Share of total (%)
49551
50651
100202
17.2
59263
61351
120793
20.7
40621
42460
83081
14.3
90596
78512
169108
29.0
0-4 YearsAge 5-11 Years 12-17 Years 18-35 Years
50013
39376
39389
15.3
36-59 Years
11727
8443
20170
3.5
+60 years
301771
280972
582743
100
Total
Table (1-16): Some characteristics of Syrian refugees andresidents in Jordan (as of early 2014)
Source: Information from the Ministry of Interior, Syrian Refugee Camp Directorate 2014

JORDAN HUMAN DEVELOPMENT REPORT 2015 42
Al Za’atari/ Mafraq
Sakan Al Hadeeqa/ Ramtha
Murejeb Al Fuhood Camp/ Mafraq
Sakan Camp/ Mafraq
Outside the camps
Total officially registered refugees
Refugees guaranteed through the governor
Departures to Syria
Non-refugee Syrian residents
Total Syrian residents in Jordan
112,874
810
3,848
1,260
431,593
550,385
32,006
54,000
750,000
1,302,717
Location of Refugees Number (thousands)
Table (1-17): Syrian Refugees: Distribution by Location(as of early 2014)
Source: Information from the Ministry of Interior, Syrian Refugee Camp Directorate 2014
Table (1-18): Syrian Refugees: Relative distribution by location
Mafraq
Al Za’atari
Murejeb Al Fuhood
Irbid
Amman
Zarqa
Balqaa
Jerash
Ajloun
Madaba
Karak
Ma’an
Aqaba
Tafilah
Others
65.0
126,3
3,8
130,1
143,5
46,5
15,5
10,7
10,0
8,2
8,8
6,4
2,4
2,2
3,4
10.5
24.4
0.7
21,1
23.7
8.3
2.5
1.8
1.7
1.3
1.6
1.0
0.4
0.4
0.7
City/Town Numbers in thousands Percentage (%)
Source: Information from the Ministry of Interior, Syrian Refugee Camp Directorate2014PSD, SRCD.

JORDAN HUMAN DEVELOPMENT REPORT 2015 43
In Conclusion: Much Progress, But Still a Long Way to Go The value of Jordan’s Human Development Index was 0.748 in 2014, up by 0.003 points from the previous year. Of the 188 countries for which the HDI was calculated in 2014, Jordan ranked 77, down three positions from 2013. Even so, the value of its HDI placed Jordan, along with five other Arab countries, in the high human development category (the HDI was computed for 19 Arab countries in both 2013 and 2014). Further, Jordan was among the top 10 countries in this group, occupying the 9th position. Even more remarkably, Jordan’s HDI value was higher than both the average (0.735 in 2013 and 0.744 in 2014) for countries in the high human development group as well as the average (0.682 in 2013 and 0.686 in 2014) for Arab countries. However, the value of Jordan’s 2014 HDI was lower than that of two Arab countries in the high human development group – Oman (0.793) and Lebanon (0.769). Jordan still has a long way to go considering that there were six Arab countries (Qatar, Saudi Arabia, United Arab Emirates, Bahrain, and Kuwait) among the 49 countries globally that secured a place in the very high human development group.
Jordan’s HDI increased by 27.4 percent between 1980 (0.587) and 2014 (0.748). The life expectancy at birth, one of the dimensions of the HDI, increased by 7.8 years, from 66.2 years to 74.0 years, reflecting improvements in the quality of healthcare in particular. The expected years of schooling increased by 1.6 years during the same period, while the mean years of schooling increased by 6.8 years, which bears testimony to greater access to education. Gross national income (PPP $) per person rose by around 45 percent during the same period. But while Jordan’s human development progress looks impressive at the national level, huge disparities exist across regions and governorates and between urban and rural areas. Spatial inequalities is thus an important developmental issue that Jordan needs to address.
Discounting for inequality across the HDI dimensions produced an overall loss of 18.6 percent in 2013 and 16.5 percent in 2014 (an IHDI value of 0.607 and 0.625, respectively). There has been progress on gender issues, however. The value of the Gender Development Index (GDI) increased from 0.842 to 0.860, while the Gender Inequality Index (GII) declined from 0.488 to 0.473 (smaller values equal lower inequality). Indeed, there has been significant progress in regards to gender equality, particularly in regard to access to education, health, and improvements in legislation to protect women’s rights within the home and at the workplace. In addition, Jordan has a framework in place for designing and implementing gender policies. On the 2014 Global Gender Index (GGI), which measures the gender gap, Jordan received a score of 0.597, which ranked it 134 out of 142 countries. The sub-index for economic participation and opportunity ranks Jordan as the bottom country – 140th. The female labor force participation rate, one of the indicators for this sub-index, is also low (a rank of 139), which is similar to the indicator on estimated earned income (PPP US$) for females, on which Jordan ranks number 137.
Based on data from 2009 and 2012, Jordan’s value on the multidimensional poverty index (MPI), which measures deprivations in multiple dimensions, was 0.004 both years. One percent of the country’s population lived in multidimensional poverty in 2009, but this number rose slightly to 1.2 percent in 2012. An additional 4.1 percent were at risk of living in multidimensional poverty in 2009 but this number decreased to 1.0 percent in 2012. The intensity of deprivation, which is measured by the number of deprivations that people in multidimensional poverty experience, was 36.8 percent and 35.3 percent in 2009 and 2012, respectively. Even though this kind of data does not exist at the regional and governorate levels, national data on poverty is available. The annual poverty line for Jordan was estimated at 813.7 JD per person and the poverty rate (headcount index) was 14.4 percent in 2013. At the level of governorates, the lowest poverty rate was observed in Amman (11.4 percent) and Karak (13.4 percent), while the highest was in Ma’an (26.6 percent) and Ajloun (25.6 percent).

JORDAN HUMAN DEVELOPMENT REPORT 2015 44
Across governorates, the proportion of households living below the middle of the distribution of the Quality of Life Index varies. The highest proportion of households living below the middle of the distribution live in Ajloun (39.9 percent), Mafraq (37.8 percent) and Tafila (35.0 percent). In comparison, Amman had the smallest proportion of households living below the middle (18.9 percent).
As the report notes, Government interventions have contributed significantly to mitigating regional disparities, specifically, the GoJ’s 12 development plans, one for each governorate, covering the period of 2013-2016. The intention is to use these plans to alleviate disparities between regions by creating decent job opportunities, building capacities, increasing accessibility to microfinance, and improving infrastructure.
Remainder of the ReportThe main aim of this National Human Development Report is to assess human development efforts in Jordan over the last few years, particularly since the last NHDR in 2011. In particular, the Report focuses on human development disparities across regions and governorates, as well as between certain segments of society.
Chapter 1 provides an overview of the human development trends in Jordan, concentrating on the Human Development Index, the poverty map, and gender issues. Chapter 2 examines developments of the education system in Jordan, with particular focus on knowledge-based education and educational disparities across geographical locations. Chapter 3 is devoted to the country’s health sector, and looks at the quality of health care, public-private partnerships, and youth and gender issues. Employment and livelihood is the focus subject of Chapter 4, with special attention paid to labor market performance, SMEs and MSMEs, women’s participation and empowerment, and regional livelihood disparities. Issues related to youth and empowerment are discussed in Chapter 5, including youth and poverty, youth and education, youth voice and participation, and regional disparities. Chapter 6 analyzes issues that affect women in a social, economic, and political context, including female economic participation. Chapter 7 is devoted to issues related to local development: municipality development strategies, participation in policy-making, good governance, decentralization, and local development and initiatives. Access to justice, stability of laws and regulations, law and order, and the judiciary system are discussed in Chapter 8. The final chapter of this NHDR summarizes major findings and provides policy recommendations to further human development and to narrow regional disparities.

JORDAN HUMAN DEVELOPMENT REPORT 2015 45
Empowered lives. Resilient nations.
EDUCATION

JORDAN HUMAN DEVELOPMENT REPORT 2015 46
CHAPTER TWOEDUCATION

JORDAN HUMAN DEVELOPMENT REPORT 2015 47
Introduction For many years, Jordan’s education system has been one of the best in the region. Observers usually refer to the fact that between 1999 and 2007, Jordan experienced continuous improvements in education at all levels. This has been the case since the mid-twentieth century. Education played a major role in the economic and social renaissance of Jordan. Educational reform efforts started in the early 1990s and included: national education standards; teaching English as a foreign language from grade one and computer science from grade 7; and developing curricula to fit the current knowledge gaps. The main goal is for Jordanian students to meet the requirements of the modern labor market, and to contribute to sustainable development.
Part one of this chapter discusses the Jordanian education system and its rank in the Arab world. Jordan’s education system used to be considered the most efficient
education system among developing countries and many countries in the region developed their education system with the Jordanian model in mind.
This chapter tackles critical issues in the education sector and it will be organized as follows: part (1) presents Jordan’s educational infrastructure; part (2) describes the educational system in Jordan; part (3) depicts the knowledge-based education in Jordan; and, part (4) sheds lights on regional disparities in education.
Jordan’s Educational Infrastructure The Ministry of Education (MoE) is responsible for pre-school, primary, and secondary education. The post-secondary education is the responsibility of the Ministry of Higher Education and Scientific Research (MoHESR). Technical and Vocational Education and Training (TVET) at the secondary level (excluding community
Figure (2-1): Education Ladder
Source: Ministry of Education, Statistical Report 2012/2013
Year
BA. 4th Year
BA. 3rd Year
BA. 2nd Year
BA. 1st Year
Grade
2nd sec.
1st sec.
Grade 10
Grade 9
Grade 8
Grade 7
Grade 6
Grade 5
Grade 4
Grade 3
Grade 2
Grade 1
KG2
KG1
Age
Age
21
20
19
18
17
16
15
14
13
12
11
10
9
8
7
6
5
4
Higher UnIv. Education
Bachelor Degree
Basic Education
Pre-School Education
General Secondary Certificate Examination
Comprehensive Secondary Education (Academic & Vocational) Applied Secondary Education
(Training Centers & Apprenticeship)
CommunityColleges
Labor Market
Educational Ladder

JORDAN HUMAN DEVELOPMENT REPORT 2015 48
colleges), as well as applied vocational education, is administered by the Vocational Training Corporation (VTC), which is under the authority of the Ministry of Labor. The education system in Jordan consists of two years of pre-school education, ten years of compulsory basic education, and two years of secondary academic or vocational education, after which students take a General Certificate of Secondary Education
Exam—Tawjihi. Figure (2-1) illustrates the Education Ladder for the Jordanian education system.
Different authorities are responsible for education in Jordan. The different schools include: Ministry of Education schools, private schools, schools operated by UNRWA, and other governmental institutions. The distribution of schools by authority is presented in table (2-1) below.
MOE supervises 3,545 schools, of which 2,300 are basic education schools, 1,243 are secondary schools, and two are kindergartens. The total number of private schools is 2,600. The majority of private schools are kindergartens, namely 1,542, while the number of private basic and secondary schools are 828 and 230 respectively. The number of other governmental and UNRWA
schools are 37 and 173 respectively. In regards to other governmental schools, only three are basic schools and 34 are secondary schools. UNRWA operates 172 basic schools but only one secondary school. Neither UNRWA nor other governmental institutions provide kindergartens. Table (2-2) shows the distribution of schools by authority, education cycle, and gender.
Male
Female
Co-Ed
Total
1,295
538
1,712
3,545
Ministry of Education
64
15
2,521
2,600
Private Schools
31
3
3
37
Other Governmental
Schools85
71
17
173
UNRWAGender
1,475
627
4,253
6,355
Total
Table (2-1): Distribution of schools by authority and gender in Jordan, 2012-2013
Source: Ministry of Education - The Hashemite Kingdom of Jordan 2013
Male
Female
Co-ed
Total
0
0
2
2
748
237
1,315
2,300
547
301
395
1,243
1,295
538
1,712
3,545
4
2
1,536
1,542
18
2
808
828
42
11
177
230
64
15
2,521
2,600
0
0
0
0
1
1
1
3
30
2
2
34
31
3
3
37
0
0
0
0
0
0
0
0
1
0
0
1
85
71
17
173
Gender Ministry of education Private Schools Other GovernmentalSchools UNRWA
Table (2-2): Distribution of schools by authority, education cCycle and genderin Jordan, 2012-2013
Source: Ministry of Education - The Hashemite Kingdom of Jordan 2013
Kind
erga
rten
Basi
c
Seco
ndar
y
Tota
l
Kind
erga
rten
Basi
c
Basi
c
Seco
ndar
y
Seco
ndar
y
Basi
c
Seco
ndar
y
Tota
l
Kind
erga
rten
Tota
l
Kind
erga
rten
Tota
l

JORDAN HUMAN DEVELOPMENT REPORT 2015 49
The number of class units by education cycle differs among schools. The total number of class units in MOE schools is 44,493: 35,655 are for basic education, 7,778 for secondary education, and 1,060 are for kindergartens. In private schools, the total number of class units is 20,339: 13,986 are for basic education,
1,329 are for secondary education, and 5,024 are for kindergarten. The class units in UNRWA and other governmental schools are 3,348 and 575 respectively. Table (2-3) shows the distribution of class units by authorities, gender, and education cycle.
Jordan’s Education System a. Pre-school education (Kindergarten)
is two years long. It consists of activities that are intended to develop children’s cognitive skills before their entry into elementary school. Kindergarten is for children aged 4 and 5. In 2013, the gross
enrollment rate in kindergarten was 38.3 percent: the enrollment rate was 38.5 percent for boys and 38.1 percent for girls. The total number of students enrolled in kindergarten was 111,771, of which 58,408 students were boys and 53,363 students were girls. The distribution of the students by authority is illustrated in table (2-4) below.
Table (2-3): Distribution of class units by authority, education cycle and genderin Jordan, 2012-2013
Male
Female
Co-ed
Total
15
7
1,038
1,060
13,177
14,457
8,021
35,655
3,588
4,166
24
7,778
16,780
18,630
9,083
44,493
174
102
4,748
5,024
2,791
1,813
9,382
13,986
546
497
286
1,329
3,511
2,412
14,416
20,339
0
0
6
6
374
55
23
452
103
12
2
117
477
67
31
575
0
0
0
0
1,600
1,552
167
3,319
29
0
0
29
1,629
1,552
167
3,348
Gender
Ministry of education Private Schools Other GovernmentalSchools UNRWA
Source: Ministry of Education - The Hashemite Kingdom of Jordan 2013
Kind
erga
rten
Basi
c
Seco
ndar
y
Tota
l
Kind
erga
rten
Basi
c
Basi
c
Seco
ndar
y
Seco
ndar
y
Basi
c
Seco
ndar
y
Tota
l
Kind
erga
rten
Tota
l
Kind
erga
rten
Tota
l
Table (2-4): Distribution of kindergarten students byauthority and gender, 2012-2013
Ministry of Education
Private Schools
Other Governmental Schools
UNRWA
Total
10,323
47,972
113
0
58,408
10,832
42,426
105
0
53,363
21,155
90,398
218
0
111,771
Authority Male Female Total
Source: Ministry of Education - The Hashemite Kingdom of Jordan 2013

JORDAN HUMAN DEVELOPMENT REPORT 2015 50
In kindergartens under the authority of MOE, the ratio of male to female teachers is 1 to 1,060. In private kindergartens, other governmental kindergartens, and kindergartens run by UNRWA, there are no male teachers. In comparison, 5,757 female teachers work in UNRWA-run kindergartens and six female teachers are employed in both private and other governmental kindergartens.
b. Basic Education:
Basic education is a 10-year compulsory level of education designed for children aged 6 to 15 years. The Government of Jordan (GoJ) puts a great emphasis on basic education
because it recognizes the important role that education plays in creating a knowledgeable work-force. Therefore, the GoJ has made basic education free in all government schools.
The total number of students enrolled in basic education reached 1,396,264 in the academic year 2012-2013; the number of male students was 713,407 while the number of female students was 682,857. MOE schools enroll 69 percent of students in basic education, while 22 percent attend private schools, 8 percent attend UNRWA schools, and 1 percent attend other governmental schools. Table (2-5), shows the distribution of students enrolled in basic education.
The gross enrollment rate in basic education reached 99.1 percent during the year 2012-2013; for females it reached 100 percent and for males it reached 97.9 percent. The high enrollment rate is reflected in declining illiteracy rates among those aged 6-15 years. The total number of dropouts in
basic education was 4,252, of which 2,238 were male and 2,014 were female. The total number of students who repeated one or more grades was 14,601; 8,045 of them were male and 6,556 were female. The distribution of dropouts and students who repeated one or more grades is shown in table (2-6).
Table (2-5): Distribution of students enrolled in basic education byauthority and gender in Jordan, 2012-2013
Ministry of Education
Private Schools
Other Governmental Schools
UNRWA
Total
458,466
187,839
10,283
56,819
713,407
504,842
120,250
2,311
55,454
682,857
963,308
308,089
12,594
112,273
1,396,264
Authority Male Female Total
Source: Ministry of Education - The Hashemite Kingdom of Jordan 2013
Table (2-5): Distribution of Basic Education Students by Authority, Gender in the Kingdom, 2012-2013

JORDAN HUMAN DEVELOPMENT REPORT 2015 51
The total number of teachers in basic education was 79,845. The proportion of female teachers was 68 percent compared to 32 percent for male teachers. 70 percent of all teachers worked in schools under the authority of MOE, followed by 24 percent in private schools, 5 percent in schools operated by UNRWA, and only 1 percent in other governmental schools.
c. Secondary Education:
Secondary education is comprised of two additional years of study for students aged 16 to 18 who have completed the basic cycle (ten years). It consists of two major orientations: the academic orientation and the vocational orientation. At the end of the two-year period, students sit for the general secondary education examination (Tawjihi) in the appropriate branch and those who pass are awarded the Tawjihi (General Secondary Education Certificate). The academic orientation qualifies students entrance to universities, whereas the
vocational or technical orientation qualifies students entrance to Community Colleges and Universities, provided that they pass two additional subjects. They can also choose to enter the job market. Practical secondary education, which is managed by the Vocational Training Corporation, provides intensive vocational training and apprenticeship that lead to a different certificate than Tawjihi. Students get practical training through apprenticeships, and not through school workshops as is the case in vocational secondary education.
The total number of students in secondary education reached 218,796; the number of male students was 105,188 while that of female students was 113,608. MOE schools enroll 86.7 percent of all secondary education students. 12 percent of students are in private schools, 1 percent are in other governmental schools, and 0.25 percent are in UNRWA schools. Table (2-7) shows the distribution of secondary education students.
Table (2-6): Distribution of dropouts and repeaters in basic education by grade and gender in Jordan, 2012-2013
123
60
346
201
225
212
252
237
294
288
2,238
115
61
235
154
203
175
172
250
313
336
2,014
238
121
581
355
428
387
424
487
607
624
4,252
223
166
133
480
680
869
1,245
1,570
1,542
1,137
8,045
177
86
106
461
636
637
1,020
1,283
1,313
837
6,556
400
252
239
941
1,316
1,506
2,265
2,853
2,855
1,974
14,601
Source: Ministry of Education - The Hashemite Kingdom of Jordan 2013
GradeDropouts Repeaters
Male Female Total Male Female Total
1
2
3
4
5
6
7
8
9
10
Total Basic
st
nd
rd
th
th
th
th
th
th
th

JORDAN HUMAN DEVELOPMENT REPORT 2015 52
The enrollment rate in secondary education is 80.4 percent. The female enrollment rate is higher than the male enrollment rate; 87 percent of females are enrolled in secondary education compared to 74.3 percent of males. The total number of dropouts was 1,002 students; 63 percent were female and 37 percent were male. The number of students who dropped out of 12th grade was higher than for 11th grade; 462 students
dropped out of 11th grade compared to 540 students who dropped out of 12th grade. The total number of students who repeated a grade was 989; 54 percent of them were male and 46 percent were female. The number of students who repeated 11th grade was 576 and the number of students who repeated 12th grade was 413. The distribution of dropouts and repeating students is presented in table (2-8).
The total number of teachers in secondary education was 23,344. The percentage of female teachers was greater than that of male teachers; 54 percent were female and 46 percent were male. The highest percentage of teachers (80 percent) worked in schools under the authority of MOE, followed by private schools (17 percent), other governmental schools (2.7 percent), and UNRWA schools (0.3 percent).
d. Vocational Education:
The Ministry of Education provides high school vocational training in 193 schools. The total number of vocational education graduates in 2011-2012 was 26,137; 18,005 of the students were male and 8,132 were female. In the 11th grade, there were 13,692 students; the number of male students was 9,514 while the number of female students was 4,178. In the 12th grade, the total number of students was 12,444; 8,491 students were male and 3,954 students were female.
Table (2-7): Distribution of secondary education students by authority and gender in Jordan, 2012-2013
Ministry of Education
Private Schools
Other Governmental Schools
UNRWA
Total
88,121
14,651
1,851
565
105,188
101,392
11,861
355
0
113,608
189,513
26,512
2,206
565
218,796
Authority Male Female Total
Source: Ministry of Education - The Hashemite Kingdom of Jordan 2013
Table (2-5): Distribution of Basic Education Students by Authority, Gender in the Kingdom, 2012-2013
Table (2-8): Distribution of dropouts and repeaters in secondary education by grade and gender in Jordan, 2012-2013
184
187
371
278
353
631
462
540
1,002
320
213
533
256
200
456
576
413
989
Source: Ministry of Education - The Hashemite Kingdom of Jordan 2013
GradeDropouts Repeaters
Male Female Total Male Female Total
11
12
th
th
Total Secondary
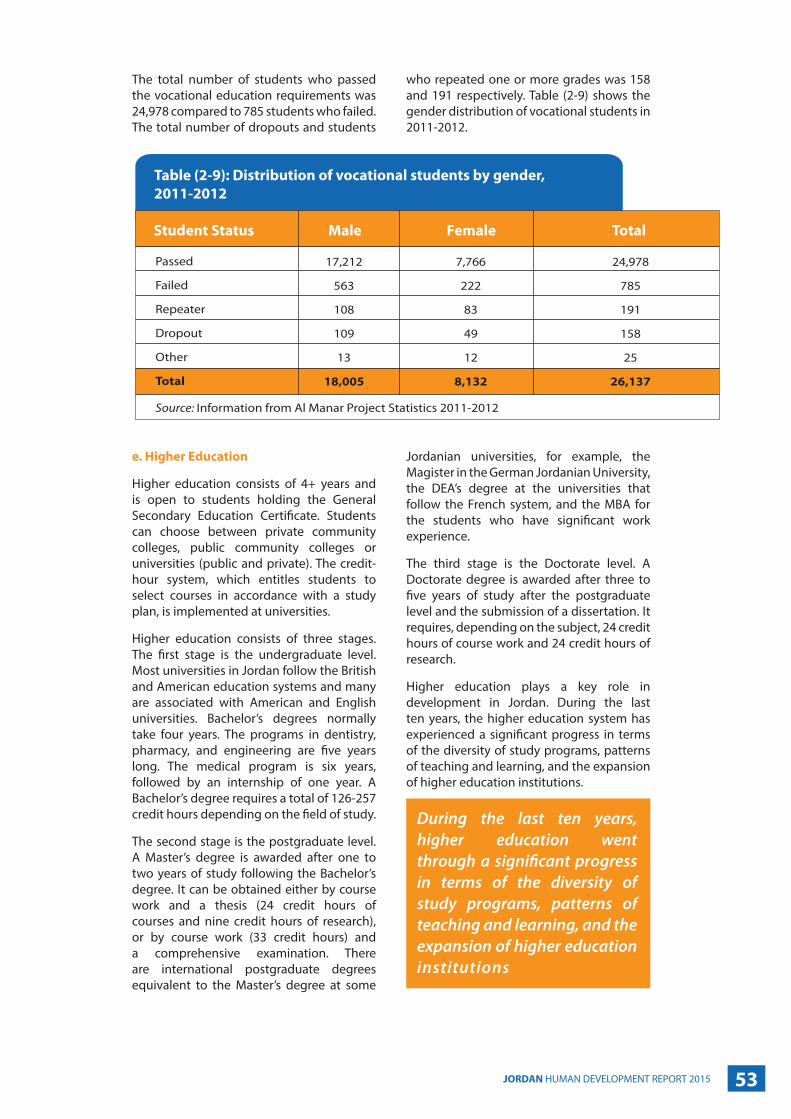
JORDAN HUMAN DEVELOPMENT REPORT 2015 53
The total number of students who passed the vocational education requirements was 24,978 compared to 785 students who failed. The total number of dropouts and students
who repeated one or more grades was 158 and 191 respectively. Table (2-9) shows the gender distribution of vocational students in 2011-2012.
e. Higher Education
Higher education consists of 4+ years and is open to students holding the General Secondary Education Certificate. Students can choose between private community colleges, public community colleges or universities (public and private). The credit-hour system, which entitles students to select courses in accordance with a study plan, is implemented at universities.
Higher education consists of three stages. The first stage is the undergraduate level. Most universities in Jordan follow the British and American education systems and many are associated with American and English universities. Bachelor’s degrees normally take four years. The programs in dentistry, pharmacy, and engineering are five years long. The medical program is six years, followed by an internship of one year. A Bachelor’s degree requires a total of 126-257 credit hours depending on the field of study.
The second stage is the postgraduate level. A Master’s degree is awarded after one to two years of study following the Bachelor’s degree. It can be obtained either by course work and a thesis (24 credit hours of courses and nine credit hours of research), or by course work (33 credit hours) and a comprehensive examination. There are international postgraduate degrees equivalent to the Master’s degree at some
Jordanian universities, for example, the Magister in the German Jordanian University, the DEA’s degree at the universities that follow the French system, and the MBA for the students who have significant work experience.
The third stage is the Doctorate level. A Doctorate degree is awarded after three to five years of study after the postgraduate level and the submission of a dissertation. It requires, depending on the subject, 24 credit hours of course work and 24 credit hours of research.
Higher education plays a key role in development in Jordan. During the last ten years, the higher education system has experienced a significant progress in terms of the diversity of study programs, patterns of teaching and learning, and the expansion of higher education institutions.
Table (2-9): Distribution of vocational students by gender,2011-2012
Passed
Failed
Repeater
Dropout
Other
Total
17,212
563
108
109
13
18,005
7,766
222
83
49
12
8,132
24,978
785
191
158
25
26,137
Male Female Total
Source: Information from Al Manar Project Statistics 2011-2012
Table (2-5): Distribution of Basic Education Students by Authority, Gender in the Kingdom, 2012-2013
Student Status
During the last ten years, higher education went through a significant progress in terms of the diversity of study programs, patterns of teaching and learning, and the expansion of higher education institutions

JORDAN HUMAN DEVELOPMENT REPORT 2015 54
According to the participants in one of the workshops held to discuss education issues in Jordan during the research phase of this report, Jordan has realized multiple achievements despite the challenges that the higher education system has faced. This is demonstrated by the increase in the number of: higher education institutions; enrolled students; faculty members; administrative and academic members; and the volume of expenditures and government financial support to the education sector. As a result, there are now 10 public universities, 17 private universities, and 51 community colleges, in addition to the World Islamic Sciences and Education University. However, some participants in the workshop mentioned above stressed the fact that maintaining quality education, including both higher and postgraduate education, is one of the biggest challenges Jordan is facing.
The rise in the number of universities is accompanied by a significant increase in the number of enrolled students. In the year 2012-2013, 268,150 students were enrolled at Jordanian universities. The total number of students in public universities was 201,495; in private universities, 66,655 students were enrolled. At public universities, female enrollment was greater than male enrollment; 113,959 female students were enrolled, compared with 87,536 male students. At private universities, it was the opposite; 42,810 male students and 23,845 female students were enrolled. Table (2-10) shows the distribution of students in private and public universities by gender and degree.
The total number of graduate students from other Arab and foreign countries enrolled at public universities was 2,266; 79 students are studying for the higher diploma degree, 1,754 students for the Master’s degree, and 433 students for a PhD degree. The total number of graduate students enrolled at private universities was 963; 942 students studied for the Master’s degree and 21 students studied for the PhD degree.
Knowledge-Based Education in Jordan Knowledge-based education depends on the interactive relationship between information technology and basic education procedures. Information and education procedures should be merged in the same data structure. In order to maintain that structure, a comprehensive program for Education Reform for Knowledge Economy (ERFKE) was introduced. This program aims to create an effective, knowledge-
Table (2-10): Students enrolled at Jordanian universities by degree andgender, 2012-2013
79,572
739
5,931
1,294
87,536
B.A / B.Sc
M.A / M.Sc
Higher Diploma
PhD
Total
106,045
1,609
5,379
926
113,959
185,617
2,348
11,310
2,220
201,495
40,914
12
1,786
98
42,810
22,901
21
892
31
23,845
63,815
33
2,678
129
66,655
Source: Ministry of Higher Education and Scientific Research –The Hashemite Kingdom of Jordan 2013
DegreePublic Universities Private Universities
Male Female Total Male Female Total

JORDAN HUMAN DEVELOPMENT REPORT 2015 55
based development process focused on developing the abilities, skills, attitudes, and values associated with a knowledge-based economy.
There are four components of the ERFKE program. Component 1 is to re-orient education policy objectives and strategies through governance and administrative reform. The five sub-components of the first component consist of: a) a redefined vision and comprehensive national education strategy; b) revised governance, management, and decision-making mechanisms to achieve and support an education system that delivers basic skills and essential learning for the knowledge economy; c) an Education Decision Support System (EDSS) to facilitate efficient policy analysis and effective system management, as well as to promote transparency; d) comprehensive and coordinated educational research as well as monitoring and evaluation activities; and e) effective management and efficient coordination of educational investments directed towards reform efforts. Additionally, support will be provided to school-based innovations.
Component 2 transforms education programs and practices for the knowledge economy. There are three sub-components: a) developing new curricula and enhanced learning assessments; b) supporting the professional development of the Ministry of Education’s personnel; and c) providing necessary resources to support effective learning.
Component 3 is designed to ensure safe school buildings and improved learning environments. Two sub-components include: a) replacing unsafe and overcrowded schools; and b) upgrading existing schools to support learning in the knowledge economy by providing computer and science labs.
Component 4 promotes early childhood education. It is designed to strengthen equality in low-income areas by providing kindergarten for children of age 5. The sub-components include: a) enhancing institutional capacity for early childhood education; b) developing a cadre of ECE educators; c) increasing access to kindergartens for the poor; and d) fostering parent and community participation and partnership (public awareness and understanding).
The first phase of the Education Reform for the Knowledge Economy Program (ErfKE I) ran from 2003-2009 and ended in June 2009 after five and a half years of implementation. The second phase of the Program (ErfKE II) continues to build on the achievements of the first phase and follows the same implementation arrangements that proved to be successful in ErfKE I. It focuses on schools as important drivers of change as well as on the need to enhance capacity building at the central and local levels. The development objective of ErfKE II is to provide students enrolled in pre-tertiary education institutions in Jordan with necessary skills so that they can participate in the knowledge economy.
There is an additional reform initiative, namely, the Jordan Education Initiative (JEI). This initiative represents an innovative program created to explore how technology can be effectively used to encourage innovation among teachers and students. Furthermore, JEI seeks to develop and test an efficient public-private partnership model to accelerate education reforms in developing countries. The JEI includes the development and implementation of six e-learning curricula in one hundred pilot schools called “Discovery Schools” around the country. The new curricula use technology and the internet to engage students with the material in new ways, create learning strategies that are research and project-oriented, and get students involved in shaping their own education. In addition to improving education for Jordan’s students, JEI also aims to build the capacity of Jordan’s ICT industry for the development of innovative learning solutions through local partners who are developing the educational software.
While JEI and ErfKE represent Jordan’s largest education reform efforts, His Majesty King Abdullah II has supported many other
The Jordan Education Initiative (JEI) represents an innovative program created to explore how technology can be effectively used to encourage innovation among teachers and students

JORDAN HUMAN DEVELOPMENT REPORT 2015 56
programs to help students and teachers, to enhance the educational environment, and to improve the knowledge-based education overall. These programs are:
• EduWave: This is the first program of its kind, both at the local and regional level, and began as an e-learning project applied in schools around the Jordan and financed by the King Abdullah II Fund for Development. The program offers e-solutions to teach students at all stages using an interactive graphic interface. The system enables teachers to employ interactive examples, models, and scientific experiments to supplement conventional textbook material. The effort to computerize all public schools began in 1999 and came to an end in 2005; all selected schools were computerized and connected electronically. Many other Middle Eastern countries have also benefitted from this model.
• Teachers’ Housing: King Abdullah has consistently pursued programs that encourage more young people to be teachers. The Ministry of Education now offers scholarships for aspiring teachers, while the King himself has initiated programs to provide high-quality subsidized housing for teachers, particularly in rural and under-served areas.
• Student Welfare: Students’ well-being is also a critical focus for King Abdullah. After national surveys conducted in the 1990s revealed serious health deficiencies among school children, including Vitamin A and D, as well as iron deficiencies which have a detrimental impact on learning abilities, the King directed the Ministry of Planning and International Cooperation to implement a school nutrition program. This program provides students with a healthy mid-morning snack that includes milk, fruit, and protein and vitamin-enriched
biscuits. The program includes UNRWA, army-run schools, and government schools, and is expanded annually. In addition, King Abdullah issued directives to provide schoolchildren with vitamins on a daily basis to improve their health and nutrition intake and to bolster their immunity against illness and disease. This project is implemented cooperatively by the Ministry of Education and the Jordan Armed Forces.
• Winter Coats Distribution: In 2005, King Abdullah II launched a campaign to distribute winter coats among schoolchildren in grades one through six. Upon the King’s directives, all compulsory level students in public schools were to be given winter coats before the winter season every year to help them and to alleviate their parents’ financial burdens. In 2008, the project was expanded to include all students in public, military, and UNRWA schools, benefitting more than 1.5 million students. Prior to the start of the 2006-2007 school year, King Abdullah also contributed 110,000 schoolbags to public school students in grades 1-12, focusing on students living in poor areas. Each schoolbag contained all the required stationery and school supplies.
• School heating project: In order to improve conditions in public schools, to enhance learning, and to achieve the principle of equal opportunity, King Abdullah issued directives to heat all public schools. In 2007, 31,000 heaters were provided.
• Exemption of School Fees: To alleviate parents’ financial burden during difficult economic times, the King instructed the government to exempt all public school students from fees for the 2008-2009 academic year. More than 1.3 million students benefitted from this royal initiative, at a cost of more than 5 million JD.

JORDAN HUMAN DEVELOPMENT REPORT 2015 57
However, in spite of the substantial resources that the country has spent on knowledge-based education and the knowledge-based economy, the recent Arab Knowledge Report (AKR) from 2014 found some shocking results regarding the level of skills and knowledge of students at the university level. The authors of the report conducted surveys on a sample of Arab youth in four Arab countries in their final year of university studies: UAE, Jordan, Tunisia, and Morocco. Jordanian students ranked the lowest among all four countries in all skill areas that the report was analyzing. These skills were related to: problem solving, written communication, searching for and processing information, use of technology, and use of a foreign language in understanding and writing17. According to the AKR, Jordan’s results “indicate a weakness in the different levels of education, particularly in the areas of cognitive communication through writing and the use of languages and technology”.18 The AKR concluded that despite the fact that information and communication technologies (ICT) are widely used and highly integrated in the teaching and learning processes worldwide, Arab countries in particular are struggling to fully integrate ICT in the education system; Jordan is not an exception according to the findings of the report.
Educational and Regional Disparities Jordanian authorities have invested heavily in the expansion of the number of schools to make access to schools more equally distributed. Yet, discrepancies remain between the number of schools located in urban and rural areas; 64 percent of schools are located in urban areas and only 36 percent are located in rural areas. On the governorate level, Amman has the highest proportion of schools (32 percent), followed by Irbid (18 percent) and Zarqa (11 percent). These governorates are also considered the largest in terms of population size. The lowest proportion of schools are located in Tafila and Aqaba (2 percent in each). Figure (2-2) shows the distribution of schools by governorate.
According to the ARK, Jordan‘s results “indicate a weakness in the different levels of education, particularly in the areas of cognitive communication through writing and the use of languages and technology”
Figure (2-2): Distribution of of schools by governorate, 2012-2013
AmmanBalqa
Zarqa
MadabaIrb
id
Mafraq
JarashAjlu
nKarak
TafielaMa'an
Aqaba
7%
32%
11%
18%
8%
4% 3%3%6%
2% 2%4%
Source: Ministry of Education – The Hashemite Kingdom of Jordan 2013.

JORDAN HUMAN DEVELOPMENT REPORT 2015 58
The 2010 Quality of Life Index (QLI) looks at different education indices and analyzes disparities across governorates. Measured by the distance to primary and secondary schools, 53.3 percent of households in Jordan fall below the average QLI value. In terms of distance to primary schools, 44 and 42 percent of households in Amman and Balqaa respectively live below the average QLI value . In Aqaba, Tafila, and Zarqa, the percentages are 13, 15, and 18 percent respectively.
In terms of distance to secondary schools, the percentage of households below the average QLI level was very low. Aqaba and Ma’an have the highest percentages of households, with 5 and 3 percent respectively. Figure (2-3) shows the disparities in distance to primary and secondary schools.
The lack of enough class units in schools is a major issue as it results in overcrowded classrooms. There are 68,755 class units in Jordan. Tafila and Aqaba have the lowest proportion of class units with 1.9 and 2.3 percent respectively, followed by Ajloun (2.6 percent), Ma’an (2.8 percent), and Madaba (2.9 percent). As Figure (2-4) shows, Amman and Irbid have the highest share of class units with 35.8 and 17.4 percent respectively.
Based on the overcrowding criteria, 60.1 percent, 51.4 percent, 37.3 percent, and 36.9 percent of households in Aqaba, Zarqa, Amman and Jarash fall below the average QLI value. Ma’an has the lowest proportion of households that fall below the average QLI value with 4 percent, followed by Mafraq and Karak with 4.5 and 7.4 percent respectively. In secondary education, Zarqa has the highest proportion of households below the average QLI value with 77.2 percent, while Ma’an still has the lowest proportion, 19.2 percent. Figure (2-5) shows the overcrowding in classrooms by governorate.
Figure (2-3): Distance to primary and secondary school by governorate, 2010
Below Middle Middle High
KingdomAqabaTafielaZarqa
IrbidMafraq
Ma'anAjlun
MadabaKarakBalqa
AmmanJarash
0.0 20.0 40.0 60.0 80.0 100.0
33.5 31.6 34.913.1 30.1 56.7
44.0 41.214.917.7 28.9
33.038.936.0
46.524.5
37.116.1 42.4
23.7
20.240.2
39.737.8
53.444.3
32.4 23.830.0 13.7
22.623.224.3
33.335.3
39.241.5
43.953.3
Below Middle Middle High
KingdomAqabaTafielaZarqa
IrbidMafraq
Ma'anAjlun
MadabaKarakBalqa
AmmanJarash
0.0 20.0 40.0 60.0 80.0 100.0
46.9 52.456.2 43.8
52.5 47.429.3
28.448.3
45.946.0
52.350.244.2 54.4
48.7
53.645.9
53.751.3
70.471.2
40.6 56.844.9 50.2
Source: Department of Statistics - The Hashemite Kingdom of Jordan 2010b

JORDAN HUMAN DEVELOPMENT REPORT 2015 59
Figure (2-4): Distribution of class units by governorate, 2012-2013
Figure (2-5): Overcrowding in Classrooms in basic and secondary education by governorate, 2010
AmmanBalqa
Zarqa
MadabaIrb
id
Mafraq
JarashAjlu
nKarak
TafielaMa'an
Aqaba
35.8%
6.9%
12.2%
2.9%
17.4%
6.8%3.3% 2.6%
5.0%1.9% 2.8% 2.3%
Source: Ministry of Education – The Hashemite Kingdom of Jordan 2013
Kingdom
Ma'an
Karak
Mafraq
Irbid
Ajlun
Madaba
Balqa
Amman
Zarqa
Aqaba
Tafiela
Jarash
0% 20% 40% 60% 80% 100%
Below Middle Middle High
54
19.2
25
27.9
37.5
39.1
41.8
44.6
51.2
51.4
59.4
71.6
77.2
39.1
64.5
60.5
50.9
56.3
52.4
44.5
41.4
44.5
39.2
37.1
25.1
19.6
6.8
16.2
14.5
21.1
6.2
8.4
13.6
13.9
4.2
9.4
3.6
3.3
3.2
Kingdom
Ma'an
Mafraq
Karak
Jarash
Madaba
Ajlun
Irbid
Amman
Aqaba
Zarqa
Balqa
Tafiela
0% 20% 40% 60% 80% 100%
Below Middle Middle High
33.0 56.6 10.4
38.6
32.6
21.8
17.5
8.7
11.0
12.6
7.9
14.0
7.8
4.8
14.0
57.5
62.9
70.7
73.9
77.5
70.9
66.4
62.1
49.0
54.9
43.7
25.9
3.9
4.5
7.4
8.6
13.9
18.1
21.0
30.0
36.9
37.3
51.4
60.1
Source: Department of Statistics - The Hashemite Kingdom of Jordan 2010b

JORDAN HUMAN DEVELOPMENT REPORT 2015 60
Looking at average number of students per teacher, the results indicate that Zarqa has the highest number of students per teacher, 19.92, followed by Amman and Balqaa with 16.94 and 16.28 students respectively, while Ma’an has 10.13 students per teacher and Tafila 11.01 students per teacher. The average number of students per class unit
on the governorate level also shows that Zarqa, Amman, and Balqa have the highest number of students per teacher (29.8, 26.4, and 24.8 respectively) compared with the lowest numbers in Ma’an, Mafraq, and Karak (17.8, 18.8, and 20.3 respectively).
Public-Private Partnerships in Education: Funding Quality, and Disparities Public-private partnerships (PPP) can be used to diagnose different factors affecting successes and failures; PPP was applied in this way during the assessment of the Jordan Education Initiative. It can also define the necessary components when building an effective solution to a problem. It has two parts: the model itself and the outcomes derived from its implementation.
The Jordan Education Initiative (JEI) is a global and local public-private partnership that aims to improve education in Jordan through the effective use of information and communication technologies (ICTs), while at the same time building the capacity of the local ICT industry and creating a model for reform that other countries can mimic. The JEI has already achieved some remarkable results: engagement of over 30 active partners from the public and private sectors; development of a full math e-curriculum (grades 1-12); ongoing usage of in-classroom technology and training in 50 Discovery Schools; transfer of ~$3.7 million to local companies that are participating in the JEI programs; and, initial steps to expand the model to other countries in the Middle East. The Jordan Education Initiative has
Amman
Balqaa
Zarqa
Madaba
Irbid
Mafraq
Jerash
Ajloun
Karak
Tafila
Ma’an
Aqaba
26.36
24.79
29.87
22.65
25.9
18.78
23.36
22.4
20.25
20.84
17.96
25.68
16.94
16.28
19.92
13.95
15.82
11.52
14.62
13.96
11.11
11.01
10.13
14.99
Average number of studentsper class unit
Average number ofstudents per teacher
Table (2-11): Student to class unit ratio and student to teacherratio by governorate, 2012-2013
Source: Ministry of Education – The Hashemite Kingdom of Jordan 2013

JORDAN HUMAN DEVELOPMENT REPORT 2015 61
brought together a wide range of global and local organizations from the private, public, and non-governmental sectors. International private companies provided much of the project’s initial leadership, vision and resources, and it covered funding gaps and implemented innovative programs in some schools. The local ICT industry has been responsible for the day-to-day implementation of many of the most advanced programs (e.g., e-curricula development), and has provided important encouragement and entrepreneurial skills. Some bigger local companies have even played the same role as international private companies by funding and leading programs and providing overall project management. Finally, academics have been called upon to provide international education expertise and best practices and to monitor the ongoing impact of the initiative. However, the partnership structure is highly flexible – there is more than one partnership model within the JEI. This aligns with the decentralized nature of the Jordan Education Initiative. While there is a central Program Management Office, it is a small body whose role is limited to coordination
and facilitation of partner activities. The responsibility for program implementation and delivery of results rests with the partners themselves.
The JEI has already achieved some remarkable results: engagement of over 30 active partners from the public and private sectors; development of a full math e-curriculum (grades 1-12); ongoing deployment of in-classroom technology and training to 50 Discovery Schools; transfer of ~$3.7 million to local companies as part of JEI programs; and, initial steps to expand the model to other countries in the Middle East
Figure (2-6): Key partners of the Jordanian education initiative
Key partners of the Jordan Education Initiative
Global Cisco Systems*Computer Associates*Corning Cable SystemsDellDHLFrance Telecome/JordanTelecomHPIntelMicrosoftPearsonsVector Capital/Commerical WareAramexe-DimensionsFastlinkIntajITGMenhajMobileComRazorviewRubiconSTSSynttex
Private Sector Public sector NGOs/Foundations AcademicsNon-governmental sector
Local
USAID MEPI (US State Dept.)British CouncilNorth VirginiaTechnology Council
US government
Jordaniangovernment Ministry of Education Ministry of ICT Ministry of Planning Other govrnment agencies
Cisco LearningInstituteKrach FamilyFoundationReuters DigitalVision FoundationWorld EconomicFormWorld Links
University of Keele
Int@jNetcorps JordanYoungEntrepreneursAssociationJordan
22 4 8 1
15
19
Total=35
* Initiative Partners

JORDAN HUMAN DEVELOPMENT REPORT 2015 62
Conclusions
Basic, secondary, and higher education is available in all regions of the Jordan. Both the public and private sectors, including UNRWA, provide education services as well as after school programs.
However, from a regional perspective, the noticeable discrepancy between the number of schools located in urban and rural areas; 64 percent of schools are located in urban areas but only 36 percent are located in rural areas. On the governorate level, Amman has the highest number of schools (32 percent), followed by Irbid (18 percent), and Zarqa (11 percent), which is reasonable since these governorates are the most populated. The lowest number of schools were found in Tafila and Aqaba (2 percent in each). The lack of sufficient class units causing overcrowding in classrooms is another big concern. Out of a total of 68,755 class units in the Jordan, Tafila and Aqaba have the lowest proportion (1.9 percent and 2.3 percent respectively), followed by Ajloun (2.6 percent), Ma’an (2.8 percent), and Madaba (2.9 percent).
Zarqa has the highest number of students per teacher (19.92), followed by Amman and Balqaa, 16.94 and 16.28 respectively, while Ma’an has 10.13 students per teacher and Tafila has 11.01 students per teacher. The number of student per class unit are highest in Zarqa (29.8), Amman (26.4), and Balqaa (24.8). The numbers are lowest in Ma’an (17.8), Mafraq (18.8), and Karak (20.3).
Providing incentives to the private sector could strengthen the opportunities for public-private partnerships, which could be a tool to bridge these regional disparities in Jordan. The Jordan Education Initiative (JEI) is a public-private partnership with both domestic and international partners that seek to improve education in Jordan through effective use of information and communication technologies (ICTs). At the same time, the JEI also builds the capacity of the local ICT industry and aims to create a model for education reform for other countries to mimic.
According to participants in three workshops that were held in preparation for this report in Amman, Irbid, and Ma’an, the quality of all levels of education needs to be improved. The participants in both the Irbid and Ma’an workshop also pointed to the issue of quality disparities in education between the capital of Amman and the other governorates as well as between main cities and rural areas within the same governorates. Furthermore, policy makers need to pay more attention to vocational education in order to increase the enrollment of students in these programs.
There is a noticeable discrepancy in the proportion of schools between urban and rural areas. 64 percent of schools are located in urban areas while only 36 percent are located in rural areas. On the governorate level, Amman has the highest proportion of schools with 32 percent, followed by Irbid with 18 percent, and Zarqa with 11 percent. These governorates are also the most populated areas of the country.

JORDAN HUMAN DEVELOPMENT REPORT 2015 63
Empowered lives. Resilient nations.
HEALTH

JORDAN HUMAN DEVELOPMENT REPORT 2015 64
CHAPTER THREE HEALTH

JORDAN HUMAN DEVELOPMENT REPORT 2015 65
The Jordanian health sector is fairly advanced and has improved the health status of the population. Life expectancy at birth increased from 69.9 to 73.7 years between 1990 and 2012, which is higher than the MENA region’s average of 72.2 years.
IntroductionOver the past decades, the Jordanian health sector has developed into a relatively modern system that provides both advanced medical services and basic primary care at comparatively low costs to patients. The health care system is characterized by a clear separation between the public and the private sector, both with respect to service provision and health financing. Furthermore, the Government of Jordan has introduced various reform measures to improve the performance of the sector in several areas, including pharmaceuticals and medical devices.
The Jordanian health sector is fairly advanced and has improved the health status of the population over the last twenty years. Life expectancy at birth increased from 69.9 years in 1990 to 73.7 years in 2012, which is higher than the MENA region’s average of 72.2 years. The Jordan Population and Family Health Survey (JPFHS) from 2012 found that there has been significant progress towards attaining the health-related millennium development goals (MDGs).19 The maternal mortality ratio (MMR) declined from 86 per 100,000 live births in 1990 to 50 in 2013.20 Child mortality indicators have also improved. The infant mortality rate (IMR) has been reduced from 34 per 1,000 live births in 1990 to 17 in 2012. In the same period (1990-2012), the under-5 mortality rate (U5MR) has also declined; from 39 to 21 per 1,000 live births. With these improvements in child and maternal health, Jordan performs better than many other countries of similar income level, both within and outside of the MENA region. These outcomes can be explained by several factors, including relatively high levels of literacy, access to preventative and curative services, and improvements in water and sanitation. Moreover, Jordan has reached almost universal coverage in terms of antenatal care, births attended by a skilled health professional, and child immunization.21
Notwithstanding these achievements, the Jordanian health sector continues to face several challenges with respect to its organization, funding, and governance. First, the relationship between the public and private sectors is not well regulated, which results in inefficient service delivery. Second, even within the public health system, several large and smaller providers and fund holders compete for resources with no or little overall coordination with respect to the allocation of resources, further undermining the overall efficiency of the system. Finally, there are some inherent organizational and governance limitations in the system, which generate significant inequalities when it comes to accessing and paying for services. Important to note is that the apparent challenges in the public health system – particularly as they relate to the quality of service delivery – and the perceived advantages of certain aspects of the private sector, generate a sense of mistrust in the health system among the general public. A key challenge for the GOJ is to restore this trust by developing a well-articulated reform plan that aims to provide all citizens with qualitative formal health coverage in an effective, efficient, and equitable manner.
The Jordanian health sector continues to face several important challenges. First, the relationship between the public and private sectors is not well regulated. Second, there is no to little overall coordination with respect to the allocation of resources. Third, there are some inherent organizational and governance limitations in the system.

JORDAN HUMAN DEVELOPMENT REPORT 2015 66
The main public health care providers and fund holders are the Ministry of Health (MOH), the Royal Medical Services (RMS), and the University Hospitals (Jordan University Hospital-JUH, and King Abdullah University Hospital-KAUH). In addition to these actors, there is a number of specialist health care providers, including the King Hussein Cancer Center (KHCC), that are funded through the general budget. In 2013, the total number of hospitals in Jordan reached 103 and the number of hospital beds reached 12,060 (compared to 11,355 beds in 2009). Of these, 3,989 were in private hospitals.
The MOH manages the Civil Insurance Program (CIP), which is the largest health insurance program for civil servants. The CIP is funded by contributions from employees, but these contributions do not generally reflect the actual cost of services and, furthermore, have not been revised to account for price increases in several years. These insufficiencies, in combination with several weaknesses on the purchasing side, have undermined the financial sustainability of the civil insurance fund (CIF) under the CIP.
The RMS manages the Military Insurance Fund (MIF), which covers health care for military staff and similar population groups, such as high ranking officials. The contributions of the members of the MIF are very low (ranging from 2.5 JD to 5 JD per month) and, as in the case of the CIP, do not reflect the costs of services. This destabilizes the financial conditions of the Jordanian health care system and may impact the broader fiscal position of the government.
There are approximately 64 private hospitals, of various sizes, and a large number of general practitioners and medical specialists. These hospitals are used both by patients who pay out of pocket and by those covered by private health insurance (approximately 8 percent of those with formal health insurance coverage), as well as MOH patients covered by the CIP who have been referred for services not provided in public hospitals. There are a relatively large number of insurance companies that operate under the regulatory supervision of the Insurance Commission (IC)22 which offer health insurance policies to both individuals and employees of private companies. Private insurance companies also act as third-party
payers/administrators (TPP/TPA) to manage the health insurance programs on behalf of larger companies and corporations that provide insurance for their staff. However, the private health insurance market is not well regulated with respect to premiums and benefits packages, which weakens the overall performance of the health care system. 23
Policy-makers who are responsible for developing Jordan’s health care system need to take into careful consideration the various economic interests that in different ways affect the performance and direction of the sector. Most private hospitals, and many public providers as well, have articulated strategies to tap into the growing market of medical tourism to attract clients from the region. However, by doing so, they have neglected the importance of establishing branches in areas less populated by tourists, leaving the vast majority of private health providers situated in the capital, Amman. For example, private Jordanian hospitals treated around a quarter of a million foreign patients in 2013, and the university hospitals are making investments to cater to these clients as well. In developing the medical tourism sector, Jordan also needs to balance the demands of this market with the needs of the domestic population.
Another area of critical economic importance is the pharmaceutical sector. The Jordanian medical industry has developed its capacity both with respect to the production of pharmaceutical products and to the research and development of new medicines. Today, the pharmaceutical sector is among the largest sources of export earnings for the country and its further development will partly depend on the country’s ability to train a sufficient number of skilled professionals in different disciplines both inside and outside of the medical sector. It is worth mentioning that the general health care sector also requires some of these professionals, such as pharmacists, physicians, and biomedical experts, which may cause labor supply conflicts as these professionals are scarce already.
Organizational, regulatory, and economic issues related to the health sector are all compounded by, and partly the result of, the overall political context of the country.

JORDAN HUMAN DEVELOPMENT REPORT 2015 67
Areas such as rule of law, public financial management, and voice and participation in public decision making all affect the health care system. As the GoJ continues its reform efforts, it is important to align the interests of the general public with those of specific health care providers, the largest of which are the MOH and the RMS. Furthermore, the performance of the health sector, including the health financing system, is undermined by the ad-hoc nature of access to subsidized health care through different channels. These opportunities create serious insufficiencies in resource allocation and in the ability to develop a strong, reliable, and sustainable health financing system based on the transparent application of rules and regulations.
In terms of regulatory bodies and health care providers at the district level, a number of regulatory challenges persist. While rules and regulations may be in place, the actual enforcement is often weak. In some instances, this is the result of weak monitoring of processes and functions by medical and clerical staff at the clinical level. In other situations, it is caused by actors who exert political and economic influence over the regulatory bodies in order to receive exemptions or avoid penalties. In order to address these challenges, the GoJ should develop measures to strengthen the accountability of service providers and fund holders in the health sector, so that they deliver high quality services in a transparent and unbiased manner.
Jordan is experiencing an epidemiological transition; the rates of communicable diseases are declining while non-communicable diseases and injuries are on the rise. The main causes of death are cardiovascular diseases, cancer, and diabetes, which are all projected to continue to increase. The economic costs of these and other health-related conditions should be counted in fractions of national income.
It is not possible to identify the exact number of people who are covered by health insurance in Jordan. Based on various surveys, it is estimated that between 70 and 93 percent of the total population are covered by formal health insurance, including those with duplicate coverage.
Based on the assumption that some 30 percent of the population lack insurance, estimates suggest that it would be financially possible to extend coverage under the current budget allocation by reallocating resources from ad-hoc coverage programs. This would also reduce the fragmentation of the Jordanian pooling arrangements.
An overview of the Jordanian health sector would not be complete without shedding light on the current Syrian refugee crisis, which poses challenges to overall sector performance. Unlike other host countries, a significant proportion of the Syrian refugees in Jordan reside outside camps and live in local communities. This has increased the demand for social services, especially health care and education, and in turn, overstretched public service provision. The GoJ Rapid Response Plan estimated that the total cost of hosting one million refugees in 2013 was US $850 million. More specifically, the cost to the health sector was estimated at approximately US $93.6 million due to a significant increase in demand for services (especially for surgical care) provided by MOH facilities. Furthermore, many Jordanian patients have been unable to receive medical care in areas with large refugee populations. The refugee crisis has also resulted in the reemergence of various diseases within Jordanian host communities.
In summary, the main challenges facing the health care sector are the following:
- Scarcity of financial resources needed to provide full coverage and insurance for all citizens.
- Lack of national clinical manuals and therapeutic protocols.
- Disparity in the quality of health services between the different entities within the health sector and between geographic areas.
- Weak coordination between the private and public sectors.
- A highly centralized health care system.
- Lack of accountability and weak monitoring and evaluation systems for both the public and private sectors.

JORDAN HUMAN DEVELOPMENT REPORT 2015 68
Public-Private Partnerships in Health Services: Funding, Quality, and Disparitiesa. Fiscal
Jordan is confronted with macroeconomic and fiscal constraints. It faces several critical public health, life-style, and epidemiological challenges and a rise in non-communicable diseases (NCDs), all of which are likely to require increased expenditures in the future. In 2012, 1,665,014,650 JD was spent on health care and health care expenditures represented 7.58 percent of GDP. 10.5 percent of GoJ’s total budget was allocated to health care.
Today, approximately one third of Jordan’s population is under the age of 15 and one fifth is between the ages of 15 and 24. As this large cohort of youth grows older, it will increase the pressure on the Jordanian health care system, especially if many of the risk factors – particularly for NCDs – go unaddressed. Further, the ongoing Syrian crisis, which has resulted in a massive influx of 629,627 refugees to Jordan (officially registered refugees, as of October 2015), most of whom receive free or cheap care, requires significant government expenditures in an already tight fiscal environment.
Jordan’s health system is highly fragmented and revenues are mobilized from a range of both public and private sources. This leads to further fragmentation on the pooling of
revenues and service provision, including in the public sector. As noted, the government will continue to be one of the largest sources of health revenues and to play a central role in service provision in the coming years.
An analysis of Jordan’s national health accounts shows that the government’s share of total health expenditure has increased over the past decade. Around two-thirds of all health care spending is public. Around 76 percent is for curative services and only around 16 percent is for primary health care. Other factors, including the contents of the benefits packages, also indicate a strong focus on curative services in the Jordanian health care system.
The historically high levels of out-of-pocket (OOP) payments for health services have gone down. However, at around 31 percent of total health spending, OOP payments continue to be relatively common. Households use OOP payments primarily to pay for pharmaceuticals. Although this type of spending has decreased in the past few years, Jordanians continue to pay a comparatively large share of its total health spending on drugs. Moreover, an analysis of household survey data shows that there are significant inequalities in OOP expenditures between socioeconomic groups, geographic regions, and urban and rural areas. OOP payments vary significantly across Jordan’s governorates, from around 60 JD per year in Ajloun to 300 JD in Amman. The majority of rich households live in Amman which help explain these differences. Figure (3-1) below presents this data in more detail.
Figure (3-1): Household OOP spending by governorate and Country Average, 2010 (JD)
400
153113.3 117.3 82.7
235.4 165.6307.4
88.7 113.5 92.4 109.2 61.7212.9300
200100
0
AmmanBalqa
Zarqa
MadabaIrb
id
Mafraq
JarashAjlu
nJordan
KarakTafiela
Ma'anAqaba
Source: Information from Department of Statistics data sets

JORDAN HUMAN DEVELOPMENT REPORT 2015 69
There are different patterns in per capita OOP payments in urban areas compared to rural districts, as shown in Figure (4-2) below. Jordanians who live in rural areas spend around 50 percent less on OOP payments than those who live in urban areas.
Based on data on the utilization of health services, demographic trends, and macroeconomic scenarios, Jordan’s health expenditures as a share of GDP are expected
to increase over the coming decades if no health financing reform is implemented. In particular, toward the end of the 2020s, Jordan is expected to spend approximately 14 percent of its GDP on health. In order to create a fiscal space for these expenditures over the coming years, sustained economic growth and reform of the expenditure and collection system of the health sector are necessary.
Figure (3- 2): Per Capita OOP payments by governorates, country average, and urban/rural areas, 2010 (JD)
80
60
40
20
0
26.3 19 20.8 14.9
4431
60.4
15.8 19.6 17.5 19.410.3
39.7 43.4
21.8
AmmanBalqa
Zarqa
MadabaIrb
id
Mafraq
JarashAjlu
nJordan
UrbanRural
KarakTafiela
Ma'anAqaba
Source:Information from Department of Statistics data sets
b. Quality
The Government of Jordan has introduced a range of reform measures, including a recently adopted strategy, to enhance the regulatory performance of the sector in various areas, including pharmaceuticals and medical devices. The strategy focuses on both human resource development and the improvement of health coverage and infrastructure in Jordan.24
To ensure, and enhance, the quality of health services, the MOH implemented a quality control program in 1993 that covered a number of public hospitals. In 1999, the MOH institutionalized the process by establishing a Directorate for quality control in the Ministry. The Directorate was in charge of designing quality criteria for MOH health services providers. This has been deemed effective, but not fully sufficient, as it did not ensure that all health service providers were providing quality services. In 2003, the Higher Health Council adopted the hospital
accreditation project and in 2007, the Health Care Accreditation Council (HCAC) sought to improve the safety of health services and facilities by adopting internationally accepted standards and building capacities on accreditation. To this day, 17 hospitals and 42 health centers have been accredited by the Council.
By the end of the 2020s, Jordan is expected to spend approximately 14 percent of its GDP on the health sector. In order to create a fiscal space for these expenditures, sustained economic growth and reform of the expenditure and collection system of the health sector are necessary.

JORDAN HUMAN DEVELOPMENT REPORT 2015 70
There is still a dire need to strengthen health ethics and principles among providers to ensure better quality of health services, which is one area that the HCAC is currently working on. Further, it is crucial to decentralize the administration of the health sector. Limited resources, high costs of health services, and weak capacities of the governorates continue to limit these efforts however. Decentralizing health services is another way to ensure quality and increased coverage. Decentralization would also help limit disparities between the different regions in the country. However, it needs to be acknowledged that decentralization is difficult to implement considering the current financial situation. It will require better capacities of personnel, a large increase of financial resources for the health sector and, most importantly, political will.
It is clear that there is a scarcity of adequate strategies in place to strengthen transparency in the health sector. In order to empower citizens, strengthen accountability, and inform patients of their rights concerning medical errors, a health accountability law should be implemented.
Health Care and Human Development: Youth and Gender DimensionsHealth is one of the most important factors in the development and empowerment of youth and women. Jordan’s current demography will be a challenge for the health care sector in the future. For example, the number of females in childbearing age (15-49) is expected to increase from 1.7 million in 2012 to 2.1 million in 2022. This will not only increase birth rates but it will also increase the demand for maternal, curative, and primary health care services.
There are various indicators that provide information on health and gender, but fewer indicators on health and youth. This scarcity is partly due to the lack of an international
definition of youth. Various international entities define, and delineate, youth in different ways, which makes it difficult to collect and analyze data. This does not only serve as an impediment to analysis but also makes it more difficult to prevent future diseases and burdens on the health system, especially considering the large number of young people in Jordan. It is crucial to develop a strategy that seeks to spread awareness nationally about how youth can prevent diseases caused by their existing habits and lifestyles. To this day, there is no Directorate that specifically works on youth health at the Ministry of Health.
As mentioned earlier in this section, there are many indicators on women and health. One of the previous MDGs is to improve maternal health. The Demographic Health Survey (DHS) looks at different indicators that relate to maternal health, such as: childbearing age; childbearing rates; marital status; and use of reproductive health products.
In 2012, 27.3 percent of females between the ages of 15 and 49 were overweight. Almost one third of all females between the ages of 30 and 39 were overweight (the age group with the highest prevalence). It is slightly more common among females residing in rural areas (28.7 percent) compared to urban areas (27 percent). In regards to obesity, 27.4 percent of women between the ages of 15 and 49 were obese in 2012. It was most common in the Mafraq and Tafileh governorates (32.3 and 31.9 percent respectively) and least common in the Ma’an and Amman governorates (25.9 and 26.5 percent respectively).
The 2010 Quality of Life Index (QLI) measured the distance to maternity and child health centers in different governorates. Based on this criteria, 22.5 percent of households in Mafraq, 20.1 percent in Jerash, and 16.4 percent in Karak fall below the average QLI value . Tafileh (1.8 percent), Aqaba (3.4 percent), and Irbid (6.6 percent) had the lowest proportion of households below the average QLI level. 25

JORDAN HUMAN DEVELOPMENT REPORT 2015 71
Figure (3-3): Distance to maternity and childhood health Centers
KingdomTafielaAqaba
IrbidZarqaMa'anAjlun
BalqaAmman
KarakJarash
Mafraq
Madaba
0% 20% 40% 60% 80% 100%
Below Middle Middle High
11.3
1.83.4
6.6
6.9
7.8
9.1
10
13.2
13.5
16.4
22.5
20.1
46
53.3
20.3
46.9
27.1
39.2
57.6
24.544.8
56.6
45.3
38.7
33.9
42.7
44.9
76.3
46.4
66
52.9
33.3
65.642.1
29.9
38.2
38.8
46
Source: Department of Statistics – The Hashemite Kingdom of Jordan 2010b
Regional Health Disparities in JordanStudies indicate that Jordan’s health care sector, even though it has wide coverage, is unequally dispersed across the different regions. The continuous influx of refugees into Jordan will result in additional burdens on the health system. As of 2015, there are around 2.5 million non-Jordanians residing in the country, of which 1.4 million are Syrians; most of them live in the northern governorates.26 Unfortunately, this situation will further increase the disparity in health services in these governorates. 27
As mentioned earlier in the chapter, there are a variety of indicators to assess the health status of citizens, and different studies and reports use different indicators and data sources. In order to analyze regional health disparities, it is necessary to look at administrative records. For example, the poverty pocket survey in Jordan found that:
- The sub-districts with the lowest percentage of households visiting
government hospitals are: Wadi Arabah (1.9 percent), Mraighah (1.8 percent), Salhiyyeh (1.8 percent), and Dair Al-Kahf (13.9 percent). One fourth of households visit health centers in Ghour El-Safi and Quaira.
- In 8 out of 12 poverty pockets, 0-4.7 percent of households use an ambulance for emergency purposes: Wadi Arabah, Mraighah, Al-Azraq, Salhiyyeh, Dair Al-Kahf, Hoasha, Borma, and Al-Rweished. Nearly a fifth of households in Wadi Arabah reported walking to hospitals and health centers.
- Al-Azraq has the highest proportion of households (17 percent) who report that lack of health insurance is a constraint to access to health facilities.
- In Al-Ruwaished and Mraighah, 50 percent of households complain that there are no specialized doctors available in health centers.
- 35-55 percent of households in all 12 poverty pockets complained of poor services.

JORDAN HUMAN DEVELOPMENT REPORT 2015 72
There are huge regional disparities in terms of the number of hospital and hospital beds
- In Ghour Al-Mazra’a, 12.5 percent of households complained of high costs of health services.
- 6 percent of households in Ghour Al-Mazra’a had children (under the age of 18) with disabilities.
Large regional disparities exist in regards to the provision of hospital and hospital beds. The annual health statistical data book for 2013 concluded the following
• Amman has 51 hospitals and 6,729 beds, of which 2,966 beds are in private hospitals.
• Irbid has 17 hospitals and 1,927 beds, of which 326 are in private hospitals.
• Zarqa has 8 hospitals and 953 beds, of which 315 beds are in private hospitals.
• Balqaa has 6 hospitals and 773 beds, all of which are in public hospitals.
• Karak has 6 hospitals and 394 beds, of which 100 beds are in private hospitals.
• Mafraq has 4 hospitals and 242 beds, of which 40 beds are in private hospitals.
• Aqaba and Madaba have 3 hospitals. Aqaba has 263 beds, of which 80 are in private hospitals; Madaba has 188 beds, of which 30 are in private hospitals.
• Jerash and Ma’an have 2 hospitals each. The two hospitals in Jerash have 171 beds, of which 12 are in a private hospital. Ma’an has 205 beds; all of them are in public hospitals.
• Lastly, Ajloun and Tafileh have 1 hospital each and 130 and 106 beds respectively; none of the beds are in private hospitals.
Child mortality rates also vary across regions, governorates, and types of residence. In 2012, the highest mortality rates for infants and children below the age of 5 were observed in the southern region (22 and 26 per 1,000 live births respectively). The lowest mortality rate for children under the age of 5 was observed in the north (19 per 1,000 live births). The central and northern regions had similar infant mortality rates; 17 per 1,000 live births. In addition, there are significant differences in child mortality rates across governorates. The IMR and U5MR were highest in the Tafileh governorate (26 and 31 per 1,000 live births respectively). The lowest IMR and U5MR were observed in Ajloun (14 and 16 per 1,000 live births respectively). Child mortality rates are higher in urban centers than they are in rural areas. 28
Figure (3-4): Child Mortality Jordan, 2012
Tafiela
Aqaba
IrbidZarqa
Ma'an
Jordan
AjlunBalqa
Amman
AmmanKarak
Jarash
Mafraq
MadabaTafiela
Aqaba
Irbid
Jarash
Mafraq
0 5 10 15 20 0 10 20 3025
Infant Mortality Rate Under-5 Mortality Rate
Source: Department of Statistics - The Hashemite Kingdom of Jordan 2013a

JORDAN HUMAN DEVELOPMENT REPORT 2015 73
Another important indicator is the prevalence of diarrhea, which was especially common among children between 6 and 11 months (32 percent of children suffered from diarrhea) as well as children between 12 and 23 months (27.8 percent). In Aqaba, about 8 percent of children under five suffered from diarrhea, the lowest rate among all governorates. In comparison, almost 20 percent of children under the age of five residing in Jerash suffered from diarrhea (the highest rate in Jordan). Overall, diarrhea was more common among children under the age of 5 residing in the northern region (17 percent), compared to those living in the central and southern regions (16 and 11 percent respectively). Despite the high rates, only about 56 percent of parents sought advice or treatment from a health facility or provider.
Approximately 7 percent of all Jordanian children under the age of 5 showed symptoms of acute respiratory infections (ARI) in 2012. ARI was most common among infants between 6 and 11 months (almost 10 percent), followed by children aged 12 to 23 months (8.4 percent) and those between 24 and 35 months (8 percent). About 9 percent of all children under the age of 5 in the Jerash governorate showed ARI symptoms (the highest prevalence), compared to 5 percent in the Madaba governorate (the lowest rate). Approximately 77 percent of all parents to children under the age of 5 showing ARI symptoms had sought treatment from a health facility or provider, and almost 87 percent of these children received antibiotics.
Obesity is mainly caused by high intake of high-fat content food products coupled with physical inactivity (mainly due to urbanization and advancements in transportation). These conditions are among the major risk factors associated with non-communicable diseases, especially cardiovascular diseases. 28.7 percent of women residing in rural areas
are overweight. In urban areas, 27 percent of all women are overweight. Obesity, across genders, is most common in the Mafraq and Tafila governorates (32.3 and 31.9 percent respectively) and rarest in Ma’an and Amman (25.9 and 26.5 percent respectively).
Micronutrient deficiencies, particularly iron deficiency anemia, iodine deficiency disorders, and vitamin A deficiencies affect the lives of many children and women across the world. In addition to the adverse effects on peoples’ health, micronutrient deficiencies also have serious consequences for the economic development of a country since these deficiencies impact an individual’s productivity and work capacity. The high prevalence of iron deficiency and anemia among children and women is a significant problem in Jordan. About one-third of all Jordanian children under the age of five, and women between the ages of 15 and 49, are anemic. Anemia is particularly common among children between 6 to 8 months (61.3 percent), and women between the ages of 40 and 49 (37.4 percent). Approximately 12.4 percent of children, and 7 percent of women, suffer from moderate anemia, while 19.7 percent of children, and 26 percent of women, face mild anemia. The prevalence of anemia varies between governorates. Among children, it is most common in Ma’an (38.1 percent), followed by Balqaa and Ajloun (37.5 and 37.2 percent respectively). The lowest prevalence rates are in Tafileh and Madaba (21.9 and 24.6 percent respectively). Among women, anemia is most common in Balqaa (39.7 percent), Ajloun (38.9 percent), and Zarqa (38.4 percent). 29
The 2010 QLI found that 17.1 percent of the population has a health status that is considered below average. This part of the population is mainly concentrated in Amman (26.3 percent), Balqaa (14.2 percent), and Zarqa (13.8 percent). 30

JORDAN HUMAN DEVELOPMENT REPORT 2015 74
The QLI also measured the distance to the closest military or public hospital. Based on this criteria, 66.8 percent, 62.4 percent and 49.9 percent of households in Mafraq, Karak, and Ma’an respectively, fall below the average QLI value.
The distance to the closest health center was also measured in the QLI. Based on this criteria, 0.9 percent, 1.8 percent, and 3.2 percent of households in Madaba, Tafileh, and Aqaba respectively, fall below the average QLI value. In Jerash, Amman, and Mafraq, 25 percent, 31.1 percent, and 12.4 percent respectively, fall below the average QLI value.
The QLI also looked at the prevalence of smoking. The majority of households with a health status below the average smoke daily. Households living in Madaba, Irbid, and Ajloun have the highest proportion of smokers: 66.8 percent, 63.8 percent, and 63.7 percent respectively. In Tafileh, Jerash, and Mafraq, the rates are 55.9 percent, 57.7 percent, and 60.1 percent respectively.
Furthermore, the QLI index also looked at the number of individuals with disabilities. Based on this criteria, 34.7 percent, 28.4 percent, and 27.1 percent of individuals in Amman, Jerash, and Aqaba, respectively, fall below the average QLI value. The lowest percentages were in Tafileh, Ma’an, and Karak with rates of 15.8 percent, 19.5 percent, and 21.5 percent respectively. 31
Conclusion
This chapter has shown that the disparities in the health sector mainly are caused by the uneven provision of health services by the private and public sector. Jordan’s capital, Amman, provides the majority of private medical services. The bed/patient ratio also differs between governorates. Some governorates, like Ma’an, Jerash, Ma’an, Ajloun, and Tafileh, have a significantly lower bed/patient ratio than other governorates. In addition, there are no hospital beds available in private hospitals in Ajloun and Tafileh.
The current Syrian refugee crisis has increased the burden on Jordan’s already strained health sector, especially in the host communities in the northern governorates. The large number of patients and the danger of new (or returning) epidemics and diseases will pose challenges in the future.
Infant mortality rates are higher in the southern regions of the country. The national infant mortality rate is within international standards however, and Jordan’s MDG indicators that relate to infant mortality rates have been achieved. Another indicator that was discussed in this chapter was the smoking index. Households that have a health status below average usually smoke daily and the governorates with the highest smoking rates were Madaba (66.8 percent of the population smokes), Irbid (63.8 percent)
Figure (3-5): Health index by governorate
AmmanBalqa
Zarqa
MadabaIrb
id
Mafraq
JarashAjlu
nKarak
TafielaMa'an
KingdomAqaba
30.026.3
14.2 13.811.5 10.2 9.3 9.2 8.9 8.5 7.8
6.6 6.5
17.1
25.020.015.010.0
5.00.0
Source: Department of Statistics – The Hashemite Kingdom of Jordan 2010b

JORDAN HUMAN DEVELOPMENT REPORT 2015 75
Figure (3-6): Quality of Life Index based on distance to public/military hospitals by governorate
Kingdom
Tafiela
Aqaba
Irbid
Zarqa
Ma'an
Ajlun
Balqa
Amman
Karak
Jarash
Mafraq
Madaba
0% 20% 40% 60% 80% 100%
Below Middle Middle High
31.6
31.9
36.1
14.1
39.2
18.6
35.8
42.2
36.6
34
22.5
6.3
8.4
46.4
53.7
49
70.9
40.8
74.4
30.7
24
17.6
18.8
43.7
15.1
24.8
22.1
14.2
14.9
15.1
20
7
33.6
33.6
45.9
47.2
49.9
62.4
66.8
Source: Department of Statistics – The Hashemite Kingdom of Jordan 2010b
Figure (3-7): Quality of Life Index based on distance to health centers by governorate
Source: Department of Statistics – The Hashemite Kingdom of Jordan 2010b
Kingdom
Tafiela
Irbid
Ma'an
Karak
Jarash
Mafraq
0% 20% 40% 60% 80% 100%
Below Middle Middle High
9.8
0.9
1.8
3.2
4.3
6.4
8.3
7.2
10
11.9
12.4
13.1
25
47.4
31.4
54.4
22.4
48.3
26.7
57.6
39.4
49.4
42.5
45.1
56.9
55.2
42.9
67.7
43.7
74.4
47.5
67.2
34
53.4
40.7
45.5
42.5
30.1
19.8
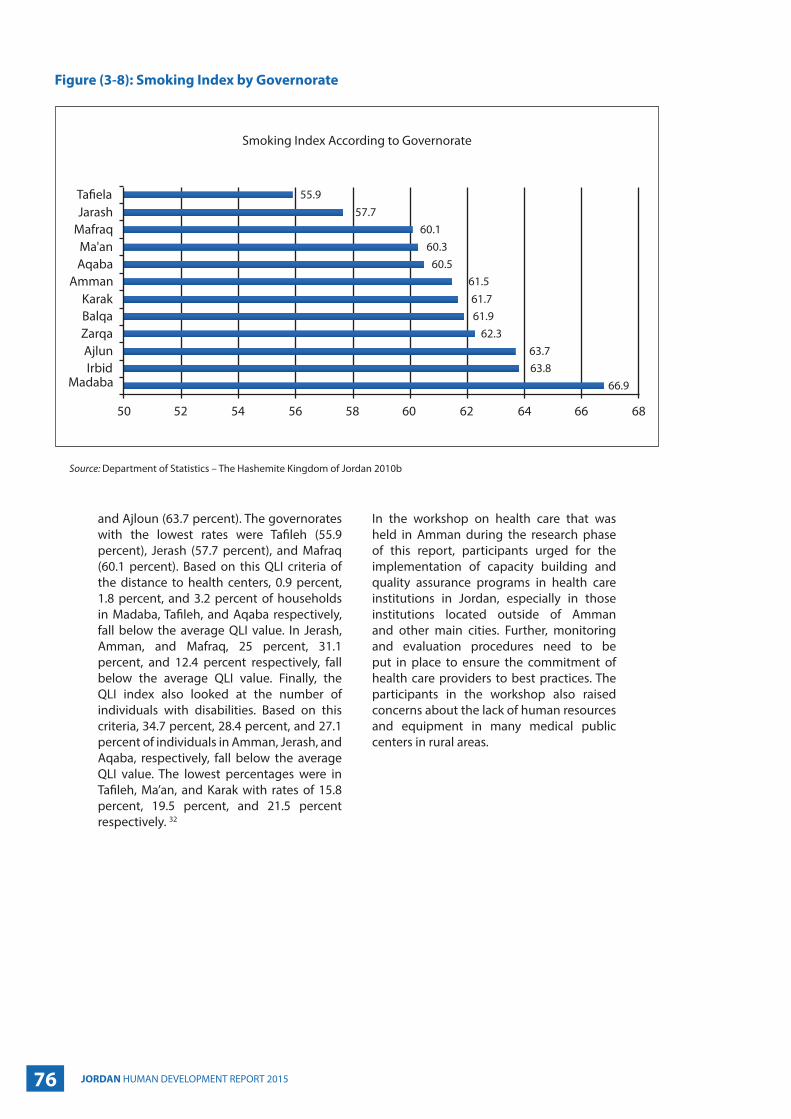
JORDAN HUMAN DEVELOPMENT REPORT 2015 76
Figure (3-8): Smoking Index by Governorate
Tafiela
Aqaba
Irbid
Zarqa
Ma'an
Ajlun
Balqa
AmmanKarak
JarashMafraq
Madaba
50 52 54 56 58 60 62 64 66 68
55.957.7
60.160.3
60.561.561.761.9
62.363.763.8
66.9
Smoking Index According to Governorate
Source: Department of Statistics – The Hashemite Kingdom of Jordan 2010b
and Ajloun (63.7 percent). The governorates with the lowest rates were Tafileh (55.9 percent), Jerash (57.7 percent), and Mafraq (60.1 percent). Based on this QLI criteria of the distance to health centers, 0.9 percent, 1.8 percent, and 3.2 percent of households in Madaba, Tafileh, and Aqaba respectively, fall below the average QLI value. In Jerash, Amman, and Mafraq, 25 percent, 31.1 percent, and 12.4 percent respectively, fall below the average QLI value. Finally, the QLI index also looked at the number of individuals with disabilities. Based on this criteria, 34.7 percent, 28.4 percent, and 27.1 percent of individuals in Amman, Jerash, and Aqaba, respectively, fall below the average QLI value. The lowest percentages were in Tafileh, Ma’an, and Karak with rates of 15.8 percent, 19.5 percent, and 21.5 percent respectively. 32
In the workshop on health care that was held in Amman during the research phase of this report, participants urged for the implementation of capacity building and quality assurance programs in health care institutions in Jordan, especially in those institutions located outside of Amman and other main cities. Further, monitoring and evaluation procedures need to be put in place to ensure the commitment of health care providers to best practices. The participants in the workshop also raised concerns about the lack of human resources and equipment in many medical public centers in rural areas.

JORDAN HUMAN DEVELOPMENT REPORT 2015 77
Empowered lives. Resilient nations.
EMPLOYMENTAND
LIVELIHOOD

JORDAN HUMAN DEVELOPMENT REPORT 2015 78
CHAPTER FOUREMPLOYMENT AND LIVELIHOOD

JORDAN HUMAN DEVELOPMENT REPORT 2015 79
In 2013, 1,444,699 individuals made up the Jordanian labor force. The public sector employs 39 percent of this labor force, and the private sector 61 percent.
IntroductionThe Jordanian labor market continues to suffer from external shocks that repeatedly increase market deficiencies and make it more difficult for policy makers to alleviate unemployment. The Arab Spring did not only draw attention to the issue of youth unemployment, but it also resulted in the Syrian crisis and a huge influx of Syrian refugees into the Jordanian labor market. Many Syrians have replaced Jordanians in the labor market and expanded the already large informal sector.
Jordan’s labor market is considered a source of highly qualified labor, but also an importer of low skilled labor for certain sectors (agriculture, construction, services, and manufacturing). The most significant characteristic of the labor market is its low participation rates; 40.1 percent of Jordanians aged 15 and older were employed in 2009, but in 2013, this rate had declined to 37.1 percent. Women’s participation went down as well, from 14.9 percent in 2009 to 13.2 percent in 2013. The percentage of employed males was 54 percent in 2013.
the Jordanian labor force included 1,444,699 individuals. The public sector hires 39 percent of the total labor force, compared to 61 percent for the private sector. 84.4 percent of the labor force are men; 15.6 percent are females.33 The number of registered foreign workers at the Ministry of Labor (MoL) went down from 335,707 in 2009 to 286,197 in 2013; foreign workers comprise 19.8 percent of Jordan’s total labor force. Foreigners mainly work in agriculture, forestry and fishing, manufacturing industries, personal and social services, household livelihood activities (such as business owners, production of goods, etc.), retail, maintenance, construction, and food services.34
Unemployment is considered the most pressing challenge facing Jordan’s economy even though the unemployment rate went down from 12.9 percent in 2009 to 12.6 percent in the third quarter of 2013. The high unemployment rate is a result of various factors, such as demographic transformations, which has led to a large number of new individuals in the labor market, and a lack of synchronization between educational outputs and the actual needs of the labor market. The current wage gap is partly a result of foreign workers taking jobs that Jordanians are unwilling to perform. Unemployment rates vary between governorates. In 2013, Tafileh had the highest unemployment rate (17.1 percent), while Amman (10.5 percent) and Jerash (12.3 percent) had relatively low rates. 35
According to data from the Social Security Corporation (SSC), 1,051,798 individuals were covered by social security at the end of 2013. This means that 70 percent of all employees were insured through social security. Around 61 percent of the total active labor force are insured, which indicates that the insurance coverage of the corporation has expanded. The SSC has also introduced two new social insurances: the maternity insurance and the unemployment insurance, which were both activated at the beginning of September 2011. This was an important step towards achieving comprehensive social protection for workers and their families in Jordan. 36
As mentioned in the first chapter of this report, the Gender Gap Index (GGI) from 2014 indicated that Jordan ranked 139 out of 143 countries in regards to female labor force participation. The female participation

JORDAN HUMAN DEVELOPMENT REPORT 2015 80
rate is still very low, and the gender gap continues to favor males. Most working females are employed in the education sector. On the educational attainment index of the GGI, Jordan ranked 74. On the health and survival index, it ranked 127, and on the political empowerment index, it ranked 119.37
Data from 2013 indicate that individuals who have an educational level of basic literacy, but who lack formal education, accounted for 1.7 percent of the total number of unemployed. Individuals with a vocational apprenticeship accounted for only 0.6 percent. The percentage increases to 39.7 for those lacking secondary education and 38.1 for those with a bachelor’s degree. Graduate degree holders comprise 1.7 percent of the unemployed, intermediate diploma holders comprise 10.1 percent, and people with secondary education make up 8.1 percent of the unemployed.
Individuals between the ages of 15-19 comprise 10.5 percent of all unemployed; people between the ages of 20-24 comprise 37.55 percent; 25-29 year olds make up 24.9 percent; and 30-34 year olds comprise 10.8 percent. As individuals get older, the unemployment rates decrease. People between the ages of 35-39 make up 6.9 percent of the unemployed; people between the ages of 40-44 comprise 5.2 percent; 45-49 year olds comprise 2.7 percent; 50-54 year olds make up 0.9 percent; and people at the age of 50 and older comprise only 0.6 percent.
Numerous deficits characterize the Jordanian labor market, all of which are highly important to address. First of all, the weak synchronization between the supply and demand in the labor market has been a challenge. This does not only cause a discrepancy between educational outputs and the jobs available in the labor market, but it also creates frustration among youth who are unable to find jobs that match their skills. Second, as mentioned above, Jordan’s female participation rate is one of the the lowest in the world and is a result of both social and cultural factors, as well as the current business environment.
Third, the vocational education and training system in Jordan is considered weak, unorganized, and unsatisfactory by students and their families. The ETVET sector is fragmented and suffers from weak coordination as the private sector is not involved as much as it should be in the process of designing necessary training programs. The number of unemployed university and college graduates is high, and those with a high school degree or below comprise around half (50.3 percent) of all unemployed.
Fourth, the wide informal sector is also a sign of labor market deficiency. Although official data is scarce, the findings of a recent study by MoPIC indicated that informal employment represents 44 percent of all employment in the Jordanian economy. In 2010, 487,861 individuals worked in the informal sector, and 744,724 worked in the formal sector. In private firms that employ less than five workers, informal workers represent 92 percent of all employees. In firms that have five to nine employees, informal workers comprise 68 percent, while firms with 100 employees or more have approximately 10 percent informal workers.38 It is estimated that this percentage has increased significantly due to the large influx of Syrian refugees.
There has been a decline of foreign demand for Jordanian labor as a result of both fewer investments in those countries which have been traditional markets for Jordanian labor, as well as an implementation of policies in these countries that favor domestic labor over foreign. The low retirement age in Jordan causes further problems. Previously, many Jordanians who retired early accepted jobs in the Gulf region, but due to the reasons mentioned above, it is more difficult for these people to find employment opportunities abroad.
The Gender Gap Index (GGI) 2014 ranked Jordan number 139 out of 143 countries on the indicator for female labor participation.

JORDAN HUMAN DEVELOPMENT REPORT 2015 81
There is a large disparity between governorates in terms of the availability of jobs and private sector presence. The majority of employed individuals are concentrated in the Greater Amman area. In 2013, the largest proportion of the workforce (61.8 percent) was concentrated in the central region, which includes the governorates of Amman, Zarqa, Balqaa, and Madaba. 28.4 percent was concentrated in the northern region, which includes the governorates of Irbid, Mafraq, Jerash, and Ajloun. 9.8 percent of the workforce was located in the southern region, which includes the governorates of Karak, Ma’an, Tafileh, and Aqaba. This is attributed partly to the fact that the central region is home to ministries, official departments, public service institutions, factories, private interests, and investments.39 In Jordan, like in many other countries, the private sector is mainly concentrated in the capital and big cities.
Other problems facing the Jordanian labor market are: the relative high percentage of employment in the public sector vis-à-vis the private sector; the lack of a human resources development policy; the fragmentation in the SMEs and microfinance market; and weak law enforcement.
The Role of MSMEs in Employment and Livelihood Micro, small, and medium enterprises (MSMEs) are often described as the backbone of a nation’s economy.
This report will use the definition of MSMEs that was adopted in the 2014 SME Strategy. Micro enterprises are those with five employees or less; small enterprises are those with five to 49 employees; and medium enterprises are those with 50 to 249 employees. The definition will also include the classification of non-agricultural MSMEs.
In countries around the world, MSMEs comprise 90 percent or more of all private enterprises and generate the majority of permanent, full-time jobs. Studies have also found that small firms generate the majority of new jobs, with the highest growth in job
creation generated by start-ups and firms that are five years old or less. The dynamic effect of the entry and exit of enterprises also drives competition and innovation and is considered essential to the process of a country’s economic revitalization and renewal. For Jordan, the MSMEs sector could be one of the solutions to the problem of female unemployment.
The female participation rate is among the lowest in the world. This is a result of social and cultural factors, as well as the current business environment.
There is a large disparity between the governorates in terms of both the presence of the private sector and the availability of jobs. Jordan, like many other countries, has a concentration of private sector jobs in the capital and big cities. Employment in Jordan is concentrated in the Greater Amman area. In 2013, the central region, which includes the governorates of Amman, Zarqa, Balqaa and Madaba had the largest proportion of the workforce (61.8 percent), followed by the northern region, which includes the governorates of Irbid, Mafraq, Jerash and Ajloun (28.4 percent), and the southern region, which includes the governorates of Karak, Ma’an, Tafileh, and Aqaba (9.8 percent).

JORDAN HUMAN DEVELOPMENT REPORT 2015 82
In 2011, the GoJ produced a National Human Development Report (NHDR) which focused on SMEs as a tool for development. It concluded that enterprise development is one of the most direct ways to grow economic assets, combat poverty, and expand human development choices, identifying MSMEs as instrumental to achieving equitable economic growth and social progress. Further, the report identified the pillars of human development in which MSMEs can contribute to participation and empowerment, social safety nets, and environmental sustainability.
MSME development is also a tool for alleviating some of the economic and social disparities between Jordan’s regions. The government’s goal is to reduce development discrepancies between governorates and municipalities by increasing the availability of financing opportunities for micro and small enterprises, especially in the poorest regions, and encouraging the private sector and non-governmental organizations (NGOs) to establish development and productive investment projects that will increase employment opportunities for women and other marginalized groups. There are multiple strategies to increase opportunities for business startups in Jordan: expanding the number of Development Zones; channeling more funds through the Agricultural Credit Corporation; and implementing the Governorates’ Development Fund. At this point, Jordan needs to address regional disparities, improve the productivity and competitiveness of its MSMEs in order to compete in both the national and international markets, and accelerate investment and economic growth. The government should address current weaknesses in the institutional business framework, the position of Jordanian products in world markets, and the basic infrastructure which supports investments in industries, technology, tourism, and agriculture.
In Jordan, there are 25.6 MSMEs per 1,000 inhabitants, which is low compared to the global average and to countries with
similar levels of economic development. An analysis of MSMEs sector trends reveals slow growth of non-agricultural enterprises over the past five years – an annual average increase of only 1.3 percent between 2006 and 2011. The net growth in the number of enterprises was lowest for those with one to four employees (annual average of just over 1 percent). On the other hand, the number of enterprises with 10-19 employees, 20-49 employees, and more than 100 workers has increased by an average of about 4 percent annually in each category. This could indicate a slower rate of new start-ups (since it can be assumed that start-ups often have one to four employees), and/or that enterprises are growing and becoming bigger. The growth of enterprises slowed considerably in the second half of the decade (down from an average of 3.8 percent annually during 2001-2006), a trend that could hurt Jordan’s economy in the future should it continue.
Data indicate that employment in non-agricultural private enterprises grew by an annual average of 2 percent from 2006 to 2011, again at a much slower growth than during 2001-2006 (annual average of 6.6 percent). This trend is concerning. The share of employment in enterprises with 100 or more employees has increased while the share of employment in enterprises with fewer than 50 employees has declined. As a result, the average firm size has increased from 3.8 employees in 2001 to 4.4 employees in 2011.
The proportion of early-stage entrepreneurs (individuals who are in the process of starting a business and individuals who own a business that is less than, or equal to, 42 months old) in the adult
On the national level, the density of MSMEs is 25.6 per 1,000 inhabitants, which is low compared to the global average and for a country at Jordan’s level of economic development.

JORDAN HUMAN DEVELOPMENT REPORT 2015 83
population is 10.2 percent, which is lower than would be expected for a country at this level of development. This suggests that there is room for efforts promoting entrepreneurship.
During the period of 2001-2012, the number of self-employed persons increased by an annual average of 1.67 percent. Overall, self-employment rates (percent of total employment) have dropped from 17.1 percent in 2001 to 15.5 percent in 2012, and the actual number of self-employed persons has been declining since 2009. This suggests that self-employment is growing at a slower pace than overall employment. Women make up less than 4.5 percent of self-employed persons, which is significantly lower than other countries. However, over the past 11 years (2001-2012), Jordanian women became self-employed at 2.7 times the rate of men, suggesting that it is becoming a more attractive employment option for Jordanian women, although the base is still very small.40
According to the Establishments Census 2011, the number of non-agricultural private enterprises in Jordan reached 156,728, representing 99.8 percent of all enterprises (the remaining being public enterprises). Almost 97 percent of these private enterprises have fewer than 10 employees, which is significantly higher than the EU average of 92.2 percent. More importantly, almost 92 percent of all private enterprises in Jordan have fewer than five employees. The lack of medium size enterprises reflects a serious structural deficiency in the Jordanian economy.41
Although there is a significant number of MSMEs in Jordan, their small size – as evident by the majority of enterprises with five or less employees – place them at a disadvantage when compared to large enterprises. They have fewer internal resources, less capacity to compete in global markets, and suffer from a lack of management skills, financing, and technology, which limit their survival and growth potential. The majority of MSMEs serve local markets and focus on the production of traditional, low value-added
goods with lower quality. Very few have the capacity to compete in international markets. The vast majority do not have any quality control systems in place, nor do they follow quality control procedures in compliance with international quality certification systems. They invest little in technologies that will add value to their products and exhibit low levels of technology utilization overall.
Apart from internal constraints, the ability of MSMEs to function effectively is also affected by external factors. These include: the markets in which they operate (e.g. entry barriers and competition); policies, laws, and regulations affecting business activities that do not take into consideration the effect on smaller enterprises; and the organizational and institutional arrangements surrounding the enterprise (e.g. business support entities and services, financial mechanisms, etc.).
There are few empirical studies of Jordanian MSMEs. However, consultations with business and sector associations, government officials, entrepreneurs, MSME support providers, and financial institutions reveal consensus on the major obstacles to MSME development, which are:
• A weak entrepreneurial culture;
• Lack of access to financing;
• Lack of entrepreneurial and management skills and capacity;
• Inadequate access to business development, advisory, and diagnostic support services, especially in the governorates;
• Market access challenges;
• Lack of innovation and technology adoption/development;
• Legal, regulatory, and administrative barriers.
These barriers are even more prevalent for new enterprises, which can have a negative effect on business start-up rates and the survival rate and growth opportunities of

JORDAN HUMAN DEVELOPMENT REPORT 2015 84
new entrepreneurs. Women and young people who start businesses face even higher barriers since they oftentimes lack experience in management skills, how to run a business, participation in formal business networks, and have lower credibility. In addition, Jordanian stakeholders emphasize the high input costs (e.g. cost of energy); the lack of adequately skilled labor due to an education and training system that is not teaching graduates “employability skills”; and the low commitment/investment of MSMEs in training their workers, all of which reduce their productivity and competitiveness.42
Women’s Participation and EmploymentWomen’s low participation will remain a huge problem, especially in a country like Jordan. Women in the MENA region comprise, on average, 28 percent of the total work force, which is the lowest average globally and well below the average of 43 percent in other developing countries. Even though Jordan has better indicators than most of these countries in terms of education and health, the percentage of Jordanian women who participate in the labor force is lower than the MENA region’s average.
The large gender gap in self-employment is another crucial issue. In 2012, the male self-employment rate was almost five times higher than the female self-employment rate (17.8 percent versus 3.6 percent). Consequently, women’s representation among self-employed workers is very low, although it slightly increased from 4.0 percent in 2001 to 4.3 percent in 2012. The number of self-employed women has been growing at a slightly faster rate than that of men: an increase of 22 percent in the number of self-employed women from 2001 to 2012 (annual average increase of 2 percent) compared to an increase of 13 percent for self-employed men (annual average increase of 1.2 percent). However, it should be noted that there were only about 3,000 self-employed women in Jordan in 2012, which means that the numbers used for these calculations were very small.
Women’s low participation in self-employment is influenced by cultural traditions and societal attitudes about women’s role in economic activity, their low labor force participation rate in general, and the overall business environment. The National Agenda and other government policy documents have stressed the importance of women’s empowerment and greater integration into the workforce
Table (4-1): Labor market status of Jordanian population aged 15+ by gender and educational level (%), 2013
79.9
40.1
55.3
19.8
18.5
39.6
20.1
59.9
44.7
80.2
81.5
60.4
Illiterate
Less thansecondary
SecondaryIntermediate diplomaBachelor’sdegree
Total
8.5
10.8
8.5
7.4
12.6
10.6
0.9
3.0
5.0
30.1
55.9
13.2
99.1
97.0
95.0
69.9
44.1
86.8
0.0
11.4
8.6
20.2
26.6
22.2
Source: Department of Statistics – The Hashemite Kingdom of Jordan 2013b
EducationalAttainment Men Women
Employed (%) Inactive (%) UnemploymentRate (%) Employed (%) Inactive (%) Unemployment
Rate (%)
Economic Activity Status

JORDAN HUMAN DEVELOPMENT REPORT 2015 85
to improve Jordan’s social and economic progress. Enabling women to enter the workforce in the first place will make it easier for them to eventually start their own businesses. The government’s Executive Development Program 2011–2013 reinforces the important role of women in the economy by focusing on the training and strengthening of women’s vocational and entrepreneurial skills, in addition to facilitating their access to finance. There are several reasons for increasing women’s access to finance. First, women are less likely to own property that can be used as collateral for bank loans to finance their business operations. According to the NHDR 2011, only 10.4 percent of women own real estate and only 2.7 percent of women are agricultural land-owners. Second, many Jordanian women have less confidence in their ability to start a business, are more risk averse than men, and are less likely to have previous business and management experience, access to information and established business networks, and cultural support for starting and developing a business.
On the other hand, women-owned enterprises appear to be much more likely than male-owned enterprises to hire other women, which makes them an important driver for increasing the number of women in the labor market. According to the NHDR 2011, women entrepreneurs hire 1.84 female employees for every male employee (about two-thirds of their employees are female), while male-owned enterprises have 3.11 males for every female employed (only about 27 percent of their employees are female). However, many women operate informal, home-based enterprises in traditional sectors that have limited growth potential. Evidence suggests that women, in general, tend to run smaller businesses than men.
Women remain underrepresented among business owners and self-employed persons. Indeed, self-employed women in micro, small, and medium enterprises account for only 6.5 percent of female employment, far below the proportion for males (20.6 percent). Expanding opportunities for
females to start their own businesses has a multiplier effect; as mentioned above, when females start their own firms, they are more likely to hire other females. Traditional businesses, such as selling food, handicrafts, and opening beauty salons will most likely continue to dominate. Therefore, the challenge is to diversify the types of businesses that females start.
Further, while it is necessary to focus on constraints to female participation in general, policies need to focus on constraints facing married females and educated women in rural areas, in particular. Restraints include: limited opportunities for on-the-job and vocational training tailored specifically for females; administrative barriers to home-based employment; the need to reform the Labor Law and the Social Security Law in regards to part-time work; lack of maternity benefits; and an insufficient number of public preschool education facilities (nurseries and kindergarten).
It is necessary to focus on current constraints to active female participation, in particular those facing married females and educated women in rural areas. The general constraints include: limited opportunities for on-the-job and vocational training tailored specifically for females; administrative barriers to home-based employment; the Labor Law and the Social Security Law on part-time work; lack of sufficient maternity benefits; and the lack of a sufficient number of public preschool education institutions (nurseries and kindergarten).

JORDAN HUMAN DEVELOPMENT REPORT 2015 86
Employment, Livelihood and Regional DisparitiesAs mentioned above, it is important to take into consideration regional disparities when improving employment and livelihood. Unemployment rates vary between governorates. In 2013, Amman’s unemployment rate was 10.5 percent; Jerash’s was 12.3 percent; Irbid, Zarqa, and Ajloun had 13, 13.1, and 13.5 percent unemployment rates respectively; Balqaa and Mafraq had 14.4 and 14.5 percent respectively; Ma’an, Aqaba, and Karak had 15 percent, 15.2 percent, and 15.8 percent respectively; and finally, Madaba and Tafileh had the highest unemployment rates, namely 16.2 and 17.1 percent respectively.
The 2011 Establishments Census also revealed regional disparities in the number and density of private enterprises across governorates. Just over 77 percent of all active establishments are located in Amman, Irbid, and Zarqa. 71 percent of Jordan’s population live in these governorates. There are 25.6 MSMEs (enterprises with fewer than 250 employees) per 1,000 inhabitants. This number is low according to World Bank data which reports an average density of 31 MSMEs per 1,000 inhabitants across 132 countries.43 The density of MSMEs is highest in Amman (29.7 per 1,000 inhabitants), followed by Zarqa (26.2 per 1,000) and Aqaba (26.1 per 1,000), and the lowest in Mafraq (16.5 per 1,000).
The disparity is also evident when looking at governorates’ share of employees in different economic sectors in comparison to their population size. For example, Amman’s share of employment is almost double its share of the population. This may be due to the fact that many employees work in Amman but live in other governorates since there are higher levels of economic activity in Amman but lower living costs outside the capital. MSMEs in Amman also generate the highest levels of income, Zarqa the second highest, and Irbid the third highest.
Amman is home to around 45 percent of establishments that have less than 250 workers and 73.6 percent of establishments that have 250 workers or more. 17.2 percent of establishments with less than 250 workers and 6.5 percent of establishments with 250 workers or more are located in Irbid. Zarqa is home to 15.2 percent of establishments with less than 250 workers and 10.6 percent of establishments with more than 250 workers. Only 1.7 percent, 1.1 percent, and 1.6 percent of establishments that employ less than 250 workers are located in Ajloun, Tafileh, and Ma’an respectively. It can be inferred from figure (4-1) that the center region (Amman, Balqaa, Zarqa, and Madaba) hosts 67.6 percent of establishments with less than 250 workers and 88.7 percent of establishments with more than 250 workers. As for the northern region (Irbid, Mafraq, Jerash, and Ajloun), these governorates are home to 24.1 percent of establishments with less than 250 workers and 8.9 percent of establishments with more than 250 workers. The southern region, (Karak, Ma’an, Tafileh and Aqaba), housed 8.3 percent of establishments with less than 250 workers and 2.4 percent of establishments with more than 250 workers. These percentages align with the size of economic activity in each region as well as with the population density. 44
Comparing the 2011 Establishment Census with the 2006 Establishments Census, the statistics show that Tafileh and Jerash experienced the highest overall growth in the number of enterprises: about 27 percent and 22 percent respectively. This is interesting considering the fact that these are among the smallest governorates. The lowest growth rates were in Amman (the number of enterprises declined with 5 percent), Ma’an (1.5 percent increase), and Mafraq (0.5 percent increase). See figure (4-2) and table (4-2) below for more information.

JORDAN HUMAN DEVELOPMENT REPORT 2015 87
Figure (4-1): Distribution of Economic Establishments by governorate and company size (%) of total number of establishments in each category
80.0
70.0
60.0
50.040.0
30.020.0
10.00.0
44.9
73.6
5.2 4.1
15.210.6
2.3 0.4
17.2
6.53.0 1.2 2.2 1.2 1.7 3.4 0 .4 1.1 1.6 2.2 2.0
Amman Balqa Zarqa Madaba Irbid Mafraq Jarash Ajlun Karak Tafiela Ma’an Aqaba
Employees Category 1-249 Employees Category _> 250
Source: Department of Statistics – The Hashemite Kingdom of Jordan 2011
Figure (4-2): Numbers of MSMEs by Governorate
0-1.797
1.798-3.668
3.669-7.665
7.666-24.207
24.208-75.913
Tafiela1.797
Aqaba4.382
Irbid27.655
Zarqa24.556
Ma'an2.636
Ajlun2.728
Balqa8.538
Amman75.913
Jarash3.593
Mafraq4.808
Karak5.508
Madaba3.765
Source: Department of Statistics – The Hashemite Kingdom of Jordan 2011

JORDAN HUMAN DEVELOPMENT REPORT 2015 88
Gov
erno
rate
1-4
Tabl
e (4
-2):
Num
ber o
f act
ive
esta
blis
hmen
ts b
y go
vern
orat
e an
d em
ploy
men
t siz
e,
2011
Num
ber
Dist
ribut
ion
(row
)N
umbe
rD
istrib
utio
n (r
ow)
Num
ber
Dist
ribut
ion
(row
)N
umbe
rD
istrib
utio
n (r
ow)
Num
ber
Dist
ribut
ion
(row
)N
umbe
rD
istrib
utio
n (r
ow)
Num
ber
Dist
ribut
ion
(row
)
10-1
920
-49
50-9
910
0-24
9≥
250
Tota
l D
ensi
ty o
f en
ter-
pris
es >
250
w
orke
rs p
er
1,00
0 in
habi
t-an
ts*
Chan
ge in
nu
mbe
r of
ente
rpris
es,
2006
-201
1
*Sou
rce:
Dep
artm
ent o
f Sta
tistic
s –
The
Has
hem
ite K
ingd
om o
f Jor
dan
2011
Am
man
Ajlo
un
Aqa
ba
Balq
a
Irbid
Jera
sh
Kara
k
Ma’
an
Mad
aba
Maf
raq
Tafie
la
Zarq
a
Tota
l
61,2
01
2,59
6
3,01
3
7,85
6
25,8
06
3,42
0
5,00
0
2,23
9
3,49
4
4,54
8
1,64
7
22,5
42
143,
362
87.0
%
97.1
%
86.7
%
96.5
%
95.9
%
97.3
%
95.1
%
92.3
%
96.1
%
96.0
%
96.4
%
94.4
%
91.5
%
6,88
8
67 394
227
946
85 232
161
117
164
59 1,11
4
10,4
54
9.8%
2.5%
11.3
%
2.8%
3.5%
2.4%
4.4%
6.6%
3.2%
3.5%
3.5%
4.7%
6.7%
1,30
9
10 35 34 103 8 17 16 14 14 2 129
1,69
1
1.9%
0.4%
1.0%
0.4%
0.4%
0.2%
0.3%
0.7%
0.4%
0.3%
0.1%
0.5%
1.1%
451 0 20 6 22 0 5 7 3 2 1 36 553
0.64
%
—
0.58
%
0.07
%
0.08
%
—-
0.10
%
0.29
%
0.08
%
0.04
%
0.06
%
0.15
%
0.35
%
342 0 9 9 16 0 1 4 5 6 0 30 422
0.49
%
—
0.26
%
0.11
%
0.06
%
—
0.02
%
0.16
%
0.14
%
0.13
%
—
0.13
%
0.27
%
181 0 5 10 16 3 1 0 1 3 0 26 246
0.26
%
—
0.14
%
0.12
%
0.06
%
0.09
%
0.02
%
—
0.03
%
0.06
%
—
0.11
%
0.16
%
70,3
72
2,67
3
3,47
6
8,14
2
26,9
09
3,51
6
5,25
6
2,42
7
3,63
4
4,73
7
1,70
9
23,8
77
156,
728
44.9
%
1.7%
2.2%
5.2%
17.2
%
2.2%
3.4%
1.5%
2.3%
3.0%
1.1%
15.2
%
100%
-5.1
%
18.3
%
2.6%
10.8
%
11.0
%
21.8
%
8.0%
1.5%
12.2
%
0.2%
27.4
%
5.6%
6.6%
-29.
7
19 26.1
20 24.7
19.2
22 21 23.8
16.5
20 26.2
25.6

JORDAN HUMAN DEVELOPMENT REPORT 2015 89
There are regional disparities in the informal economy as well. The relative distribution of the informal labor force reflects the population density between rural and urban areas. In Jordan, around 83 percent of the informal labor force is concentrated in urban areas, versus 17 percent in rural areas. Moreover, 47.5 percent of persons working in urban areas work in the informal sector; in rural areas, this proportion is 28.3 percent.
As for the relative distribution of SMEs in the informal sector, it is estimated that the majority are located in Amman and spread across all economic activities. Comparing the number of enterprises in the informal sector to the total number of informal enterprises nation-wide, Amman has 34 percent of enterprises in the “mining and quarrying” sector and 89 percent in the “organizations and foreign agencies activities” sector. Zarqa hosts 20 percent of establishments in the “water and sewage supply” sector, 22 percent of “transportation and storage” sector establishments, and 5 percent in both the “financial and insurance” and “public administration and defense” sectors. Irbid is home to 18 percent of informal enterprises in the “wholesale and retail and vehicle maintenance activity” sector, 19 percent in the education sector, and 19 percent in the manufacturing sector; it does not have any establishments specializing in “organizations and foreign agencies’ activities”. In the remaining governorates, there are very few informal sector establishments; none of these governorates had establishments in the “organizations and foreign agencies activities” sector. However, Mafraq had 24 percent of the total informal sector establishments in the mining and quarrying activity, which is a relatively high percentage and most likely a result of its landscape. Apart from this anomaly, the remaining governorates (except Amman, Zarqa, and Irbid) housed between 0 and 11 percent of all informal establishments 45
Conclusion
This chapter clarifies that one of the main reasons behind regional disparities is the lack of proper and enough business opportunities among governorates due to disparities in the geographic distribution of the private sector in the Jordan, where Amman, Zarqa, Irbid and Aqaba are dominating among all other regions. The private sector almost does not exist in Tafileh and Ma’an. This is not only a main challenge to employing youth and women, but it is also an impediment to economic growth and sustainable development. It was clear, though, that remote governorates have the highest rates of unemployment, especially among youth and women. Work ethics and job skills are challenging factors among unemployed youth all over the country. However, governorates, other than Amman, Zarqa, Irbid and Aqaba, are suffering from the lack of proper capacity building programs in both areas. A regional and sub-regional data base on youth employment, including the gender factor, is not found. Informal economy is the main place where youth and women are more engaged in many governorates, including the four above mentioned main governorates. This by itself is a factor for poor employment conditions where social security coverage is not available, let alone healthcare coverage. Finally, the lack of proper and enough financing to micro and small enterprises, which includes all governorates with different proportions depending on the proximity to Amman, is a tumbling factor for engaging youth and women in the labor market.
Around 83 percent of the informal labor force is concentrated in urban areas, versus 17 percent in rural areas. 47.5 percent of those working in urban areas are informally employed; in rural areas, this percentage is 28.3.

JORDAN HUMAN DEVELOPMENT REPORT 2015 90

JORDAN HUMAN DEVELOPMENT REPORT 2015 91
Empowered lives. Resilient nations.
YOUTH

JORDAN HUMAN DEVELOPMENT REPORT 2015 92
CHAPTER FIVEYOUTH

JORDAN HUMAN DEVELOPMENT REPORT 2015 93
IntroductionJordan’s large youth population constitutes the cornerstone of development and the foundation for progress and positive change. Empowered with knowledge and skills in science and technology, young people can help drive Jordan’s progress towards sustainable development. Therefore, it is crucial to invest in youth and enable them to engage in the labor market.
The number of Jordanians aged 15-2446
reached 1,199,418 in 2013, which represents about 20 percent of the total population. They also comprise 30.8 percent of the working age population, which reached a total of 3,897,040 people in 2013. According to several demographers, this percentage is reaching a turning point. Many countries in the Middle East, including Jordan, are approaching a point of “peak youth,” which means that the proportion of young people will begin to decline, while the proportion of the elderly will increase. This requires a clear and balanced vision of development to ensure appropriate policies that utilize human resources in the most optimal way.
However, before Jordan reaches this so called “demographic window of opportunity,” it is expected that youth will come to account for an even larger proportion of the
population. This requires that policy makers focus on education. Education is the most important tool to empower people and drive sustainable development, by arming them with cognitive skills, strengthening their capacities, building their skills and knowledge, and teaching them necessary expertise. Human capital accelerates the different dimensions of development and high quality education enables youth to respond to the particular requirements of their generation and to compete in the labor market.
Distribution of the Population by Age and GenderJordan’s total population reached about 6,008,000 47 people in 2013 and was growing with an annual rate of 2.2 percent. Youth (15 – 24 year olds) accounted for 20 percent of the total population, as shown in Table (5-1).
As seen in the table above, there is a balanced gender distribution among young people: 53.5 percent are male and 46.5 percent are female. Among females, 18.9 percent are between 15-24 years old. Among men, 21.0 percent are between 15-24 years old.
Table (5-1): Distribution of the Jordanian population by age group and gender
Below 15
15 – 24
More than 24
Total
1,084,308
641,401
1,331,487
3,057,196
1,026,210
558,017
1,366,135
2,950,362
2,110,518
1,199,418
2,697,622
6,007,558
Male Female Total
Source: Information from Al Manar Project Database/the National Center for Human ResourcesDevelopment
Table (2-5): Distribution of Basic Education Students by Authority, Gender in the Kingdom, 2012-2013
Age group
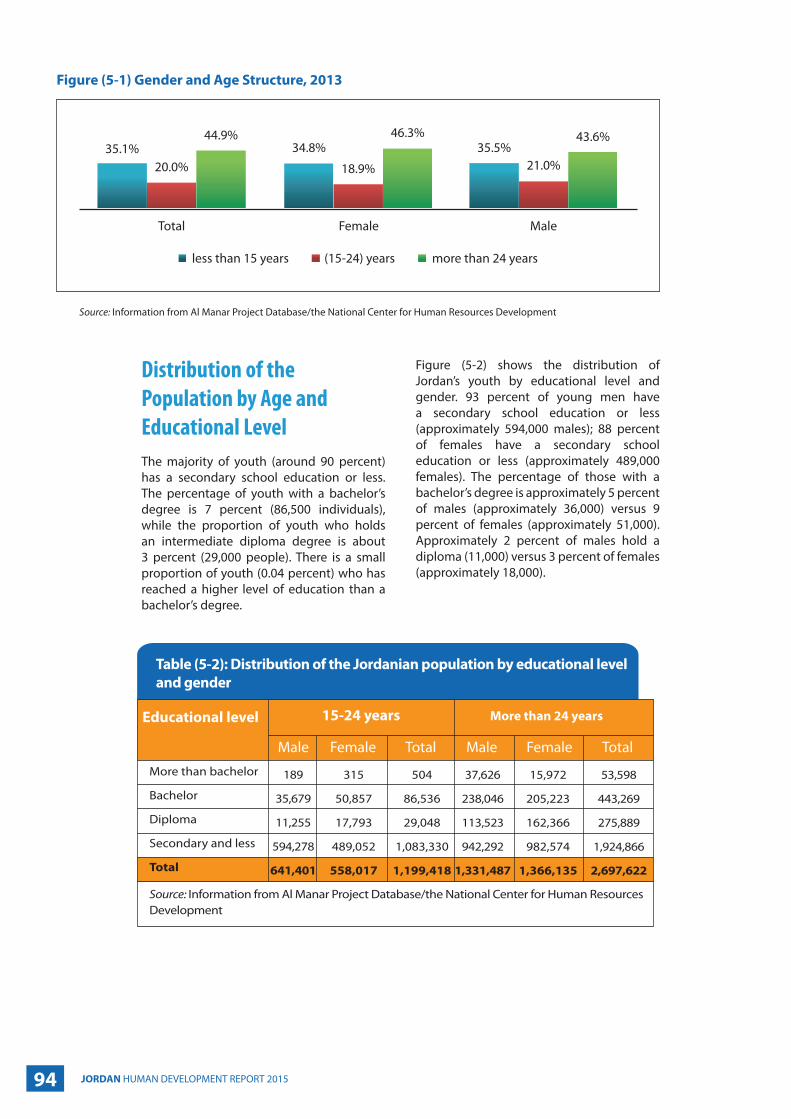
JORDAN HUMAN DEVELOPMENT REPORT 2015 94
Distribution of the Population by Age and Educational LevelThe majority of youth (around 90 percent) has a secondary school education or less. The percentage of youth with a bachelor’s degree is 7 percent (86,500 individuals), while the proportion of youth who holds an intermediate diploma degree is about 3 percent (29,000 people). There is a small proportion of youth (0.04 percent) who has reached a higher level of education than a bachelor’s degree.
Figure (5-2) shows the distribution of Jordan’s youth by educational level and gender. 93 percent of young men have a secondary school education or less (approximately 594,000 males); 88 percent of females have a secondary school education or less (approximately 489,000 females). The percentage of those with a bachelor’s degree is approximately 5 percent of males (approximately 36,000) versus 9 percent of females (approximately 51,000). Approximately 2 percent of males hold a diploma (11,000) versus 3 percent of females (approximately 18,000).
Figure (5-1) Gender and Age Structure, 2013
Table (5-2): Distribution of the Jordanian population by educational level and gender
189
35,679
11,255
594,278
641,401
More than bachelor
Bachelor
Diploma
Secondary and less
Total
315
50,857
17,793
489,052
558,017
504
86,536
29,048
1,083,330
1,199,418
37,626
238,046
113,523
942,292
1,331,487
15,972
205,223
162,366
982,574
1,366,135
53,598
443,269
275,889
1,924,866
2,697,622
Source: Information from Al Manar Project Database/the National Center for Human ResourcesDevelopment
Educational level 15-24 years More than 24 years
Male Female Total Male Female Total
35.1%20.0%
44.9%34.8%
18.9%
46.3%35.5%
21.0%
43.6%
Total Female Male
less than 15 years (15-24) years more than 24 years
Source: Information from Al Manar Project Database/the National Center for Human Resources Development

JORDAN HUMAN DEVELOPMENT REPORT 2015 95
Table (5-3): Percentage Distribution of the Jordanianpopulation byage, gender, and educational level
Above Bachelor
Bachelor
Diploma
Secondary school or less
Total 35.1%
0.9%
16.3%
9.5%
36.0%
20.0%
99.1%
83.7%
90.5%
64.0%
44.9%
Educational qualification Below 15 15 – 24 Over 24
Source: Information from Al Manar Project Database/the National Center for Human ResourcesDevelopment
Table (2-5): Distribution of Basic Education Students by Authority, Gender in the Kingdom, 2012-2013
Figure (5-2): Distribution of Jordanian youth by educational level and gender
Bachelor7%
Diploma3%
Secondary schoolor less90%
Diploma2%
Bachelor5%
Males
Secondary schoolor less93%
Diploma3%
Bachelor9%
Females
Secondary schoolor less88%

JORDAN HUMAN DEVELOPMENT REPORT 2015 96
Distribution of Youth (15-24 years old) by Educational Level and RegionDistribution of youth (15-24 years old) by educational level and region
Table (5-4): Distribution of Jordanian youth by educational level, gender, and region
Above BA/ BS
BA/ BS
Secondary and less
Intermediate diploma
Total
73
10,855
188,102
3,766
202,796
95
22,650
347,352
6,463
376,560
21
2,174
58,824
1,026
62,045
121
15,781
155,004
5,915
176,821
182
29,707
284,383
10,308
324,580
12
5,369
49,665
1,570
56,616
194
26,636
343,106
9,681
379,617
277
52,357
631,735
16,771
701,140
33
7,543
108,489
2,596
118,661
Region
Northern region
Central region
Southern region
Educational qualification!
Educational qualification2013
Above BA/ BS
BA/ BS
Secondary and less
Intermediate diploma
Total
Above BA/ BS
BA/ BS
Secondary and less
Intermediate diploma
Total
Male Female Total
Source: Information from Al Manar Project Database/the National Center for Human ResourcesDevelopment

JORDAN HUMAN DEVELOPMENT REPORT 2015 97
Figure (5-3): Distribution of Jordanian youth by educational level and region
Central RegionDiploma
2%
Diploma2%
BA/ BS8%
BA/ BS6%
Secondaryor less90%
Southern Region Northern Region
Seconda ryor less92%
Diploma3%
BA/ BS7%
Seconda ryor less90%

JORDAN HUMAN DEVELOPMENT REPORT 2015 98
Table (5-5): Distribution of Jordanian youth by educational qualification, gender, and governorate
BA/ BS
Secondary or less
Intermediate diploma
Total
BA/ BS
Secondary or less
Intermediate diploma
Total
Higher than BA/ BS
BA/ BS
Secondary or less
Intermediate diploma
Total
Higher than BA/ BS
BA/ BS
Secondary or less
Intermediate diploma
Total
Higher than BA/ BS
BA/ BS
Secondary or less
Intermediate diploma
Total
Higher than BA/ BS
BA/ BS
Secondary or less
Intermediate diploma
Total
BA/ BS
Secondary or less
Intermediate diploma
Total
Higher than BA/ BS
BA/ BS
Secondary or less
Intermediate diploma
Total
BA/ BS
Secondary or less
Intermediate diploma
Total
Higher than BA/ BS
BA/ BS
Secondary or less
Intermediate diploma
Total
Higher than BA/ BS
BA/ BS
Secondary or less
Intermediate diploma
Total
Higher than BA/ BS
BA/ BS
Secondary or less
Intermediate diploma
Total
425
11,000
154
11,579
239
11,204
212
11,655
21
1,242
25,852
501
27,616
268
10,768
159
11,195
73
8,054
119,915
2,910
130,952
1,186
32,486
464
34,136
1,186
32,486
464
20,841
613
16,095
159
16,867
2,439
39,663
501
42,603
64
4,062
78,478
1,863
84,467
31
15,127
214,937
3,888
233,983
1,022
14,274
211
15,507
996
7,879
149
9,024
748
9,788
250
10,786
3,002
23,441
854
27,297
12
623
8,557
317
9,509
81
10,267
98,539
3,984
112,871
21
2,662
25,535
748
28,966
2,662
25,535
748
18,014
19
1,356
14,877
718
16,970
2,346
32,708
1,074
36,128
21
5,185
69,119
2,369
76,694
121
20,449
169,478
6,583
196,631
40
1,727
13,078
282
15,127
1,421
18,879
303
20,603
987
20,992
462
22,441
21
4,244
49,293
1,355
54,913
12
891
19,325
476
20,704
154
18,321
218,454
6,894
243,823
21
3,848
58,021
1,212
63,102
3,848
58,021
1,212
38,855
19
1,969
30,972
877
33,837
4,785
72,371
1,575
78,731
85
9,247
147,597
4,232
161,161
152
35,576
384,415
10,471
430,614
40
2,749
27,352
493
30,634
Governorate
Tafilah
Aqaba
Karak
Ma’an
Irbid
Mafraq
Jerash
Ajloun
Balqaa
Zarqa
Amman
Madaba
Educational qualification2013
Male Female Total
Source: Information from Al Manar Project Database/the National Center for Human ResourcesDevelopment
_
_
_
_
Distribution of Jordanian Youth by Educational Level and GovernorateThe majority of youth hold a secondary degree or less across all different governorates and there is a similar gender distribution as well. The second most common degree is a bachelor’s. More information can be found in the table below and in the graphs that follow.

JORDAN HUMAN DEVELOPMENT REPORT 2015 99
Table (5-5): Distribution of Jordanian youth by educational qualification, gender, and governorate
BA/ BS
Secondary or less
Intermediate diploma
Total
BA/ BS
Secondary or less
Intermediate diploma
Total
Higher than BA/ BS
BA/ BS
Secondary or less
Intermediate diploma
Total
Higher than BA/ BS
BA/ BS
Secondary or less
Intermediate diploma
Total
Higher than BA/ BS
BA/ BS
Secondary or less
Intermediate diploma
Total
Higher than BA/ BS
BA/ BS
Secondary or less
Intermediate diploma
Total
BA/ BS
Secondary or less
Intermediate diploma
Total
Higher than BA/ BS
BA/ BS
Secondary or less
Intermediate diploma
Total
BA/ BS
Secondary or less
Intermediate diploma
Total
Higher than BA/ BS
BA/ BS
Secondary or less
Intermediate diploma
Total
Higher than BA/ BS
BA/ BS
Secondary or less
Intermediate diploma
Total
Higher than BA/ BS
BA/ BS
Secondary or less
Intermediate diploma
Total
425
11,000
154
11,579
239
11,204
212
11,655
21
1,242
25,852
501
27,616
268
10,768
159
11,195
73
8,054
119,915
2,910
130,952
1,186
32,486
464
34,136
1,186
32,486
464
20,841
613
16,095
159
16,867
2,439
39,663
501
42,603
64
4,062
78,478
1,863
84,467
31
15,127
214,937
3,888
233,983
1,022
14,274
211
15,507
996
7,879
149
9,024
748
9,788
250
10,786
3,002
23,441
854
27,297
12
623
8,557
317
9,509
81
10,267
98,539
3,984
112,871
21
2,662
25,535
748
28,966
2,662
25,535
748
18,014
19
1,356
14,877
718
16,970
2,346
32,708
1,074
36,128
21
5,185
69,119
2,369
76,694
121
20,449
169,478
6,583
196,631
40
1,727
13,078
282
15,127
1,421
18,879
303
20,603
987
20,992
462
22,441
21
4,244
49,293
1,355
54,913
12
891
19,325
476
20,704
154
18,321
218,454
6,894
243,823
21
3,848
58,021
1,212
63,102
3,848
58,021
1,212
38,855
19
1,969
30,972
877
33,837
4,785
72,371
1,575
78,731
85
9,247
147,597
4,232
161,161
152
35,576
384,415
10,471
430,614
40
2,749
27,352
493
30,634
Governorate
Tafilah
Aqaba
Karak
Ma’an
Irbid
Mafraq
Jerash
Ajloun
Balqaa
Zarqa
Amman
Madaba
Educational qualification2013
Male Female Total
Source: Information from Al Manar Project Database/the National Center for Human ResourcesDevelopment
_
_
_
_

JORDAN HUMAN DEVELOPMENT REPORT 2015 100
Figure (5-4): Distribution of Jordanian youth by educational level in the southern governorates
Figure (5-5): Distribution of Jordanian youth by educational level in the northern governorates
25,000
20,000
15,000
10,000
5,000
Male
Female
Total
Ma’an
More thanBachelor
Bachelor Secondaryand less
Diploma
Male
Female
Total
60,00050,00040,00030,00020,00010,000
Karak
More than Bachelor
Secondary and le
ss
Bachelor
Diploma
Aqaba Tafiela
25,000
20,000
15,000
10,000
5,000
Male
Female
Total
BachelorSecondaryand less
Diploma
Male
Female
Total
BachelorSecondaryand less
Diploma
20,00018,00016,00014,00012,00010,000
8,0006,0004,0002,000
Ajlun Irbid
Male
Female
Total
35,00030,00025,00020,00015,00010,000
5,000
More than Bachelor
Secondary and le
ss
Bachelor
Diploma
More than Bachelor
Secondary and le
ss
Bachelor
Diploma
Male
Female
Total
250,000
200,000
150,000
100,000
50,000

JORDAN HUMAN DEVELOPMENT REPORT 2015 101
Figure (5-6): Distribution of Jordanian youth by educational level in the central governorates
70,00060,00050,00040,00030,00020,00010,000
Mafraq Jerash
70,000
60,000
50,000
40,000
30,000
20,000
10,000
More than Bachelor
Secondary and le
ss
Bachelor
Diploma
Male
Female
Total
Male
Female
Total
Bachelor Secondaryand less
Diploma
Balqaa Amman
450,000400,000350,000300,000250,000200,000150,000100,000
50,000
80,000
70,000
60,00050,00040,00030,000
20,00010,000
More than Bachelor
Secondary and le
ss
Bachelor
Diploma
Male
Female
Total
Male
Female
Total
Bachelor Secondaryand less
Diploma
ZarqaMadaba
30,00025,000
20,00015,000
10,000
5,000
160,000140,000120,000100,00080,00060,00040,00020,000
More than Bachelor
Secondary and le
ss
Bachelor
Diploma
More than Bachelor
Secondary and le
ss
Bachelor
Diploma
Male
Female
Total
Male
Female
Total
Source: Information from Al Manar Project Database/the National Center for Human Resources Development

JORDAN HUMAN DEVELOPMENT REPORT 2015 102
Distribution of Jordanian Youth by Educational Level and Economic ActivityJordan’s population, as in all countries, can be divided into two categories: the economically active and the economically inactive. Economically active includes those persons who are employed or who are actively seeking employment. In Jordan, 23 percent of youth are economically active.
As for the economically active population, a large proportion (74.1 percent) have a secondary education or less. 22.4 percent has a bachelor’s degree, 3.3 percent an intermediate diploma, and 0.1 percent a degree higher than a bachelor’s. See the figure below for the distribution of educational qualifications among economically active youth (both employed and unemployed).
Figure (5-7): Distribution of Jordanian economically inactive youth by educational level
In Jordan, 77 percent of youth are economically inactive. Only 23 percent are economically active.
Bachelor3%
Diploma1%
Inactive
Secondary or less96%
Source: Information from Al Manar Project Database/the National Center for Human Resources Development

JORDAN HUMAN DEVELOPMENT REPORT 2015 103
Figure (5-8): Distribution of Jordanian youth by educational level and activity
Distribution of Working Youth Population by Educational Level and SpecializationA significant proportion of youth are still attending school and have not yet finished secondary school. Most students specialize in social sciences, business, law, science, mathematics, computer science, humanities, arts, engineering, manufacturing and construction. The distribution of educational levels within these specializations is shown in table (5-6) and Figure (5-9).
Diploma10%
Diploma5%
Unemployed Employed
Secondaryor less53%
BA/ BS37%
BA/ BS15%
Secondaryor less80%
Source: Information from Al Manar Project Database/the National Center for Human Resources Development

JORDAN HUMAN DEVELOPMENT REPORT 2015 104
Education
Higher than BA/ BS
BA/BS
Intermediate diploma
Services
Higher than BA/ BS
BA/BS
Intermediate diploma
Humanities and arts
Higher than BA/ BS
BA/BS
Secondary or less
Intermediate diploma
Agriculture and Veterinary
Higher than BA/ BS
BA/BS
Intermediate diploma
Health and social services
Higher than BA/ BS
BA/BS
Intermediate diploma
Social sciences, business, and law
Higher than BA/ BS
BA/BS
Secondary or less
Intermediate diploma
Science, math, and computer science
Higher than BA/ BS
BA/BS
Intermediate diploma
Engineering, manufacturing, and construction
Higher than BA/ BS
BA/BS
Intermediate diploma
2,524
2,250
274
2,399
1,259
1,140
4,229
29
3,089
1,111
359
18
266
75
4,614
2,661
1,953
15,156
67
12,802
43
2,244
6,983
5,643
1,340
10,902
75
7,709
3,118
11,827
109
8,553
3,165
1,052
20
698
334
12,686
21
10,135
37
2,493
778
769
9
7,641
40
3,981
3,620
15,451
90
10,527
4,834
13,647
35
10,513
3,099
5,920
5,681
239
14,351
109
10,803
3,439
3,451
20
1,957
1,474
16,915
50
13,224
37
3,604
1,137
18
1,035
84
12,255
40
6,642
5,573
30,607
157
23,329
43
7,078
20,630
35
16,156
4,439
16,822
75
13,390
3,357
Educational qualification Male female
Table (5-6): Distribution of Jordanian youth by educational level and specialization
Source: Information from Al Manar Project Database/the National Center for Human ResourcesDevelopment
Total
_
_
_
_
_
_

JORDAN HUMAN DEVELOPMENT REPORT 2015 105
Figure (5-9): Distribution of Jordanian youth by educational level and specialization
Education Services
Health & social services Abriculture & veterinary
Humanities & arts Social sciences, business and law
Science, maths & computer scienceEngineering, manufacturing,
and construction
Diploma%24 Diploma
%43
Diploma%46
Diploma%7
Diploma%22
Diploma%23
Diploma%22
Diploma%20
BA/ BS%57
BA/ BS%91
BA/ BS%76
BA/ BS%80
BA/ BS%75
BA/ BS%54
BA/ BS%78
BA/ BS%78
Higherthan BA/BS
%1
Higherthan BA/BS
%2
Higherthan BA/BS
%1
Source: Information from Al Manar Project Database/the National Center for Human Resources Development

JORDAN HUMAN DEVELOPMENT REPORT 2015 106
Distribution of Youth by Educational Level and Geographical Location81 percent of youth live in urban areas and 19 percent in rural areas. 90 percent of youth in urban areas have a secondary education or below, compared to 91.3 percent in rural areas. The proportion of bachelor’s degree holders is 7.4 percent in urban areas and 6.3 percent in rural areas.
Figure (5-10): Distribution of Jordanian youth by educational level and urban/rural areas
1,000,000
900,000
800,000
700,000
600,000
500,000
400,000
300,000
200,000
100,000
More than Bachelor Bachelor
Urban Rural
Secondary and less Diploma
439 65 14,389
874,952
72,147
208,378
23,690 5,358
Source: Information from Al Manar Project Database/the National Center for Human Resources Development

JORDAN HUMAN DEVELOPMENT REPORT 2015 107
Figure (5- 11): Distribution of Jordanian youth in urban areas by educational level
Figure (5-12): Distribution of Jordanian youth in rural areas by educational level
1,000,000900,000800,000700,000600,000
400,000500,000
300,000200,000100,000
Urban
More thanBachelor
Bachelor Secondary andless
Diploma
Male
Female
Total
250,000
200,000
150,000
100,000
50,000
Rural
More thanBachelor
Bachelor Secondary and less Diploma
Male
Female
Total
Source: Information from Al Manar Project Database/the National Center for Human Resources Development

JORDAN HUMAN DEVELOPMENT REPORT 2015 108
Enabling Jordanian Youth to Participate in the Economic, Social, and Political LifeThe term “enabling youth” is related to a number of cultural initiatives that aim to strengthen the role of youth in various aspects of life. The most prominent of these is the ‘We Are All Jordan Youth Commission’, which was launched with the support of His Majesty King Abdullah II in 2006 in order to provide the institutional platform for youth to get familiar with the policies and programs that target their economic, social, and political development.
Since its establishment, the Youth Commission has worked to strengthen the capacities of youth from all governorates so that they are able to start initiatives, make recommendations for their communities, and view themselves as active partners; economically, socially, and politically. The Commission established one office in each of the 12 governorates to facilitate communication with youth, and administrative staff was appointed to follow-up on the programs and activities proposed by youth.
The King Abdullah II Fund for Development supports the Commission financially and administratively, and made the Commission its youth arm. Some of the most important mandates of the Commission include to communicate with youth, involve them in its activities, raise their institutional capacity, encourage them to do voluntary work and engage with state institutions and civil society organizations, strengthen their role in confronting the challenges that face local communities, and improve their ability to engage with media. The Commission also set up a fund to finance pilot projects in cooperation with the National Microfinance Bank and the initiative of the Knights of Change Award, which focuses on applied science projects, voluntary work, and smaller projects by youth.
The democratic empowerment initiative is one of several royal initiatives and programs to emphasize the role that youth can play in political life. Further, the Queen Rania Family and Child Center runs youth empowerment programs, notably the ‘Youth Leadership Program,’ which seeks to build and enhance leadership skills among youth through comprehensive practical training that combines theory and practice, and that focuses on the skills that young people need to plan and implement local community projects.
The King Abdullah II Fund for Development also established special offices at 23 universities in 2004 in order to help students gain experience and acquire necessary training to make them qualified for the labor market. The Fund also launched the International Travel Support Program in 2006 to support Jordanian university students to participate in youth activities around the world. This program covers the cost of travel (partially or entirely) and visa fees for outstanding students in extracurricular activities. The Fund also launched “Darb,” a local training program, in partnership with LOYAC Centre and with the support of the Ministry of Planning and International Cooperation. The program allows Jordanian students at Jordanian universities to join an enterprise in the private or public sector or a non-governmental organization as paid interns for a minimum period of eight weeks.
In the area of finance, the Development and Employment Fund financed 3,456 young males and females in 2013 to create their own enterprises. Besides, Tamweelcom launched the Fikrati Award for pilot projects in cooperation with Silatech organization in 2013. The award aims to raise awareness of the culture of entrepreneurship and company start-ups in society by providing opportunities for financing, training, and counseling, as well as connecting entrepreneurs to a network of investors and mentors to develop their projects in trade, industry, production, services, social work, and related to the environment. Qualified applicants will receive funding and participate in a forty-hour long training program to help them develop their business ideas into action plans.

JORDAN HUMAN DEVELOPMENT REPORT 2015 109
Table (5-7): Distribution of Jordanian youth by educational level, gender, and beneficiaries of loans from the development and employment Fund
Not specified
Under lower secondary
Lower secondary
Secondary
Vocational Training Institute
Intermediate Diploma
Bachelor’s and Master’s
PhD
Total
1
24
86
676
22
32
536
1
1,378
57
257
1159
2
61
542
2,078
1
81
343
1835
24
93
1078
1
3,456
Male Female Total
Source: Information from Al Manar Project Database/the National Center for Human ResourcesDevelopment
Table (2-5): Distribution of Basic Education Students by Authority, Gender in the Kingdom, 2012-2013
Educational qualification_
_

JORDAN HUMAN DEVELOPMENT REPORT 2015 110
Youth and PovertyThere are several definitions of poverty, but the State of Poverty in Jordan Report,48 prepared by the Department of Statistics, defines poverty as the inability of an individual to meet the minimal basic needs that ensure him or her a decent life (food, clothing, housing, health care, education, and transportation). According to the report, 19.2 percent of all poor were youth in 2008.
Population indicators
Total Jordanian population
Youth population in the 15 – 24 age group
Main educational indicators
Total distribution of students in all stages of education
Male students
Female students
Ratio of students to total population
Ratio of male students to total population
Ratio of female students to total population
Students in the academic secondary stream
Male students in the academic secondary stream
Female students in the academic secondary stream
Students in the vocational secondary stream
Male students in the vocational secondary stream
Female students in the vocational secondary stream
Distribution of students in community colleges
Male students
Female students
Distribution of students in universities
Male students
Female students
1,000 people
1,000 people
1,000
1,000
1,000
%
%
%
1,000
1,000
1,000
1,000
1,000
1,000
1,000
1,000
1,000
1,000
1,000
1,000
6,008
1,199
2,021
1019,2
1001,8
31.0
30.3
31.7
189.9
86.1
103.8
28.9
19.1
9.8
28.9
13.4
15.5
280.1
133.5
146.7
Indicator Measurement unit Value of indicator
Table (5-8): Summary of educational indicators for youth
Source: Information from Al Manar Project Database/the National Center for Human ResourcesDevelopment
2013

JORDAN HUMAN DEVELOPMENT REPORT 2015 111
The analysis showed that there are clear regional disparities among youth in all of the following dimensions: gender, education, economic activities, political and social participation, and poverty.
Conclusion
This chapter showed that there is a balanced gender distribution among youth in Jordan. Youth, aged 15-24, comprise almost one fifth of the country’s total population. Dimensions such as gender, education, economic activities, political and social participation, and poverty among youth were analyzed. The analysis looked at regional disparities in all of the dimensions above, with a particular focus on gender. This includes disparities between regions and governorates, between urban and rural areas, between economically active and inactive youth, and between different educational specializations.
Policy makers should pay special attention to youth, especially since Jordan is approaching its so called “demographic window of opportunity”. This requires a clear and comprehensive vision of human development and sufficient planning in order to utilize young people to their fullest extent. Participants in three workshops that
were held in preparation for this report urged policy makers to pay special attention to youth engagement and youth initiatives. Leaving youth without adequate programs to strengthen their engagement will put them at greater risk of becoming radicalized and further marginalized. The culture of shame (which results in a situation where many Jordanians are too ashamed to accept certain jobs for fear of what their families and communities will think) has to be addressed through orientation sessions that teach participants the value of work and the importance of being a productive citizen.
Poorest
Richest
19.2%
20.1%
23.6%
24.3%
24.3%
Degree of poverty Segments of poverty proportion of youthfrom the total segment
Table (5-9): Distribution of Jordanian youth by poverty segments
Source: Department of Statistics - The Hashemite Kingdom of Jordan 2010c
1 quintuple
2 quintuple
3 quintuple
4 quintuple
5 quintuple
st
nd
rd
th
th

JORDAN HUMAN DEVELOPMENT REPORT 2015 112

JORDAN HUMAN DEVELOPMENT REPORT 2015 113
Empowered lives. Resilient nations.
WOMENAND
DISPARITIES

JORDAN HUMAN DEVELOPMENT REPORT 2015 114
CHAPTER SIXWOMEN AND DISPARITIES
JORDAN HUMAN DEVELOPMENT REPORT 2015 115
Introduction Gender equality and women’s issues require special attention. Gender equality is a prerequisite for socio-economic development and an important factor of socio-political stability worldwide. The Arab spring drew attention to the need for more comprehensive solutions to the challenges that women face in Jordan. Jordan does not legally discriminate against one gender, but this chapter will demonstrate that gender discrimination still exists in reality.
Jordanian women are less involved in economic development than their counterparts in other countries, which limits Jordan’s ability to materialize its vision of advancing human capacities. This also hinders Jordan’s concerted efforts to empower women at all levels and stages in life, which, if realized, will increase the quality of life for women as well as for their families.
The labor force participation rate of Jordanian women is 14.7 percent, one of the lowest rates in the world. There are various reasons for this, such as women’s health status and broader social, political, and cultural barriers. For example, the fertility rate of Jordanian women (3.5) is considered high for a country like Jordan and hinders, or at least delays, women’s participation in the labor market.
Jordan has taken significant steps during the last years to improve women’s situation by implementing economic and social policies and legislations. In particular, women have had educational achievements, evident by higher enrollment rates of girls in school and the fact that female students achieve higher results and grades. There has also been progress in the health sector with the provision of free and comprehensive health care for mothers and children.
Women in the Labor Market Women’s participation continues to be a major development obstacle in Jordan. Jordanian legislation and regulations do not discriminate against women when it comes to access to wages, economic participation, capacity building, education, or the opportunity to access any type of job. Unofficial discrimination and the disregard for existing regulations cause current gender discrimination. However, even though gender discrimination exists, it is difficult to identify as there are not enough data and surveys available. Participants in one of the workshops for this report stated that there is gender discrimination against women in the work place. At the same time, various national strategies and documents have emphasized the importance of increasing female economic participation and ensuring that females have access to the same opportunities as males in the labor market. The National Employment Strategy 2013-2020 (NES), The National Agenda 2005-2015, and the Poverty Reduction Strategy 2013-2020 (PRS), among others, have adopted recommendations to increase female economic participation. All documents have underscored that female participation is essential to social and economic development.
There are various limitations that prevent the improvement of women’s participation in the labor market and in assuming high skilled jobs. These include: the mismatch between the demand and supply in the labor market; weak private sector encouragement of gender equality; lack of a decent job environment; social and cultural traditions; lack of transportation; and a low number of child nurseries.

JORDAN HUMAN DEVELOPMENT REPORT 2015 116
There are various factors that prevent women from participating in the labor market and/or assuming high skilled jobs. Those factors include the mismatch between the demand and supply in the labor market, lack of commitment to gender equality by the private sector, lack of jobs, social and cultural traditions, inaccessibility to transportation, and a low number of child nurseries.
Official numbers indicate that the average wage gap between men and women in Jordan is 41.3 percent in manufacturing, 27.9 percent in health and social work sectors, and 24.5 percent in the education sector. International data show that women, on average, earn approximately 22.9 percent less than men. Current Jordanian laws do not include clauses that penalize wage discrimination, which causes the continuation of this wage gap. Weak inspection systems further allow for more frequent circumventions of the law.
Women in the Labor Market: Formal and Informal DiscriminationAs mentioned earlier in this chapter, Jordan does not legally discriminate against one gender. Jordan suffers from weak enforcement of laws which limits women’s economic participation. According to data from the Department of Statistics (DOS), the average female labor force participation rate was 13.7 percent between 2005-2013. This is lower than the regional average (22 percent) and more than three times below the average rate of middle income countries (47 percent), Figure (6-1). The marginal changes with respect to women’s engagement in the labor market reflect the entrenched challenges, controversy, and complexity surrounding this issue. Despite regular references in strategic and analytical documents, and a multitude of activities, there is an evident and persisting gap between strategies, legislation, and policy on one side, and actual improvement in women’s employment situation on the other.
The average female labor participation rate between 2005 and 2013 was 13.7 percent. This is more than two times lower than the regional average (22 percent) and more than three times below the average rate of participation in the middle income countries (47 percent).
Figure (6-1): Average labor force participation rates in Jordan, the Southern Eastern and Mediterranean region (SEMED), and in middle income countries
Female, Jordan,13.2
Sources: National Statistical Offices and World Bank. Notes: SEMED regional average includes Algeria (data from 2013), Egypt (2011),Jordan (2013), Lebanon (2009), Libya (2012), Palestine (2013) and Tunisia (2012); Middle income countries: World bank data, modeled
Total Male Female
Female, SEMEDregional average,21.96442041
Female, MiddleIncome countries,47.21532727
Male, Jordan,60.4
Male, SEMEDregional average,73.51538175 Total, Middle
Income countries,62.76956876Total, SEMED
regional average,47.9199687
Total, Jordan,37.1
Male, MiddleIncome countries,78.515001158
Source: Information from European Training Foundation - Prime 2012

JORDAN HUMAN DEVELOPMENT REPORT 2015 117
The share of women of working age who are neither employed nor looking for a job in Jordan is remarkably high in comparison to international numbers.49 It seems that even if women are willing to work, they are confronted with difficulties in finding a job.
In 2013, close to a quarter (22 percent) of the women who were active in the labor market were unemployed. In some governorates, like Aqaba and Irbid, the rate was as high as 41 percent. See Table (6-1) for more information.
Women who are not economically active are more likely to be married and to have lower education levels. There are also considerable differences between governorates. In Tafileh and Karak, around 22 percent of females
are economically active, but in Zarqa, only 8 percent of women are economically active. In Jerash and Aqaba, approximately 12 percent of women are working or seeking employment. Table (6-2) . 50
Ajloun
Amman
Aqaba
Balqaa
Irbid
Jerash
Karak
Ma’an
Madaba
Mafraq
Tafileh
Zarqa
National
9%
10%
13%
9%
13%
9%
13%
9%
14%
9%
13%
9%
11%
19%
19%
41%
19%
41%
19%
20%
19%
20%
25%
19%
39%
22%
Governorate Unemployment Rate (%)
Table (6-1): Unemployment rate by governorate and gender (2013)
Source: Department of Statistics – The Hashemite Kingdom of Jordan 2013b
Male Females

JORDAN HUMAN DEVELOPMENT REPORT 2015 118
It is interesting to note that the governorates with the highest female activity rates (Tafileh: 22.5 percent; Karak: 22 percent; and Madaba: 18.8 percent) are also those with the highest male activity rates (Tafileh: 61.6 percent Karak: 63.5 percent; and Madaba: 64.9 percent). Of these governorates, Karak has an Industrial Qualified Zone which may have a positive impact on employment rates, but this can not explain the higher female activity rates in Talifeh and Madaba.
In fact, other governorates with similar zones, such as Irbid, Zarqa, Amman, and Aqaba, had very different data patterns. Aqaba and Zarqa are the next “best” governorates in terms of male economic activity (Aqaba: 64.5 percent, Zarqa: 61.7 percent; and Irbid: 61.2 percent) but they are also places where women are among the least active (Aqaba: 12.1 percent; Zarqa: 8 percent; and Irbid: 12.3 percent). Jerash has the second lowest activity rate in Jordan for both males and females. The female activity rate in the capital Amman is around the national average (13.4 percent).
Tafileh
Karak
Madaba
Balqaa
Ajloun
Amman
Ma’an
Mafraq
Irbid
Aqaba
Jerash
Zarqa
61,6
63,5
64,9
59,6
55,5
59,4
59,0
59,7
61,2
64,5
57,6
61,7
22,5
22,0
18,8
15,6
14,8
13,4
13,4
13,2
12,3
12,1
11,5
8,0
Governorate Economic Activity (%)
Table (6-2): Economic activity rates by governorate andgender (2013)
Source: Department of Statistics – The Hashemite Kingdom of Jordan 2013b
Male
42,5
42,3
42,0
38,2
34,90
36,7
36,9
36,9
36,9
39,1
35,1
35,4
Total Female
The governorates with the highest female activity rates (Tafileh: 22.5 percent; Karak: 22 percent; and Madaba: 18.8 percent) are also those with the highest male activity rates (Tafileh: 61.6 percent; Karak: 63.5 percent; and Madaba: 64.9 percent) and the highest average rates for both genders (Tafileh: 42.5 percent; Karak: 42.3 percent, and Madaba: 42 percent).

JORDAN HUMAN DEVELOPMENT REPORT 2015 119
There are laws and regulations in place to protect women in the labor market. The Jordanian maternity law provides 70 days maternity leave for women in the private sector and 90 days maternity leave for women in the public sector. This is lower than the International Labour Organization’s (ILO) recommended maternity leave of 98 days. However, Jordan has not ratified the ILO agreement.
The perception of women among private sector employers is another factor that limits female participation. Employers are more likely to invest in, and strengthen the capacities of, males rather than females. They often perceive it risky to hire women, since they might leave work because of marriage, pregnancy, and cultural attitudes. This type of informal discrimination is difficult to address.
Women in a Socio-Economic and Political Context a. Education and capacity building
Females and males have equal access to education in Jordan and gross enrollment rates are high. At the primary level, 99 percent of males and 97 percent of females are enrolled; at the secondary level, 87 percent of males and 89 percent of females are enrolled; and at the tertiary level, 43 percent of males and 50 percent of females are enrolled.
Total
Illiterate
Less than secondary
Secondary
Intermediate diploma
Bachelor and above
100
3.7
56.3
17.9
6.3
15.8
100
10.1
48.6
17.8
9.4
14.2
Population (15+) by education (%)
2013
Table (6-3): Educational level of the population in Jordan by gender (2013)
Source: Department of Statistics - The Hashemite Kingdom of Jordan 2013a
Male
100
6.8
52.5
17.9
7.8
15.0
Total Female

JORDAN HUMAN DEVELOPMENT REPORT 2015 120
Overall, the younger generation of females have better access to education than the generations that preceded them. The average share of women with only elementary education or below (including illiterate persons) is considerably higher
among older age groups: 57.3 percent among 55-64 year olds and 84 percent in the group of 65 year olds and older. This compares to 10.3 percent among 25-39 year olds and 5.5 percent among those who are between the age of 20 and 24. Figure (6- 2).
In terms of gender parity in educational attainment, Jordan is performing well too. In 2010, the gender parity index in primary education was 1, and for secondary education it was 1.06. In higher education, the male-female ratio was 108 and in the intermediate diploma stage it was 140.3. It is crucial to analyze relative access to education, but it is equally important to compare the types of education that men
and women pursue. While women are almost equally represented in education overall, more women enroll in general education than in TVET. In 2011-2012, vocational training represented only 8.7 percent of all female enrollment in secondary school. The vast majority of women preferred academic secondary education, presumably in order to continue university studies upon graduation. Table (6-4).
Figure (6-2): Females with elementary Elementary Education or less by age group
Number of students
Share of total
101753
91.2%
9724
8.7%
Academic secondary education
Vocational secondary education
Table (6-4): Number of female students in academic and in vocationalsecondary education (2011-2012)
Source: Department of Statistics - The Hashemite Kingdom of Jordan 2012c
7.2%
15-19 20-24 25-39 40-54 55-64 65+
5.5%10.3%
25.4%
57.3%
84.0%
Source: Department of Statistics - The Hashemite Kingdom of Jordan 2013a
Share of females with elementary education or less/illiterate (2013)

JORDAN HUMAN DEVELOPMENT REPORT 2015 121
In 2011-2012, women accounted for only 31 percent of total enrollment in secondary vocational schools and they were concentrated mainly in a small number of vocational programs provided in more “female-friendly” surroundings and limited to traditional female professions like hairdressing or nursing. The reasons behind the low female enrollment rate in TVET, despite the promising employment opportunities it offers, are numerous and well known. Addressing them might help to slowly start influencing perceptions and choices of prospective female students and their families. While there are cultural barriers to women’s participation, accessibility
and friendly environments are recognized as important factors to promote female participation. For those few female students who do enroll in TVET, their choice of courses becomes another limitation. In general, females enroll in programs that are deemed “appropriate” for them and that align with their interests. They often choose clerical and office-related courses and trade and craft-related vocations, such as hairdressing, personal care and beauty treatment, leather clothing, and tailoring. Males tend to make traditional choices as well: machinery and vehicle operation, metal formations and mechanics, and electronics and equipment technology, etc. Table (6-5).
b. Health
The Government has paid special attention to women’s and children’s health and developed several national projects and programs. These efforts, and many others, have led to an improvement in all of the following indicators during 2007-2013: decrease in mortality rates (19 of every 100,000 live births); increase in the expected life span for both genders (76.7 years for women); increase in the number of female doctors (from 15.5 percent to 18 percent); increase in the number of female dentists (from 32.7 percent to 36.7 percent); increase in the number of female nurses (from 53.6 percent to 74.6 percent); and an increase in the percentage of pharmacists (from 54.4 percent to 59.6 percent).
The improvement in maternal health is a result of comprehensive insurance policies, obligatory health programs, and nation-wide health awareness campaigns targeting mothers (the breast cancer awareness campaign is an example).
However, there is still an urgent need to address health related problems that women face. The most important ones are: the increase in incidences of complications caused by pregnancy; fetal deaths; higher breast cancer rates; fluctuating fertility rates; and the high number of women with closely spaced pregnancies.
Communication /IT
Trades, Crafts and Related Vocations
Electronics and Equipment Technology
Catering and Hospitality
Clerical/Office Functions
Metal Formations and Mechanics
Agriculture and Horticulture
Machinery and Vehicle Operation
55
28
62
61
30
97
80
94
45
72
38
39
70
3
20
6
Male % female %
Table (6-5): TVET training courses by gender among youth aged 16-26
Source: United Nations Development Programme (UNDP) 2014c
TVET Course Interest

JORDAN HUMAN DEVELOPMENT REPORT 2015 122
c. Violence
As a result of increased general social awareness of violence against women, more women report cases of violence and are being supported by governmental and nongovernmental organizations. Further, several organizations and special centers have been established to deal with violence against women, including the government entity “Family Protection Department”, who receive calls from women who are victims of violence. Some work in coordination with other organizations, like the “Fighting Violence against Women Network – Sham’a” under the umbrella of the Jordanian National Commission for Women Affairs. In addition, there is legislation in place to prevent and protect women from violence and transgression, especially human trafficking and domestic violence.
There is still an urgent need to increase efforts, gather transparent statistics, improve women’s access to justice, improve coordination with community-based organizations that provide services to women who are victims of violence, improve the social and psychological care provided to children suffering from violence, and implement strategies, policies and national legislations. The Juvenile Act needs to be implemented in order to warrant proper protection, care, and just trials for juveniles. Further, the Protection Act against domestic violence should be adopted, as well as the “Children Rights Act”. In addition to legislation, programs need to focus on changing attitudes and norms and strive to become less dependent on external funding and grants.
Unfortunately, there is a scarcity of data on violence against women. A study from 2012, named “Violence against Women in Jordan,” found that the prevalence of violence against women is the same regardless of the husband’s educational level or profession. The study found that 45 percent of women have experienced, and 55 percent have witnessed, violence during their childhood. 28 percent of abused women believe that a husband has the right to control his wife’s behavior and 93 percent believe that a wife is obliged to obey her husband. After each incidence of abuse, women reported feeling insecure, ashamed, frightened, confined, and stigmatized. 70 percent of abused women believe that husbands have the right to beat their wives if they insult their husbands, leave the house without asking for permission, and neglect their children. Figure (6-3) shows the distribution of women who have been abused by their husbands by governorate.
There is still an urgent need to coordinate efforts, gather transparent statistics, and support women’s access to justice. Further, there needs to be strengthened coordination with community-based organizations that provide programs and services to women who are victims of violence in order to ensure that social and psychological care and shelter are provided to children suffering from violence.

JORDAN HUMAN DEVELOPMENT REPORT 2015 123
Figure (6-3): Domestic Violence by Governorate
Sourse: Information from "Violence Against Women in Jordan 2012
Tafiela22%
Aqaba21%
Irbid26%
Zarqa28%
Ma'an20%
Ajlun18%
Balqa23%
Amman23%
Jarash29%
Mafraq21%
Karak14%
Madaba18% Percentages of Women
who are Married ages 15-49
and were exposed to one
form of violence from
their spouses.
JORDAN HUMAN DEVELOPMENT REPORT 2015 124
d. Political Empowerment
The current turmoil in the Arab region has brought attention to the importance of increasing women’s participation in politics. Even though women in Jordan enjoy economic, social, and political rights, and Jordan has drafted laws to strengthen women’s political participation, they are still underrepresented in decision making processes. Women are slowly reaching influential political positions, which has been made possible by the political will and support of His Majesty King Abdullah II. His Majesty King Abdullah II has promoted women’s participation in the political system by creating a quota system for parliamentary seats and appointments to senior administrative positions. In 2013, 606 candidates ran for elections; 105 were women. In the 2013 parliamentary elections, 15 women got elected through the quota system; only two women got parliamentary seats outside of the quota system. Women make up 12 percent of the Parliament.
The amendment of the Municipalities Law has increased women’s employment rates from 20 to 25 percent; increased women’s participation rate in the Judicial Authority to 12.4 percent; and their occupation of high level positions to 8 percent. Two of Jordan’s political parties are led by women, and the Political Parties Law demands that political organizations applying for a political party license need to demonstrate that at least 10 percent of their members are women. Women have held numerous cabinet positions throughout Jordan’s history; Jordan has even had a female Deputy Prime Minister. However, only one woman has held this position and the number of females in high level positions continues to be low. Women’s participation rate is only 1.3 percent in the chamber of commerce, 8.5 percent in the chamber of industry, 4.9 percent in syndicates’ councils, and 29.1 percent in political parties. Further, women are underrepresented in the cabinet and committees that determine Jordanian policies in various sectors.
Women and Regional DisparitiesThe DoS, in cooperation with the Higher Population Council, recently published the Regional Gender Equality Index (RGEI). The index assessed regional gender disparity and is based on 17 indicators on the governorate level: (1) Female literacy rates; (2) Female literacy rates compared to male literacy rates; (3) Percentage of women with a university degree; (4) Percentage of women with a university degree compared to the male percentage; (5) Percentage of females in administrative boards of charity organizations; (6) Percentage of females in administrative boards in charity organizations compared to males in the same positions; (7) Percentage of female members in municipal councils; (8) Percentage of female members in municipal councils compared to males in the same positions; (9) Percentage of economically active females; (10) Percentage of economically active females compared to economically active males; (11) Female unemployment rates; (12) Female unemployment rates compared to male unemployment rates; (13) Percentage of women who are self-employed or own a business out of the total number of employed women; (14) Percentage of women who are self-employed or own a business out of the total number of employed women compared to the same rate for males; (15) The female to male ratio in the age group of 20-39; (16) Average annual income for female-headed households; and (17) Average annual income for female-headed households compared to the average annual income for male-headed households.
The value of the index ranged between 1.72 and 3.06. The highest values were found in all regions, and the lowest index values were distributed in the north and middle regions. Findings indicated that:
• Madaba had the highest score on the index (3.06); Ajloun and Aqaba were second with a value of 2.83; and Mafraq and Tafileh ranked number three with a score of 2.67.
JORDAN HUMAN DEVELOPMENT REPORT 2015 125
• Irbid ranked seventh on the index with a score of 2.22, Balqaa ranked second to last with a value of 2.0, and Zarqa ranked last with a score of 1.72.
• Policies aimed at increasing education and awareness had a positive impact on reducing illiteracy rates in Amman, Zarqa, and Ajloun and increasing the number of women with university degrees in Tafileh, Amman, Karak, and Madaba, which was reflected in the index for these governorates.
• The indicator for female participation in administrative boards of charity organizations played a big role in determining the index value for Ajloun, Mafraq, and Ma’an. The indicator for female participation in municipal councils was a determining factor in the index for Jerash, Aqaba, Mafraq, Ajloun, and Madaba.
• Tafileh, Karak, and Madaba scored high because of the indicator on economic participation.
• Aqaba’s low index score was a result of the indicator on the female to male ratio of individuals aged 20-39.
• The substantial increase of the average yearly income for female-headed households in Amman improved the governorate’s index. In Amman, the average income was 8,634.2 JD; Aqaba had the second highest average income of 7,001.2 JD.
• Zarqa scored the lowest on the index due to low values on several indicators: females with university degrees; female economic participation rates; percentage of women who were self-employed or owned a business; as well as low political and social participation. 51

JORDAN HUMAN DEVELOPMENT REPORT 2015 126
Figure (6-4): Regional Gender Equality Index – Women’s Empowerment Map, 2013
Sourse: Information from "Violence Against Women in Jordan 2012
Tafiela2.67
Aqaba2.83
Irbid2.22
Zarqa1.72
Ma'an2.5
Ajlun2.83
Balqa2
Amman2.61
Jarash2.56
Mafraq2.67
Karak2.61
Madaba3.06
Regional Gender Equality Index
Women empowermentmap 2013

JORDAN HUMAN DEVELOPMENT REPORT 2015 127
Female illiteracy rates
Female illiteracy rates vs. m
ale illiteracy rates6.8
2.52
17.2
0.78
29.2
0.02
29.9
0.43
13.4
0.22
19
2.2
3.6
0.2
92.7
8634.2
0.8
13.5
2.76
13
0.94
23.3
0.15
30
0.43
15.6
0.26
19
1.6
1.8
0.1
88.1
5746.2
0.8
9.3
3.180.8
32.8
0.14
29.9
0.438
0.13
39
1.8
1.4
0.1
91.3
5793.4
0.8
12.8
2.37
16.1
1.13
24
0.23
31
0.45
18.8
0.29
20
1.6
3.4
0.2
93.4
6299.3
0.9
10.6
3.31
12.5
0.97
35.4
0.12
12.4
0.14
12.3
0.2
41
2.6
6.2
0.4
93.6
6525.5
0.8
18.4
2.39
12.6
1.26
50.4
0.22
31.5
0.46
13.2
0.22
2023.9
0.3
91
5855.9
0.8
11.7
2.66
14.4
1.13
39
0.48
31.7
0.46
11.6
0.2
19
2.1
2.2
0.1
90.9
5866.3
0.7
10
2.94
14.5
1.21
53.1
0.27
31.1
0.45
14.8
0.27
19
2.8
1.5
0.1
95
6666
0.9
14.5
2.79
16.9
1.34
28.3
0.15
30.3
0.43
21.9
0.35
2023.3
0.2
99.1
5562.1
0.6
13.7
2.8
17.6
1.5
34.4
0.38
30.4
0.44
22.5
0.36
19
2.2
2.1
0.3
97
2770.5
0.3
24.7
2.66
10.4
1.32
50
1.14
30.3
0.43
13.4
0.23
19
1.4
1.3
0.1
86.9
6106.9
0.8
13.5
2.25
9.6
0.98
45.2
1.08
31.6
0.46
12.1
0.19
41
1.5
8.5
0.8
69.2
7001.2
0.9
IndicatorG
overnorate
Table (6-6): Indicators Used in the G
ender Regional Equality Index by gender andgovernorate, 2013
Source : Information from
Regional Gender Equality Index 2013
Am
man
BalqaZarqa
Madaba
IrbidM
afraqJerash
Ajloun
KarakTafileh
Ma’an
Aqaba
Percentage of females w
ith university degrees vs. males
with university degrees
Percentage of females w
ith university degrees
Percentage of females in adm
inistrative councils in charity organizations
Percentage of females in adm
inistrative councils in charity organizations vs. m
ales in administrative
councils in charity organizations.
Percentage of females in m
unicipal councils Percentage of fem
ales in municipal councils vs.
males in m
unicipal councilsPercentage of econom
ically active females
Percentage of economically active fem
ales vs. economically
active males
Female unem
ployment rate
Female unem
ployment rate vs. m
ale unemploym
ent rate
Percentage of females w
ho own their ow
n businesses
Percentage of females w
ho own their ow
n businessesvs. m
ales who ow
n their own businesses
Females to m
ales ratio (ages 20-39)
Average yearly income of fem
ale headed households
Average yearly income of fem
ale headed householdsvs. average yearly incom
e of male headed households

JORDAN HUMAN DEVELOPMENT REPORT 2015 128
Conclusion
This chapter confirms that women’s low participation continues to be a major development obstacle in Jordan. Female employment continues to be the main hurdle to women’s empowerment. There are considerable differences between governorates. In Tafileh and Karak, approximately 22 percent of females are economically active. In Zarqa, however, only 8 percent of women are working or seeking employment. In Jerash and Aqaba, the percentage is 12 percent. In regards to education, Jordanians are well educated and have equal access to education services. In addition, indicators on women’s health, in particular the MDGs, have reflected large nation-wide improvements in the past decade. Women are also relatively well represented in the informal sector. According to the participants in three of the workshop that were held during the research phase of this report, there are not enough studies that look at the engagement of women in the economic and political life. Gender and development issues are not being given enough consideration at the national level. The gender gap in the capital Amman is bigger than in other governorates as women are required to work in poorer governorates in order to support family members.

JORDAN HUMAN DEVELOPMENT REPORT 2015 129
Empowered lives. Resilient nations.
JUSTICESYSTEM

JORDAN HUMAN DEVELOPMENT REPORT 2015 130
CHAPTER SEVENTHE JUSTICE SYSTEM AND STATECAPACITY

JORDAN HUMAN DEVELOPMENT REPORT 2015 131
IntroductionThe Jordanian Constitution recognizes the judiciary as one of the three separate and independent branches of government. Jordan’s current legal system is based on the Constitution, the Court Establishment Law of 2001, the civil and criminal code, and Islamic and religious laws in family cases. Its legal system has been influenced by many sources. It developed from codes of law instituted by the Ottoman Empire (based on French law), which were supplemented by British laws during the British mandate. Islamic law has also been influential and has, in many ways, modified the earlier European models.
The judiciary is responsible for the interpretation and application of Jordan’s laws. As a branch of the government, its main objective is to serve the people by ensuring equal justice under the law. An effective judiciary system recognizes the value and importance of integrity and equality, and of maintaining the rights and liberties of citizens as stated in Jordan’s Constitution and as guaranteed by the country’s laws.
The Judicial System: Independence and TransparencyJudicial independence is closely linked to issues of justice, equality, freedom, and rule of law. Judicial independence does not mean complete separation from the other branches but rather having a balance between the three.
The independence of the judiciary is important for ensuring justice and protecting human rights. The lack of an independent judicial system jeopardizes the rights and freedoms of citizens and renders them vulnerable to violations by the executive or legislative authorities or by those in other powerful positions. Meanwhile, an independent and impartial judiciary curbs arbitrariness, ensures non-interference, and upholds the rights of citizens. The mandate of the judiciary cannot be realized without impartial, honest, trustworthy, and
competent judges who are able to issue verdicts in accordance with the law. They must do so with complete impartiality and under no influence, whether material or moral, from any individual or institution regardless of the end sought by this influence, be it political, social, partisan, occupational, economic or otherwise. An independent judge guarantees the establishment of justice and equality in society, and frees the judiciary from suspicion. Numerous international instruments on human rights guarantee the right to access to independent tribunals, in particular Article 8 of the United Nations Universal Declaration of Human Rights of 1948, which states: “Everyone has the right to an effective remedy from the relevant national tribunals for acts violating the fundamental rights granted him by the Constitution or by law”. Article 10 of the same Declaration stipulates: “Everyone is entitled, in full equality, to a fair and public hearing by an independent and impartial tribunal, in the determination of his rights and obligations and of any criminal charge against him”, while Article 11 stresses the importance of holding public trials that provide the necessary safeguards for defending suspects charged with penal offences.
According to the Jordanian Judicial Independence Law No. 29 of 2014, the judiciary is independent, specialized, and neutral and stands on equal footing with the executive and legislative branches. In addition, the Judicial Independence Law stipulated the establishment of the Judicial Council and outlined its duties, meetings, meetings quorum, and voting procedures. It also outlined the Judicial Council’s powers with respect to overseeing the affairs of judges.
The recent constitutional amendments of 2011 sought to strengthen the independence of the Judicial Council to protect human rights and freedoms. One of the amendments was to add the word “independence” to Article 27 of the Constitution which reads as follows: “The Judicial Power shall be exercised by the courts of law in their varying types and degrees. All judgments shall be given in accordance with the law and pronounced in the name of the king.” Further, Article 98 of the Constitution was amended to establish, by law, for the

JORDAN HUMAN DEVELOPMENT REPORT 2015 132
first time, a Judicial Council to handle affairs related to civil courts. The Judicial Council alone will have the right to appoint civil judges. The new statutory Judicial Council will assume the management of all matters relating to the appointment, promotion, transfer, and retirement of judges without any interference from the Executive.
Independence of Judges
The Jordanian Constitution stresses the independence of judges; they are subject to no authority other than that of the law. The Government has no authority to interfere in the judiciary. Any infringement on this would affect the dignity of the judiciary and disrupt the balance between the three branches and, ultimately, undermine the basis of ruling. It is the duty of judges to comply with international conventions that prohibit interference and to be independent from any influence of the executive and the legislative branches.
Settling Disputes in JordanJordan has an advanced legal system that has been revised and modernized in recent years. Many old laws have been either amended or replaced to allow the country to adopt best practices from other developed countries in order to provide the best legal system.
In Jordan, there are different ways to settle a dispute. The main mean of dispute settlement is to refer the dispute to the Jordanian courts. However, it is still possible to settle disputes by referring them to Alternative Dispute Resolution (ADR) mechanisms; the major ADRs in Jordan are arbitration and mediation.
Arbitration
Arbitration has been the traditional mean of settling disputes since the creation of modern Jordan. The first formal statute to regulate arbitration was the Arbitration Law of 1953 (and its amendments) which was annulled by the current Arbitration Law of 2001. The Law of 2001 is mainly based on the United Nations Commission on International Trade Law (UNCITRAL) and the Model Law of 1985 on International Commercial Arbitration.
• Ad hoc and Institutional Arbitration
The parties to a dispute can either agree in advance to use arbitration to settle the dispute or they can choose to enter into an ad hoc agreement to arbitrate. In ad hoc agreements in Jordan, the parties to a contract might negotiate a whole set of custom-made arbitration rules, establishing procedures that will fit their needs and address all eventualities. Or, the parties might suffice with a simple arbitration clause to be included in their contract with a simple reference to statutory procedures such as the Jordanian Arbitration Law. They can also adopt rules designed specifically for ad hoc arbitral proceedings, such as the UNCITRAL rules.
• International Arbitration
Jordan has acceded to several important bilateral and multilateral conventions and treaties concerning arbitration and enforcement. Among these are: the Riyadh Arab Treaty on Judicial Collaboration; the Amman Arab Treaty on Commercial Arbitration; the Settlement of Investment Disputes in the Arab Countries Treaty; and the Arab Treaty on Commercial Arbitration, which stipulates that an Arab Center for Commercial Arbitration shall be established, although this has yet to materialize.
Jordan is also party to numerous bilateral agreements and treaties concerning ADR mechanisms, especially regarding arbitration.
Jordan has an advanced legal system that has been revised and modernized in recent years. Many old laws have been either amended or replaced in order to provide the best legal protection for citizens.

JORDAN HUMAN DEVELOPMENT REPORT 2015 133
Mediation
Mediation may range from minimal intervention, merely facilitating information flows between the parties, to a more comprehensive role of offering external advice and information, evaluating options, proposing solutions, and promoting certain outcomes. In Jordan, the first use of mediation on a relatively wide scale occurred with the establishment of mediation procedures by the Law of Mediation for the Settlement of Civil Disputes of 2003, recently replaced by the Law of 2006. According to the Mediation Law of 2006, the Administration of Mediation in the court consists of several Magistrate Court and First Instance Court judges who are nominated by the Chairman of the First Instance Court. In addition to the Mediation Judges, the Head of the Judicial Council may nominate Private Mediators such as retired judges, lawyers, and other professionals with long experience, known for their impartiality and integrity.
The legislative framework in Jordan encourages disputants to resort to mediation as an ADR method; such encouragement can be observed in the new Law of Mediation which stipulates the following:
• The Administrator of the Lawsuits Judge, after meeting with the parties or their lawyers, have the authority to pass on any filed case to the Mediation Judge or to a Private Mediator upon the request or approval of the disputants. In all circumstances, and to the extent possible, the judge shall consider the agreement of both parties on the nomination of the Mediator.
• The parties in a dispute, pursuant to the acceptance of the Administrator of the Lawsuits Judge or the Magistrate Judge, have the right to resolve their dispute by mediation by referring their dispute to any person they deem appropriate. In this case, the Mediator shall determine his or her fees in coordination with the disputants. In case the dispute is settled amicably, the plaintiff shall retrieve the previously paid legal fees.
If the Mediator was successful in reaching a complete or partial settlement, he or she should present a report to the Administrator of the Lawsuits Judge or the Magistrate Judge enclosing the settlement signed by the disputants. The Judge will have to endorse the settlement, which then is considered a final judgment. At the end of the mediation process, regardless of whether the mediation resulted in resolving the dispute or not, the Mediator shall return to each party any documents he or she received from that party. Furthermore, the proceedings of the Mediation shall be deemed confidential. No information used in the course of Mediation shall be used by the disputants before any court or before any other authority.
Alternative Dispute Resolution (ADR) Mechanisms
In case of labor disputes, the Minister of Labor may appoint one or more Ministry officials, according to the Jordanian Labor Law. These officials will serve as conciliation officers and carry out mediation for the settlement of collective labor disputes for the sector that the Minister specifies and for the duration that he or she deems appropriate.
If, for any reason, the conciliation officer and, later on, the Minister, are not able to achieve a settlement between the parties, the Minister shall refer the dispute to a Conciliation Board that he or she shall set up. The Conciliation Board will consist of a chairman who shall be appointed by the Minister – and who shall have no connection to the dispute or with any trade unions or employers associations – and two or more members representing employers and workers (equal number of representatives on each side), each party appointing its own representatives on the board. If the Conciliation Board fails to settle the dispute, the Minister shall refer the dispute to a labor tribunal that shall consist of three judges commissioned by the Judicial Council for that purpose, upon the request of the Minister. This tribunal’s decisions are binding and final to the parties of the dispute and cannot be challenged before any judicial or administrative authority.

JORDAN HUMAN DEVELOPMENT REPORT 2015 134
Description of the Judicial Authority’s Institutional FrameworkThe Judicial Authority is considered one of the three State powers and its functions are considered complementary to national efforts carried out by the legislative and executive powers. The Judicial Authority carries out its duties through an institutional structure that is comprised of:
1- Regular Courts
2- Judicial Council
3- Judicial Inspection Body
4- Public Prosecution
5- State Lawyer Department
6- Technical Office at the Court of Cassation
7- Judicial Institute of Jordan
8- Judicial Council Administrative Units
Regular Courts
Regular courts in Jordan exercise the right to try all persons in all civil and criminal matters, with the exception of matters falling under the jurisdiction of religious courts (tribunals) or special courts, according to the provisions of other laws.
Regular courts include first level courts (Conciliation and First Instance), second level courts, which are the Amman, Irbid, and Maan Appeals Courts, and the Court of Cassation, which is the top echelon of the judiciary. Following the 2011 Constitutional amendments, administrative justice is carried out by the Administrative Court and decisions can be appealed by the High Administrative Court. There are other courts as well, including the Major Felonies Court, the Tax First Instance and Appeals Courts, the Customs First Instance and Appeals Courts, and the Lands and Water Settlement Court.
Judicial Council
The Judicial Council manages all affairs related to regular judges. It has general oversight over regular judges in terms of appointment, transfer, secondment, promotion, retirement, acceptance of resignation, termination of judicial appointment, and the imposition of disciplinary measures. The organizational structure of the Judicial Council is comprised of:
-Judges Affairs Unit
The Judges Affairs Unit handles the following tasks:
• Implementing decisions related to judges’ appointment, promotion, transfer, secondment, granting of vacation time, disciplinary decisions, termination or ending of their services, and following up on related personnel issues and administrative procedures;
• Providing administrative support services to judges.
- Training and Specialization Unit
The Training and Specialization Unit handles the following tasks:
• Identifying training needs of judges, organizing and following-up on courses for judges, and organizing measures pertinent to their research in accordance with current legislation;
• Organizing training programs, courses, and activities, and ensuring the availability of training venues and other relevant requirements for implementing the programs, including training materials and publications;
• Following-up on matters related to scientific scholarships for judges;
• Preparing information and conducting necessary studies related to the specialization of judges in civil and criminal chambers in accordance with current legislation.

JORDAN HUMAN DEVELOPMENT REPORT 2015 135
- Planning and Development Unit
The Planning and Development Unit handles the following tasks:
• Preparing the Annual Plan of the Council and its units and supervising its implementation after the Council’s endorsement;
• Contributing to the development of work plans and programs that are necessary for the operations of courts and public prosecutions;
• Preparing the Annual Courts Report;
• Managing the Council’s website.
- Office of the Chief Justice
- Judicial Council’s Secretariat
The Chief Justice shall choose a secretary, from the Council staff, who is responsible for:
• Preparing the agenda for the Council’s sessions;
• Inviting Council members to, and informing them of, session dates;
• Preparing Council decisions, and have them signed by the Chief Justice and attending members, before recording them in a special registry after which they are filed and archived;
• Documenting all records related to the Council and its work;
• Any duties assigned to him/her by the Chief Justice.
The Council, upon the recommendation of the Chief Justice, may second any judge to carry out the director’s duties of any of the units, either as full time work or in addition to his/her assigned duties.
Judicial Inspection Body
The Judicial Inspection body is under the Ministry of Justice, where the Judicial Inspection Directorate was established. The Judicial Inspection is comprised of the Chief Inspector along with other inspectors. The Chief Inspector is appointed pursuant to the decision of the Judicial Council and a Royal decree. The Chief Inspector is appointed from among higher-level judges. He/she is
the direct administrative supervisor of the Directorate’s inspectors and staff. Inspectors are appointed by a decision of the Judicial Council and are selected from judges whose ranks are no less than second level, for a period of three years, subject to renewal. The services of an inspector cannot be terminated, nor can he/she be subjected to retirement, transfer, or secondment unless it is upon his/her own request, based upon the recommendation of the Chief Inspector. The Chief Inspector submits Directorate reports, and that of the inspectors, relating to Judicial Inspection reports over judges, judicial assistants, and the affairs of courts and the public prosecution, to both the Chief Justice and the Minister of Justice.
The Judicial Inspection Directorate handles the following tasks:
1- Inspecting the work of judges, members of the prosecution body, State Lawyer assistants, and Execution Judges, with the exception of higher-level judges;
2-Evaluating judges’ work in terms of the proper application of the law, the fulfillment of litigation, evidentiary procedures, reasons for postponement, case duration until judgment issuance, the proper reasoning and justification of judgments reached, and determining the annual clearance rate of each judge;
3- Inspecting the work of Public Prosecution Departments, Execution Departments, the State Lawyer Department, Notary Public Departments, and courts staff;
4- Reviewing and investigating complaints filed against judges.
Public Prosecution
The public prosecution body is comprised of the Prosecutor General, Attorney Generals, and Public Prosecutors. A judge holding the title of Prosecutor General is appointed at the Court of Cassation and he/she performs the functions of the Prosecutor General before the Court of Cassation. In addition, at each Court of Appeal, a judge holding the title of Attorney General is appointed to exercise all the powers granted to him/her in the Criminal Procedures Code and other laws. Both the Chief Attorney General

JORDAN HUMAN DEVELOPMENT REPORT 2015 136
and the Prosecutor General have assistants with all powers conferred upon them. Furthermore, in each First Instance Court, at least one judge holds the title of Public Prosecutor and it is possible to appoint a Public Prosecutor to any Conciliation Court.
Representatives of the public prosecution body handle the filing of criminal cases and follow-up on them as outlined in the Criminal Procedures Code and other laws.
All members and staff of the public prosecution apparatus within the Appeals and First Instance levels fall under the Attorney General and are tasked to implement his/her orders and the orders of the Minister of Justice in their administrative affairs, the filing of cases, and all follow-up matters. Additionally, all of them are accountable to the Prosecutor General and are linked to the Minister of Justice within the hierarchy of said levels. All judicial staff are subject to the supervision of the Prosecutor General and his/her designees with respect to their judicial functions.
Jordanian public prosecutors recognize the advantages of specialization. Some specializations already exist in the form of high felony prosecutors and other specialized courts, but the public prosecution service is possibly too small to support much more specialization – at least formally. Some topical specialization will occur naturally as offices face new types of crimes. The Chief Public Prosecutor should be empowered to designate topic matter experts between jurisdictions when need arises.
One area of specialization that the Judicial Council should consider is criminal justice. When criminal justice practitioners accumulate experience and knowledge from the field, it will help them become effective public prosecutor leaders within the police and lead to better investigations. It is wasteful to train a public prosecutor, let him/her gain valuable experience, and then render it irrelevant by re-assigning him/her to civil work. A specialized criminal career track will more effectively utilize those scarce resources.
State Lawyer Department
The Judicial Council, upon the nomination of the Minister of Justice, appoints one senior level judge as the State Lawyer. In addition, the Judicial Council assigns a number of judges as his/her assistants.
The State Lawyers and his/her assistants, who are either hired or appointed according to the provisions of the law, represent the state in all civil cases related to the treasury, cases filed by the state, or cases filed against it.
The State Lawyer and his/her assistants are administratively linked to the Minister of Justice; the State Lawyer is the direct supervisor of his/her assistants and clerks that are assigned to the department.
The State Lawyer may assign any of his/her assistants to represent the government before courts either on a full time or part time basis. If needed, he/she may, upon the approval of the Minister of Justice, assign on his/her behalf any of the Public Prosecutor or Attorney General assistants to appear before the courts.
The State Lawyer provides a monthly report to both the Minister of Justice and the Minister of Finance on the progress of cases in which he/she represents as well as the judgments he/she is executing. In addition, the State Lawyer provides an Annual Report at the end of December of each year to the Minister of Justice, who, in turn, submits it to the Chief Justice.
Technical Office at the Court of Cassation
A Technical Office is established at the Court of Cassation to provide legal, technical, and administrative support to the Court of Cassation. The Technical Office is managed by a senior-level judge who is seconded by the Judicial Council, either in addition to his/her judicial work or on a full-time basis. The appointment of the Technical Office director shall be based on the nomination of the Chief Justice and for a renewable period of four years. The director is assisted by a number

JORDAN HUMAN DEVELOPMENT REPORT 2015 137
of judges seconded by the Judicial Council, upon the nomination of the director, for a renewable period of two years. The most senior judge of the aforementioned judges is the deputy director and carries out the director’s duties during his/her absence.
The administrative staff of the Technical Office shall be Ministry of Justice employees assigned by the Minister of Justice for this purpose. The Technical Office performs the following functions:
1- Providing the legal, technical, and administrative support to the Court of Cassation. This includes the classification of cases and motions filed before it and their distribution among judicial chambers according to specialization. Its functions also include providing judicial chambers with necessary legislation, past judgments and precedents related to each case according to its type and subject matter, as well as any legal studies and research they may need;
2- Drawing legal principles based on decisions and judgments issued by the Court of Cassation, classifying them, and undertaking necessary measures to facilitate their publication;
3- Analyzing judicial precedents and providing the necessary studies and opinions to the President of the Court of Cassation, which contribute to the establishment of legal principles;
4- Providing courts with legislation and legal precedents that the Director deems necessary for dissemination;
5- Any other functions or tasks assigned by the Judicial Council or the President of the Cassation Court.
Judicial Institute of Jordan
A board of directors that is chaired by the Minister of Justice and includes each of the following members supervises the Judicial Institute of Jordan:
1- Chief Judge of the Court of Higher Justice/Deputy Chairperson;
2- Chief Attorney General;
3- Secretary General of the Ministry of Justice;
4- Director of the Judicial Institute of Jordan;
5- Two judges of no less than “special” rank, appointed by the Judicial Council upon the nomination of the Minister of Justice for a period of two years, subject to renewal. During this period, it is possible to replace both or one of the judges by appointing a replacement through the same process as when completing the membership term.
6- President of the Jordan Bar Association;
7-Two faculty members from public Jordanian Universities, each holding a rank no less than Associate Professor in Law, appointed by the Minister of Justice, in coordination with the President of the University in question, for a renewable period of two years. The Minister may, during that period, similarly appoint a replacement for the remainder of his/her board membership term.
A judge, seconded by the Judicial Council upon the nomination of the Minister of Justice, manages the Institute. This judge should have no less than 20 years of judicial service experience, or of judicial service and the practice of law collectively; the term of his/her service is for two years and is subject to renewal. The director’s tenure ends upon the expiry of his/her secondment, or by the secondment of a replacement. A deputy director exercises the director’s powers during his/her absence.
The Judicial Institute of Jordan aims at achieving the following:
1- Preparing qualified candidates to take on judicial functions;
2- Strengthening the competence of judges and court staff, and building their scientific research skills through training courses organized by the Institute;
3- Exchanging expertise and best practices, and cooperating with similar institutes in the Arab region and in other foreign countries;

JORDAN HUMAN DEVELOPMENT REPORT 2015 138
4- Encouraging cooperation with Arab and foreign entities in judicial work.
To achieve the above, the Institute undertakes the following tasks:
1- Offering preparatory (non–academic) programs for BA holders in law and providing candidates who pass the program a diploma certificate from the Judicial Institute of Jordan. It also offers other preparatory training programs that are necessary for assuming judicial posts.
2- Holding continuing legal education trainings, seminars, and workshops that target judges, staff, and those seconded to study at the Judicial Institute.
3- The Judicial Institute also offers a non–academic, one–year preparatory program for non-lawyers who hold, at a minimum, a first level university degree, to prepare qualified candidates to assume legal positions at the Ministry. Candidates who pass the program are granted a paralegal certificate. The Minister, upon the recommendation of the Scientific Committee, shall issue the necessary instructions to determine admission criteria and conditions for granting the certificate, provided that the criteria include passing the admissions test.
Judicial CouncilThe Judicial Council was developed in support of recent constitutional amendments that aim to augment the authority and independence of the judicial branch in Jordan. The presence of the Judicial Council serve as a reminder of the importance of creating a democratic society governed by a separation of powers.
Jordan’s Judicial Council represents the judiciary’s highest administrative body and has the legal authority to oversee the affairs of all judges in the country on matters related to employment, discipline, accountability, transportation, promotions, loans, mandates, and retirement.
As a policy-making body, the Judicial Council has a demonstrated interest and commitment to promoting the development of Jordan’s judiciary. The Judicial Council’s primary role is to help the Judiciary prepare draft laws and regulations by submitting
legislative proposals related to litigation procedures and public prosecution. Jordan’s Judicial Council is composed of 11 member judges, including:
1. President: President of the Cassation Court;
2. Vice President: President of the Supreme Administrative Court;
3. President of the Public Prosecution of the Cassation Court;
4. The two most senior judges in the Cassation Court;
5. The Presidents of the Appeal Courts of Amman, Irbid, and Ma’an;
6. Senior inspectors in the regular Courts;
7. Secretary General of the Ministry of Justice; and,
8. The President of the First Instance Court.
At the invitation of the Council’s President, the Judicial Council meets at the Cassation Court in the Palace of Justice in Amman, or elsewhere as determined by the President. A minimum number of seven Judicial Council members are required to attend the meeting in order to have it deemed legal. Judicial Council decisions are issued by reaching consensus or an absolute majority by all members. When votes are equally distributed, the most senior judges from the Cassation Court join the Council as voting members.
Courts in JordanThe Jordanian Constitution regulates the provisions related to the Judicial Authority in Chapter Six, Articles 97 through 110, in addition to Article 27 as outlined below:
• Article 27 of the Constitution states that “The Judicial Power shall be exercised by the courts of law in their varying types and degrees. All judgments shall be given in accordance with the law and pronounced in the name of the King.”
• Pursuant to article 97 of the Constitution, judges are independent in the exercise of their judicial functions, and they are subject to no authority other than that of the law.
JORDAN HUMAN DEVELOPMENT REPORT 2015 139
• Pursuant to article 98 of the Constitution, judges of the civil and Sharia courts shall be appointed and dismissed by a Royal Decree, in accordance with the provisions of the law. Accordingly, the Judicial Council manages all affairs related to regular court judges, while the hiring and dismissal of judges shall be based on a Royal Decree; only the Judicial Council shall have the right to appoint regular judges in accordance with the law.
• Article 99 of the Constitution specifies the types of courts: regular (civil) courts, religious courts, and special courts, as detailed below.
• According to article 100 of the Constitution, the establishment of the various courts, including their categories, divisions, jurisdiction, and administration, shall be by virtue of a special law, and it requires the establishment of a High Court of Justice, whose law shall state that the administrative judiciary should be at two levels.
• According to article 101 of the Constitution, the courts shall be open to all and shall be free from any interference in their affairs. No civilian may be tried in a criminal case before a court whose judges are not all civilians, with the exception of crimes of high treason, espionage, terrorism, drug crimes, and counterfeit currency. Court hearings shall be public, unless the court decides otherwise, in the interest of public order and morale. In all cases, however, verdicts shall be pronounced during a public session. Furthermore, the accused is innocent until proven guilty.
• Pursuant to Articles 102 and 103 of the Constitution, regular courts in Jordan shall have jurisdiction over all persons in all matters, civil and criminal, including cases brought by or against the Government, except those matters in which jurisdiction is vested in Religious or Special Courts in accordance with the provisions of the present Constitution or any other legislation in force.
• Regular Courts shall exercise their jurisdiction pertinent to civil and criminal matters in accordance with the laws in force, provided that, in matters affecting the personal status of foreigners or in matters of civil or commercial nature which, in accordance with international norms, are governed by the law of another country, such law shall be applied in the manner designated by the law. Matters of personal status are those that are defined as such by law and in accordance therewith fall within the exclusive jurisdiction of the Sharia Courts where the parties are Muslims.
• According to articles 104, 105 and 106 of the Constitution, religious courts are divided into Sharia Courts and the Tribunals of other religious communities. Sharia courts shall, in accordance with their own laws, have exclusive jurisdiction over matters of personal status of Muslims, cases concerning blood money (Diya) (where the parties are Muslims or where one of the parties is Muslim and the two parties consent to the jurisdiction of the Sharia courts), and matters pertaining to Islamic Waqfs (religious bequest or endowment). Sharia courts, in the exercise of their jurisdiction, apply the provisions of the Sharia law.
• According to articles 108 and 109 of the Constitution, the Tribunals of Religious Communities are for non-Muslim religious communities, which have been or will be recognized as established religious communities by the government. Tribunals of Religious Communities shall be established in conformity with the provisions of relevant laws. Such laws define the jurisdiction of these Tribunals in matters of personal status and Waqfs (religious bequest or endowment) constituted for the benefit of the community concerned. Matters of personal status from any such community shall be the same, as in the case of Muslims, as within the jurisdiction of the Sharia courts. Such laws shall determine the procedure to be followed by the Tribunals of the Religious Communities.
• Pursuant to article 110 of the Constitution, Special Courts exercise their jurisdiction in accordance with the provisions of the laws constituting them.
JORDAN HUMAN DEVELOPMENT REPORT 2015 140
a. Civil Courts
The Jordanian civil court system hears all civil and criminal matters that do not fall under one of the special courts. In ascending order of authority, the civil court system is comprised of: magistrate courts, first instance courts, courts of appeal, high administrative courts, and the Court of Cassation.
The magistrate courts have jurisdiction over minor criminal matters, such as misdemeanors or crimes where the sentence cannot exceed two years, and civil matters where the penalty does not exceed 750 JD (about 1,000 US Dollars).
The Courts of First Instance have jurisdiction over more serious civil and criminal matters. They will hear civil cases where penalties exceed 750 JD (about 1,050 US Dollars) and criminal cases where the punishment may exceed two years of imprisonment. These courts also play a limited appeal function for minor criminal cases in the magistrate courts. In the courts of first instance, criminal matters are heard by a two-judge panel and civil matters are heard by one judge.
Within the first instance courts is a Major Felonies Court. Its jurisdiction is limited to certain serious crimes which potentially have sentences longer than three years. Cases in this court are heard by a three-judge panel, and appeals go directly to the Court of Cassation.
The courts of appeal hear all appeals from the Courts of First Instance and the magistrate courts. These courts apply a de novo review: a three-judge panel may review the facts of each appealed case.
The Court of Cassation is the final appellate court. It hears appeals on felony criminal matters and on civil judgments exceeding 500 JD (about 700 US Dollars). The court may hear other cases at its optional discretion. It also decides on jurisdictional disputes between the lower courts. Cases are heard by at least 5 judges.
b. Religious Courts
The religious courts in Jordan have jurisdiction solely over personal matters. These include areas of family law such as marriage or divorce, child custody, adoption, and inheritance matters. Each major religious group administers its own religious laws (e.g. the Shari’a court system is used for Muslim citizens, while Christian citizens have religious councils that serve a similar purpose). One exception is inheritance laws, which, though administered through the religious courts of the family’s religion, are still governed by Shari’a principles.
c. Special Courts
The other courts in Jordan are limited to specialized or specific jurisdictions. A military court deals with offenses involving military personnel and with national security crimes (smuggling and bribery of public officials etc.). Land settlement courts administer claims of ownership over unregistered land. A tax court deals with valuation disputes. There is a primary and appellate court for customs disputes.
• Tax Appeals Court: This court hears cases submitted against assessment and re-assessment decisions of the Income and Sales Tax Assessment Officer.
• State Property Court: According to the interpretive memorandum of the Law on the Preservation of State Land and Property, the justification for the establishment of this court is that “the slow court proceedings as well as the fact that courts do not give cases of assault on state property a special importance has facilitated continuous assaults on such property. Moreover, courts issued easy judgments against assaulters and such judgments were not being enforced.”
• Customs Courts: These courts look into customs related crimes and disputes arising from the Customs Law and the General Sales Tax Law and all its amendments.
• Settlement Court: This court has the jurisdiction to hear disputes related to land and water rights in addition to water claims related to irrigation.

JORDAN HUMAN DEVELOPMENT REPORT 2015 141
• State Security Court: This court was established by virtue of the State Security Court Law. The court is constituted by the Prime Minister and some of its areas of jurisdiction are also determined by virtue of a resolution issued by the Prime Minister. Despite the fact that Article 3 of the above-mentioned law defines the crimes that fall within the jurisdiction of this court, paragraph 11 of the same Article grants the Prime Minister the authority to refer any case to this court if the Prime Minister deems the case to be related to a security crime. The public prosecutor at this court is appointed by the Head of the Joint Chiefs-of-Staff at the Jordanian Armed Forces.
Judges of the State Security Court are appointed by the Prime Minister upon the recommendation of the Minister of Justice with regard to civilian judges, and that of the Head of the Joint Chiefs-of-Staff at the army with regards to military judges. The court is normally presided over by a military judge and has the authority to conduct trials behind closed doors if deemed dictated by public interest. Due to the military character of its judges and public prosecution officers, who are normally subject to military discipline rules and who abide by the orders of those who are higher in rank, the independence of judges at this court is questionable. This has proved to be a real concern, as the Court of Cassation on numerous occasions has reversed the rulings of the State Security Court and indicated that the court lacked independence and failed to provide fair trial guarantees to the defendants. In addition, numerous reports have indicated that the public prosecution at the State Security Court issued previously prepared warrants and provided them to the General Intelligence Department as cover for the detainment of persons without proper judicial decisions.
• Military courts: These courts have the mandate to try members of the military for crimes committed during military service.
• Police Court: This court has jurisdiction over crimes committed by members of the Public Security Department. It is constituted, by virtue of an order issued by the Director of the Public Security Department, of officers who hold a college degree in law.
• Gendarmerie Forces Court: This court has the jurisdiction to hear cases related to crimes committed by members of the Gendarmerie Forces, or any previous member, if the crime was committed during the term of service. This court is constituted, by virtue of an order issued by the Director of the Gendarmerie Forces, of Gendarmerie officers who hold a college degree in law.
• The Military Council of the General Intelligence Department: In accordance with Law No. 24 of 1964 on the General Intelligence Department (“GID Law”), the Director of the General Intelligence Department appoints members of the Military Council and ratifies its decisions that pertain to officers and members of the General Intelligence Department. Judgments of the Council are considered final and are not open to any contestation.
• The Court for the Trial of Ministers: This is the “High Tribunal” that the Constitution provided for prior to the constitutional amendments and which was vested with the jurisdiction to try ministers and interpret constitutional provisions. This court does no longer exist because of the constitutional amendments that gave the regular courts the jurisdiction to try ministers for crimes that resulted from the performance of their functions, while the interpretation of constitutional provisions was designated to a constitutional court.
The interpretation of the Constitution was previously carried out by the High Tribunal upon a request from the Council of Ministers or a decision taken by the absolute majority of the House of Representatives or the Senate. The constitutional amendments have annulled the right of the House of Representatives to accuse ministers and for the House of Representatives to assume the functions of public prosecutors before this special court. Instead, the House of Representatives has been given the right to vote on referring ministers to public prosecution, provided that the majority of the House members shall pass the referral decision and that justifying reasons for such decision are stated.

JORDAN HUMAN DEVELOPMENT REPORT 2015 142
Constitutional CourtConstitutional amendments issued on 1 October, 2011 approved a special chapter for establishing the Constitutional Court in Articles 58, 59, 60, and 61, Law number 15, where Article number 58 of the Constitutional amendments states that “Be established by law a constitutional Court based in the capital considered as an independent judicial body stands alone and consisting of nine members at least including the chairman of the court appointed by his Majesty”. His majesty, in his instructions to the Royal Commission to amend the constitution, emphasized the role that the Constitutional Court would play in the process of reform, and promoted the principle of separation between powers and authorities, stopping the predominance of each authority over the other and defending the people’s liberties and rights as stated in the provisions of the constitution, especially after its amendments which are compatible with international standards.
The court began its tasks on 6 October, 2012 and is still, in addition to being a prominent constitutional entitlement, considered a cultural landmark and a prominent milestone in the comprehensive and gradual reforms led by his Majesty King Abdullah II. Since before the start of the Arab Spring, the Constitutional Court functions as an independent body with independent judges. The Constitutional Court gets its mandate from the constitution and protects the constitution in turn.
Also, any party to a pending case has the right, in different types and levels of courts, to state the unconstitutionality of any law or regulation that is applicable to the merits of the case in accordance with the assets specified in the Constitutional Court law.
The Constitutional Court decides on the appeal assigned to it within a period not exceeding one hundred and twenty days from the date of the referral decision. The court has the right to ask for any data or information which it deems necessary for making a decision.
The court issues its decisions in the name of the King and the provisions issued by the court are final and binding to all authorities.
Since its establishment, the court has issued 11 interpretation decisions, as follows:
1. Decision no. 7/2013: Interpretation of article no. (86/1) of the Jordanian Constitution.
2. Decision no. 6/2013: Interpretation of article (59/2) of the Jordanian Constitution.
3. Decision no. 5/2013: Interpretation of articles (93 and 94) of the Jordanian Constitution.
4. Decision no. 3/2013: Interpretation of article (73/1) of the Jordanian Constitution.
5. Decision no. 2/2013: Interpretation of article (94/a) of the Jordanian Constitution.
6. Decision no. 1/2013: Interpretation of article (117) of the Jordanian Constitution.
7. Decision no. 8/2013: Interpretation of the airport agreement.
8. Decision no. 10/2013: Interpretation of a unified law for the Judiciary and Administrative Courts.
9. Decision no. 11/2013: Interpretation of abrogating one article or law in a temporary law by a permanent law.
10. Decision no. 1/2014: Interpretation of articles (89 and 92).
11. Decision no. 2/2014: Interpretation of the retirement of the Parliament members.
Human RightsProtecting human rights has been an integral part of Jordan’s reform process and continues to be an important instrument in the democratization process.
There are a number of guarantees which ensure the respect, observance, and protection of human rights and which assure their effective implementation. The main guarantees include:

JORDAN HUMAN DEVELOPMENT REPORT 2015 143
1.The Jordanian Constitution is a key document which guarantees protection of the full range of civil, political, economic, social, and cultural rights and freedoms. The Constitution protects and promotes the rights of all Jordanians, including minorities, by stipulating that ‘Jordanians shall be equal before the law irrespective of their race, language or religion’. Its provisions are consistent with international human rights principles and standards.
2. The recent constitutional amendments reinforced the separation and balance of powers between state branches, strengthened the role of Parliament and the independence of the judiciary, and introduced further guarantees for civil rights and freedoms:
• Protecting freedom of expression and the equality among citizens of all denominations.
• Punishing any infringement on peoples’ rights and freedoms, including criminalizing torture.
• The independent Constitutional Court will guarantee that laws regulating the rights and freedoms in Jordan shall not weaken the substance of these rights or affect their fundamental principles.
• Civilians will not be tried in any court whose judges are not civilians. The State Security Court’s mandate will be limited to treason, espionage, terrorism, drugs, and currency counterfeit crimes.
• Freedom of the press includes all forms and outlets of mass media as well as freedom of expression.
• Guaranteeing the freedom of scientific research and intellectual property.
3. Jordan has ratified most of the international human rights instruments, and human rights have been incorporated into its domestic laws. Jordan is taking steps to further improve this legislative policy. Jordan was the first Arab state to ratify the International Criminal Court Statute and among the first countries to ratify the Convention on the Elimination of all Forms of Discrimination Against Women (CEDAW). Further Jordan ratified the International Covenant on Civil and
Political Rights and the International Covenant on Economic, Social and Cultural Rights as early as 1977. Jordan was also the first Arab state to ratify the Arab Human Rights Convention and to submit its report to the Arab Human Rights Committee at the Arab League headquarters in Cairo. In accordance with the principles embodied in the Constitution and in international charters, legislation has been enacted to protect human rights.
4. Jordan has taken important measures to protect civil and political rights:
• The National Human Rights Centre was set up as an independent body tasked with conducting visits to detention centers to check on prisoners, reform institutions, and receive complaints about human rights violations. The Centre has published several reports that are critical of the government.
• The Office of the Ombudsman was established pursuant to Act No. 11 of 2008, issued on 16 April 2008, as an independent monitoring mechanism which protects the rights of persons wishing to bring a grievance against decisions of the administrative authorities.
• The Ministry of Political Development was set up to support the political reform process and raise public awareness of democratic and human rights issues.
• A standing Human Rights committee was formed, comprised of members from a number of ministries and institutions responsible for promoting human rights and following up on international reports about human rights in Jordan.
• Human rights departments have been established in several ministries, including the foreign affairs, interior, and justice ministries, and a special Human Rights department has been established at the Public Security Directorate to review complaints about violations committed by the Directorate’s personnel.
• Judicial inspections of detention and reform centers have increased to ensure that no person is being detained illegally and to verify the treatment afforded to prisoners.

JORDAN HUMAN DEVELOPMENT REPORT 2015 144
• The International Committee of the Red Cross, the National Centre for Human Rights, Human Rights Watch, civil society institutions, members of the Public Prosecution Department, and judges are routinely granted free access to detention, reform and rehabilitation centers.
5. Securing the active and free participation of civil society and NGOs, as well as allowing international human rights organizations to operate in the country.
6. A number of laws governing political life have been adopted after consultations with various segments of society through a national dialogue committee and the Lower House in order to reach the highest level of national consensus.
7. Political freedoms and the ability of citizens to participate in political life have been strengthened by the following amendments:
• Establishment of the Constitutional Court;
• The Public Assembly Law that grants the freedom to carry out protests without prior approval;
• The Political Parties Law that encourages and supports the establishment of national political parties beyond tribal affiliations;
• The establishment of the Independent Election Commission which guarantees the transparency and integrity of elections;
• Granting international election observers unrestricted access.
In addition, paragraph 2 of article 8 was recently added to the constitution and reads as follows:
“Every person who is arrested, imprisoned or his/her freedom is restricted, must be treated in a way that preserves his/her human dignity. It is forbidden for him/her to be tortured (in any way) or harmed physically or mentally, as it is forbidden to detain him/her in places outside of those designated by the laws regulating prisons. Any statement extracted from a person under duress of anything of the above or the threat thereof shall neither bare any consideration nor reliability”.
This amendment is designed to meet widespread criticism of the alleged, under Jordanian Law, illegal practices of ill-treatment, mainly by the General Intelligence Directorate, recently reported by the European Court of Human Rights (Qatada v. United Jordan). The Court ruled, however, that an extradition to Jordan would not be in violation of Article 3.
The periodic reports on torture by the UN Committee paints a gruesome picture of the status of routine practices of torture in Jordan. Despite the fact that Jordan has been a State party to the United Nations Convention on Torture since 1991, it did not include the prohibition of torture in its constitution. In fact, in 2010, the Committee against torture recommended that:
“The state party should incorporate the prohibition of torture into the Constitution to show a real and important recognition of torture as a serious crime and human rights abuse and to fight impunity”.
With the current version of paragraph 2 of Article 8 of the Constitution, this recommendation has been implemented. Further legislative amendments of the penal code, as well as more stringent implementation practices, will have to take place in order for Jordan to fully comply with the recommendations of the Committee.

JORDAN HUMAN DEVELOPMENT REPORT 2015 145
Opportunities in Relation to the Judicial Authority’s Legislative and Institutional FrameworkThere are many opportunities available for developing the judiciary, enhancing its performance, and instilling institutional and legislative independence of the judiciary and of individual judges. The main opportunity relates to His Majesty’s vision of supporting the Judicial Authority to perform according to modern standards. This effort is complementary to other national reform efforts, including constitutional amendments and efforts towards sustainable development. Establishing the independence of the judiciary also makes the implementation of the rule of law more likely to be successful.
There are numerous challenges facing the Judicial Authority as a result of technological developments and other modern changes that require new legislation. This requires judicial specialization and judges that are capable of resolving complex cases brought before them.
1. The following are the opportunities facing the judiciary in relation to the legislative and institutional frameworks:
• The Constitutional amendments that emphasize the independence of the Judicial Authority.
• His Majesty’s vision of establishing the independence of the resources and operations of the Judicial Authority.
• The amendments of relevant legislation that support the independence of the Judicial Authority.
• Increased awareness of the importance of the justice sector and its main functions and services.
• An environment that is conducive for more effective communication between the Judicial Authority, its institutions, and other relevant government entities whose work is related to that of the judiciary.
• A conducive environment for communicating, and working, with the Jordan Bar Association to advance the legal profession in Jordan.
• The potential for collaboration with the media to launch legal education and awareness programs, to highlight the role of the Judicial Authority and the rule of law, and to emphasize the role of the judiciary in building and developing the Jordanian society.
• The possibility to benefit from advanced Arab and international experiences in the development of court operations.
• Availability of donor agencies.
2. Reform Issues
• Enhancing and building the capacity, knowledge, and skills of judges.
• Developing the monitoring and accountability system of the Judicial Inspection Unit according to objective and effective criteria.
• Improving the quality of court judgments.
• Reducing litigation time.
• Guaranteeing rapid handling of cases to achieve justice in an effective and timely manner.
• Reducing the caseload of courts and improving their performance.
• Developing the Administrative Judiciary System.

JORDAN HUMAN DEVELOPMENT REPORT 2015 146
State Involvement One of the most important components of judicial reform in Jordan over the last decade has been to improve the qualifications of judges. Jordan is currently home to more than 900 judges and 113 courts, and each judge is handling an average of over 735 cases.
Training can help to ensure that the justice sector reforms are implemented in practice; accordingly, both the Judicial Institute of Jordan and the Ministry of Justice consider training an essential element of an efficient justice system that ensures the competency of those in charge of enforcing the law. Training is also an important component as the demand for judicial services is increasing and begins to relate to new complex issues (e.g. public-private partnerships). In comparison to judges in Common law countries, judges in Jordan are considered public servants with service responsibilities. Therefore, requests to continue to attend training events are seen as positive signs of judges fulfilling their public service duties. Other justice professionals are also feeling the need for training in an evolving justice sector. Barriers to training are mainly related to time, funding, and a lack of experience of traditional trainers, rather than a resistance of trainees to new approaches.
The Ministry of Justice trained approximately 8,000 of its personnel on general topics such as language skills for new employees, report drafting, technical writing, word processing, International Computer Driving License (ICDL), communication skills, dealing with the public, and how to handle work stress. Further training is related to topics specific to the work of the courts, such as fees determination and training on using the Arabic-language case management system (MIZAN). Furthermore, Ministry of Justice staff conducted training on strategic planning, business analysis, enhancing government services, and team-building skills and teamwork. Ministry of Justice staff also attended training courses on human rights, gender equality, and immigration policies and legislations.
Considering the current reforms in Jordan, the review of training topics needs to be more comprehensive than usual. In EU’s
judicial training institutes, approximately 25 percent of the courses offered each year are new. As continuing legal education has been adopted for all judges (except in higher courts) it should be organized and conducted in a structured way, both in didactic and administrative terms; for instance, by institutionalizing the best training events and all their learning objectives, activities, experts, and materials. They should be made available to courts across the country as a means of improving the effectiveness of judicial education at the local level.
The effectiveness of training can be measured by a combination of:
• Tests conducted before and after the school year;
• Participant satisfaction and self-evaluation interviews;
• Interviews with trainers and relevant officials (e.g. supervising judges and mentors, etc.);
• Independent expert appraisal and peer reviews;
• Assessment of court data, decisions, and records;
• Focus groups and surveys (e.g. of court users).
The increased demand of judicial services, coupled with the Judiciary’s independence, requires that any new Judicial Institute of Jordan- Ministry of Justice training programs teach skills in:
1. Judicial reasoning and opinion writing;
2. Relationship building with lawyers;
3. Court management skills, personnel management, planning and management of objectives, and program and performance budgeting (PPB);
4. Behavior and performance in the courtroom and improved judicial bench skills;
5. Scientific evidence and expert testimony;
6. Essential skills for Appellate judges;

JORDAN HUMAN DEVELOPMENT REPORT 2015 147
7. The use of new technologies, computer automation, statistics, and records management;
8. Court security;
9. Media and public relations;
10. The law-making process and the functions of the legal and justice sector actors;
11. Legal aid and the wider social context of litigation;
12. Personal issues related to judges themselves (change management).
Evidently, judicial training should provide judges with updates on any changes to the law. But the challenges are more comprehensive; judges today will face increasing media scrutiny of judicial decisions and the introduction of “quality control” measures. As a consequence, curricula must be wide-ranging, innovative, and offer specialization possibilities.
The Stability of Law Stability is not mutually exclusive with changeability; archaic laws benefit few and harm most. However, a society cannot function properly if laws change too often and citizens constantly are in doubt of whether their actions are in accordance with the law. Further, foreign investors are less likely to invest in Jordan since Jordanian investment laws and regulations are constantly amended. It is for this reason that foreign investors request stabilization clauses when entering into agreements with the Government of Jordan and/or State controlled entities.
A consistent legal system is one that, while not being too fixed, does not stray too far from the parameters set by its constitution. The Jordanian constitution has been subject to many changes, and some have occurred too rapidly when considering their comprehensiveness.
Access to Justice Official documents have revealed that it is a difficult process to obtain free legal aid in Jordan. Although the Bar Association Law of 1972 granted free legal aid, it is not being implemented in practice. Furthermore, both the justice system and the Shari’a courts have had limited technical and operational capacities for a long period of time. As a result, the performance of courts and their ability to ensure fair trials is challenged all over the country.52 A report by MoPIC on the access to justice found the following:
• Institutional capacity building is highly needed to meet the increasing demand for justice services in Jordan.
• Lack of information, poor legal awareness, scarcity of resources, and difficulties traveling to courts are impeding citizens’ access to justice in Jordan.
• Vulnerable communities are not well aware of available legal aid services.
• The Government of Jordan has developed a justice reform strategy to improve the access to justice.
In addition, a recent project document by UNDP53 revealed that although the Government has been committed to improving the access to justice, there are still challenges because of the steady increase in the volume of judicial cases. This has been exacerbated by the increasing number of Syrian refugees. Furthermore, UNDP’s project document stated that certain vulnerable groups, including women and children, are facing the most difficulties accessing free legal aid. Pro bono legal representation does not have a clear enforcement mechanism under the Bar Association in Jordan. The Association needs sustained support on the issue of pro bono legal aid services and its members need capacity building to be able to participate in legal aid initiatives. The provision of judicial services is negatively affected by the absence of a comprehensive regulatory framework for legal aid and legal aid awareness. Finally, according to the project document, more assessments and surveys need to be made in order to identify and address current challenges.
JORDAN HUMAN DEVELOPMENT REPORT 2015 148
Conclusion
This chapter reviewed Jordan’s judicial system and its relationship with the state. The independence and transparency of the judicial system were examined, bearing in mind that judicial independence does not mean complete separation from the other two branches, but rather a balance between all three. Dispute settlement mechanisms, the institutional frameworks of judicial authorities, judicial councils, and different levels of courts in Jordan operate under the same policies and procedures all over the country. Regarding human rights, Jordan’s reform process has focused on establishing mechanisms to protect these rights. The chapter also described the main measures that Jordan has taken to protect civil and political rights. Jordan has also implemented important reforms of the judicial system. The chapter concluded that stability is not mutually exclusive with changeability and that archaic laws benefit few and harm most. At the same time, however, it is counterproductive to amend laws too often. Finally, the chapter has shown that there are challenges when it comes to access to justice and legal aid. There is a genuine need for a complete assessment of both frameworks in order to deal with the lack of a comprehensive legal framework that regulates the provision of legal aid. The Syrian refugee crisis has exacerbated the limitations to access to justice and legal aid in Jordan.

JORDAN HUMAN DEVELOPMENT REPORT 2015 149
Empowered lives. Resilient nations.
GOODGOVERNANCE
JORDAN HUMAN DEVELOPMENT REPORT 2015 150
CHAPTER EIGHTGOOD GOVERNANCE, DECENTRALIZATION, AND PARTICIPATION
JORDAN HUMAN DEVELOPMENT REPORT 2015 151
Introduction Issues related to good governance, decentralization, political participation, and anti-corruption are controversial in the Arab region today. As mentioned in several sections of this report, the movements that have developed in most of the Arab countries since the end of 2010 – what has been labeled the “Arab Spring” – brought these issues to the top of the political, social, and economic agendas of leaders in the region. Jordan is not an exception. However, Jordan was a peculiar case as its leadership responded rapidly by amending 42 articles of the constitution, which allowed for further transparency and accountability. The Government introduced a new elections law and took important measures to change the judiciary system. As far as governance is concerned, the following box outlines UNDP’s definition of “governance” which mainly focuses on the system of values, policies, and institutions by which citizens participate in managing their political, economic, and social wellbeing. In this chapter, Jordan’s score on good governance indicators will be reviewed. In addition, a randomized field survey was conducted to receive feedback from citizens on issues related to good governance, participation, decentralization, rule of law, and anticorruption.
Good Governance in Jordan: The International Context The following Figures (8-1 to 8-6) depict the Worldwide Governance Indicators (WGI) for Jordan over the period of 1996-2013. The indicators include six aggregate governance indicators covering: Voice and Accountability, Political Stability and Absence of Violence, Government Effectiveness, Regulatory Quality, Rule of Law, and Control of Corruption. The line graphs in each of the figures represent the country’s percentile rank. The percentile rank indicates the percentage of countries worldwide that rank lower than Jordan. The dashed lines represent margins of error; 90% confidence intervals. A higher percentile rank indicates better governance scores. On the
Voice and Accountability indicator (Figure 8-1), Jordan’s percentile rank declined from 45.7 in 1996 to 25.1 in 2013. In 2000, during the early era of the King Abdullah II reign, Jordan’s percentile rank was 46.2, but this improvement did not last long, declining to 25 in 2002, when the government dissolved the parliament for almost two years. The rank improved again in 2004 after the parliament was reestablished but stayed volatile till 2013 due to a lack of confidence in the election process.
Jordan is considered one of the most politically stable countries in the region and indicators on violence show that there is little social and political violence.

JORDAN HUMAN DEVELOPMENT REPORT 2015 152
The Political Stability and Absence of Violence indicator (Figure 8-2) experienced a similar trend; Jordan’s score declined from 41.8 in 1996 to 25.6 in 2013. However, the score was highly volatile during this
period. Nevertheless, Jordan is considered one of the most politically stable countries in the region and official figures indicate that neither social nor political violence is a widespread phenomenon in Jordan.
Figure (8-2): Jordan, 1996-2013Aggregate Indicator: Political Stability and Absence of Violence
Figure (8-1): Jordan, 1996-2013Aggregate Indicator: Voice & Accountability
1996
100
90
80
70
60
50
40
30
20
10
01998 2000 2002 2003 2004 2005 2006 2007 2008 2009 2010 2011
45.7
38.9
46.2
25.0 27.432.7 31.3
28.8 29.3 27.9 27.5 27.5 26.3 27.0 25.1
2012 2013
Perc
entil
e Ra
nk
Source: World Bank 2015
1996
100
90
80
70
60
50
40
30
20
10
01998 2000 2002 2003 2004 2005 2006 2007 2008 2009 2010 2011
41.8 42.8 40.4
27.4
39.437.0
42.3
23.1 33.7 31.1 32.2 34.4 29.7 29.9 25.6
2012 2013
Perc
entil
e Ra
nk
Source: World Bank 2015

JORDAN HUMAN DEVELOPMENT REPORT 2015 153
With respect to the Government Effectiveness indicator, figure (8-3) shows a relatively stable high score over the period. This could be attributed to the fact that most stakeholders in the economy believe that the government is efficient. This is further
reinforced by the indicators presented in figures (8-4), Regulatory Quality, and (8-5) Rule of Law. Government efficiency is also supported in figure (8-6): control of corruption.
The graph on regulatory quality shows that Jordan has improved, albeit slightly, during the period of 1996-2013. Figure (8-4) below demonstrates the relatively high quality of regulations in Jordan.
In regards to rule of law, the graph in figure (8-5) below shows that Jordan ranks relatively high. Its rank has stayed the same, and even slightly improved, during the period of 1996-2013.
Figure (8-3): Jordan, 1996-2013Aggregate Indicator: Government Effectiveness
Figure (8-4): Jordan, 1996-2013Aggregate Indicator: Regulatory Quality
1996
100
90
80
70
60
50
40
30
20
10
01998 2000 2002 2003 2004 2005 2006 2007 2008 2009 2010 2011
59.5 58.556.1
61.063.4 63.4 57.6 61.5 62.6 61.7 63.2
59.3 59.358.8 49.8
2012 2013
Perc
entil
e Ra
nk
Source: World Bank 2015
1996
100
90
80
70
60
50
40
30
20
10
01998 2000 2002 2003 2004 2005 2006 2007 2008 2009 2010 2011
53.9
65.7
60.8 56.4 60.3
64.7
57.8 62.3
61.7 60.7 61.2
57.4 59.7 56.9 56.0
2012 2013
Perc
entil
e Ra
nk
Source: World Bank 2015
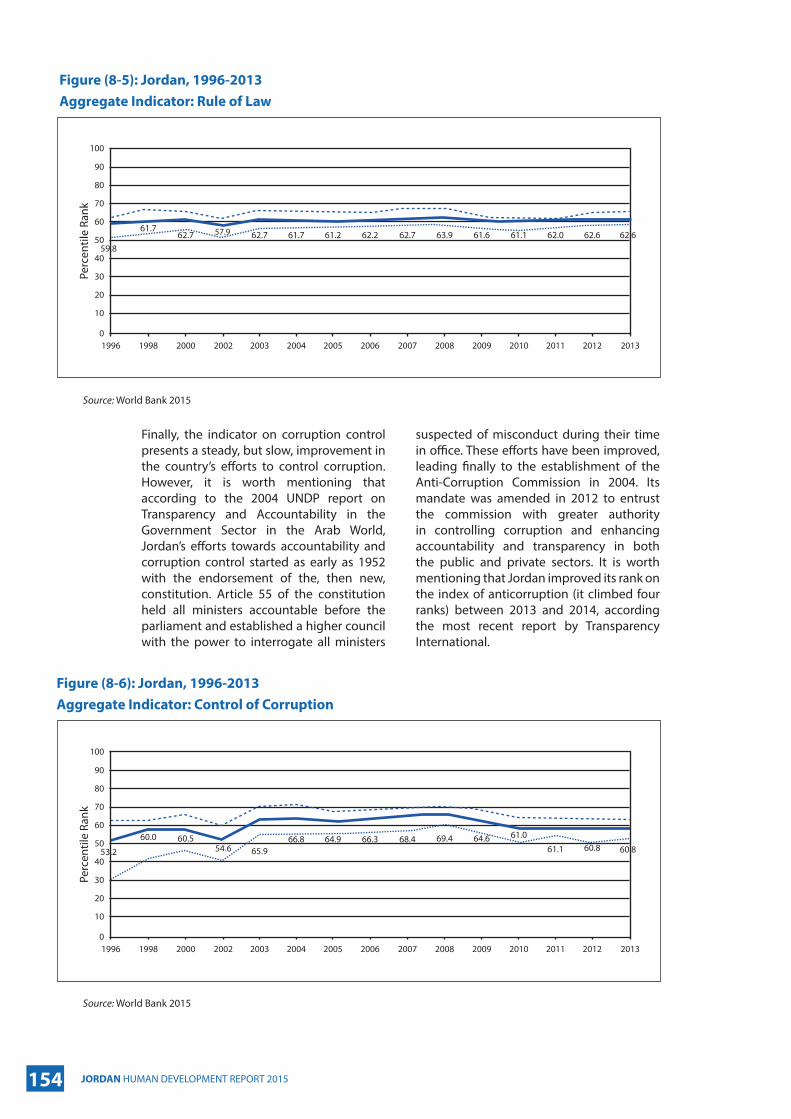
JORDAN HUMAN DEVELOPMENT REPORT 2015 154
Finally, the indicator on corruption control presents a steady, but slow, improvement in the country’s efforts to control corruption. However, it is worth mentioning that according to the 2004 UNDP report on Transparency and Accountability in the Government Sector in the Arab World, Jordan’s efforts towards accountability and corruption control started as early as 1952 with the endorsement of the, then new, constitution. Article 55 of the constitution held all ministers accountable before the parliament and established a higher council with the power to interrogate all ministers
suspected of misconduct during their time in office. These efforts have been improved, leading finally to the establishment of the Anti-Corruption Commission in 2004. Its mandate was amended in 2012 to entrust the commission with greater authority in controlling corruption and enhancing accountability and transparency in both the public and private sectors. It is worth mentioning that Jordan improved its rank on the index of anticorruption (it climbed four ranks) between 2013 and 2014, according the most recent report by Transparency International.
Figure (8-5): Jordan, 1996-2013Aggregate Indicator: Rule of Law
Figure (8-6): Jordan, 1996-2013Aggregate Indicator: Control of Corruption
1996
100
90
80
70
60
50
40
30
20
10
01998 2000 2002 2003 2004 2005 2006 2007 2008 2009 2010 2011
53.2
60.0 60.554.6 65.9
66.8 64.9 66.3 68.4 69.4 64.6 61.061.1 60.8 60.8
2012 2013
Perc
entil
e Ra
nk
Source: World Bank 2015
1996
100
90
80
70
60
50
40
30
20
10
01998 2000 2002 2003 2004 2005 2006 2007 2008 2009 2010 2011
59.8
61.762.7 57.9 62.7 61.7 61.2 62.2 62.7 63.9 61.6 61.1 62.0 62.6 62.6
2012 2013
Perc
entil
e Ra
nk
Source: World Bank 2015

JORDAN HUMAN DEVELOPMENT REPORT 2015 155
Good Governance, Decentralization, Transparency, and ParticipationGiven the scarcity of first-hand information about people’s perception of good governance, decentralization, transparency, rule of law, and political participation in Jordan, this study opted to conduct a survey of random sampling of around 500 individuals from different governorates in the north, middle, and south. The tables (A 8-1 to A 8-6) in the annex to this chapter describe the method of sampling in detail. The response rate was around 85 percent, of which 46.5 percent were males and 53.5 percent were females. Almost 48 percent of the sample was taken from the southern governorates, mainly Ma’an, and 42 percent from the center, mainly Amman. Many of the demonstrations on social, political, and economic issues during the so called “Arab Spring” took place in these two governorates. Over 31 percent of the sample were unemployed young Jordanians, 28.3 percent public sector employees, and 22.9 percent private sector employees. The results of the survey were analyzed on the
basis of four areas: Good Governance and Anti-corruption, Decentralization, Rule of Law and Judiciary System, and Participation. The results are presented below.
a. Good Governance and Anti-corruption
Table (8-1) below summarizes the responses on the issue of good governance and anti-corruption in Jordan. Over 38 percent of the respondents have a clear understanding of the concept of good governance; 26 percent do not consider themselves to have a clear understanding of the concept; and 35.4 percent were neutral. Over 38 percent of respondents think that good governance is applied on a large scale in the private sector, but only 36 percent believe that this is the case in the public sector. As far as regional disparity is concerned, 46.9 percent of respondents believe that good governance is implemented unequally in the different governorates in Jordan. As for anti-corruption efforts, almost 47 percent of the respondents think that there are good measures in place to fight corruption, compared to 36 percent who disagree with this statement. Overall, respondents displayed a fairly high degree of confidence in good governance and anti-corruption efforts in Jordan.
Tota
l Pe
rcen
tageStrongly
DisagreeStrongly
Agree Disagree Neutral
Table (8-1): Results on Good Governance and Anti-corruption
Perc
enta
ge
Num
ber
Perc
enta
ge
Num
ber
Perc
enta
ge
Num
ber
Perc
enta
ge
Num
ber
Perc
enta
ge
Num
ber
A clear understanding of the concepts of good governance in Jordan
#AgreeItems
Good governance concepts applied on a large scale in the Jordanian private sector
Good governance concepts applied on a large scale in the Jordanian public sector
Variation in applying good governance, especially in the area of transparency and accountability, among governorates
There is a great effort in fighting corruption in Jordan
36
21
21
62
74
1
2
3
4
5
8.4%
4.9%
4.9%
14.5%
17.3%
127
142
109
139
126
29.8%
33.3%
25.4%
32.4%
29.4%
152
146
144
114
74
35.4%
34.0%
33.6%
26.6%
17.2%
87
104
131
91
83
20.3%
24.2%
30.5%
21.2%
19.3%
26
15
24
23
71
6.1%
3.5%
5.6%
5.4%
16.6%
100%
100%
100%
100%
100%

JORDAN HUMAN DEVELOPMENT REPORT 2015 156
b. Decentralization
Table (8-2) below shows the results of the survey on decentralization. Almost 44 percent of respondents agrees that decentralization of government services
allows the public sector to provide services to citizens in their hometowns. However, over 51 percent of respondents agrees that there should be a new decentralization law in order to strengthen the role of the local administration in development.
c. Rule of Law and Judiciary System
Table (8-3) below shows that over half of all respondents, 56.4 percent, believes that the Judiciary System in Jordan is independent and 48 percent believes that the judicial system and the courts provide high quality services. However, over 72 percent of respondents complained about the time that it takes for the judiciary system to handle cases. Further, over 38 percent of respondents believes that rule of law is applied equally everywhere; approximately the same number of people disagree. In conclusion, people seem divided on the issue of rule of law, and since over 23 percent of participants answered “neutral” on the question of regional disparities, the results are not conclusive.
Total Percentage
Strongly Disagree
StronglyAgree Disagree Neutral
Table (8-2): Results on Decentralization
Perc
enta
ge
Num
ber
Perc
enta
ge
Num
ber
Perc
enta
ge
Num
ber
Perc
enta
ge
Num
ber
Perc
enta
ge
Num
ber
Decentralization allows the public sector to provide services to citizens in their home towns (the branches of public institutions serve as the central department)
#AgreeItems
60
42
1
2
14.0%
9.8%
128
179
29.8%
42.0%
108
136
25.2%
31.7%
94
48
22.1%
11.2%
38
23
8.9%
5.4%
100%
100%There is a need for a new law for decentralization
Over half of the sample, 56.4 percent, believes that the Judiciary System in Jordan is independent. Over 48 percent thinks that the services provided by the Judiciary System are of high quality.

JORDAN HUMAN DEVELOPMENT REPORT 2015 157
d. Participation
In the areas related to political, economic, and social participation, table (8-4) shows that over 41 percent of participants disagrees with the statement that citizens are engaged in political life. However, over 35 percent thinks that citizens are highly engaged in political life. In terms of economic and social
participation, over 42 percent disagrees that citizens participate in economic and social issues. Finally, over 40 percent of participants thinks that municipalities are doing little when it comes to social and economic development. This reinforces previous responses on the need for further decentralization. .
Tota
l Pe
rcen
tage
Strongly Disagree
StronglyAgree Disagree Neutral
Table (8-3): Results on Rule of Law and Results onRule of Law and the Judiciary System
Perc
enta
ge
Num
ber
Perc
enta
ge
Num
ber
Perc
enta
ge
Num
ber
Perc
enta
ge
Num
ber
Perc
enta
ge
Num
ber
The judicial system is an independent authority without any negative influence from any other authorities
#AgreeItems
1
2
3
4
172
66
135
50
16.8%
15.4%
31.5%
11.7%
170
140
176
115
39.6%
32.9%
41.0%
27.0%
182
116
70
102
19.1%
27.0%
16.3%
23.8%
81
88
37
115
18.9%
20.5%
8.6%
26.8%
24
18
10
46
5.6%
4.2%
2.3%
10.7%
100%
100%
100%
100%
The judicial system and the courts provide high quality services
The judicial system and the courts provide high quality services
There is no disparity in the rule of law among governorates
Total Percentage
Strongly Disagree
StronglyAgree Disagree Neutral
Table (8-4): Results on Participation
Perc
enta
ge
Num
ber
Perc
enta
ge
Num
ber
Perc
enta
ge
Num
ber
Perc
enta
ge
Num
ber
Perc
enta
ge
Num
ber
Citizens are a widely engaged in the political life in Jordan
#AgreeItems
1
2
3
40
39
27
9.3%
9.1%
6.3%
114
113
115
26.6%
26.3%
26.8%
97
96
112
22.6%
22.4%
26.1%
135
138
134
31.7%
32.4%
31.5%
42
42
40
9.8%
9.8%
9.3%
100%
100%
100%
There is a wide participation in economic and social issues in Jordan
Local councils and municipalities, are active in economic and social development issues

JORDAN HUMAN DEVELOPMENT REPORT 2015 158

JORDAN HUMAN DEVELOPMENT REPORT 2015 159
Empowered lives. Resilient nations.
CONCLUSIONAND
POLICY

JORDAN HUMAN DEVELOPMENT REPORT 2015 160
CHAPTER NINECONCLUSIONS AND POLICY RECOMMENDATIONS

JORDAN HUMAN DEVELOPMENT REPORT 2015 161
Conclusions Jordan consists of twelve governorates. The capital city of Amman and three other governorates – Irbid, Zarqa, and Aqaba – score the highest on human development indicators. Other governorates, particularly those in the south, rank lower on the human development index. This report shows that local regional disparities should be of significant importance to policy makers in their development efforts; regional equality needs to be taken into account. However, the Syrian refugee crisis poses a serious challenge to any efforts the country is undertaking to bridge the regional gaps.
Despite these challenges however, Jordan ranked number 77 on the HDI with a score of 0.745, which puts Jordan in the high human development category, among the 19 Arab countries who are given an HDI score in the global Human Development Report. Also, Jordan is one of the top 10 countries in this category, ranking number 9. Jordan’s HDI value was higher than both the average of 0.735 for countries in the high human development group and the average of 0.682 for Arab countries. However, Jordan’s HDI value was lower than for some other Arab countries in the same human development group, such as Libya, Oman, and Lebanon who had HDI values of 0.784, 0.783, and 0.765 respectively.
Jordan’s HDI value has increased by 27 percent from 1980-2013, from a score of 0.587 to a score of 0.745. Jordan’s life expectancy at birth increased by 7.7 years, from 66.2 years to 73.9 years, reflecting an improvement in the quality of healthcare. The expected years of schooling increased by 1.4 years between 1980 and 2013, while the mean years of schooling increased by 6.8 years, reflecting improved access to education.
Jordan’s annual poverty line was estimated at 813.7 JD per individual with a poverty rate of 14.4 percent. On the governorate level, Amman and Karak had the lowest poverty rates with 11.4 percent and 13.4 percent respectively. Ma’an and Ajloun had the highest poverty rates of 26.6 percent and 25.6 percent respectively.
The status of Jordanian women in society has improved, particularly in regard to access to education and health, and thanks to improvements in legislations to protect women’s rights within the home and at the workplace. Moreover, Jordan has frameworks in place for developing and implementing gender policies. On to the 2014 Global Gender Index, Jordan scored 0.597 and ranked 134 out of 142 countries. On to the economic participation and opportunity index, Jordan ranks 140 which is on the lower end of the index. The female labor force participation rate is too low in Jordan and Jordan ranked 139 out of 142 countries. Further, the estimated earned income (PPP US$) for females is lower than for males and, as a result, Jordan’s rank was 137.
Across governorates, the proportion of households that lives below the average of the QLI distribution varied depending on the economic situation and the different methods used to measure standards of living. Ajloun (39.9 percent), Mafraq (37.8 percent), and Tafila (35.0 percent) had the highest proportion of households living below the average, while Amman had the lowest proportion of households (18.9 percent).
The government’s interventions have contributed significantly to mitigate regional disparities in Jordan. The government prepared 12 programs for the development of governorates for the period of 2013-2016. These Development Programs will help alleviate the disparities between regions by creating job opportunities, building capacities, increasing accessibility to microfinance, and improving infrastructure.
In the field of education, Jordan experienced a noticeable discrepancy in the proportion of schools located in urban and rural areas. 64 percent of schools are located in urban areas and only 36 percent are located in rural areas. On the governorates’ level, Amman has the highest proportion of schools (32 percent), followed by Irbid (18 percent), and Zarqa (11 percent). These governorates are also the most populated. The lowest proportion of schools are in Tafila and Aqaba (2 percent each). The lack of class units is a big problem and causes overcrowding in classrooms. Out of a total of 68,755 class

JORDAN HUMAN DEVELOPMENT REPORT 2015 162
units in Jordan, Tafila and Aqaba have the lowest proportion with 1.9 percent and 2.3 percent respectively followed by Ajloun (2.6 percent), Ma’an (2.8 percent), and Madaba (2.9 percent).
Looking at average number of students per teacher, the results indicate that Zarqa has the highest number of students per teacher, 19.92, followed by Amman and Balqaa with 16.94 and 16.28 students respectively, while Ma’an has 10.13 students per teacher and Tafila 11.01 students per teacher. The average number of students per class unit on the governorate level also shows that Zarqa, Amman, and Balqa have the highest number of students per teacher (29.8, 26.4, and 24.8 respectively) compared with the lowest numbers in Ma’an, Mafraq, and Karak (17.8, 18.8, and 20.3 respectively).
Providing incentives to the private sector to establish public-private partnerships could be a tool to bridge the regional disparities between governorates. The Jordan Education Initiative (JEI) is an initiative that involves both international and domestic actors, in which the public and the private sector have partnered and managed to improve education in Jordan through the effective use of information and communication technologies (ICTs). At the same time, the initiative also built local ICT capacities within different industries and created a model of educational reform for other countries.
In regards to health and the healthcare system, this report found the following:
• Disparities between governorates are characterized by the unequal distribution of private and public sector health services. The majority of private sector medical services are located in Amman.
• Some governorates have a significantly lower bed-patient ratio.
• Disparities in the quality of health services between the different entities within the health sector, as well as between geographical areas, are prevalent, mainly in Ma’an, Jerash, Ma’an, Ajloun, and Tafileh. These governorates also have the lowest
number of hospital beds; neither Ajloun nor Tafileh provide hospital beds in private hospitals.
• The current Syrian refugee crisis has further increased the burden on the health sector. Host communities, especially the northern governorates, are facing significant health challenges due to the large number of Syrian refugees living in their communities. These challenges are not only linked to the number of patients, but also to the risk of new epidemics and diseases.
• The highest infant mortality rates are in the southern region of the country. The nation-wide infant mortality rate is within international standards and Jordan’s MDG indicator on infant mortality has been reached.
• Households that rank below the average distribution tend to smoke daily. In Madaba, 66.8 percent of the population smokes, in Irbid, 63.8 percent smokes, and in Ajlun 63.7 percent smokes. The governorates with the lowest smoking rates are Tafileh (55.9 percent), Jerash (57.7 percent), and Mafraq (60.1 percent).
• Based on the distance to health center criteria, 0.9 percent, 1.8 percent, and 3.2 percent of households in Madaba, Tafileh, and Aqaba respectively, fall below the average QLI value. In Jerash, Amman, and Mafraq, 25 percent, 31.1 percent, and 12.4 percent respectively, fall below the average QLI value.
• Based on the disability criteria, 34.7 percent, 28.4 percent, and 27.1 percent of individuals in Amman, Jerash, and Aqaba, respectively, fall below the average QLI value. The lowest percentages were in Tafileh, Ma’an, and Karak with rates of 15.8 percent, 19.5 percent, and 21.5 percent respectively. 54
When it comes to youth and female employment, this report found that there are large disparities between governorates in terms of business opportunities, as the private sector is unevenly distributed across the country. Amman, Zarqa, Irbid, and

JORDAN HUMAN DEVELOPMENT REPORT 2015 163
Aqaba are home to the majority of private companies. There are almost no private companies in Tafileh and Ma’an. This is not only a challenge for youth and female employment, but it is also an impediment to overall economic growth and sustainable development. The report also found that remote governorates have the highest rates of unemployment, especially among youth and women. Lack of work ethics and relevant job skills are some of the reasons for the high rates of unemployed youth. Other governorates, however, such as Amman, Zarqa, Irbid, and Aqaba, suffer from a lack of proper capacity building programs, both in regards to work ethics and to job skills. Finally, there is not enough financing for micro and small enterprises. This is a problem in all governorates, mainly in those further away from Amman. A regional and sub-regional data base on youth employment, including data on gender, is not available, which makes it difficult to identify the best tools to increase the participation of women and youth in the labor market. In some governorates, including Amman, Zarqa, Irbid, and Aqaba, youth and women mainly engage in the informal economy. The informal economy usually suffers from poor employment conditions and is not covered by social security or health care insurance.
There is a balanced gender distribution among young people in Jordan. Youth, in the age bracket of 15-24, represent almost one fifth of the total population. Dimensions such as gender, education, geographical location, economic activities, political and social participation, and poverty, were analyzed in the report. Regional disparities exist in all these dimensions among youth. Since youth are the cornerstone of development, policy makers should pay special attention to this age group, in particular since Jordan is approaching its “demographic window of opportunity”. A clear and comprehensive vision of sustainable human development, as well as sufficient planning, is required in order to utilize Jordan’s human resources in the most optimal way.
In regards to women’s issues, this report confirmed that women’s participation continues to be a major development obstacle in Jordan and the main impediment to women’s empowerment. There are significant differences between governorates
in terms of women’s participation. In Tafileh and Karak, around 22 percent of women are economically active. The governorate with the lowest female participation rate is Zarqa, where only 8 percent of women participate in the labor force. In Jerash and Aqaba, approximately 12 percent of women are working or seeking employment. However, when it comes to education, Jordanian women are well educated and have equal access to education services. In addition, indicators on women’s health, especially the MDGs, have reflected large regional-wide improvements in the past decade.
The chapter on Jordan’s justice system and state involvement closely examined the independence and transparency of the judicial system. The report underscores that judicial independence does not mean separation from the other branches but rather a balance between them. In this regard, it is fair to conclude that the judicial system in Jordan does not suffer from regional disparities. Dispute settlements, the judicial authority’s institutional framework, the judicial council, and the different levels of courts in Jordan follow the same policies and procedures all over the country. In terms of human rights, Jordan’s reform process has focused on continuous protection of human rights and the establishment of specific requirements for protecting those rights. The report highlighted the main measures the country has taken to protect civil and political rights. In addition, reforms in the judicial system have been implemented. Finally, the chapter underscored that stability is not mutually exclusive with changeability and that archaic laws benefit few and harm most.
The last chapter of this report examined Jordan’s performance in good governance, decentralization, political participation, and anti-corruption based on the Worldwide Governance Indicators (WGI) and a random sample of 500 individuals from all over Jordan. Jordan ranked relatively high on the Voice and Accountability indicator. The country is also considered to be one of the most politically stable in the region. As for the indicator on Government Effectiveness, Jordan ranks relatively high. On the Quality of Regulatory Process indicator, Jordan has improved its ranking during 1996-2013. Finally, in the area of Rule of Law, Jordan has

JORDAN HUMAN DEVELOPMENT REPORT 2015 164
a relatively good rank. The survey conducted by the research team of this report found that participants think positively about Jordan’s anti-corruption efforts. In addition, over 56 percent of participants consider the judiciary system in Jordan to be independent. However, in regards to rule of law, the results were inconclusive and vary from one area to another. This indicates some level of regional disparity when it comes to rule of law implementation. Finally, in the area of political, economic, and social participation, participants mostly disagree with the statement that citizens are engaged in Jordan’s political life. Also, over 42 percent of participants believe that citizens are not participating in policy making. Similarly, over 40 percent of participants think that municipalities are doing little when it comes to social and economic development. These results suggest that a more comprehensive decentralization process is needed if the government wants to increase public participation in Jordan’s political, economic, and social life.
Recommendations The following recommendations and policy proposals are deduced from the findings of the research team, from the workshops, and from the expert interviews. The recommendations and policy proposals are divided into the various topics of this report.
Human Development Index
• In order to more accurately calculate the Human Development Index (HDI) of governorates, data needs to be collected on the level of governorates rather than on the national level.
• The data used in calculating the HDI should be integrated with official published data, so that a calculation of the HDI based on official data results in the same value, score, and rank.
• Instead of using the 2009 Multidimensional Poverty Index (MPI) to calculate the 2014 HDI, the MPI should be updated to reflect the latest available information. Using old data will not give an accurate description of the current situation and will affect Jordan’s HDI rank.
Education
• In order to make the education sector a driver for economic growth and jobs creation, Jordan needs to improve the quality of its institutions. The Government should demand higher standards of excellence and encourage new investments, potentially through public-private partnerships. There should be a special focus on the regional dimensions to ensure that education is provided equally across regions and by gender.
• A comprehensive review of primary and secondary schools, particularly those located in rural areas, should be conducted to identify disparities in available resources. An action plan should then be developed to bridge the current gap between schools and regions.
• Develop the basic reading and writing skills of pre-school students, especially in urban and poorer areas.
• Strengthen orientation programs that encourage students to enroll in vocational training institutions, especially in marginal areas.
Healthcare• It is necessary to expand the provision
of private health care services in governorates by either giving incentives to investors or by establishing public-private partnerships.
• The government should develop and launch media campaigns that inform the public, targeting remote areas in particular, of the dangers of smoking, obesity, and non-communicable diseases.
• Provide vaccinations to populations in host communities to avoid the spread of new diseases.
• Increase the access to transportation services in governorates with the lowest number of health centers, ensure that these centers hire more doctors, and make sure that all health centers, nation-wide, have access to equipment, medications, and other requirements.

JORDAN HUMAN DEVELOPMENT REPORT 2015 165
• Pass the medical accountability law to ensure the provision of better services and care to patients.
• It is necessary to produce both a nationwide accreditation manual, to be monitored by related entities, and a procedure manual for public sector health service providers.
Employment and livelihood
• The government should strengthen the incentives for investors in order to increase the private sector’s presence in governorates other than Amman, Zarqa, Irbid, and Aqaba. This could also strengthen youth and female employment in the more remote governorates.
• It is necessary to improve business ethics and support skills-building in the various governorates to increase the sustainability of jobs. This can be achieved through education as well as with the help of donors that operate projects in the targeted regions.
• A more detailed analysis, and data collection on youth employment, is needed due to the current scarcity of information on youth employment; this should be a project spearheaded by the Ministry of Labor.
• The government should adopt a policy that seeks to turn informal economic activities into formal jobs in order to improve employment conditions and allow for better work environments.
• Increased financing of medium and small enterprises in the governorates is necessary. This should be accompanied by training programs for youth and women to teach them how to run sustainable businesses.
Youth
• Jordan should increase its investments in human capital, particularly in youth, and enable them to engage in the labor market, through both public and private institutions.
• Policy makers must focus on Jordan’s education system as education is the most important driver of sustainable development. Education empowers people, improve their cognitive skills, strengthen their capacities, skills and knowledge, and provide them with necessary experience.
• The government should seek funds from various different sources to ensure the financial security and sustainability of youth oriented, and youth-led, projects, with specific focus on gender equality.
• Young people should be partners in all efforts that seek to make education more sustainable. They should be equipped with the competencies and skills to improve their own lives, the educational institutions, and their communities.
• The government should strengthen and support the role of the Higher Youth Council in the development of youth policies and consider it a public authority on policies and activities that relate to youth.
• The education system should adopt international standards and allow for external monitoring at the regional and global level; educational and training institutions need to respond to the requirements of the job markets at the local, regional, and international levels.

JORDAN HUMAN DEVELOPMENT REPORT 2015 166
Women and women’s empowerment
• Support small female-run businesses, with special attention paid to rural areas and governorates (other than Amman, Irbid, Zarqa, and Aqaba) in order to make it easier for women to work in the formal sector from home.
• The government should consider providing tax exemptions or other incentives for companies that provide women with transportation to and from work and that have nurseries available at the workplace.
• Improve the quality of health centers by increasing the numbers of doctors specializing in pre- and postnatal care.
• Make vocational training programs more attractive to females.
The Judicial System
• Improve the capacity of judges and build their knowledge and skills.
• Jordan should develop a monitoring and accountability system for the Judicial Inspection Unit according to objective and effective criteria.
• There is a need to improve the quality of court judgments.
• It is important to reduce the litigation time.
• Reduce the caseload of courts and improve their performance.
• It is necessary to develop the Administrative Judiciary System.

JORDAN HUMAN DEVELOPMENT REPORT 2015 167
Empowered lives. Resilient nations.
ANNEXES

JORDAN HUMAN DEVELOPMENT REPORT 2015 168
Amman
Zarqa
Irbid
Ma’an
Karak
Balqaa
Mafraq
Tafiela
Madaba
Total
168
13
3
200
4
10
22
3
5
428
39.3
3.0
.7
46.7
.9
2.3
5.1
.7
1.2
100
Percentage (%) NumberGovernorate
Table (A 8-1) Distribution of the sample by governorate
18 – 28
29 – 38
39 – 48
49+
Total
212
90
72
54
428
49.5
21.0
16.8
12.6
100.0
Table (A 8-3) Distribution of the sample by Age group
Age Group Number Percentage (%)
Male
Female
Total
199
229
428
46.5
53.5
100
Table (A 8-2) Distribution of the sample by gender
Sex Number Percentage (%)
Annex (1) Chapter Nine Tabels

JORDAN HUMAN DEVELOPMENT REPORT 2015 169
Amman
Zarqa
Irbid
Ma’an
Karak
Balqaa
Mafraq
Tafiela
Madaba
Total
168
13
3
200
4
10
22
3
5
428
39.3
3.0
.7
46.7
.9
2.3
5.1
.7
1.2
100
Percentage (%) NumberGovernorate
Table (A 8-1) Distribution of the sample by governorate
18 – 28
29 – 38
39 – 48
49+
Total
212
90
72
54
428
49.5
21.0
16.8
12.6
100.0
Table (A 8-3) Distribution of the sample by Age group
Age Group Number Percentage (%)
Male
Female
Total
199
229
428
46.5
53.5
100
Table (A 8-2) Distribution of the sample by gender
Sex Number Percentage (%)
1.2
.2
1.6
7.7
15.4
61.9
11.9
100
5
1
7
33
66
265
51
428
Illiterate
Primary
Middle school
Secondary
Intermediate Diploma
B.A. / BSc
Higher than B.A / BSc
Total
Table (A 8-4) Distribution of the sample by Educational Level
Percentage (%) NumberGovernorate
Public Sector
Private Sector
Self Employed
Unemployed
Others
Total
121
98
19
133
57
428
28.3
22.9
4.4
31.1
13.3
100
Table (A 8-6) Distribution of the sample by Employment Status
Current Employment Status Number Percentage (%)
Never Married
Married
Divorced
Widower
Total
240
179
7
2
428
56.1
41.8
1.6
.5
100
Table (A 8-5) Distribution of the sample by Marital Status
Marital Status Number Percentage (%)

JORDAN HUMAN DEVELOPMENT REPORT 2015 170
Annex (2) Survey Questionnaire
بسم ا( الرحمن الرحيم
شركة التجمع االستشاري للتطوير المالي وا3داري (إسناد) استبانة قياس
-5g�l�7¹+� F5
#k�7+5bH+�§|K�¸�kG5g����H�b�l��I�mJ'+��K
-b�hH+ %g�®�H+
%+¨�H+ k�Egu½+
�b�,L��kh«;�k«´�k«�¢.�}N}�.�3+b=g,��«�xlH+�-5+6LL�¬*gȹ+�-bul½+�Ź+�sIgJ},�£I��«��l,L�5g��l�7¹+���rlH+�kG}�8�¡¨�.� «Kg�I �g¥¢IL �kN}��hH+ �35+¨H+ �k«�¢l, �kFÒ�H+ �n+4 � «Kg�½+ ��®�, �©�= ��}�lH+L �2014 �¡g��H �kN}��hH+ �35+¨½+�g«�7g«�7L�gN3g��lF+���7+¨H+�gKg¢�°�kG5g��½+� «Kg�IL�¬*g�®�H+�¡g�¢H+L�kN�G}IÒH+L�3g���H+�gNg�®FL�-b«�8}H+�k«�Gg»+
�kIg.�kN}��,��Ig�.L��¬���H+�puhH+�ngNg�H�ngI¨��½+�¤'+�Og��=��puhH+��N}E��I�¤Lg�lHg,�¡}�lH+�¨0}J
¹��2 � � � � � � � � � � � �J ��1
k�,g�½+�m¥lJ+�p1ghH+
2015��������������yN5glH+���������������������������������������������������������������������«F¨lH+������������������������������������������������������������������p1ghH+� �7+�2015��������������yN5glH+���������������������������������������������������������������������«F¨lH+������������������������������������������������������������������iF+}½+� �7+�
101
k«��x��H+�ngJg«hH+��¹L'+
���¢º+��1©oJ'+ ��2 � � � �}G4��1
5¨�7��2 � � � �Ê35'+ ��1
���}��H+��2�k¢�7
���}¥��H+��2bH+��6�5g¢N3
�k«��¢º+�7
�¬�«��lH+�M¨l��½+��3
��I5'+ ��4 � � � � � � � � � � � � � � � ����I��3 � � � � � � � � � � �tL�lI��2 � � � � � � � � � � �j�='+ ��1�
��7¨lI�¡¨�,3��6 � � � � � � � � � �¨Jg/��5 � � � � � � � � �3+b=)+ � ��4 � � � � � � � � � � �¬*+bl,+��3 � � � � � � � � � �I��2 � � � � � � � � � �¬I'+ ��1���g«�=�ng�7+53��8����������7¨N5¨Hg�,��7�
�k«=g�l0¹+�kHg»+��4
����H+��5���='+ �¹��4 � � � � � � �-}1��g�='+ ��3 � � � � � � � �Õ�H+�MbH����N����=�i1g�9��3b1� ��9g2��g�F��2 � � � � � � � �¬I¨�1��g�F��1
kN}��hH+�35+¨½+�k«�¢l,�kFg�H+�n+4� «Kg�½+��®�,��«h�.L�k«Hg�E��7g«F��g«Jg/������
-}��H+� F5
1
2
3
4
5
6
7
8
9
10
��b��D*� �̄�~6*H�I¡g~zE�¢�<�f�c�E�,]£~7xD*�f£�Cb²*��£Gb�EÁ24°*��b�D*
��b��D*� �̄�~6*H�I¡g~zE�¢�<�f�c�E�,]£~7xD*�f£�Cb²*��£Gb�EÁ24°*��8b³*
�b��£c�-�2*2yJH�ib�Abp´*�Í+�,]£~7xD*�f£�Cb²*��£c�-�iHb�gJÈC*�f+bBxD*�2¡/H�dc~z+��b�<�f�~8b�D*�¯
�i*$*x/°*H�ÍF*¡�D*H�f��F°*��£c�-� �̄fJyCxE�°��Db�G��¡�-�fDH]D*�ib~z~6'¡E��HxA��*�¥*��Í�:*¡��D�ibE]³*�Ã]�-H
��fJyCx´*�,x)*]D*��b�E
��+bB�fJyCxEÉD*H��£DbB°*��¡FbB�¡pF�f£F24°*�fE¡�²*��/¡-��*��C�f£�~9H��<�f~¦£�g~zE�ib~6*42�¶*�f/b²*��H2��£c�g�D
�£�B*
��E�¤c�~6��1*]-�]/¡J�°H�f��g~zE�f��~6�Äg�J�¤)b~¦�D*��b��D*Ix1°*�ib��~zD*
�°H�f£Db<�,2¡/�i*3�ibE]1��]�J��Cbp´*H�¤)b~¦�D*��b��D*b�£A�hc�D�f�J¡:�f£�E5�i*ÆA�¶*�bJb~¦�D*�obg«
�f£~6b£~zD*�,b£²*� �̄Í�:*¡��D�f�~6*H�fC4b~{E��Db�Gf£E¡�²*�bJb~¦�D*H�i*4*x�D*��C� �̄f£<b�g/°*H�fJ2b~|gB°*H
� �̄�gC4b~{EH�Á24°*��4b~{D*�fc=4�b�)*2��z��J�e*¡�D*��z�¸f£<b�g/°*H�fJ2b~|gB°*H�f£~6b£~zD*�,b£²*
-}��H+�¤+¨¢=�-b��,��E+¨I5
��E+¨I4
bNgÂ3
�E+¨I�Õ>2
�-b��,��E+¨I�Õ>1
ng1g�®N)+

JORDAN HUMAN DEVELOPMENT REPORT 2015 171
k«��x��H+�ngJg«hH+��¹L'+
���¢º+��1©oJ'+ ��2 � � � �}G4��1
5¨�7��2 � � � �Ê35'+ ��1
���}��H+��2�k¢�7
���}¥��H+��2bH+��6�5g¢N3
�k«��¢º+�7
�¬�«��lH+�M¨l��½+��3
��I5'+ ��4 � � � � � � � � � � � � � � � ����I��3 � � � � � � � � � � �tL�lI��2 � � � � � � � � � � �j�='+ ��1�
��7¨lI�¡¨�,3��6 � � � � � � � � � �¨Jg/��5 � � � � � � � � �3+b=)+ � ��4 � � � � � � � � � � �¬*+bl,+��3 � � � � � � � � � �I��2 � � � � � � � � � �¬I'+ ��1���g«�=�ng�7+53��8����������7¨N5¨Hg�,��7�
�k«=g�l0¹+�kHg»+��4
����H+��5���='+ �¹��4 � � � � � � �-}1��g�='+ ��3 � � � � � � � �Õ�H+�MbH����N����=�i1g�9��3b1� ��9g2��g�F��2 � � � � � � � �¬I¨�1��g�F��1
kN}��hH+�35+¨½+�k«�¢l,�kFg�H+�n+4� «Kg�½+��®�,��«h�.L�k«Hg�E��7g«F��g«Jg/������
-}��H+� F5
1
2
3
4
5
6
7
8
9
10
��b��D*� �̄�~6*H�I¡g~zE�¢�<�f�c�E�,]£~7xD*�f£�Cb²*��£Gb�EÁ24°*��b�D*
��b��D*� �̄�~6*H�I¡g~zE�¢�<�f�c�E�,]£~7xD*�f£�Cb²*��£Gb�EÁ24°*��8b³*
�b��£c�-�2*2yJH�ib�Abp´*�Í+�,]£~7xD*�f£�Cb²*��£c�-�iHb�gJÈC*�f+bBxD*�2¡/H�dc~z+��b�<�f�~8b�D*�¯
�i*$*x/°*H�ÍF*¡�D*H�f��F°*��£c�-� �̄fJyCxE�°��Db�G��¡�-�fDH]D*�ib~z~6'¡E��HxA��*�¥*��Í�:*¡��D�ibE]³*�Ã]�-H
��fJyCx´*�,x)*]D*��b�E
��+bB�fJyCxEÉD*H��£DbB°*��¡FbB�¡pF�f£F24°*�fE¡�²*��/¡-��*��C�f£�~9H��<�f~¦£�g~zE�ib~6*42�¶*�f/b²*��H2��£c�g�D
�£�B*
��E�¤c�~6��1*]-�]/¡J�°H�f��g~zE�f��~6�Äg�J�¤)b~¦�D*��b��D*Ix1°*�ib��~zD*
�°H�f£Db<�,2¡/�i*3�ibE]1��]�J��Cbp´*H�¤)b~¦�D*��b��D*b�£A�hc�D�f�J¡:�f£�E5�i*ÆA�¶*�bJb~¦�D*�obg«
�f£~6b£~zD*�,b£²*� �̄Í�:*¡��D�f�~6*H�fC4b~{E��Db�Gf£E¡�²*�bJb~¦�D*H�i*4*x�D*��C� �̄f£<b�g/°*H�fJ2b~|gB°*H
� �̄�gC4b~{EH�Á24°*��4b~{D*�fc=4�b�)*2��z��J�e*¡�D*��z�¸f£<b�g/°*H�fJ2b~|gB°*H�f£~6b£~zD*�,b£²*
-}��H+�¤+¨¢=�-b��,��E+¨I5
��E+¨I4
bNgÂ3
�E+¨I�Õ>2
�-b��,��E+¨I�Õ>1
ng1g�®N)+

JORDAN HUMAN DEVELOPMENT REPORT 2015 172

JORDAN HUMAN DEVELOPMENT REPORT 2015 173
Empowered lives. Resilient nations.
REFERENCES

JORDAN HUMAN DEVELOPMENT REPORT 2015 174
Administrative Committee on Coordination, 1998, “Statement of Commitment for Action to Eradicate Poverty”, http://www.unesco.org/most/acc4pov.htm, Accessed 14 August 2016
Department of Statistics – The Hashemite Kingdom of Jordan, 2006, Household Expenditure and Income Survey HEIS 2006, Jordan
______, 2008, Household Expenditure and Income Survey HEIS 2008, Jordan
______, 2010a, Household Expenditure and Income Survey HEIS 2010, Jordan
______, 2010b, Quality of Life Index 2010, Jordan
______, 2010c, State of Poverty Report in Jordan 2010, Jordan
______, 2011, Establishment Census 2011, Jordan
______, 2012a, State of Poverty Report in Jordan 2012, Jordan
______, 2012b, Jordan Population and Family Health Survey 2012, Jordan
______, 2012c, Statistical Yearbook 2012, 2012, Jordan
______, 2013a, Statistical Yearbook 2013, 2013, Jordan
______, 2013b, Employment and Unemployment Survey EUS 2013, Jordan
______, 2015, General Population and Housing Census 2015, Jordan
Independent Election Commission, 2010, Amended Electoral Law (2010)
Jordan Enterprise Development Corporation, 2014, MSME National Strategy 2014, Jordan
Kovacevic, M., and C. Calderon, 2014, “UNDP’s Multidimensional Poverty Index: 2014 Specifications”, UNDP Human Development Report Office: Occasional Paper, http://hdr.undp.org/en/content/undp%E2%80%99s-multidimensional-poverty-index-2014-specifications, Accessed 14 August 2016
Kushnir, K., M. L. Mirmulstein, and R. Ramalho, 2010, “Micro, Small, and Medium Enterprises Around the World: How Many Are There, and What Affects the Count?”, World Bank/IFC, http://www.ifc.org/wps/wcm/connect/9ae1dd80495860d6a482b519583b6d16/MSME-CI-AnalysisNote.pdf?MOD=AJPERES, Accessed August 14 2016
Ministry of Education– The Hashemite Kingdom of Jordan, 2013, Statistical Report 2012-2013, 2013, Jordan
Ministry of Health – The Hashemite Kingdom of Jordan, 2013, Annual Statistical Book 2013, Jordan

JORDAN HUMAN DEVELOPMENT REPORT 2015 175
Ministry of Higher Education and Scientific Research – The Hashemite Kingdom of Jordan, 2013, The Annual Statistical Report on Higher Education in Jordan 2012-2013, 2013, Jordan
Ministry of Labor – The Hashemite Kingdom of Jordan, 2013, Annual Report 2013, Jordan
Ministry of Planning and International Cooperation – The Hashemite Kingdom of Jordan, 2013a, Diagnostic Study of the Informal Sector, Amman
______, 2013b, Panoramic Analysis of the Informal Sector, Amman
______, 2014, 2014-2016 National Resilience Plan, Amman
______, 2015a, Jordan 2025, Jordan,
______, 2015b, Comprehensive Vulnerability Assessment, Amman
Social Security Corporation, 2013, Annual Report 2013, Jordan
United Nations Development Programme (UNDP), 2014a, Human Development Report: Sustaining Human Progress: Reducing Vulnerabilities and Building Resilience 2014, New York
______, 2014b, Arab Knowledge Report 2014: Youth and Localisation of Knowledge, Dubai
______, 2014c, Labour Market: The Case of Vocational Training in Jordan
______, 2015, Human Development Report: Work for Human Development 2015, New York
United Nations Development Programme (UNDP) Jordan, 2015, Enhancing community security and access to justice in host communities and other fragile areas in Jordan (2015-2018), UNDP Jordan Country Office: Project Document, http://www.jo.undp.org/content/jordan/en/home/operations/projects/democratic_governance/Enhancing_community_security.html Accessed August 14 2016
Wazani, K., 2014, “The Socio-Economic Implications of Syrian Refugees on Jordan: A Cost-Benefit Framework”, Konrad Adenauer Stiftung, Berlin, http://www.kas.de/wf/en/33.37808/, Accessed August 14 2016
World Bank, 2015, “Country Data Report for Jordan, 1996-2014”, Worldwide Governance Indicators, http://info.worldbank.org/governance/wgi/pdf/c112.pdf Accessed August 14 201
6
World Economic Forum, 2013, The Global Gender Gap Report 2013, Geneva
______, 2014, The Global Gender Gap Report 2014, Geneva

JORDAN HUMAN DEVELOPMENT REPORT 2015 176
Chapter One: Human Development Trends in Jordan
1. The report includes the value and the rank for 19 Arab countries (States) or territories: Algeria, Bahrain, Djibouti, Egypt, Iraq, Jordan, Kuwait, Lebanon, Libya, Morocco, State of Palestine, Oman, Qatar, Saudi Arabia, Sudan, Syrian Arab Republic, Tunisia, United Arab Emirates, Yemen.
2. Libya’s HDI declined from 0.784 in 2013 to 0.724 in 2014, and its ranking fell from 55th to 94th (United Nations Development Programme (UNDP) 2014, 2015).
3. Group 1 comprises countries with high equality in HDI achievements between women and men (absolute deviation of less than 2.5 percent); group 2 comprises countries with medium to high equality in HDI achievements between women and men (absolute deviation of 2.5–5 percent); group 3 comprises countries with medium equality in HDI achievements between women and men (absolute deviation of 5–7.5 percent); group 4 comprises countries with medium to low equality in HDI achievements between women and men (absolute deviation of 7.5–10 percent); and group 5 comprises countries with low equality in HDI achievements between women and men (absolute deviation from gender parity of more than 10 percent) (United Nations Development Programme (UNDP) 2015: 223.
4. United Nations Development Programme (UNDP) 2014: 41.
5. A household, and all of its members, is classified as multi-dimensionally poor (or MPI-poor) if it suffers overlapping deprivation in at least one-third of the weighted indicators. A household is considered severely multidimensionally poor if the deprivation score is ½ or more; near-MPI poor if the deprivation is 1/5 or more but less than 1/3; and deprived but not near-MPI poor if the deprivation score is positive but less than 1/5 (Kovacevic and Calderon 2014. [Full ref: Kovacevic and M. Cecilia Calderon. 2014. “UNDP’s Multidimensional Poverty Index: 2014 Specifications.” Human Development Report Office, Occasional Paper]).
6. According to the UN statement of June 1998, poverty is a denial of choices and opportunities, a violation of human dignity. It means lack of basic capacity to participate effectively in society. It means not having enough to feed and clothe, not having a school or clinic to go to, not having the land on which to grow one’s food or a job to earn one’s living, not having access to credit. It also means insecurity, powerlessness and exclusion of individuals, households and communities. It means as well the susceptibility to violence, and it often implies living on marginal or fragile environment, without access to clean water or sanitation. Note: need to cite the source for this. Eg: United Nations year: page. Then include full citation in the list of references at the end of the report. (“Statement of Commitment for Action to Eradicate Poverty”, adopted by the Administrative Committee on Coordination, 1998
7. Squared Poverty Gap Index (SPGI or P2) is the self weighted (squared) average of poverty gaps taken as proportions of the value of poverty line of both poor and non-poor assuming zero poverty gaps for the non-poor. The measure lacks intuitive appeal, and because it is not easy to interpret it is not used very widely.
8. The poverty rate for 2006 and 2010 was recalculated based on the new approach used in 2010 for deriving the poverty line. This approach
takes the bottom three quintiles households as the reference group while the previous approach takes the bottom two quintiles households (ranked by per capita expenditures) as the reference group for deriving the poverty line.
9. The new methodology was developed by the World Bank in cooperation with the Jordanian Ministry of Planning and International Cooperation (MoPIC) and the Jordanian Department of Statistics.
10. Independent Election Commission 2010.
11. World Economic Forum 2014.
12. The value of the Gender Gap Index ranges from 0.00 for complete inequality to 1.00 for perfect equality.
13. The Gini Coefficient ranges from 0 (perfect equality) to 1 (perfect inequality or a situation where one person gets all the income).
14. For more information, see Wazani 2014.
15. The number of officially registered refugees increased to around 600,000 by the end of February 2014, which is in addition to unregistered Syrians, who number 750,000 according to statistics from the Public Security Directorate.
16. For more information, see Wazani 2014.
Chapter Two: Education
17. For more information, see United Nations Development Programme (UNDP) 2014b.
18. For more information, see United Nations Development Programme (UNDP) 2014b.
Chapter Three : Health
19. Source: Department of Statistics – The Hashemite Kingdom of Jordan 2012b
20. Information from UNDP MDG Status Report 2013
21. Source: Department of Statistics – The Hashemite Kingdom of Jordan 2012b
22. The IC was cancelled as part of the Government Restructuring Program. However, its functions were moved under a specialized directorate in the Ministry of Industry and Trade.
23. Source: Ministry of Health - The Hashemite Kingdom of Jordan 2013
24. Dr. Hani Al-Kurdi, Secretary-General of the Higher Health Council, presented the main findings of the strategy during the Amman workshop for this report.
25. Source: Department of Statistics – The Hashemite Kingdom of Jordan 2010b.
26. Source: Department of Statistics – The Hashemite Kingdom of Jordan 2015.
27. Source: Ministry of Planning and International Cooperation - The Hashemite Kingdom of Jordan 2014.
JORDAN HUMAN DEVELOPMENT REPORT 2015 177
28. Information from Department of Statistics data sets on health indicators 2013.
29. Information from Department of Statistics data sets on health indicators 2013.
30. Source: Department of Statistics – The Hashemite Kingdom of Jordan 2010b.
31. Source: Department of Statistics – The Hashemite Kingdom of Jordan 2010b.
32. Source: Department of Statistics – The Hashemite Kingdom of Jordan 2010b.
Chapter Four: Employment and Livelihood
33. Source: Department of Statistics – The Hashemite Kingdom of Jordan 2013b.
34. Source: Ministry of Labor – The Hashemite Kingdom of Jordan 2013.
35. Source: Department of Statistics – The Hashemite Kingdom of Jordan 2013b.
36. Source: Social Security Corporation 2013.
37. Source: World Economic Forum 2014.
38. Source: Ministry of Planning and International Cooperation – The Hashemite Kingdom of Jordan 2013a.
39. Information from Department of Statistics data sets 2013.
40. Source: Jordan Enterprise Development Corporation 2014.
41. Source: Department of Statistics – The Hashemite Kingdom of Jordan 2011.
42. Source: Jordan Enterprise Development Corporation 2014.
43. Source: Kushnir et al 2010.
44. Source: Department of Statistics – The Hashemite Kingdom of Jordan 2011.
45. Source: Ministry of Planning and International Cooperation – The Hashemite Kingdom of Jordan 2013b.
Chapter Five: Youth
46. According to the International Labor Organization (ILO), youth is within the age of 15-24 years.
47. The figure does not include residents of other nationalities or Syrian refugees.
48. Source: Department of Statistics - The Hashemite Kingdom of Jordan 2010c.
Chapter Six: Women and Disparities
49. Information from European Training Foundation 2012 - SEMED Regional Report.
50. Source: Department of Statistics – The Hashemite Kingdom of Jordan 2013b.
51. World Economic Forum 2013.
Chapter Seven: The Justice System and State Capacity
52. Source: Ministry of Planning and International Cooperation - The Hashemite Kingdom of Jordan 2015b.
53. Source: United Nations Development Programme (UNDP) Jordan 2015.
Chapter Nine: Conclusions and Policy recommendations
54. Source: Department of Statistics – The Hashemite Kingdom of Jordan 2010b.

Empowered lives. Resilient nations.