Joint Meeting Agenda Board of Commissioners & Board of Education
46
1 MEETING CALLED TO ORDER MEETING OBJECTIVES: I. Receive and Consider Revised Scenario for an Upcoming Capital Plan II. Understand the Program and Fiscal Implications of the Scenario ITEMS OF BUSINESS: I. Opening Remarks Joe Bryan, Chair - Wake County Board of Commissioners Keith Sutton, Chair - Wake County Board of Education Agenda (1) II. Follow-Up Information from April 18, 2013 Joint Board Meeting Joe Desormeaux, Assistant Superintendent for Facilities Nicole Kreiser, Debt and Capital Director Presentation (2): Page 4 Attachment (3): Total Cost of Security at WCPSS including SROs Attachment (4): School Resource Officers by School, Law Enforcement Agency, with Funding by WCPSS Attachment (5): Elementary and Middle Schools with Allied Barton Officers Joint Meeting Agenda Board of Commissioners & Board of Education Thursday, May 16, 2013 – 8: 00 a.m. Greater Raleigh Chamber of Commerce South Salisbury Street, Raleigh NC 27601
Transcript of Joint Meeting Agenda Board of Commissioners & Board of Education
1
MEETING CALLED TO ORDER MEETING OBJECTIVES:
I. Receive and Consider Revised Scenario for an Upcoming Capital Plan
II. Understand the Program and Fiscal Implications of the Scenario
ITEMS OF BUSINESS:
I. Opening Remarks Joe Bryan, Chair - Wake County Board of Commissioners Keith Sutton, Chair - Wake County Board of Education Agenda (1)
II. Follow-Up Information from April 18, 2013 Joint Board Meeting Joe Desormeaux, Assistant Superintendent for Facilities Nicole Kreiser, Debt and Capital Director
Presentation (2): Page 4 Attachment (3): Total Cost of Security at WCPSS including SROs
Attachment (4): School Resource Officers by School, Law Enforcement Agency, with Funding by WCPSS Attachment (5): Elementary and Middle Schools with Allied Barton Officers
Joint Meeting Agenda Board of Commissioners & Board of Education
Thursday, May 16, 2013 – 8: 00 a.m. Greater Raleigh Chamber of Commerce South Salisbury Street, Raleigh NC 27601
mlvenditto
Typewritten Text
Attachment 1

2
III. WCPSS Building Program Scenario Joe Desormeaux, Assistant Superintendent for Facilities
Presentation (2): Pages 5-12 Attachment (6): Facility Utilization
Attachment (7): Membership Projections Attachment (8): Use of Additional Funding Before Next Bond Attachment (9): May 16, 2013 Scenario Detail Attachment (10): Elementary, Middle and High Circle Maps Feb. 2013 Attachment (11): Existing Schools Prioritization Whole Campus Attachment (12): Existing Schools Prioritization Partial Campus Attachment (13): Summary of Whole and Partial Renovation Projects Attachment (14): Renovations: Phased vs. Swing Space Attachment (15): New School vs. Renovations Examples Attachment (16): Unfunded Life Cycle Needs Dec 2012, By School Attachment (17): Security Requirements Description Attachment (18): Support and Athletic Attachment (19): CIP 2006 Plan for Referendum Facilities
IV. Fiscal Impact of Scenario Nicole Kreiser, Debt and Capital Director
Presentation (2): Pages 13-20
V. Discussion: Priorities, Choices and Trade-offs – Next Steps to Arrive at a Consensus on a Capital Plan
Joe Bryan, Chair - Wake County Board of Commissioners Keith Sutton, Chair - Wake County Board of Education Presentation (2): Page 21
VI. Wrap-up

Building Program Scenarios & Fiscal Impact
Joe Desormeaux, WCPSS Assistant Superintendent for Facilites Nicole Kreiser, Wake County Debt and Capital Director
May 16, 2013
Wake County Board of Education and Wake County Board of Commissioners
Joint Meeting
Attachment 2

Presentation Overview
Follow-Up Information from April 18, 2013 Joint Meeting
Revised WCPSS Building Program Scenario
Fiscal Impact of Scenario
2

Follow-Up Information from April 18, 2013 Joint Meeting
3

Benchmarking Wake County & Triple A Counties That Fund School Construction
4
Under Scenario 2 ($1.1 Billion) & Scenario 3 ($911 Million), Wake County would rank third highest in projected overall debt per capita and second highest in overall debt to assessed value amongst the benchmarked triple-A counties.
Scenario 3 ($911)
Scenario 2 ($1.1 B)
Arlington County VA 4,384$ 4,384$ Loudoun County VA 3,766$ 3,766$ Wake County NC (Projected with Program) 3,330$ 3,506$ Mecklenburg County NC 2,810$ 2,810$ Fairfax County VA 2,785$ 2,785$ Guilford County NC 2,458$ 2,458$ Forsyth County NC 2,321$ 2,321$ Prince William County VA 2,247$ 2,247$ Henrico County VA 1,735$ 1,735$ Chesterfield County VA 1,692$ 1,692$
Projected Overall Debt Per Capita Scenario 3 ($911 M)
Scenario 2 ($1.1 B)
Guilford County NC 2.7% 2.7%Wake County NC (Projected with Program) 2.5% 2.6%Forsyth County NC 2.4% 2.4%Mecklenburg County NC 2.3% 2.3%Prince William County VA 2.0% 2.0%Loudoun County VA 1.9% 1.9%Arlington County VA 1.6% 1.6%Fairfax County VA 1.5% 1.5%Henrico County VA 1.5% 1.5%Chesterfield County VA 1.5% 1.5%
Projected Overall Debt to Assessed Value

Revised
WCPSS Building Program Scenario
Joe Desormeaux, WCPSS Assistant Superintendent for Facilities
5

BOE Proposed Capital Program
6
Capital Program Funding from $53.8M in available funds
Capital Program needs
11 Elementary Schools 222,327,255 5,450,000 216,877,255 3 Middle Schools 112,661,013 3,000,000 109,661,013 2 High Schools 126,637,919 8,000,000 118,637,919 6 Renovations and 3 Renovation Starts 164,862,628 164,862,628 Life Cycle Replacements 64,398,914 13,229,432 51,169,482 Life Cycle Furniture Replacements 1,511,456 1,511,456 Educational Equipment Replacements 1,948,913 1,948,913 Environmental and ADA 5,317,500 5,317,500 Technology 60,000,000 60,000,000 Mobile Classroom Relocation 16,398,000 16,398,000 Assessment of Facilities 1,065,150 1,065,150 Public Infrastructure 30,564,483 30,564,483 Property Acquisition 41,787,444 10,796,552 30,990,892 Startup Designs 22,800,000 22,800,000 Program Contingency 13,457,206 13,457,206 Program Management 23,675,710 23,675,710 Inflation (3% per year) 71,017,185 71,017,185 Athens Stadium 4,952,281 4,952,281 - Security 7,429,735 7,429,735 - Additional Program Management 942,000 942,000 -
993,754,793 53,800,000* 939,954,793
* $43.8M is from the sale of 2/3 bonds and $10M is from additional anticipated savings in CIP 2006

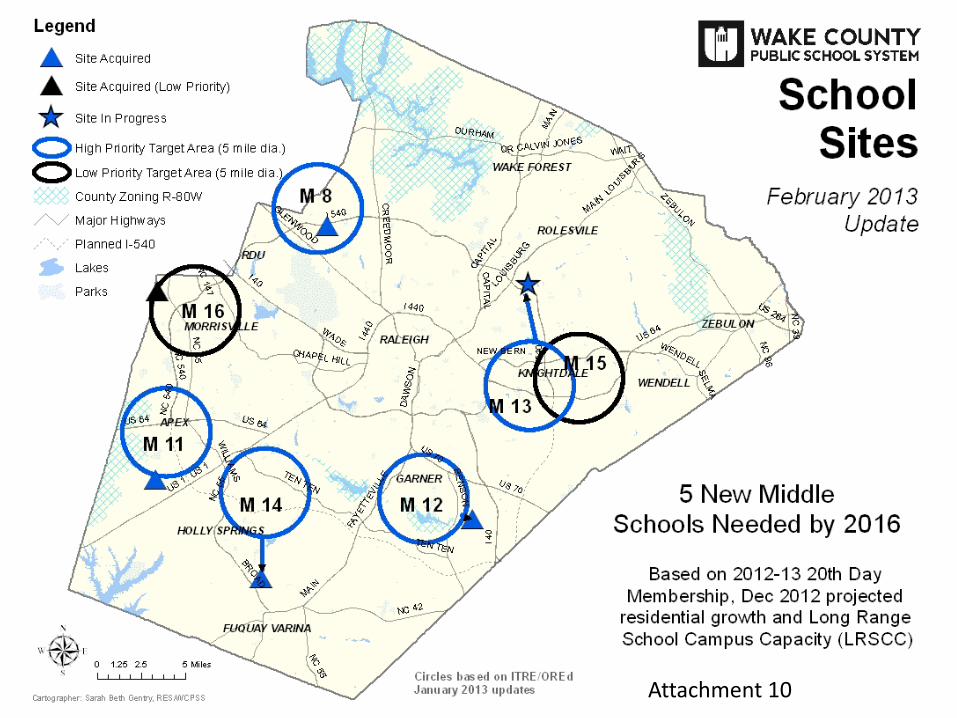
May 2013 Scenario: $939.9 M 11 Elementary, 3 Middle, 2 High LRSCC crowding rate: Funded projects plus 11 Elementary, 3 Middle, 2 High &
Renovations( % reflects special schools and new grade levels) Elementary: 101.5% as of 2017-18 from 102.1% in 2012-13 Middle: 102.6% as of 2018-19 from 99.3% in 2012-13 High: 109.4% as of 2018-19 from 114.8% in 2012-13
M8 is the only planned Year Round School included in seat count
6 Fully Funded and 3 Partially Funded Major Renovations Fully Funded: Green ES, Vandora Springs ES, Lincoln Heights ES, Brooks ES, Garner HS,
and Rolesville ES Partially Funded: Stough ES, East Wake MS, and Apex HS
Deferred Major Renovation and Lifecycle increases
7
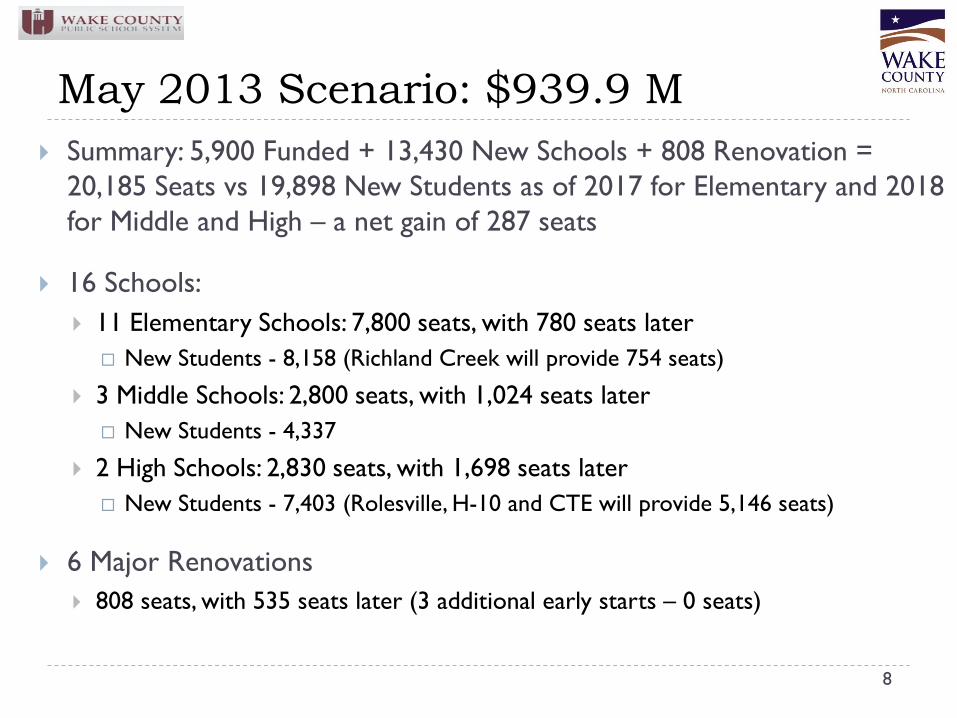
May 2013 Scenario: $939.9 M Summary: 5,900 Funded + 13,430 New Schools + 808 Renovation =
20,185 Seats vs 19,898 New Students as of 2017 for Elementary and 2018 for Middle and High – a net gain of 287 seats
16 Schools: 11 Elementary Schools: 7,800 seats, with 780 seats later New Students - 8,158 (Richland Creek will provide 754 seats)
3 Middle Schools: 2,800 seats, with 1,024 seats later New Students - 4,337
2 High Schools: 2,830 seats, with 1,698 seats later New Students - 7,403 (Rolesville, H-10 and CTE will provide 5,146 seats)
6 Major Renovations 808 seats, with 535 seats later (3 additional early starts – 0 seats)
8

May 2013 Scenario: $939.9 M Differences from $2.2 B plan New schools reduced from 32 to 16 schools - Stay even with
growth instead of reducing crowding
Major renovations reduced from 28 projects to 6 projects - Used priority list to decide which projects were funded. Deferred major renovation list will increase.
Life cycle list reduced by 25% - Still exceeds yearly recommended
average to stay even with life cycle but expected to be insufficient due to overflow from significant reduction in major renovations.
9

May 2013 Scenario: $939.9 M Technology reduced by 33% - Focused on infrastructure replacement
while new classroom devices were reduced.
Security reduced by 60% - Focused on critical cameras, card access systems and buzzer entrance systems for elementary schools. Pending security task force recommendations and legislative potential actions.
Temporary Classrooms – increased significantly in expectation of more relocations and to fund one temporary campus for early start and/or swing space
Public infrastructure, property acquisition, contingency and program management reduced – to match reduction in new and renovation projects.
10

Impact of Capital Improvement Plan
11
Scenario 2 New Scenario 3 Investment $1.14 B $939.9 M $911.6 M
New Schools 15 16 11 Renovations 9 6 and 3 Start-ups 7
Asset Allocation New Schools $558.2 M 49% $528.3 M 56% $478.8 M 53% Renovations $322.3 M 28% $243.9 M 26% $270.0 M 30%
Support $255.4 M 22% $167.8 M 18% $162.8 M 18%
Prior Plans: CIP Plan 2000 2004 2006 2013 New Schools 43% 47% 55% 56% Renovations 52% 45% 30% 26% Support 5% 8% 15% 18% Total $500 M $450 M $970 M $939.9 M
Impact of Capital Improvement Plan
12
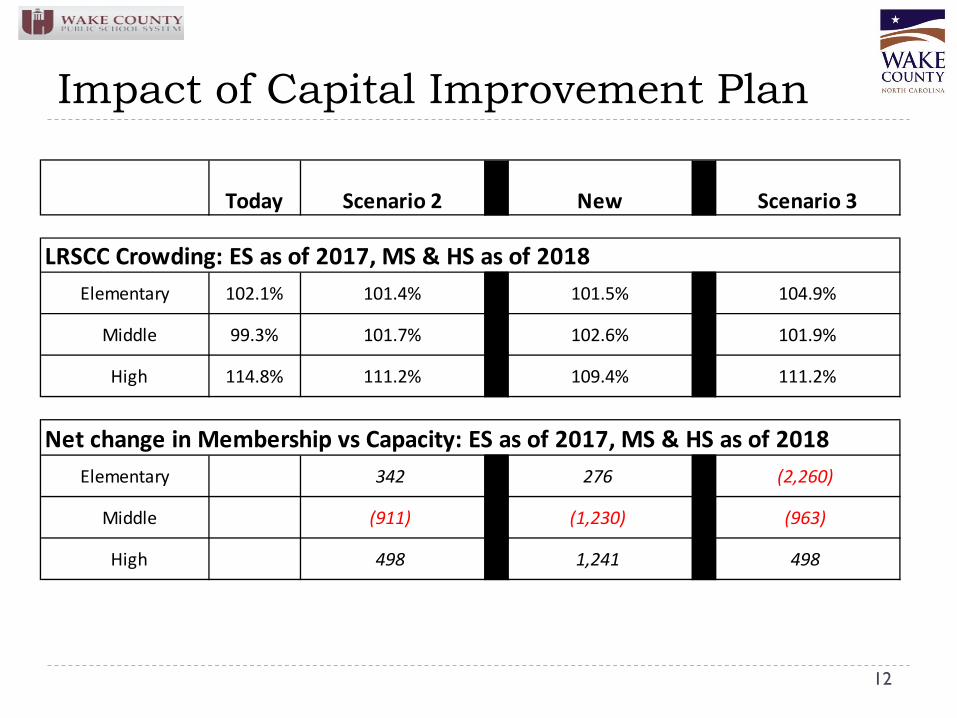
Today
LRSCC Crowding: ES as of 2017, MS & HS as of 2018Elementary 102.1%
Middle 99.3%
High 114.8%
Net change in Membership vs Capacity: ES as of 2017, MS & HS as of 2018Elementary
Middle
High
Scenario 3New
498
101.5%
102.6%
109.4%
101.4%
342
(911)
111.2%
276
(1,230)
1,241
Scenario 2
101.7%
498
104.9%
101.9%
111.2%
(2,260)
(963)

Fiscal Impact of WCPSS Building
Program Scenarios
Nicole Kreiser, Wake County Debt and Capital Director
13
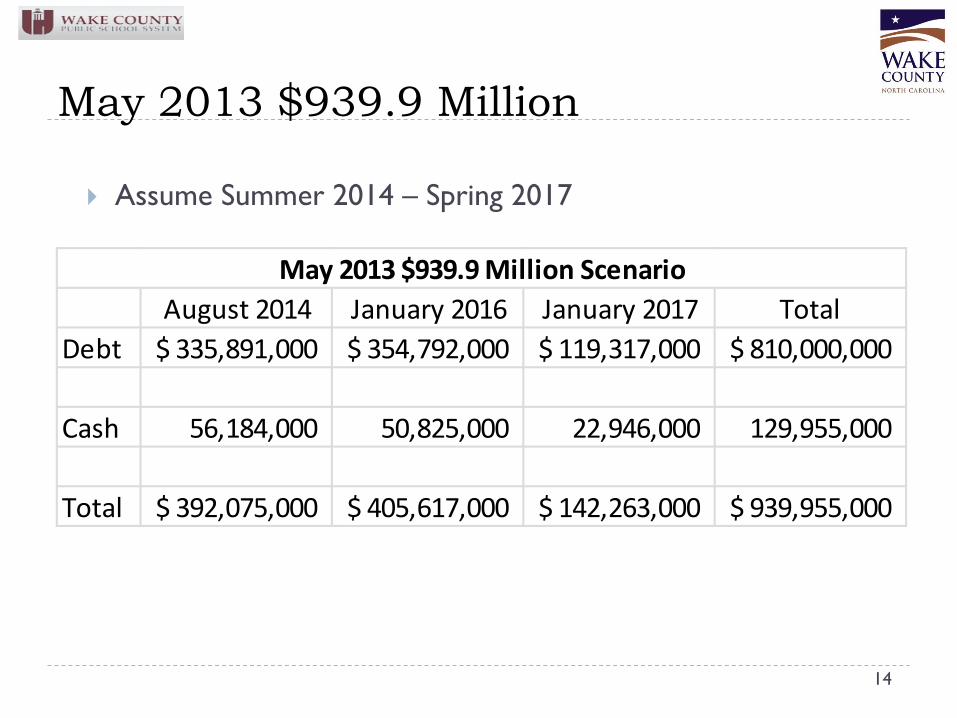
May 2013 $939.9 Million
Assume Summer 2014 – Spring 2017
14
August 2014 January 2016 January 2017 TotalDebt 335,891,000$ 354,792,000$ 119,317,000$ 810,000,000$
Cash 56,184,000 50,825,000 22,946,000 129,955,000
Total 392,075,000$ 405,617,000$ 142,263,000$ 939,955,000$
May 2013 $939.9 Million Scenario

Summary of Fiscal Impacts
Requires 4.86 cents property tax increase for debt and capital; operating impact of 0.67 cents.
Total fiscal impact is 5.53 cents
15
FY 2015 FY 2016 FY 2017 FY 2018 FY 2019 TotalCapital 4.86 4.86Operating 0.06 0.28 0.28 0.05 0.67Total 4.86 0.06 0.28 0.28 0.05 5.53

For Context…
16
Average Assessed Value of a Home in Wake County equals $263,500
Average Property Tax Increase… May Scenario ($939.9 Million): $145.72

Financial Model and Debt Capacity
17
Assumptions for Tax Rates, Growth in Tax Base, and Allocation for Debt and Capital. 4.86 Cents for FY 15
for Debt & Capital and 0.67 Cents for
Operating FY 16 -19
Assumptions for Debt Service
Revenues
Assumptions for Debt Service Expenditures
Debt Service Fund
Balance
Projected Low Debt Service Fund Balance
(% of Subsequent
Years Expenditures)
19.1%

Debt Guidelines
18
Maintain the mix of cash (“pay-as-you-go”) and debt funding within a range of 75% to 85% debt over the span of the seven year CIP.
WCPSS modeled program generally adheres to target of no more than 80% debt in any given year
Repayment of bond principal should be consistent with other AAA-rated counties (60% - 70%) WCPSS modeled program 74.2% of principal amortized in ten years
2014 2015 2016 2017 2018* 2019* 2020* Total 14-20
0.0% 80.5% 80.7% 70.0% 73.5% 79.4% 79.7% 76.8%FY 2018 - FY 2020 includes additional debt capacity without a tax increase
FY 14 - FY 20 Percentage Debt: WCPSS, Wake Tech, and County CIP Projects

Benchmarking Ratios/Metrics for triple-A rated Counties Wake County would rank third highest in projected overall
debt per capita and second highest in overall debt to assessed value amongst the benchmarked triple-A counties.
19
May Scenario
$939.9 MArlington County VA 4,384$ Loudoun County VA 3,766$ Wake County NC (Projected with Program) 3,214$ Mecklenburg County NC 2,810$ Fairfax County VA 2,785$ Guilford County NC 2,458$ Forsyth County NC 2,321$ Prince William County VA 2,247$ Henrico County VA 1,735$ Chesterfield County VA 1,692$
Projected Overall Debt Per Capita May
Scenario $939.9 M
Guilford County NC 2.7%Wake County NC (Projected with Program) 2.5%Forsyth County NC 2.4%Mecklenburg County NC 2.3%Prince William County VA 2.0%Loudoun County VA 1.9%Arlington County VA 1.6%Fairfax County VA 1.5%Henrico County VA 1.5%Chesterfield County VA 1.5%
Projected Overall Debt to Assessed Value

20
Questions?

Discussion…
Priorities
Choices & Tradeoffs
Next Steps
21

Attachment 3
TOTAL COST OF SECURITY AT WCPSS
Law Enforcement Agency Number of SROs Provided
Annual Cost Per SRO*
Total WCPSS Funding Cost to County/Municipality
Total Cost
Wake County Sheriff's Office 19 $73,620 $0 $1,398,780 $1,398,780Apex Police Department 3 $86,396 $0 $259,188 $259,188Holly Springs Police Department 3 $74,500 $18,920 $204,580 $223,500Garner Police Department 2 $81,416 $9,460 $153,372 $162,832Cary Police Department 6 $90,524 $0 $543,144 $543,144
Sub-Total 33 $406,456 $28,380 $2,559,064 $2,587,444
Wake County Sheriff's Office 3 $73,620 $75,676 $145,184 $220,860Raleigh Police Department 9 $73,174 $340,542 $318,024 $658,566Apex Police Department 1 $86,396 $37,838 $48,558 $86,396Cary Police Department 4 $90,524 $151,352 $210,744 $362,096Fuquay-Varina Police Department 1 $64,988 $37,838 $27,150 $64,988Knightdale Police Department 1 $71,000 $37,838 $33,162 $71,000Garner Police Department 2 $83,327 $58,838 $107,816 $166,654Holly Springs Police Department 2 $74,500 $58,838 $90,162 $149,000Wake Forest Police Department 2 $83,974 $75,676 $92,272 $167,948Rolesville Police Department 1 $65,139 $37,838 $27,301 $65,139
Sub-Total 26 $766,642 $912,274 $1,100,373 $2,012,647
Total Cost for SROs 59 $1,173,098 $940,654 $3,659,437 $4,600,091
Contract Security Security Dept. (Sal/Benefits)
Operational Expenses Total
High Schools $654,820 $0 $0 $654,820 Middle Schools $75,899 $0 $0 $75,899 Elementary Schools $87,739 $0 $0 $87,739 All Schools/Central Services $592,042 $685,074 $78,049 $1,355,165 Total WCPSS Cost (Non-SRO) $1,410,500 $685,074 $78,049 $2,173,623
Total Cost - All $6,773,714Total Cost - WCPSS $3,114,277Total Cost - County/Municipality $3,659,437
*includes personnel and operating costs
COST OF SROsMiddle Schools and One Elementary
High Schools
WCPSS COST - Non-SRO

Middle Schools Jurisdiction Law Enforcement Agency Funding Source
WCPSS Amount Funded
WCPSS Funding Source
High School/9th Grade Center Law Enforcement Agency Funding Source
WCPSS Amount Funded
WCPSS Funding Source
Carnage Middle School Raleigh Wake County Sheriff's Office Wake County $0 NA Wakefield 9th Grade Center Wake County Sheriff's Office WCPSS $37,838 StateCentennial Campus Middle School Raleigh Wake County Sheriff's Office Wake County $0 NA East Wake High School Wake County Sheriff's Office WCPSS $37,838 StateCarroll Middle School Raleigh Wake County Sheriff's Office Wake County $0 NA East Wake High School (2nd officer) Wake County Sheriff's Office Wake County $0 NADillard Drive Middle School Raleigh Wake County Sheriff's Office Wake County $0 NA Athens Drive High School Raleigh Police Department WCPSS $37,838 StateDaniels Middle School Raleigh Wake County Sheriff's Office Wake County $0 NA Broughton High School Raleigh Police Department WCPSS $37,838 StateDurant Road Middle School Raleigh Wake County Sheriff's Office Wake County $0 NA Enloe High School Raleigh Police Department WCPSS $37,838 StateEast Millbrook Middle School Raleigh Wake County Sheriff's Office Wake County $0 NA Leesville High School Raleigh Police Department WCPSS $37,838 StateEast Wake Middle School Raleigh Wake County Sheriff's Office Wake County $0 NA Longview/Mary Phillips High School Raleigh Police Department WCPSS $37,838 StateFuquay Varina Middle School Fuquay-Varina Wake County Sheriff's Office Wake County $0 NA Milbrook High School Raleigh Police Department WCPSS $37,838 StateHeritage Middle School Wake Forest Wake County Sheriff's Office Wake County $0 NA Sanderson High School Raleigh Police Department WCPSS $37,838 StateLigon Middle School Raleigh Wake County Sheriff's Office Wake County $0 NA Southeast Raleigh High School Raleigh Police Department WCPSS $37,838 StateLeesville Middle School Raleigh Wake County Sheriff's Office Wake County $0 NA Wakefield High School Raleigh Police Department WCPSS $37,838 StateMartin Middle School Raleigh Wake County Sheriff's Office Wake County $0 NA Apex High School Apex Police Department WCPSS $37,838 StateMoore Square Middle School Raleigh Wake County Sheriff's Office Wake County $0 NA Cary High School Cary Police Department WCPSS $37,838 StateWakefield Middle School Raleigh Wake County Sheriff's Office Wake County $0 NA Green Hope High School Cary Police Department WCPSS $37,838 StateWest Millbrook Middle School Raleigh Wake County Sheriff's Office Wake County $0 NA Middle Creek High School Cary Police Department WCPSS $37,838 StateWendell Middle School Wendell Wake County Sheriff's Office Wake County $0 NA Panther Creek High School Cary Police Department WCPSS $37,838 StateZebulon Middle School Zebulon Wake County Sheriff's Office Wake County $0 NA Fuquay-Varina High School Fuquay-Varina Police Department WCPSS $37,838 StateWake Forest Middle School Wake Forest Wake County Sheriff's Office Wake County $0 NA Knightdale High School Knightdale Police Department WCPSS $37,838 StateApex Middle School Apex Apex Police Department Apex $0 NA Garner High School Garner Police Department WCPSS $37,838 StateLufkin Road Middle School Apex Apex Police Department Apex $0 NA Garner High School (2nd Officer) Garner Police Department WCPSS (partial) $21,000 LocalSalem Middle School Apex Apex Police Department Apex $0 NA Holly Springs High School Holly Springs Police Department WCPSS $37,838 StateHolly Ridge Middle School Holly Springs Holly Springs Police Department WCPSS (partial) $9,460 Local Holly Springs High School (2nd Officer) Holly Springs Police Department WCPSS (partial) $21,000 LocalHolly Grove Middle School Holly Springs Holly Springs Police Department WCPSS (partial) $9,460 Local Wake Forest-Rolesville High School Wake Forest Police Department WCPSS $37,838 StateNorth Garner Middle School Garner Garner Police Department WCPSS (partial) $9,460 Local Heritage High School Wake Forest Police Department WCPSS $37,838 StateEast Garner Middle School Garner Garner Police Department Garner $0 NA Rolesville High School Rolesville Police Department WCPSS $37,838 StateDavis Drive Middle School Cary Cary Police Department Cary $0 NAEast Cary Middle School Cary Cary Police Department Cary $0 NAMills Park Middle School Cary Cary Police Department Cary $0 NAReedy Creek Middle School Cary Cary Police Department Cary $0 NAWest Cary Middle School Cary Cary Police Department Cary $0 NA4 Elementary Schools (shared) Holly Springs Holly Springs Police Department Holly Springs $0 NA
WCPSS has requested WCSO to provide an SRO at Rolesville Middle School in FY 2014, with the full cost covered by Wake County.
School Resource Officers by School, Law Enforcement Agency, with Funding by WCPSS
Middle Schools High School/9th Grade Centers
mlvenditto
Typewritten Text
Attachment 4
Attachment 5
Elementary Schools and Middle Schools With AlliedBarton Officers Elementary Bugg (part-time) Conn Fuller Hunter Poe Washington Middle Carnage Ligon Martin

2012-2013 Facility Utilization
Elementary Schools 104 378 74,900 579 (4,457) 74,256 71,160 101.0% 95.8% 17.7%
Middle Schools 33 65 36,616 207 (899) 38,352 34,505 96.6% 90.0% 13.2%
High Schools 25 68 38,822 349 (585) 44,171 43,435 113.6% 98.3% 18.4%
Special Schools 4 1 407 1 0 407 408 100.2% 100.2% 2.5%
Total 169 512 150,745 1,136 (5,941) 157,186 149,508 103.2% 95.1% 16.9%
Multi-Grade Schools 3
School LevelNumber of
Schools
Optimum Temporary
Classrooms
Long-Range School
Capacity (LRSCC)
Program Adjustment
Data included in school level totals
Percent Of Capacity in Temporary
Classrooms
Total Temporary
Classrooms
20th-Day Actual
Membership
LRSCC Percent
Crowding (Inc. Program Adjustment)
Annual School
Campus Capacity (ASCC)
ASCC Percent
Crowding
Attachment 6

Membership Projection By Grade Level
2012-2013
2013-2014
2014-2015
2015-2016
2016-2017
2017-2018
2018-2019
2019-2020
2020-2021
Elementary Membership
71,190 72,458 73,459 75,398 77,171 79,348 81,857 84,653
87,557
Middle Membership
34,631 35,572 36,399 36,360 36,992 37,666 38,968 39,836 40,715
High Membership
43,687 44,654 46,076 47,587 48,847 50,283 51,090 52,085 53,280
Total 149,508 152,684 155,934 159,345 163,010 167,297 171,915 176,574 181,552
Attachment 7

May 7, 2013
FUNDS AVAILABLE$43,800,000 Available from Spring 2013 County bond sale$10,000,000 Approximate additional savings in CIP 2006 not in $130M spending plan$53,800,000 Total available
NEEDSAthen Drive Stadium $4,952,281 Bid in spring 2015
Startup Design for additional schools $3,250,000 For 5 new elementary schools to open in 2016
Additional program management $942,000 (3 months at $314K per month which lasts thru 9/14)
Early start sitework for E20, E32, M8, H7, and H8 $13,200,000 Early package funding prior to primary funding from next bond
Property Acquisition $10,796,552 For 5 new elementary schools to open in 2016
Security $7,090,024 Critical needs only
Life Cycle Replacements $13,569,143
TOTAL $53,800,000
SPENDING PLAN FOR ADDITIONAL COUNTY FUNDING AND ADDITIONAL SAVINGS
mlvenditto
Typewritten Text
Attachment 8

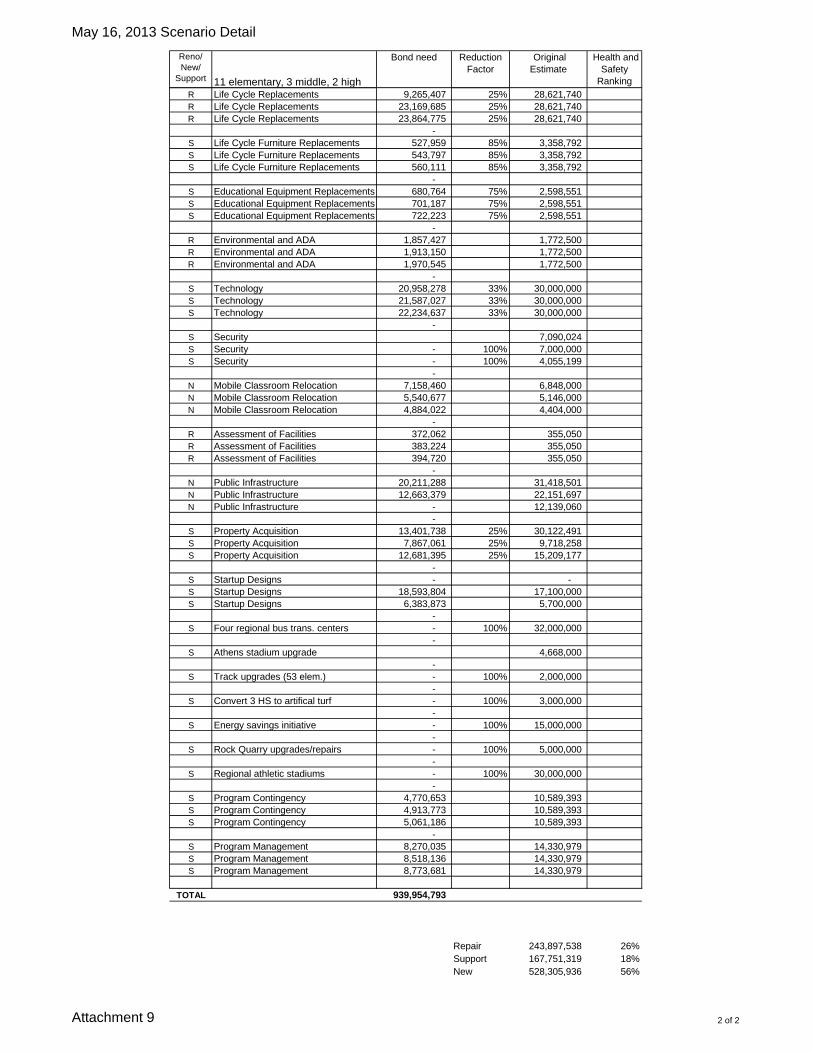
May 16, 2013 Scenario Detail
Attachment 9 1 of 2
Reno/New/
Support 11 elementary, 3 middle, 2 high
Bond need Reduction Factor
Original Estimate
Health and Safety
Ranking R Green Elem 22,720,503 22,202,072 4R Vandora Springs Elem 24,600,555 22,402,356 1R Lincoln Heights Elem 21,657,244 19,722,047 3R Brooks Elem 21,391,080 19,479,666 5R Garner High 67,075,342 61,081,780 6R Wiley Elem - 100% 12,374,350 8R Stough Elem 2,435,856 90% 21,535,905 12R East Wake Middle 4,185,349 90% 37,003,539 17R West Millbrook Middle - 100% 29,110,434 14R Apex High 5,085,445 90% 44,961,473 20R North Ridge Elem - 100% 21,209,575 15R Fuquay Varina High - 100% 60,339,809 25
- R East Garner Middle - 100% 16,505,471 7R Rolesville Elem 11,555,169 10,574,616 2R Cary High - 100% 29,664,947 16R Wendell Elem - 100% 14,204,650 13R Washington Elem - 100% 3,072,265 9R Broughton High - 100% 11,924,244 21R Fuller Elem - 100% 13,785,194 11R Swift Creek Elem - 100% 6,987,132 10R Conn Elem - 100% 10,541,736 24R Millbrook High - 100% 17,725,950 28R Hunter Elem - 100% 10,683,773 22R York Elem - 100% 9,660,274 23R Knightdale Elem - 100% 3,298,210 18R Fuquay Varina Middle - 100% 8,229,646 19R Sanderson High - 100% 6,697,003 27R Enloe High - 100% 26,781,053 26
- N Abbott's Creek Elementary 18,323,841 21,171,417 N Scott's Ridge Elementary 19,946,172 21,521,417 N New Elementary 21,068,514 20,421,417 N New Elementary 21,068,514 20,421,417 N New Elementary 21,068,514 20,421,417 N New Elementary 21,068,514 20,421,417 N New Elementary 21,720,069 20,421,417 N New Elementary - 100% 20,421,417 N New Elementary - 100% 20,421,417 N New Elementary - 100% 20,421,417 N New Elementary - 100% 20,421,417 N New Elementary - 100% 20,421,417 N New Elementary 22,370,069 20,421,417 N New Elementary 22,370,069 20,421,417 N New Elementary 22,370,069 20,421,417 N New Elementary 22,370,069 20,421,417 N New Elementary - 100% 20,421,417 N New Elementary - 100% 20,421,417 N New Elementary - 100% 20,421,417 N New Elementary - 100% 20,421,417 N New Elementary - 100% 20,421,417 N New Elementary - 100% 20,421,417 N New Elementary - 100% 20,421,417 N New Elementary - 100% 20,421,417 N New Elementary - 100% 20,421,417
- N M8 Small Middle 33,713,366 36,269,077 N New Large Middle 41,742,741 39,795,968 N New Large Middle 43,025,023 39,795,968 N New Large Middle - 100% 39,795,968 N New Large Middle - 100% 39,795,968 N New Large Middle - 100% 39,795,968
- N H7 High 63,493,196 65,718,960 N H8 High 62,129,371 65,718,960 N New High - 100% 65,718,960 N New High - 100% 65,718,960 N New High - 100% 65,718,960
-
May 16, 2013 Scenario Detail
Attachment 9 2 of 2
Reno/New/
Support 11 elementary, 3 middle, 2 high
Bond need Reduction Factor
Original Estimate
Health and Safety
Ranking R Life Cycle Replacements 9,265,407 25% 28,621,740 R Life Cycle Replacements 23,169,685 25% 28,621,740 R Life Cycle Replacements 23,864,775 25% 28,621,740
- S Life Cycle Furniture Replacements 527,959 85% 3,358,792 S Life Cycle Furniture Replacements 543,797 85% 3,358,792 S Life Cycle Furniture Replacements 560,111 85% 3,358,792
- S Educational Equipment Replacements 680,764 75% 2,598,551 S Educational Equipment Replacements 701,187 75% 2,598,551 S Educational Equipment Replacements 722,223 75% 2,598,551
- R Environmental and ADA 1,857,427 1,772,500 R Environmental and ADA 1,913,150 1,772,500 R Environmental and ADA 1,970,545 1,772,500
- S Technology 20,958,278 33% 30,000,000 S Technology 21,587,027 33% 30,000,000 S Technology 22,234,637 33% 30,000,000
- S Security 7,090,024 S Security - 100% 7,000,000 S Security - 100% 4,055,199
- N Mobile Classroom Relocation 7,158,460 6,848,000 N Mobile Classroom Relocation 5,540,677 5,146,000 N Mobile Classroom Relocation 4,884,022 4,404,000
- R Assessment of Facilities 372,062 355,050 R Assessment of Facilities 383,224 355,050 R Assessment of Facilities 394,720 355,050
- N Public Infrastructure 20,211,288 31,418,501 N Public Infrastructure 12,663,379 22,151,697 N Public Infrastructure - 12,139,060
- S Property Acquisition 13,401,738 25% 30,122,491 S Property Acquisition 7,867,061 25% 9,718,258 S Property Acquisition 12,681,395 25% 15,209,177
- S Startup Designs - - S Startup Designs 18,593,804 17,100,000 S Startup Designs 6,383,873 5,700,000
- S Four regional bus trans. centers - 100% 32,000,000
- S Athens stadium upgrade 4,668,000
- S Track upgrades (53 elem.) - 100% 2,000,000
- S Convert 3 HS to artifical turf - 100% 3,000,000
- S Energy savings initiative - 100% 15,000,000
- S Rock Quarry upgrades/repairs - 100% 5,000,000
- S Regional athletic stadiums - 100% 30,000,000
- S Program Contingency 4,770,653 10,589,393 S Program Contingency 4,913,773 10,589,393 S Program Contingency 5,061,186 10,589,393
- S Program Management 8,270,035 14,330,979 S Program Management 8,518,136 14,330,979 S Program Management 8,773,681 14,330,979
TOTAL 939,954,793
Repair 243,897,538 26%Support 167,751,319 18%New 528,305,936 56%

Attachment 10
Attachment 10

Attachment 10

Attachment 11
Academic Program
Student Assignment
Campus Bldg Cond
Health & Safety
Schools 15% 15% 35% 35% TOTALGreen Elem 2 2 2 3 2.4
Brooks Elem 10 6 1 4 4.2
Vandora Springs Elem 7 10 5 1 4.7
Stough Elem 8 4 3 7 5.3
Lincoln Heights Elem 5 1 11 2 5.5
Garner High 4 5 7 5 5.6
Wiley Elem 6 12 4 6 6.2
East Wake Middle 1 3 9 10 7.3
North Ridge Elem 9 9 6 9 8.0
West Millbrook Middle 12 7 8 8 8.5
Apex High 3 11 10 11 9.5
Fuquay Varina High 11 8 12 12 11.3
High PriorityMid PriorityLow Priority
CategoriesAcademic Program Suitability of building to desired educational programStudent Assignment Capacity increase potential, Optimum use of facilitiesBldg Condition Quality of roofing, plumbing, electrical, mechanical systems, code complianceHealth & Safety Indoor air quality (HVAC), lead paint, mold, and building safety systems
WHOLE CAMPUS
RANKINGS
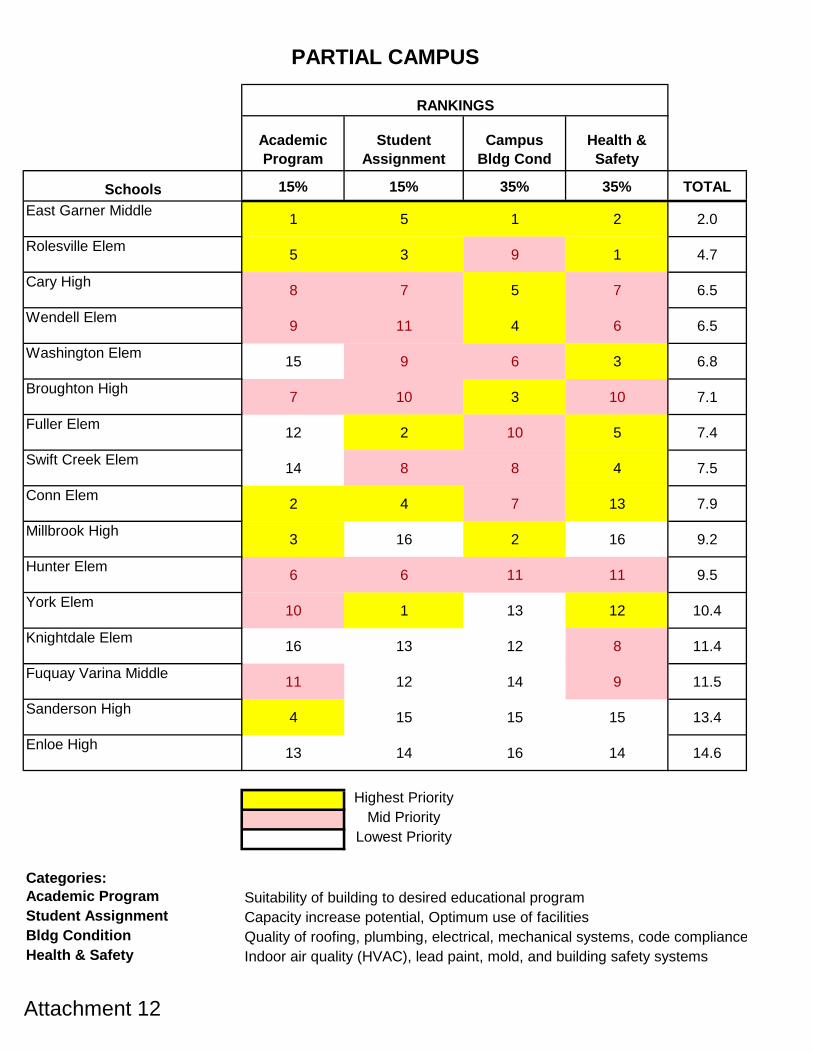
Attachment 12
Academic Program
Student Assignment
Campus Bldg Cond
Health & Safety
Schools 15% 15% 35% 35% TOTALEast Garner Middle 1 5 1 2 2.0
Rolesville Elem 5 3 9 1 4.7
Cary High 8 7 5 7 6.5
Wendell Elem 9 11 4 6 6.5
Washington Elem 15 9 6 3 6.8
Broughton High 7 10 3 10 7.1
Fuller Elem 12 2 10 5 7.4
Swift Creek Elem 14 8 8 4 7.5
Conn Elem 2 4 7 13 7.9
Millbrook High 3 16 2 16 9.2
Hunter Elem 6 6 11 11 9.5
York Elem 10 1 13 12 10.4
Knightdale Elem 16 13 12 8 11.4
Fuquay Varina Middle 11 12 14 9 11.5
Sanderson High 4 15 15 15 13.4
Enloe High 13 14 16 14 14.6
Highest PriorityMid Priority
Lowest Priority
Categories:Academic Program Suitability of building to desired educational programStudent Assignment Capacity increase potential, Optimum use of facilitiesBldg Condition Quality of roofing, plumbing, electrical, mechanical systems, code complianceHealth & Safety Indoor air quality (HVAC), lead paint, mold, and building safety systems
PARTIAL CAMPUS
RANKINGS
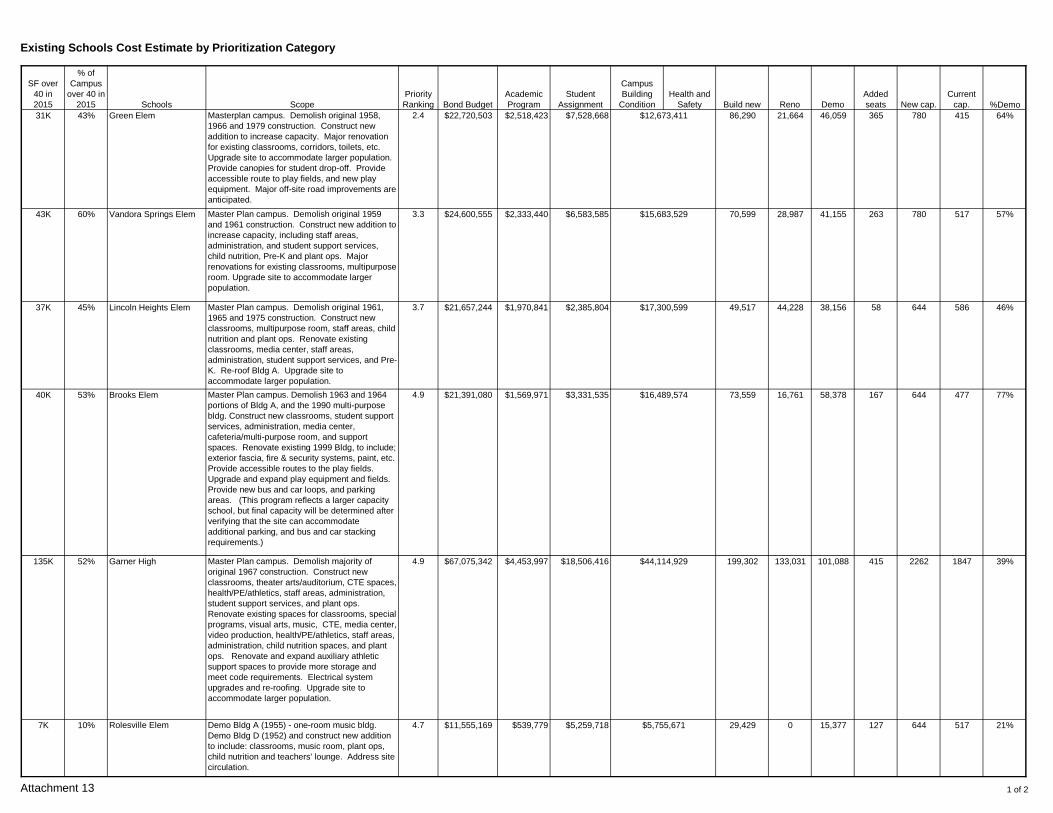
Existing Schools Cost Estimate by Prioritization Category
SF over
40 in
2015
% of
Campus
over 40 in
2015 Schools Scope
Priority
Ranking Bond Budget
Academic
Program
Student
Assignment
Campus
Building
Condition
Health and
Safety Build new Reno Demo
Added
seats New cap.
Current
cap. %Demo
31K 43% Green Elem Masterplan campus. Demolish original 1958,
1966 and 1979 construction. Construct new
addition to increase capacity. Major renovation
for existing classrooms, corridors, toilets, etc.
Upgrade site to accommodate larger population.
Provide canopies for student drop-off. Provide
accessible route to play fields, and new play
equipment. Major off-site road improvements are
anticipated.
2.4 $22,720,503 $2,518,423 $7,528,668 86,290 21,664 46,059 365 780 415 64%
43K 60% Vandora Springs Elem Master Plan campus. Demolish original 1959
and 1961 construction. Construct new addition to
increase capacity, including staff areas,
administration, and student support services,
child nutrition, Pre-K and plant ops. Major
renovations for existing classrooms, multipurpose
room. Upgrade site to accommodate larger
population.
3.3 $24,600,555 $2,333,440 $6,583,585 70,599 28,987 41,155 263 780 517 57%
37K 45% Lincoln Heights Elem Master Plan campus. Demolish original 1961,
1965 and 1975 construction. Construct new
classrooms, multipurpose room, staff areas, child
nutrition and plant ops. Renovate existing
classrooms, media center, staff areas,
administration, student support services, and Pre-
K. Re-roof Bldg A. Upgrade site to
accommodate larger population.
3.7 $21,657,244 $1,970,841 $2,385,804 49,517 44,228 38,156 58 644 586 46%
40K 53% Brooks Elem Master Plan campus. Demolish 1963 and 1964
portions of Bldg A, and the 1990 multi-purpose
bldg. Construct new classrooms, student support
services, administration, media center,
cafeteria/multi-purpose room, and support
spaces. Renovate existing 1999 Bldg, to include;
exterior fascia, fire & security systems, paint, etc.
Provide accessible routes to the play fields.
Upgrade and expand play equipment and fields.
Provide new bus and car loops, and parking
areas. (This program reflects a larger capacity
school, but final capacity will be determined after
verifying that the site can accommodate
additional parking, and bus and car stacking
requirements.)
4.9 $21,391,080 $1,569,971 $3,331,535 73,559 16,761 58,378 167 644 477 77%
135K 52% Garner High Master Plan campus. Demolish majority of
original 1967 construction. Construct new
classrooms, theater arts/auditorium, CTE spaces,
health/PE/athletics, staff areas, administration,
student support services, and plant ops.
Renovate existing spaces for classrooms, special
programs, visual arts, music, CTE, media center,
video production, health/PE/athletics, staff areas,
administration, child nutrition spaces, and plant
ops. Renovate and expand auxiliary athletic
support spaces to provide more storage and
meet code requirements. Electrical system
upgrades and re-roofing. Upgrade site to
accommodate larger population.
4.9 $67,075,342 $4,453,997 $18,506,416 199,302 133,031 101,088 415 2262 1847 39%
7K 10% Rolesville Elem Demo Bldg A (1955) - one-room music bldg.
Demo Bldg D (1952) and construct new addition
to include: classrooms, music room, plant ops,
child nutrition and teachers' lounge. Address site
circulation.
4.7 $11,555,169 $539,779 $5,259,718 29,429 0 15,377 127 644 517 21%$5,755,671
$12,673,411
$15,683,529
$17,300,599
$16,489,574
$44,114,929
Attachment 13 1 of 2

Existing Schools Cost Estimate by Prioritization Category
SF over
40 in
2015
% of
Campus
over 40 in
2015 Schools Scope
Priority
Ranking Bond Budget
Academic
Program
Student
Assignment
Campus
Building
Condition
Health and
Safety Build new Reno Demo
Added
seats New cap.
Current
cap. %Demo
35K 51% Stough Elem Master plan campus. Demolish original 1968
bldg. Construct new addition to increase
capacity. Renovate existing B Buildings for K
and 1st grade classrooms. Renovate art, music
and self-contained suite. Upgrade toilets and
provide for ADA compliance. Construct new
classrooms, administration, student support
services, dining and multipurpose room, media
center, plant ops and Pre-K classroom. Upgrade
site to accommodate larger population. Provide
canopies for student drop-off. Provide accessible
route to play fields, and new play equipment.
6.7 $2,435,856 $158,799 $841,961 79,222 27,756 39,666 378 780 402 59%
0 0% East Wake Middle Master Plan campus. Construct new addition to
increase capacity. New construction to include:
classrooms, gymnasium, staff areas,
administration and student support services.
Renovate existing space for new cafetorium.
Renovate existing classrooms, CTE spaces,
media center, child nutrition, aux. gym and group
toilets. Electrical system upgrades and re-
roofing. Increase security by providing interior
circulation to connect all parts of campus.
Upgrade site to accommodate larger population.
6.9 $4,185,349 $384,671 $1,334,104 73,529 135,945 0 429 1280 851 0%
108K 44% Apex High Master Plan campus. Demolish approx. 33,000
square feet of original 1975 construction.
Construct new additions to include: new
classrooms, theater arts/auditorium, CTE, staff
spaces, administration, student support services,
child nutrition, aux. athletics spaces, and plant
ops. Renovate existing spaces to provide
classrooms, media center expansion,
health/PE/athletics, staff spaces, administration,
and child nutrition expansion. Upgrade HVAC
and fire alarm system. Provide ADA upgrades
for stadium. Upgrade site to accommodate
larger population.
9.5 $5,085,445 $533,178 $1,561,803 135,036 162,050 33,111 623 2262 1639 13%
Percentage breakout by category 8% 26%
$1,435,096
$2,466,574
$2,990,464
66%
Attachment 13 2 of 2

Attachment 14
Fully Funded
Green (A) 2015-16 Sw @Spring Forest Modular
Rolesville ES 2015-16 Phased
Vandora Spgs 2015-17 Phased
Lincoln Heights 2016-18 Phased
Brooks (B) 2016-17 Sw @Spring Forest Modular
Garner HS 2016-17 Sw @H-8 + phased
Funds Needed in Future Bond
Stough (C) 2017-18 Sw @Spring Forest Modular
E Wake MS 2017-18 Sw @M-13
Apex HS 2017-18 Sw @H-7 + phased
Wiley 2018-19 Phased
North Ridge (D) 2018-19 Sw @Spring Forest Modular
West Millbrook 2018-20 Phased
Fuquay-Varina HS 2019-20 Sw @H-13 + phased
School Phased or Swing Space (Sw)

New School vs. Renovation ExamplesNew New New Garner Brooks Vandora Rolesville Green Lincoln Heights
Elementary Middle High High Elem Elem Elem Elem ElemItem Budget Budget Budget Budget Budget Budget Budget Budget Budget
Construction/ GMP for new construction 12,210,943 24,951,027 39,584,340 23,800,678 8,642,384 8,141,469 3,476,549 10,096,381 5,785,671Design/Precon Size and cost/sf (105,000 @ 116.29) (200,[email protected]) (335,[email protected]) (199,[email protected]) (77,559 @ 117.49) (70,366 @ 115.70) (29,[email protected]) (86,290 @ 117.00) (49,517 @ 116.42)
Premium @ 17% 0 4,046,115 1,469,206 1,384,050 591,013 1,716,384 983,564Demolition 0 833,001 374,165 310,180 71,272 337,448 359,072
Renovation/Lifecycle/Lead Paint/Phasing 0 10,035,813 1,281,510 2,457,015 3,337,208 1,598,017 3,801,871Sitework 3,106,449 5,728,314 11,498,558 8,375,555 3,106,449 3,106,449 870,676 3,106,449 3,106,449
Owner's contingency (5% new, 10% reno) 765,870 1,533,967 2,554,145 4,709,116 1,487,371 1,539,916 834,672 1,685,468 1,403,663Design/Precon/Reimbursables (2% more for reno) 1,059,226 2,088,475 3,455,514 4,153,437 1,334,410 1,380,387 763,297 1,507,744 1,261,165
SUBTOTAL: 17,142,488 34,301,783 57,092,557 55,953,715 17,695,495 18,319,466 9,944,687 20,047,891 16,701,455
Land Surveying 45,000 70,000 85,000 100,000 60,000 60,000 40,000 60,000 60,000Conslt./ Geotechnical 15,000 25,000 45,000 30,000 10,000 10,000 10,000 10,000 10,000Various Permit Fees to be reallocated to Wake County 115,000 200,000 250,000 225,000 64,932 67,185 35,248 74,863 64,760Vendors Utilities Costs/Fees 35,000 50,000 65,000 50,000 25,000 25,000 10,000 25,000 25,000
Materials Testing/Insp. 200,000 300,000 400,000 350,000 190,000 190,000 100,000 190,000 170,000Misc. Construction Exp. 49,522 167,609 176,658 186,823 21,911 32,898 13,420 61,502 21,156
Asbestos/Environmental 0 0 721,977 47,258 71,446 756 12,009 1,079Commissioning 75,705 144,200 241,535 264,660 65,121 71,698 21,219 77,835 67,590
Moving 0 385,827 123,829 115,594 25,341 112,064 135,769Swing Space 0 0 1,944,640 0 0 1,215,400SUBTOTAL: 535,227 956,809 1,263,193 2,314,287 608,051 2,588,461 255,984 623,273 1,770,754
Project Furniture (including freestanding media furniture) 753,916 1,400,600 2,026,554 1,823,898 530,321 678,524 205,836 678,524 530,321Specific Media Center Equipment 25,214 35,265 36,771 36,771 25,214 25,214 0 25,214 25,214Items Custodial Equipment 37,018 67,190 101,613 50,807 18,326 18,509 0 18,509 18,326
Operational & Program Equipment 1,237,323 2,274,344 4,023,022 471,899 214,981 352,769 60,785 355,100 325,186Playground Equipment (if elementary) 221,450 221,450 221,450 0 221,450 221,450
Technology 94,554 165,637 237,930 237,930 94,554 94,554 49,440 94,554 94,554Child Nutrition 17,078 30,666 35,754 32,179 15,370 15,370 15,370 15,370 15,370Library Books 357,151 563,673 901,565 160,294 55,903 88,039 42,513 122,184 19,416SUBTOTAL: 2,743,704 4,537,375 7,363,209 2,813,778 1,176,119 1,494,429 373,944 1,530,905 1,249,837
PROJECT COSTS: 20,421,419 39,795,967 65,718,959 61,081,780 19,479,665 22,402,356 10,574,615 22,202,069 19,722,046
Public Improvements 1,324,618 3,028,260 3,028,260 381,785 381,785 381,785 381,785 381,785 381,785Average Land Cost 1,810,400 2,715,600 5,793,280 0 0 0 0 0 0
TOTAL PROJECT COSTS: 23,556,437 45,539,827 74,540,499 61,463,565 19,861,450 22,784,141 10,956,400 22,583,854 20,103,831
Attachment 15

Attachment 16
Unfunded Life Cycle Needs
Build
ing
Elem
ents
Dem
oliti
onCo
mm
erci
al E
quip
men
tCo
mm
unic
atio
n &
Sec
urity
Sys
tem
s
Cont
rols
& In
stru
men
tatio
nCo
olin
g G
ener
atin
g Sy
stem
sDi
strib
utio
n Sy
stem
sDo
mes
tic W
ater
Dis
tribu
tion
Elec
trica
l Ser
vice
& D
istri
butio
nEl
evat
ors
Exte
rior D
oors
Exte
rior W
alls
Exte
rior W
indo
ws
Fire
Pro
tect
ion
Spec
ialti
esFi
xed
Furn
ishi
ngs
Floo
r Fin
ishe
sHa
zard
ous
Com
pone
nts
Aba
tem
ent
Heat
Gen
erat
ing
Syst
ems
Inte
rior D
oors
Land
scap
ing
Ligh
ting
& Br
anch
Wiri
ngPa
rkin
g Lo
tsPa
rtitio
nsPe
dest
rian
Pavi
ngPl
umbi
ng F
ixtu
res
Rain
wat
er D
rain
age
Road
way
sRo
of C
over
ings
Sani
tary
Was
teSi
gnag
eSi
te D
evel
opm
ent
Soffi
t & F
asci
aSp
ecia
l con
stru
ctio
nSp
ecia
l Ele
ctric
al S
yste
ms
Spec
ial F
ire P
rote
ctio
n Sy
stem
sSp
ecia
l Plu
mbi
ng S
yste
ms
Spec
ialit
ies
Stai
r Fin
ishe
sSt
orm
Sew
er S
yste
ms
Wal
l Fin
ishe
sW
ater
Sup
ply
& Di
strib
utio
n Sy
stem
s
Adams Elementary School 2 1 1 1Apex Elementary School 1 1 1 1Apex High School 1 1 1 4 5 2 7 2 1 11 5 4 5 3 5 4 109 9Apex Middle School 1 2 1 2 1 2 2Athens Drive High School 1 4 1 1 1 1 1 3 1 1Aversboro Elementary School 1Baileywick Elementary School 2 1 1 1Ballentine Elementary School 1 1Banks Road Elementary School 1 1Barwell Road Elementary School 5Baucom Elementary School 1 2 1 3Brassfield Elementary School 2 1 1 4 2 2 1 3 1Brentwood Elementary School 1 1 5 4 3 3Briarcliff Elementary School 6 7 3 1 2 5 8 7 1 1 24 4Brier Creek Elementary School 4Brooks Elementary School 1 1 1 3 2 3 5 5 1 2 13 1 1 8 1 29 2 6Broughton High School 2 2 1 3 1 1 6 1 3 6 1 3Bugg Elementary School 1Carnage Middle School 1 1 1 3 4 1Carpenter Elementary School 1Carroll Middle School 1 1 2 1Carver Elementary School 2 1 3 1Cary Elementary School 1 2 1Cary High School 1 5 5 1 6 2 1Cedar Fork Elementary School 1 1 1Centennial Campus Middle School 2 1 2 1 1Central Services/Rock Quarry Rd. 1 4 4 1 5Combs Elementary School 2 1 1 1 1Conn Elementary School 1 1 1 1 3 3 1 1 1 2Creech Road Elementary School 1 1 3 1 1 1Daniels Middle School 1 1 3 2 1Davis Drive Elementary School 1 1 1 1Davis Drive Middle School 1 1 1 4 1Dillard Drive Elementary School 1 2 1 1Dillard Drive Middle School 2 1 2 2 1 1Douglas Elementary School 1 3 1 1 1Durant Road Elementary School 1 1 1 1 2 1 1 1Durant Road Middle School 1 2 2 1East Cary Middle School 5 1 1 2East Garner Middle School 5 1 1 1 1 2 2 2 1 12 7 2 2 1 3 6 1 1 35 5East Millbrook Middle School 1 1East Wake High School 1 1 1 1East Wake Middle School 3 3 3 6 1 1 7 3 4 1 3 57 3Enloe High School 1 2 1 12 1 3 1 1 5Farmington Woods Elementary School 1 1 7 3 1 1Forest Pines Drive Elementary School 2Forestville Elementary School 2 1Fox Road Elementary School 1 3 1 1 2 1 1 2 1 2Fuller Elementary School 1 2 1 1 1 1 1 3 7 4 4 25 1
Unfunded Life Cycle Needs
As of Dec. 2012
Whole Campus-Dark Gray Partial Campus-Light Gray

Attachment 16
Unfunded Life Cycle Needs
Build
ing
Elem
ents
Dem
oliti
onCo
mm
erci
al E
quip
men
tCo
mm
unic
atio
n &
Sec
urity
Sys
tem
s
Cont
rols
& In
stru
men
tatio
nCo
olin
g G
ener
atin
g Sy
stem
sDi
strib
utio
n Sy
stem
sDo
mes
tic W
ater
Dis
tribu
tion
Elec
trica
l Ser
vice
& D
istri
butio
nEl
evat
ors
Exte
rior D
oors
Exte
rior W
alls
Exte
rior W
indo
ws
Fire
Pro
tect
ion
Spec
ialti
esFi
xed
Furn
ishi
ngs
Floo
r Fin
ishe
sHa
zard
ous
Com
pone
nts
Aba
tem
ent
Heat
Gen
erat
ing
Syst
ems
Inte
rior D
oors
Land
scap
ing
Ligh
ting
& Br
anch
Wiri
ngPa
rkin
g Lo
tsPa
rtitio
nsPe
dest
rian
Pavi
ngPl
umbi
ng F
ixtu
res
Rain
wat
er D
rain
age
Road
way
sRo
of C
over
ings
Sani
tary
Was
teSi
gnag
eSi
te D
evel
opm
ent
Soffi
t & F
asci
aSp
ecia
l con
stru
ctio
nSp
ecia
l Ele
ctric
al S
yste
ms
Spec
ial F
ire P
rote
ctio
n Sy
stem
sSp
ecia
l Plu
mbi
ng S
yste
ms
Spec
ialit
ies
Stai
r Fin
ishe
sSt
orm
Sew
er S
yste
ms
Wal
l Fin
ishe
sW
ater
Sup
ply
& Di
strib
utio
n Sy
stem
s
Unfunded Life Cycle Needs
As of Dec. 2012
Whole Campus-Dark Gray Partial Campus-Light Gray
Fuquay-Varina Elementary School 1 1 2 1Fuquay-Varina High School 1 4 1 1 1 1 8 3 1 1 3 1 5 4 2 2 83 4Fuquay-Varina Middle School 1 1 1 2 4 2 1Garner High School 2 2 5 1 6 1 2 11 6 2 19 11 3 5 3 4 1 1 1 1 1 91 10Green Elementary School 1 1 4 2 2 1 5 1 1 2 2 5 23 1 2 1 3 103 2Green Hope Elementary School 2 3 3 12 1Green Hope High School 2 2 6 1Harris Creek Elementary School 6 4Heritage Elementary School 2 1 1Heritage Middle School 4 2 1Highcroft Drive Elementary School 4 1Hilburn Drive Elementary School 1 2 2 2 1 1Hodge Road Elementary School 1 4 6 1Holly Ridge Elementary School 1 1 1Holly Ridge Middle School 1 1 1Holly Springs Elementary School 2 1 1Hunter Elementary School 1 1 2 1 5 2 1 1 1Jeffreys Grove Elementary School 1 1 1 1 1Jones Dairy Elementary School 1 1 3 1 1 1Joyner Elementary School 1 1 2 1 2Kingswood Elementary School 1Knightdale Elementary School 1 1 1 2 2 1 2Knightdale High School 2 1Laurel Park Elementary School 1Lead Mine Elementary School 3 1 1 1 2 1 3 3 1Leesville Road Elementary School 1 1 1 1Leesville Road High School 1 1 5 1 2 1Leesville Road Middle School 1 1 1 3 2 1 1 1Ligon Middle School 7 1 2Lincoln Heights Elementary School 2 1 4 3 9 2 2 10 1 2 2 8 1 2 54 6Lockhart Elementary School 1 5 10 1 1 1 1 42 1 8 34 7Lufkin Road Middle School 1Lynn Road Elementary School 1 3 2 1Martin Middle School 1 1 1Mary E. Phillips High School School 1 1Middle Creek Elementary School 2 1 1Middle Creek High School 1 1 3 1Millbrook Elementary School 3 3 1 1Millbrook High School 4 2 1 9 6 1 8 1 8Moore Square Middle School 1 1 1Morrisville Elementary School 3 1 1 3 1 2 1Mt. Vernon School 1Noble Rd. 1North Forest Pines Elementary School 1North Garner Middle School 3 1 1 3 1 2North Ridge Elementary School 1 3 3 8 5 1 1 9 8 5 6 2 1 72 5Northwoods Elementary School 1 2 2 1 1 1Oak Grove Elementary School 1 1 1 1 1 1

Attachment 16
Unfunded Life Cycle Needs
Build
ing
Elem
ents
Dem
oliti
onCo
mm
erci
al E
quip
men
tCo
mm
unic
atio
n &
Sec
urity
Sys
tem
s
Cont
rols
& In
stru
men
tatio
nCo
olin
g G
ener
atin
g Sy
stem
sDi
strib
utio
n Sy
stem
sDo
mes
tic W
ater
Dis
tribu
tion
Elec
trica
l Ser
vice
& D
istri
butio
nEl
evat
ors
Exte
rior D
oors
Exte
rior W
alls
Exte
rior W
indo
ws
Fire
Pro
tect
ion
Spec
ialti
esFi
xed
Furn
ishi
ngs
Floo
r Fin
ishe
sHa
zard
ous
Com
pone
nts
Aba
tem
ent
Heat
Gen
erat
ing
Syst
ems
Inte
rior D
oors
Land
scap
ing
Ligh
ting
& Br
anch
Wiri
ngPa
rkin
g Lo
tsPa
rtitio
nsPe
dest
rian
Pavi
ngPl
umbi
ng F
ixtu
res
Rain
wat
er D
rain
age
Road
way
sRo
of C
over
ings
Sani
tary
Was
teSi
gnag
eSi
te D
evel
opm
ent
Soffi
t & F
asci
aSp
ecia
l con
stru
ctio
nSp
ecia
l Ele
ctric
al S
yste
ms
Spec
ial F
ire P
rote
ctio
n Sy
stem
sSp
ecia
l Plu
mbi
ng S
yste
ms
Spec
ialit
ies
Stai
r Fin
ishe
sSt
orm
Sew
er S
yste
ms
Wal
l Fin
ishe
sW
ater
Sup
ply
& Di
strib
utio
n Sy
stem
s
Unfunded Life Cycle Needs
As of Dec. 2012
Whole Campus-Dark Gray Partial Campus-Light Gray
Olds Elementary School 1 1 2 1 1Olive Chapel Elementary School 1 1 1Panther Creek High School 2 1Partnership Elementary School 1 1 1 1 1Penny Road Elementary School 3 2 1 3 1Pleasant Union Elementary School 1 1 1 1 1 1 1Poe Elementary School 1Powell Elementary School 2 1 1 1 1 1Project Enlightenment 1Rand Road Elementary School 3 1 1 1 3 1 3 1 1Reedy Creek Elementary School 2 1 1River Oaks Middle School 1 1Rolesville Elementary School 2 1 8 2 3 6 3 8 2 27 29 6Salem Elementary School 1 1 1Salem Middle School 1Sanderson High School 1 2 2 1 1 1Southeast Raleigh High School 1 2 3 1 1 1Stough Elementary School 2 2 2 1 3 2 1 6 1 1 2 4 5 1 3 1 17 1Swift Creek Elementary School 3 1 3 1 4 3 1 1 3Timber Drive Elementary School 1 2 2 1 1 1Turner Creek Elementary School 1 1Underwood Elementary School 1 1 1Vance Elementary School 1 1 3 1 2 1 1 1Vandora Springs Elementary School 1 1 2 2 1 1 2 2 7 1 1 5 1 6 12 1 3 1 14 1 4 1Wake Forest Elementary School 1 2 2 1Wake Forest-Rolesville High School 3Wake Forest-Rolesville Middle School 1 1 1 1 4Wakefield Elementary School 5 1 1Wakefield High School 2 4 1Wakefield Middle School 2 7 1Wakelon Elementary School 3Walnut Creek Elementary School 1Washington Elementary School 1 1 1 1 3 1 1 2Weatherstone Elementary School 1 2 1 1 1 1Wendell Elementary School 1 1 4 1 1 6 1 3 1 3 1West Cary Middle School 1 4 1 1 3West Lake Elementary School 1 1 5 1 1 1 1West Lake Middle School 1 11 2 1 1West Millbrook Middle School 1 1 1 8 1 18 10 4 1 24 12 4 1 106 9Wildwood Forest Elementary School 1 3 1 1Wiley Elementary School 5 1 2 1 1 4 1 1 4 1 2 1 7 1 1 21 3Willow Springs Elementary School 2 2 1 1Yates Mill Elementary School 3 2 1 1York Elementary School 3 1 2 1 1Zebulon Elementary School 1 1 2 1Zebulon Middle School 1 1 1 1 1 3 2 4 17 4 1 106 1

CIP 2013: WCPSS Security Summary Description
Attachment 17
Complete Project: Reduced Needs: Priority Needs: Critical Needs:
A CCTV System Upgrade: All camera systems are brought up to security standards for minimum number of cameras per type of facility. All camera systems in middle schools and high schools are
provided/upgraded to enterprize IP camera systems. Camera systems are utilized most at the middle and high
school level. Footage is typically needed for security investigations at this level. An enterprize system will give
the security department greater ability to provide this footage. System Standards: Elementary Schools - 16
cameras minimum, Middle Schools - 32 cameras minimum, High Schools - 64 cameras minimum.
All camera systems are brought up to security standards for minimum number of cameras per type of facility. All new camera systems will be
enterprize IP camera systems. System Standards: Elementary Schools - 16
cameras minimum, Middle Schools - 32 cameras minimum, High Schools - 64 cameras minimum.
Facilities have been assessed via the attached scoring matrix.
B Access Control: Elementary and High schools receive uniform enterprize card access systems. Elementary schools are a priority to receive this system in order to give greater ability to lock down schools in emergency situations, control access of
staff and visitors in the building, and provide secure access to outdoor facilites. High schools receive the ability to control staff, student, and visitor access by securing all
exterior doors throughout the school day thus influencing pedestrian traffic. In addition the school receives greater access control for all extracurriculars. System standards:
Elementary Schools have access on 8 doors, Middle Schools have access control on 10 doors, High Schools have access control on 12 doors.
Elementary schools receive uniform enterprize card access systems. Elementary schools are a
priority to receive this system in order to give greater ability to lock down schools in emergency situations, control access of staff and visitors in
the building, and provide secure access to outdoor facilites.
System standards: Elementary Schools have access control on 8
doors, Middle Schools have access control on 10 doors, High Schools have access control on 12 doors. Facilities have been assessed via the priority
scoring matrix.
C Area Notification: (Public Address Systems/Intercoms)
Provide IP access to intercom systems at all schools. Gives access to security to perform
mass notification from a central location.
D Visitor Management: Provide a visitor management system at all schools that tie
back to a central location. This will give the security
department the ability to limit access at multiple facilites as well as perform analytics and background checks on people who are accessing WCPSS
facilities.
E Entrance Buzzer System:
All camera systems are brought up to security standards for minimum number of cameras per type of facility. All camera systems are provided/upgraded to
enterprize IP camera systems. System Standards:
Elementary Schools - 16 cameras minimum, MIddle Schools - 32 cameras minimum, High Schools - 64 cameras minimum.
All schools receive uniform enterprize card access systems. System standards:
Elementary Schools have access on 8 doors, Middle Schools have access control on 10 doors, High Schools have access control on 12 doors.
------------------------------------------------------ Area notification is not provided. ------------------------------------------------------
---------------------------------------------------- Visitor Management is not provided. ----------------------------------------------------
Elementary schools receive uniform entrance access system. System shall provide the ability to acknowledge visitors to the building and to see and communicate with them before granting access to the building.
System includes a closed circuit camera, intercom, and electronic door lock. One system shall be provided to each facility for their main visitor access location.

Attachment 18
SUPPORT AND ATHLETIC FACILITIES
Four Regional Bus Transportation Centers approx $8M each Deferred from Last Bond; currently have two sites acquired
Additional Maintenance Capacity Needed/Efficiency Gains Athens Stadium Upgrades $500K- $4.4M ADA issues/Program shortfalls Elementary School Tracks (53 schools need track upgrades) $2M Schools that do not have a track or the track lacks suitable surface Convert 3 High Schools with Limited Outdoor Program to Artificial Turf $2-3M Allows more PE, athletic and non-athletic programs on same field Energy Savings Initiatives $5-15M Alternative to Performance Contracting Rock Quarry Industrial Complex Upgrades and Repairs (22 yrs Old) >$5M HVAC, Roof, Bus maintenance and Purchasing warehouse capacity increase Regional Athletic Stadium or Complex $10-30M Basketball/Volleyball Baseball/Softball Football/Soccer/Lacrosse Tennis/Track and Field Band Performances/Competition Cary HS /Apex HS/Garner HS/Fuquay HS/Athens HS Stadium (Major Renovations) Add missing programs to tight school sites and reduce cost of major renovations West Apex HS/H7/H8/H13/+2 Reduce cost of new HS construction Regional Bus Transportation Center Reduce cost of Transportation Center construction Joint Use and Maintenance with Municipality Reduce cost of Regional Complex construction and maintenance

mlvenditto
Typewritten Text
mlvenditto
Typewritten Text
mlvenditto
Typewritten Text
mlvenditto
Typewritten Text
mlvenditto
Typewritten Text
mlvenditto
Typewritten Text
CIP 2006 Plan for Referendum
mlvenditto
Typewritten Text
Attachment 19