Johnson Electric Holdings Limited Annual Report 2015
167
(Stock Code: 179) Johnson Electric Holdings Limited Annual Report 2015
Transcript of Johnson Electric Holdings Limited Annual Report 2015

(Stock Code: 179)
Johnson Electric Holdings Limited12 Science Park East Avenue, 6/F
Hong Kong Science ParkShatin, New Territories
Hong KongTel: (852) 2663 6688 Fax: (852) 2897 2054
www.johnsonelectric.com
Johnson Electric H
oldings Limited A
nnual Report 2015
Johnson Electric Holdings LimitedAnnual Report 2015

1
REPORT FOR THE YEAR ENDED31 MARCH 2015
CONTENTS
LETTER TO SHAREHOLDERS 2
JOHNSON ELECTRIC SOLUTIONS 6
MANAGEMENT’S DISCUSSION AND ANALYSIS 13
CORPORATE GOVERNANCE REPORT 33
REPORT OF THE DIRECTORS 47
FINAL DIVIDEND 56
CLOSING REGISTER OF SHAREHOLDERS 56
STATEMENT OF ACCOUNTS 57
JOHNSON ELECTRIC GROUP TEN-YEAR SUMMARY 156
PROFILE OF DIRECTORS AND SENIOR MANAGEMENT 158
CHANGES IN INFORMATION OF DIRECTORS 164
CORPORATE AND SHAREHOLDER INFORMATION 165
HIGHLIGHTS
● For the financial year ended 31st March 2015, total sales amounted to US$2,136 million – an increase of 2% compared to the prior financial year. Excluding the effects of foreign currency changes, underlying sales increased by 4%
● Gross profit margins slightly increased to 29.6% from 29.5% in the prior year
● EBITDA totalled US$336 million – up 4%
● Operating profit increased by 4% to US$243 million or 11.4% of sales
● Net profit attributable to shareholders increased 1% to a record US$211 million
● Basic earnings per share increased by 3% to 24.11 US Cents
● The Group’s gearing level remained low with a total debt to capital ratio of 13%
Profit Attributable to Shareholders Free Cash Flow from Operations to Debt
0
20
40
60
80
100
120
140
160
180
200
220
182 187 191
208 211
US$ million
FY2010/11 FY2011/12 FY2012/13 FY2013/14 FY2014/150
20
40
60
80
100
120
140
160
180
200
54%
81%90%
53%
198%
FY2010/11 FY2011/12 FY2012/13 FY2013/14 FY2014/15
%

2Johnson Electric Holdings Limited
Annual Report 2015
LETTER TO SHAREHOLDERS
Johnson Electric delivered record profits for the financial year 2014/15 against a backdrop of uneven global economic conditions and dramatic foreign exchange rate movements.
Notwithstanding this unpredictable operating environment, Johnson Electric continued to make very satisfactory progress in all of the key elements of its strategy. The on-going expansion of our global operating footprint has been welcomed by customers seeking increased in-region responsiveness and shorter delivery times. And our focus on bringing innovative technology solutions to the most difficult electro-mechanical problems is resulting in a series of new business wins that are set to underpin healthy long-term growth.
Patrick Shui-Chung Wang JP
Chairman and Chief Executive

LETTER TO SHAREHOLDERS
3
HIGHLIGHTS OF 2014/15 RESULTS
• For the financial year ended 31st March 2015, total sales amounted to US$2,136 million – an increase of 2% compared to the prior financial year. Excluding the effects of foreign currency changes, underlying sales increased by 4%
• Gross profit margins slightly increased to 29.6% from 29.5% in the prior year
• EBITDA totalled US$336 million – up 4%
• Operating profit increased by 4% to US$243 million or 11.4% of sales
• Net profit attributable to shareholders increased 1% to a record US$211 million
• Basic earnings per share increased by 3% to 24.11 US Cents
• The Group’s gearing level remained low with a total debt to capital ratio of 13%
DIVIDENDS
The Board has previously stated its intention to increase gradually the ratio of interim dividends such that it represents approximately one-third of the prior financial year’s total dividends paid. The interim dividend paid in January 2015 was consequently increased by 17% to 14 HK Cents per share. For the final dividend, the Board is recommending 34 HK Cents per share (FY2013/14: 34 HK Cents per share). Subject to the performance of the Group in the first half of the 2015/16 financial year and taking into account its overall financial condition and prospects at the time, the Board intends to give consideration to a further increase in the 2015/16 interim dividend.
SALES PERFORMANCE
A generally solid overall sales performance was partially offset by the significant movements in foreign exchange rates during the year. Before the effects of currency changes, underlying sales grew by 4% compared to the prior year. After currency changes, particularly the lower average exchange rate for the Euro against the US Dollar, Group sales increased by 2% to US$2,136 million.
The Automotive Products Group (“APG”), the largest operating division, achieved sales of US$1,458 million. Excluding currency effects, which reduced sales by US$44 million, APG’s sales increased by 4%.
Strong performance by the Engine & Transmission and Powertrain Cooling business units reflected Johnson Electric’s industry leading technologies in these segments where the focus of customers is on solutions that improve fuel economy and reduce emissions. On a geographic basis, European sales benefited from the first overall increase in car registrations in the region in seven years, but Euro denominated sales were negatively affected upon

4Johnson Electric Holdings Limited
Annual Report 2015
translation into US Dollars. In Asia, APG performed strongly despite the slowdown in China vehicle sales growth from the exceptional levels seen in recent years. The only area of disappointment for APG has been in the Americas region, which is the division’s smallest major regional market in terms of direct sales. Partly as a result of certain programmes ending over the past two years, we have yet to benefit from the strong recovery of the US auto industry. However, with the establishment of our Mexico manufacturing facilities, we see a major opportunity for the Group to grow its presence and market share in the region.
The Industry Products Group (“IPG”) reported a 3% increase in sales (up 4% in constant currency terms) to US$679 million. This compares to a 4% decline in the prior year and marks an important shift in the trajectory and competitive position of the division. Solenoid Actuators, Parlex and JE MedTech were the standout performers for IPG during the year. These business units exemplify our strategy of investing in differentiated technology and serving customers whose flagship products require customised motion solutions.
SUSTAINING HEALTHY PROFITABILITY ANDBALANCE SHEET STRENGTH
Gross profit margins slightly increased to 29.6% (FY2013/14: 29.5%) due primarily to subdued raw material prices and ongoing cost reduction initiatives which were offset by rising labour costs – particularly in China, but also as a result of the opening of new manufacturing facilities in Mexico and Serbia.
Although total sales in the period under review were depressed by foreign currency movements, the Group’s use of forward contracts in the normal course of business helped to mitigate the impact on operating profit which totalled US$243 million or 11.4% of sales.
Free cash flow from operations amounted to US$156 million, down US$75 million from the prior year. This decline was largely the result of higher working capital required to support increased business levels and higher capital expenditures associated with the expansion of the Group’s operating footprint and increased investment in automation.
Johnson Electric’s overall financial condition remains robust. As of 31st March 2015, cash reserves amounted to US$773 million and the total debt to capital ratio was 13%.
NEW MILESTONES IN INTERNATIONAL EXPANSION
During the year, the Group made significant progress in the development of its global manufacturing footprint which is a critical element in our long-term competitive strategy.
In September 2014, a new plant was opened in Niš, Serbia which adds to our existing capacity in Eastern Europe and is well placed to provide our customers in the region with a highly compelling fulfillment proposition. Similarly, a second plant has been opened in Mexico to meet growing demand from customers in the Americas. And in Asia, we have recently relocated our manufacturing facility in Chennai, India to larger premises designed to meet the needs of the domestic automotive sector.

LETTER TO SHAREHOLDERS
5
In addition to these organic growth initiatives, we are continuing to evaluate potential acquisitions that can bring complementary technologies to Johnson Electric and strengthen our position in key markets. Management intends to remain prudent in its assessment of acquisition opportunities and will only pursue situations where the prospects for long-term value-add are clear and the valuation of the business is not excessive.
OUTLOOK
In recent months the gradual recovery of the global economy since the 2008-09 financial crisis has shown signs of faltering as a result of a combination of factors including the collapse in oil prices, the depreciation of the Euro, a slowdown in China, and the overhang of excessive debt levels.
Although any prospective setback in the global economy is a concern to all industrial manufacturers, we have not observed any noticeable softening in demand for Johnson Electric’s products at the present time. On the contrary, both of our core operating divisions continue to win important new programmes based on their differentiated technology and global manufacturing capabilities. In the case of automotive components, such programmes typically take two to three years to reach full production volume and consequently the impact on sales will not be felt in the near term. In the current 2015/16 financial year, the weak Euro compared to the US Dollar appears likely to constrain sales growth on translation to the low single digit in percentage terms.
On the cost side, wage inflation in China remains an ever-present headwind and will need to be offset by further efficiency improvement measures, including greater investment in automation. The build-out of our new manufacturing facilities in Serbia and Mexico will also mean an additional cost burden before they are operating at optimal volume levels. As a consequence, we anticipate modest erosion in gross and operating margins in the current financial year such that it will be difficult for the Group to repeat the record net income level of the past year.
Overall, I remain very satisfied with the performance of the business and confident that we remain on track to build and sustain value for shareholders over time.
On behalf of the Board, I would like to sincerely thank our customers, employees, suppliers, and shareholders for their continued support.
Patrick Shui-Chung Wang JPChairman and Chief Executive
Hong Kong, 13th May 2015

Johnson Electric SolutionsAnnual Report 2015
6Johnson Electric Holdings Limited
Johnson Electric is the leader in providing motion subsystems to address the macro growth trends in the global industries that we serve.
In the Automotive industry the demand for advanced technology has expanded from luxury vehicles to higher volume mid-range vehicle segments. The demands for passenger comfort & safety, fuel economy and emissions improvements are growth drivers for Johnson Electric in all vehicle classes. As a result, we expect our global market share to grow significantly due to our capability to combine cost effective technology with a global manufacturing footprint. Production on four continents creates a platform to increase our business with global automotive OEMs in China, Europe, the Americas and India.
In the Industry sectors we serve, we are focused on partnering with companies that need cost effective technology in high volumes with perfect quality and assurance of supply globally. This includes sectors such as gas and electric smart metering; powered surgical devices; high efficiency pumps for washing machines and dishwashers; energy efficient blowers and fans for ventilation and kitchen range hoods; high performance motors and switches for power tools; and innovative contact plate technology for SIM and bank cards.
Our solutions deliver human value benefits to
the end user of a product and also align with the business needs of our
direct customers Aut
omot
ive
Prod
ucts
Indu
stry
Pro
duct
s
Johnson Electric solutions combine product innovation with global manufacturing excellence

Technology Leadership & Safe Choice
7
From the physics of the materials that our engineers select, to the precision of the tools and production equipment that we design in-house, all are aligned with our vision to be the world’s definitive provider of innovative and reliable motion systems.
Product innovation that deploys
advanced technology and precision
manufacturing for global markets
Johnson Electric’s global logistics capability in combination with our complete vertical integration process provides our customers with a “Safe Choice” solution.
John
son
Elec
tric
Pro
duct
ion
Syst
em
To achieve the combination of Technology Leadership and Safe Choice, Johnson Electric translates the performance demands of end-users and the commercial needs our OEM customers into technical parameters for product development and production system design. The Johnson Electric Production System was developed to deliver the industry’s highest quality level from our facilities worldwide. A total commitment to vertical integration of components, tooling, semi-automated and fully automated production lines ensure that “dead copy” quality and performance is achieved no matter where a product is produced.
Our global manufacturing footprint is aligned with the regional manufacturing strategies of our customers. In addition to production planning flexibility and logistics risk mitigation, a natural currency hedge is a significant benefit to many of our customers. The complete vertical integration strategy of Johnson Electric enables total quality assurance from materials to components to final products. Technology Leadership and Safe Choice for customers results from the disciplined execution of the Johnson Electric Product Development System and the Johnson Electric Production System.
Qua
lity
Ass
uran
ce

Automotive Products GroupAnnual Report 2015
8Johnson Electric Holdings Limited
Johnson Electric supports OEMs to comply with stricter regulatory requirements for fuel economy and emission reduction and consumer demand for improved comfort and safety features.
Johnson Electric develops and produces sub-systems for a broad range of vehicle applications that require motors or actuators. Our new product development roadmap supports OEMs in their efforts to comply with stricter regulatory requirements for fuel economy and emission reduction, and passenger demands for comfort and safety features. Automotive technology trends such as hybrid/electric vehicles and the fuel saving “start-stop” feature have created demand for low noise and low vibration systems. The start-stop feature has also created the need for the electric parking brake function.
Johnson Electric is in the unique position of being able to meet these new technology challenges and also have high volume manufacturing within the continent where the OEM vehicle platform will be produced. Johnson Electric is developing advanced technology solutions suitable for a high volume production system and the achievement of zero defect quality.
Actu
ator
s fo
r St
art-
Stop
Fea
ture
Cooling Fan Module
Next generation fuel efficient engines need more efficient cooling fan modules
Solu
tion
s fo
r Im
prov
ed F
uel
Econ
omy

9
Motor and actuator demand is growing due to regulatory requirements in all vehicle classes and features are moving from high-end cars to the higher volume mid-range. Johnson Electric has leading technology in the following functional areas: cooling fans for engine thermal management; motors for turbo charger actuators; electric power steering motors; electric parking brake motors; LED headlamp actuators; window lift drives; sun-roof drives; electric door lock motors and actuators; battery cooling fans for hybrid/electric vehicles; seat adjust actuators; transmission and driveline actuators; engine management motors and actuators. In the engine management area there are critical requirements for the extreme conditions experienced by systems operating under the hood. High temperature, vibration and shock must be tolerated to deliver high reliability and lifetime performance.
Our latest new product developments include motors and actuators for variable geometry turbochargers (VGT); exhaust gas recirculation (EGR); diesel exhaust fluid (DEF); electronic throttle control (ETC); fuel pumps; main and auxiliary cooling valves.
Win
dow
Lif
t D
rive
Sys
tem
s
In all areas of the latest vehicles, the motors and actuators must be compact, robust and energy efficient. These technical challenges have been successfully addressed by Johnson Electric’s engineering groups throughout the world.
DEF ActuatorElec
tric
Par
king
Bra
ke M
otor
Johnson Electric motor technology is resistant tohigh temperature and shock for engine applications
Window Lift Drive

Industry Products GroupAnnual Report 2015
10Johnson Electric Holdings Limited
Hom
e Te
chno
logy
Sol
utio
ns
The Industry Products Group provides technologically leading motion solutions to major equipment and product manufacturers requiring high quality volume production.
Our product development activity is focused on providing energy efficient and high performance products to our industry leading customers. Many of our Industry Products Group customers simultaneously participate in professional and consumer market segments hence they require performance differentiation and also cost competitive products in high volume. The Johnson Electric Group is uniquely positioned to design technology leading products and also deploy the manufacturing infrastructure required for high volume production to benefit from economies of scale.
Intrinsically Safe Gas Shut Off Valve
Johnson Electric is the global leader in motorized gas shut-off valves for the gas smart meter industry. Our gas shut-off products range from zero pressure-drop versions, to improve gas grid efficiency, to low cost and pre-payment meter versions. All valves exceed every international safety and performance standard. The gas valves are designed with the industry’s lowest energy motors and innovative aerodynamic geometry to provide our customers with Technology Leadership and Safe Choice.
Circulation Pump
Solu
tion
s fo
r G
loba
l G
as M
eter
s

11
The Johnson Medtech Technology team is partnering with medical device manufacturers to create products that improve medical outcomes for patients. Johnson Medtech’s engineering and manufacturing capability is aligned with the technology advancements and demand for affordable high volume medical devices. Significant growth areas are motorized surgical devices, miniature medication dosing systems, and vital signs monitoring equipment.
Our new brushless motor (BLDC) product line provides the same control and efficiency benefits as existing BLDC motors but at a lower cost. Our new BLDC motor technology is being deployed to replace small engines in chainsaws and in professional tools to replace pneumatic equipment and induction motors. For the consumer tools market our low cost BLDC motor will accelerate the shift from corded to cordless operation. The ventilation fan industry will also use the BLDC motor, with an efficiency of 80%, to replace shaded-pole and induction motors with efficiency of 10% to 25%, for a huge energy saving globally. In the home appliance industry our new BLDC pumps for washing machines and dishwashers will also create significant energy savings.
Solu
tion
s fo
r Pr
ofes
sion
al P
ower
Too
ls
Brushless DC Motorand Controller
Mot
oriz
ed S
urgi
cal
Tool
s
Johnson Electric has created high performance and cost effective products for contact plates used in bank cards and SIM cards. Our flip-chip, printed ink, and gold deposition technologies provide the most reliable data connections via contact plates or Near Field Communication (NFC) antennas. The production system is capable to produce the massive volumes demanded by this segment.
Solu
tion
s fo
r PO
S Te
rmin
als
Dosing System Pump
Contact Plate for Bank Cards

Global Manufacturing FootprintAnnual Report 2015
12Johnson Electric Holdings Limited
Global Assurance of Supply and Consistent Process Capability
Johnson Electric’s manufacturing strategy is designed to align with the globalization trends of the industries we serve. Our production footprint is deployed throughout the world in Asia, Europe, and the Americas. In addition to our existing major plants in China, India, Poland, Hungary, Switzerland, Italy, and the USA, we have expanding production capability in Behai (China), Chennai (India), Zacatecas (Mexico) and Niš (Serbia). All of our plants use the “Johnson Electric Production System” to achieve the same high level of process capability worldwide. The increased production capacity includes the roll out of Johnson Electric’s custom “Economation” production lines. The Economation equipment is designed and manufactured in-house to automate the most critical steps in the manufacturing process.
The combination of the Johnson Electric Production System and Economation lines provide our customers with unmatched levels of quality and service. Our global manufacturing footprint is a significant benefit for our customers who manufacture in multiple regions. Johnson Electric production plants located in proximity to customer points of manufacture provide them with assurance of supply and reduce their logistics and currency risks.
John
son
Elec
tric
Qua
lity
Ass
uran
ce

13
MANAGEMENT’S DISCUSSION AND ANALYSIS
CONTENTS
FINANCIAL PERFORMANCE 14
SALES AND PROFITABILITY 15
WORKING CAPITAL 21
CASH FLOW 24
FINANCIAL MANAGEMENT AND TREASURY POLICY 26
ENTERPRISE RISK MANAGEMENT 29
INVESTING IN PEOPLE 30

14Johnson Electric Holdings Limited
Annual Report 2015
MANAGEMENT’S DISCUSSION AND ANALYSIS
FINANCIAL PERFORMANCE
US$ million FY2014/15 FY2013/14
Sales 2,136.1 2,097.6
Gross profit 632.4 618.9Gross margin 29.6% 29.5%
Profit attributable to shareholders 210.9 207.9Diluted earnings per share 1 (US Cents) 23.60 23.25
EBITDA 2 335.5 321.8EBITDA margin 15.7% 15.3%
Free cash flow from operations 3 155.8 231.1
US$ million 31 Mar 2015 31 Mar 2014
Cash 773.2 644.0
Total debt 4 291.3 116.9
Net cash (cash – total debt) 481.9 527.1
Total equity 1,900.9 1,766.3
Market capitalisation 5 3,032.5 3,282.2
Enterprise value 6 2,589.3 2,789.1
Enterprise value to EBITDA 7.7 8.7
Credit Quality – Financial Ratios 31 Mar 2015 31 Mar 2014
Free cash flow from operations 3 to total debt 53% 198%
Total debt to EBITDA 0.9 0.4
Total debt to capital (total equity + total debt) 13% 6%
1 For FY2013/14, diluted earnings per share adjusted to reflect the 1 for 4 share consolidation on 15 July 2014 (“Consolidated Share”)
2 Earnings before interest, tax, depreciation and amortisation
3 Net cash generated from operating activities plus net interest received, less capital expenditure (net of proceeds from disposal of fixed assets) and capitalisation of engineering development costs
4 Total debt calculated as borrowings plus convertible bonds
5 Outstanding number of shares multiplied by the closing share price (HK$27.30 per share as of 31 March 2015 and HK$28.68 per Consolidated Share as of 31 March 2014) converted to US Dollars at the closing exchange rate
6 Enterprise value calculated as market capitalisation plus non-controlling interests plus total debt less cash

MANAGEMENT’S DISCUSSION AND ANALYSIS
15
• Record EBITDA, profit attributable to shareholders and earnings per share.
• Sales, as reported, increased 2%. Excluding currency effects, sales increased 4% (Automotive Products Group, 4% increase; Industry Products Group, 4% increase) as the Group benefited from recent product launches.
• Gross profit margin slightly increased to 29.6%.
• Awarded “Baa1” investment grade credit rating with stable outlook by Moody’s Investors Service and “BBB” investment grade credit rating with stable outlook by Standard and Poor’s (“S&P”) Ratings Services.
• Issued convertible bonds in an aggregate principal amount of US$200 million with a cash coupon rate of 1% per annum. These convertible bonds have a maturity of 7 years and a 5 year put option for the bondholders. The bonds have an effective annual yield of 3.57%.
• Total debt to capital ratio is 13% and cash reserves are US$773.2 million as of 31 March 2015.
Further information on liquidity, cash, borrowings and convertible bonds can be found in the Financial Management and Treasury Policy Section on page 26.
SALES AND PROFITABILITY
Johnson Electric’s Operating Model
Johnson Electric is one of the world’s largest providers of motion subsystems, with a global customer base. Operations throughout the Group share many commonalities including advanced technologies, manufacturing processes, vertical integration (with the majority of components manufactured in-house), supply chain, brands, distribution channels and program management.
The Group constantly pursues technology leadership in its key markets. From its innovation and product design centres, the business continuously add new solutions to its range of motors, solenoids, actuators, micro-switches, flexible printed circuits and microelectronics product platforms. These are then customised to provide high-quality solutions that address our customers’ needs.
The Group has also established a flexible and responsive operating footprint. Manufacturing facilities in fifteen countries on four continents provide an annual production capacity of over one billion units.
These factors create opportunities for growth by leveraging the strength of the Group’s technology and for cost efficiencies through the sharing of resources and continuous improvement of standardised methods and processes.

16Johnson Electric Holdings Limited
Annual Report 2015
Sales Review
Group sales in FY2014/15 were US$2,136.1 million, an increase of US$38.5 million, 2%, compared to US$2,097.6 million for FY2013/14. Excluding currency effects, sales increased by US$87.6 million, 4%, compared to FY2013/14, as shown below:
SalesUS$ million FY2014/15 FY2013/14 growth
Automotive Products Group (“APG”)– Sales, excluding currency effects 1,501.0 69% 1,436.8 68% 4%– Currency effects (43.5) n/a
APG sales, as reported 1,457.5 1,436.8
Industry Products Group (“IPG”)– Sales, excluding currency effects 684.2 31% 660.8 32% 4%– Currency effects (5.6) n/a
IPG sales, as reported 678.6 660.8
Group sales– Sales, excluding currency effects 2,185.2 100% 2,097.6 100% 4%
– Currency effects (49.1) n/a
Group sales, as reported 2,136.1 2,097.6 2%
The drivers underlying sales growth in FY2014/15 are shown in the following chart:
64 23
2%
49
FY2013/14Sales,
as reported
APG volume / mix and price, net
IPG Volume / mixand price, net
Currencyeffects
FY2014/15Sales,
as reported
US$ million
2,098 2,136
Note: Numbers do not add across due to the effect of rounding
Volume / mix and price, net, increased sales by US$87.6 million. The underlying changes in the sales of the Automotive Products Group and Industry Products Group are discussed on pages 17 to 19.
Currency effects: revenues decreased by US$49.1 million compared to FY2013/14, primarily due to the lower average rate for the Euro against the US Dollar in FY2014/15 (average rate of 1.27) compared to the prior year (average rate of 1.34). The Group’s sales are largely denominated in the US Dollar, the Euro and the Chinese Renminbi. See Note 34.3 to the accounts for all foreign currency translation rates.

MANAGEMENT’S DISCUSSION AND ANALYSIS
17
Automotive Products Group
APG’s business model continued to deliver organic business growth, as shown in the adjacent table.
Sales, excluding currency effects, increased 4% compared to the prior year (Asia: 12% growth, Europe: 5% growth, Americas: 8% decline). This was in excess of the growth in global light vehicle production in the year.
In Asia, sales of products for powertrain cooling systems and sunroof application increased. Sales also increased due to recent product launches for electric power steering, engine air management and transmission applications. These increases were slightly offset by reduced sales of products for certain low-margin window-lift applications.
In Europe, sales increased across a broad range of products, most notably in products for engine air management, heating, ventilation and air-conditioning (“HVAC”), coolant valve, window-lift and electric parking brake applications. This was the result of growth in market share and the ramp-up of products launched in earlier years.
In the Americas, sales declined for seat adjustment applications due to older products having reached end of life. Sales also declined for powertrain cooling applications, mainly in South America, and for HVAC actuators in North America. These declines were partially offset by increased sales from new products launched for transmission and driver feedback applications.
The Powertrain Cooling business including the “GATE” brand, primarily engaged in the manufacture and sale of cooling fan modules for OEM and Tier 1 customers, accounted for 25% of the total Group’s sales in FY2014/15 (25% in FY2013/14). Sales for this business unit, excluding currency effects, increased 5% in FY2014/15 compared to the prior year. This was driven by a ramp-up in production of key global customer platforms incorporating brushless technology as well as continued growth of brushed powertrain cooling products in China.
Half-yearly trend in sales(excluding currency effects)
APG salesSix month period ended growth*
31 March 2015 4%30 September 2014 5%31 March 2014 9%30 September 2013 4%31 March 2013 4%30 September 2012 7%
* Comparing each 6 months’ results to the same period in the previous fiscal year
1,436.81,501.0
434.7
718.3
283.8
488.0
751.6
261.4
+12%
+5%
(8%)
US$ million APG salesat constant exchange rates
Increase of 4%
FY2013/14 FY2014/15
AmericasEuropeAsia

18Johnson Electric Holdings Limited
Annual Report 2015
The APG design teams are organised into engineering centres, based on specific product technologies. These centres are focused on powertrain cooling, window-lift drive, seat adjustment, power closures and actuators for engine control valves, grill shutter, HVAC, headlamp, transmission, braking and stability control applications. These design teams constantly focus on innovation, providing custom engineered solutions and investing in the development of low-weight, high power-density motors and subsystems for advanced applications that increase fuel efficiency, reduce emissions and improve safety.
Recent product launches include:
• The latest generation of compact motors for turbochargers with a robust design for high resistance to temperature and vibration for reliable operation. These motors deliver high torque for a faster turbo response and more precise control, at both low and high speeds, compared to traditional mechanical solutions. This enables engine manufacturers to deliver increased fuel efficiency and reduced emissions by using smaller engines without sacrificing engine power; and
• Dosing solutions for diesel exhaust fluid (“DEF”), with a robust design for extreme operating conditions. These flexible subsystems can operate with the voltages used by both commercial vehicles and passenger vehicles and deliver precise motion control for exact DEF dosing over a wide speed range, reducing diesel engine emissions.
The Group’s on-the-ground engineering presence in key geographic markets enables it to identify particular customer needs and customise its products accordingly. Management is also ensuring that the Group’s manufacturing sites are well-placed to support regional customers, increase responsiveness and reduce delivery lead times whilst minimising logistics costs and inventory levels.
Industry Products Group
IPG’s go-to-market strategy has returned the business unit to growth, with increasing sales of innovative motion subsystem solutions. This change is reflected in the adjacent table.
On a full year basis, sales, excluding currency effects, increased 4% for FY2014/15 compared to the prior year (Asia: 4% decline, Europe: 6% growth, Americas: 12% growth).
In Asia, there was a decline in sales of products for lower-end food and beverage, power tool and business machine applications. This was partially offset by growth in demand for products for floor care, smart meter and point-of-sale applications.
Half-yearly trend in sales(excluding currency effects)
IPG salesSix month period ended growth/(decline)*
31 March 2015 5%30 September 2014 2%31 March 2014 (1%)30 September 2013 (7%)31 March 2013 (8%)30 September 2012 (8%)
* Comparing each 6 months’ results to the same period in the previous fiscal year
MANAGEMENT’S DISCUSSION AND ANALYSIS
19
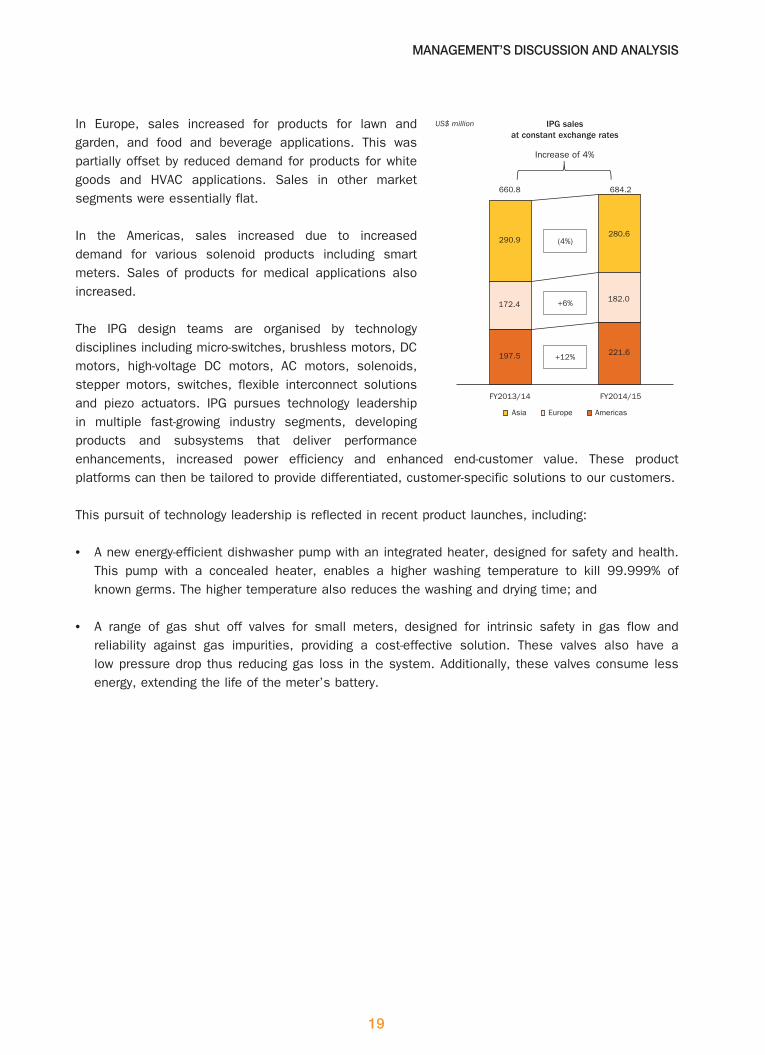
In Europe, sales increased for products for lawn and garden, and food and beverage applications. This was partially offset by reduced demand for products for white goods and HVAC applications. Sales in other market segments were essentially flat.
In the Americas, sales increased due to increased demand for various solenoid products including smart meters. Sales of products for medical applications also increased.
The IPG design teams are organised by technology disciplines including micro-switches, brushless motors, DC motors, high-voltage DC motors, AC motors, solenoids, stepper motors, switches, flexible interconnect solutions and piezo actuators. IPG pursues technology leadership in multiple fast-growing industry segments, developing products and subsystems that deliver performance enhancements, increased power efficiency and enhanced end-customer value. These product platforms can then be tailored to provide differentiated, customer-specific solutions to our customers.
This pursuit of technology leadership is reflected in recent product launches, including:
• A new energy-efficient dishwasher pump with an integrated heater, designed for safety and health. This pump with a concealed heater, enables a higher washing temperature to kill 99.999% of known germs. The higher temperature also reduces the washing and drying time; and
• A range of gas shut off valves for small meters, designed for intrinsic safety in gas flow and reliability against gas impurities, providing a cost-effective solution. These valves also have a low pressure drop thus reducing gas loss in the system. Additionally, these valves consume less energy, extending the life of the meter’s battery.
US$ million IPG salesat constant exchange rates
Increase of 4%
FY2013/14 FY2014/15
290.9
172.4
197.5
280.6
182.0
221.6
(4%)
+6%
+12%
660.8 684.2
AmericasEuropeAsia

20Johnson Electric Holdings Limited
Annual Report 2015
Profitability Review
Profit attributable to shareholders increased to US$210.9 million in FY2014/15, compared to the previous record of US$207.9 million set in FY2013/14.
Increase/ (decrease)US$ million FY2014/15 FY2013/14 in profit
Sales 2,136.1 2,097.6 38.5
Gross profit 632.4 618.9 13.5 Gross margin % 29.6% 29.5%
Other income and gains, net 17.9 19.8 (1.9)
Selling and administrative expenses (“S&A”) (407.5) (405.2) (2.3)S&A% 19.1% 19.3%
Operating profit 242.8 233.5 9.3Operating profit margin % 11.4% 11.1%
Net interest income 5.5 9.1 (3.6)Share of profit of associate 0.7 0.4 0.3
Profit before income tax 249.0 243.0 6.0
Income tax expense (29.2) (28.1) (1.1)Effective tax rate 11.7% 11.6%
Profit for the year 219.8 214.9 4.9
Non-controlling interests (8.9) (7.0) (1.9)
Profit attributable to shareholders 210.9 207.9 3.0
Profit Attributable to Shareholders
17
87
FY2013/14Net pro�t,
as reported
Volume / mix,pricing and
operating costs
Currencyeffects,
net
Other income,�nance costs
and taxes
FY2014/15Net pro�t,
as reported
US$ million
208 211
Note: Numbers do not add across due to the effect of rounding

MANAGEMENT’S DISCUSSION AND ANALYSIS
21
Volume / mix, pricing and operating costs: Margins improved as a result of recently launched value-added products, cost reduction activities that increased productivity and efficiency and lower raw material costs including certain commodities. This was partly offset by increased labour and staff costs due to wage inflation, especially in China, and the effect of increased headcount and operating costs as the Group expanded its operations in Mexico and Serbia. The net effect of these changes was to increase profit by US$17.2 million.
Currency effects, net: Johnson Electric’s global operations expose the Group to foreign exchange volatility, which is partially mitigated through the use of foreign currency forward contracts. Overall, currency movements in FY2014/15 (especially the weakening of the Euro) decreased profit by US$7.6 million.
Other income, finance costs and taxes: Other income decreased by US$1.9 million as the previous year included higher gains on the disposal of investments and property, plant and equipment, as well as more income from government subsidies. This change was partly offset by increased fair value gains on investment property in FY2014/15. This is analysed in Note 19 to the accounts.
Net interest income decreased by US$3.6 million. This was mainly due to the issuance of convertible bonds at the start of FY2014/15, which was partly offset by a US$3.1 million increase in interest income due to higher cash reserves. This is analysed in Note 21 to the accounts.
Tax expenses increased by US$1.1 million. The effective tax rate remained essentially flat, at 11.7% for FY2014/15 (FY2013/14, 11.6%). Tax is analysed further in Note 23 to the accounts.
WORKING CAPITAL
Balance sheet Pension, Working capital Balance sheet as of Currency hedging and changes per as ofUS$ million 31 Mar 2014 translations others cash flow 31 Mar 2015
Inventories 207.0 (12.6) – 27.6 222.0Trade and other receivables 441.6 (34.7) – 7.9 414.8Other non-current assets 6.5 (1.1) 2.4 1.9 9.7Trade payables, other payables and deferred income 1 (401.9) 22.3 (3.5) (15.0) (398.1)Provision obligations and other liabilities 1,2 (47.5) 6.3 (15.6) 0.2 (56.6)Other financial assets / (liabilities), net 1 (21.4) – 211.4 (1.5) 188.5
Total working capital per balance sheet 184.3 (19.8) 194.7 21.1 380.3
1 Current and non-current2 Net of defined benefit pension plan assets

22Johnson Electric Holdings Limited
Annual Report 2015
Inventories increased by US$15.0 million, from US$207.0 million as of 31 March 2014 to US$222.0 million as of 31 March 2015. Days inventory on hand (“DIOs”) also increased to 52 days as of 31 March 2015 from 47 days as of 31 March 2014. This was due to the build-up of inventory relating to new products and the new facilities in Mexico and Serbia.
Trade and other receivables decreased by US$26.8 million in FY2014/15, from US$441.6 million as of 31 March 2014 to US$414.8 million as of 31 March 2015, largely due to the strengthening of the US Dollar against the Euro. This was partially offset by increases in VAT receivables and prepayments for raw materials due to increased local content from the supplier base servicing the new manufacturing sites in Mexico and Serbia.
Days sales outstanding (“DSOs”) increased slightly from 60 days as of 31 March 2014 to 62 days as of 31 March 2015. The Group’s receivables are of high quality. Amounts overdue greater than 30 days amounted to approximately 1.1% of gross trade receivables as of 31 March 2015 (3.8% as of 31 March 2014).
Trade payables, other payables and deferred income were US$398.1 million as of 31 March 2015, a decrease of US$3.8 million from US$401.9 million as of 31 March 2014, largely due to the strengthening of the US Dollar against the Euro. This was partially offset by increased material purchases towards the end of the year to support the increase in sales and the increase in deferred income relating to government grants and customer contributions towards tooling.
Days purchases outstanding (“DPOs”) increased by 7 days to 83 days as of 31 March 2015 compared to 76 days as of 31 March 2014 consistent with the changes in inventory.
Inventories
31-Mar-14 30-Sep-14 31-Mar-15
US
$ m
illio
n
Day
s in
vent
ory
on h
and
Inventories Days inventory on hand
0
50
100
150
200
250
20
10
0
30
40
50
60
47
5752
Trade payables, other payablesand deferred income
(DPOs calculated on trade payables only)
Days purchases outstanding
Trade payables, other payables and deferred income
31-Mar-14 30-Sep-14 31-Mar-15
US
$ m
illio
n
Day
s pu
rcha
ses
outs
tand
ing
0
100
50
250
200
150
300
400
350
450
0
10
20
30
40
50
100
60
70
80
90
76
9183
31-Mar-14 30-Sep-14 31-Mar-15
US
$ m
illio
n
Day
s sa
les
outs
tand
ing
0
100
50
250
200
150
300
400
350
450
10
0
20
30
40
50
60
70
6063 62
Trade and other receivables(DSOs calculated on trade receivables only)
Trade and other receivables Days sales outstanding

MANAGEMENT’S DISCUSSION AND ANALYSIS
23
Provision obligations and other liabilities increased by US$9.1 million to US$56.6 million as of 31 March 2015 compared to US$47.5 million as of 31 March 2014 mainly due to a change in the present value of pension obligations caused by falling interest rates in Europe. The Group will make contributions of US$4.7 million to post-employment benefit plans for FY2015/16 (FY2014/15 contributions were US$5.7 million). See Note 15 to the accounts for further details.
Other financial assets / (liabilities), net, increased by US$209.9 million from a net financial liability of US$21.4 million as of 31 March 2014 to a net financial asset of US$188.5 million as of 31 March 2015.
• Foreign currency forward contracts and cross-currency interest rate swaps increased in value by US$216.4 million, primarily due to an increase in mark-to-market value of Euro hedge contracts, partially offset by a reduction in the mark-to-market value of Renminbi hedge contracts.
• The mark-to-market valuation of commodity forward contracts decreased by US$6.5 million, due to decreasing copper and silver prices.
Further details of the Group’s hedging activities can be found in the Financial Management and Treasury Policy section on page 26 and in Note 7 to the accounts.
Spot rates Spot rates as of as of Strengthen/ 31 Mar 2015 31 Mar 2014 (weaken)
USD per EUR 1.08 1.38 27%
RMB per USD 6.14 6.21 1%
HUF per EUR 299.25 308.34 3%
MXN per USD 15.26 13.07 (14%)
USD per metric ton of copper 6,051 6,636 (9%)
USD per ounce of silver 16.60 19.97 (17%)

24Johnson Electric Holdings Limited
Annual Report 2015
CASH FLOW
US$ million FY2014/15 FY2013/14 Change
Operating profit * 243.0 233.7 9.3Depreciation and amortisation 92.5 88.1 4.4
EBITDA 335.5 321.8 13.7
Other non-cash items in profit before taxes (1.5) 0.9 (2.4)Working capital changes (21.1) 17.8 (38.9)Interest paid (2.6) (1.8) (0.8)Income taxes paid (43.2) (31.3) (11.9)
Net cash generated from operating activities 267.1 307.4 (40.3)
Capital expenditure, net of subsidies (119.9) (92.2) (27.7)Capitalisation of engineering development costs (6.2) (5.8) (0.4)Proceeds from disposal of fixed assets 0.8 10.8 (10.0)Interest received 14.0 10.9 3.1
Free cash flow from operations 155.8 231.1 (75.3)
Acquisition (9.2) – (9.2)Subsequent payments due to divestiture of non-core business – (6.1) 6.1Dividends paid (54.3) (50.4) (3.9)Purchase of shares held for Long-Term Incentive Share Scheme (50.7) (2.9) (47.8)Purchase of shares for cancellation of issued capital (55.0) (1.7) (53.3)Other investing activities 0.8 1.5 (0.7)Other financing activities (4.8) (3.2) (1.6)
Total cash flow (excluding changes in borrowings and currency effects) (17.4) 168.3 (185.7)Net repayment of borrowings (10.8) (12.7) 1.9Proceeds from issuance of convertible bonds, net of transaction costs 197.3 – 197.3
Increase in cash (excluding currency effects) 169.1 155.6 13.5
Exchange (losses) / gains on cash (39.9) 7.5 (47.4)
Net movement in cash 129.2 163.1 (33.9)
* Operating profit as reported plus US$0.2 million dividend received from associate in FY2014/15 (FY2013/14: US$0.3 million).

MANAGEMENT’S DISCUSSION AND ANALYSIS
25
The Group generated US$155.8 million free cash flow from operations in FY2014/15, a decrease of US$75.3 million compared to US$231.1 million in FY2013/14. This movement in operational cash flows includes the following:
• Working capital, explained in the previous section, required an additional investment of US$21.1 million in FY2014/15 due to increasing business levels and the expansion of manufacturing sites compared to a reduction of US$17.8 million in working capital requirements in the prior year.
• Income taxes: In FY2014/15, the Group paid income taxes of US$43.2 million, an increase of US$11.9 million from US$31.3 million paid in the prior year due to certain entities moving into profit, the final settlement of earlier years of assessment and as carry-forward losses were exhausted in certain jurisdictions.
• Capital expenditure amounted to US$119.9 million in FY2014/15. In FY2013/14 capital expenditure was US$102.7 million, partially offset by government grants of US$10.5 million (net capital expenditure of US$92.2 million). The Group continues to enhance the level of automation in production processes to partially offset the on-going rise in direct labour costs in China, standardise operating processes and further improve product quality and reliability. This automated manufacturing equipment is also being introduced directly into new facilities. Additionally, investments continued to be made for new product launches and long-term technology / testing development, on-going productivity improvements and replacement of assets.
• Proceeds from disposal of fixed assets: In FY2014/15, proceeds from disposals of fixed assets amounted to US$0.8 million. In FY2013/14, proceeds from disposals of fixed assets amounted to US$10.8 million, largely due to disposals of real estate.
This free cash flow from operations was mainly applied to the funding of the following activities:
• Acquisition: In FY2014/15, the Group paid US$9.2 million to insource a sales agency in the UK. This acquisition strengthened the Group’s sales network by providing a direct interface with key automotive customers in the UK. There was no such event in FY2013/14.
• Subsequent payments due to divestiture of non-core business: There were no divestitures or subsequent proceeds or payments in FY2014/15. In FY2013/14, the Group paid US$6.1 million to settle purchase price adjustments resulting from the divestiture of Saia-Burgess Controls.
• Share purchases and dividends are discussed in the Financial Management and Treasury Policy Section in the following pages.
Capital expenditure and depreciation
FY2012/13 FY2013/14 FY2014/15
US
$ m
illio
n
0
20
40
60
80
100
120
DepreciationCapital expenditure
71.1
82.692.2
119.9
68.6 67.2
1.2 1.4 1.7Capital expenditureto depreciation

26Johnson Electric Holdings Limited
Annual Report 2015
FINANCIAL MANAGEMENT AND TREASURY POLICY
Financial risk faced by the Group is managed by the Group’s Treasury department, based at the corporate headquarters in Hong Kong. Policies are established by senior management and approved by the Board of Directors.
Credit Rating
Moody’s Investors Service awarded Johnson Electric a “Baa1” investment grade rating with stable outlook in May 2015. Also, Standard & Poor’s (S&P) Ratings Services awarded Johnson Electric a “BBB” investment grade rating with stable outlook in December 2014. These ratings represent the Group’s solid market position, stable profitability and minimal financial leverage. This is the first time that Johnson Electric has undergone formal credit ratings.
Liquidity
Management believes the combination of cash on hand, available credit lines and expected future operating cash flows is sufficient to satisfy the Group’s cash needs for the current and planned level of operations for the foreseeable future.
Net Cash and Credit lines
US$ million 31 Mar 2015 31 Mar 2014 Change
Cash 773.2 644.0 129.2Borrowings (94.0) (116.9) 22.9Convertible bonds (197.3) – (197.3)
Net cash 481.9 527.1 (45.2)
Available unutilised credit lines 577.6 576.8 0.8
Cash increased by US$129.2 million to US$773.2 million as of 31 March 2015. The convertible bond issuance discussed below increased the US Dollar cash reserve. Also, the Group reduced the cash reserve kept in Chinese Renminbi due to expectations of rising US Dollar interest rates.
US$ million 31 Mar 2015 31 Mar 2014
USD 382.0 47.3RMB 269.8 445.3EUR 59.7 99.4Others 61.7 52.0
Total 773.2 644.0

MANAGEMENT’S DISCUSSION AND ANALYSIS
27
Borrowings decreased by US$22.9 million (net repayment of US$10.8 million in FY2014/15 and unrealised exchange gains of US$12.1 million) to US$94.0 million as of 31 March 2015, compared to US$116.9 million as of 31 March 2014. Further information on borrowings can be found in Note 13 to the accounts.
Convertible bonds: The Company issued convertible bonds at the start of FY2014/15, in an aggregate principal amount of US$200 million with a cash coupon rate of 1% per annum. These convertible bonds have a maturity of 7 years and a 5 year put option for the bondholders. The bonds have an effective annual yield of 3.57%. The carrying value of the convertible bonds as of 31 March 2015 amounted to US$197.3 million. Further information on the convertible bonds can be found in Note 14 to the accounts; and
Consequently:
• The Group’s total debt to capital ratio increased to 13% as of 31 March 2015 compared to 6% as of 31 March 2014; and
• Interest coverage (defined as EBIT divided by gross interest expense) was 29 times for the year ended 31 March 2015, compared to 128 times for the year ended 31 March 2014.
Free cash flow from operations as a percentage of gross debt decreased to 53% as of 31 March 2015, compared to 198% as of 31 March 2014. This was due to the combined effect of the increase in borrowings and convertible bonds and the decrease in free cash flow explained earlier.
As of 31 March 2015, the Group was in compliance with all covenants on its borrowings and expects to remain compliant in future periods.
Net cash (cash less borrowings and convertible bonds) decreased by US$45.2 million to US$481.9 million as of 31 March 2015, from US$527.1 million as of 31 March 2014 as a result of the movements in cash, borrowings and convertible bonds.
Available credit lines – The Group had US$618 million in available credit lines as of 31 March 2015 (adjusted for one new facility effective on 7 May 2015) as follows:
• US$205 million committed and unutilised revolving credit facilities, provided by certain of its principal bankers, with the following expiry dates:
◦ US$30 million – 25 July 2015◦ US$30 million – 14 August 2015◦ US$20 million – 5 November 2015◦ US$30 million – 10 December 2015◦ US$20 million – 15 January 2016◦ US$35 million – 28 February 2017◦ US$40 million – 7 May 2018 (effective 7 May 2015)
• US$322 million of uncommitted and unutilised revolving credit facilities, provided by its principal bankers; and
• US$91 million of uncommitted and unutilised trade receivable financing lines.

28Johnson Electric Holdings Limited
Annual Report 2015
Shares and Dividends
Share Consolidation: In FY2014/15, Johnson Electric Holdings Limited (“JEHL”) made a 1 for 4 consolidation of its ordinary shares (“Share Consolidation”). This was intended to bring the Company’s share price more into line with other blue chip and well-established companies listed on the Stock Exchange of Hong Kong Limited, to attract more investors and thereby expand the shareholder base of the Company. In addition, the Share Consolidation will enable greater flexibility in future dividend payments that the Company may choose to distribute.
In this section, the number of shares purchased in FY2013/14, and the dividend per share for FY2013/14, are presented on the basis of Consolidated Shares.
Further information on share capital, including purchases of shares and the Share Consolidation, can be found in Note 17 to the accounts.
Dividends: The Board has recommended a final dividend of 34 HK Cents per share for FY2014/15 (FY2013/14: 34 HK Cents per share) equivalent to US$37.8 million, to be paid in July 2015. The Board’s intention is to have the interim dividend increase over time, such that it will represent one-third of the previous year’s total dividend payment. The Company paid an interim dividend of 14 HK Cents per share for FY2014/15 (FY2013/14: 12 HK Cents per share) equivalent to US$15.5 million.
Purchase of shares for Long-Term Incentive Share Scheme: To foster a focus on long-term sustainable growth, JEHL maintains a long-term incentive share scheme, further discussed on page 51. To support this, in FY2014/15, the Company purchased 13.7 million shares for US$50.7 million including brokerage fees (FY2013/14, purchased 1.2 million shares for US$2.9 million) for use in granting shares to eligible employees and Directors under the Long-Term Incentive Share Scheme.
Purchase of shares for cancellation of issued capital: 14.3 million shares were purchased in FY2014/15 at a total cost of US$55.0 million including brokerage and cancellation fees. In FY2013/14, the Company purchased and cancelled 0.6 million shares at a total cost of US$1.7 million.

MANAGEMENT’S DISCUSSION AND ANALYSIS
29
Foreign Exchange and Raw Material Commodity Price Risk
The Group is exposed to foreign exchange risk and hedges part of this risk through forward contracts. These forward contracts have varying maturities ranging from 1 to 81 months as of 31 March 2015, to match the underlying cash flows of the business and included:
• Forward sales of the Euro (“EUR”) and the Japanese Yen (“JPY”) to hedge export sales denominated in these currencies; and
• Forward purchases of the Chinese Renminbi (“RMB”), the Hungarian Forint (“HUF”), the Swiss Franc (“CHF”), the Mexican Peso (“MXN”), the Polish Zloty (“PLN”), the Indian Rupee (“INR”) and the Israeli Shekel (“ILS”) to hedge operating costs, primarily production conversion costs, denominated in these currencies.
The Group also hedges its net investment in its European operations to protect itself from exposure to future changes in currency exchange rates.
The Group is exposed to raw material commodity purchase price risk, mainly from fluctuations in steel, copper, silver and aluminium purchase prices. Price risk due to steel is reduced through fixed price contracts up to 3 months forward with the Group’s suppliers. Price risk due to copper, silver and aluminium is reduced by hedging through appropriate financial instruments that have varying maturities ranging from 1 to 70 months as of 31 March 2015. The Group also manages copper and silver prices by way of incorporating appropriate clauses in certain customer contracts to pass increases / decreases in raw material costs onto these customers.
In order to avoid the potential default by any of its counterparties on its forward contracts, the Group deals only with major financial institutions (e.g. the Group’s principal bankers) with strong investment grade credit ratings whom the Group believes will satisfy their obligations under the contracts.
Further information about forward foreign currency exchange contracts and raw material commodity contracts can be found in Note 7 to the accounts.
ENTERPRISE RISK MANAGEMENT
The Group identifies and manages its strategic, operational, financial and compliance risks through proactive management oversight and business processes.
Existing and emerging risks are analysed and tracked on a quarterly basis by the Group’s Enterprise Risk Management Steering Committee. This is led by the Group’s Chief Executive and composed of the Chief Financial Officer, the Senior Vice Presidents of Human Resources, Supply Chain Services, Global Manufacturing and Corporate Engineering, as well as key senior leaders from the Quality and Reliability, Legal and Intellectual Property, Corporate Audit Services and Environment, Health and Safety departments.
The Group’s sales are primarily denominatedin the currencies shown in the table below:
% of sales FY2014/15 FY2013/14
USD 45% 46%EUR 34% 35%RMB 18% 16%Others 3% 3%

30Johnson Electric Holdings Limited
Annual Report 2015
Risks are managed / mitigated through close cooperation amongst the senior management team and through robust business practices. Management monitors these business practices and test them periodically to ensure their continuing effectiveness.
Specific areas of focus for enterprise risk management include:
• Ensuring the suitability of the operational footprint to respond quickly and cost effectively to market changes and capacity utilisation;
• Ensuring supply chain resilience, including supplier continuity, quality and reliability;
• Continuously improving the engineering and manufacturing processes and quality standards to maintain the position as the “safe choice” for our customers;
• Developing and managing product differentiation through technology, innovation and intellectual property in order to be the definitive supplier of motion solutions to our customers;
• Attracting and retaining high-calibre management and other key personnel and building effective networks of employees and partners, thus safeguarding the Group’s success;
• Managing customer relationships, including contract terms and conditions, in accordance with industry standards and Group policy;
• Managing customer credit risk and maintaining a low tolerance for delinquent payments;
• Applying appropriate hedging strategies to manage foreign exchange risks, commodity cost risks and interest rate risks;
• Ensuring that a strong tone at the top is reflected in business practices. High integrity, sound ethics and good business practices are expected and practiced by employees at all levels of Johnson Electric’s global organisation with no tolerance for non-compliance; and
• Meeting or exceeding requirements on environmental responsibility, employee safety and energy efficiency.
INVESTING IN PEOPLE
People and culture are at the core of Johnson Electric’s success. Our human capital strategy is to attract and develop great people, put them in the right jobs and provide an environment that enables everyone to excel at what they do.
This is supported by a robust talent management process, an equitable and competitive compensation and benefits program, a fit-for-purpose training and development agenda, an engaging internal communications infrastructure and a systems-based approach to Environmental, Health and Safety requirements.
As of 31 March 2015, the Group’s total global headcount stood at close to 36,000 across Asia, the Americas and Europe.

MANAGEMENT’S DISCUSSION AND ANALYSIS
31
Right People in the Right Roles
The Group remains committed to attracting and developing great people, and has increased its focus on talent management to ensure that the workforce is aligned to the organisational strategy, with “the right people in the right roles”. Management has carefully reviewed the “go-to-market” sales and business development leaders globally and put in place new tools and resources to improve the hiring and selection process. As a result, the organisation has taken aggressive steps to ensure the alignment of the people resources with the strategic objectives of the business.
Aligning Rewards to Shareholder Value
The Group maintains a global compensation structure that ensures competitive pay levels and benefit offerings in each market in which it operates. Annual incentive pay is tied to the achievement of profitability and liquidity goals and is an important component of compensation for over 80% of staff-level employees, including all management staff. The Group’s long-term incentive share scheme forms a critical part of the competitive compensation package for senior executives, encouraging retention while aligning rewards to shareholder value. The scheme includes not only time-vested restricted stock units, but also a high proportion of performance stock units which vest only if stringent financial conditions are met.
To further align executives’ performance to shareholder value and to ensure that senior executives maintain a valuable stake in Johnson Electric, in 2015, the Company increased the share ownership requirement for Executive Committee members and extended share ownership requirements to the next layer of senior management. Executives covered by the share ownership requirement must hold a certain number of the Company’s shares as a condition of employment.
Enhancing Training and Development Platforms and Programs
Supported by the successful launch of an “e-Learning Centre”, a just-in-time, borderless and agile teaching platform, the training and development team enables dissemination of the Group’s key initiatives to its global workforce in a swift manner. This includes the continuing training of key Engineers and Specialists on the Group’s unique approach to product development, the JE Product Development System, which is vital to driving product innovation and profitable growth.
Reinforcing JE Culture and Values
Maintaining an open and honest communication is part of Johnson Electric’s pledge to employees. During the year, management bolstered internal communications by enhancing existing channels and putting in place new ones including a video magazine “JE in Motion”, featuring topics that are trending within the Group and bringing to the forefront employees behind its success.
To reinforce the Group’s corporate values, and bring employees in individual locations closer together as one family, a one-week celebration was dedicated to mark One Johnson around the world with subsequent highlights published on a global platform viewable by all staff. At the same time, management launched a recognition program to reward role-model behaviour upholding the Group’s values, with over 100 awardees by 31 March 2015.

32Johnson Electric Holdings Limited
Annual Report 2015
Upholding Global EHS Standards
The Environmental, Health and Safety (EHS) group continues to extend its focus. During the year, most of the operating facilities in the JE Group achieved compliance with the ISO14001 and /or OHSAS 18001 standards on environmental management and occupational health and safety management. The remainder of the Group’s sites continue to progress towards conformity with these standards.
The participation of the factories in Shenzhen, China in the pilot carbon emission trading scheme has proven to be a success. Thanks to various energy and carbon emission reduction measures, the Group achieved a surplus of credits in 2014/15, which were then sold.
Regional Initiatives
The financial year of 2014/15 saw a continued focus on new and expanded manufacturing sites in every region:
Americas: To support footprint alignment, management is using human resources tools and strategies to improve selection of candidates and placement of current employees into roles where they can be most effective. The region has standardised its practices to ensure consistent delivery of employee services and improved communication to employees.
The Americas compensation and benefits team led a successful roll-out of redesigned healthcare plans to balance costs with the competitiveness of their benefit programs. This complies with the Affordable Care Act and offers consumer driven healthcare choices to all employees.
Asia: The economic boom in Central China caused a tightening of the labour supply at the Group’s largest plant, in Shenzhen. To alleviate the situation and further diversify the production footprint, the capacity of the manufacturing site in Beihai was enlarged with an increase in employment by 25% to 4,100 people.
The Group has also been able to meet its staffing needs throughout China through aggressive recruitment and employee relations programs. These efforts include connecting employees’ families with the workplace through the “Johnson Electric Parents’ Association” and Changsheng Garden, an on-site family quarters that allows for multi-generation families to live together, enriching the accommodation culture and increasing employees’ sense of belonging.
China remains the major knowledge transfer centre in the Group through inbound and outbound exchange of talents.
Europe: A new manufacturing plant in Niš, Serbia, was officially inaugurated in September 2014 and has now commenced production. The plant increased manpower by more than two-fold over FY2014/15 to meet increasing customer demand.
In the spirit of educating young locals and developing prospective employees equipped with a specialised skills set, the Serbia manufacturing base has embarked on a long-term collaboration program with Machine School in Niš, which involves a rigorous selection process and curriculum to provide selected students with practical production training and imbue JE’s corporate values.
The European Shared Service Centre in Hungary was also strengthened and provides cost-effective shared services to the region while standardising and upholding service quality.

33
CORPORATE GOVERNANCE REPORTJohnson Electric Holdings Limited (“Company”) is committed to achieving high standards of corporate governance that properly protect and promote the interests of its shareholders and devotes considerable effort to identifying and formalising best practices of corporate governance.
BOARD OF DIRECTORS
The board of directors of the Company (“Board”) currently consists of three executive directors and seven non-executive directors (of whom five are independent) (“Directors”).
The independent non-executive directors are all experienced individuals from a range of industries and geographies. Their mix of professional skills and experience is an important element in the proper functioning of the Board and in ensuring a high standard of objective debate and overall input to the decision-making process. The Board has received from each independent non-executive director a written confirmation of their independence and has satisfied itself of such independence up to the approval date of this report in accordance with the Rules Governing the Listing of Securities (“Listing Rules”) on The Stock Exchange of Hong Kong Limited (“Stock Exchange”).
The profile of the Directors are provided on pages 158 to 161 of this report.
THE BOARD AT WORK
The Board is accountable to shareholders for the activities and performance of the Company and its subsidiaries (“Group”). Directors meet in person on a quarterly basis and on other occasions when a board-level decision on a particular matter is required. The Board has reserved for its decision or consideration matters covering corporate strategy, annual and interim results, directors’ appointment, succession planning, enterprise risk management, major acquisitions, disposals and capital transactions and other significant operational and financial matters.
Although the capacity of any board to involve itself in the details of a large international business is limited, the Company aims to provide its independent non-executive directors with extensive exposure and access to its operations and management. The board meeting agendas are structured to address the broad spectrum of key governance issues on a regular and systematic basis. Forming part of the continuous professional development program for Directors, visits to the Group’s principal operating facilities are arranged and relevant subject area experts are invited to address the Board from time to time.
The Board recognises the importance and benefits of conducting regular evaluations of its performance to ensure the effectiveness of its functioning. On an annual basis, a board effectiveness survey is sent to each Director in order to enable the performance of the Board to be evaluated. Responses to the survey are analysed and discussed at the Board meeting. Suggestions made by the Directors have been implemented to further improve the performance of the Board.

34Johnson Electric Holdings Limited
Annual Report 2015
Major corporate matters that are specifically delegated by the Board to management include the preparation of annual and interim accounts for board approval before public reporting, execution of business strategies and initiatives adopted by the Board, implementation of adequate systems of internal controls and enterprise risk management procedures, and compliance with relevant statutory requirements and rules and regulations.
The Group’s Executive Vice Presidents attend all board meetings to advise on strategic planning, corporate governance, enterprise risk management, statutory compliance, internal controls, mergers and acquisitions, financial, tax and accounting matters.
Under the Company’s Bye-law 109(A), one-third of the directors except the director holding office as executive chairman, who have served longest on the Board, shall retire from office and be eligible for re-election at each annual general meeting. As such, except the executive chairman, no director has a term of appointment longer than three years.
The Company has arranged for appropriate liability insurance to indemnify its Directors against liabilities arising out of corporate activities. The insurance coverage is reviewed on an annual basis.
COMMITTEES
The monitoring and assessment of certain governance matters are delegated to four committees which operate under defined terms of reference and are required to report to the Board on a regular basis. The composition of the committees during FY2014/15 and up to the date of this report is set out in the table below:
Nomination and Corporate Audit Remuneration Governance BoardDirectors Committee Committee Committee Committee
Executive DirectorsPatrick Shui-Chung Wang M MWinnie Wing-Yee Wang M M
Non-Executive DirectorPeter Kin-Chung Wang M
Independent Non-Executive DirectorsPeter Stuart Allenby Edwards CPatrick Blackwell Paul C MMichael John Enright M CJoseph Chi-Kwong Yam MChristopher Dale Pratt (effective 1 April 2015) M
C – Chairman
M – Member

CORPORATE GOVERNANCE REPORT
35
Audit Committee
The Audit Committee comprises two independent non-executive directors and one non-executive director who together have substantial experience in the fields of accounting, taxation, business, corporate governance and regulatory affairs. The current members are Mr. Patrick Blackwell Paul (Committee Chairman), Prof. Michael John Enright and Mr. Peter Kin-Chung Wang.
The Committee is responsible for monitoring the financial reporting, accounting, enterprise risk management and internal control aspects of the Group’s activities. It has full access to the Group’s Head of Corporate Audit Services to hear directly any concerns of the internal audit function that may have arisen during the course of the department’s work. The Committee also monitors the appointment, function and remuneration of the Group’s external auditor. The Committee’s authority and duties are set out in the terms of reference which are available on the websites of the Group and the Stock Exchange.
Four committee meetings were held in FY2014/15 to discuss and review the following matters together with the Chief Financial Officer, the Executive Vice President, the Vice President of Operations for Europe, the Controller and Principal Accounting Officer, the General Counsel, the Head of Tax, the Head of Corporate Audit Services, the Head of Financial Reporting, the Company Secretary and the external auditor:
1. The FY2013/14 annual results and interim results for FY2014/15, to ensure that the related disclosures in the financial statements were complete, accurate and fair and complied with accounting standards, the Listing Rules and legal requirements, and to submit the same to the Board for approval;
2. The work done by the external auditor, the relevant fees and terms of engagement and appropriate actions required on any significant control weaknesses;
3. The external auditor’s independence, including consideration of their provision of non-audit services;
4. The Corporate Audit Services Department’s staffing and team competencies, its internal audit plan and budget for approval, its report on work performed and the status of open issues for remedial action;
5. The overall adequacy and effectiveness of internal controls;
6. The Group’s enterprise risk management activity, namely the processes by which risks are assessed and registered and by which such risks are addressed for mitigation and management;
7. The status and adequacy of the Group’s insurance coverage;
8. The status of the Group’s global tax position and any fiscal audits by the various jurisdictions;
9. The status of intellectual property asset management; and
10. The status of litigation cases.

36Johnson Electric Holdings Limited
Annual Report 2015
Remuneration Committee
The Remuneration Committee consists of three independent non-executive directors and one executive director. The current members are Prof. Michael John Enright (Committee Chairman), Mr. Joseph Chi-Kwong Yam, Mr. Christopher Dale Pratt and Ms. Winnie Wing-Yee Wang.
The Committee determines the compensation structure and rewards for the Chief Executive and other executive directors and monitors the policies being applied in remunerating the senior management on behalf of the Board.
In addition, it has responsibility for reviewing and making appropriate recommendations to the Board on retirement plans and provisions and on management development and succession plans for executive directors and senior management. The Committee’s authority and duties are set out in the terms of reference which are available on the websites of the Group and the Stock Exchange.
At Johnson Electric, remuneration and incentive schemes are linked to the achievement of annual and long term performance goals. By providing total compensation at competitive industry levels, for on-target performance, the Group seeks to attract, motivate and retain the key executives essential to its long term success. To this end, the Committee directs the management in the engagement of outside remuneration experts and stays abreast of remuneration practices among comparable companies around the world. Senior management incentive schemes include an equity component that is designed to align the long term interest of management with those of shareholders.
All global staff positions, including senior management, are governed by an evaluation methodology which takes into account management / technical know-how, problem solving and accountability. Individual senior management remuneration acknowledges scope of responsibilities, contribution and performance. The base salary takes into account factors such as contribution to the business, employee retention and market remuneration. Annual incentives, when payable, are performance-based, and include Company’s and Group’s financial objectives as well as individual objectives which may be non-financial. The Long-Term Incentive Share Scheme for senior management provides for the grant of JEHL Restricted Stock Units (“RSUs”) and Performance Stock Units (“PSUs”). Vesting of these is subject to attainment of service milestones in the case of RSUs and, in the case of PSUs, the attainment over time of identified group wide financial goals. RSUs and PSUs are used to retain and motivate senior staff and are designed to maximise long term shareholder value.
In determining the level of remuneration and fees paid to members of the Board, a review of current practices in leading Hong Kong public companies and comparable companies elsewhere in the world is regularly conducted with the aid of an independent consultant. Board remuneration consists of an annual retainer with additional fees payable for committee memberships and attendance at meetings. An annual grant of fully-vested shares comprises a component of remuneration for the independent non-executive directors. Executive directors are not eligible for any remuneration or fees for board activities.

CORPORATE GOVERNANCE REPORT
37
The Remuneration Committee reviews the overall remuneration program of the Company over the short, medium and long term while addressing the goals of management development and retention and the enhancement of shareholder value.
No individual director or senior manager approves his or her own remuneration.
Four committee meetings were held in FY2014/15. During the financial year, the Committee addressed the following:
1. Retirement Plan Structures in Europe;
2. Director and Senior Executive Compensation and Benefits;
3. Long-Term Incentive Share Scheme Awards;
4. Annual Incentive Plan Measurement;
5. Healthcare Benefits in the United States;
6. New Long-Term Incentive Plan Rules; and
7. Renewal of Executive Committee members’ contracts.
Nomination and Corporate Governance Committee
The Nomination and Corporate Governance Committee comprises two independent non-executive directors and one executive director. The current members are Mr. Peter Stuart Allenby Edwards (Committee Chairman), Mr. Patrick Blackwell Paul and Dr. Patrick Shui-Chung Wang.
The Committee is responsible for the identification and evaluation of candidates for appointment or re-appointment as a director, as well as the development and maintenance of the Group’s overall corporate governance policies and practices. The Committee’s authority and duties are set out in the terms of reference which are available on the websites of the Group and the Stock Exchange.
The Board has adopted a Board Diversity Policy. The Committee monitors the implementation of this policy and has responsibility for leading the process for Board appointments and for identifying and nominating, for approval by the Board, candidates for appointment to the Board. Selection of candidates will be based on a range of perspectives, including but not limited to, cultural and educational background, professional experience and qualifications, skills, functional expertise, knowledge, gender and age. The candidates will be considered against objective criteria, having due regard for the benefits of diversity on the Board. The ultimate decision will be based on merit and contribution that the selected candidates will bring to the Board.

38Johnson Electric Holdings Limited
Annual Report 2015
In reviewing Board composition, the Committee will consider the benefits of all aspects of diversity including, but not limited to those described above, in order to maintain an appropriate range and balance of skills, experience and diversity of perspectives appropriate to the requirements of the Group’s business globally.
In accordance with the Bye-laws of the Company, every newly appointed director is subject to re-election at the next annual general meeting.
Two committee meetings were held in FY2014/15. The following is a summary of work performed by the Committee during the financial year:
1. Consideration and recommendation of the retiring directors for re-election at the Annual General Meeting;
2. Review of the structure, size and composition of the Board;
3. Consideration of the independence of all independent non-executive directors;
4. Review and approval of the corporate governance report and information for the Annual Report and the Interim Report;
5. Review of the Group’s report on compliance with laws and regulations in the countries in which it operates;
6. Consideration and recommendation to the Board for appointing an independent non-executive director as a member of the Remuneration Committee; and
7. Consideration of an emergency succession policy.
Board Committee
The Board Committee comprises two executive directors, Dr. Patrick Shui-Chung Wang and Ms. Winnie Wing-Yee Wang. Its primary function is to undertake and supervise the day to day management and operating affairs of the Group. It exercises leadership and develops and keeps under review strategy and business development initiatives of the Group and supervises their implementation. The Committee’s authority and duties are set out in the terms of reference and a summary of which is available on the Group’s website.

CORPORATE GOVERNANCE REPORT
39
Attendance of Directors at Various Meetings
The Board held four board meetings in FY2014/15 and the average attendance rate was 92.5%. Details of the attendance of individual directors at board meetings, committee meetings and the annual general meeting during FY2014/15 are set out in the table below:
Number of meetings attended / held
Nomination and Corporate Audit Remuneration Governance Annual Board Committee Committee Committee GeneralDirectors Meeting Meeting Meeting Meeting Meeting
Executive DirectorsPatrick Shui-Chung Wang 4/4 – – 2/2 1/1 (Chairman and Chief Executive)
Winnie Wing-Yee Wang 4/4 – 4/4 – 1/1 (Vice- ‐Chairman)
Austin Jesse Wang 4/4 – – – 0/1
Non-Executive DirectorsYik-Chun Koo Wang 2/4 – – – 0/1 (Honorary Chairman)
Peter Kin-Chung Wang 4/4 4/4 – – 0/1
Independent Non-Executive DirectorsPeter Stuart Allenby Edwards 4/4 – – 2/2 0/1
Patrick Blackwell Paul 4/4 4/4 – 2/2 1/1
Michael John Enright 4/4 4/4 4/4 – 0/1
Joseph Chi-Kwong Yam 4/4 – 4/4 – 0/1
Christopher Dale Pratt 3/4 – – – 0/1
Average attendance rate 92.5% 100% 100% 100% 30%
Date of meetings 15/05/2014 09/05/2014 14/05/2014 15/05/2014 10/07/2014 11/09/2014 28/07/2014 16/05/2014 12/03/2015 04/11/2014 03/11/2014 04/11/2014 12/03/2015 09/02/2015 11/03/2015

40Johnson Electric Holdings Limited
Annual Report 2015
INTERNAL CONTROL ANDENTERPRISE RISK MANAGEMENT
The Board is responsible for ensuring that a sound and effective system of internal control and enterprise risk management is maintained within the Group, and for reviewing its design and operational adequacy and effectiveness through the Audit Committee.
The internal control and enterprise risk management system, which includes a defined management structure with specified limits of authority and control responsibilities, is designed to (a) help the achievement of business objectives and safeguard the Group’s assets; (b) ensure proper maintenance of accounting records and reliability of financial reporting; (c) ensure compliance with relevant legislation and regulations; and (d) identify, manage and mitigate key risks to the Group.
Policies and procedures are established to ensure reasonable, but not absolute, assurance against material misstatement or loss and to manage, but not to eliminate, risks of failure in achieving the Group’s objectives.
Pursuant to a risk-based approach, the Group’s Corporate Audit Services Department independently reviews the risks associated with and controls over various operations and activities and evaluates their adequacy, effectiveness and compliance. Audit findings and recommendations are reported to the Audit Committee, senior management, and the external auditor. In addition, progress on audit recommendations implementation is followed up on a monthly basis. The results are discussed with the Audit Committee on a regular basis.
During its annual review, the Audit Committee also considers the adequacy of resources, qualifications and experience of staff of the Group’s accounting and financial reporting function and their training programs and budgets.
To supplement the above, under the Integrity and Ethics Policy, employees can report any ethical misconduct, impropriety or fraud cases within the Group to the Johnson Electric Whistleblower Hotline or in writing in confidence without the fear of recrimination in particular.
Based on the results of evaluations and representations made by the management, the Group’s Corporate Audit Services Department and the external auditor in FY2014/15, the Audit Committee is satisfied that:
• There is an ongoing process for identifying, evaluating and managing the significant risks faced by the Group that threaten the achievement of its business objectives; and
• An appropriate system of internal control and enterprise risk management has been in place in FY2014/15, and up to the date of approval of the Annual Report.

CORPORATE GOVERNANCE REPORT
41
EXTERNAL AUDITOR
Johnson Electric’s independent external auditor is PricewaterhouseCoopers. The Audit Committee is responsible for considering the appointment of the external auditor and also reviews any non-audit functions performed by the external auditor for the Group. In particular, the Committee will consider whether such non-audit functions could lead to any potential material conflict of interest.
During FY2013/14 and FY2014/15, the services (and associated remuneration) provided to the Group by PricewaterhouseCoopers were as follows:
US$ million FY2014/15 FY2013/14
Audit 2.46 2.35
Taxation services 1.32 1.28
Other advisory services 0.33 0.43
Included above are US$0.5 million of contracted fees for work to be performed subsequent to 31 March.
DIRECTORS’ AND AUDITOR’S RESPONSIBILITIES FOR ACCOUNTS
The Directors’ responsibilities for the accounts are set out on page 55 and the responsibilities of the external auditor to the shareholders are set out on pages 58 to 59.
CORPORATE GOVERNANCE CODE
During the year ended 31 March 2015, the Company complied with the code provisions set out in the Corporate Governance Code contained in Appendix 14 of the Listing Rules, except for the following deviations:
Code Provision A.2.1
Code A.2.1 provides, inter alia, that the roles of chairman and chief executive should be separate and should not be performed by the same individual.
Neither the Company’s Bye-laws nor The Johnson Electric Holdings Limited Company Act, 1988 (a private act of Bermuda) contains any requirement as to the separation of these roles.
Dr. Patrick Shui-Chung Wang is the Chairman and Chief Executive of the Company. The Board is of the opinion that it is appropriate and in the best interests of the Company that Dr. Wang should hold both offices. The Board believes that it is able to effectively monitor and assess management in a manner that properly protects and promotes the interests of shareholders.

42Johnson Electric Holdings Limited
Annual Report 2015
Code Provision A.4.1 and A.4.2
Code A.4.1 provides, inter alia, that non-executive directors should be appointed for a specific term, subject to re-election.
Code A.4.2 provides that every director, including those appointed for a specific term, should be subject to retirement by rotation at least once every three years.
The independent non-executive directors are appointed for a specific term while the non-executive directors do not have a specific term of appointment. However, under Section 3(e) of The Johnson Electric Holdings Limited Company Act, 1988 and the Company’s Bye-law 109(A), one-third of the Directors who have served longest on the Board since their last election shall retire and be eligible for re-election at each annual general meeting. Accordingly, no director has a term of appointment longer than three years. Bye-law 109(A) also states that the director holding office as the executive chairman is not subject to retirement by rotation and shall not be counted in determining the number of directors to retire.
In the opinion of the Board, it is important for the stability and beneficial to the growth of the Company that there is, and is seen to be, continuity of leadership in the role of the Chairman of the Company and, in consequence, the Board is of the view that the Chairman should not be subject to retirement by rotation or hold office for a limited term at the present time.
Code Provision A.6.7
Code A.6.7 provides, inter alia, that independent non-executive directors and other non-executive directors should attend general meetings and develop a balanced understanding of the views of shareholders.
Ms. Yik-Chun Koo Wang, Mr. Peter Kin-Chung Wang, Mr. Peter Stuart Allenby Edwards, Prof. Michael John Enright, Mr. Joseph Chi-Kwong Yam and Mr. Christopher Dale Pratt were unable to attend the Annual General Meeting of the Company held on 10 July 2014 due to overseas commitments or other prior business engagements.
CONTINUOUS PROFESSIONAL DEVELOPMENT
On appointment to the Board, each Director receives an induction package covering the Group’s businesses, operations and the general, statutory and regulatory obligations of being a director to ensure sufficient awareness of responsibilities under the Listing Rules and other relevant regulatory requirements. Thereafter, the Company provides the Directors with regular updates relating to the Group’s business and the business environment in which the Group operates.

CORPORATE GOVERNANCE REPORT
43
All Directors have complied with the code provision in relation to continuous professional development. This has involved various forms of activities including attending presentations given by external professional advisors and reading materials relevant to the Company’s business, director’s duties and responsibilities.
The Company continuously updates Directors on the latest developments regarding the Listing Rules and other applicable regulatory requirements, to ensure compliance and enhance their awareness of good corporate governance practices.
SHAREHOLDERS’ RIGHTS
Convening a Special General Meeting
Pursuant to Section 74 of the Bermuda Companies Act 1981, shareholder(s) holding at the date of the deposit of the requisition not less than one-tenth of the paid-up capital of the Company carrying the right of voting at general meetings of the Company shall have the right to submit a written requisition requiring a special general meeting (“SGM”) to be called by the Board. The written requisition (i) must state the purposes of the SGM, and (ii) must be signed by the requisitionists and deposited at the registered office of the Company for attention of the Company Secretary of the Company, and may consist of several documents in like form, each signed by one or more requisitionists. Such requisitions will be verified with the Company’s share registrars and upon their confirmation that the requisition is proper and in order, the Company Secretary will ask the Board to convene a SGM by serving sufficient notice to all shareholders. On the contrary, if the requisition has been verified as not in order, the requisitionists will be advised of this outcome and accordingly, the SGM will not be convened as requested.
If the Board does not within 21 days from the date of the deposit of the requisition proceed duly to convene a SGM, the requisitionists or any of them representing more than one-half of the total voting rights of all of them may convene a SGM, but any SGM so convened shall not be held after expiration of three months from the said date of deposit of the requisition. A SGM convened by the requisitionists shall be convened in the same manner, as nearly as possible, as that in any SGM to be convened by the Board.
Putting Forward Proposals at General Meetings
Pursuant to Sections 79 and 80 of the Bermuda Companies Act 1981, either any number of shareholders representing not less than one-twentieth of the paid-up capital of the Company carrying the right of voting at general meetings of the Company, or not less than 100 shareholders, can request the Company in writing to (a) give to shareholders entitled to receive notice of the next annual

44Johnson Electric Holdings Limited
Annual Report 2015
general meeting notice of any resolution which may properly be moved and is intended to be moved at that meeting; and (b) circulate to shareholders entitled to have notice of any general meeting sent to them any statement of not more than 1,000 words with respect to the matter referred to in any proposed resolution or the business to be dealt with at that meeting. The requisition signed by all the requisitionists must be deposited at the registered office of the Company with a sum reasonably sufficient to meet the Company’s relevant expenses and not less than six weeks before the meeting in case of a requisition requiring notice of a resolution or not less than one week before the meeting in case of any other requisition.
Proposing a Person for Election as a Director
The procedures for proposing candidate(s) for election as director(s) at a general meeting are set out in the Shareholder Information under the Investor Relations section of the website of the Group.
Enquiries to the Board
Shareholders may send their enquiries and concerns, in written form, to the Board by addressing them to the Company Secretary at 12 Science Park East Avenue, 6/F., Hong Kong Science Park, Shatin, New Territories, Hong Kong. Shareholders may also make enquiries to the Board at the general meetings of the Company. In addition, shareholders can contact Computershare Hong Kong Investor Services Limited, the share registrar of the Company in Hong Kong, if they have any enquiries about their shareholdings and entitlements to dividend.
There was no significant change to the Company’s constitutional documents during FY2014/15.
MODEL CODE FOR SECURITIES TRANSACTIONS
The Company has adopted procedures governing directors’ securities transactions in compliance with the Model Code as set out in Appendix 10 of the Listing Rules. Specific confirmation has been obtained from all Directors to confirm compliance with the Model Code throughout the year ended 31 March 2015.
Employees who are likely to be in possession of unpublished inside information of the Group are also subject to compliance with guidelines on no less exacting terms than the Model Code.
COMMUNICATIONS WITH SHAREHOLDERS
The Company uses a number of formal communication channels to account to shareholders for the performance of the Group. These include the annual report and accounts, the interim report, periodic announcements made through the Stock Exchange, as well as through the annual general meeting. Copies of relevant corporate and financial information are also made available through the Group’s website: www.johnsonelectric.com.

CORPORATE GOVERNANCE REPORT
45
The Company aims to provide its shareholders and potential investors with high standards of disclosure and financial transparency. In order to provide effective disclosure to investors and potential investors and to ensure they all receive equal access to the same information at the same time, inside information is released by way of formal public announcements as required by the Listing Rules. The Company supplements and follows up such announcements through periodic presentations, investor road shows and conference calls with the international investment community. The Company also welcomes comments and questions from shareholders at its annual general meeting.
SOCIAL RESPONSIBILITY
Johnson Electric is dedicated to socially responsible interactions with shareholders, customers, employees, suppliers, business partners and local communities worldwide. The Group’s commitment to social accountability includes policies and practices on a variety of issues such as human rights, non-discrimination and environmental management.
The Group’s commitment to business excellence and its constant focus on innovation and quality require a work environment where the highest standard of business ethics are respected. Management and the Board are committed to operating in compliance with all applicable national, state and local laws.
Environmental, Health and Safety
The Group is committed to protecting the environment and the health and safety of employees wherever it operates around the world. It is our belief that excellent Environmental, Health and Safety (“EHS”) performance will contribute to the sustainable growth of the company for generations to come.
Specific EHS goals are:• No harm to people working for us; and• No damage to the environment wherever we operate.
The Group takes a proactive approach to addressing these issues and have established progressive structures for managing its EHS programs. Critical measurable factors are tracked through a global EHS management system, with key performance indicators reported to the Chief Executive and the senior management team, monthly.
Management requires all worldwide locations to apply the EHS system to avoid, mitigate and manage the various environmental, health and safety risks. When a host country’s regulations differ from the levels and measures presented in the JE EHS Standards, the relevant JE location is expected to achieve both the country regulations and those specified in the JE EHS Standards.
Most of the operating facilities in the JE Group are certified by the internationally recognised ISO14001 and/or OHSAS 18001 standards on environmental management and occupational health and safety management. Compliance to these international standards is regularly audited and verified by external auditors. The remainder sites continue to progress towards conformity with these standards.

46Johnson Electric Holdings Limited
Annual Report 2015
Responsible Corporate Citizen
A commitment to the education and development of young people is central to Johnson Electric’s efforts as a responsible corporate citizen. This includes:
• Donations to and long-term collaboration with education institutions at various locations in the world and the provision of financial and other support to young students to increase their general academic qualifications and workplace skills in Group sponsored programs; and
• The Johnson Electric Technical College (“JETC”), based in Shajing, China location provides a mix of general and technical education for youths from China, administered by staff and educators over a three-year course. This program is successful at producing skilled young technicians, who, it is hoped, will remain with the Group throughout their careers. Since its foundation in 2004, JETC has accepted over 900 students, with a further intake of over 150 students expected to join in August 2015.
JETC also assists in the establishment and development of new locations such as Chennai, India; Zacatecas, Mexico; and Niš, Serbia. Selected individuals from such locations attend JETC in Shajing, China, for 4-8 months induction and training. This ensures that the Group has a nucleus of Johnson Electric trained employees in these locations, capable of providing strong support to regional customers.
Our Communities
The Group is dedicated to being an active participant in the local community wherever it does business in around the world and pursues responsible employment and social practices that are sustainable over time in all business locations. The Group also encourages these practices be adopted by its suppliers and business partners.
Good corporate social policies are not only desirable but make sound business sense; investments made today for our people and communities are for the benefit of our world tomorrow.

47
REPORT OF THE DIRECTORSThe Directors have pleasure in submitting their report together with the audited accounts for the year ended 31 March 2015.
PRINCIPAL ACTIVITIES
The principal activity of the Company is investment holding. The principal activities of the subsidiaries are shown in Note 38 to the accounts.
RESULTS AND APPROPRIATIONS
The results of the Group for the year ended 31 March 2015 are set out in the consolidated income statement on page 63 of the accounts.
The Directors declared an interim dividend of 1.79 US Cents (14 HK Cents) per share, totalling US$15.5 million which was paid on 6 January 2015.
The Board recommends the payment of a final dividend of 4.36 US Cents (34 HK Cents) per share, totalling US$37.8 million, payable on 31 July 2015.
DISTRIBUTABLE RESERVES
As of 31 March 2015, the distributable reserves of the Company available for distribution as dividends amounted to US$1,631.1 million, comprising retained earnings of US$1,566.8 million and contributed surplus of US$64.3 million.
Under the Companies Act 1981 of Bermuda (as amended), the contributed surplus shall not be distributed to the shareholders if there are reasonable grounds for believing that:
(i) The Company is, or would after the payment be, unable to pay its liabilities as they become due; or
(ii) The realisable value of the Company’s assets would thereby be less than its liabilities.
DONATIONS
During the year, the Group made donations of US$0.2 million (FY2013/14: US$0.2 million).

48Johnson Electric Holdings Limited
Annual Report 2015
CONVERTIBLE BONDS
On 2 April 2014, the Group issued convertible bonds (“CB”) in an aggregate principal amount of US$200 million with a cash coupon rate of 1% per annum, and a 7 year life with a 5 year put option. Further information on the CB can be found in page 87 of the Annual Report.
DIRECTORS
The directors during the year and up to the date of this report were:
Yik-Chun Koo WangPatrick Shui-Chung Wang JPWinnie Wing-Yee WangAustin Jesse WangPeter Kin-Chung WangPeter Stuart Allenby EdwardsPatrick Blackwell Paul CBE
Michael John EnrightJoseph Chi-Kwong Yam GBM, GBS, CBE, JP
Christopher Dale Pratt CBE
In accordance with Bye-law 109(A) of the Company’s Bye-laws, Mr. Austin Jesse Wang, Mr. Peter Kin-Chung Wang and Mr. Joseph Chi-Kwong Yam shall retire from office by rotation and being eligible, offer themselves for re-election.
None of the directors proposed for re-election at the forthcoming Annual General Meeting has a service contract with the Company which is not determinable by the Company within one year without payment of compensation, other than statutory compensation.
No transactions, arrangements and contracts of significance in relation to the Group’s business to which the Company or any of its subsidiaries was a party and in which a Director of the Company had a material interests, whether directly or indirectly, subsisted at the end of the year or at any time during the year.
The Company is managed through the Board which currently comprises ten directors. As of the date of this report, three of the directors are executive and seven of the directors are non-executive, of whom five are independent. Their details are set out in the Profile of Directors and Senior Management section on pages 158 to 161.

REPORT OF THE DIRECTORS
49
DISCLOSURE OF INTERESTS
Directors
As of 31 March 2015, the interests of each Director and Chief Executive of the Company in the shares of the Company or any of the Company’s associated corporations (within the meaning of Part XV of the Securities and Futures Ordinance (“SFO”)) as recorded in the register required to be kept under Section 352 of the SFO were as follows:
Shares of HK$0.05 each of the Company Personal OtherName Interests Interests
Austin Jesse Wang 46,875 – (Note 1)
Yik-Chun Koo Wang – 550,574,720 (Notes 2 & 3)
Peter Kin-Chung Wang – 144,250 (Note 4)
Peter Stuart Allenby Edwards – 38,250 (Note 5)
Patrick Blackwell Paul 30,750 –
Michael John Enright 13,250 –
Joseph Chi-Kwong Yam 9,750 –
Christopher Dale Pratt 54,000 –
Notes:
1. These shares were granted on 3 June 2014 under the Long-Term Incentive Share Scheme and are to be vested in the third year after the grant.
2. These shares were held, directly or indirectly, by the trustees of various trusts associated with the Wang family.
3. Duplications of shareholdings occurred among and between the parties shown below under Substantial Shareholders.
4. These shares were held beneficially by Peter Kin-Chung Wang’s spouse.
5. These shares were held under a trust of which Peter Stuart Allenby Edwards was one of the beneficiaries.
Save as disclosed herein, as of 31 March 2015, the register maintained by the Company pursuant to Section 352 of the SFO recorded no other interests or short positions of the Directors and Chief Executive in any shares of the Company or its associated corporations (within the meaning of Part XV of the SFO).
At no time during the year, the Directors and Chief Executive (including their spouses and children under 18 years of age) had any interests in, or had been granted, or exercised, any rights to subscribe for shares of the Company or its associated corporations required to be disclosed pursuant to the SFO.

50Johnson Electric Holdings Limited
Annual Report 2015
Substantial Shareholders
As of 31 March 2015, the register of substantial shareholders maintained under Section 336 of the SFO shows that the Company had been notified of the following substantial shareholders’ interests, being 5% or more of the Company’s issued share capital:
Number of Approximate %Name of shareholder Capacity shares held of shareholding
Yik-Chun Koo Wang Beneficiary of 550,574,720 62.52 family trusts (Notes 1 & 2)
Ansbacher (Bahamas) Limited Trustee 221,760,000 25.18 (Note 1)
HSBC International Trustee Limited Trustee 190,201,822 21.60 (Note 1)
Great Sound Global Limited Interest of controlled 188,585,840 21.41 corporation (Note 3)
Winibest Company Limited Beneficial owner 188,585,840 21.41 (Note 4)
Federal Trust Company Limited Trustee 140,228,880 15.92 (Note 1)
Schroders Plc Investment manager 62,683,689 7.11 (Note 5)
Ceress International Investment Trustee 55,753,520 6.33 (PTC) Corporation (Note 6)
Merriland Overseas Limited Interest of controlled 52,985,760 6.01 corporation (Note 7)
Notes:
1. The shares in which Ansbacher (Bahamas) Limited and Federal Trust Company Limited were interested and 188,585,840 of the shares in which HSBC International Trustee Limited was interested were held, directly or indirectly, by them as the trustees of various trusts associated with the Wang family and were included in the shares in which Ms. Yik-Chun Koo Wang was interested as referred to above under Directors’ Interests of Disclosure of Interests.
2. The shares in which Ms. Yik-Chun Koo Wang was interested as referred to above formed part of the shares referred to in Note 1.
3. The interests of Great Sound Global Limited in the Company formed part of the interests in the Company held by HSBC International Trustee Limited.
4. The interests of Winibest Company Limited in the Company were duplicated by the interests in the Company held by Great Sound Global Limited.
5. Upon the 1 for 4 share consolidation became effective on 15 July 2014 (“Share Consolidation”), pro-rata adjustment has been made to the number of shares in the Company accordingly.
6. The interests of Ceress International Investment (PTC) Corporation in the Company formed part of the interests in the Company held by Federal Trust Company Limited.
7. The interests of Merriland Overseas Limited in the Company formed part of the interests in the Company held by Federal Trust Company Limited.
Save as disclosed herein, as of 31 March 2015, the register maintained by the Company pursuant to Section 336 of the SFO recorded no other interests or short positions in the shares of the Company.

REPORT OF THE DIRECTORS
51
PURCHASE, SALE OR REDEMPTION OF SHARES
During the year ended 31 March 2015, the Company repurchased a total of 14,257,000 ordinary shares of HK$0.05 each of the Company on the Stock Exchange. All of the shares repurchased were subsequently cancelled. The number of issued shares of the Company as of 31 March 2015 was 880,542,105. Particulars of the shares repurchased are as follows:
Purchase price paid per share AggregateMonth of Number of ordinary Highest Lowest consideration paidrepurchase shares repurchased HK$ HK$ HK$ million*
August 2014 56,500 29.95 29.95 1.69September 2014 8,106,000 29.95 29.20 242.05October 2014 567,500 29.95 29.45 16.98November 2014 1,837,000 29.95 29.85 54.98December 2014 3,690,000 29.95 28.90 109.23
14,257,000 424.93
* Excluding brokerage and cancellation fees of HK$1.4 million
The Directors consider the repurchases a constructive element in the prudent management of the Company’s overall capital structure and in enhancing returns to shareholders over time.
Save as disclosed above, neither the Company nor any of its subsidiaries purchased, sold or redeemed any of the Company’s shares during the year.
SHARE SCHEME
Long-Term Incentive Share Scheme
The Long-Term Incentive Share Scheme (“Share Scheme”) was approved by the shareholders on 24 August 2009. The Share Scheme was further amended, with its amendments being approved by the shareholders, on 20 July 2011. The Board may grant time-vested units (Restricted Stock Units) and performance-vested units (Performance Stock Units) or cash payment in lieu of shares to such eligible employees and directors as the Board may select at its absolute discretion under the Share Scheme.

52Johnson Electric Holdings Limited
Annual Report 2015
During the year ended 31 March 2015, the Company purchased 13,748,875 shares* of the Company at a cost of HK$392.1 million in connection with the Share Scheme for directors and eligible employees. The highest and the lowest purchase price paid per share were HK$29.95 and HK$24.28*, respectively.
Details of shares purchased by the Company during the year are as follows:
Year ended 31 March 2015 Before Share Consolidation After Share Consolidation
Purchase price Purchase price per share per share
No. of shares Highest Lowest No. of shares Highest Lowest purchased HK$ HK$ purchased HK$ HK$
1 April 2014 to 14 July 2014 18,554,500 7.15 6.07 4,638,625* 28.60* 24.28*
15 July 2014 to 31 March 2015 9,110,250 29.95 26.80
Aggregate number of shares purchased, as of 31 March 2015 13,748,875
* The number of shares purchased and the highest and lowest purchase price paid per share have been adjusted to reflect the impact of Share Consolidation.
Movements in the number of unvested shares granted as of the date of this report are as follows:
Number of unvested shares granted (thousands) Restricted Performance Stock Units Stock Units Total
Unvested shares granted, as of 31 March 2014* 3,624 4,300 7,924Shares granted to Directors and employees during the year 1,828 2,267 4,095Shares vested to Directors and employees during the year (794) (815) (1,609)Forfeited during the year (140) (222) (362)
Unvested shares granted, as of 31 March 2015 4,518 5,530 10,048
Shares vested to Directors and employees in FY2015/16 (1,256) – (1,256)Forfeited in FY2015/16 (22) (48) (70)
Unvested shares granted, as of the date of this report 3,240 5,482 8,722
* The number of shares as of 31 March 2014 has been adjusted to reflect the impact of Share Consolidation.

REPORT OF THE DIRECTORS
53
The number of unvested shares are as follows:
Number of unvested shares granted (thousands) Restricted PerformanceVesting period Stock Units Stock Units Total
FY2015/16 – 1,253 1,253FY2016/17 1,364 2,055 3,419FY2017/18 1,426 2,174 3,600FY2018/19 125 – 125FY2019/20 325 – 325
Total unvested shares, as of the date of this report 3,240 5,482 8,722
Share Option Scheme
The Company had on 29 July 2002 adopted a share option scheme (“Option Scheme”). The Option Scheme expired on 28 July 2012 and no options could be granted afterwards. However, any unexercised options under the Option Scheme would continue to be valid and exercisable subject to the provisions of the Option Scheme within their respective exercisable periods. As of 31 March 2015, all of the then outstanding share options granted under the Option Scheme lapsed in their respective exercisable periods.
Details of the share options granted under the Option Scheme as of the date of this report were as follows:
Options Options Subscription Options lapsed held at the priceType of held at during date of this per share Exercisable Exercisablegrantees 31/03/2014* the year* report (HK$)* Date of grant from until
Employees 25,000 (25,000) – 29.60 28/12/2004 01/01/2007 27/12/2014
25,000 (25,000) – 29.60 28/12/2004 01/01/2008 27/12/2014
50,000 (50,000) –
* The number of options and the subscription price per share have been adjusted to reflect the impact of Share Consolidation.
Apart from the Share Scheme and the Option Scheme mentioned above, there were no other arrangements to which the Company or its subsidiaries was a party to enable the Directors of the Company to acquire benefits by means of the acquisition of shares in, or debentures of, the Company or any other body corporate.

54Johnson Electric Holdings Limited
Annual Report 2015
JOHNSON ELECTRIC GROUP TEN-YEAR SUMMARY
A summary of the results and of the assets and liabilities of the Group for the previous ten financial years are set out on pages 156 to 157.
PRE-EMPTIVE RIGHTS
No pre-emptive rights exist under the laws of Bermuda in relation to issues of new shares by the Company.
MAJOR SUPPLIERS AND CUSTOMERS
During the year, the Group purchased less than 30% of its goods and services from its five largest suppliers and sold less than 30% of its goods and services to its five largest customers.
MANAGEMENT CONTRACTS
No contracts concerning the management and administration of the whole or any substantial part of the business of the Company were entered into or existed during the year.
PUBLIC FLOAT
Based on the information that is publicly available to the Company and within the knowledge of the Directors of the Company, as of the date of this report, there is sufficient public float of more than 25% of the Company’s issued shares as required under the Listing Rules.
SENIOR MANAGEMENT
The profile of the senior management is set out in the Profile of Directors and Senior Management section on pages 161 to 163.
CORPORATE GOVERNANCE
Principal corporate governance practices as adopted by the Company are set out in the Corporate Governance Report on pages 33 to 46.

REPORT OF THE DIRECTORS
55
DIRECTORS’ RESPONSIBILITIES FOR THE ACCOUNTS
The Directors are responsible for the preparation of accounts for each financial period which give a true and fair view of the state of affairs of the Group and of the results and cash flows for that period. In preparing these accounts for the year ended 31 March 2015, the Directors have selected suitable accounting policies and applied them consistently, made judgements and estimates that are prudent and reasonable, and have prepared the accounts on a going concern basis. The Directors are responsible for keeping proper accounting records which disclose with reasonable accuracy at any time the financial position of the Group.
AUDITOR
The accounts have been audited by PricewaterhouseCoopers, who retire and, being eligible, offer themselves for re-appointment.
On behalf of the Board
Patrick Shui-Chung Wang JPChairman and Chief Executive
Hong Kong, 13 May 2015

56Johnson Electric Holdings Limited
Annual Report 2015
FINAL DIVIDENDThe Board will recommend at the Annual General Meeting to be held on 9 July 2015 (Thursday) a final dividend of 34 HK Cents equivalent to 4.36 US Cents per share (2014: 34 HK Cents or 4.36 US Cents) payable on 31 July 2015 (Friday) to persons who are registered shareholders of the Company on 22 July 2015 (Wednesday), making a total distribution of 48 HK Cents equivalent to 6.15 US Cents per share for the year ended 31 March 2015 (2014: 46 HK Cents or 5.90 US Cents*). The Board’s intention is to have the interim dividend increase over time, such that it will represent one-third of the previous year’s total dividend payment.
* Dividend per share has been adjusted on the basis of the number of shares of the Company after every 4 shares of the Company with a nominal value of HK$0.0125 each be consolidated into 1 consolidated share of the Company with a nominal value of HK$0.05 each became effective on 15 July 2014.
CLOSING REGISTER OF SHAREHOLDERS
ATTENDING ANNUAL GENERAL MEETING
The Register of Shareholders of the Company will be closed from 7 July 2015 (Tuesday) to 9 July 2015 (Thursday) inclusive, during which no transfer of shares will be registered.
In order to qualify for attending and voting at the Annual General Meeting, all transfers accompanied by the relevant share certificates must be lodged with the Company’s registrar in Hong Kong, Computershare Hong Kong Investor Services Limited at Shops 1712-1716, 17th Floor, Hopewell Centre, 183 Queen’s Road East, Wan Chai, Hong Kong (not the registrar in Bermuda) for registration, not later than 4:30 p.m. on 6 July 2015 (Monday).
FINAL DIVIDEND
The Register of Shareholders of the Company will be closed from 20 July 2015 (Monday) to 22 July 2015 (Wednesday) inclusive, during which no transfer of shares will be registered.
In order to qualify for the proposed final dividend, all transfers accompanied by the relevant share certificates must be lodged with the Company’s Registrar in Hong Kong, Computershare Hong Kong Investor Services Limited at Shops 1712-1716, 17th Floor, Hopewell Centre, 183 Queen’s Road East, Wan Chai, Hong Kong (not the registrar in Bermuda) for registration, not later than 4:30 p.m. on 17 July 2015 (Friday). Shares of the Company will be traded ex-dividend as from 16 July 2015 (Thursday).

190515Johnson(Client)
JO: 43215(N)1P*22051409 Accounts
P.57
57
STATEMENT OF ACCOUNTS
CONTENTS
INDEPENDENT AUDITOR’S REPORT 58
CONSOLIDATED BALANCE SHEET 60
JEHL BALANCE SHEET 62
CONSOLIDATED INCOME STATEMENT 63
CONSOLIDATED STATEMENT OF COMPREHENSIVE 64 INCOME
CONSOLIDATED STATEMENT OF CHANGES IN EQUITY 65
CONSOLIDATED CASH FLOW STATEMENT 67
NOTES TO THE ACCOUNTS 69

Annual Report 2015
58Johnson Electric Holdings Limited
INDEPENDENT AUDITOR’S REPORT
TO THE SHAREHOLDERS OF JOHNSON ELECTRIC HOLDINGS LIMITED(incorporated in Bermuda with limited liability)
We have audited the consolidated financial statements of Johnson Electric Holdings Limited (“JEHL”) and its subsidiaries (together, the “Group”) set out on pages 60 to 155, which comprise the consolidated and JEHL balance sheets as at 31 March 2015, and the consolidated income statement, the consolidated statement of comprehensive income, the consolidated statement of changes in equity and the consolidated cash flow statement for the year then ended, and a summary of significant accounting policies and other explanatory information.
DIRECTORS’ RESPONSIBILITY FOR THE CONSOLIDATED FINANCIAL STATEMENTS
The directors of JEHL are responsible for the preparation of consolidated financial statements that give a true and fair view in accordance with Hong Kong Financial Reporting Standards issued by the Hong Kong Institute of Certified Public Accountants and the disclosure requirements of the predecessor Hong Kong Companies Ordinance (Cap 32), and for such internal control as the directors determine is necessary to enable the preparation of consolidated financial statements that are free from material misstatement, whether due to fraud or error.
AUDITOR’S RESPONSIBILITY
Our responsibility is to express an opinion on these consolidated financial statements based on our audit and to report our opinion solely to you, as a body, in accordance with Section 90 of the Companies Act 1981 of Bermuda and for no other purpose. We do not assume responsibility towards or accept liability to any other person for the contents of this report.
We conducted our audit in accordance with Hong Kong Standards on Auditing issued by the Hong Kong Institute of Certified Public Accountants. Those standards require that we comply with ethical requirements and plan and perform the audit to obtain reasonable assurance about whether the consolidated financial statements are free from material misstatement.
An audit involves performing procedures to obtain audit evidence about the amounts and disclosures in the consolidated financial statements. The procedures selected depend on the auditor’s judgement, including the assessment of the risks of material misstatement of the consolidated financial statements, whether due to fraud or error. In making those risk assessments, the auditor considers internal control relevant to the entity’s preparation of consolidated financial statements

59
that give a true and fair view in order to design audit procedures that are appropriate in the circumstances, but not for the purpose of expressing an opinion on the effectiveness of the entity’s internal control. An audit also includes evaluating the appropriateness of accounting policies used and the reasonableness of accounting estimates made by the directors, as well as evaluating the overall presentation of the consolidated financial statements.
We believe that the audit evidence we have obtained is sufficient and appropriate to provide a basis for our audit opinion.
OPINION
In our opinion, the consolidated financial statements give a true and fair view of the state of affairs of JEHL and of the Group as at 31 March 2015, and of the Group’s profit and cash flows for the year then ended in accordance with Hong Kong Financial Reporting Standards and have been properly prepared in accordance with the disclosure requirements of the predecessor Hong Kong Companies Ordinance (Cap 32).
PricewaterhouseCoopersCertified Public Accountants
Hong Kong, 13 May 2015

Annual Report 2015
60Johnson Electric Holdings Limited
As of 31 March 2015CONSOLIDATED BALANCE SHEET
2015 2014 Note US$’000 US$’000
Assets
Non-current assets Property, plant and equipment 3 410,578 392,226 Investment property 4 82,035 68,371 Intangible assets 5 595,578 650,733 Investment in associate 6 2,720 2,202 Other financial assets 7 215,182 29,887 Defined benefit pension plan assets 15 7,156 6,929 Deferred income tax assets 16 43,500 37,508 Other non-current assets 9,679 6,513
1,366,428 1,194,369
Current assets Inventories 8 222,029 207,041 Trade and other receivables 9 414,893 441,637 Non-current assets held for sale 10 8,003 – Financial assets at fair value through profit and loss – 1,085 Other financial assets 7 60,072 10,590 Income tax recoverable 3,386 2,004 Cash and deposits 11 773,172 643,986
1,481,555 1,306,343
Current liabilities Trade payables 12 206,161 207,234 Other payables and deferred income 175,319 179,172 Current income tax liabilities 37,244 45,660 Other financial liabilities 7 14,531 21,500 Borrowings 13 65,816 115,459 Provision obligations and other liabilities 15 21,713 24,330
520,784 593,355
Net current assets 960,771 712,988
Total assets less current liabilities 2,327,199 1,907,357

61
2015 2014 Note US$’000 US$’000
Non-current liabilities Other payables and deferred income 16,642 15,524 Other financial liabilities 7 72,189 40,386 Borrowings 13 28,214 1,394 Convertible bonds 14 197,345 – Deferred income tax liabilities 16 69,821 53,609 Provision obligations and other liabilities 15 42,076 30,126
426,287 141,039
NET ASSETS 1,900,912 1,766,318
Equity Share capital Ordinary shares 17 5,681 5,773 Shares held for the Share Scheme 17 (61,082) (13,896) Share premium 17 – 23,628 Reserves 18 1,879,951 1,677,884 Proposed dividends 25 37,768 38,910
1,862,318 1,732,299Non-controlling interests 38,594 34,019
TOTAL EQUITY 1,900,912 1,766,318
The notes on pages 69 to 155 form an integral part of these consolidated financial statements.
Patrick Shui-Chung Wang JP Winnie Wing-Yee WangDirector Director

Annual Report 2015
62Johnson Electric Holdings Limited
As of 31 March 2015JEHL BALANCE SHEET
2015 2014 Note US$’000 US$’000
AssetsNon-current assets Interest in subsidiaries 37 996,397 997,638 Other financial assets 37 39,932 201
1,036,329 997,839
Current assets Amounts due from subsidiaries 37 799,222 613,132 Other financial assets 37 10,349 5 Other receivables 37 345 – Cash and deposits 37 37 53
809,953 613,190
Current liabilities Amounts due to subsidiaries 37 1 58 Other financial liabilities 37 – 1,071 Other payables 37 1,152 85
1,153 1,214
Non-current liabilities Other financial liabilities 37 – 6,622 Convertible bonds 14 197,345 – Deferred income tax liabilities 3,154 –
200,499 6,622
NET ASSETS 1,644,630 1,603,193
Equity Share capital Ordinary shares 17 5,681 5,773 Shares held for the Share Scheme 17 (61,082) (13,896) Share premium 17 – 23,628 Reserves 37 1,662,263 1,548,778 Proposed dividends 37 37,768 38,910
TOTAL EQUITY 1,644,630 1,603,193
The notes on pages 69 to 155 form an integral part of these consolidated financial statements.
Patrick Shui-Chung Wang JP Winnie Wing-Yee WangDirector Director

63
For the year ended 31 March 2015CONSOLIDATED INCOME STATEMENT
2015 2014 Note US$’000 US$’000
Sales 2 2,136,052 2,097,618
Cost of goods sold (1,503,647) (1,478,711)
Gross profit 632,405 618,907
Other income and gains, net 19 17,918 19,762
Selling and administrative expenses 20 (407,539) (405,180)
Operating profit 242,784 233,489
Finance income 21 13,998 10,927
Finance costs 21 (8,452) (1,830)
Share of profit of associate 6 731 408
Profit before income tax 249,061 242,994
Income tax expense 23 (29,249) (28,098)
Profit for the year 219,812 214,896
Profit attributable to non-controlling interests (8,918) (7,031)
Profit attributable to shareholders 210,894 207,865
Basic earnings per share for profit attributable to the shareholders during the year (expressed in US Cents per share) 24 24.11 23.40
Diluted earnings per share for profit attributable to the shareholders during the year (expressed in US Cents per share) 24 23.60 23.25
The notes on pages 69 to 155 form an integral part of these consolidated financial statements.
The Board has recommended a final dividend of 34 HK Cents equivalent (4.36 US Cents) per share (FY2013/14: 34 HK Cents or 4.36 US Cents adjusted to reflect the impact of 1 for 4 share consolidation on 15 July 2014 (“Share Consolidation”)) equivalent to US$37.8 million (FY2013/14: US$38.9 million), details are set out in Note 25.
The basic and diluted earnings and dividend per share for the prior year have been adjusted to reflect the impact of Share Consolidation.

Annual Report 2015
64Johnson Electric Holdings Limited
For the year ended 31 March 2015CONSOLIDATED STATEMENT OF COMPREHENSIVE INCOME
2015 2014 Note US$’000 US$’000
Profit for the year 219,812 214,896
Other comprehensive income / (expenses)
Items that will not be recycled to profit and loss:Defined benefit plans – remeasurements 15 & 18 (15,812) 8,466 – deferred income tax effect 16 & 18 1,553 (1,084)Long service payment – remeasurements 15 & 18 230 623 – deferred income tax effect 16 & 18 (39) (63)
Total items that will not be recycled to profit and loss (14,068) 7,942
Items that will be recycled to profit and loss:Hedging instruments – raw material commodity contracts – fair value losses, net 18 (17,088) (19,273) – transferred to inventory and subsequently recognised in income statement 18 8,107 8,127 – deferred income tax effect 16 & 18 1,482 1,886 – forward foreign currency exchange contracts – fair value gains / (losses), net 18 175,868 (25,000) – transferred to income statement 18 (17,104) (14,233) – deferred income tax effect 16 & 18 (23,790) 6,311 – net investment hedge – fair value gains / (losses), net 18 61,693 (12,362)Currency translations of subsidiaries and associate (103,858) 49,882
Total items that will be recycled to profit and loss 85,310 (4,662)
Other comprehensive income for the year, net of tax 71,242 3,280
Total comprehensive income for the year, net of tax 291,054 218,176
Total comprehensive income attributable to:Shareholders 281,659 211,160Non-controlling interests Share of profits for the year 8,918 7,031 Currency translations 477 (15)
291,054 218,176
The notes on pages 69 to 155 form an integral part of these consolidated financial statements.

65
For the year ended 31 March 2015CONSOLIDATED STATEMENT OF CHANGES IN EQUITY
Attributable to shareholders of JEHL
Share capital and Non- share Other Retained controlling Total Note premium reserves* earnings Total interests equity US$’000 US$’000 US$’000 US$’000 US$’000 US$’000
As of 31 March 2014 15,505 76,409 1,640,385 1,732,299 34,019 1,766,318
Profit for the year – – 210,894 210,894 8,918 219,812Other comprehensive income / (expenses):
Hedging instruments – raw material commodity contracts – fair value losses, net 18 – (17,088) – (17,088) – (17,088) – transferred to inventory and subsequently recognised in income statement 18 – 8,107 – 8,107 – 8,107 – deferred income tax effect 16 & 18 – 1,482 – 1,482 – 1,482 – forward foreign currency exchange contracts – fair value gains, net 18 – 175,868 – 175,868 – 175,868 – transferred to income statement 18 – (17,104) – (17,104) – (17,104) – deferred income tax effect 16 & 18 – (23,790) – (23,790) – (23,790) – net investment hedge – fair value gains, net 18 – 61,693 – 61,693 – 61,693
Defined benefit plans – remeasurements 15 & 18 – – (15,812) (15,812) – (15,812) – deferred income tax effect 16 & 18 – – 1,553 1,553 – 1,553
Long service payment – remeasurements 15 & 18 – – 230 230 – 230 – deferred income tax effect 16 & 18 – – (39) (39) – (39)
Investment property – revaluation surplus realised upon disposal 18 – (14) 14 – – –
Currency translations of subsidiaries and associate 18 – (104,335) – (104,335) 477 (103,858)
Total comprehensive income for FY2014/15 – 84,819 196,840 281,659 9,395 291,054
Transactions with shareholders:
Appropriation of retained earnings to statutory reserve 18 – 4,224 (4,224) – – –
Convertible bonds – equity component of convertible bonds issued 14 & 18 – 4,823 – 4,823 – 4,823 – deferred income tax effect 16 & 18 – (3,868) – (3,868) – (3,868)
Cancellation of issued capital 17 (24,069) (30,926) – (54,995) – (54,995)
Long–Term Incentive Share Scheme – shares vested 17 & 18 3,889 (3,889) – – – – – value of employee services 18 & 27 – 7,413 – 7,413 – 7,413 – purchase of shares 17 (50,726) – – (50,726) – (50,726)
Share options – options lapsed 18 – (68) 68 – – –
Dividend paid to non–controlling shareholders of a subsidiary – – – – (4,820) (4,820)
FY2013/14 final dividend paid 18 – – (38,765) (38,765) – (38,765)FY2014/15 interim dividend paid 18 – – (15,522) (15,522) – (15,522)
Total transactions with shareholders (70,906) (22,291) (58,443) (151,640) (4,820) (156,460)
As of 31 March 2015 (55,401)** 138,937 1,778,782 1,862,318 38,594 1,900,912
* Other reserves mainly represent contributed surplus, capital reserve, property revaluation reserve, equity component of convertible bonds (net of tax), statutory reserve, exchange reserve, share-based employee compensation reserve, hedging reserve and goodwill on consolidation.
** The total of US$(55.4) million is comprised by share capital of US$5.7 million and shares held for Share Scheme of US$(61.1) million.
The notes on pages 69 to 155 form an integral part of these consolidated financial statements.

Annual Report 2015
66Johnson Electric Holdings Limited
Attributable to shareholders of JEHL
Share capital and Non- share Other Retained controlling Total Note premium reserves* earnings Total interests equity US$’000 US$’000 US$’000 US$’000 US$’000 US$’000
As of 31 March 2013 17,361 78,094 1,473,057 1,568,512 30,251 1,598,763
Profit for the year – – 207,865 207,865 7,031 214,896Other comprehensive income / (expenses):
Available–for–sale financial assets – adoption of HKFRS 9 18 – 380 (380) – – –
Hedging instruments – raw material commodity contracts – fair value losses, net 18 – (19,273) – (19,273) – (19,273) – transferred to inventory and subsequently recognised in income statement 18 – 8,127 – 8,127 – 8,127 – deferred income tax effect 16 & 18 – 1,886 – 1,886 – 1,886 – forward foreign currency exchange contracts – fair value losses, net 18 – (25,000) – (25,000) – (25,000) – transferred to income statement 18 – (14,233) – (14,233) – (14,233) – deferred income tax effect 16 & 18 – 6,311 – 6,311 – 6,311 – net investment hedge – fair value losses, net 18 – (12,362) – (12,362) – (12,362)
Defined benefit plans – remeasurements 15 & 18 – – 8,466 8,466 – 8,466 – deferred income tax effect 16 & 18 – – (1,084) (1,084) – (1,084)
Long service payment – remeasurements 15 & 18 – – 623 623 – 623 – deferred income tax effect 16 & 18 – – (63) (63) – (63)
Investment property – revaluation surplus realised upon disposal 18 – (583) 583 – – –
Currency translations of subsidiaries and associate 18 – 49,897 – 49,897 (15) 49,882
Total comprehensive income / (expenses) for FY2013/14 – (4,850) 216,010 211,160 7,016 218,176
Transactions with shareholders:
Appropriation of retained earnings to statutory reserve 18 – (1,446) 1,446 – – –
Cancellation of issued capital 17 (1,650) – – (1,650) – (1,650)
Long–Term Incentive Share Scheme – shares vested 17 & 18 2,685 (2,685) – – – – – value of employee services 18 & 27 – 5,799 – 5,799 – 5,799 – purchase of shares 17 (2,891) – – (2,891) – (2,891) – transfer from cash settled share–based unit 18 – 1,771 – 1,771 – 1,771
Share options – options lapsed 18 – (274) 274 – – –
Contribution from non–controlling interests – – – – 650 650
Dividend paid to non–controlling shareholders of a subsidiary – – – – (3,898) (3,898)
FY2012/13 final dividend paid 18 – – (36,664) (36,664) – (36,664)FY2013/14 interim dividend paid 18 – – (13,738) (13,738) – (13,738)
Total transactions with shareholders (1,856) 3,165 (48,682) (47,373) (3,248) (50,621)
As of 31 March 2014 15,505 76,409 1,640,385 1,732,299 34,019 1,766,318
* Other reserves mainly represent contributed surplus, capital reserve, property revaluation reserve, statutory reserve, exchange reserve, share-based employee compensation reserve, hedging reserve and goodwill on consolidation.
For the year ended 31 March 2014CONSOLIDATED STATEMENT OF CHANGES IN EQUITY

67
For the year ended 31 March 2015CONSOLIDATED CASH FLOW STATEMENT
2015 2014 Note US$’000 US$’000
Cash flows from operating activities Earnings before interest, taxes, depreciation and amortisation 27 335,520 321,811 Other non-cash items and adjustments 27 (1,546) 856 Change in working capital 27 (21,076) 17,787
Cash generated from operations 27 312,898 340,454 Interest paid (2,583) (1,830) Income taxes paid (43,172) (31,329)
Net cash generated from operating activities 267,143 307,295
Investing activities Purchase of property, plant and equipment and capitalised expenditure of investment property, net of subsidies (119,875) (92,171) Capitalisation of engineering development costs 5 (6,269) (5,804) Proceeds from disposal of property, plant and equipment and investment property 27 812 10,807 Interest received 13,998 10,927
(111,334) (76,241)
Business combination * 28 (9,203) – Acquisition of non-controlling interests (285) – Purchase of financial assets at fair value through profit and loss (3,257) – Proceeds from sale of financial assets at fair value through profit and loss 4,373 1,458 Subsequent payments due to divestiture of non-core business ** – (6,071)
Net cash used in investing activities (119,706) (80,854)
* On 30 July 2014, the Group paid US$9.2 million (total consideration US$10.0 million net of cash acquired US$0.8 million) to insource a sales agency in the UK. This acquisition strengthened the Group’s sales network by providing a direct interface with key automotive customers in the UK.
** In FY2013/14, the payment was to the buyer of the Saia-Burgess Controls business for the anticipated post-closing adjustments as agreed at closing (1 February 2013).

Annual Report 2015
68Johnson Electric Holdings Limited
2015 2014 Note US$’000 US$’000
Financing activities Purchase of shares for cancellation of issued capital 17 (54,995) (1,650) Purchase of shares held for Long-Term Incentive Share Scheme 17 (50,726) (2,891) Proceeds from borrowings – 5,628 Repayments of borrowings (10,751) (18,309) Proceeds from issuance of convertible bonds, net of transaction costs 14 197,300 – Dividends paid to shareholders (54,287) (50,402) Dividends paid to non-controlling interests (4,820) (3,898) Contribution from non-controlling interests – 650
Net cash generated from / (used in) financing activities 21,721 (70,872)
Net increase in cash and cash equivalents 169,158 155,569
Cash and cash equivalents at beginning of the year 643,986 480,924
Currency translations on cash and cash equivalents (39,972) 7,493
CASH AND CASH EQUIVALENTS AT THE END OF THE YEAR 773,172 643,986
The notes on pages 69 to 155 form an integral part of these consolidated financial statements.

69
NOTES TO THE ACCOUNTS
1. GENERAL INFORMATION AND BASIS OF PREPARATION
The principal operations of Johnson Electric Holdings Limited (“JEHL”) and its subsidiaries (together, “the Group”) are the manufacture and sale of motion systems. The Group has manufacturing plants and sales operations throughout the world.
JEHL, the parent holding company, is a limited liability company incorporated in Bermuda. The address of its registered office is Canon’s Court, 22 Victoria Street, Hamilton HM 12, Bermuda.
The shares of JEHL are listed on The Stock Exchange of Hong Kong Limited.
These consolidated financial statements are presented in US Dollars, unless otherwise stated and have been approved for issue by the Board of Directors on 13 May 2015. They have been prepared in accordance with Hong Kong Financial Reporting Standards (“HKFRS”) using the historical cost convention, as modified by the revaluation of financial assets and financial liabilities (including derivative instruments) at fair value through profit and loss, and investment property, which are carried at fair value.
The preparation of financial statements in conformity with HKFRS requires the use of certain critical accounting estimates. It also requires management to exercise its judgement in the process of applying the Group’s accounting policies. The areas involving a higher degree of judgement or complexity, or areas where assumptions and estimates are significant to the consolidated financial statements, are disclosed in Note 35.
Detailed accounting policies are set out in Note 34. In FY2014/15, the Group adopted new / revised standards and interpretations of HKFRS effective for the first time in FY2014/15. The effects of adopting the new / revised HKFRSs are disclosed in Note 36.

Annual Report 2015
70Johnson Electric Holdings Limited
2. SEGMENT INFORMATION
Operating segments are reported in a manner consistent with the internal reporting provided to the chief operating decision maker (as defined in HKFRS). The chief operating decision maker has been identified as the Group’s Executive Committee. The Group has one operating segment.
The Group’s management assesses the performance of its operating segment based on the measure of operating profit, excluding items which are not directly related to the segment performance. These include non-operating income / (expenses) such as interest income and expense, rental income, fair value gains / (losses) on investment property and gains / (losses) on disposals of fixed assets and investments.
The reconciliation of the operating profit presented to management to the consolidated income statement is as follows:
2015 2014 US$’000 US$’000
Operating profit presented to management 224,866 213,727Other income and gains, net (Note 19) 17,918 19,762
Operating profit per consolidated income statement 242,784 233,489
Sales from external customers by business unit was as follows:
2015 2014 US$’000 US$’000
Automotive Products Group (“APG”) 1,457,448 1,436,801Industry Products Group (“IPG”) 678,604 660,817
2,136,052 2,097,618
The Powertrain Cooling business (included in APG) is primarily engaged in the manufacture and sale of cooling fan modules for OEM and Tier 1 customers. Sales for this business unit accounted for 25% of the total sales of the Group for FY2014/15 (FY2013/14: 25%).

71
NOTES TO THE ACCOUNTS
2. SEGMENT INFORMATION (Cont’d)
Sales by geographySales to external customers by region of destination was as follows:
2015 2014 US$’000 US$’000
Europe * 891,355 885,738People’s Republic of China (“PRC”) 582,303 570,071North America 447,172 439,805Asia (excluding PRC) 178,759 156,095South America 32,567 41,490Others 3,896 4,419
2,136,052 2,097,618
* Included in Europe are sales to external customers in Germany of US$247.6 million for FY2014/15 (FY2013/14: US$254.6 million).
No single external customer contributed 10% or more of the total Group sales.
Segment assetsFor FY2014/15, the additions to non-current assets (other than deferred tax assets, financial assets at fair value through profit and loss, other financial assets and defined benefit pension plan assets) were US$139.3 million (FY2013/14: US$112.1 million).
As of 31 March 2015, excluding goodwill, the total of non-current assets (other than deferred tax assets, financial assets at fair value through profit and loss, other financial assets and defined benefit pension plan assets) located in HK/PRC was US$364.7 million (31 March 2014: US$328.3 million) and the total of these non-current assets located in other countries was US$303.8 million (31 March 2014: US$326.7 million).

Annual Report 2015
72Johnson Electric Holdings Limited
3. PROPERTY, PLANT AND EQUIPMENT
Freehold land, Machinery Assets Moulds leasehold land and under and Other and buildings equipment construction tools assets* Total US$’000 US$’000 US$’000 US$’000 US$’000 US$’000
As of 31 March 2013Cost 226,160 577,500 29,092 267,807 137,541 1,238,100Accumulated depreciation and impairment (123,315) (455,809) – (208,215) (92,195) (879,534)
Net book amount 102,845 121,691 29,092 59,592 45,346 358,566
FY2013/14
As of 31 March 2013 102,845 121,691 29,092 59,592 45,346 358,566Currency translations 2,907 844 679 640 226 5,296Additions 6,740 17,693 64,062 8,554 4,740 101,789Transfer 5,063 21,181 (39,790) 10,771 2,775 –Transfer from investment property (Note 4) 1,520 – – – – 1,520Disposals (2,597) (998) – (267) (157) (4,019)Provision for impairment (Note 22 & 27) (9) (681) (2,172) (512) (9) (3,383)Depreciation (Note 22) (11,405) (27,636) – (20,369) (8,133) (67,543)
As of 31 March 2014 105,064 132,094 51,871 58,409 44,788 392,226
As of 31 March 2014Cost 239,568 596,129 54,043 285,041 140,793 1,315,574Accumulated depreciation and impairment (134,504) (464,035) (2,172) (226,632) (96,005) (923,348)
Net book amount 105,064 132,094 51,871 58,409 44,788 392,226
* Other assets comprise computers, furniture and fixtures, motor vehicles and aircraft.

73
NOTES TO THE ACCOUNTS
3. PROPERTY, PLANT AND EQUIPMENT (Cont’d)
Freehold land, Machinery Assets Moulds leasehold land and under and Other and buildings equipment construction tools assets* Total US$’000 US$’000 US$’000 US$’000 US$’000 US$’000
FY2014/15
As of 31 March 2014 105,064 132,094 51,871 58,409 44,788 392,226Currency translations (8,749) (1,968) (5,398) (1,218) (388) (17,721)Additions 4,900 26,919 71,967 10,039 3,935 117,760Transfer 6,971 30,171 (54,024) 11,992 4,890 –Transfer to non–current asset held for sale (Note 10) (8,003) – – – – (8,003)Disposals (220) (236) – (663) (114) (1,233)Provision for impairment (Note 22 & 27) – (84) – (598) (4) (686)Depreciation (Note 22) (11,732) (30,432) – (20,745) (8,856) (71,765)
As of 31 March 2015 88,231 156,464 64,416 57,216 44,251 410,578
As of 31 March 2015Cost 211,931 616,373 64,495 280,859 136,115 1,309,773Accumulated depreciation and impairment (123,700) (459,909) (79) (223,643) (91,864) (899,195)
Net book amount 88,231 156,464 64,416 57,216 44,251 410,578
* Other assets comprise computers, furniture and fixtures, motor vehicles and aircraft.
Freehold land is located in Europe and North America.
The Group’s interest in leasehold land of US$7.4 million (31 March 2014: US$7.6 million) comprises leases of between 10 to 50 years in Hong Kong.
The Group begins depreciating an item of property, plant and equipment when it is available for use. Depreciation of property, plant and equipment is calculated using the straight-line method to allocate their cost to their residual values over their estimated useful lives, as follows:
Leasehold land Shorter of lease term or useful lifeBuildings on leasehold land Shorter of lease term or useful lifeBuildings on freehold land 10 to 50 years*Machinery, equipment, moulds and tools 2 to 10 yearsFurniture and fixtures and computers 3 to 10 yearsMotor vehicles 3 to 7 yearsAircraft 25 years
* 50 years for buildings in Hungary, Germany and Switzerland

Annual Report 2015
74Johnson Electric Holdings Limited
4. INVESTMENT PROPERTY
2015 2014 US$’000 US$’000
At beginning of the year 68,371 63,214Currency translations 77 (1)Fair value gains (Note 19 & 27) 10,749 5,239Capitalised expenditure 2,890 2,523Transfer to property, plant and equipment (Note 3) – (1,520)Disposals (52) (1,084)
At end of the year 82,035 68,371
The Group’s investment property in HK/PRC was valued on an open market basis as of 31 March 2015. The appraisals were performed by independent, professionally qualified valuers, Chung, Chan & Associates, Chartered Surveyors.
As of 31 March 2015, the Group’s investment property has tenancies expiring in the period from July 2015 to May 2027 (31 March 2014: from April 2014 to May 2027).
The Group’s interests in investment property were analysed as follows:
2015 2014 US$’000 US$’000
In Hong Kong:On lease between 10 to 50 years 74,999 61,444
Outside Hong Kong:On lease between 10 to 50 years 7,036 6,927
82,035 68,371

75
NOTES TO THE ACCOUNTS
5. INTANGIBLE ASSETS Patents and engineering Client Land use Goodwill Technology development Brands relationships rights Total US$’000 US$’000 US$’000 US$’000 US$’000 US$’000 US$’000
As of 31 March 2013Cost 436,573 142,026 16,207 63,864 106,141 4,779 769,590Accumulated amortisation and impairment – (67,250) (11,376) (18,460) (46,190) (979) (144,255)
Net book amount 436,573 74,776 4,831 45,404 59,951 3,800 625,335
FY2013/14
As of 31 March 2013 436,573 74,776 4,831 45,404 59,951 3,800 625,335Currency translations 28,438 4,412 452 3,219 4,163 6 40,690Additions (Note 22) – – 5,804 – – – 5,804Amortisation (Note 22 & 27) – (9,497) (641) (2,591) (8,125) (242) (21,096)
As of 31 March 2014 465,011 69,691 10,446 46,032 55,989 3,564 650,733 *
As of 31 March 2014Cost 465,011 151,335 22,958 68,571 113,877 4,782 826,534Accumulated amortisation and impairment – (81,644) (12,512) (22,539) (57,888) (1,218) (175,801)
Net book amount 465,011 69,691 10,446 46,032 55,989 3,564 650,733
FY2014/15
As of 31 March 2014 465,011 69,691 10,446 46,032 55,989 3,564 650,733Currency translations (32,975) (4,478) (2,323) (3,573) (5,319) 37 (48,631)Acquisition (Note 28) – – – – 9,203 – 9,203Additions (Note 22) – – 6,269 – – – 6,269Amortisation (Note 22 & 27) – (9,389) (926) (2,559) (8,283) (239) (21,396)Provision for impairment (Note 22 & 27) – – (600) – – – (600)
As of 31 March 2015 432,036 55,824 12,866 39,900 51,590 3,362 595,578 *
As of 31 March 2015Cost 432,036 140,326 21,955 63,023 112,657 4,835 774,832Accumulated amortisation and impairment – (84,502) (9,089) (23,123) (61,067) (1,473) (179,254)
Net book amount 432,036 55,824 12,866 39,900 51,590 3,362 595,578
* Total intangible assets as of 31 March 2015 and 31 March 2014 are denominated in the following underlying currencies:
USD equivalent
2015 2014 US$’000 US$’000
In CHF 487,726 551,052In USD 82,204 83,055In GBP 12,683 6,528In EUR 9,603 6,534In RMB 3,362 3,564
Total intangible assets 595,578 650,733

Annual Report 2015
76Johnson Electric Holdings Limited
5. INTANGIBLE ASSETS (Cont’d)
Land use rights are grouped as intangible assets and prior year figures have been reclassified to conform with current year’s presentation. The Group’s interests in land use rights represent prepaid operating lease payments and are on lease between 10 to 50 years in PRC.
The amortisation charge was included in the “Selling and administrative expenses” in the consolidated income statement.
Amortisation is calculated using the straight-line method to allocate the cost over the estimated useful life. The estimated useful life for amortisation purposes is:
Technology, patents and engineering development 4 to 20 yearsBrands 25 yearsClient relationships 5 to 15 yearsLand use rights Shorter of remaining lease term or useful life
Impairment tests for goodwillThe Group is one cash-generating unit (“CGU”) and goodwill is allocated to the CGU for the purpose of testing goodwill impairment in accordance with HKAS 36 “Impairment of Assets”. Goodwill is tested annually for impairment or more frequently if events or changes in circumstances indicate a potential impairment. Impairment test for goodwill is carried out by comparing the recoverable amount (i.e. higher of value in use and the fair value less costs of disposal) of the assets belonging to a CGU to the carrying amount of those assets as of the balance sheet date.
For the years ended 31 March 2015 and 2014, the recoverable amount of the Group is determined based on value-in-use calculations. These calculations use pre-tax cash flow projections based on the FY2015/16 and FY2014/15 financial budget and future forecast respectively.
Forecast profitability is based on past performance and expected future changes in costs and sales prices. Cash flow projections are based on long-range financial forecasts using an estimated sales growth rate of 6% until 2020 and a 2% perpetual growth rate thereafter (FY2013/14: 6% and 2% respectively) and operating margin of 10% (FY2013/14: 10%). Future cash flows are discounted at a pre-tax rate of 11.6% (equivalent to post-tax weighted average cost of capital of 10%) (FY2013/14: pre-tax rate of 11.6%).
There was no evidence of impairment arising from tests of reasonable variations of the key assumptions used for the value-in-use calculations.

77
NOTES TO THE ACCOUNTS
6. INVESTMENT IN ASSOCIATE
2015 2014 US$’000 US$’000
At beginning of the year 2,202 2,064Currency translations 32 1Share of associate’s profit for the year 731 408Dividend received (245) (271)
At end of the year 2,720 2,202
Details of associate are shown in Note 38.
7. OTHER FINANCIAL ASSETS AND LIABILITIES
2015 2014 Assets (Liabilities) Net Assets (Liabilities) Net US$’000 US$’000 US$’000 US$’000 US$’000 US$’000
Raw material commodity contracts (Note a) – cash flow hedge 3,306 (21,794) (18,488) 634 (12,614) (11,980)Forward foreign currency exchange contracts (Note b) – cash flow hedge 221,648 (64,923) 156,725 39,627 (41,575) (1,948) – held for trading 19 (3) 16 10 (4) 6Net investment hedge (Note c) – forward foreign currency exchange contracts to hedge European subsidiaries 48,616 – 48,616 8 (7,693) (7,685) – cross currency interest rate swap 1,541 – 1,541 – – –Others 124 – 124 198 – 198
Total (Note d) 275,254 (86,720) 188,534 40,477 (61,886) (21,409)
Current portion 60,072 (14,531) 45,541 10,590 (21,500) (10,910)Non-current portion 215,182 (72,189) 142,993 29,887 (40,386) (10,499)
Total 275,254 (86,720) 188,534 40,477 (61,886) (21,409)

Annual Report 2015
78Johnson Electric Holdings Limited
7. OTHER FINANCIAL ASSETS AND LIABILITIES (Cont’d)
Note:
(a) Raw material commodity contracts
Copper, silver and aluminium forward commodity contracts as per the table below are designated as cash flow hedges. Gains and losses initially recognised in the hedging reserve, will be transferred to balance sheet within inventories and subsequently recognised in the income statement in the period or periods in which the underlying hedged copper, silver and aluminium volumes are consumed and sold.
As of 31 March 2015, the Group had the following outstanding raw material commodity contracts:
Weighted Liabilities, average Mark-to- Remaining net Settlement contract Spot market maturities carrying Notional value price price rate range value amount (US$ million) (US$) (US$) (US$) (months) (US$’000)
Cash flow hedge contractsCopper commodity 40,300 metric ton 259.0 6,428 6,051 6,025 1 – 70 (16,240)Silver commodity 840,000 oz 16.4 19.54 16.60 16.93 1 – 54 (2,190)Aluminium commodity 300 metric ton 0.6 2,007 1,789 1,813 1 – 12 (58)
Total (18,488)
(b) Forward foreign currency exchange contracts
The EUR, HUF, PLN, JPY, CHF, ILS, INR, MXN and RMB forward foreign currency exchange contracts as per the table below are designated as cash flow hedges. The Group has sales in EUR and JPY, thus it entered into EUR and JPY forward sales contracts. The Group incurs majority of its operating expenses (including conversion costs) in domestic currencies in China, Hungary, Poland, Switzerland, Israel and Mexico, hence, it entered into forward foreign currency purchase contracts to hedge these expenses. Gains and losses initially recognised in the hedging reserve, will be recognised in the income statement in the period or periods in which the underlying hedged transactions occur (cash realisation).
For currency contracts designated as held for trading, fair value gains and losses on the forward contracts are immediately recognised in the income statement. The net fair value changes recognised in the income statement were not material.

79
NOTES TO THE ACCOUNTS
7. OTHER FINANCIAL ASSETS AND LIABILITIES (Cont’d)
(b) Forward foreign currency exchange contracts (Cont’d)
As of 31 March 2015, the Group had the following outstanding forward foreign currency exchange contracts:
Assets/ Settlement (liabilities), Weighted Remaining value in net Notional average Mark-to- maturities USD carrying Settlement value contract Spot market range equivalent value currency (million) rate* rate rate (months) (US$ million) (US$’000)
Cash flow hedge contractsEUR forward sales USD EUR 774.5 1.39 1.08 1.14 1 – 81 1,078.2 195,325
HUF forward purchase EUR HUF 36,899.9 331.55 299.25 313.87 1 – 60 120.6 6,791
PLN forward purchase EUR PLN 175.7 4.49 4.09 4.26 1 – 58 42.4 2,249
JPY forward sales USD JPY 881.0 107.89 120.05 118.36 1 – 34 8.2 722
CHF forward purchase EUR CHF 13.4 1.06 1.05 1.04 1 – 3 13.7 280
ILS forward purchase USD ILS 45.4 3.97 3.97 3.96 1 – 24 11.4 32
INR forward purchase USD INR 1,029.8 72.96 62.62 73.56 13 – 60 14.1 (115)
MXN forward purchase USD MXN 1,437.6 15.00 15.26 16.65 1 – 73 95.9 (9,529)
RMB forward purchase USD RMB 11,445.6 6.51 6.14 6.66 1 – 73 1,758.2 (39,030)
Total 156,725
Held for trading contractsINR forward purchase USD INR 122.3 65.22 62.62 64.68 1 – 12 1.9 16
* Weighted average contract rate is a ratio defined as notional value / settlement value except for the EUR to USD which is stated in the inverse order.
(c) Net investment hedge
The EUR forward foreign currency exchange contracts and cross currency interest rate swaps as per the table in the following page are designated as a net investment hedge. Gains and losses recognised in the exchange reserve, will be released from equity to profit and loss on the disposal or partial disposal of the foreign operation.

Annual Report 2015
80Johnson Electric Holdings Limited
7. OTHER FINANCIAL ASSETS AND LIABILITIES (Cont’d)
(c) Net investment hedge (Cont’d)
As of 31 March 2015, the Group had the following outstanding contracts:
Settlement Weighted Remaining value in Assets, net Notional average Mark-to- maturities USD carrying Settlement value contract Spot market range equivalent value currency (million) rate* rate rate (months) (US$ million) (US$’000)
Net investment hedge contractsEUR forward sales USD EUR 187.0 1.38 1.08 1.12 9 – 57 258.8 48,616Cross currency interest rate swaps (sell EUR, buy USD) USD EUR 68.0 1.10 1.08 1.08 73 75.0 1,541
* Weighted average contract rate is a ratio defined as notional value / settlement value except for the EUR to USD which is stated in the inverse order.
(d) The maximum exposure of other financial assets to credit risk at the reporting date was the fair value in the balance sheet.
(e) The net gain from raw material commodity and foreign currency exchange hedge contracts recognised in the income statement during the year was US$9.0 million (FY2013/14: net gain of US$6.1 million).
(f) Estimate of future cash flow
In terms of estimating future cash flow, the contracts rate compared to the spot rate of all the currency and commodity contracts as of 31 March 2015 would result in approximately US$354 million cash flow benefit (31 March 2014: US$29 million).
8. INVENTORIES
2015 2014 US$’000 US$’000
Raw materials 89,842 84,667Finished goods 132,187 122,374
222,029 207,041
The Group’s inventories were valued at the lower of actual cost on a first-in-first-out basis (FIFO) or net realisable value.

81
NOTES TO THE ACCOUNTS
9. TRADE AND OTHER RECEIVABLES
2015 2014 US$’000 US$’000
Trade receivables – gross 352,608 387,408Less: impairment of trade receivables * (2,751) (9,186)
Trade receivables – net 349,857 378,222Prepayments and other receivables 65,036 63,415
414,893 441,637
* Impairment of trade receivables is discussed on next page
All trade and other receivables were due within one year from the end of the reporting period. Accordingly, the fair value of the Group’s trade and other receivables was approximately equal to the carrying value.
Ageing of gross trade receivablesThe Group normally grants credit terms ranging from 30 to 105 days to its trade customers. The ageing of gross trade receivables based on overdue date was as follows:
2015 2014 US$’000 US$’000
Current 341,077 364,8231 – 30 days overdue 7,606 7,99931 – 90 days overdue 1,643 7,051Over 90 days overdue 2,282 7,535
Total 352,608 387,408
There was no concentration of credit risk with respect to trade receivables, as the Group has a large number of customers and no single customer represents 10% or more of total receivables.
The carrying amounts of the Group’s trade receivables were denominated in the following currencies:
2015 2014 US$’000 US$’000
USD 148,251 144,114EUR 114,665 153,279RMB 80,209 78,850Others 9,483 11,165
Total 352,608 387,408

Annual Report 2015
82Johnson Electric Holdings Limited
9. TRADE AND OTHER RECEIVABLES (Cont’d)
Ageing of overdue trade receivables but not impairedThe Group has credit policies in place to review the credit worthiness of all existing and potential customers. Credit terms range between 30 and 105 days normally. As of 31 March 2015, trade receivables of US$8.8 million (31 March 2014: US$13.4 million) were overdue but not impaired. Management assessed the credit quality of this US$8.8 million by reference to the repayment history and current financial position of the customers. Management believes that no provision for impairment is necessary and these balances are expected to be fully recovered.
The ageing of these overdue trade receivables but not impaired is as follows:
2015 2014 US$’000 US$’000
1 – 30 days overdue 6,891 7,99931 – 90 days overdue 1,239 3,166Over 90 days overdue 650 2,234
Total 8,780 13,399
Impairment of trade receivablesMovements on the impairment of trade receivables were as follows:
2015 2014 US$’000 US$’000
At beginning of the year 9,186 2,472Currency translations (558) 263Receivables written off during the year as uncollectible (6,984)* (481)Impairment of trade receivables / bad debt expense (Note 22) 1,107 6,932
At end of the year 2,751 9,186
* The written off of receivable was primarily due to a customer that entered into a court approved rehabilitation process.
The maximum exposure to credit risk at the reporting date is the fair value of the receivable mentioned above.

83
NOTES TO THE ACCOUNTS
10. NON-CURRENT ASSETS HELD FOR SALE
2015 2014 US$’000 US$’000
Assets held for sale (Note 3) 8,003 –
In March 2015, the Group entered into an agreement to sell its manufacturing building in Germany. The sale was completed in April 2015 and the carrying amount of the building is reclassified to asset held for sale as of 31 March 2015.
During the year, the Group also put one of its manufacturing buildings in Switzerland on the market for sale, thus the carrying amount of this building is shown as asset held for sale as of 31 March 2015.
11. CASH AND DEPOSITS
2015 2014 US$’000 US$’000
Cash at bank and in hand 174,883 164,265Short term bank deposits 598,289 479,721
Total 773,172 643,986
The effective interest rate on bank balances and deposits was 1.8% (FY2013/14: 2.3%). These deposits have an average maturity of 49 days (FY2013/14: 77 days).
The carrying amounts of the Group’s cash and deposits are denominated in the following currencies:
2015 2014 US$’000 US$’000
USD 381,957 47,291RMB 269,762 445,261EUR 59,710 99,364Others 61,743 52,070
Total 773,172 643,986

Annual Report 2015
84Johnson Electric Holdings Limited
12. TRADE PAYABLES
2015 2014 US$’000 US$’000
Trade payables 206,161 207,234
The fair value of the Group’s trade payables was approximately equal to the carrying value. The ageing analysis of trade payables based on invoice date was as follows:
2015 2014 US$’000 US$’000
0 – 60 days 152,839 153,59261 – 90 days 38,984 39,892Over 90 days 14,338 13,750
Total 206,161 207,234
The carrying amounts of the Group’s trade payables are denominated in the following currencies:
2015 2014 US$’000 US$’000
RMB 87,378 76,762USD 55,549 57,492EUR 37,987 42,871HKD 20,824 23,344Others 4,423 6,765
Total 206,161 207,234

85
NOTES TO THE ACCOUNTS
13. BORROWINGS
2015 2014 US$’000 US$’000
Loans based on trade receivables (Note) 90,432 114,986Other borrowings – Non-current 714 1,394 – Current 2,884 473
Total borrowings 94,030 116,853
Current borrowings 65,816 115,459
Non-current borrowings 28,214 1,394
Note:
Subsidiary companies have borrowed US$90.4 million in the USA, Europe and Hong Kong as of 31 March 2015 (as of 31 March 2014: US$115.0 million) based on trade receivables. These loans are placed such that the interest expense will match the geography of the operating income as follows:
• Unsecured borrowings in the USA of US$27.5 million, with a covenant that trade receivables shall not be pledged to any parties (31 March 2014: US$40.0 million).
• Borrowings in Europe of US$43.3 million (EUR40.0 million) (31 March 2014: US$55.0 million (EUR40.0 million)), which are secured by trade receivables and require an over-collateralisation level of 20% of the amount loaned (US$52.0 million as of 31 March 2015 and US$66.0 million as of 31 March 2014).
• Unsecured borrowings in Hong Kong of US$19.6 million based on trade receivables (31 March 2014: US$20.0 million).

Annual Report 2015
86Johnson Electric Holdings Limited
13. BORROWINGS (Cont’d)
The maturity of borrowings was as follows:
Bank borrowings Other loans
2015 2014 2015 2014 US$’000 US$’000 US$’000 US$’000
Less than 1 year 65,432 114,986 384 4731 – 2 years 27,500 – 396 4882 – 5 years – – 318 906
92,932 114,986 1,098 1,867
As of 31 March 2015, the interest rate charged on outstanding balances ranged from 0.6% to 3.2% per annum (31 March 2014: 0.7% to 3.2% per annum) and the weighted average effective interest rate of the borrowings was approximately 0.7% (31 March 2014: 0.8%). Interest expense is disclosed in Note 21.
As of 31 March 2015, borrowings of subsidiary companies amounting to US$92.9 million (31 March 2014: US$115.0 million) were guaranteed by JEHL. The Group has financial covenants as part of its various borrowing agreements. The Group was in compliance with all covenants as of 31 March 2015 and expects to remain compliant in future periods.
Moody’s Investors Service awarded Johnson Electric a “Baa1” investment grade rating with stable outlook in May 2015. Also, Standard & Poor’s (S&P) Ratings Services awarded Johnson Electric a “BBB” investment grade rating with stable outlook in December 2014. This is the first time that Johnson Electric has undergone formal credit ratings.
The fair value of borrowings approximately equals their carrying amount, as the impact of discounting is not significant. The fair values are based on cash flows discounted using a rate based on the borrowing rate and are within level 2 of the fair value hierarchy.
The carrying amounts of the borrowings (bank borrowings and other loans) were denominated in the following currencies:
2015 2014 US$’000 US$’000
USD 49,600 59,978EUR 44,430 56,875
Total borrowings 94,030 116,853

87
NOTES TO THE ACCOUNTS
14. CONVERTIBLE BONDS
2015 2014 US$’000 US$’000
Proceeds from the issuance of convertible bonds on 2 April 2014 (net of transaction cost) 197,300 –
Equity component (Note 18) 4,823 –
Liability component on initial recognition on 2 April 2014 192,477 –Interest expense (Note 21 & 24) 6,868 –Coupon interest paid and payable (2,000) –
Liability component at end of the year 197,345 –
JEHL issued convertible bonds in an aggregate principal amount of US$200 million on 2 April 2014. These convertible bonds bear interest as cash coupon at the rate of 1% per annum, payable semi-annually. They have a maturity of 7 years to 2 April 2021 and a 5 year put option for the bondholders. The bondholders have the option of requiring JEHL to redeem all or some of the convertible bonds on 2 April 2019 at 109.31% of the principal amount. Otherwise, unless previously redeemed, converted or purchased and cancelled, JEHL will redeem each convertible bond at 113.41% of its principal amount on the maturity date. The effective interest rate of the liability component is 3.57%.
The bondholders have the right to convert their bonds into ordinary shares of JEHL at the conversion price at any time on or after 13 May 2014 up to the maturity date. No such conversions had occurred as of 31 March 2015.
With effect from 17 July 2014, the conversion price was adjusted to HK$40.54 per share as a result of the Share Consolidation and payment of the final dividend for FY2013/14. The conversion price was not adjusted for the interim dividend for FY2014/15 since this event fell below the 1% threshold for adjustment as per the terms and conditions of the Bond Offering. The effect of this interim dividend will be accumulated and included in the next adjustment to the conversion price.
The fair value of the liability component of the Group’s convertible bonds was approximately equal to its carrying value as of 31 March 2015. The fair values of convertible bonds are within level 2 of the fair value hierarchy.

Annual Report 2015
88Johnson Electric Holdings Limited
15. PROVISION OBLIGATIONS AND OTHER LIABILITIES
Retirement Legal Finance Long service benefit and lease payment and obligations warranty Restructuring liability others Total US$’000 US$’000 US$’000 US$’000 US$’000 US$’000
As of 31 March 2013 23,278 22,582 10,325 5,418 4,054 65,657Currency translations 1,648 774 587 – 49 3,058Provisions / (release of provision) (Note 20) (123) 7,195 – – 4,701 11,773Utilised (6,280) (8,023) (4,514) (800) (4,255) (23,872)Remeasurements (Note 18)* (8,466) – – – (623) (9,089)
As of 31 March 2014 10,057 22,528 6,398 4,618 3,926 47,527
Provision obligations and other liabilities:Current portion – 16,606 6,398 908 418 24,330Non-current portion 16,986 5,922 – 3,710 3,508 30,126
Defined benefit pension plan assets:Non-current portion (6,929) – – – – (6,929)
As of 31 March 2014 10,057 22,528 6,398 4,618 3,926 47,527
As of 31 March 2014 10,057 22,528 6,398 4,618 3,926 47,527Currency translations (1,786) (3,126) (1,242) – (152) (6,306)Provisions / (release of provision) (Note 20) 2,980 9,632 (682) – 5,040 16,970Utilised (5,744) (5,240) (491) (908) (4,757) (17,140)Remeasurements (Note 18)* 15,812 – – – (230) 15,582
As of 31 March 2015 21,319** 23,794 3,983 3,710 3,827 56,633
Provision obligations and other liabilities:Current portion – 16,217 3,983 1,020 493 21,713Non-current portion 28,475 7,577 – 2,690 3,334 42,076
Defined benefit pension plan assets:Non-current portion (7,156) – – – – (7,156)
As of 31 March 2015 21,319 23,794 3,983 3,710 3,827 56,633
* Remeasurements represent actuarial gains and losses.
** The retirement benefit obligations were mainly denominated in CHF, GBP and EUR as of 31 March 2015. These retirement benefit obligations of US$21.3 million (31 March 2014: US$10.1 million) composed of gross present value of obligations of US$184.0 million (31 March 2014: US$171.7 million) less fair value of plan assets of US$162.7 million (31 March 2014: US$161.6 million).

89
NOTES TO THE ACCOUNTS
15. PROVISION OBLIGATIONS AND OTHER LIABILITIES (Cont’d)
15.1 Retirement benefit obligationsDefined benefit pension plansThe Group operates defined benefit pension plans in various countries, providing benefits to members in the form of a guaranteed level of pension payable for life. These defined benefit plans are valued by independent external actuaries using the projected unit credit method.
The Group’s defined benefit plans provide pensions to employees after meeting specific retirement age / period of service. Pensions are based on specific pension rates applied to the employees’ years of service. The assets of funded plans are held independently of the Group’s assets in separate trustee administered funds.
The amounts recognised in the balance sheet were determined as follows:
2015 2014 US$’000 US$’000
Present value of obligations that are funded 169,635 155,126Present value of obligations that are unfunded 14,415 16,551
Gross present value of obligations 184,050 171,677Less: Fair value of plan (assets) (162,731) (161,620)
Total retirement benefit obligations – net liability 21,319 10,057
Represented by:Defined benefit pension plan (assets) (7,156) (6,929)Provisions obligations and other liabilities 28,475 16,986

Annual Report 2015
90Johnson Electric Holdings Limited
15. PROVISION OBLIGATIONS AND OTHER LIABILITIES (Cont’d)
15.1 Retirement benefit obligations (Cont’d)The movement of the retirement benefit obligations were as follows:
Present value Fair value of Total of obligations plan (assets) net liability US$’000 US$’000 US$’000
As of 31 March 2013 168,542 (145,264) 23,278
Current service cost (396)* – (396)Interest cost / (income) 4,182 (3,909) 273
Net cost / (income) to the income statement (Note 22) 3,786 (3,909) (123)
Remeasurements: – Loss from change in demographic assumptions 288 – 288 – Gain from change in financial assumptions (2,656) – (2,656) – Experience gains (3,314) (56) (3,370) – Return on plan assets, excluding amounts included in interest income – (2,728) (2,728)
Gains recognised in equity (Note 18) (5,682) (2,784) (8,466)
Currency translations 13,614 (11,966) 1,648Contributions by plan participants 2,705 (2,705) –Contributions by employer – (5,415) (5,415)Benefits paid (11,288) 10,423 (865)
As of 31 March 2014 171,677 (161,620) 10,057
As of 31 March 2014 171,677 (161,620) 10,057
Current service cost 3,084 – 3,084Interest cost / (income) 4,255 (4,359) (104)
Net cost / (income) to the income statement (Note 22) 7,339 (4,359) 2,980
Remeasurements: – Gain from change in demographic assumptions (681) – (681) – Loss from change in financial assumptions 29,574 – 29,574 – Experience (gains) / losses (2,307) 86 (2,221) – Return on plan assets, excluding amounts included in interest income – (10,860) (10,860)
Losses / (gains) recognised in equity (Note 18) 26,586 (10,774) 15,812
Currency translations (16,026) 14,240 (1,786)Contributions by plan participants 2,707 (2,707) –Contributions by employer – (5,139) (5,139)Benefits paid (8,233) 7,628 (605)
As of 31 March 2015 184,050 (162,731) 21,319
* The current service cost for FY2013/14 included the effect of adoption of HKAS 19 (2011) “Employee benefits”.

91
NOTES TO THE ACCOUNTS
15. PROVISION OBLIGATIONS AND OTHER LIABILITIES (Cont’d)
15.1 Retirement benefit obligations (Cont’d)The principal actuarial assumptions used were as follows:
2015 2014 Percentage Percentage
Discount rate 0.6% – 3.4% 2.1% – 4.5%Future pension growth rate 0% – 3.3% 0% – 3.5%
Sensitivity analysisThe sensitivity of the defined benefit obligation to changes in the weighted principal assumptions was:
Impact on defined benefit obligation
Increase in Decrease in assumption assumption
Discount rate – change by 0.5% Decrease by 7.3% Increase by 8.4%Future pension growth rate – increase by 0.5% Increase by 4.6% n/a
The above sensitivity analyses are based on a change in an assumption while holding all other assumptions constant. In practice, this is unlikely to occur, and changes in some of the assumptions may be correlated. When calculating the sensitivity of the defined benefit obligation to significant actuarial assumptions the same method (present value of the defined benefit obligation calculated with the projected unit credit method at the end of the reporting period) has been applied as when calculating the pension liability recognised in the balance sheet.
The methods and types of assumptions used in preparing the sensitivity analysis did not change compared to the previous period.
During the year, the increase in the present value of funded defined benefit obligations was primarily due to a decrease in the discount rate:
2015 2014 Percentage Percentage
Switzerland 0.6% 2.1%United Kingdom 3.4% 4.4%Germany 1.7% 3.3%

Annual Report 2015
92Johnson Electric Holdings Limited
15. PROVISION OBLIGATIONS AND OTHER LIABILITIES (Cont’d)
15.1 Retirement benefit obligations (Cont’d)The weighted average duration of the defined benefit obligation is 16.7 years (as of 31 March 2014: 15.4 years).
The expected maturity analysis of undiscounted pension benefits as of 31 March 2015 and 31 March 2014 was:
2015 2014 US$’000 US$’000
Less than 1 year 6,300 6,6821 – 2 years 6,460 6,6882 – 5 years 20,009 21,670Over 5 years 292,360 333,618
325,129 368,658
Plan assetsPlan assets comprised the following:
2015 2014 US$’000 Percentage US$’000 Percentage
QuotedEquities Asia 3,842 2% 3,265 2% Europe 24,382 15% 27,287 17% Americas 9,338 6% 8,513 5% Global 24,547 15% 29,906 18%
Bonds Europe 53,340 33% 32,245 20% Americas 1,060 1% 897 1% Global 5,039 3% 2,914 2%
Others Asia 534 0% 1,572 1% Europe 9,077 6% 22,084 14% Americas 2,135 1% 6,288 4%
133,294 82% 134,971 84%UnquotedProperty investment – Europe 29,150 18% 26,334 16%Others – Europe 287 0% 315 0%
29,437 18% 26,649 16%
162,731 100% 161,620 100%

93
NOTES TO THE ACCOUNTS
15. PROVISION OBLIGATIONS AND OTHER LIABILITIES (Cont’d)
15.1 Retirement benefit obligations (Cont’d)Plan assets (Cont’d)The plan asset mix is established through consideration of many factors including assumptions of tolerance for fluctuations in market values, portfolio diversification and the targeted long term rate of return for the assets. Foreign exchange risk is inherent in the asset mix policy and foreign currency fluctuations may significantly affect the return on the assets held by the trustees of the funds.
Asset-liability matching has been undertaken to reduce risk.
For the pension plan in Switzerland, Swiss law prescribes ranges of percentages within which the assets have to be invested (bank, shares, bonds, real estate, etc.). This is to ensure a segregation of risk. These ranges allow some room for investment decision but have to be respected at all times.
For the pension plan in the United Kingdom, the trustees of the scheme invest the assets in line with the statement of investment principles, which was established taking into consideration the liabilities of the scheme and the investment risk that the trustees are willing to accept. The trustees are required to carry out regular scheme funding valuations and establish a schedule of contributions and a recovery plan if there is a shortfall in the scheme.
The Group will make contributions of US$3.8 million to post-employment benefit plans for fiscal year FY2015/16 (FY2014/15: US$5.2 million).
15.2 Defined contribution pension plansThe largest defined contribution schemes are in Hong Kong where the Group operates two defined contribution schemes. These comply with all the respective requirements under the Occupational Retirement Schemes Ordinance (“ORSO”) and the Mandatory Provident Fund (“MPF”) Ordinance. All scheme assets are held separately from the Group in independently administered funds. Contributions to the MPF Scheme follow the MPF Ordinance while contributions made by the employer to the ORSO Scheme range between 5% and 12% of basic salary depending on level and years of service.
If employees leave the ORSO scheme prior to the contributions fully vesting, these may be forfeited and the charge to income statement reduced accordingly. There were no forfeited contributions as of 31 March 2015 (31 March 2014: US$1.6 million).
The Group also operates other defined contribution retirement schemes which are available to certain employees in the United States of America, PRC, the United Kingdom and France.
Contributions made by the Group are charged to the income statement as incurred. The charge to income statement for all defined contribution plans for FY2014/15 was US$4.8 million (FY2013/14: US$4.3 million) as shown in Note 22.

Annual Report 2015
94Johnson Electric Holdings Limited
15. PROVISION OBLIGATIONS AND OTHER LIABILITIES (Cont’d)
15.3 Finance lease liabilityProperty, plant and equipment included the following amounts held under a finance lease:
2015 2014 US$’000 US$’000
Cost – capitalised finance lease 10,658 10,658Accumulated depreciation and impairment (8,424) (8,046)
Net book amount 2,234 2,612
The lease liability is effectively secured as rights to the leased asset that reverts to the lessor in the event of default.
Gross finance lease obligation – minimum lease payments:
2015 2014 US$’000 US$’000
Less than 1 year 1,400 1,4001 – 5 years 3,062 4,463
4,462 5,863Future finance charges on the finance lease (752) (1,245)
Present value of the finance lease liability 3,710 4,618
The present value of the finance lease liability was as follows:
2015 2014 US$’000 US$’000
Less than 1 year 1,020 9081 – 5 years 2,690 3,710
3,710 4,618
The finance lease will mature in May 2018.

95
NOTES TO THE ACCOUNTS
16. DEFERRED INCOME TAX
Deferred tax assets and liabilities are offset when the deferred income taxes relate to the same fiscal authority and when there is a legally enforceable right to offset current tax assets against current tax liabilities. Income tax expense is discussed in Note 23.
The following amounts, determined after appropriate offsetting within a tax jurisdiction, are shown in the consolidated balance sheet:
2015 2014 US$’000 US$’000
Deferred income tax assets 43,500 37,508Deferred income tax liabilities (69,821) (53,609)
Deferred income tax liabilities, net (26,321) (16,101)
The gross differences between book and tax accounting, before netting were as follows:
2015 2014 US$’000 US$’000
Gross deferred income tax assets 70,375 54,221Gross deferred income tax liabilities (96,696) (70,322)
Deferred income tax liabilities, net (26,321) (16,101)

Annual Report 2015
96Johnson Electric Holdings Limited
16. DEFERRED INCOME TAX (Cont’d)
The movement in deferred income tax assets and liabilities during the year, without taking into consideration the offsetting of balances within the same tax jurisdiction, was as follows:
Accrued Accelerated tax Fair value liabilities depreciation Tax losses gains / (losses) Others Total
2015 2014 2015 2014 2015 2014 2015 2014 2015 2014 2015 2014 US$’000 US$’000 US$’000 US$’000 US$’000 US$’000 US$’000 US$’000 US$’000 US$’000 US$’000 US$’000
Deferred income tax assets
At beginning of the year 16,118 12,033 3,242 2,311 17,173 21,237 8,713 474 8,975 10,367 54,221 46,422Currency translations (1,342) 544 (53) 6 (415) (68) – – (40) 333 (1,850) 815Credited / (charged) to income statement 4,373 3,541 1,558 925 3,666 (3,996) (241) (44) (1,044) (585) 8,312 (159)Credited / (charged) to equity – – – – – – 8,153 8,283 1,539 (1,140) 9,692 7,143
Assets at end of the year 19,149 16,118 4,747 3,242 20,424 17,173 16,625 8,713 9,430 8,975 70,375 54,221
Deferred income tax (liabilities)
At beginning of the year (6,180) (5,595) (5,432) (10,872) – – (47,262) (49,008) (11,448) (9,916) (70,322) (75,391)Currency translations 1,248 (424) 657 (226) – – 3,172 (3,026) 438 (12) 5,515 (3,688)Credited/(charged) to income statement 195 (161) (51) 5,666 – – 6,027 4,860 (3,706) (1,515) 2,465 8,850(Charged) to equity – – – – – – (30,461) (88) (3,893) (5) (34,354) (93)
(Liabilities) at end of the year (4,737) (6,180) (4,826) (5,432) – – (68,524) (47,262) (18,609) (11,448) (96,696) (70,322)
Deferred income tax assets / (liabilities), net 14,412 9,938 (79) (2,190) 20,424 17,173 (51,899) (38,549) (9,179) (2,473) (26,321) (16,101)
Deferred income tax liabilities of US$0.6 million (FY2013/14: US$2.2 million) have not been recognised in respect of the tax payable upon the distribution of profits where JEHL controls the dividend policy and it has been determined that these undistributed profits will not be distributed in the foreseeable future.
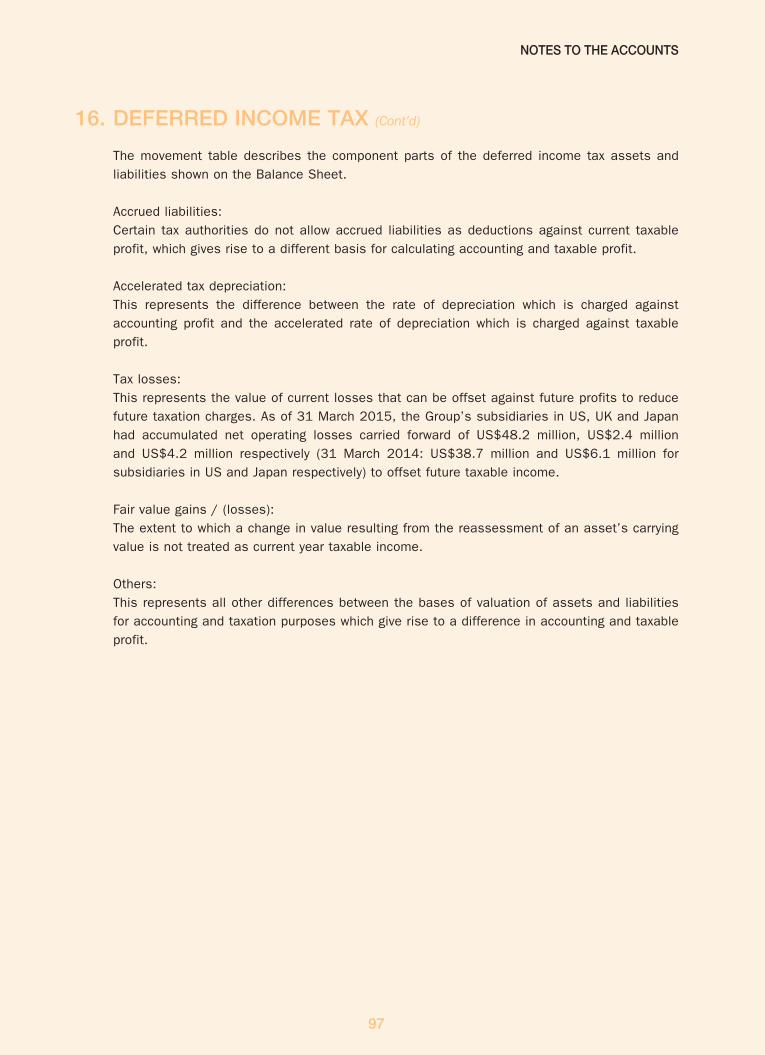
97
NOTES TO THE ACCOUNTS
16. DEFERRED INCOME TAX (Cont’d)
The movement table describes the component parts of the deferred income tax assets and liabilities shown on the Balance Sheet.
Accrued liabilities:Certain tax authorities do not allow accrued liabilities as deductions against current taxable profit, which gives rise to a different basis for calculating accounting and taxable profit.
Accelerated tax depreciation:This represents the difference between the rate of depreciation which is charged against accounting profit and the accelerated rate of depreciation which is charged against taxable profit.
Tax losses:This represents the value of current losses that can be offset against future profits to reduce future taxation charges. As of 31 March 2015, the Group’s subsidiaries in US, UK and Japan had accumulated net operating losses carried forward of US$48.2 million, US$2.4 million and US$4.2 million respectively (31 March 2014: US$38.7 million and US$6.1 million for subsidiaries in US and Japan respectively) to offset future taxable income.
Fair value gains / (losses):The extent to which a change in value resulting from the reassessment of an asset’s carrying value is not treated as current year taxable income.
Others:This represents all other differences between the bases of valuation of assets and liabilities for accounting and taxation purposes which give rise to a difference in accounting and taxable profit.
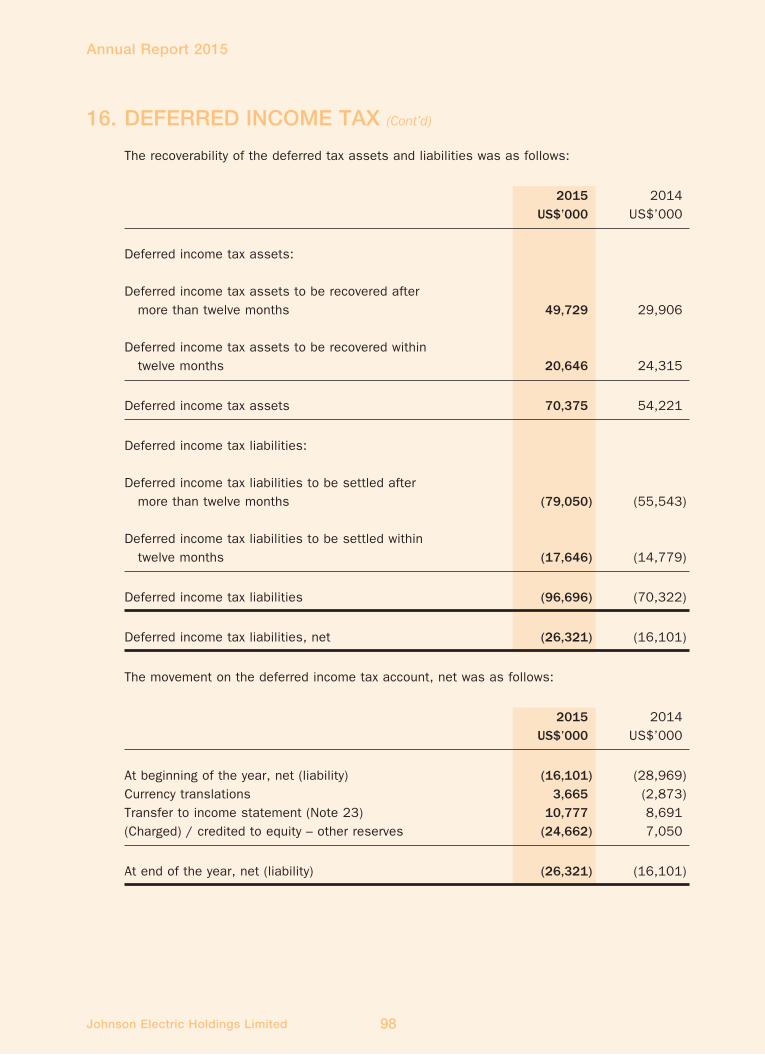
Annual Report 2015
98Johnson Electric Holdings Limited
16. DEFERRED INCOME TAX (Cont’d)
The recoverability of the deferred tax assets and liabilities was as follows:
2015 2014 US$’000 US$’000
Deferred income tax assets:
Deferred income tax assets to be recovered after more than twelve months 49,729 29,906
Deferred income tax assets to be recovered within twelve months 20,646 24,315
Deferred income tax assets 70,375 54,221
Deferred income tax liabilities:
Deferred income tax liabilities to be settled after more than twelve months (79,050) (55,543)
Deferred income tax liabilities to be settled within twelve months (17,646) (14,779)
Deferred income tax liabilities (96,696) (70,322)
Deferred income tax liabilities, net (26,321) (16,101)
The movement on the deferred income tax account, net was as follows:
2015 2014 US$’000 US$’000
At beginning of the year, net (liability) (16,101) (28,969)Currency translations 3,665 (2,873)Transfer to income statement (Note 23) 10,777 8,691(Charged) / credited to equity – other reserves (24,662) 7,050
At end of the year, net (liability) (26,321) (16,101)

99
NOTES TO THE ACCOUNTS
16. DEFERRED INCOME TAX (Cont’d)
The deferred income tax (charged) / credited to equity during the year was as follows:
2015 2014 US$’000 US$’000
Net fair value gains of hedging instruments (Note 18) (22,308) 8,197Remeasurements of long service payment (Note 18) (39) (63)Remeasurements of defined benefit plans (Note 18) 1,553 (1,084)Equity component of convertible bonds issued (Note 18) (3,868) –
(24,662) 7,050
Deferred income tax assets are recognised for tax losses carried forward to the extent that it is probable that future taxable profit will be available against which the unused tax losses can be utilised.
The movement in the Group’s unrecognised tax losses for FY2014/15 and FY2013/14 was presented below:
2015 2014 US$’000 US$’000
At beginning of the year 112,127 101,933Currency translations (7,187) (1,891)(Utilised / recognised) / addition during the year (15,695) 8,666(Reduction) / addition for tax positions of prior years (6,346) 5,788Liquidation and other reductions (4,778) (2,369)
At end of the year 78,121 112,127
Deferred income tax assets in respect of tax losses amounting to US$78.1 million (FY2013/14: US$112.1 million) have not been recognised primarily due to the uncertainty of future profit generation in the legal entities where such losses were incurred.

Annual Report 2015
100Johnson Electric Holdings Limited
16. DEFERRED INCOME TAX (Cont’d)
The ageing of unrecognised tax losses by expiry date is as follows:
2015 2014 US$’000 US$’000
Less than 1 year 57 4701 – 2 years 53 1582 – 5 years 15,757 3,6425 – 20 years 26,002 59,636Unlimited 36,252 48,221
78,121 112,127
Deferred income tax assets have not been recognised with respect to other deductible temporary differences amounting to US$2.3 million (FY2013/14: US$5.9 million) for which no taxable profit will be available to offset the deductible temporary difference.
JEHL files income tax returns in Hong Kong and its subsidiaries filed income tax returns in Hong Kong or various foreign jurisdictions.
JEHL and / or its subsidiaries are no longer subject to standard income tax examinations in major jurisdictions for the periods set out below:
Years no longer subject to tax audit
Hong Kong FY2007/08 and priorChina Calendar year 2009 and priorUS Federal FY2010/11 and priorSwitzerland FY2012/13 and priorGermany FY2005/06 and priorItaly FY2009/10 and priorHungary FY2008/09 and prior

101
NOTES TO THE ACCOUNTS
17. SHARE CAPITAL
Number of shares (thousands)
Shares held Ordinary for the Share shares Scheme Total
As of 31 March 2012 * 903,235 (7,297) 895,938
Repurchase and cancellation of issued capital (7,796) – (7,796)Shares vested to employees and INED for the Share Scheme – 409 409
As of 31 March 2013 * 895,439 (6,888) 888,551
Repurchase and cancellation of issued capital (640) – (640)Shares purchased by trustee for the Share Scheme – (1,224) (1,224)Shares vested to employees and INED for the Share Scheme – 1,144 1,144
As of 31 March 2014 * 894,799 (6,968) 887,831
Repurchase and cancellation of issued capital (14,257) – (14,257)Shares purchased by trustee for the Share Scheme – (13,749) (13,749)Shares vested to employees and INED for the Share Scheme – 1,609 1,609
As of 31 March 2015 880,542 (19,108) 861,434
* As of 15 July 2014, the shares of JEHL were consolidated on 4 to 1 basis and the number of shares for prior years has been adjusted to reflect the impact of this consolidation.
At the Annual General Meeting (“AGM”) of JEHL held on 10 July 2014, an ordinary resolution was duly passed under which each of the existing issued and unissued shares of HK$0.0125 each in the share capital of JEHL as of 15 July 2014 were consolidated on the basis that every 4 issued and unissued ordinary shares for 1 consolidated share of HK$0.05 each (“Consolidated Share”).
As of 31 March 2015, the total authorised number of ordinary shares was 1,760.0 million (31 March 2014: 1,760.0 million) with a par value of HK$0.05 per share (31 March 2014: HK$0.05 per share) after taking into account the effect of the Share Consolidation. All issued shares were fully paid.

Annual Report 2015
102Johnson Electric Holdings Limited
17. SHARE CAPITAL (Cont’d)
Shares held Ordinary for the Share Share shares Scheme premium Total US$’000 US$’000 US$’000 US$’000
As of 31 March 2012 5,827 (14,741) 45,336 36,422
Repurchase and cancellation of issued capital (50) – (19,823) (19,873)Shares vested to employees and INED for the Share Scheme – 892 (80) 812
As of 31 March 2013 5,777 (13,849) 25,433 17,361Repurchase and cancellation of issued capital (4) – (1,646) (1,650)Shares purchased by trustee for the Share Scheme – (2,891) – (2,891)Shares vested to employees and INED for the Share Scheme (Note 18) – 2,844 (159) 2,685
As of 31 March 2014 5,773 (13,896) 23,628 15,505Repurchase and cancellation of issued capital (92) – (23,977) (24,069)*Shares purchased by trustee for the Share Scheme – (50,726) – (50,726)Shares vested to employees and INED for the Share Scheme (Note 18) – 3,540 349 3,889
As of 31 March 2015 5,681 (61,082) – (55,401)
The total repurchase and cancellation of issued capital as shown in the “Consolidated Statement of Changes in Equity” on page 65 was recorded as a reduction in equity in two parts as follows: US$’000
Share capital * 24,069Other reserves 30,926
Total cost 54,995

103
NOTES TO THE ACCOUNTS
17. SHARE CAPITAL (Cont’d)
Cancellation of issued capitalA general mandate was approved and given to the Board by shareholders at JEHL’s AGM held on 10 July 2014 empowering the Board to repurchase shares up to 10% (89.5 million shares after taking into account the effect of the Share Consolidation) of the aggregate nominal amount of the issued share capital of JEHL. This mandate which had also existed in the previous year was extended to the next 12 month period. 14.3 million shares were purchased in FY2014/15, for cancellation, at a total cost of US$55.0 million (HK$426.4 million) including brokerage and cancellation fees (FY2013/14: 0.6 million shares after taking into account the effect of the Share Consolidation at a total cost of US$1.7 million (HK$12.8 million)).
Long-Term Incentive Share SchemeShare awards under the Long-Term Incentive Share Scheme (“Share Scheme”) were granted to directors, senior management and other employees as recommended by the Chairman and Chief Executive and approved by the Remuneration Committee of the Group.
The Share Scheme was approved by the shareholders on 24 August 2009. The Share Scheme was further amended, with its amendments being approved by the shareholders, on 20 July 2011. Under the Share Scheme, the directors have absolute discretion to grant shares to such eligible employees and directors.
Senior management of the Group regularly receive annual grants of time-vested units (Restricted Stock Units or RSUs) and performance-vested units (Performance Stock Units or PSUs). Time-vested units vest after three years. Performance-vested units vest after three years, subject to achievement of the performance conditions over the three-year vesting period. The performance conditions consist of a combination of a three-year cumulative earnings per share target set at the time of grant and a series of one-year earnings per share targets set at the beginning of each year of the three-year vesting period. The full vesting of performance vested units is subject to achievement of the three-year cumulative earnings per share target; partial vesting occurs if one or more of the one-year earnings per share targets are met.
Prior to April 2010, JEHL only granted time-vested units (RSUs), with 20% of the grant vesting each year for the five years following the date of the grant.
JEHL makes grants of time-vested units to key staff below the senior management level. These are subject to a three-year vesting period.
Once vested, the directors have the discretion to deliver either shares or the cash equivalent of the vested shares to eligible employees.

Annual Report 2015
104Johnson Electric Holdings Limited
17. SHARE CAPITAL (Cont’d)
JEHL makes annual grants of fully-vested shares to the Independent Non-Executive Directors (“INED”). The shares granted must be held by each director for the remainder of the board term in which the grant was made. Each year, JEHL grants each of the INED shares equivalent in value to US$6,000 rounded up to the next multiple of 500 shares.
Movements in the number of unvested shares granted were as follows:
Number of unvested units granted (thousands) Restricted Performance Stock Units Stock Units Total
Unvested shares granted, as of 31 March 2013 * 3,146 2,925 6,071
Shares granted to employees and INED during the year 1,730 2,455 4,185Shares vested to employees and INED during the year (705) (441) (1,146)Cash settled share-based units vested to employees during the year (191) (75) (266)Forfeited during the year (356) (564) (920)
Unvested shares granted, as of 31 March 2014 * 3,624 4,300 7,924
Shares granted to employees and INED during the year 1,828 2,267 4,095Shares vested to employees and INED during the year (794) (815) (1,609)Forfeited during the year (140) (222) (362)
Unvested shares granted, as of 31 March 2015 4,518 5,530 10,048
* As of 15 July 2014, the shares of JEHL were consolidated on 4 to 1 basis and the number of shares for prior periods has been adjusted to reflect the impact of the share consolidation.
The weighted average fair value of the unvested shares granted during the year was HK$26.92 (US$3.45) after taking into account the effect of the Share Consolidation.
As of 31 March 2015, excluding any subsequent grants and forfeitures, the number of unvested shares was as follows:
Number of unvested units granted (thousands) Restricted PerformanceVesting year Stock Units Stock Units Total
FY2015/16 1,256 1,253 2,509FY2016/17 1,376 2,080 3,456FY2017/18 1,436 2,197 3,633FY2018/19 125 – 125FY2019/20 325 – 325
Total unvested shares granted 4,518 5,530 10,048

105
NOTES TO THE ACCOUNTS
17. SHARE CAPITAL (Cont’d)
Share optionsPursuant to the Share Option Scheme (the “Option Scheme”) approved at the AGM of JEHL held on 29 July 2002 and adopted by JEHL on the same day, the Board of Directors may, at its discretion, grant options to any qualifying participants (including but not limited to any employee, whether full time or part time, and any executive or non-executive directors of JEHL or any affiliate as defined in the Scheme). As of 31 March 2015, all of the then outstanding share options granted under the Option Scheme lapsed in their respective exercisable periods.
Options lapsed Subscription Held at during Held at price per Date of Exercisable Exercisable 31/03/2014* the year 31/03/2015 share (HK$)* grant from until
25,000 (25,000) – 29.60 28/12/2004 01/01/2007 27/12/2014 25,000 (25,000) – 29.60 28/12/2004 01/01/2008 27/12/2014
50,000 (50,000) –
* The number of options and the subscription price per share have been adjusted to reflect the impact of Share Consolidation.
There was no profit and loss impact relating to the Option Scheme in FY2014/15 (FY2013/14: nil).

Annual Report 2015
106Johnson Electric Holdings Limited
18. RESERVES
Share-based employee Contributed Capital Goodwill on Exchange compensation Hedging Miscellaneous Retained surplus reserve consolidation reserve reserve reserve reserves* earnings Total US$’000 US$’000 US$’000 US$’000 US$’000 US$’000 US$’000 US$’000 US$’000
As of 31 March 2014 15,499 38,904 (233,885) 219,855 10,470 (20,378) 45,944 1,640,385 1,716,794
Hedging instruments – raw material commodity contracts – fair value losses, net – – – – – (17,088) – – (17,088) – transferred to inventory and subsequently recognised in income statement – – – – – 8,107 – – 8,107 – deferred income tax effect (Note 16) – – – – – 1,482 – – 1,482 – forward foreign currency exchange contracts – fair value gains, net – – – – – 175,868 – – 175,868 – transferred to income statement – – – – – (17,104) – – (17,104) – deferred income tax effect (Note 16) – – – – – (23,790) – – (23,790) – net investment hedge – fair value gains, net – – – 54,037 – 7,656 – – 61,693
Defined benefit plans – remeasurements (Note 15) – – – – – – – (15,812) (15,812) – deferred income tax effect (Note 16) – – – – – – – 1,553 1,553
Long service payment – remeasurements (Note 15) – – – – – – – 230 230 – deferred income tax effect (Note 16) – – – – – – – (39) (39)
Investment property – revaluation surplus realised upon disposal – – – – – – (14) 14 –
Currency translations of subsidiaries and associate – – – (104,419) – 84 – – (104,335)
Net income recognised directly in equity – – – (50,382) – 135,215 (14) (14,054) 70,765Profit for the year – – – – – – – 210,894 210,894
Total comprehensive income for the year – – – (50,382) – 135,215 (14) 196,840 281,659
Appropriation of retained earnings to statutory reserve – – – – – – 4,224 (4,224) –
Convertible bonds – equity component of convertible bonds issued (Note 14) – – – – – – 4,823 – 4,823 – deferred income tax effect (Note 16) – – – – – – (3,868) – (3,868)
Cancellation of issued capital (Note 17) (15,499) (15,427) – – – – – – (30,926)
Long-Term Incentive Share Scheme – shares vested (Note 17) – – – – (3,889) – – – (3,889) – value of employee services (Note 27) – – – – 7,413 – – – 7,413
Share options – options lapsed – – – – (68) – – 68 –
FY2013/14 final dividend paid – – – – – – – (38,765) (38,765)FY2014/15 interim dividend paid – – – – – – – (15,522) (15,522)
(15,499) (15,427) – (50,382) 3,456 135,215 5,165 138,397 200,925
As of 31 March 2015 – 23,477 (233,885) 169,473 13,926 114,837 51,109 1,778,782 1,917,719
Final dividend proposed (Note 25) – – – – – – – 37,768 37,768Other – 23,477 (233,885) 169,473 13,926 114,837 51,109 1,741,014 1,879,951
As of 31 March 2015 – 23,477 (233,885) 169,473 13,926 114,837 51,109 1,778,782 1,917,719
* Miscellaneous reserves mainly represent property revaluation reserve, equity component of convertible bonds (net of tax) and statutory reserve.

107
NOTES TO THE ACCOUNTS
18. RESERVES (Cont’d)
Share-based employee Contributed Capital Goodwill on Exchange compensation Hedging Miscellaneous Retained surplus reserve consolidation reserve reserve reserve reserves* earnings Total US$’000 US$’000 US$’000 US$’000 US$’000 US$’000 US$’000 US$’000 US$’000
As of 31 March 2013 15,499 38,904 (233,885) 169,887 5,859 34,237 47,593 1,473,057 1,551,151
Available-for-sale financial assets – adoption of HKFRS 9 – – – – – – 380 (380) –
Hedging instruments – raw material commodity contracts – fair value losses, net – – – – – (19,273) – – (19,273) – transferred to inventory and subsequently recognised in income statement – – – – – 8,127 – – 8,127 – deferred income tax effect (Note 16) – – – – – 1,886 – – 1,886 – forward foreign currency exchange contracts – fair value losses, net – – – – – (25,000) – – (25,000) – transferred to income statement – – – – – (14,233) – – (14,233) – deferred income tax effect (Note 16) – – – – – 6,311 – – 6,311 – net investment hedge – fair value losses, net – – – – – (12,362) – – (12,362)
Defined benefit plans – remeasurements (Note 15) – – – – – – – 8,466 8,466 – deferred income tax effect (Note 16) – – – – – – – (1,084) (1,084)
Long service payment – remeasurements (Note 15) – – – – – – – 623 623 – deferred income tax effect (Note 16) – – – – – – – (63) (63)
Investment property – revaluation surplus realised upon disposal – – – – – – (583) 583 –
Currency translations of subsidiaries and associate – – – 49,968 – (71) – – 49,897
Net income recognised directly in equity – – – 49,968 – (54,615) (203) 8,145 3,295Profit for the year – – – – – – – 207,865 207,865
Total comprehensive income for the year – – – 49,968 – (54,615) (203) 216,010 211,160
Appropriation of retained earnings to statutory reserve – – – – – – (1,446) 1,446 –
Long-Term Incentive Share Scheme – shares vested (Note 17) – – – – (2,685) – – – (2,685) – value of employee services (Note 27) – – – – 5,799 – – – 5,799 – transfer from cash settled shared-based unit – – – – 1,771 – – – 1,771
Share options – options lapsed – – – – (274) – – 274 –
FY2012/13 final dividend paid – – – – – – – (36,664) (36,664)FY2013/14 interim dividend paid – – – – – – – (13,738) (13,738)
– – – 49,968 4,611 (54,615) (1,649) 167,328 165,643
As of 31 March 2014 15,499 38,904 (233,885) 219,855 10,470 (20,378) 45,944 1,640,385 1,716,794
Final dividend proposed (Note 25) – – – – – – – 38,910 38,910Other 15,499 38,904 (233,885) 219,855 10,470 (20,378) 45,944 1,601,475 1,677,884
As of 31 March 2014 15,499 38,904 (233,885) 219,855 10,470 (20,378) 45,944 1,640,385 1,716,794
* Miscellaneous reserves mainly represent property revaluation reserve and statutory reserve.

Annual Report 2015
108Johnson Electric Holdings Limited
19. OTHER INCOME AND GAINS, NET
2015 2014 US$’000 US$’000
Gross rental income from investment property 4,192 4,569(Losses) / gains on investments, net (120) 1,590(Losses) / gains on disposal of property, plant and equipment and investment property (Note 27) (473) 2,529Fair value gains on investment property (Note 4 & 27) 10,749 5,239Fair value gains / (losses) on other financial assets / liabilities 65 (429)Subsidies and other income 3,505 6,264
17,918 19,762
20. SELLING AND ADMINISTRATIVE EXPENSES
2015 2014 US$’000 US$’000
Selling expenses 100,933 106,372Administrative expenses 303,936 287,562Legal and warranty (Note 15) 9,632 7,195Net exchange (gains) / losses on revaluation of monetary assets and liabilities (Note 22) (6,962) 4,051
407,539 405,180
Note: Selling and administrative expenses included operating lease payments for FY2014/15 of US$6.7 million (FY2013/14: US$6.9 million).
21. FINANCE INCOME / (COSTS), NET
2015 2014 US$’000 US$’000
Interest income 13,998 10,927Interest expense on borrowings wholly repayable within 5 years (1,584) (1,830)Interest expense on convertible bonds wholly repayable later than 5 years (Note 14 & 24) (6,868) –
Net interest income (Note 27) 5,546 9,097
Borrowings are discussed in Note 13. Convertible bonds are discussed in Note 14.

NOTES TO THE ACCOUNTS
109
22. EXPENSES BY NATURE
Operating profit was stated after crediting and charging the following:
2015 2014 US$’000 US$’000
Depreciation Depreciation of property, plant and equipment (Note 3) 71,765 67,543 Less: amounts capitalised in assets under construction (670) (588)
71,095 66,955
Engineering expenditure * Engineering expenditure 127,830 122,490 Capitalisation of engineering development costs (Note 5) (6,269) (5,804)
Net engineering expenditure 121,561 116,686
Employee compensation ** Wages and salaries 589,016 523,924 Share-based payments 7,375 6,301 Social security costs 56,444 51,731 Pension costs – defined benefit plans (Note 15.1) 2,980 (123) Pension costs – defined contribution plans (Note 15.2) 4,757 4,272
660,572 586,105 Less: amounts capitalised in assets under construction (5,167) (3,530)
655,405 582,575
Other items: Cost of goods sold *** 1,503,647 1,478,711 Auditors’ remuneration 2,458 2,354 Amortisation of intangible assets (Note 5 & 27) 21,396 21,096 Impairment of property, plant and equipment (Note 3 & 27) 686 3,383 Impairment of intangible assets (Note 5 & 27) 600 – Net exchange (gains) / losses on revaluation of monetary assets and liabilities (Note 20) (6,962) 4,051 Impairment of trade receivables / bad debt expense (Note 9) 1,107 6,932
* Engineering expenditure as a percentage of sales was 6.0% in FY2014/15 (FY2013/14: 5.8%).
** During the past year, certain operations in China were converted from a contract processing agreement operating model to a Wholly Foreign Owned Enterprise structure. For comparison purpose, the FY2013/14 costs for subcontracting were US$36.5 million. In FY2014/15, such expenses are included in employee compensation.
*** Cost of goods sold comprised materials, direct labour costs (including their social costs) and production overheads including operating lease payments of US$14.7 million (FY2013/14: US$15.0 million).

Annual Report 2015
110Johnson Electric Holdings Limited
23. INCOME TAX EXPENSE
Hong Kong profits tax has been provided at the rate of 16.5% (FY2013/14: 16.5%) on the estimated assessable profit for the year. Overseas tax has been provided at the applicable rates on the estimated assessable profit in the respective countries of operations for the year. The overall global effective tax rate for FY2014/15 was 11.7% (FY2013/14: 11.6%).
2015 2014 US$’000 US$’000
Current income tax Hong Kong profits tax * 7,631 16,870 Overseas taxation 31,761 21,771 Under / (over) provision in prior years 634 (1,852)
40,026 36,789Deferred income tax (Note 16) (10,777) (8,691)
Total income tax expense 29,249 28,098
Effective tax rate 11.7% 11.6%
* The Hong Kong current tax obligation reduced as a result of required changes to our legal structure and the associated creation of Wholly Foreign Owned Enterprises in China, replacing our previous contract processing arrangements. This change in Hong Kong taxes was partially offset by a change in mainland China taxes.
The Group’s effective tax rate of 11.7% differed from the statutory tax rate of Hong Kong of 16.5% as follows:
2015 2014
US$’000 US$’000
Profit before income tax 249,061 242,994
Tax charged at Hong Kong profits tax rate 16.5% 41,095 16.5% 40,094
Effect of different tax rates in other countries – Countries with taxable profit 0.6% 1,438 1.3% 3,224 – Countries with loss (1.5)% (3,743) (1.1)% (2,686)Effect of income, net of expenses, not subject to tax (4.0)% (9,885) (5.5)% (13,288)Over provisions in prior years (current and deferred) (0.4)% (1,055) (1.1)% (2,802)Effect of tax losses recognised, net of utilisation (1.2)% (2,945) (0.7)% (1,868)Other timing differences not recognised as an asset and other tax, net of utilisation 1.7% 4,344 2.2% 5,424
11.7% 29,249 11.6% 28,098
See Note 16 for a discussion of deferred income tax assets and liabilities.

NOTES TO THE ACCOUNTS
111
24. EARNINGS PER SHARE
Basic earnings per shareBasic earnings per share was calculated by dividing the profit attributable to shareholders by the weighted average number of ordinary shares in issue during the year excluding ordinary shares purchased by JEHL and held for the Long-Term Incentive Share Scheme. The number of shares for the calculation of basic and diluted earnings per share for the prior year has been adjusted to reflect the impact of the Share Consolidation.
2015 2014
Profit attributable to shareholders (thousands US Dollar) 210,894 207,865
Weighted average number of ordinary shares in issue (thousands) 874,537 888,376
Basic earnings per share (US Cents per share) 24.11 23.40
Basic earnings per share (HK Cents per share) 186.98 181.51
Diluted earnings per shareDiluted earnings per share was calculated by adjusting the weighted average number of ordinary shares as per basic earnings per share, to include the weighted average number of all the dilutive potential ordinary shares.
2015 2014
Profit attributable to shareholders (thousands US Dollar) 210,894 207,865Adjustments for convertible bonds – Interest (thousands US Dollar) (Note 14 & 21) 6,868 – – Deferred income tax effect (thousands US Dollar) (714) –
Adjusted profit attributable to shareholders (thousands US Dollar) 217,048 207,865
Weighted average number of ordinary shares issued and outstanding (thousands) 874,537 888,376
Adjustments for restricted shares granted – Share Scheme (Time vesting) 3,954 3,624 – Share Scheme (Performance earned) 2,750 2,013Adjustments for convertible bonds – Assumed conversion of convertible bonds 38,294 –
Weighted average number of ordinary shares (diluted) (thousands) 919,535 894,013
Diluted earnings per share (US Cents per share) 23.60 23.25
Diluted earnings per share (HK Cents per share) 183.02 180.36

Annual Report 2015
112Johnson Electric Holdings Limited
25. DIVIDENDS
2015 2014 US$’000 US$’000
Interim, of 1.79 US Cents (14 HK Cents) per share, paid in January 2015 (first half of FY2013/14: 1.54 US Cents or 12 HK Cents*) 15,522 13,738
Final, proposed, of 4.36 US Cents (34 HK Cents) per share, to be paid in July 2015 (FY2013/14: 4.36 US Cents or 34 HK Cents*) (Note 18) 37,768** 38,910
53,290 52,648
* The interim and final dividends per share for FY2013/14 have been adjusted to reflect the impact of Share Consolidation.** Proposed dividend is calculated based on the total number of shares as of 31 March 2015. Actual dividend would be paid on 31
July 2015 to shareholders whose names appear on the Register of Shareholders of JEHL on 22 July 2015.
Total dividend per share for the year is 48 HK Cents (FY2013/14 was 46 HK Cents after taking into account the effect of Share Consolidation).
At a meeting held on 13 May 2015 the Directors recommended a final dividend of 4.36 US Cents (34 HK Cents) per share to be paid out in July 2015. The recommended final dividend will be reflected as an appropriation of retained earnings for FY2015/16.
Dividends for the periods FY2010/11 through FY2014/15 are shown in the table below:
Interim Final Total Total HK Cents HK Cents HK Cents dividend per share per share per share US$’000
FY2010/11 * 12.0 24.0 36.0 42,488FY2011/12 * 12.0 28.0 40.0 46,118FY2012/13 * 12.0 32.0 44.0 50,396FY2013/14 * 12.0 34.0 46.0 52,648FY2014/15 14.0 34.0** 48.0 53,290
* The interim and final dividends per share for prior periods have been adjusted to reflect the impact of Share Consolidation.** Final dividend for FY2014/15 has been recommended by the Board of Directors and is subject to shareholder approval.

NOTES TO THE ACCOUNTS
113
26. COMMITMENTS
26.1 Capital commitments
2015 2014 US$’000 US$’000
Capital commitments for property, plant and equipmentAuthorised but not contracted for * 40,013 56,150Contracted but not provided for 18,884 11,215
58,897 67,365
* As of the balance sheet date, capital commitments authorised but not contracted for represented the management’s budget for the coming quarter. The commitments as of 31 March 2014 included budgets for new manufacturing facilities in Mexico and Serbia.
26.2 Operating lease commitments(i) The Group’s future aggregate minimum lease payments under non-cancellable
operating leases as of 31 March 2015 and 31 March 2014 were as follows:
2015 2014 Land and Land and buildings Others buildings Others US$’000 US$’000 US$’000 US$’000
Less than 1 year 17,965 1,343 18,115 1,1621 – 5 years 51,726 2,351 52,842 1,487Over 5 years 14,199 – 19,384 –
83,890 3,694 90,341 2,649
(ii) The Group’s future aggregate minimum lease rental receivable under non-cancellable operating leases on land and buildings as of 31 March 2015 and 31 March 2014 were as follows:
2015 2014 US$’000 US$’000
Less than 1 year 1,323 3,0271 – 5 years 5,293 3,436Over 5 years 7,547 6,993
14,163 13,456
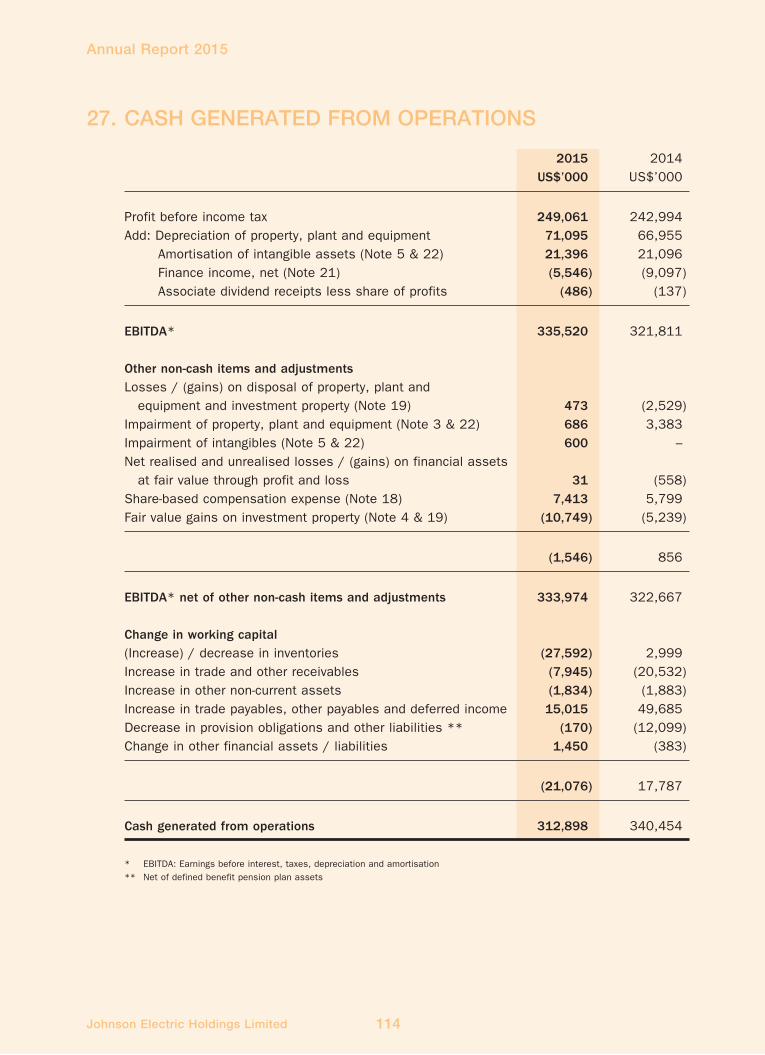
Annual Report 2015
114Johnson Electric Holdings Limited
27. CASH GENERATED FROM OPERATIONS
2015 2014 US$’000 US$’000
Profit before income tax 249,061 242,994Add: Depreciation of property, plant and equipment 71,095 66,955 Amortisation of intangible assets (Note 5 & 22) 21,396 21,096 Finance income, net (Note 21) (5,546) (9,097) Associate dividend receipts less share of profits (486) (137)
EBITDA* 335,520 321,811
Other non-cash items and adjustmentsLosses / (gains) on disposal of property, plant and equipment and investment property (Note 19) 473 (2,529)Impairment of property, plant and equipment (Note 3 & 22) 686 3,383Impairment of intangibles (Note 5 & 22) 600 –Net realised and unrealised losses / (gains) on financial assets at fair value through profit and loss 31 (558)Share-based compensation expense (Note 18) 7,413 5,799Fair value gains on investment property (Note 4 & 19) (10,749) (5,239)
(1,546) 856
EBITDA* net of other non-cash items and adjustments 333,974 322,667
Change in working capital(Increase) / decrease in inventories (27,592) 2,999Increase in trade and other receivables (7,945) (20,532)Increase in other non-current assets (1,834) (1,883)Increase in trade payables, other payables and deferred income 15,015 49,685Decrease in provision obligations and other liabilities ** (170) (12,099)Change in other financial assets / liabilities 1,450 (383)
(21,076) 17,787
Cash generated from operations 312,898 340,454
* EBITDA: Earnings before interest, taxes, depreciation and amortisation** Net of defined benefit pension plan assets

NOTES TO THE ACCOUNTS
115
27. CASH GENERATED FROM OPERATIONS (Cont’d)
In the cash flow statement, proceeds from disposal of property, plant and equipment and investment property comprises:
2015 2014 US$’000 US$’000
Net book amount 1,285 6,195(Losses) / gains on disposal of property, plant and equipment and investment property (Note 19) (473) 2,529Subsequent receipt of cash from disposal of property – 2,083
Proceeds from disposal of property, plant and equipment and investment property 812 10,807
28. BUSINESS COMBINATION
On 30 July 2014, the Group paid US$9.2 million (total consideration US$10.0 million net of cash acquired US$0.8 million) to acquire the entire interest of Van de Wiel International Limited, a sales agency of JE in the UK. This acquisition strengthened the Group’s sales network by providing a direct interface with key automotive customers in the UK.
Completion took place on 30 July 2014. The aggregate revenue and net profit contributed by this acquisition were insignificant to the Group’s results for the year. The acquisition would not have had any significant impact to the Group’s revenue and profit for the year if it had occurred on 1 April 2014.
The following table summarises the consideration paid for fair value of the assets acquired at the acquisition date.
30 July 2014 US$’000
Outflow of cash to acquired business, net of cash acquired
Consideration 9,987Cash and deposits in subsidiary acquired (784)
Cash outflow on acquisition 9,203
Fair value US$’000
Assets acquired
Intangibles – client relationships (Note 5) 9,203Cash and deposits 784
Total identifiable net assets 9,987Goodwill –
9,987

Annual Report 2015
116Johnson Electric Holdings Limited
29. DIRECTORS’ REMUNERATION AND KEY / SENIOR MANAGEMENT COMPENSATION
29.1 Directors’ remunerationThe remuneration of directors for FY2014/15 was as follows:
Employer’s contribution to pension Fees Salary Bonus Others scheme TotalName of director US$’000 US$’000 US$’000 US$’000 US$’000 US$’000
Yik-Chun Koo Wang – 72 – 36 – 108Patrick Shui-Chung Wang – 889 1,384 – 106 2,379Winnie Wing-Yee Wang – 626 488 – 75 1,189Austin Jesse Wang – 285 104 60 35 484Peter Kin-Chung Wang 36 – – – – 36Peter Stuart Allenby Edwards 45* – – – – 45Patrick Blackwell Paul 57* – – – – 57Michael John Enright 52* – – – – 52Joseph Chi-Kwong Yam 42* – – – – 42Christopher Dale Pratt 32* – – – – 32
264 1,872 1,976 96 216 4,424
The remuneration of directors for FY2013/14 was as follows:
Employer’s contribution to pension Fees Salary Bonus Others scheme TotalName of director US$’000 US$’000 US$’000 US$’000 US$’000 US$’000
Yik-Chun Koo Wang – 72 – – – 72Patrick Shui-Chung Wang – 865 752 – 104 1,721Winnie Wing-Yee Wang – 610 265 – 73 948Austin Jesse Wang – 259 60 61 21 401Peter Kin-Chung Wang 36 – – – – 36Peter Stuart Allenby Edwards 49* – – – – 49Patrick Blackwell Paul 60* – – – – 60Michael John Enright 50* – – – – 50Joseph Chi-Kwong Yam 45* – – – – 45
240 1,806 1,077 61 198 3,382
* Included the value of the grant of shares to Independent Non-Executive Directors.

NOTES TO THE ACCOUNTS
117
29. DIRECTORS’ REMUNERATION AND KEY / SENIOR MANAGEMENT COMPENSATION (Cont’d)
29.2 Key / senior management compensationOther than the directors’ remuneration disclosed above, emoluments paid to 10 (FY2013/14: 11) key / senior management as set out in the section-Profile of Directors and Senior Management on pages 161 to 163 of the annual report were as follows:
2015 2014 US$’000 US$’000
Salaries, allowances and other benefits 6,104 6,128Retirement scheme contributions 524 509Share-based payment 2,355 1,858Bonuses 3,107 1,941
12,090 10,436
Remuneration bands Number of individuals
2015 2014
US$512,001 – US$641,000 (HK$4,000,001 – HK$5,000,000) – 1
US$769,001 – US$897,000 (HK$6,000,001 – HK$7,000,000) – 3
US$897,001 – US$1,026,000 (HK$7,000,001 – HK$8,000,000) 3 4
US$1,026,001 – US$1,154,000 (HK$8,000,001 – HK$9,000,000) 1 2
US$1,154,001 – US$1,282,000 (HK$9,000,001 – HK$10,000,000) 3 –
US$1,282,001 – US$1,410,000 (HK$10,000,001 – HK$11,000,000) 2 1
US$1,538,001 – US$1,666,000 (HK$12,000,001 – HK$13,000,000) 1 –

Annual Report 2015
118Johnson Electric Holdings Limited
29. DIRECTORS’ REMUNERATION AND KEY / SENIOR MANAGEMENT COMPENSATION (Cont’d)
29.3 Five highest individuals compensationOf the five highest paid individuals of the Group, 1 is a director of the Group whose remuneration is included in Note 29.1 (FY2013/14: 1 director in the five highest paid individuals). The compensation paid to the 5 (FY2013/14: 5) highest paid employees were as follows:
2015 2014 US$’000 US$’000
Salaries, allowances and other benefits 3,623 3,525Retirement scheme contributions 361 342Share-based payment 1,049 665Bonuses 2,940 1,695
7,973 6,227
Remuneration bands Number of individuals
2015 2014
US$961,001 – US$1,026,000 (HK$7,500,001 – HK$8,000,000) – 1
US$1,026,001 – US$1,090,000 (HK$8,000,001 – HK$8,500,000) – 2
US$1,218,001 – US$1,282,000 (HK$9,500,001 – HK$10,000,000) 1 –
US$1,282,001 – US$1,346,000 (HK$10,000,001 – HK$10,500,000) 1 –
US$1,346,001 – US$1,410,000 (HK$10,500,001 – HK$11,000,000) 1 1
US$1,602,001 – US$1,666,000 (HK$12,500,001 – HK$13,000,000) 1 –
US$1,666,001 – US$1,731,000 (HK$13,000,001 – HK$13,500,000) – 1
US$2,372,001 – US$2,436,000 (HK$18,500,001 – HK$19,000,000) 1 –
30. RELATED PARTY TRANSACTION
Details of substantial shareholders are shown in Disclosure of Interests in the Report of the Directors. The Group had no material related party transactions during the year. Details of directors’ remunerations and key / senior management compensation are disclosed in Note 29.

NOTES TO THE ACCOUNTS
119
31. FINANCIAL RISK MANAGEMENT
The Group’s activities expose it to a variety of financial risks: market risk (including foreign exchange risk, interest rate risk, fair value interest rate risk and raw material commodity purchase price risk), customer credit risk, liquidity risk and capital risk. The Group’s overall risk management program focuses on the unpredictability of financial markets and seeks to minimise potential adverse effects on the Group’s financial performance. The Group uses derivative financial instruments to hedge certain risk exposures.
Risk management is carried out by a central treasury department (“Group Treasury”) according to Group policy. Group Treasury identifies, evaluates and hedges financial risks in close co-operation with the Group’s operating units.
31.1 Market risk
(a) Foreign exchange riskThe Group operates globally and is exposed to foreign exchange risk primarily through sales and purchases transactions that are denominated in a currency other than the functional currency of the subsidiaries.
For FY2014/15, of the sales, 45% (FY2013/14: 46%) were in USD, 34% (FY2013/14: 35%) in EUR, 18% (FY2013/14: 16%) in RMB with the rest being in other currencies including JPY.
The major currencies used for raw material commodity purchases, production overhead costs and selling and administrative expenses are USD, HKD, RMB, EUR, HUF, MXN, CHF, PLN and ILS.
Apart from USD and HKD (which is pegged to USD), open foreign exchange exposures are hedged with forward foreign exchange contracts, with a view to reducing the net exposure to currency fluctuation. As of 31 March 2015, forward foreign currency exchange contracts had durations of up to 81 months.
The Group’s most significant currency exposures relate to RMB and EUR. As of 31 March 2015, if USD had weakened / strengthened by 5% against RMB with all other variables held constant, post-tax profit for the year would be 5.6% (FY2013/14: 10.2%) higher / lower, mainly due to foreign exchange differences on the translation of RMB denominated net current assets. If USD had weakened / strengthened by 5% against EUR with all other variables held constant, post-tax profit for the year would be 1.8% (FY2013/14: 0.3%) higher / lower, mainly a result of foreign exchange differences on translation of EUR denominated net current assets. The above sensitivity ignores the potential impact of cash flow hedges.

Annual Report 2015
120Johnson Electric Holdings Limited
31. FINANCIAL RISK MANAGEMENT (Cont’d)
31.1 Market risk (Cont’d)
(a) Foreign exchange risk (Cont’d)
The Group has operations in Europe and its net assets value is exposed to foreign exchange risk denominated in Euro. This exposure is hedged with forward foreign exchange contracts and cross currency interest rate swaps with durations up to 73 months at the year end.
(b) Interest rate riskThe Group’s interest rate risk mainly arises from interest-bearing borrowings.
The Group continues to monitor interest rate risk and will consider the use of both fixed and floating interest rate borrowings in the functional currencies where the Group operates.
Bank balances and deposits as of 31 March 2015 were US$773.2 million (31 March 2014: US$644.0 million) bearing interest at a weighted average rate of approximately 1.8% (31 March 2014: 2.3%). Other than bank deposits, the Group has no significant interest-bearing assets. Management does not anticipate a significant impact resulting from changes in interest rates on interest-bearing assets and borrowings.
(c) Raw material commodity purchase price riskThe Group is exposed to raw material commodity purchase price risk, mainly due to fluctuations in steel, copper, silver and aluminium purchase prices. Price risk due to steel is reduced through fixed price contracts of up to 3 months forward with the Group’s suppliers, and price risk due to copper, silver and aluminium is reduced by hedging through appropriate financial instruments. The Group also manages copper, silver and aluminium prices through incorporating appropriate clauses in contracts with certain customers so as to have the flexibility to pass increases in raw material costs onto these customers.
The Group’s most significant raw material commodity purchase price risk exposure relates to copper. A 10% increase / decrease in the copper price would increase / decrease the equity by US$24.3 million (31 March 2014: US$20.6 million), representing the change in fair value of copper hedging contracts at the balance sheet date.

NOTES TO THE ACCOUNTS
121
31. FINANCIAL RISK MANAGEMENT (Cont’d)
31.2 Credit and customer collection riskThe Group’s credit and customer collection risk mainly arises from trade and other receivables. The Group has no significant concentrations of credit risk. The Group normally grants credit terms ranging from 30 to 105 days to trade customers. It has a policy in place to evaluate customers’ credit risk by considering their current financial position and past repayment history. Management reviews the collectability of the overdue accounts receivable according to the Group’s credit and provision for doubtful debt policies. The Group’s customer credit management has resulted in a continuing low rate of bad debt.
The Group manages its deposits with banks and financial institutions and transactions involving derivative financial instruments by monitoring credit ratings and limiting the aggregate risk to any individual counterparty. The majority of the Group’s cash and deposits are held with, and transactions involving derivative financial instruments were made with, major financial institutions (e.g. the Group’s principal bankers) with strong investment grade credit ratings.
As of 31 March 2015, JEHL’s exposure to credit risk for financial guarantees is US$92.9 million (31 March 2014: US$115.0 million).
31.3 Liquidity riskManagement believes the combination of cash on hand, available credit lines and expected future operating cash flows is sufficient to satisfy the Group’s cash needs for the current and planned level of operations for the foreseeable future. Available credit lines include financing of trade receivables by subsidiary companies in USA, Europe and Hong Kong, guaranteed by JEHL.
The Group had cash and cash equivalents of US$773.2 million as of 31 March 2015 (31 March 2014: US$644.0 million), which constitute 27% (31 March 2014: 26%) of its total assets. As of 31 March 2015, The Group had US$165 million of three year committed and unutilised facilities (31 March 2014: US$165 million) and US$322 million of uncommitted and unutilised short term borrowing facilities provided by its principal bankers (31 March 2014: US$326 million). The Group also had US$91 million in uncommitted and unutilised trade receivable financing lines (31 March 2014: US$86 million).

Annual Report 2015
122Johnson Electric Holdings Limited
31. FINANCIAL RISK MANAGEMENT (Cont’d)
31.3 Liquidity risks (Cont’d)
The table below analyses the Group’s borrowings and other financial assets / liabilities into relevant maturity groupings based on the remaining period to the contractual maturity date at the balance sheet date. The amounts disclosed in the table are the contractual undiscounted cash flows. Balances due within 12 months equal their carrying balances, as the impact of discounting is not significant.
Less than Over 1 year 1 – 2 years 2 – 5 years 5 years US$’000 US$’000 US$’000 US$’000
As of 31 March 2015Borrowings 66,102 28,124 327 –Convertible bonds 2,000 2,000 223,620 –Other financial assets and liabilities – Raw material commodity contracts 9,742 4,012 4,637 98 – Forward foreign exchange contracts – Net settled (6,252) (3,948) 10,972 7,002 – Gross settled: – inflow (530,275) (544,663) (1,119,914) (381,215) – outflow 483,921 494,901 980,288 302,286 – Net investment hedge – Gross settled: – inflow (52,034) (52,822) (159,649) (76,898) – outflow 41,165 41,165 120,246 73,649Finance lease 1,400 1,400 1,662 –Trade and other payables 272,434 – – –
As of 31 March 2014Borrowings 115,062 55 1,948 –Other financial assets and liabilities – Raw material commodity contracts 8,770 2,173 1,037 – – Forward foreign exchange contracts – Net settled (230) (6,104) (11,462) – – Gross settled: – inflow (658,635) (382,605) (894,172) (166,476) – outflow 658,005 385,716 877,486 157,825 – Net investment hedge – Gross settled: – inflow (51,289) (51,401) (156,440) (50,969) – outflow 52,258 52,258 156,773 48,132Finance lease 1,400 1,400 3,063 –Trade and other payables 271,801 – – –

NOTES TO THE ACCOUNTS
123
31. FINANCIAL RISK MANAGEMENT (Cont’d)
31.4 Capital risk managementAs of 31 March 2015, the Group’s total debt to capital ratio was 13% compared to 6% as of 31 March 2014.
Total debt to capital ratio as of 31 March 2015 and 31 March 2014 was as follows:
2015 2014 US$’000 US$’000
Short term borrowings (Note 13) 65,816 115,459Long term borrowings (Note 13) 28,214 1,394Convertible bonds (Note 14) 197,345 –
Total debt 291,375 116,853Total equity 1,900,912 1,766,318
Total capital (equity + debt) 2,192,287 1,883,171
Total debt to capital ratio 13% 6%
The net cash position as of 31 March 2015 and 31 March 2014 was as follows:
Total debt (291,375) (116,853)Cash and deposits (Note 11) 773,172 643,986
Net cash (total debt less cash) 481,797 527,133
Funding requirements for capital expenditure are expected to be met by cash on hand, available credit lines and expected future operating cash flows.

Annual Report 2015
124Johnson Electric Holdings Limited
32. FAIR VALUE ESTIMATION
The fair value of the Group’s assets and liabilities is classified into a 3 levels hierarchy based on measurement according to HKFRS 7 and HKFRS 13 requirements and disclosed as below:
Level 1 : No financial assets and liabilities of the Group are quoted in public markets.
Level 2 : The Group’s level 2 financial assets and liabilities are traded in the market and the fair values are based on bank valuations. The Group’s level 2 investment property is valued on an open market basis.
Level 3 : The Group’s level 3 investment property is not traded actively in the market and the fair values are obtained by appraisals performed by independent, professional qualified valuers. The fair values of the Group’s level 3 financial assets are based on the valuations issued by the investment bank.
The following table presents the Group’s assets and liabilities that are measured at fair value as of 31 March 2015.
Level 1 Level 2 Level 3 Total US$’000 US$’000 US$’000 US$’000
As of 31 March 2015AssetsInvestment property – Residential property and car parks – 681 5,351 6,032 – Industrial property – – 76,003 76,003Other financial assets – Derivatives held for trading – 19 – 19 – Derivatives used for hedging – 275,111 – 275,111 – Others – – 124 124
Total assets – 275,811 81,478 357,289
LiabilitiesOther financial liabilities – Derivatives held for trading – 3 – 3 – Derivatives used for hedging – 86,717 – 86,717
Total liabilities – 86,720 – 86,720

NOTES TO THE ACCOUNTS
125
32. FAIR VALUE ESTIMATION (Cont’d)
The following table presents the Group’s assets and liabilities that are measured at fair value as of 31 March 2014.
Level 1 Level 2 Level 3 Total US$’000 US$’000 US$’000 US$’000
As of 31 March 2014AssetsInvestment property – Residential property and car parks – 732 5,672 6,404 – Industrial property – – 61,967 61,967Other financial assets – Derivatives held for trading – 10 – 10 – Derivatives used for hedging – 40,269 – 40,269 – Others – – 198 198Financial assets at fair value through profit and loss – Unlisted debt securities – 1,085 – 1,085
Total assets – 42,096 67,837 109,933
LiabilitiesOther financial liabilities – Derivatives held for trading – 4 – 4 – Derivatives used for hedging – 61,882 – 61,882
Total liabilities – 61,886 – 61,886
There were no significant transfer of assets between the level 1, level 2 and level 3 fair value hierarchy classifications during the year.
The following summarises the major methods and assumptions used in estimating the fair values of the assets and liabilities classified as level 2 or 3 and the valuation process for assets and liabilities classified as level 3:
(i) Investment propertyLevel 2Fair values of car parks are generally derived using the direct comparison method. This valuation method is based on comparing the property to be valued directly with other comparable properties in close proximity, which have recently transacted. The most significant input into this valuation approach is unit price per parking space.

Annual Report 2015
126Johnson Electric Holdings Limited
32. FAIR VALUE ESTIMATION (Cont’d)
(i) Investment property (Cont’d)
Level 3Fair values of industrial property and residential property are derived using the income capitalisation and market comparison method. Income capitalisation method is based on the capitalisation of the net income and reversionary income potential by adopting appropriate capitalisation rates, which are derived from analysis of sale transactions and valuers’ interpretation of prevailing investor requirements or expectations. The prevailing market rents adopted in the valuation have referenced to valuers’ view of recent lettings, within the subject property and other comparable property. The market comparison method takes into account properties that are similar in nature in the general locality, which have recently transacted, with adjustments made on factors such as size, age, location and condition. The most significant input in this valuation approach is the price per square feet.
Discussion of valuation processes and results are held between the Group’s senior management and valuers to validate the major inputs and validation process.
Significant inputs used to determine the fair value of investment property are as follows:
As of 31 March 2015 As of 31 March 2014 Market rate / Market rate /Property Valuation method rent per month Market yield rent per month Market yield
Industrial Income capitalisation HK$4.2 to 7.4% to 11.0% HK$4.2 to 4.5% to 11.0% HK$7.0/sq.ft HK$9.9/sq.ft
Industrial Market comparison HK$3,545/sq.ft HK$2,590/sq.ftResidential Market comparison HK$18,138/sq.ft HK$19,230/sq.ft
Market rates / rents are estimated based on valuers’ view of recent lettings, within the subject property and other comparable property. The higher the rents, the higher the fair value.
Market yields are estimated by valuers based on the risk profile of the property being valued. The lower the rates, the higher the fair value.
(ii) Other financial assets / liabilitiesThe majority of the Group’s other financial assets / liabilities are classified as level 2. The Group relies on bank valuations to determine the fair value of financial assets / liabilities which in turn are determined using discounted cash flow analysis. These valuations maximise the use of observable market data. Copper price and foreign currency exchange prices are the key observable inputs in the valuation.

NOTES TO THE ACCOUNTS
127
32. FAIR VALUE ESTIMATION (Cont’d)
The following table presents the changes in level 3 instruments for FY2014/15 and FY2013/14:
Investment property Available-for- Residential Industrial Other financial sale property property assets financial assets Total
2015 2014 2015 2014 2015 2014 2015 2014 2015 2014 US$’000 US$’000 US$’000 US$’000 US$’000 US$’000 US$’000 US$’000 US$’000 US$’000
At beginning of the year 5,672 5,410 61,967 55,989 198 – – 1,081 67,837 62,480
Currency translations – – 77 (2) – – – – 77 (2)
Capitalised expenditure – – 2,890 2,523 – – – – 2,890 2,523
Adoption of HKFRS 9 – – – – – 1,081 – (1,081) – –
Transfer to property,
plant and equipment – – – (1,520) – – – – – (1,520)
Disposal – – – – (7) (1,458) – – (7) (1,458)
Fair value gains / (losses)
recorded in income
statement (321) 262 11,069 4,977 (67) 575 – – 10,681 5,814
At end of the year 5,351 5,672 76,003 61,967 124 198 – – 81,478 67,837
Change in unrealised
gains / (losses) for the
year included in
income statement for
assets held at
balance sheet date (321) 262 11,069 4,977 (10) 560 – – 10,738 5,799
Total gains / (losses) for the
year included in income
statement under “Other
income and gains, net” (321) 262 11,069 4,977 (67) 575 – – 10,681 5,814

Annual Report 2015
128Johnson Electric Holdings Limited
33. FINANCIAL INSTRUMENTS BY CATEGORY
According to HKFRS 7 and HKFRS 9, financial assets represent assets with contractual rights to receive cash flows. Financial liabilities represent liabilities with contractual obligations to pay the cash flows to one or more recipients. The financial instruments of the Group are classified into 3 categories disclosed as below:
Financial assets / Financial assets / (liabilities) (liabilities) at amortised cost at fair value Total US$’000 US$’000 US$’000
As of 31 March 2015
Assets as per balance sheet
Other non-current assets 4,785 – 4,785Other financial assets – 275,254 275,254Trade and other receivables excluding prepayments 363,066 – 363,066Cash and deposits 773,172 – 773,172
Total financial assets 1,141,023 275,254 1,416,277
Liabilities as per balance sheet
Other financial liabilities – (86,720) (86,720)Trade payables (206,161) – (206,161)Other payables (66,273) – (66,273)Borrowings (94,030) – (94,030)Convertible bonds (197,345) – (197,345)Finance lease (3,710) – (3,710)
Total financial liabilities (567,519) (86,720) (654,239)
As of 31 March 2014
Assets as per balance sheet
Other non-current assets 2,475 – 2,475Financial assets at fair value through profit and loss – 1,085 1,085Other financial assets – 40,477 40,477Trade and other receivables excluding prepayments 391,138 – 391,138Cash and deposits 643,986 – 643,986
Total financial assets 1,037,599 41,562 1,079,161
Liabilities as per balance sheet
Other financial liabilities – (61,886) (61,886)Trade payables (207,234) – (207,234)Other payables (64,567) – (64,567)Borrowings (116,853) – (116,853)Finance lease (4,618) – (4,618)
Total financial liabilities (393,272) (61,886) (455,158)

NOTES TO THE ACCOUNTS
129
34. PRINCIPAL ACCOUNTING POLICIES
The principal accounting policies applied in the preparation of these consolidated financial statements are set out below. These policies have been consistently applied to all of the years presented, unless otherwise stated. Certain comparative figures have been reclassified to conform with current year presentation.
34.1 ConsolidationThe consolidated financial statements include the financial statements of JEHL and all of its subsidiaries made up to 31 March 2015.
34.2 SubsidiariesSubsidiaries are all entities over which the Group has control. The Group controls an entity when the Group is exposed to, or has rights to, variable returns from its involvement with the entity and has the ability to affect those returns through its power over the entity.
Subsidiaries are fully consolidated from the date on which control is transferred to the Group. They are de-consolidated from the date that control ceases.
The Group applies the acquisition method to account for business combinations. The consideration transferred for the acquisition of a subsidiary is the fair values of the assets and liabilities measured initially at their fair values at the acquisition date and the equity interests issued by the Group. Acquisition-related costs are expensed as incurred. The Group recognises any non-controlling interest in the acquiree on an acquisition-by-acquisition basis either at fair value or at the non-controlling interest’s proportionate share of the recognised amounts of acquiree’s identifiable net assets.
In JEHL’s balance sheet, investments in subsidiaries are accounted for at cost less impairment. Cost is adjusted to reflect changes in consideration arising from contingent consideration amendments. Cost also includes direct attributable costs of investment.
The excess of the consideration transferred, the amount recognised for non-controlling interest and any fair value of the Group’s previously held equity interests in the acquiree over the identifiable net assets acquired is recorded as goodwill. If this is less than the fair value of the net assets acquired, the difference is recognised directly in the income statement.
Inter-company transactions, balances and unrealised gains / losses on transactions between Group companies are eliminated.
When the Group ceases to have control, any retained interest in the entity is remeasured to its fair value at the date when control is lost. Gains and losses arising on disposal is recognised in income statement. In addition, any amounts previously recognised in other comprehensive income in respect of that entity are reclassified to profit and loss.
Annual Report 2015
130Johnson Electric Holdings Limited
34. PRINCIPAL ACCOUNTING POLICIES (Cont’d)
34.3 Foreign currency translation
(a) Functional and presentation currencyItems included in the financial statements of each of the Group’s entities are measured using the currency of the primary economic environment in which the entity operates (“the functional currency”). The consolidated financial statements are presented in US Dollars, which is JEHL’s functional and the Group’s presentation currency.
(b) Transactions and balancesForeign currency transactions are translated into the functional currency using the exchange rates prevailing at the dates of the transactions or valuation where items are re-measured. Foreign exchange gains and losses resulting from the settlement of such transactions and from the translation at year-end exchange rates of monetary assets and liabilities denominated in foreign currencies are recognised in the income statement, except when deferred in equity as qualifying cash flow hedges or qualifying net investment hedges. The foreign exchange gains and losses are recognised within “selling and administrative expenses” in the income statement.
(c) Group companiesThe results and financial position of all the Group entities (none of which has the currency of a hyperinflationary economy) that have a functional currency different from the presentation currency are translated into the presentation currency at the year end closing rate for assets and liabilities and at average exchange rates for the year for the income statement items. All resulting exchange differences are recognised in other comprehensive income. On consolidation, exchange differences arising from the translation of the net investment in foreign entities are taken to other comprehensive income. When a foreign operation is partially disposed of or sold, such exchange differences (that were recorded in equity) are transferred out of the exchange reserve and are recognised in the income statement as part of the gain or loss on disposal.

NOTES TO THE ACCOUNTS
131
34. PRINCIPAL ACCOUNTING POLICIES (Cont’d)
34.3 Foreign currency translation (Cont’d)
(d) Exchange ratesThe following table summarises the exchange rates which are frequently used on the consolidated financial statements.
Average rate
1 unit of foreign Closing rate for the year
currency to USD 2015 2014 2015 2014
Swiss Franc CHF 1.03400 1.12770 1.07690 1.09050Euro EUR 1.08330 1.37520 1.26960 1.34070Hungarian Forint HUF 0.00362 0.00446 0.00411 0.00448Israeli Shekel ILS 0.25176 0.28581 0.27207 0.28114Indian Rupee INR 0.01597 0.01670 0.01636 0.01658Japanese Yen JPY 0.00833 0.00973 0.00914 0.00999Mexican Peso MXN 0.06552 0.07650 0.07309 0.07754Polish Zloty PLN 0.26490 0.32970 0.30320 0.31910Chinese Renminbi RMB 0.16286 0.16108 0.16143 0.16350Serbian Dinar RSD 0.00900 0.01210 0.01090 0.01180
34.4 Property, plant and equipmentProperty, plant and equipment other than investment property (Note 34.5) and leasehold land classified as finance lease are stated at cost less accumulated depreciation and accumulated impairment losses. Freehold land is not amortised. No depreciation is provided for assets under construction.
Subsequent costs are included in the asset’s carrying amount or recognised as a separate asset, as appropriate, only when it is probable that future economic benefits associated with the item will flow to the Group and the cost of the item can be measured reliably.
The assets’ residual values and useful lives are reviewed, and adjusted if appropriate, at the end of each reporting period. An asset’s carrying amount is written down immediately to its estimated recoverable amount if this is lower.
Gains or losses arising from the disposal of property, plant and equipment are determined as the difference between the net disposal proceeds and the carrying amounts of those assets and are recognised within other income and gains, net in the income statement.
The depreciation policy is set out in Note 3.

Annual Report 2015
132Johnson Electric Holdings Limited
34. PRINCIPAL ACCOUNTING POLICIES (Cont’d)
34.5 Investment propertyProperty that is held for long term rental yields or for capital appreciation or both, and that is not occupied by the companies in the Group, is classified as investment property.
Investment property is measured initially at its cost, including related transaction costs. After initial recognition, investment property is carried at fair value. Fair value is based on active market prices, adjusted, if necessary, for any difference in the nature, location or condition of the specific asset. These valuations are reviewed annually determined by external appraisers. Changes in fair values are recognised in the income statement within other income and gains, net.
Subsequent expenditure is charged to the asset’s carrying amount only when it is probable that future economic benefits associated with the item will flow to the Group and the cost of the item can be measured reliably.
If an item of property, plant and equipment becomes an investment property because its use has changed, any difference resulting between the carrying amount and the fair value of this item at the date of transfer is recognised in equity. If a fair value gain reverses a previous impairment loss, the gain is recognised in the income statement. Any balance of the decrease is recognised as an expense in the income statement.
34.6 Intangible assets
(a) GoodwillGoodwill arising on the acquisition of subsidiaries and associates is initially measured at cost and it represents the excess of the cost of acquisition over the net fair value of the Group’s share of the net identifiable assets and the non-controlling interest of the acquired subsidiary. Goodwill on acquisitions of subsidiaries is included in intangible assets.
The policy for impairment tests of goodwill is set out in Note 5.
(b) Land use rightsUp-front prepayments made for land use rights are expensed in the income statement on a straight-line basis over the period of the lease, or, when there is impairment, the impairment is expensed in the income statement.

NOTES TO THE ACCOUNTS
133
34. PRINCIPAL ACCOUNTING POLICIES (Cont’d)
34.6 Intangible assets (Cont’d)
(c) Research and development costsResearch and development costs are expensed as incurred and are only recognised as an intangible asset where the technical feasibility and intention of completing the product under development has been demonstrated and the resources are available to do so, costs are identifiable, can be reliably measured and there is an ability to sell or use the asset that will generate probable future economic benefits. Research and development costs that do not meet the above criteria are expensed as incurred.
(d) Other Intangible assetsPatents, technology, brands, client relationships that are acquired by the Group are stated in the balance sheet at fair value at the date of acquisition less accumulated amortisation and impairment losses.
The policy for amortisation of intangible assets is set out in Note 5.
34.7 Impairment of investments in subsidiaries, associate and non-financial assetsAssets that have an indefinite useful life (e.g. goodwill) are not subject to amortisation but are tested annually for impairment. Assets are reviewed for impairment whenever events or changes in circumstances indicate that the carrying amount may not be recoverable. An impairment loss is recognised for the amount by which the asset’s carrying amount exceeds its recoverable amount (the higher of an asset’s fair value less costs to sell and the value in use). For the purpose of assessing impairment, assets are grouped at the lowest levels for which there are separately identifiable cash flows (cash-generating units). Non-financial assets other than goodwill that suffered an impairment are reviewed for possible reversal of the impairment at each reporting date.
Impairment testing of investments in subsidiaries or associate is required if the carrying amount of the investment exceeds the carrying amount of the investee’s net assets including goodwill.

Annual Report 2015
134Johnson Electric Holdings Limited
34. PRINCIPAL ACCOUNTING POLICIES (Cont’d)
34.8 Financial assets
The Group’s financial assets only comprise debt instruments, and it classifies its financial assets (not part of a hedging relationship) in the following categories: those to be measured at amortised cost, and those to be measured subsequently at fair value.
(a) Financial assets at amortised costA financial asset is classified as measured at ‘amortised cost’ only if both of the following criteria are met: the objective is to hold the asset to collect the contractual cash flows; and the contractual terms give rise on specified dates to cash flows that are solely payments of principal and interest on the principal outstanding. A gain or loss is recognised in profit and loss when the financial asset is derecognised or impaired and through the amortisation process using the effective interest rate method.
(b) Financial assets at fair valueIf either of the two criteria above are not met, a financial asset is classified as measured at ‘fair value through profit and loss’. The subsequent unrealised and realised fair value changes are recognised in profit and loss.
At initial recognition, the Group measures a financial asset at its fair value plus, in the case of a financial asset not at fair value through profit or loss, transaction costs that are directly attributable to the acquisition of the financial assets. Transaction costs of financial assets carried at fair value through profit or loss are expensed in the income statement.
34.9 Other financial assets and liabilities
(a) Other financial assets and liabilities related to hedging activities
Other financial assets and liabilities are forward and swap contracts related to hedging activities.
Hedging instruments are initially recognised at fair value on the date a contract is entered into and are subsequently remeasured at their fair value. The method of recognising the resulting gain or loss depends on the nature of the item being hedged:
• Hedges of a particular risk associated with a recognised asset or liability or a highly probable forecast transaction (cash flow hedge); or
• Hedges of a net investment in a foreign operation (net investment hedge).

NOTES TO THE ACCOUNTS
135
34. PRINCIPAL ACCOUNTING POLICIES (Cont’d)
34.9 Other financial assets and liabilities (Cont’d)
(a) Other financial assets and liabilities related to hedging activities (Cont’d)
The Group documents, at the inception of the transaction, the relationship between hedging instruments and hedged items, as well as its risk management objectives and strategy for undertaking various hedge transactions. The Group also documents its assessment, both at hedge inception and on an ongoing basis, of whether the hedging instruments that are used in hedging transactions are highly effective in offsetting changes in fair values or cash flows of hedged items.
(i) Cash flow hedgeA cash flow hedge of the Group hedges a particular risk associated with a highly probable forecast transaction. The effective portion of changes in the fair value of financial instruments designated as cash flow hedges are recognised in other comprehensive income. Amounts accumulated in equity will be recognised in the income statement in the period or periods in which the underlying hedged transaction occurred.
When a hedging instrument expires or is sold, or when a hedge no longer meets the criteria for hedge accounting, any cumulative gain or loss existing in equity at that time remains in equity and is recognised when the forecast transaction is ultimately recognised in the income statement. When a forecast transaction is no longer expected to occur, the cumulative gain or loss that was reported in equity is immediately transferred to the income statement within other income and gains, net.
(ii) Net investment hedgeA net investment hedge of the Group hedges net investments in foreign operations. Any unrealised and realised gain or loss of the hedging instrument is recognised in other comprehensive income within exchange reserve.
Gains and losses accumulated in equity are recycled to income statement when the foreign operation is partially disposed of or sold.
(b) Financial instruments held for trading that do not qualify for hedge accountingFinancial instruments designated as held for trading do not qualify for hedge accounting and are accounted for at fair value through profit and loss. Changes in the fair value of these financial instruments are recognised immediately in the income statement within other income and gains, net.

Annual Report 2015
136Johnson Electric Holdings Limited
34. PRINCIPAL ACCOUNTING POLICIES (Cont’d)
34.9 Other financial assets and liabilities (Cont’d)
The fair values of various financial instruments used for hedging purposes are disclosed in Note 7. Movements in the hedging reserve in shareholders’ equity are shown in Note 18. The full fair value of a hedging financial instrument is classified as a non-current asset or liability when the remaining maturity of the hedge item is more than 12 months, and is classified as a current asset or liability when the remaining maturing of the hedge item is less than 12 months.
The effectiveness test has been overhauled and replaced with the assessment of economic relationship between hedging instruments and hedge items, appropriateness of hedge ratio and effect of credit risks. Retrospective assessment of hedge effectiveness is also no longer required. Enhanced disclosure requirements about an entity’s risk management activities have also been introduced.
34.10 InventoriesInventories are stated at the lower of cost and net realisable value. Cost, calculated on a first-in-first-out basis, comprises materials, direct labour and an appropriate proportion of all production overhead expenditure. The value calculated approximates the weighted- average actual cost. Net realisable value is the estimated selling price in the ordinary course of business, less applicable variable selling expenses.
34.11 Trade and other receivablesTrade and other receivables are recognised initially at fair value and subsequently measured at amortised cost using the effective interest method, less provision for impairment. A provision for impairment of trade and other receivables is established when there is objective evidence that the Group will not be able to collect all amounts dues according to the original terms of receivables; that is, the difference between the asset’s carrying amount and the present value of the estimated future cash flows, discounted at the original effective interest rate. The impairment charge is recognised within “selling and administrative expenses” in the income statement. When a trade receivable is uncollectible, it is written off against the allowance account for trade receivables. Subsequent recoveries are credited in the income statement.
34.12 Non-current assets held for saleNon-current assets are classified as assets held for sale when their carrying amounts are to be recovered principally through a sale transaction and a sale is considered highly probable. They are stated at the lower of carrying amount and fair value less costs of disposal.

NOTES TO THE ACCOUNTS
137
34. PRINCIPAL ACCOUNTING POLICIES (Cont’d)
34.13 Cash and depositsCash and deposits comprise cash on hand and demand deposits with banks that are readily convertible into known amounts of cash and which are subject to an insignificant risk of change in value, and with original maturities of three months or less.
34.14 Trade and other payablesTrade and other payables are recognised initially at fair value and subsequently measured at amortised cost using the effective interest method.
34.15 BorrowingsBorrowings are initially recognised at fair value, net of transaction costs incurred and are subsequently stated at amortised cost. Any difference between the proceeds (net of transaction costs) and the redemption value is recognised in the income statement over the period of the borrowings using the effective interest method.
Borrowings are classified as current liabilities unless the Group has an unconditional right to defer settlement of the liability for at least twelve months after the end of reporting period.
34.16 Convertible bondsConvertible bonds are accounted for as the aggregate of (i) a liability component and (ii) an equity component.
At initial recognition, the fair value of the liability component of the convertible bonds is determined using a market interest rate for an equivalent non-convertible bond. The remainder of the proceeds is allocated to the conversion option as an equity component, recognised in shareholder’s equity in other reserve.
The liability component is subsequently carried at amortised cost, calculated using the effective interest method, until extinguished on conversion or maturity.
34.17 Current and deferred income taxThe tax expense for the period comprises current and deferred tax. Tax is recognised in the income statement, except to the extent that it relates to items recognised in comprehensive income or directly in equity. In this case, the tax is also recognised in comprehensive income or directly in equity.

Annual Report 2015
138Johnson Electric Holdings Limited
34. PRINCIPAL ACCOUNTING POLICIES (Cont’d)
34.17 Current and deferred income tax (Cont’d)
The current income tax charge is calculated on the basis of the tax laws enacted or substantively enacted at the balance sheet date in the countries where JEHL’s subsidiaries and associate operate and generate taxable income. Management periodically evaluates positions taken in tax returns with respect to situations in which applicable tax regulation is subject to interpretation and establishes accruals where appropriate on the basis of amounts expected to be paid to the tax authorities.
Deferred income tax is recognised, using the liability method, on temporary differences arising between the tax bases of assets and liabilities and their carrying amounts in the consolidated financial statements. However, the deferred income tax is not accounted for if it arises from the initial recognition of an asset or liability in a transaction other than a business combination that at the time of the transaction affects neither accounting nor taxable profit and loss at the time of such a transaction. Deferred income tax is determined using tax rates enacted or substantively enacted by the balance sheet date or expected to be applied in future.
Deferred income tax assets are recognised only to the extent that it is probable that future taxable profit will be available against which the temporary differences can be utilised.
Deferred income tax liability is recognised in respect of the undistributed profits of subsidiaries which is expected to be distributed in the foreseeable future.
The policy for offsetting deferred income tax assets and liabilities is set out in Note 16.
34.18 Share capitalOrdinary shares are classified as equity. Incremental costs directly attributable to the issue of new shares or options are shown in equity as a deduction, net of tax, from the proceeds.
Where any Group company purchases JEHL’s equity share capital, the consideration paid, including any directly attributable incremental costs (net of income taxes), is deducted from equity until the shares are vested, cancelled or reissued. Where such shares are subsequently sold or reissued, any consideration received (net of any directly attributable incremental transaction costs and the related income tax effects) is included in equity attributable to JEHL’s shareholders.

NOTES TO THE ACCOUNTS
139
34. PRINCIPAL ACCOUNTING POLICIES (Cont’d)
34.19 Employee compensation
(a) Pension obligationsGroup companies operate various pension schemes. The schemes are generally funded through payments to insurance companies or trustee-administered funds, determined by periodic actuarial calculations. The Group has both defined contribution and defined benefit plans.
(i) Defined contribution planFor defined contribution plans, the Group and the employees pay fixed contributions to publicly or privately administered pension insurance plans on a mandatory, contractual or voluntary basis. The Group has no further payment obligations once the contributions have been paid. Contributions are recognised as employee compensation when they are due and are reduced by contributions forfeited by those employees who leave the scheme prior to vesting fully in the contributions.
(ii) Defined benefit planDefined benefit plans define an amount of pension benefit that an employee will receive on retirement, usually dependent on one or more factors such as age, years of service and compensation.
The liability recognised in the balance sheet in respect of defined benefit pension plans is the present value of the defined benefit obligation at the end of the reporting period less the fair value of plan assets. The defined benefit obligation is calculated annually by independent actuaries using the projected unit credit method by discounting the estimated future cash outflows using interest rates of high-quality corporate bonds that are denominated in the currency in which the benefits will be paid and that have terms to maturity approximating to the terms of the related pension liability.
Actuarial gains and losses arising from experience adjustments and changes in actuarial assumptions are charged or credited to equity in other comprehensive income in the period in which they arise.
Past-service costs are recognised immediately in the income statement.

Annual Report 2015
140Johnson Electric Holdings Limited
34. PRINCIPAL ACCOUNTING POLICIES (Cont’d)
34.19 Employee compensation (Cont’d)
(b) Share-based compensationThe Group operates a number of share-based compensation plans, settled by equity or cash, under which the entity receives services from employees as consideration for equity instruments of the Group. The fair value of such employee services is recognised as an expense. The total amount to be expensed is determined by reference to the fair value of the shares granted.
For share-based compensation settled by equity or cash, shares granted to eligible employees for their services are charged as an expense based on the share price at the grant date.
Non-market vesting conditions are included in assumptions about the number of shares expected to vest. The total expense is recognised over the vesting period, which is the period over which all of the specified vesting conditions are to be satisfied. At the end of each reporting period, the entity revises its estimates of the number of shares that are expected to vest. Any impact of the revision to original estimates are recognised in the income statement, with a corresponding adjustment to equity.
(c) Profit sharing and bonus plansThe Group recognises charges for profit sharing and bonus plans due wholly within twelve months after balance sheet date when it has a legal or constructive obligation as a result of services rendered by employees and a reliable estimate of the obligation can be made.
34.20 Judgmental accruals, valuation allowances and provision obligationsJudgmental accruals, valuation allowances and provision obligations are recognised when the company has a present legal or constructive obligation as a result of past events, it is probable that an outflow of resources will be required to settle the obligation, and a reliable estimate of the amount can be made.

NOTES TO THE ACCOUNTS
141
34. PRINCIPAL ACCOUNTING POLICIES (Cont’d)
34.21 Government grantsGrants from the government are recognised at their fair value where there is a reasonable assurance that the grant will be received and the Group will comply with all attached conditions.
Government grants relating to future operating costs are recognised in the income statement over the period necessary to match them with the costs that they are intended to compensate. Government grants that are receivable as compensation for expenses or losses already incurred or for the purpose of giving immediate financial support to the Group with no future related costs are recognised in income statement in the period in which they become receivable.
Government grants relating to assets are included in liabilities as deferred government grants and are credited to the income statement on a straight–line basis over the expected lives of the related assets.
34.22 Revenue recognitionRevenue is shown net of valued-added tax, returns, rebates and discounts and after eliminating sales within the Group.
(a) Sales of goodsRevenue from the sales of goods is recognised on the transfer of risks and rewards of ownership, which generally coincides with the time when the goods are delivered to the customer and title has passed.
(b) Interest incomeInterest income is recognised when it is earned on a time-proportion basis using the effective interest method.
(c) Rental incomeRental income is recognised on a straight-line basis over the period of the lease.

Annual Report 2015
142Johnson Electric Holdings Limited
34. PRINCIPAL ACCOUNTING POLICIES (Cont’d)
34.23 LeasesHKAS 17 defines a lease as being an agreement whereby the lessor conveys to the lessee in return for a payment, or series of payments, the right to use an asset for an agreed period of time.
(a) Finance leases as the lesseeThe Group leases certain property, plant and equipment. Leases of property, plant and equipment where the Group has substantially all the risks and rewards of ownership are classified as finance leases. Finance leases are capitalised at the lease’s commencement at the lower of the fair value of the leased property and the present value of the minimum lease payments.
Each lease payment is allocated between interest charged to the financial statement and reduction of liabilities based on the interest rate implied in the lease contracts. The corresponding rental obligations, net of finance charges, are included in other short term and other long term payables. The property, plant and equipment acquired under finance leases is depreciated over the shorter of the useful life of the asset and the lease term.
(b) Operating leases as the lesseeLeases where substantially all the risks and rewards of ownership of assets remain with the leasing company are accounted for as operating leases. Payments made under operating leases, net of any incentives from the leasing company, are recognised in the income statement on a straight-line basis over the lease term.
34.24 Dividend distributionDividend distribution to JEHL’s shareholders is recognised as a liability in the Group’s and JEHL’s financial statements in the period in which the dividends are approved by JEHL’s shareholders or directors, where appropriate.
34.25 Contingent liabilitiesA contingent liability is a possible obligation that arises from past events and whose existence will only be confirmed by the occurrence or non-occurrence of one or more uncertain future events not wholly within the control of the company. It can also be a present obligation arising from past events that is not recognised because it is not probable that outflow of economic resources will be required or the amount of obligation cannot be measured reliably. A contingent liability is not recognised but is disclosed in the notes to the accounts. When a change in the probability of an outflow occurs so that the outflow is probable (more likely than not), it will then be recognised as a liability on the balance sheet.

NOTES TO THE ACCOUNTS
143
34. PRINCIPAL ACCOUNTING POLICIES (Cont’d)
34.26 Financial guarantee contractsA financial guarantee is a contract that requires the issuer to make specified payments to reimburse the holder for a loss it incurs because a specified customer fails to make payments when due in accordance with the original or modified terms of a debt instrument. The Group does not recognise liabilities for financial guarantees at inception, but performs a liability adequacy test at each reporting date by comparing its carrying amount of the net liability regarding the financial guarantee with its present legal or constructive obligation amount. If the carrying amount of the net liability is less than its present legal or constructive obligation amount, the entire difference is recognised in the income statement immediately.
35. ACCOUNTING ESTIMATES AND JUDGEMENTS
Estimates and judgements are continually evaluated and are made based on historical experience and other factors, including expectations of future events that are believed to be reasonable under the circumstances.
The Group makes estimates and assumptions concerning the future. The resulting accounting estimates will, by definition, seldom equal the related actual results. The estimates and assumptions that have a risk of causing a material adjustment to the carrying amounts of assets and liabilities within the next financial year are addressed below.
(a) Assessment of goodwill impairmentThe Group tests annually whether goodwill has suffered any impairment, in accordance with the accounting policy stated in Note 5. The recoverable amounts of cash-generating units have been determined based on value-in-use calculations. These calculations require the use of estimates (Note 5).
(b) Income taxesThe Group is subject to income taxes in numerous jurisdictions. Significant judgement is required in determining the worldwide provision for income taxes. There are many transactions and calculations for which the ultimate tax determination is uncertain. The Group recognises liabilities for anticipated tax audit issues when management assesses that it is probable such issues will impact the current and deferred income tax assets and liabilities.

Annual Report 2015
144Johnson Electric Holdings Limited
35. ACCOUNTING ESTIMATES AND JUDGEMENTS (Cont’d)
(c) Warranty and claimsThe Group generally offers warranties for its motors and other products. Consequently, management uses historical warranty claims experience as well as recent trends to determine the need for warranty liability. On specific claims brought against the Group by customers, a provision is made based on the consideration of the merits of a warranty claim against the Group, the existence of any obligation under the warranty commitment and legal advice if appropriate.
(d) Useful lives and impairment of property, plant and equipment and other intangible assetsThe Group’s management determine the estimated useful lives, residual values and related depreciation and amortisation charges for property, plant and equipment and other intangible assets by reference to the estimated periods that the Group intends to derive future economic benefits from the use of these assets. Management will revise the depreciation and amortisation charges where useful lives are different to those previously estimated, or it will write-off or write-down technically obsolete or non-strategic assets that have been abandoned or sold. Actual economic lives may differ from estimated useful lives and actual residual values may differ from estimated residual values. Periodic reviews could result in a change in depreciable lives and residual values and therefore depreciation and amortisation expense in the future periods.
The Group reviews tangible and intangible assets for impairment whenever events or changes in circumstances indicate that the related carrying amounts may not be recovered. Assessing the impairment loss requires a determination of fair value which is based on the best estimates and information available.
(e) Fair value of other financial assets / liabilitiesThe fair value of other financial assets / liabilities is determined using various valuation techniques such as discounted cash flow analysis. Copper, silver and aluminium prices and foreign currency exchange price are the key inputs in the valuation.
(f) Fair value of investment propertyThe Group’s investment property is revalued at the balance sheet date on the open market value basis by independent professional valuers. Such valuations are based on certain assumptions, which are subject to uncertainty and might materially differ from the actual results. In making the judgement on whether such valuations and assumptions made by the valuers are reasonable, the Group considers information from comparable current prices in an active market for similar property, capitalisation rates, terminal yield, rental income from current leases and assumptions about rental from future leases and the reversionary income potential and uses assumptions that are mainly based on market conditions existing at each balance sheet date. The main assumptions have been disclosed in Note 32.

NOTES TO THE ACCOUNTS
145
36. EFFECT OF ADOPTING NEW, REVISED AND AMENDED HKFRS
Standards, interpretations and amendments to published standards effective in FY2014/15 which are relevant to the GroupIn FY2014/15, the Group adopted the following new, revised and amended standards of HKFRS below, which are relevant to its operations and have an impact on the consolidated financial statements:
HKAS 32 (amendment) Financial instruments: presentation – offsetting financial assets and financial liabilities
HK (IFRIC) – Int 21 Levies
Annual improvement 2012 Annual improvements 2010-2012 reporting cycle
The adoption of such new, revised and amended standards did not have material impact on the consolidated financial statements except as described below:
HKAS 32 (amendment), “Financial instruments: presentation – offsetting financial assets and financial liabilities”These amendments are to the application guidance in HKAS 32, ‘Financial instruments: Presentation’, and clarify some of the requirements for offsetting financial assets andfinancial liabilities on the balance sheet.
HK (IFRIC) – Int 21, “Levies”This is an interpretation of HKAS 37, ‘Provisions, contingent liabilities and contingent assets’. HKAS 37 sets out criteria for the recognition of a liability, one of which is the requirement for the entity to have a present obligation as a result of a past event (known as an obligating event). The interpretation clarifies that the obligating event that gives rise to a liability to pay a levy is the activity described in the relevant legislation that triggers the payment of the levy.

Annual Report 2015
146Johnson Electric Holdings Limited
36. EFFECT OF ADOPTING NEW, REVISED AND AMENDED HKFRS (Cont’d)
Standard adopted early by the GroupThe Group has adopted early the revised standard of HKFRS below, which is relevant to its operations.
HKFRS 9 Financial instruments (Hedging accounting and amendments to HKFRS 9, HKFRS 7 and HKAS 39)
HKFRS 9 “Financial instruments (Hedge accounting and amendments to HKFRS 9, HKFRS 7 and HKAS 39)” applies to all hedging relationships, with the exception of portfolio fair value hedges of interest rate risk. The new guidance better aligns hedge accounting with the risk management activities of an entity and provides relief from the more “rule-based” approach of HKAS 39.
Greater flexibility has been introduced to the types of transactions eligible for hedge accounting, specifically broadening the types of instruments that qualify for hedging instruments and the types of risk components of non-financial items that are eligible for hedge accounting.
In addition, a component of an item can be designated as the hedged item in a hedging relationship provided that, based on an assessment within the context of the particular market structure, the risk component is separately identifiable and reliably measured.
In accordance with the transitional provision for hedge accounting of HKFRS 9, the Group is only required to prospectively apply the new requirements for hedge accounting under HKFRS 9, except for certain limited exception, from the date of initial application on 1 April 2014. At initial application, hedging relationships that qualified for hedge accounting in accordance with Hong Kong Accounting Standard 39 “Financial instruments: Recognition and Measurement” that also qualify for hedge accounting in accordance with the criteria of the new requirements after taking into account any rebalancing of the hedging relationship on transition were regarded as continuing hedging relationships.
The Group has applied hedge accounting under revised HKFRS 9 prospectively for hedging relationships designated during the current year in accordance with the new requirements for hedge accounting under HKFRS 9.
The early application of these new requirements for hedge accounting under HKFRS 9 has had no material impact on the results and financial position of the Group for the current and prior years.
HKFRS 9 as issued in September 2014 supersedes this standard. An entity shall apply HKFRS 9 as issued in September 2014 for annual periods beginning on or after 1 January 2018. Early application is permitted.

NOTES TO THE ACCOUNTS
147
36. EFFECT OF ADOPTING NEW, REVISED AND AMENDED HKFRS (Cont’d)
Standards and amendments to published standards that are not effective in FY2014/15Certain new standards and amendments to existing standards have been published that are mandatory for the Group’s accounting periods beginning on or after 1 April 2015 or later periods, which the Group has not early adopted, are as follows:
HKAS 1 (amendment) Presentation of financial statement – Disclosure initiative 2
HKAS 16 (amendment) and Clarification of acceptable methods of depreciation HKAS 38 (amendment) and amortisation 2
HKAS 16 (amendment) and Agriculture: Bearer plants 2
HKAS 41 (amendment)
HKAS 27 (amendment) Separate financial statements – Equity method in separate financial statements 2
HKFRS 9 Financial instruments 4
HKFRS 10 (amendment) and Sale or contribution of assets between an investor HKAS 28 (amendment) and its associate or joint venture 2
HKFRS 10 (amendment), Investment entities: applying the consolidation HKFRS 12 (amendment) exception 2
and HKAS 28 (amendment)
HKFRS 11 (amendment) Accounting for acquisitions of interests in joint operations 2
HKFRS 14 Regulatory deferral accounts 2
HKFRS 15 Revenue from contracts with customer 3
Annual improvements 2012 Annual improvements 2010-2012 reporting cycle 1
Annual improvements 2013 Annual improvements 2011-2013 reporting cycle 1
Annual improvements 2014 Annual improvements 2012-2014 reporting cycle 2
Note:(1) Effective for annual periods beginning on or after 1 July 2014(2) Effective for annual periods beginning on or after 1 January 2016(3) Effective for annual periods beginning on or after 1 January 2017(4) Effective for annual periods beginning on or after 1 January 2018, except for the 2010 version of HKFRS 9 and the new
requirements for hedge accounting issued in 2013, which the Group early adopted.
The Group is in the process of making an assessment of the impact of these amendments, new standards and new interpretations in the period of initial application. In addition to the above, there are a number of minor amendments to HKAS / HKFRS under the annual improvement project of HKICPA. These amendments are not likely to have a significant impact on the Group’s financial statements and are not analysed in detail.

Annual Report 2015
148Johnson Electric Holdings Limited
37. NOTES TO JEHL BALANCE SHEET37.1 Reserves
The reserve movements of JEHL for FY2014/15 and FY2013/14 are set below:
Share- ‐based employee Contributed compensation Exchange Hedging Other Retained surplus reserve reserve reserve reserve earnings Total US$’000 US$’000 US$’000 US$’000 US$’000 US$’000 US$’000
As of 31 March 2013 95,273 5,859 – 4,706 (380) 1,383,692 1,489,150Available-for-sale financial assets – adoption of HKFRS 9 – – – – 380 (380) –Hedging instruments – Net investment hedge fair value losses, net – – – (12,362) – – (12,362)Long-Term Incentive Share Scheme – shares vested (Note 17) – (2,685) – – – – (2,685) – value of employee services (Note 27) – 5,799 – – – – 5,799 – transfer from cash settled shared-based unit –‐ 1,771 – – – – 1,771Share options – options lapsed –‐ (274) – – – 274 –Profit for the year – – – – – 156,417 156,417FY2012/13 final dividend paid – – – – – (36,664) (36,664)FY2013/14 interim dividend paid – – – – – (13,738) (13,738)
As of 31 March 2014 95,273 10,470 – (7,656) – 1,489,601 1,587,688
Final dividend proposed (Note 25) – – – – – 38,910 38,910Other 95,273 10,470 – (7,656) – 1,450,691 1,548,778
As of 31 March 2014 95,273 10,470 – (7,656) – 1,489,601 1,587,688
Hedging instruments – Net investment hedge fair value gains, net – – 54,037 7,656 – – 61,693Convertible bonds – equity component of convertible bonds issued (Note 14) – – – – 4,823 – 4,823 – deferred income tax effect (Note 16) – – – – (3,868) – (3,868)Cancellation of issued capital (Note 17) (30,926) – – – – – (30,926)Long-Term Incentive Share Scheme – shares vested (Note 17) – (3,889) – – – – (3,889) – value of employee services (Note 27) – 7,413 – – – – 7,413Share options – options lapsed – (68) – – – 68 –Profit for the year – – – – – 131,384 131,384FY2013/14 final dividend paid – – – – – (38,765) (38,765)FY2014/15 interim dividend paid – – – – – (15,522) (15,522)
As of 31 March 2015 64,347 13,926 54,037 – 955 1,566,766 1,700,031
Final dividend proposed (Note 25) – – – – – 37,768 37,768Other 64,347 13,926 54,037 – 955 1,528,998 1,662,263
As of 31 March 2015 64,347 13,926 54,037 – 955 1,566,766 1,700,031
The US$131.4 million profit attributable to shareholders for the year (FY2013/14: US$156.4 million) is dealt with in the financial statements of JEHL.

NOTES TO THE ACCOUNTS
149
37. NOTES TO JEHL BALANCE SHEET (Cont’d)
37.2 SubsidiariesThe details of subsidiaries of JEHL are set below:
2015 2014 US$’000 US$’000
Unlisted investments, at cost 983,148 983,147Amounts due from subsidiaries – non-current portion (a) 13,249 14,491
996,397 997,638
Amounts due from subsidiaries – current portion (b) 799,222 613,132Amounts due to subsidiaries – current portion (b) (1) (58)
799,221 613,074
1,795,618 1,610,712
(a) The amount is unsecured, interest-free and is not repayable in the foreseeable future.
(b) The amounts are unsecured, interest-free and repayable on demand (31 March 2014: US$6.6 million was unsecured,
interest bearing at 3% per annum and the remaining was unsecured and interest-free. Total balance was repayable on
demand).
Details of principal subsidiaries are shown in Note 38.
37.3 Other financial assets and liabilities
Assets Liabilities
2015 2014 2015 2014 US$’000 US$’000 US$’000 US$’000
Net investment hedge contracts – forward foreign currency exchange contracts to hedge European subsidiaries 48,616 8 – 7,693 – cross currency interest rate swap 1,541 – – –
Others 124 198 – –
Total 50,281 206 – 7,693
Current portion 10,349 5 – 1,071Non-current portion 39,932 201 – 6,622
Total 50,281 206 – 7,693

Annual Report 2015
150Johnson Electric Holdings Limited
37. NOTES TO JEHL BALANCE SHEET (Cont’d)
37.4 Cash and depositAs of 31 March 2015, JEHL had US$36,715 cash at bank and in hand (31 March 2014: US$53,565 cash at bank and in hand).
37.5 Other receivable and other payablesThe fair value of JEHL’s other receivable and other payables was approximately equal to the carrying value.
37.6 Liquidity risksThe table below analyses JEHL’s borrowings and other financial assets / liabilities into relevant maturity groupings based on the remaining period at the balance sheet date to the contractual maturity date:
Less than Over 1 year 1 – 2 years 2 – 5 years 5 years US$’000 US$’000 US$’000 US$’000
As of 31 March 2015Convertible bonds 2,000 2,000 223,620 –Other financial assets and liabilities – Net investment hedge – Gross settled: – inflow (52,034) (52,822) (159,649) (76,898) – outflow 41,165 41,165 120,246 73,649Other payables 1,152 – – –Amounts due to subsidiaries 1 – – –Financial guarantee contracts 92,932 – – –
As of 31 March 2014Other financial assets and liabilities – Net investment hedge – Gross settled: – inflow (51,289) (51,401) (156,440) (50,969) – outflow 52,258 52,258 156,773 48,132Other payables 85 – – –Amounts due to subsidiaries 58 – – –Financial guarantee contracts 114,986 – – –

NOTES TO THE ACCOUNTS
151
37. NOTES TO JEHL BALANCE SHEET (Cont’d)
37.7 Fair value estimationThe following table presents JEHL’s assets and liabilities that are measured at fair value as of 31 March 2015 and 31 March 2014.
Level 1 Level 2 Level 3 Total US$’000 US$’000 US$’000 US$’000
As of 31 March 2015AssetsOther financial assets – Derivatives used for hedging – 50,157 – 50,157 – Others – – 124 124
Total assets – 50,157 124 50,281
Level 1 Level 2 Level 3 Total US$’000 US$’000 US$’000 US$’000
As of 31 March 2014AssetsOther financial assets – Derivatives used for hedging - ‐ 8 - ‐ 8 – Others - ‐ - ‐ 198 198
Total assets - ‐ 8 198 206
LiabilitiesOther financial liabilities – Derivatives used for hedging - ‐ 7,693 - ‐ 7,693
Total liabilities - ‐ 7,693 - ‐ 7,693

Annual Report 2015
152Johnson Electric Holdings Limited
38. PRINCIPAL SUBSIDIARIES AND ASSOCIATE
The following list contains particulars of subsidiaries and associate of the Group that in the opinion of the directors, materially affect the results and assets of the Group:
Place of Effective incorporation / shareholding establishment Issued and by byName Principal activities and operation paid up capital JEHL subsidiary
Subsidiaries
Changchun Ri Yong – Manufacturing, China RMB10,000,000 – 60% JEA Gate Electric Co., sales and marketing Ltd. #
Chengdu Ri Yong – JEA Manufacturing, China RMB20,000,000 – 60% Gate Electric Co Ltd # sales and marketing
Easy Fortune (H.K.) Ltd. Property holding British Virgin 50,000 shares of – 100% Islands US$1 each
Gate do Brasil Ltda. Manufacturing, Brazil BRL35,547,848.56 – 100% sales and marketing
Gate France SAS Manufacturing, France EUR382,000 – 100% sales and marketing
Harbour Sky (BVI) Ltd. Property holding British Virgin 50,000 shares of – 100% Islands US$1 each
Hwa Sun (Guangdong) Manufacturing, China US$8,000,000 – 100% Co Ltd * sales and marketing
Johnson Electric Manufacturing, sales Italy EUR2,600,000 – 100% Asti S.r.l. and marketing, R&D, licensing
Johnson Electric Manufacturing, sales China US$12,000,000 – 100% (Beihai) Co Ltd * and marketing
Johnson Electric Doo Manufacturing Serbia RSD165,359,608.42 – 100% Nis
Johnson Electric Manufacturing, sales Germany EUR15,338,800 – 100% Germany GmbH & and marketing, Co. KG R&D, licensing
* Wholly foreign owned enterprises# Equity joint ventures

NOTES TO THE ACCOUNTS
153
38. PRINCIPAL SUBSIDIARIES AND ASSOCIATE (Cont’d)
Place of Effective incorporation / shareholding establishment Issued and by byName Principal activities and operation paid up capital JEHL subsidiary
Subsidiaries
Johnson Electric Manufacturing, sales China US$4,250,000 – 100% (Guangdong) Co., Ltd. * and marketing, R&D
Johnson Electric Manufacturing Mexico MXN3,000 – 100% Group Mexico, S. de R.L. de C.V.
Johnson Electric Manufacturing, R&D Hungary EUR160,130 – 100% Hungary Kft
Johnson Electric Manufacturing, Hong Kong HK$154,000,000 100% – Industrial Manufactory, sales and marketing Limited
Johnson Electric Sales and marketing, Switzerland 643,200 shares of – 100% International AG R&D, provision of CHF18.66 each service, licensing
Johnson Electric Sales and marketing France 6,250 shares of – 100% International France EUR16 each Sarl
Johnson Electric Sales and marketing Italy EUR3,700,000 – 100% International (IT) S.r.l.
Johnson Electric Provision of service Hong Kong HK$80,000,000 – 100% International Limited
Johnson Electric Licensing, sales and United Kingdom 17,203,145 shares – 100% International (UK) Limited marketing, R&D of GBP1 each
Johnson Electric Manufacturing, sales China US$6,100,000 – 100% Nanjing Co., Ltd. * and marketing, R&D
Johnson Electric North Sales and marketing United States 12 shares without – 100% America, Inc. of America par value issued at US$120,000
* Wholly foreign owned enterprises# Equity joint ventures

Annual Report 2015
154Johnson Electric Holdings Limited
38. PRINCIPAL SUBSIDIARIES AND ASSOCIATE (Cont’d)
Place of Effective incorporation / shareholding establishment Issued and by byName Principal activities and operation paid up capital JEHL subsidiary
Subsidiaries
Johnson Electric Manufacturing Poland 49,554 shares of – 100% Poland Sp.zo.o. PLN500 each
Johnson Electric Manufacturing, India INR1,044,096,500 – 100% Private Limited sales and marketing
Johnson Electric Provision of service Italy EUR10,000 – 100% Services Italia S.r.l.
Johnson Electric Provision of service Mexico MXN3,000 – 100% Services Mexico, S. de R.L. de C.V.
Johnson Electric Sales and marketing China US$200,000 – 100% (Shanghai) Company Limited *
Johnson Electric R&D China HK$30,000,000 – 100% (Shenzhen) Co., Ltd. *
Johnson Electric Manufacturing and Switzerland 5,000 shares of – 100% Switzerland AG R&D CHF1,000 each
Johnson Electric Provision of service China US$130,000 – 100% Technology Service (Shenzhen) Co Ltd *
Johnson Electric Sales and marketing Mexico MXN3,000 – 100% Trading Mexico, S. de R.L. de C.V.
Johnson Electric World Sales and marketing Hong Kong HK$100,000 100% – Trade Limited
Johnson Medtech Sales and marketing, Hong Kong HK$1 – 100% (HK) Limited R&D
M.M.A. (Manufactura Manufacturing, Argentina 388,000 shares of – 100% de Motores sales and marketing 10 Pesos each Argentinos) S.r.l.
* Wholly foreign owned enterprises# Equity joint ventures

NOTES TO THE ACCOUNTS
155
38. PRINCIPAL SUBSIDIARIES AND ASSOCIATE (Cont’d)
Place of Effective incorporation / shareholding establishment Issued and by byName Principal activities and operation paid up capital JEHL subsidiary
Subsidiaries
Nanomotion Ltd. Manufacturing, sales Israel 18,669,985 shares – 100% and marketing, R&D of ILS0.01 each
Parlex Pacific Limited Manufacturing, sales Hong Kong HK$10,000 – 100% and marketing, R&D
Parlex (Shanghai) Manufacturing, sales China US$15,000,000 – 100% Electronics Co., Ltd. * and marketing, R&D
Parlex USA LLC Manufacturing, sales United States – – 100% and marketing, R&D of America
Saia-Burgess Manufacturing, sales United States – – 100% Automotive and marketing, R&D of America Actuators LLC
Saia-Burgess Sales and marketing Netherlands 3,000 shares of – 100% Benelux B.V. EUR45 each
Saia-Burgess (China) Manufacturing, China US$6,500,000 – 100% Ltd * sales and marketing
Saia-Burgess LLC Manufacturing, sales United States – – 100% and marketing, R&D of America
Shanghai Malu Ri Yong– Manufacturing, sales China RMB85,000,000 – 60% JEA Gate Electric and marketing, R&D Co Ltd #
V Motor (China) Ltd * Manufacturing, China US$6,000,000 – 100% sales and marketing
Associate
Shenzhen SMART Manufacturing, China US$2,100,000 – 49% Micromotor Co., Ltd. # sales and marketing
* Wholly foreign owned enterprises# Equity joint ventures

156Johnson Electric Holdings Limited
Annual Report 2015
JOHNSON ELECTRIC GROUP TEN-YEAR SUMMARY
US$ million 2015 2014 2013
Consolidated income statement
Sales 2,136.1 2,097.6 2,059.7Earnings before interest and tax (EBIT) 1 243.5 233.9 213.2Profit before income tax 249.0 243.0 218.0Income tax (expense) / income (29.2) (28.1) (21.1)Discontinued operations – – –Profit for the year 219.8 214.9 196.9Non-controlling interests (8.9) (7.0) (5.6)Profit attributable to shareholders 210.9 207.9 191.3
Consolidated balance sheet
Fixed assets 492.6 460.6 425.6Goodwill and intangible assets 595.6 650.7 621.5Cash and deposits 773.2 644.0 480.9Other current and non-current assets 986.6 745.4 715.9
Total assets 2,848.0 2,500.7 2,243.9
Equity attributable to shareholders 1,862.3 1,732.3 1,568.5Non-controlling interests 38.6 34.0 30.3
Total equity 1,900.9 1,766.3 1,598.8Total debt 2 291.3 116.9 125.0Other current and non-current liabilities 655.8 617.5 520.1
Total equity and liabilities 2,848.0 2,500.7 2,243.9
Per share data 3
Basic earnings per share – continuing operations (US Cents) 24.1 23.4 21.4Dividend per share (US Cents) 6.2 5.9 5.6Closing stock price (HKD) 27.3 28.7 23.1
Other information
Free cash flow from operations 4 155.8 231.1 111.9Earnings before interest, tax, depreciation and amortisation (EBITDA) 335.5 321.8 304.3EBITDA to sales % 15.7% 15.3% 14.8%Capital expenditure (CAPEX) 119.9 92.2 82.6CAPEX to sales % 5.6% 4.4% 4.0%Market Capitalisation 3,032.5 3,282.2 2,646.2Enterprise Value (EV) 2,589.3 2,789.1 2,320.5EV/EBITDA 5 7.7 8.7 7.6
Ratios
EBIT to sales % 11.4% 11.2% 10.4%Return on average total equity % 6 12.0% 12.8% 12.8%Free cash flow from operations to debt % 53% 198% 90%Total debt to EBITDA (times) 0.9 0.4 0.4Total debt to capital % 13% 6% 7%Interest coverage (times) 7 28.8 127.8 79.0
1 Earnings before interest and tax (EBIT) is defined as operating profit (per accounts) plus share of profits / (losses) of associate
2 Total debt calculated as borrowings plus convertible bonds
3 Per share data had been adjusted to reflect the impact of 1 for 4 share consolidation on 15 July 2014
4 Net cash generated from operating activities plus interest received, less capital expenditure (net of proceeds from disposal of assets) and capitalisation of engineering development costs
5 EV / EBITDA is calculated excluding non-recurring items for FY2011/12
6 Return on average total equity is calculated as profit for the year over average total equity during the year
7 Interest coverage (times) is calculated by EBIT / interest expense

JOHNSON ELECTRIC GROUP TEN-YEAR SUMMARY
157
2012 2011 2010* 2009 2008 2007 2006
2,140.8 2,104.0 1,741.0 1,828.2 2,220.8 2,086.6 1,526.3 221.6 235.8 110.5 47.0 188.9 157.5 117.8 220.5 226.4 103.8 37.4 170.1 135.9 116.3 (31.6) (36.1) (16.4) 0.4 (31.9) (22.9) (21.9) – – – (31.1) – – – 188.9 190.3 87.4 6.7 138.2 113.0 94.4 (2.2) (8.6) (10.4) (4.1) (7.4) (3.3) (0.4) 186.7 181.7 77.0 2.6 130.8 109.7 94.0
433.1 457.5 440.6 428.3 471.3 439.0 421.1 757.8 774.7 699.9 662.1 775.2 667.2 631.6 385.1 354.7 367.1 302.0 268.0 149.3 238.5 704.0 755.5 623.2 557.5 840.2 764.8 722.8
2,280.0 2,342.4 2,130.8 1,949.9 2,354.7 2,020.3 2,014.0
1,461.6 1,362.2 1,121.7 964.4 1,101.9 940.7 845.5 25.9 60.1 51.5 33.7 31.0 22.7 10.3
1,487.5 1,422.3 1,173.2 998.1 1,132.9 963.4 855.8 205.4 313.7 408.7 528.9 564.5 573.5 708.1 587.1 606.4 548.9 422.9 657.3 483.4 450.1
2,280.0 2,342.4 2,130.8 1,949.9 2,354.7 2,020.3 2,014.0
20.7 19.9 8.4 3.7 14.3 12.0 10.2 5.1 4.6 2.6 – 7.3 6.7 6.7 19.3 18.2 20.6 6.0 14.7 20.8 29.0
166.0 169.6 215.1 168.5 186.7 106.8 110.3 314.3 322.5 197.9 136.2 279.5 246.0 178.0 14.7% 15.3% 11.4% 7.4% 12.6% 11.8% 11.7% 91.3 85.6 38.0 62.8 97.1 76.1 64.1 4.3% 4.1% 2.2% 3.4% 4.4% 3.6% 4.2% 2,229.5 2,134.4 2,426.3 704.3 1,732.3 2,439.2 3,429.6 2,075.6 2,153.4 2,519.4 964.9 2,059.8 2,886.1 3,909.5 6.3 6.7 12.7 7.1 7.4 11.7 22.0
10.4% 11.2% 6.3% 2.6% 8.5% 7.5% 7.7% 13.0% 14.7% 8.1% 0.6% 13.2% 12.4% 11.3% 81% 54% 53% 32% 33% 19% 16% 0.7 1.0 2.1 3.9 2.0 2.3 4.0 12% 18% 26% 35% 33% 37% 45% 32.1 18.2 12.4 3.0 7.2 5.5 15.5
* Historical data for FY2009/10 had been restated for the adoption of HKAS 12 (amendment) – deferred tax related to investment properties. Historical data for FY2005/06 to FY2008/09 had not been restated in this summary.

158Johnson Electric Holdings Limited
Annual Report 2015
PROFILE OF DIRECTORS ANDSENIOR MANAGEMENT
DIRECTORS
Yik-Chun Koo WangNon-Executive DirectorHonorary ChairmanYik-Chun Koo Wang, age 98, is the Honorary Chairman of the Company and co-founder of the Group. She was the Vice-Chairman of the Group from 1984 to 1996 and was actively involved in the development of the Group in its early stages. Madam Wang is also the Honorary Chairlady of Tristate Holdings Limited.
Patrick Shui-Chung Wang JPChairman and Chief ExecutiveMember of Nomination and Corporate Governance CommitteePatrick Shui-Chung Wang, age 64, obtained his Bachelor of Science and Master of Science degrees in Electrical Engineering and received an Honorary Doctorate of Engineering from Purdue University in Indiana, United States. He joined the Group in 1972 and became a director of the Company in 1976 and Managing Director in 1984. In 1996, he was elected Chairman and Chief Executive of the Company. He also serves on the board of directors of various subsidiaries of the Company. Dr. Wang was the Chairman and a director of the Hong Kong Applied Science and Technology Research Institute Company Limited, however he retired from the aforesaid positions with effect from 21 October 2013. Dr. Wang is an Independent Non-executive Director and a member of the Nomination Committee of VTech Holdings Limited and a non-executive director of Tristate Holdings Limited. He ceased to be a non-executive director and a member of the Audit Committee of The Hongkong and Shanghai Banking Corporation Limited with effect from 31 December 2012. He is a son of the Honorary Chairman, Madam Yik-Chun Koo Wang.
Winnie Wing-Yee WangVice-ChairmanMember of Remuneration CommitteeWinnie Wing-Yee Wang, age 68, obtained her Bachelor of Science degree from Ohio University in the United States. She joined the Group in 1969. She became a director of the Company in 1971 and Executive Director in 1984 and was elected the Vice-Chairman in 1996. She also serves on the board of directors of various subsidiaries of the Company. Ms. Wang is a non-executive director of Tristate Holdings Limited. She is a sister of the Chairman and Chief Executive, Dr. Patrick Shui-Chung Wang.

PROFILE OF DIRECTORS AND SENIOR MANAGEMENT
159
Austin Jesse WangExecutive DirectorAustin Jesse Wang, age 34, graduated from the Massachusetts Institute of Technology with Master of Engineering and Bachelor of Science degrees in Computer Science and Electrical Engineering. He joined the Group in 2006 and became a director of the Company in 2009. He also serves on the board of directors of various subsidiaries of the Company. Mr. Wang is a committee member of the Shenzhen Committee of The Chinese People’s Political Consultative Conference. He has previously worked as a consulting engineer in the computing industry. Mr. Wang is the son of the Chairman and Chief Executive, Dr. Patrick Shui-Chung Wang.
Peter Kin-Chung WangNon-Executive DirectorMember of Audit CommitteePeter Kin-Chung Wang, age 61, has been a Non-Executive Director of the Company since 1982. He obtained a Bachelor of Science degree in Industrial Engineering from Purdue University in Indiana, United States and a Master of Business Administration degree from Boston University in Massachusetts, United States. He is the Chairman and Chief Executive Officer of Tristate Holdings Limited and the Chairman and Managing Director of Hua Thai Manufacturing Public Company Limited which was formerly listed on The Stock Exchange of Thailand. Mr. Wang won the Young Industrialist Award of Hong Kong in 1998. In 2005, he received the Outstanding Industrial Engineer Award from the School of Industrial Engineering of Purdue University. He is a member of the Anhui Provincial Committee of Chinese People’s Political Consultative Conference, the honorary chairman of the Hong Kong Garment Manufacturers Association, a general committee member of the Textile Council of Hong Kong Limited and a director of The Federation of Hong Kong Garment Manufacturers. He is a brother of the Chairman and Chief Executive, Dr. Patrick Shui-Chung Wang.
Peter Stuart Allenby EdwardsIndependent Non-Executive DirectorChairman of Nomination and Corporate Governance CommitteePeter Stuart Allenby Edwards, age 66, has been an Independent Non-Executive Director of the Company since 1995. He is a solicitor and was Senior Partner of Johnson, Stokes & Master until he retired on 30 September 1996. Mr. Edwards was the Chairman of the Hong Kong Branch of the International Fiscal Association, the Chairman of the Revenue Law Committee of the Hong Kong Law Society and a member of the Joint Liaison Committee on Taxation which advises the Government of the Hong Kong Special Administrative Region. He is also a member of the International Academy of Estate and Trust Law, an honorary lecturer in law at the University of Hong Kong and a director of a number of investment and holding companies. He is a director of Martin Currie Pacific Trust plc.

160Johnson Electric Holdings Limited
Annual Report 2015
Patrick Blackwell Paul CBE
Independent Non-Executive DirectorChairman of Audit Committee and Member of Nomination and Corporate Governance CommitteePatrick Blackwell Paul, age 67, has been an Independent Non-Executive Director of the Company since 2002. He had been the Chairman and Senior Partner of PricewaterhouseCoopers in Hong Kong from 1994 to 2001. He is an independent non-executive director of The Hongkong and Shanghai Hotels, Ltd. and Pacific Basin Shipping Limited. His civic commitments include chairing the Supervisory Board of the British Chamber of Commerce in Hong Kong.
Michael John EnrightIndependent Non-Executive DirectorChairman of Remuneration Committee and Member of Audit CommitteeMichael John Enright, age 56, has been an Independent Non-Executive Director of the Company since 2004. He obtained his Bachelor of Arts (in Chemistry), Master of Business Administration, and Doctor of Philosophy (in Business Economics) degrees all from Harvard University. He was formerly a professor at the Harvard Business School. Prof. Enright is currently a professor at the University of Hong Kong School of Business and a director at Enright, Scott & Associates, a Hong Kong-based consulting firm.
Joseph Chi-Kwong Yam GBM, GBS, CBE, JP
Independent Non-Executive DirectorMember of Remuneration CommitteeJoseph Chi-Kwong Yam, age 67, has been an Independent Non-Executive Director of the Company since 2010. He graduated from the University of Hong Kong with first class honours in 1970. Over the years, he has received a number of honorary doctorate degrees and professorships from universities in Hong Kong and overseas. Mr. Yam was awarded the highest honour of the Grand Bauhinia Medal by the Government of the Hong Kong Special Administrative Region in 2009. He was the Chief Executive of the Hong Kong Monetary Authority from 1993 to September 2009. He is the Executive Vice President of the China Society for Finance and Banking, a society managed by the People’s Bank of China, Distinguished Research Fellow of the Institute of Global Economics and Finance at The Chinese University of Hong Kong and the Chairman of Macroprudential Consultancy Limited. Mr. Yam is a member of the Board of Directors, the Corporate Culture and Responsibility Committee and the Risk Committee of UBS Group AG, and a Board member and Chairman of Compensation & Assessment Committee of UnionPay International Co., Ltd. He was formerly an independent non-executive director, chairman of the Risk Management Committee and member of the Strategic Development Committee of China Construction Bank Corporation but retired from these positions with effect from 23 October 2013. Mr. Yam is also a member of the advisory committees of a number of academic and private institutions focusing on finance.

PROFILE OF DIRECTORS AND SENIOR MANAGEMENT
161
Christopher Dale Pratt CBE
Independent Non-Executive DirectorMember of Remuneration CommitteeChristopher Dale Pratt, age 58, has been an Independent Non-Executive Director of the Company since 2014. He obtained his honours degree in Modern History from Oxford University. He joined the Swire group in 1978 and over the next 35 years worked in various of the group’s businesses in Hong Kong, Australia and Papua New Guinea. From 2006 until his retirement in March 2014, he served as Chairman of Cathay Pacific Airways Limited, Hong Kong Aircraft Engineering Company Limited, John Swire & Sons (H.K.) Limited, Swire Pacific Limited and Swire Properties Limited. He was also a Director of Swire Beverages, Air China Limited and The Hongkong and Shanghai Banking Corporation Limited. Mr. Pratt is currently a Non-Executive Director of PureCircle Limited and an Independent Non-Executive Director and a member of Audit Committee, Investment and Capital Markets Committee, Remuneration and Options Committee and Risk Committee of Noble Group Limited. Mr. Pratt is the Vice Chairman of The Hong Kong General Chamber of Commerce. He received a Commander of the Order of the British Empire (CBE) in 2000.
SENIOR MANAGEMENT
Tung-Sing ChoiSenior Vice President,Global ManufacturingTung-Sing Choi, age 65, is responsible for the global manufacturing management of the Group. He joined the Group in 1968 and has more than 40 years of experience in motor component manufacturing, motor assembly processes and the utilisation of machines and fixtures.
James Randolph DickSenior Vice President,Strategic Marketing & SalesJames Randolph Dick, age 61, holds a Bachelor of Science in Electrical and Electronic Engineering from the University of Paisley in Scotland. He is responsible for developing responses to macro market issues and leading the Company’s productizing and selling process. He joined the Group in 1999. He has 35 years of experience in high technology management throughout the world. Prior to joining the Group, he held executive positions with Xerox in the United States, IBM in Europe and with Astec (BSR) Plc, an Emerson Electric company, based in Hong Kong.

162Johnson Electric Holdings Limited
Annual Report 2015
Michael Philip GannonSenior Vice President,Human ResourcesMichael Philip Gannon, age 60, holds a Bachelor of Industrial Administration degree from Kettering University and a Master of Business Administration (Accounting) from the University of Michigan. He joined the Group in 2013 and is responsible for global human resources, training and development and environment and health and safety. Prior to joining the Group, he worked in the United States and Europe for General Motors, Delphi and Nexteer Automotive, where he held positions in human resources, business strategy and operations. Most recently, he was Senior Vice President of global human resources and Chief Operations Officer of the Saginaw division for Nexteer Automotive.
Robert Allen GilletteSenior Vice President,Supply Chain ServicesRobert Allen Gillette, age 49, holds a Bachelor of Science degree in Electrical Engineering from Washington University in Missouri, United States and a Master of Business Administration concentrating in Operations and Finance from Vanderbilt University in Tennessee, United States. He is responsible for providing leadership and strategic direction in supply chain management for all business units of the Group. Prior to joining the Group in 2007, he worked for Emerson Electric where he held various operations, marketing and supply chain positions in North America and Asia.
Joseph Alan GuisingerSenior Vice President,Industry Products Group – AmericasJoseph Alan Guisinger, age 48, holds a Bachelor of Science in Business Administration degree in Transportation and Logistics from Ohio State University in Ohio, United States and a Master’s Degree from the Thunderbird School of Global Management in Arizona, United States. He joined the Group in 2004 and is currently responsible for the strategic, commercial and operational direction of IPG in the Americas. Prior to joining the Group, he worked for Emerson Electric and held senior positions in supply chain management division in Asia and North America.
Christopher John HassonExecutive Vice PresidentChristopher John Hasson, age 52, was educated at the University of Manchester and London Business School (Corporate Finance and Accounting). He is responsible for corporate business development, mergers and acquisitions, corporate strategic planning and for supervision of the legal and company secretarial functions. Prior to joining the Group in 2002, he was a partner at The Boston Consulting Group.

PROFILE OF DIRECTORS AND SENIOR MANAGEMENT
163
Kam-Chin KoSenior Vice President,Automotive Products Group – AsiaKam-Chin Ko, age 49, holds a Master of Science degree in Manufacturing System Engineering from the University of Warwick in the United Kingdom and a Doctor of Engineering from the Hong Kong Polytechnic University in Hong Kong. He is responsible for the business and strategic objectives for sales, business development and engineering of APG in Asia. He joined the Group in 1988 and in previous positions led C&S and the Corporate Engineering function. He is a member of The Institute of Engineering and Technology and a member of the Institute of Industrial Engineers.
Yiu-Cheung KwongSenior Vice President,Industry Products Group – AsiaYiu-Cheung Kwong, age 49, holds a Mechanical Engineering degree from Sunderland Polytechnics in the United Kingdom and a Master of Business Administration degree from the City University of Hong Kong. He is responsible for the strategic, commercial and operational direction of IPG in Asia. He joined the Group in 1999 and had been a General Manager for the Home Appliance Business Unit. Prior to joining the Group, he had 10 years of experience with TDK, NHK and Philips, where he held a variety of positions in product engineering, product procurement and sales and marketing.
Yue LiSenior Vice President,Corporate EngineeringYue Li, age 55, obtained a Bachelor of Science degree from Tsinghua University in the PRC and also a Doctor of Philosophy degree from the University of Wisconsin-Madison in Wisconsin, United States. He is responsible for overall corporate technology, engineering operations and Value Innovation Programs. Prior to joining the Group in 2004, he worked for Emerson Electric in St. Louis as director of new products, for Carrier Corporation in Syracuse as director of power electronics and motor technologies and for Emergency One Inc. in Florida as vice president of product management.
Jeffrey L. ObermayerExecutive Vice President andChief Financial OfficerJeffrey L. Obermayer, age 59, has a Bachelor of Science degree (Hons.) in Business Administration and a Master of Science degree in Accounting from the Illinois State University in Illinois, United States. He also holds a Master of Business Administration degree from the Northwestern University in Illinois, United States. He is a member of the American Institute of Certified Public Accountants, the Institute of Management Accountants and the Institute of Internal Auditors. Prior to joining the Group in 2010, he had 28 years of experience with BorgWarner Inc. in the United States and Germany, where he held a variety of senior executive positions in finance, business development, treasury and enterprise risk management, capital markets, pension plans and accounting. His last two positions there were Vice President & Treasurer and Vice President & Controller, Principal Accounting Officer. He also worked with Arthur Andersen & Co. in Chicago, Illinois, United States.

164Johnson Electric Holdings Limited
Annual Report 2015
CHANGES IN INFORMATION OF DIRECTORSIn accordance with Rule 13.51B(1) of the Listing Rules, the changes in information of Directors of the Company subsequent to the date of the Interim Report 2014 of the Company are set out below:
Name of Director Details of Changes
Christopher Dale Pratt Mr. Pratt was appointed as a member of the Remuneration Committee of the Board of the Company with effect from 1 April 2015.

165
CORPORATE AND SHAREHOLDER INFORMATIONJohnson Electric Holdings Limited(Incorporated in Bermuda with limited liability)
CORPORATE INFORMATIONBoard of Directors
Executive DirectorsPatrick Shui-Chung Wang JP Chairman and Chief ExecutiveWinnie Wing-Yee Wang Vice-ChairmanAustin Jesse Wang
Non-Executive DirectorsYik-Chun Koo Wang Honorary ChairmanPeter Kin-Chung WangPeter Stuart Allenby Edwards*Patrick Blackwell Paul CBE*Michael John Enright*Joseph Chi-Kwong Yam GBM, GBS, CBE, JP *Christopher Dale Pratt CBE*
* Independent Non-Executive Director
Company Secretary
Lai-Chu Cheng
AuditorPricewaterhouseCoopers
Registrars and Transfer OfficesPrincipal Registrar:MUFG Fund Services (Bermuda) Limited26 Burnaby StreetHamilton HM 11Bermuda
Registrar in Hong Kong:Computershare Hong Kong Investor Services LimitedShops 1712-1716, 17th FloorHopewell Centre183 Queen’s Road EastWan Chai, Hong Kong
Registered OfficeCanon’s Court22 Victoria StreetHamilton HM 12Bermuda
Hong Kong Head Office12 Science Park East Avenue, 6/FHong Kong Science ParkShatin, New TerritoriesHong KongTel : (852) 2663 6688Fax : (852) 2897 2054Website : www.johnsonelectric.com
Principal BankersThe Hongkong and Shanghai Banking Corporation LimitedCommerzbank AGBank of China (Hong Kong) LimitedHang Seng Bank LimitedMizuho Bank, Ltd.The Bank of Tokyo-Mitsubishi UFJ, Ltd.Citibank, N.A.BNP ParibasJPMorgan Chase Bank, N.A.Standard Chartered Bank
Rating agenciesMoody’s Investors ServiceStandard & Poor’s Ratings Services
LISTING INFORMATIONShare Listing
The Company’s shares are listed on The Stock Exchange of Hong Kong Limited.
Stock Code
The Stock Exchange of Hong Kong Limited : 179Bloomberg : 179:HKReuters : 0179.HK
SHAREHOLDERS’ CALENDARAnnual General Meeting (AGM)
9 July 2015 (Thu)
Register of Shareholders
Closure of Register (both dates inclusive)For attending AGM : 7 – 9 July 2015 (Tue – Thu)For final dividend : 20 – 22 July 2015 (Mon – Wed)
Dividend (per Share)
Interim Dividend : 14 HK CentsPaid on : 6 January 2015 (Tue)Final Dividend : 34 HK CentsPayable on : 31 July 2015 (Fri)

(Stock Code: 179)
Johnson Electric Holdings Limited12 Science Park East Avenue, 6/F
Hong Kong Science ParkShatin, New Territories
Hong KongTel: (852) 2663 6688 Fax: (852) 2897 2054
www.johnsonelectric.com
Johnson Electric H
oldings Limited A
nnual Report 2015
Johnson Electric Holdings LimitedAnnual Report 2015