Johann Wolfgang von Goethe - Imperial College London · Johann Wolfgang von Goethe. IMPERIAL...
176
“Mehr licht!“ (“More light!”) („Więcej światła!”) Johann Wolfgang von Goethe
Transcript of Johann Wolfgang von Goethe - Imperial College London · Johann Wolfgang von Goethe. IMPERIAL...

“Mehr licht!“
(“More light!”)
(„Więcej światła!”)
Johann Wolfgang von Goethe
IMPERIAL COLLEGE LONDON
INVESTIGATION AND DEVELOPMENT OF
TRANSIENT THERMOGRAPHY FOR
DETECTION OF DISBONDS IN THERMAL
BARRIER COATING SYSTEMS
by
Grzegorz Stanislaw Ptaszek
A thesis submitted to Imperial College London for the degree of
Doctor of Engineering
Non-Destructive Testing Group
Department of Mechanical Engineering
Imperial College London
London SW7 2AZ
December 2012

2
Declaration of Originality
The content of this thesis is my own work, with supervision from Professor Peter Cawley.
Where I have made use of the work of others, I have made this clear and provided
appropriate references.
Grzegorz Ptaszek
20.12.2012

3
Abstract
This thesis has explored the use of transient thermography for the detection of disbonds
of minimum diameter 2mm located in a thermal barrier coating (TBC) system whose
surface may be unpainted. The technique, the type/size of the defect and also the
condition of the TBC system for the inspection has been specified by Alstom Power
Switzerland, the sponsor of the EngD project.
As for other Non Destructive Testing (NDT) techniques, reference test specimens are
required for calibration, but unfortunately, real disbonds are very difficult to use because
it is difficult to control their size, and larger ones tend to spall. Flat bottomed holes are
commonly used, but these over-estimate the thermal contrast obtained for a defect of a
given diameter. The thesis quantifies the differences in thermal response using finite
element analysis validated by experiments, and proposes a form of artificial disbond that
gives a better representation of the thermal responses seen with real defects. Real
disbonds tend to have a non-uniform gap between the disbonded surfaces across the
defect, and the effect of this on the thermal response is evaluated using finite element
simulations. It is shown that the effect can be compensated for by adjusting the diameter
of the calibration defect compared to the real defect.
Surfaces of inspected specimens are usually covered by a black, energy absorbing paint
before the transient thermography test is carried out. Unfortunately, this practice is not
acceptable to some turbine blade manufacturers (including the project sponsor) since
thermal barrier coatings are porous so the paint is difficult to remove. Unpainted TBC
surfaces have very low emissivity, and after period of service their colour changes
unevenly and with which also absorptivity and emissivity changes. The low emissivity
gives low signal levels and also problems with reflections of the incident heat pulse,
while the variation in emissivity over the surface gives strong variation in the contrast
obtained even in the absence of defects. The thesis has investigated the effects of uneven
discolouration of the surface and of Infra Red (IR) translucency on the thermal responses

4
observed by using mid and long wavelength IR cameras. It has been shown that
unpainted blades can be tested satisfactorily by using a more powerful flash heating
system assembled with an IR glass filter and a long wavelength IR camera. The problem
of uneven surface emissivity can be overcome by applying of the 2nd
time derivative
processing of the log-log surface cooling curves.

5
Acknowledgements
I would like to sincerely thank my supervisor Prof. Peter Cawley for his professional and
very patient guidance throughout this work which sometimes was very difficult for me. I
am very thankful to Prof. Chris Scruby and Prof. Mike Lowe for giving me the
opportunities to be a part of the NDT group at Imperial College and also for their
knowledge and skills which I tried to gain as much as I could during the EngD program.
Similarly, I would like to thank all my teachers from RCNDE who were delivering the
courses and to Mr. Fernando Silverio from Alstom Power Switzerland for the
opportunities to realize the project for the company.
I am very grateful for enormous help which I received from the NDT group at University
of Bath particularly from Dr. Simon Pickering who always tried to answer on my
peculiar thermal questions very often not only during the working hours.
My experiments could not be performed without great help from dr. Tim Barden (Rolls
Royce), Mr. Paul Brown (the Physics Department), Mr. David Tomlin and Mr. Phil
Wilson (Mechanical Engineering Department).
I would like to thank also Mrs. Nina Hancock (Mechanical Engineering Department) for
highly professional approach to all logistic issues during my EngD program and to my
friends from the NDT laboratory from whom I had gained the scientific knowledge and
with whom I had some fun as well.
Finally and with great respect, I would like to thank Dr. Gustaw Sikora (my
psychoanalyst) for helping me to understand myself much better and due to this
knowledge to experience reality more fully and hopefully to be a better person.

CONTENTS
6
Contents
1 EngD project ..................................................................................................................17
1.1 Introduction…………………………………………………………………….....17
1.2 Thermal barrier coatings and their failure modes ...................................................17
1.3 Alstom .....................................................................................................................23
1.4 Motivation and project aims ....................................................................................25
1.5 Thesis outline ..........................................................................................................27
2 Development of active thermography ............................................................................29
2.1 Introduction .............................................................................................................29
2.2 Transient thermography ..........................................................................................34
2.2.1 Characteristics of IR cameras ...........................................................................39
2.2.2 Properties of tested materials ...........................................................................40
2.2.3 Characteristics of flash sources ........................................................................42
2.3 Transient thermography for disbond detection in TBC systems………………….43
2.4 Conclusions .............................................................................................................47
3 Computer simulations ....................................................................................................48
3.1 Introduction .............................................................................................................48
3.2 Analytical solutions for transient thermography .....................................................49

CONTENTS
7
3.3 Numerical solutions for transient thermography .....................................................66
3.4 Indicators of defect ..................................................................................................75
3.5 Conclusions .............................................................................................................82
4 Calibration defects vs. real “buckled” disbonds .............................................................83
4.1 Introduction .............................................................................................................83
4.2 Flat bottomed hole (FBH) and artificial disbond ....................................................85
4.3 Real “buckled”disbonds ..........................................................................................90
4.4 Experimental Results ...............................................................................................95
4.5 Profiled artificial disbonds ......................................................................................98
4.6 Conclusions ...........................................................................................................102
5 Properties of TBC system and their effect on thermal response ..................................103
5.1 Introduction ...........................................................................................................103
5.2 Thickness of substrate ...........................................................................................104
5.3 Thickness of coating ..............................................................................................109
5.4 Thermal conductivity of TBC ...............................................................................113
5.5 Conclusions ...........................................................................................................117
6 Issues at transient thermography inspection of unpainted TBC ...................................118
6.1 Introduction ...........................................................................................................118
CONTENTS
8
6.2 Coating translucency .............................................................................................121
6.3 The afterglow effect and use of a glass filter ........................................................124
6.4 Effect of non uniform energy absorption on surface of TBC……………………127
6.5 Trial tests of unpainted TBC specimen by using two different TT systems .........134
6.5.1 Description of specimen and two transient thermography systems ...............134
6.5.2 Tests and results .............................................................................................136
6.6 Conclusions ...........................................................................................................143
7 Practical solution for thermography inspection of unpainted TBC systems in service144
7.1 Introduction ...........................................................................................................144
7.2 Coloured Zirconia discs ........................................................................................145
7.3 Randomly discoloured TBC system ......................................................................148
7.4 Locally blackened TBC system .............................................................................150
7.5 Conclusions ...........................................................................................................156
8. Conclusions .................................................................................................................157
8.1 Thesis review .........................................................................................................157
8.2 Main findings of this thesis ...................................................................................160
8.3 Suggestions of future work ...................................................................................161
Appendix .........................................................................................................................163
References .......................................................................................................................166
LIST OF FIGURES AND TABLES
9
Figure
Number Title of Figure page
1.1
Thermal barrier coating (TBC) a) location of TBC on gas turbine; b)
coated gas turbine blade; c) cross section of TBC system and its
functions.
18
1.2
Plasma spraying at work a) Schematic diagram of plasma spray gun;
b) photo showing applying of TBC on gas turbine blade.
19
1.3
Electron micrographs of plasma sprayed TBC showing porous and
microcracked structure at a) 150x and b) 500x.
20
1.4 Formation of thermal growth oxide (TGO) on boundaries bond coat
and top coat.
21
1.5
Bonding between top coat and bond coat with thermal growth oxide
between a) stress concentration (tensile- peaks, compressive-valleys)
b) separation between layers due to stresses.
22
1.6 TBC blade after partial spalling of coating and substrate.
22
1.7 Selected stages of TBC blade manufacturing (visual inspection and
checks of cooling channels).
24
1.8
Stages of TBC blade refurbishment (I) - TBC blade removed from
turbine to (VIII) - TBC blade after applying bond coat (gray) and
part of top coat (white).
24
2.1 Basic principles of transient thermography shown on example of
TBC system containing disbond.
35
2.2 Schematic diagram of equipment used for transient thermography
test performed on TBC specimen.
36
2.3 Example of real transient thermography equipment produced by TWI
(Thermal Wave Imaging) called EchoTherm.
37
LIST OF FIGURES AND TABLES
10
2.4
Schematic example of flash head interior.
38
2.5 Operator performing transient thermography test.
38
3.1
Photothermal effect after applying pulse of energy.
49
3.2
Heat conduction caused by thermal gradient.
50
3.3
Heat flow into cross section - energy balance.
51
3.4
Temperature distribution in specimens as function of depth after
pulse energy deposition: 0.4 ms, 0.8 ms, 1.2 ms for a) Zirconia; b)
Nickel super alloy.
53
3.5
Temperature distribution in specimens as function of time after pulse
energy at depths: 0.1mm, 0.2 mm, 0.4 mm for a) Zirconia; b) Nickel
super alloy.
54
3.6
Surface cooling of semi-infinite materials.
57
3.7
1D heat flow after pulse. Half space with large defect replaced by
finite plate and behavior of a heat front at the boundaries of the plate.
58
3.8
Time of deviation from -0.5 gradient as function of material
thickness.
59
3.9
Surface cooling of Zirconia plate of various thickness.
60
3.10
2nd
derivative taken from surface cooling plotted in Figure 3.9.
60
3.11
Heat front on boundaries between TBC and Nickel Super Alloy
substrate.
61
3.12 Surface cooling of TBC plates with various thicknesses 62
LIST OF FIGURES AND TABLES
11
3.13
2nd
derivative taken from surface cooling plotted in Figure 3.12.
63
3.14 Tree dimensional heat flow around defect tip.
65
3.15 Schematic 3D model of three layered specimen containing three
subsurface defects.
66
3.16 Pulse shape used.
69
3.17 Effect of mesh element size in direction of heat propagation on
convergence between analytical and numerical solution
70
3.18 Surface cooling of 0.8mm thick Zirconia plate. Pulse applied on top
surface.
71
3.19 2nd
derivative taken from Figure 3.17.
72
3.20 Surface cooling of 0.8mm thick Zirconia plate. Pulse applied in the
middle of plate.
72
3.21 Surface cooling of 0.8mm thick Zirconia plate. Pulse applied on
bottom of plate.
73
3.22 Surface cooling of 0.8mm thick Zirconia plate rigidly bonded to
3mm and 40mm substrate. Pulse applied on top surface.
73
3.23 2nd
derivative taken from Figure 3.21.
74
3.24
Effect caused by disbond in TBC system on thermal response based
on computer simulations together with points needed to calculate
thermal contrast a) cross section of TBC system; b) surface
temperature distribution; c) schematically defective region on
surface with points needed to calculate thermal contrast.
78
3.25
Variation of peak thermal contrast as function of defect aspect ratio
for circular defects 1mm beneath Zirconia coating.
79
3.26
Usage of 2nd
derivative. Clear distinction between defective and
sound point. Fitting of “synthetic” signal to raw signal from IR
camera.
80
LIST OF FIGURES AND TABLES
12
3.27
Fitting of “synthetic” signal to raw signal from IR camera.
81
4.1 Real disbond between ceramic coat and substrate before spalling (a)
YSZ ceramic coating; (b) BC and nickel super alloy.
84
4.2 Significant differences in heat flow at: a) FBH as representation of
real disbond b) real “buckled” disbond.
85
4.3 Proposed artificial disbond as representation of real disbond. 86
4.4
Predicted effect of air gap thickness in artificial disbond on thermal
contrast (a) 0.08mm, (b) 0.2mm, (c) 0.3mm, (d) 0.4mm, (e) 0.6mm,
(f) 0.8mm, (g) 1mm, (h) 1.5mm, (i) 2mm=FBH.
88
4.5 Effect of diameter of artificial disbond on thermal contrast.
88
4.6 Reduction of maximum thermal contrast caused by heat flow
through disbond and lateral around its tips to cooler underside.
90
4.7 Schematic forms of disbond in TBC specimen: a) FBH; b) artificial
disbond; c) real “buckled” disbond.
91
4.8 Finite element prediction for combined effect of diameter and air gap
of „buckled‟ disbond on thermal contrast.
92
4.9
Finite element predictions for matching diameter of „buckled‟
disbond with equivalent diameter of artificial disbond and FBH by
applying equal maximum thermal contrast.
93
4.10
Matching of thermal response from „buckled‟ disbond with
equivalent artificial disbond and FBH (a) Thermal contrast (b) 2nd
derivative.
94
4.11 Raw thermal images at times of maximum thermal contrast.
95
4.12 Predicted and measured thermal contrast as a function of time for
artificial disbonds and FBHs with diameter.
97
4.13
Improvement in detection sensitivity by applying 2nd
derivative.
Images collected at times of maximum values for defects: a) 2mm
FBH; (b) 3mm FBH; (c) 4mm FBH; (d) 5mm FBH; (e) 2mm art.
disb.; (f) 3mm art. disb.; (g) 4mm art. disb.
98
4.14 Concept of profiled artificial disbond: a) heat flow differences at
“buckled” and artificial disbond; b) the original artificial disbond; c)
profiled artificial disbond.
99
LIST OF FIGURES AND TABLES
13
4.14
Concept of profiled artificial disbond: a) heat flow differences at
“buckled” and artificial disbond; b) the original artificial disbond; c)
profiled artificial disbond.
4.15
Finite element predictions for matching diameter of ”buckled”
disbond with equivalent diameter of FBH, artificial disbond and
improved profiled artificial disbond by applying maximum thermal
contrast.
100
4.16 Thermal contrast. Matching of thermal response from “buckled”
disbond with equivalent profiled artificial disbond.
100
4.17 2
nd time derivative. Matching of thermal response from “buckled”
disbond with equivalent profiled artificial disbond.
101
4.18 Problems at screw profiling a) schematically shown profiled part of
screw M4 b) image of profiled screw viewed from the top.
101
5.1 Cooling channels in turbine blade from an aircraft engine detected by
transient thermography.
102
5.2
Cross section of a coated gas turbine blade. I, II, III - various
possible positions of disbond (red) and (4) reference points (green).
Different possible reference points associated with the disbonds I, II,
III are also shown.
105
5.3 Various positions of disbond and corresponding reference point in
part of coated blade cross section based on Figure 5.2.
106
5.4
Thermal contrast as a function of time for the cases based on Figure
5.3.
108
5.5 2
nd time derivative to log-log surface cooling curves for disbonds and
reference points on the different substrate thicknesses.
109
5.6
Maximum thermal contrast as function of coating thickness for 4 mm
diameter FBH and artificial disbond with 0.1 µm air gap. Substrate
thickness was 3mm (Data points have been fitted with cubic
polynomial to make trends clearer).
110
5.7 Time of maximum thermal contrast as function of coating thickness
for defects of Figure 5.6.
111
5.8 Amplitude of the 2
nd derivative at TBC-substrate transition as
function of coating thickness.
112
LIST OF FIGURES AND TABLES
14
5.9 Peak time for the 2nd
derivative as function of coating thickness.
112
5.10
Maximum thermal contrast as function of thermal conductivity for
4mm diameter FBH and artificial disbond with 0.1mm air gap. TBC
thickness was 0.6mm and substrate thickness was 3mm.
114
5.11 Time of maximum thermal contrast appears as function of thermal
conductivity for FBH and artificial disbond for cases of Figure 5.10.
114
5.12 Amplitude of the 2
nd derivative at transition period TBC-substrate as
function of thermal conductivity.
115
5.13 Peak time for the 2
nd derivative of Figure 5.12 as function of coating
thermal conductivity.
116
6.1 Transient thermography effects during a test of TBC system: a)
painted; b) unpainted.
119
6.2 Examples of TBC surface discoloration on various types of TBC gas
turbine blades a) b) concave side c) convex side.
120
6.3 Model of TBC plate rigidly connected to nickel–super alloy
substrate. Pulse of energy applied unevenly through layers of TBC 122
6.4 Heat flux deposited into TBC as function of depth in TBC. 122
6.5
Surface cooling as function of time on log-log scale for black painted
semi-infinite TBC, finite black painted TBC bonded to substrate and
finite translucent TBC bonded to substrate.
123
6.6 Intensity of thermal radiation from black body at temperature 6000 K
and at room temperature.
125
6.7 Transmission of borosilicate window. 126
6.8 Transmission of light (visible and middle wavelength IR) as function
of glass thickness.
127
6.9
Model of TBC plate rigidly connected to nickel–super alloy
substrate. Pulse of energy applied only locally on circular regions of
diameter 0.6-4 mm.
128
6.10 Surface cooling in log-log scale for the model of Figure 6.9. 128
6.11 Set of models with various amount of energy applied on TBC
surface. 131
LIST OF FIGURES AND TABLES
15
6.12
Thermal contrast for models of Figure 6.11 as function heat flux,
time and distance between centre of defect and region of high
emissivity.
132
6.13
2nd
derivative from log (T)-log (t) surface cooling for models of
Figure 6.11 as function of heat flux, time and distance between
centre of defect and centre of region of high emissivity.
133
6.14 TBC reference specimen. 135
6.15 Two transient thermography systems: a) Bath University, b) Rolls
Royce.
135
6.16 Principles of the tests conducted at the NDT lab of Bath University
and at an inspection facility of Rolls Royce.
135
6.17 TBC specimen a) photo showing random discolouration on surface,
b) raw thermal image, c) 2nd
derivative image (Mosaiq).
136
6.18 Raw thermal image of TBC specimen showing defects and locally
applied discolouration (layers) of graphite, paint and soot.
138
6.19 Log-log surface cooling of selected points from TBC specimen: a)
defects; b) thin black layers.
139
6.20 Schematic configuration of Bath System when a glass filter is placed
between hood and specimen.
140
6.21 Log-log surface cooling of selected point of TBC specimen (Bath
system, glass filter applied).
141
6.22 Raw thermal image of TBC specimen when pulse applied via glass
filter.
142
6.23 Log-log surface cooling of TBC specimen of Figure 6.16. 142
6.24 2nd
derivative applied to log-log surface cooling. 143
7.1
Zirconia a) fragment of discoloured TBC from blade in service; b)
artificially discoloured discs.
145
7.2 Zirconia a) fragment of discoloured TBC from blade in service; b)
artificially discoloured discs.
147
7.3 2nd
time derivative calculated from log-log surface cooling of Figure
7.2. 147
LIST OF FIGURES AND TABLES
16
7.4 Non uniform colour of TBC a) photo showing discoloured TBC of
reference specimen; b) its thermal image.
148
7.5 Surface cooling on log-log scale from areas selected in Figure 7.4.
149
7.6 2
nd time derivative calculated from log-log surface cooling of Figure
7.5.
150
7.7 2
nd time derivative calculated from log-log surface cooling of Figure
7.5.
151
7.8 TBC reference specimen of Figure 7.7 a) photo showing TBC
specimen with areas of interest; b) Thermal image of TBC specimen.
152
7.9a Surface cooling on log-log scale from areas I-V of Figure 7.8. 154
7.9b Surface cooling on log-log scale from areas VI-XI of Figure 7.8. 154
7.10a
2nd
time derivative calculated from log-log surface cooling of Figure
7.9a.
155
7.10b 2
nd time derivative calculated from log-log surface cooling of Figure
7.9b.
155
8.1 Challenges at TBC thermography inspection 162
A.1 Two models with defect used to validate ThermoCalc3D
a) air gap placed below coating inside substrate; b) air gap placed
below coating inside substrate with additional filling.
164
A.2 Thermal contrast as function of time – validation of ThermoCalc3D
for a model (a) and expanded model (b).
165
A.3 Thermal contrast as function of time – validation of Comsol for a
model (a) and expanded model (b).
165
Number
of Table Title of Table page
3.1 Thermal properties of selected materials. 56
3.2
Estimation of maximum defect depth based on deviation of surface
cooling curve
65
EngD project
17
Chapter 1
EngD project
1.1 Introduction
This chapter introduces thermal barrier coatings (TBC), describing their structure and the
application of this multilayer system. A set of events is presented which leads to the
development of disbonds in the TBC system and subsequently failure by spalling.
Alstom Power, the sponsor of the project, a manufacturer/servicer of gas turbines is
introduced and the company activities in relation to TBC are presented. The chapter
briefly describes the current, industrial application of NDT for inspection of the TBC
systems with their limitations and shows that transient thermography is a promising
technique that has been chosen by the sponsor of the project. The detailed aims of the
project are then presented.
1.2 Thermal barrier coatings and their failure modes
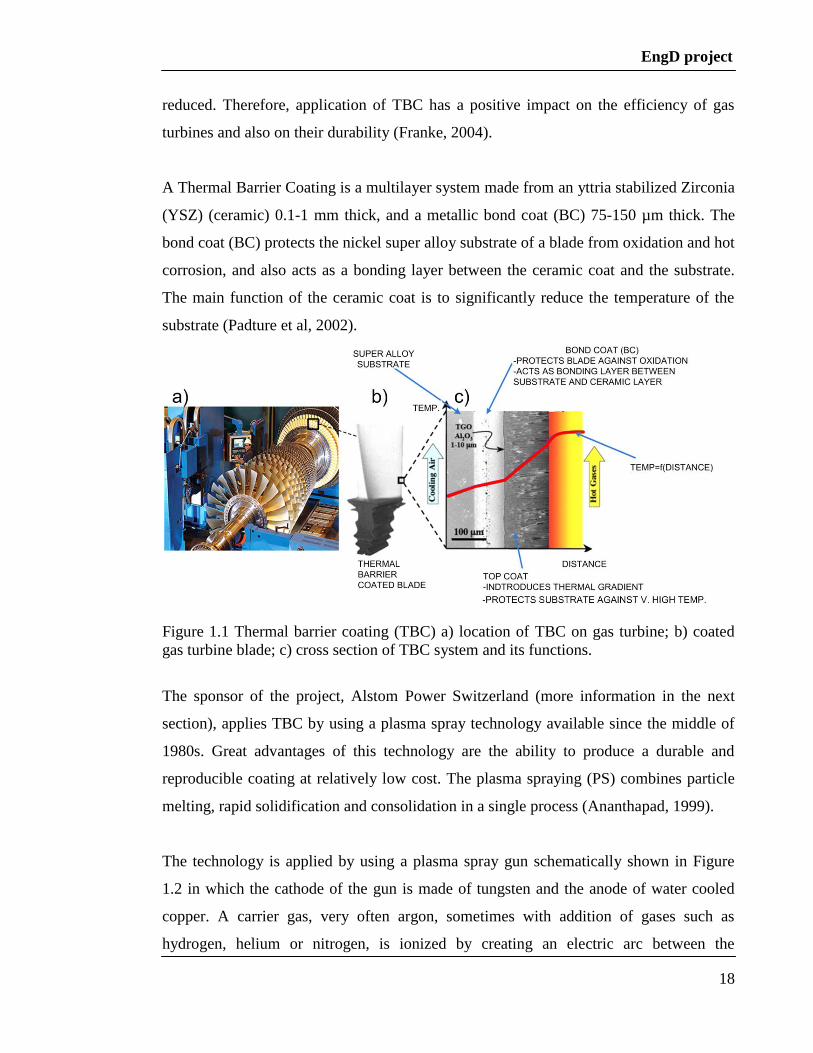
Thermal barrier coatings (TBCs) as shown in Figure 1.1 are applied to hot section
components of modern gas turbine engines in order to provide a thermal gradient
between hot combustion gases and a metallic substrate and also to protect the substrate
against oxidation and corrosion. Specimens on which TBCs are applied are internally
cooled gas turbine blades and vanes, combustion liners and nozzles. Protection delivered
by a TBC allows the possibility to increase the combustion gas temperature and in this
way its enthalpy. Additionally, the amount of cooling air delivered to the structure can be
EngD project
18
reduced. Therefore, application of TBC has a positive impact on the efficiency of gas
turbines and also on their durability (Franke, 2004).
A Thermal Barrier Coating is a multilayer system made from an yttria stabilized Zirconia
(YSZ) (ceramic) 0.1-1 mm thick, and a metallic bond coat (BC) 75-150 µm thick. The
bond coat (BC) protects the nickel super alloy substrate of a blade from oxidation and hot
corrosion, and also acts as a bonding layer between the ceramic coat and the substrate.
The main function of the ceramic coat is to significantly reduce the temperature of the
substrate (Padture et al, 2002).
Figure 1.1 Thermal barrier coating (TBC) a) location of TBC on gas turbine; b) coated
gas turbine blade; c) cross section of TBC system and its functions.
The sponsor of the project, Alstom Power Switzerland (more information in the next
section), applies TBC by using a plasma spray technology available since the middle of
1980s. Great advantages of this technology are the ability to produce a durable and
reproducible coating at relatively low cost. The plasma spraying (PS) combines particle
melting, rapid solidification and consolidation in a single process (Ananthapad, 1999).
The technology is applied by using a plasma spray gun schematically shown in Figure
1.2 in which the cathode of the gun is made of tungsten and the anode of water cooled
copper. A carrier gas, very often argon, sometimes with addition of gases such as
hydrogen, helium or nitrogen, is ionized by creating an electric arc between the
EngD project
19
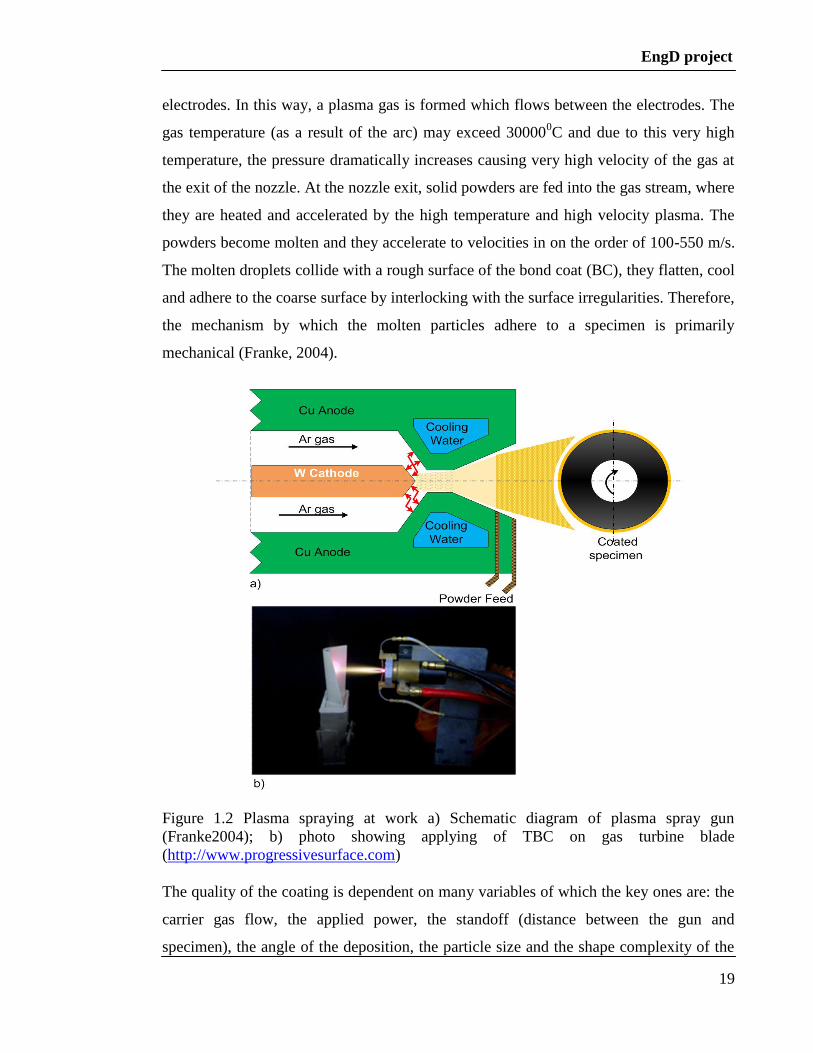
electrodes. In this way, a plasma gas is formed which flows between the electrodes. The
gas temperature (as a result of the arc) may exceed 300000C and due to this very high
temperature, the pressure dramatically increases causing very high velocity of the gas at
the exit of the nozzle. At the nozzle exit, solid powders are fed into the gas stream, where
they are heated and accelerated by the high temperature and high velocity plasma. The
powders become molten and they accelerate to velocities in on the order of 100-550 m/s.
The molten droplets collide with a rough surface of the bond coat (BC), they flatten, cool
and adhere to the coarse surface by interlocking with the surface irregularities. Therefore,
the mechanism by which the molten particles adhere to a specimen is primarily
mechanical (Franke, 2004).
Figure 1.2 Plasma spraying at work a) Schematic diagram of plasma spray gun
(Franke2004); b) photo showing applying of TBC on gas turbine blade
(http://www.progressivesurface.com)
The quality of the coating is dependent on many variables of which the key ones are: the
carrier gas flow, the applied power, the standoff (distance between the gun and
specimen), the angle of the deposition, the particle size and the shape complexity of the
EngD project
20
specimen. The deposition efficiency of the coating is influenced by the particle size
distribution, the rate of heating and acceleration and also the surrounding temperature
(Chen 2001).
For coating deposition Alstom Power Switzerland uses a technology called High
Velocity Oxygen Fuel Thermal Spray (HVOFTS) in which the gun has the ability to
increase the very high velocity of the plasma spray even more which helps to improve
the bonding of the coating (Dobbins et al 2003), (Gas Turbine Reconditioning,
www.alstom.com).
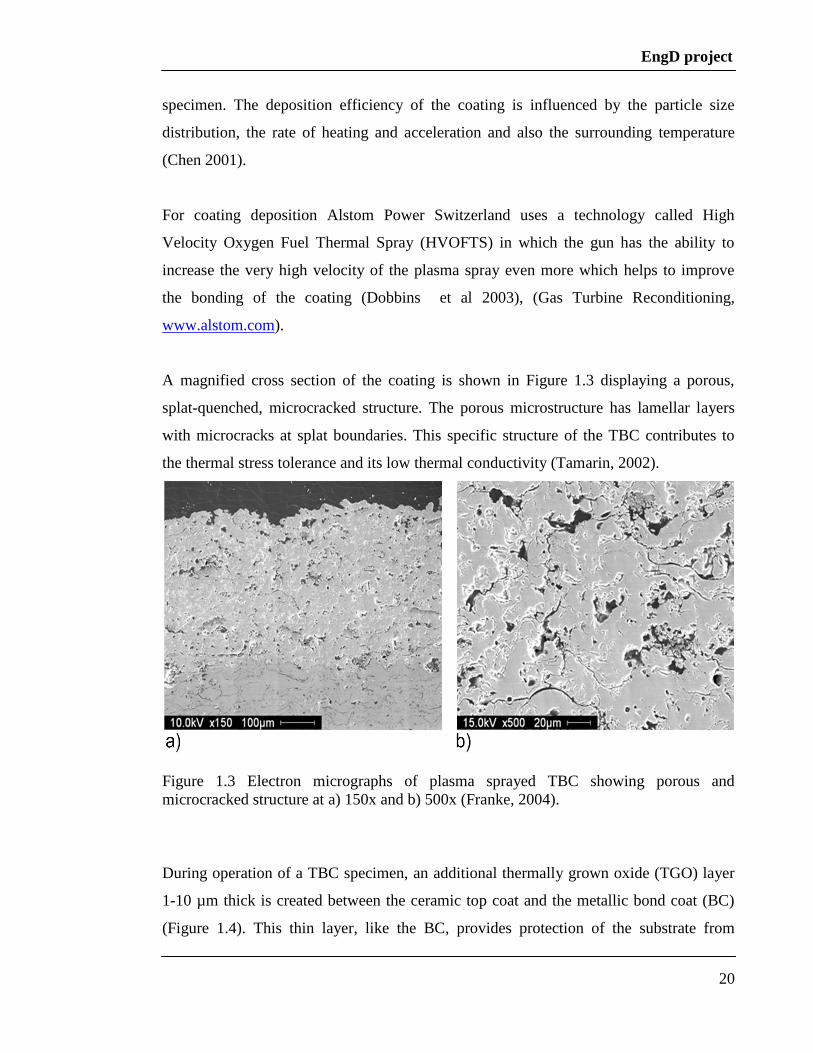
A magnified cross section of the coating is shown in Figure 1.3 displaying a porous,
splat-quenched, microcracked structure. The porous microstructure has lamellar layers
with microcracks at splat boundaries. This specific structure of the TBC contributes to
the thermal stress tolerance and its low thermal conductivity (Tamarin, 2002).
Figure 1.3 Electron micrographs of plasma sprayed TBC showing porous and
microcracked structure at a) 150x and b) 500x (Franke, 2004).
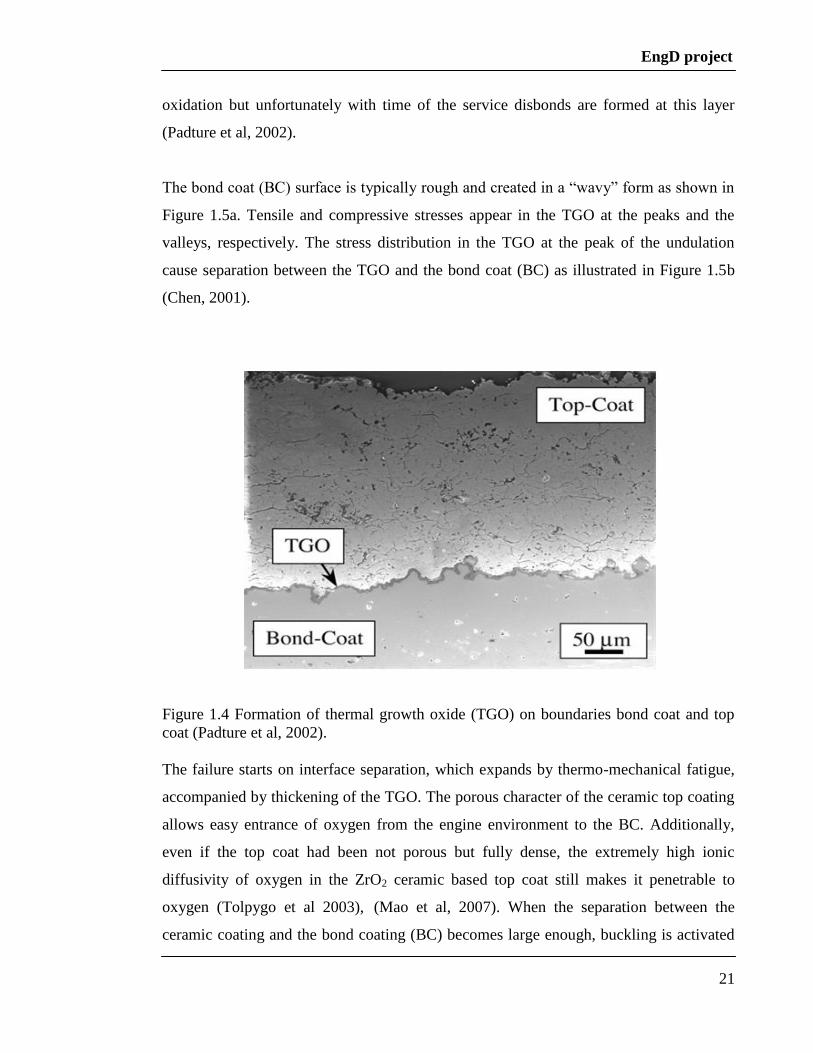
During operation of a TBC specimen, an additional thermally grown oxide (TGO) layer
1-10 µm thick is created between the ceramic top coat and the metallic bond coat (BC)
(Figure 1.4). This thin layer, like the BC, provides protection of the substrate from
EngD project
21
oxidation but unfortunately with time of the service disbonds are formed at this layer
(Padture et al, 2002).
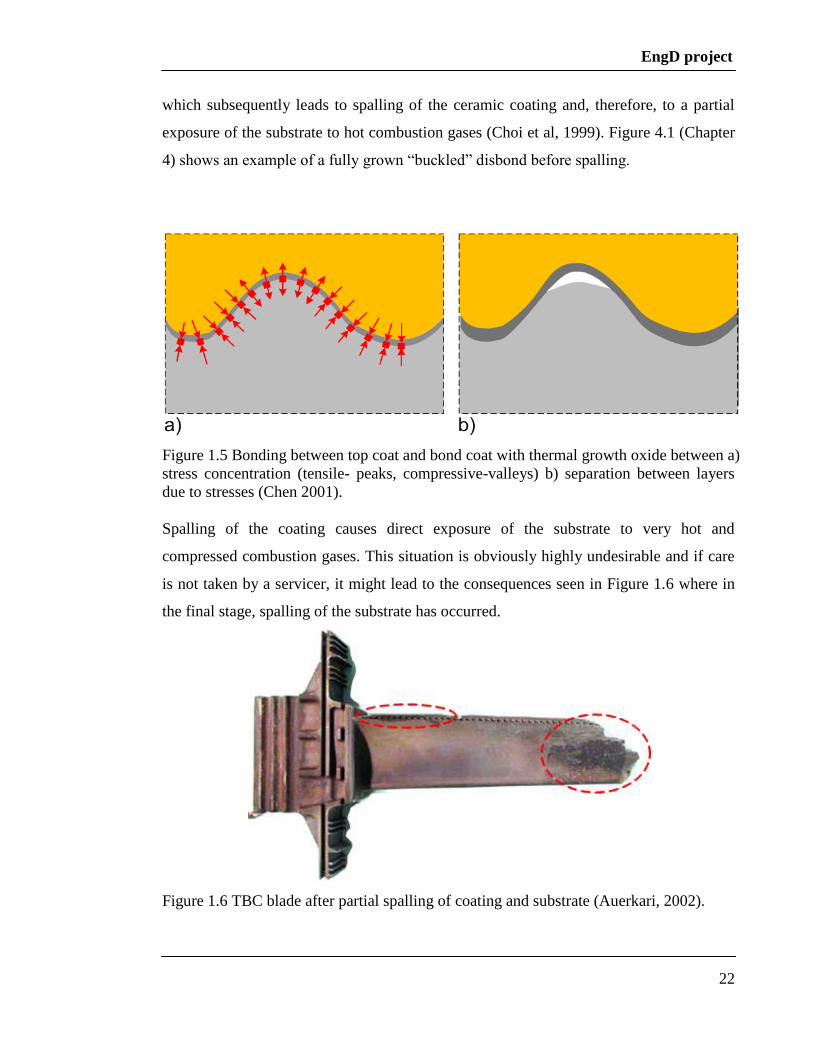
The bond coat (BC) surface is typically rough and created in a “wavy” form as shown in
Figure 1.5a. Tensile and compressive stresses appear in the TGO at the peaks and the
valleys, respectively. The stress distribution in the TGO at the peak of the undulation
cause separation between the TGO and the bond coat (BC) as illustrated in Figure 1.5b
(Chen, 2001).
Figure 1.4 Formation of thermal growth oxide (TGO) on boundaries bond coat and top
coat (Padture et al, 2002).
The failure starts on interface separation, which expands by thermo-mechanical fatigue,
accompanied by thickening of the TGO. The porous character of the ceramic top coating
allows easy entrance of oxygen from the engine environment to the BC. Additionally,
even if the top coat had been not porous but fully dense, the extremely high ionic
diffusivity of oxygen in the ZrO2 ceramic based top coat still makes it penetrable to
oxygen (Tolpygo et al 2003), (Mao et al, 2007). When the separation between the
ceramic coating and the bond coating (BC) becomes large enough, buckling is activated
EngD project
22
which subsequently leads to spalling of the ceramic coating and, therefore, to a partial
exposure of the substrate to hot combustion gases (Choi et al, 1999). Figure 4.1 (Chapter
4) shows an example of a fully grown “buckled” disbond before spalling.
Figure 1.5 Bonding between top coat and bond coat with thermal growth oxide between a)
stress concentration (tensile- peaks, compressive-valleys) b) separation between layers
due to stresses (Chen 2001).
Spalling of the coating causes direct exposure of the substrate to very hot and
compressed combustion gases. This situation is obviously highly undesirable and if care
is not taken by a servicer, it might lead to the consequences seen in Figure 1.6 where in
the final stage, spalling of the substrate has occurred.
Figure 1.6 TBC blade after partial spalling of coating and substrate (Auerkari, 2002).
EngD project
23
1.3 Alstom
Alstom is a large multinational concern in the power generation and transport sectors. A
part of the concern (Alstom Power) designs, manufactures, services and supplies
products and systems for the hydroelectric, wind, conventional and nuclear power sectors
(www.alstom.com).
One of the company activities is manufacturing and servicing gas power systems and its
branch located in Switzerland (Alstom Power Switzerland) focuses on the production and
the refurbishment of gas turbines.
The parts which see combustion gases of the highest enthalpy in a gas turbine are the first
stages of the guided (static) vanes and the blades locked to the rotor (Boyce, 2012).
Therefore, in order to protect the base metal of the blades, TBC is applied and this
operation is performed by the company during manufacture and blades can also be re-
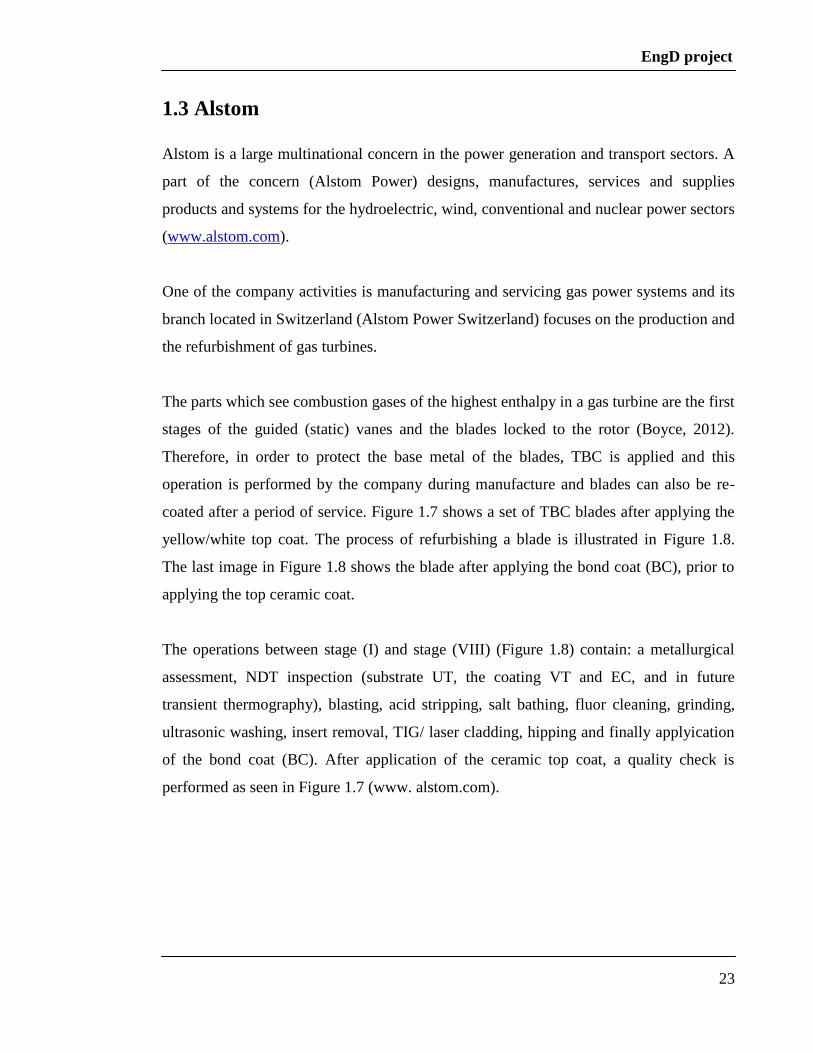
coated after a period of service. Figure 1.7 shows a set of TBC blades after applying the
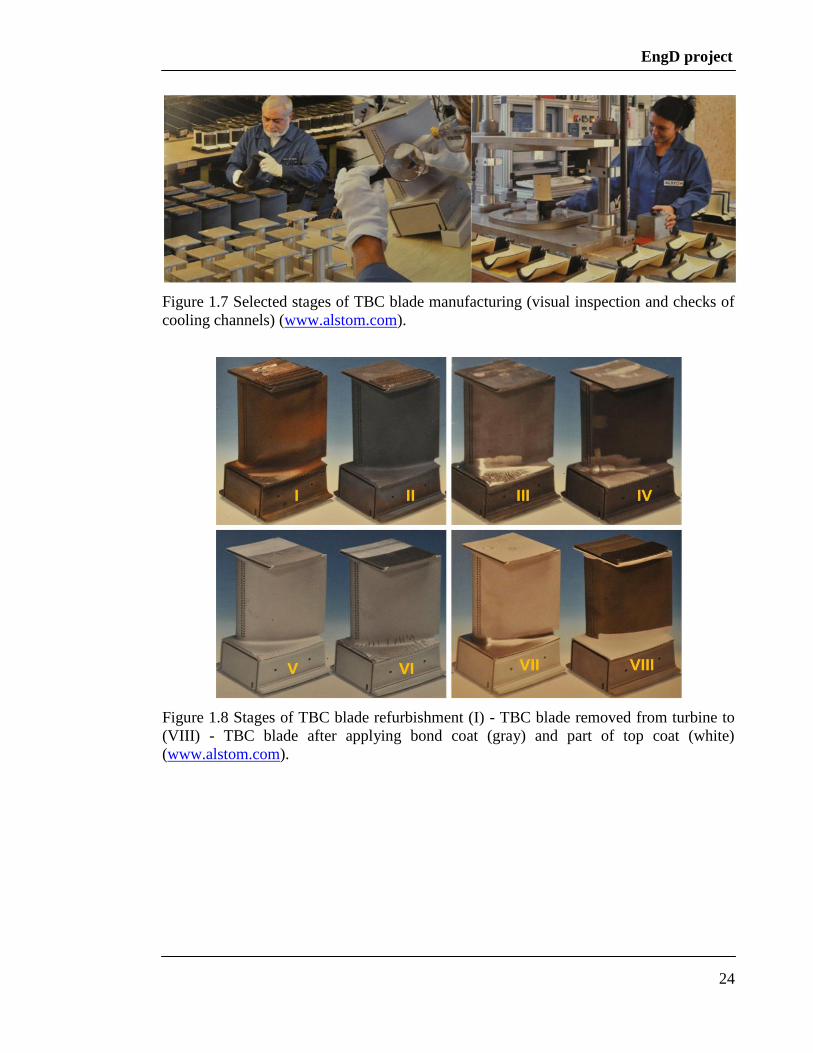
yellow/white top coat. The process of refurbishing a blade is illustrated in Figure 1.8.
The last image in Figure 1.8 shows the blade after applying the bond coat (BC), prior to
applying the top ceramic coat.
The operations between stage (I) and stage (VIII) (Figure 1.8) contain: a metallurgical
assessment, NDT inspection (substrate UT, the coating VT and EC, and in future
transient thermography), blasting, acid stripping, salt bathing, fluor cleaning, grinding,
ultrasonic washing, insert removal, TIG/ laser cladding, hipping and finally applyication
of the bond coat (BC). After application of the ceramic top coat, a quality check is
performed as seen in Figure 1.7 (www. alstom.com).
EngD project
24
Figure 1.7 Selected stages of TBC blade manufacturing (visual inspection and checks of
cooling channels) (www.alstom.com).
Figure 1.8 Stages of TBC blade refurbishment (I) - TBC blade removed from turbine to
(VIII) - TBC blade after applying bond coat (gray) and part of top coat (white)
(www.alstom.com).
EngD project
25
1.4 Motivation and project aims
Thermal barrier coatings (TBCs) on turbine blades are inspected at different stages of
their life. The techniques are applied for quality control during manufacture and also
during maintenance in order to make the “run/repair/replace” decision (Auerkari, 2003).
Typical defects targeted in any NDT inspection include original defects which appeared
during manufacturing and also defects emerging and growing during service which for
the TBC specimens is particularly critical due to contact with combustion gases of very
high enthalpy.
Three major NDT techniques are potentially applicable for industrial evaluation of TBC
systems: visual (VT), ultrasonic (UT) and eddy current technique (EC) (Heida, 2004).
Unfortunately, all of them have significant limitations for these specific systems.
The visual technique (VT) is obviously limited to the surface and here VT is very
strongly dependent on the diagnostic experience of the NDT technician. It is particularly
difficult to apply to TBC because its surface is rough and also discoloured (if in service).
Therefore, the location of disbonds which is the target of the project (explained later) is
almost impossible except when spalling of the TBC has occurred.
The application of UT is also limited for several reasons. Firstly, a couplant is usually
needed. However, the coating is not only rough but also its macrostructure is porous
which might cause partial filling of the coating by the couplant (Heida, 2004). The
porosity of the coating is used for the thermal resistance purposes; therefore the presence
of the couplant (very difficult to remove) is highly undesirable. Secondly, the porosity of
the coating causes high attenuation of the ultrasonic waves. The rise of the frequency
needed for the thin coating increases additionally attenuation. Thirdly, very often the
TBC coating is applied to a complex geometry such as a gas turbine blade; therefore,
coverage by the ultrasonic probe is significantly reduced (Heida, 2004).

EngD project
26
The application of Eddy Current (EC) is also limited. The disbonds which need to be
detected create a very thin discontinuity whose gap depends of the coating thickness and
it is usually a maximum of 10% of the coating thickness. However, very often the
thickness of the coating is not even; therefore, the combination of the uneven thickness
and the very discontinuity gap creates difficulties in the usage of lift-off from the
conducting substrate. The roughness of the TBC surface is also liable to cause erosion of
the EC probes and therefore makes it additionally difficult to control the lift off from the
surface. Although small EC probes might be able to access geometrically complex areas,
the small probe size means that scanning is very time-consuming.
The limitations of the major NDT techniques resulted in a search for a new NDT
technique applicable for efficient and quick detection of disbonds in TBC. One
promising possibility is transient thermography, also called pulse thermography and this
has been extensively researched in this work. Although the technique is relatively simple
in its principles, the specific nature of TBC causes certain complications. Its multilayered
structure, partial translucency to infrared light (IR), uneven energy absorption/emission,
and complexity in heat flow at a defect results in the risk of incorrect interpretations of
the results (Cielo, 1984), (Dallaire, 1985), (Maclachlan et al 1989), (Aamodt et al, 1990),
(Patel et al 1991), (Happlodt, 1994), (Shepard et al, 1995), (Ringermacher,2002), (Bison
et al 2003), (Shepard et al 2005), (Shepard, 2006), (Pickering et al 2007), (Sun, 2009),
(Larsen, 2011), (Ptaszek et al, 2011).
Alstom Power Switzerland (the sponsor of the project) as a manufacturer and a servicer
of TBC coated components is interested in applying transient thermography in order to
detect disbonds of minimum diameter d=2mm which are present in TBC coated gas
turbine blades, and are not willing to coat the surface with a black paint (commonly used
for this technique as equalizer and improver of absorptivity) for the inspection. The
chosen d=2mm is used by the sponsor as a threshold disbond above which the coating
needs to be locally removed and re-applied in order to avoid the problems described
earlier. In this thesis, the application of transient thermography to the detection of
EngD project
27
disbonds in TBC systems is investigated in detail and a set of improvements is proposed
in order to fulfill the sponsor requirements.
1.5 Thesis outline
In this chapter thermal barrier coatings (TBC) have been described together with a failure
mode of concern. The sponsoring company Alstom Power Switzerland has been
introduced and the targets for the EngD project have been stated.
Chapter 2 presents thermal techniques with particular emphasis on active thermography.
From the techniques, transient thermography (the sponsor‟s choice) is selected and
described with a detailed literature review. Firstly, its general usage is investigated
followed by the application of the technique to TBC components.
In chapter 3, two established theoretical approaches (one analytical and one numerical)
are investigated to predict the thermal responses from specimens receiving a short pulse
of thermal energy. Firstly, the analytical approach is described with information about its
limitations and secondly the numerical approach. Both investigated solutions are applied
in order to provide information about the temperature distribution in any specimen as a
function of time and depth. However, only the surface temperature distribution
(practically accessible) is used in all following chapters for a variety of computer and
practical scenarios with TBC specimens. Based on the surface temperature distribution,
two indicators of a defect are defined in this chapter, thermal contrast and application of
the 2nd
time derivative (Shepard et al 2006) to the surface cooling plotted on a log-log
scale.
Chapter 4 discusses the effects caused by different diameters and air gap thicknesses of a
defect on the thermal response by using computer simulations and experimental tests.
The chapter proposes artificial disbonds which provide more realistic thermal responses
than the signals from flat bottomed holes of the same sizes. The thermal responses from
the artificial disbonds are compared to the signals from real “buckled” disbonds using
computer simulations.

EngD project
28
Chapter 5 investigates by using computer simulations the effects on the thermal
responses from defective TBC systems caused by variables such as the thickness of the
coating, the thickness of the substrate and also the thermal conductivity of the coating.
In chapter 6, two specific features present during a transient thermography inspection of
any TBC system are discussed which are the partial translucency of the coating to IR
radiation and also the effect caused by the afterglow of the lamps used to heat the
testpiece. Additionally, the results from practical tests on TBC specimens are shown
where two different set ups were applied. The chapter indicates the most reliable set up
for performing the tests and also the image processing technique which reduces
misinterpretation of the thermal results.
In chapter 7, practical tests are performed by using the set ups from the previous chapter
where the effects on the surface thermal responses caused by discoloration of the TBC
are investigated by using a range of TBC specimens.
Finally in chapter 8, the conclusions and major contributions of the thesis are outlined.
2. Development of active thermography
29
Chapter 2
Development of active thermography
2.1 Introduction
IR active thermography, sometimes known as thermal imaging, is an example of
scientific usage of infrared radiation (IR) emitted by an object of interest. IR cameras are
able to detect radiation in the infra red range between 3-13µm and to generate images of
that radiation called thermograms. This specific form of radiation is created by an object
whose temperature is above absolute zero and the radiation is emitted from its surface or
just below it. The amount of this radiation depends on the object‟s temperature and
always increases with the temperature. Therefore, IR thermography is able to detect
variations in temperature. These variations in temperature always have their causes,
which makes IR thermography a powerful surveillance and a diagnostic tool (Maldague
2001).
Over its development IR thermography was divided into two categories, passive and
active thermography. Passive thermography does not require any energy source to excite
an inspected object. This type of thermography is used in many fields. For example, in
the medical field, infected parts of a body cause changes in blood circulation and
therefore, local changes of IR radiation appear. In the military field, it is used very often
to detect heat generating weapons in limited visibility. In general industrial application
2. Development of active thermography
30
passive thermography is used to search for any forms of heating leaks which can be
caused by various factors such as poor insulation or loose of electrical connections
(Gaussourgues, 1994).
This research focuses only on active thermography in which an object needs to be excited
in order to generate a thermal response which is subsequently detected by an IR camera.
Active thermography as an industrial diagnostic tool groups several NDT thermal
techniques. The techniques were separated due to various types of energy sources which
are used to excite a specimen. They are called:
short pulse (transient) thermography;
lock in thermography;
long pulse thermography;
laser spot thermography;
eddy current thermography;
thermosonics.
In transient thermography (TT), a short pulse of light is used to excite a specimen. The
pulse is converted into heat which propagates inside the specimen. Abnormalities inside
of the specimen disturb heat propagation which manifests itself in a local increase of IR
radiation above the abnormalities (Almond et al 1996).The technique is applicable for
detection of various types of defects which cause disturbance in heat propagation. It is
very suitable to detect delaminations in composite materials often inspected in the
aerospace sector or disbonds between different materials such as TBC rigidly bonded to a
substrate in the power sector. It is applicable also for detection of blockages present in
cooling channels of turbine blades (Maldague 2001) and also in detection of
delaminations in art work such as paintings or frescos (Lau et al, 1991a), (Lau et al,
1991b), (Queck et al, 2005), (Shepard et al, 2007a), (Shepard et al, 2006b). The
technique is described in more detail in the next section of the thesis due to its
application for disbond detection in TBC.
2. Development of active thermography
31
In lock in thermography, modulated optical energy is applied on a tested specimen. This
energy is converted into modulated heat which expresses itself as a modulated
temperature field. This field is recorded during deposition of energy. Heat in the form of
thermal waves propagates inside the specimen and the waves, like any other waves, are
reflected from any boundaries. The reflections from the boundaries cause modification of
the modulated temperature field on the surface. The phase angle between the original
temperature field and that modified by reflections is processed. Fourier analysis
performed on each recorded pixel provides the phase of the thermal response. Lock in
thermography is applicable for detection of the same types of abnormalities as transient
thermography (Busse et al, 1992a, Busse 1992b, Patel et al, 1987).
In long pulse thermography, a pulse of heating energy of duration above 1 sec is applied
on a tested surface. The thermal response from the surface is recorded during both the
heating and cooling regimes. Internal abnormalities cause local differences in the thermal
radiation from the tested surface between a defective and a sound region. The differences
in thermal radiation are present during both the heating and the cooling regimes. Like
transient and lock in long pulse thermography can be applicable for detection of
delaminations and disbonds in various types of materials. (Badgaish et al 2008a),
(Badgaish, 2008b).
In laser spot thermography, a pulse of light generated by a laser is applied to a surface
and converted into heat. This local heat application causes a lateral-radial heat flow. The
presence of an open crack causes perturbation in heat propagation due to the crack
thermal resistance. Therefore, the thermal radiation at the crack will be disturbed which
can be recorded by an IR camera. This technique is efficient for detection of small open-
to-surface cracks and it is applied for this purpose in turbine blade inspection (Rashed et
al, 2007, Weekes, 2011).
In thermosonics, a high power acoustic horn is typically used to excite a complex
vibration field. This field causes defect interfaces to rub and dissipate energy as heat.
Local increase in temperature at the testpiece surface is recorded by an IR camera. Here
2. Development of active thermography
32
similarly like for laser spot thermography, this technique is applicable for detection of
small open to surface cracks particularly in blades or impact damages in composites
(Morbidini et al, 2006a), (Morbidini, 2008b, Barden et al, 2007).
Eddy current thermography is a new NDT thermal technique for the detection of cracks
in electrically conductive materials. In this technique a specimen is heated by an
inductively generated current flow and the temperature profile generated on the surface
of the specimen is recorded with an IR camera. Cracks disturb the flow of the current in
the component and thus change the temperature distribution as well. Eddy current
thermography, like laser spot thermography and thermosonics is able to detect small
surface breaking cracks in materials which are electrically conductive (Weeks, 2007,
Oswald-Tranta, 2007, Zensiger et al 2007).
All thermal NDT techniques have advantages and also some disadvantages. In transient,
lock in, long pulse and eddy current thermography, physical contact of an energy source
with the testpiece is not necessary and during one test it is possible to inspect a relatively
large area. Thermosonics which requires a physical contact with a tested specimen allows
inspection of regions which are difficult to access by using other NDT techniques.
However, those regions must be accessible to an IR camera. Transient, lock in and long
pulse thermography are very useful for detection of disbonds and delaminations and very
poor at detection of open-to-surface cracks, in which thermosonics, laser spot
thermography and eddy current thermography are efficient.
It is worth mentioning that all NDT thermal techniques are very efficient in locating the
position of a defect on a tested surface. However, due to the complexity of heat
propagation inside of a material at a defect and the thermal radiation from the surface, all
NDT thermal techniques cause some difficulties in sizing of a defect (Maldague 2001).
2. Development of active thermography
33
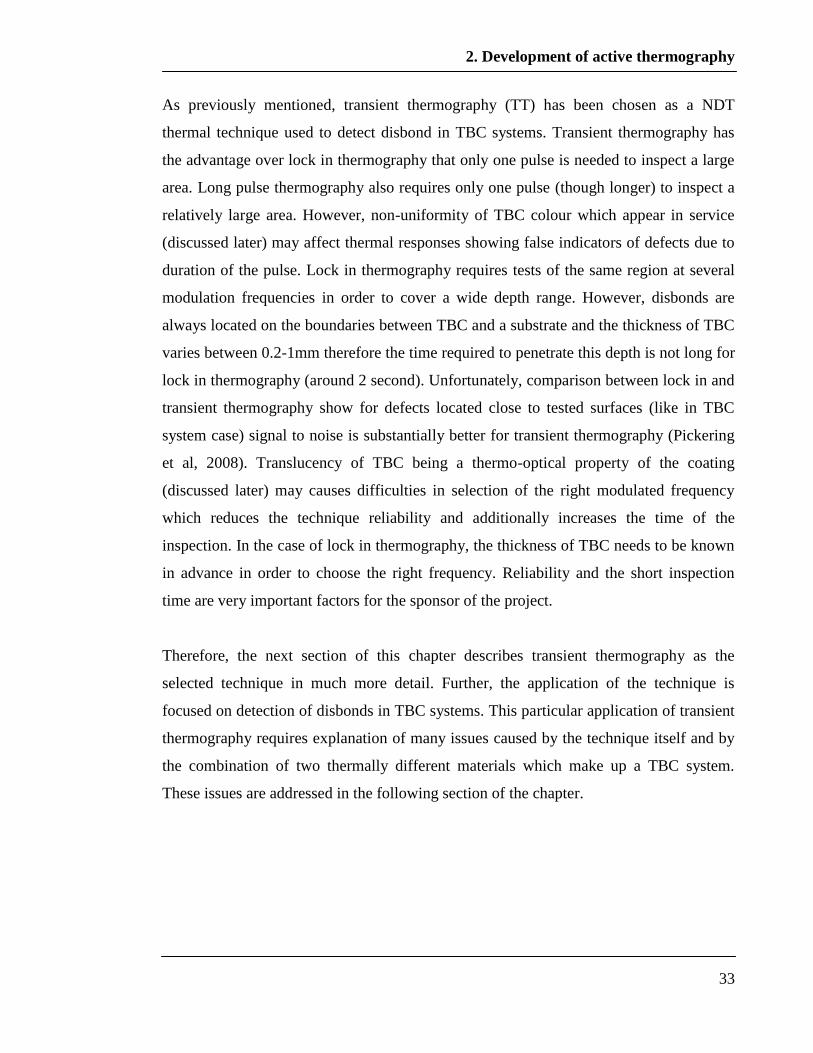
As previously mentioned, transient thermography (TT) has been chosen as a NDT
thermal technique used to detect disbond in TBC systems. Transient thermography has
the advantage over lock in thermography that only one pulse is needed to inspect a large
area. Long pulse thermography also requires only one pulse (though longer) to inspect a
relatively large area. However, non-uniformity of TBC colour which appear in service
(discussed later) may affect thermal responses showing false indicators of defects due to
duration of the pulse. Lock in thermography requires tests of the same region at several
modulation frequencies in order to cover a wide depth range. However, disbonds are
always located on the boundaries between TBC and a substrate and the thickness of TBC
varies between 0.2-1mm therefore the time required to penetrate this depth is not long for
lock in thermography (around 2 second). Unfortunately, comparison between lock in and
transient thermography show for defects located close to tested surfaces (like in TBC
system case) signal to noise is substantially better for transient thermography (Pickering
et al, 2008). Translucency of TBC being a thermo-optical property of the coating
(discussed later) may causes difficulties in selection of the right modulated frequency
which reduces the technique reliability and additionally increases the time of the
inspection. In the case of lock in thermography, the thickness of TBC needs to be known
in advance in order to choose the right frequency. Reliability and the short inspection
time are very important factors for the sponsor of the project.
Therefore, the next section of this chapter describes transient thermography as the
selected technique in much more detail. Further, the application of the technique is
focused on detection of disbonds in TBC systems. This particular application of transient
thermography requires explanation of many issues caused by the technique itself and by
the combination of two thermally different materials which make up a TBC system.
These issues are addressed in the following section of the chapter.

2. Development of active thermography
34
2.2 Transient thermography
This technique is used for the detection of defects located below the surface of a tested
specimen. Transient thermography is based on the effect created by a short optical pulse
of light applied to a specimen‟s surface. The emitted intensity of optical energy is in the
visible band (0.4-0.75 µm) with a small contribution from IR. The short pulse causes a
temperature rise on the specimen surface due to a photo-thermal effect and shortly
afterwards the temperature begins to decrease as an effect of the diffusion of the thermal
pulse inside the specimen. This effect can be seen as a “wave front” of heat which
diffuses from the surface into the material. If the material is homogenous the “wave front”
passes through uniformly but if on its way a defect appears such as a delamination or a
disbond, the wave receives extra thermal impedance from the defect, which reduces the
cooling rate due to the diffusion process. In this situation, when a defect is located close
to the surface, it is possible to notice on the surface “a hot spot” meaning a place at
which the temperature is higher than its surroundings. When the surface is viewed by an
infrared camera the temperature difference is seen shortly after the deposition of the heat
pulse. Similarly on the opposite side of the specimen surface a defective area appears as a
“cold spot” because the defect delays the passage of the heat. The principles of the
technique can be seen in Figure 2.1 and are discussed in (Lau et al, 1991a), (Lau et al,
1991b), (Almond et al, 1993), (Queck et al, 2005), (Shepard et al, 2007), (Shepard et al,
2006).

2. Development of active thermography
35
disbond
Heat conduction
Lamps
IR camera
Pulse of Light
IR radiation
Figure 2.1 Basic principles of transient thermography shown on example of TBC system
containing disbond.
The increase of the temperature on the heated surface is proportional to the quantity of
energy which is applied and the thermal properties of the specimen surface. The
temperature contrast which is observed on the specimen surface due to the presence of a
defect is proportional to the size of the defect, its position in relation to the surface (best
parallel), its depth, its thickness, the initial temperature rise, the thermal properties of the
material (Almond et al, 1994), (Almond et al, 1995). These parameters change from one
specimen to another, and during a test IR variations from the surface are recorded after
the thermal transient has been applied (this issue is discussed in much more detail in
chapter 4). The temperature contrast due the presence of a defect may occur and be
recorded over time scales ranging from sub-millisecond to several seconds depending on
the material properties and thickness. In many cases, useful information from the
material surface is obtained within 500 ms so it is necessary to use a system which
acquires many sequential images over this time window (Maldague, 2001).
2. Development of active thermography
36
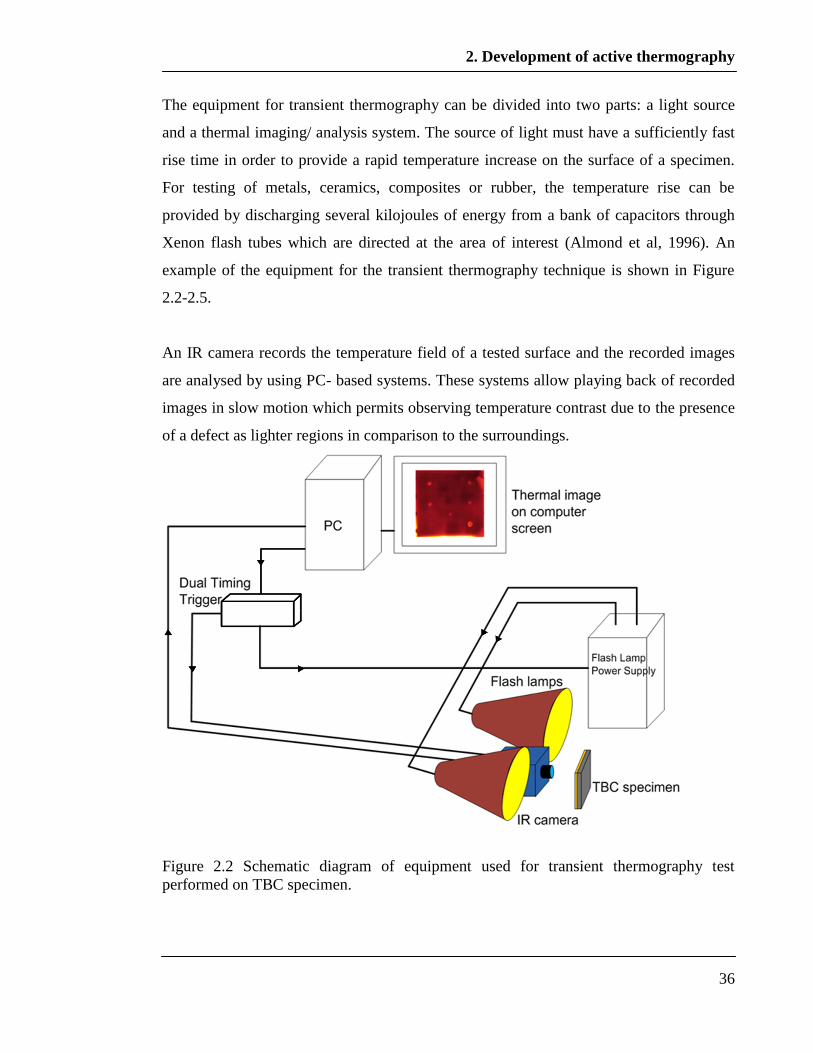
The equipment for transient thermography can be divided into two parts: a light source
and a thermal imaging/ analysis system. The source of light must have a sufficiently fast
rise time in order to provide a rapid temperature increase on the surface of a specimen.
For testing of metals, ceramics, composites or rubber, the temperature rise can be
provided by discharging several kilojoules of energy from a bank of capacitors through
Xenon flash tubes which are directed at the area of interest (Almond et al, 1996). An
example of the equipment for the transient thermography technique is shown in Figure
2.2-2.5.
An IR camera records the temperature field of a tested surface and the recorded images
are analysed by using PC- based systems. These systems allow playing back of recorded
images in slow motion which permits observing temperature contrast due to the presence
of a defect as lighter regions in comparison to the surroundings.
Figure 2.2 Schematic diagram of equipment used for transient thermography test
performed on TBC specimen.
2. Development of active thermography
37
Display
Control Interface
Electronics
PC
Flash head
IR Camera
Flash Lamp
Power Supply
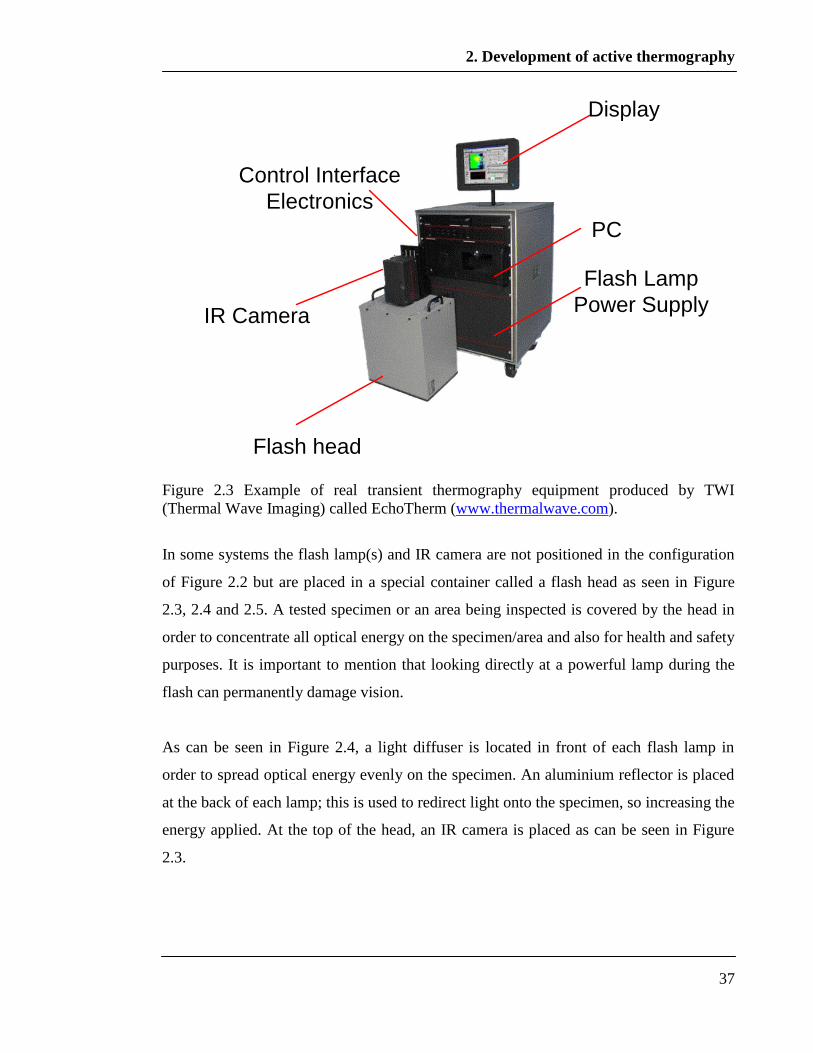
Figure 2.3 Example of real transient thermography equipment produced by TWI
(Thermal Wave Imaging) called EchoTherm (www.thermalwave.com).
In some systems the flash lamp(s) and IR camera are not positioned in the configuration
of Figure 2.2 but are placed in a special container called a flash head as seen in Figure
2.3, 2.4 and 2.5. A tested specimen or an area being inspected is covered by the head in
order to concentrate all optical energy on the specimen/area and also for health and safety
purposes. It is important to mention that looking directly at a powerful lamp during the
flash can permanently damage vision.
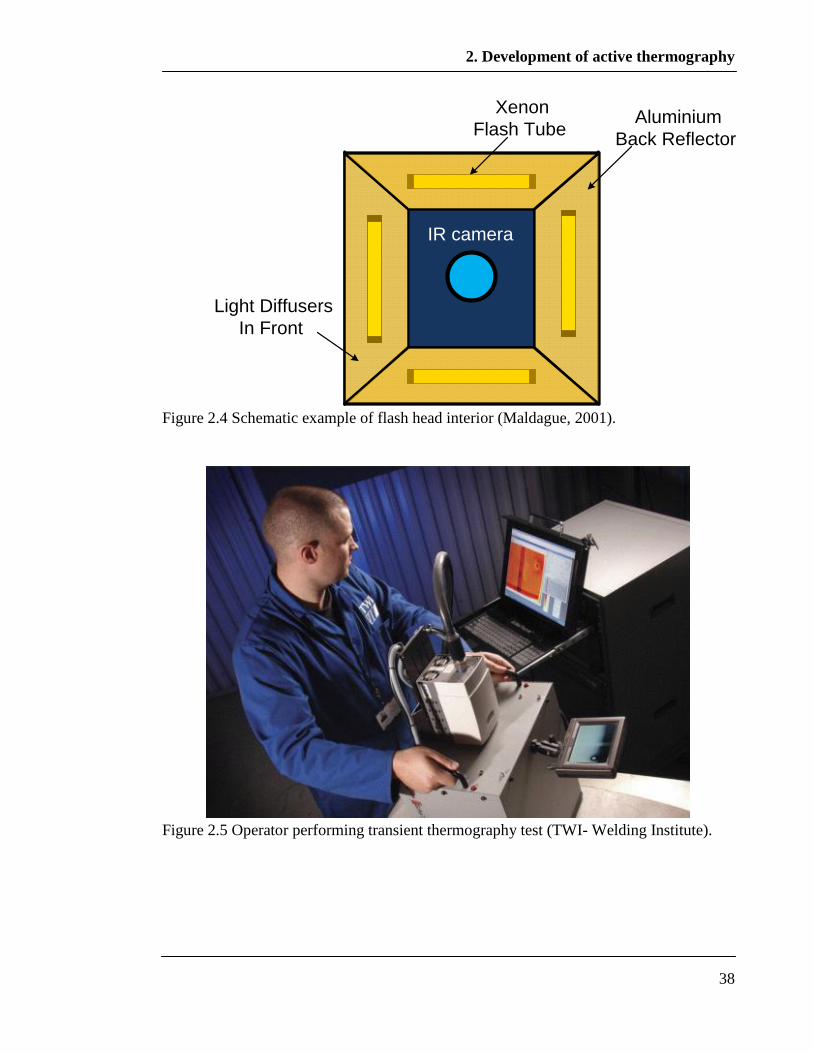
As can be seen in Figure 2.4, a light diffuser is located in front of each flash lamp in
order to spread optical energy evenly on the specimen. An aluminium reflector is placed
at the back of each lamp; this is used to redirect light onto the specimen, so increasing the
energy applied. At the top of the head, an IR camera is placed as can be seen in Figure
2.3.
2. Development of active thermography
38
Xenon
Flash Tube Aluminium
Back Reflector
IR camera
Light Diffusers
In Front
Figure 2.4 Schematic example of flash head interior (Maldague, 2001).
Figure 2.5 Operator performing transient thermography test (TWI- Welding Institute).
2. Development of active thermography
39
The sensitivity of the transient thermography technique can be expressed in terms of the
defect diameter/depth ratio required for the defect to be detected. This sensitivity is
related to material properties and must be determined practically using specially
fabricated test plates (discussed in more detail in chapter 4). These reference plates
contain flat bottomed holes of different diameters located at different depths. Increasing
the depth of a defect reduces the thermal contrast on the surface between the defective
area and its surroundings. In general the best results are obtained when the maximum
possible amount of energy is applied on the surface of the specimen, though care must be
taken to avoid thermal damage (Meola, 2004).
There are many factors which need to be taken into consideration when transient
thermography is used. These factors can be categorised as characteristics of the IR
camera, the thermal properties of tested material and the characteristic of the flash source
(Bison et al, 2006).
2.2.1 Characteristics of IR cameras
The IR camera used during the inspection must be able to detect temperature differences
on a tested surface caused by presence of a defect. This characteristic is described as the
temperature sensitivity which is a measure of the smallest temperature difference a
camera is able to detect. This sensitivity must be greater than the temperature differences
generated on the surface between a defect and a sound region (Vavilov, 2007). The
sensitivity of cooled IR cameras is in the range 8-80mK and typically 20 mK. For
uncooled IR cameras (bolometers) the sensitivity is above 80 mK (Maldague, 2001).
Another parameter which describes an IR detector is acquisition rate, sometimes known
as sampling rate or video frame rate. This parameter needs to be adjusted to the thermal
diffusivity of the tested material (discussed later in the section) and it varies between 30-
400 Hz. The higher the thermal diffusivity, the higher sampling rate is required.
2. Development of active thermography
40
The image pixel resolution is a measure of the physical area which is displayed by an
individual pixel. A defect must have an area of minimum one pixel in order to be
detected. The resolution used for transient thermography purposes is typically 640 x 480
pixels but it could be 640 x 512 pixels. For the IR bolometers the resolution is typically
320 x 240 pixels (www.flir.com).
The spectral range of IR detectors is a parameter which shows in which band the camera
is able to detect a thermal signal. IR cameras are separated into mid wavelength 3.4-5.2
µm, long wavelength 7.7-10.5 µm and bolometers 8-13 µm (Maldague, 2001).
IR cameras also vary in size and weight, which is a very important factor when access to
a specimen is limited. As an example, a microbolometer can have size less than
50x50x50mm and weight less than 150g; whereas, a precise cooled IR camera can have
size 3-4 times greater and weight several kilograms. However, it is important to
remember that bolometer sensitivity and resolution is much poorer in comparison to the
cooled IR cameras (Maldague, 2001).
2.2.2 Properties of tested materials
From the transient thermography perspective, a tested material can be described by a few
specific properties: emissivity, reflectivity, transmissivity, effusivity and diffusivity.
The emissivity (ε) is the relative ability of its surface to emit energy by radiation. It is the
ratio of energy radiated by a particular material to energy radiated by a black body at the
same temperature. A true black body would have ε = 1 while any real object would have
ε < 1. Emissivity is a dimensionless quantity. In general, the duller and blacker a material
is, the closer its emissivity is to 1. This is a surface property and surfaces with high
emissivity are the most attractive for transient thermography as the optical energy applied
is absorbed fully, after which the surface can emit thermal radiation.
2. Development of active thermography
41
The thermal reflectivity (r) determines the amount of energy which is absorbed by a
material. A low value of this parameter indicates that a large fraction of the incident
energy is absorbed.
The transmissivity (τ) indicates how much energy passes through a material. Almost all
materials tested by transient thermography are significantly opaque to energy being
applied so they do not transmit radiation (transmissivity τ =0).
The thermal emissivity, reflectivity and transmissivity of a surface are related through:
ɛ+r+τ=1 (2.1)
(Ammirato, 1999).
For τ=0 equation 2.1 becomes
r=1-ɛ (2.2)
Based on Kirchoff‟s law (Cengel, 1998)
ɛ(T)=a(T) (2.3)
where (a) is the material absorptivity and T is temperature.
Many surfaces reflect a high proportion of the incident illumination. Therefore, only a
small proportion of the incident light is absorbed and converted to heat (ɛ <<1). The
emissivity can be not only much less than unity but its value can also vary across the
same surface. As a solution to both these issues, surfaces which are inspected by using
transient thermography are very often covered by black paint. This paint increases and
equalizes emissivity and therefore it substantially reduces the reflectivity of the surface.
The thermal diffusivity (m2/s) is a measure of the material thermal inertia and is
described by:
(2.4)
where k is thermal conductivity (W/mK), ρ is density (kg/m3), cp is heat capacity (J/kgK).
2. Development of active thermography
42
The higher the value of thermal diffusivity, the shorter time it takes for energy to diffuse
through a material. This parameter affects the required sampling rate of the IR camera
(discussed above) which needs to be high for highly diffusive materials. The total
sampling time required to allow for diffusion to the back wall of a layer is specified by:
(2.5)
where L is the thickness of the layer and is the thermal diffusivity (Maldague, 2001),
(Krapez et al, 1994).
Thermal effusivity (e) (J/m2K
2s
0.5) is a measure of the ability of a material to exchange
thermal energy with its surroundings and is described by:
(2.6)
Low values of effusivity lead to high surface temperatures after the pulse deposition
(Almond et al, 1996).
2.2.3 Characteristics of flash sources
The optical pulse of light is generated by a capacitor discharge; therefore it is not an ideal
Dirac delta pulse because it has duration which contains a period of dramatic increase
and a period of exponential decay (a tail) which can be as long as 30 ms (Sun et al,
2005). It was found that by using a flash controller to shorten the length of the tail, better
temperature responses were obtained (Lhota et al, 2005), (Netzelmann, 2001). Of course
reduction of the tail also causes a reduction of the energy applied on a specimen;
therefore it is important to check the performance of a flash system on an appropriate test
specimen containing artificial defects (chapter 4). Additionally, when the flash lamp
filament is cooling after the pulse is switched off, it continues to radiate energy primarily
in the IR region. This is called the after-glow effect; if the reflectivity is non-zero, some
of this radiation is reflected from the specimen surface and can interfere with the emitted
radiation from the specimen caused by the pulse. Therefore, the IR camera does not

2. Development of active thermography
43
record the correct thermal radiation from the specimen caused by the response to the
pulse. This problem is discussed in more detail in chapter 5.
TBC systems pose particular difficulties for the application of transient thermography
and these are discussed in the next section.
2.3 Transient thermography for disbond detection in TBC
systems
As was mentioned in the previous section, a specimen which is tested by using transient
thermography is very often covered by a black paint. The black paint is used as an IR
anti-reflective layer which increases and equalises the emissivity/absorptivity of the
specimen‟s surface. Unfortunately, Alstom Power Switzerland states that TBC cannot be
painted for inspection because the paint contaminates the top zirconia coating which is
unacceptable. Lack of painting causes problems for disbond detection due to
translucency, the afterglow effect and effects of non uniform colour. Uneven thickness of
the top zirconia coat and difficulties with creating appropriate reference specimens make
application of transient thermography even more challenging (Cielo, 1984),
(Rousset,1985), (Dallaire, 1985), (Ahmed, 1987), (Cielo, 1987), (Morris, 1988),
(Maclachlan et al 1989), (Maclachlan Spicer, 1989), (Hartikainen,1989), (Ahmed, 1987),
(Aamodt et al, 1990), (Velinov, 1990), (Patel et al 1991), (Happlodt, 1994), (Houlbert,
1994), (Shepard et al, 1995), (Troitskii,1999), (Ringermacher,2002), (Bison et al 2003),
(Vavilov, 2005), (Shepard et al 2005), (Shepard, 2006), (Pickering et al 2007), (Sun,
2009), (Larsen, 2011), (Ptaszek et al, 2011), (Weeks, 2011).
An unpainted thermal barrier coating is partly translucent to visible, near and middle IR
radiation which is applied on it by the pulse during an inspection. This means that
transformation of the energy from the light pulse into heat does not happen only on the
TBC surface but in its volume as well. Similarly, the IR radiation from a TBC caused by
the pulse does not happen only from its surface but also from its volume and it depends
2. Development of active thermography
44
on the IR radiation wavelength (Abuhamad, 2010). This volumetric energy absorption
and emission reduces the cooling gradient inside the TBC. As a result, the lateral thermal
gradient between defective and non defective regions on the surface is also reduced,
which makes disbond detection more difficult. Because the IR emission from the TBC
volume depends on the IR wavelength, the wave length of an IR camera is also an
important factor in inspection of TBC. It has been shown that the commonly used middle
wave length IR cameras do not record thermal emission only from the TBC surface but
also from its volume. It has been shown that more reliable thermal images can be
achieved if an IR camera operates in a long wave length band width where the thermal
emission is recorded only from the surface (Shepard, 1995). Issues caused by
translucency of TBC are investigated in chapter 5 section 5.2.
However, the translucency of TBC decreases with time of service (Eldrige et al 2006);
the colour of the TBC surface changes non-uniformly (Shawkat, 2000). Some regions of
TBC keep their white/yellow colour and some parts significantly darken. It should be
recalled that a substantial amount of energy from the pulse is in the visible band width;
therefore these dark regions will absorb more energy than the bright regions. Because
bright regions will absorb more energy than the rest of the surface, they will also radiate
more energy. The increased radiation from the dark regions might be misinterpreted as a
defect because defective regions also radiate more IR due to reduction of heat
propagation inside of a TBC specimen (Bison et al, 2003). Therefore, in order to achieve
thermal images which allow clear distinction between a defective region and a sound
region even if the latter absorbed more energy than its surroundings, it is necessary to
apply an image processing technique. Various image processing techniques are available
for thermal images (Larsen, 2011). From available techniques, application of the 2nd
derivative processing to surface cooling on a log-log scale becomes particularly useful
due to differences in the thermal properties between the two layers which are rigidly
bonded to each other in a TBC system (Balageas, 2010), (Shepard et al, 2003), (Zhao et
al, 2011), (Shepard et al, 2006), (Kidd et al 2011),(Shepard et al 2007), (Sun,2009).
Differences in thermal conductivity between TBC and the substrate cause significant
2. Development of active thermography
45
changes in the surface cooling. Application of this signal processing technique is
explained in detail in chapters 4 and 5.
Thermal signals achieved during testing of unpainted TBC are also affected by the
presence of an afterglow effect. The flash tubes still radiate IR after the end of the
excitation pulse due to their high temperature. This radiation is reflected by an unpainted
TBC surface and it interferes with IR radiation from the surface which was caused by the
this reflected thermal signal can overwhelm the emitted signal. Therefore, the IR camera
does not detect solely the thermal response caused by the pulse (Maldague, 2001). One
solution which can eliminate this undesirable effect is application of a mechanical shutter
such as that developed by NASA (Ringermacher, 2005). This device consists of three
shutters for a typical system with two flash lamps: one shutter is for the IR camera and
two shutters are for the two flash lamps. The device operates in three steps during a test.
Before the flash, the camera shutter is open so the camera can take a few pre-excite
images. During the flash the lamp shutters are open and the camera shutter is closed;
after the flash the camera shutter is open and the flash shutters are closed. Therefore, it is
possible by applying the shutters to use visible and IR light from the pulse, avoid residual
IR radiation from the lamps and also protect the IR camera from the powerful pulse,
which reduces aging of the camera. However, this device must be extremely precisely
made because the shutter action must by synchronised and the time which is available for
the operations is measured in milliseconds. Another much cheaper and simpler solution
to remove the afterglow effect is to apply a glass filter (Sun, 2009). The optical filter
covers the flash lamp and allows only visible wavelengths to reach the specimen by
blocking the IR radiation. Of course, the mechanical shutter device or the glass filter are
not only limited to TBC but are also applicable to other materials in which a significant
amount of applied energy is reflected. The practical usage of a glass filter is explained in
detail in chapter 5, section 5.3.
The technological process of TBC plasma spraying on the complex geometry of a blade
always causes some inaccuracy in the thickness of the coating (Silviero, 2008).
Additionally, the process of TBC erosion in service causes local reduction of the coating
2. Development of active thermography
46
thickness (Nicholls et al, 2003). Unfortunately, uneven thickness of TBC also affects
thermal responses because after applying of the energy pulse, the propagating heat front
in a thin and thick coating will have different distance to reach the highly conductive
substrate. For the thin coating this distance is shorter which result in much faster decay
of the thermal signal emitted from the surface below which the coating is thin in
comparison to the thermal signal from the surface below the coating is thick. These
differences in magnitude of the thermal signals from two areas of different thickness
might indicate a disbond even if a bond between the coating and the substrate is sound
(Bison et al, 2003). Additionally, the substrate thickness is also not constant in a blade
due to the presence of cooling channels. Therefore, different volumes of substrate below
the coating might also affect the thermal response which becomes particularly important
if the coating above is thin.
Inaccuracy during the process of TBC plasma spraying can also introduce pores inside
the coating. Like disbonds, the pores disturb heat propagation and therefore they might
indicate the presence of disbonds where the bond between the coating and the substrate is
sound (Zhao et al, 2011). The effects of TBC thickness and substrate variation on thermal
responses are investigated in chapter 3, section 3.4.
Like other NDT techniques, transient thermography requires reference test specimens for
calibration. Unfortunately, real disbonds are very difficult to use because it is very
difficult to control their size, and large disbonds tends to spall. Flat bottom holes are
commonly used, but they over estimate the thermal contrast obtained for a defect of a
given diameter (Almond, 1995) (Ptaszek et al 2011). The reasons for this overestimation
and a proposal for an artificial disbond as a more accurate representation of a real
disbond are discussed in chapter 4.
2. Development of active thermography
47
2.4 Conclusions
In this chapter, IR thermography was introduced and differences between active and
passive thermography were shown. Selected NDT thermal techniques were briefly
described together with their advantages and disadvantageous. Transient thermography
has been selected for detection of disbonds in TBC systems and the reasons for this
choice were given. The principles of this technique were described in detail together with
the equipment used during the inspection. The chapter listed a number of major
difficulties which face transient thermography applied to TBC systems. The difficulties
which are related to the translucency of TBC, the afterglow effect, non–uniform colour
of TBC in service, the effect of TBC and substrate thickness, porosity of TBC and
selection of appropriate calibration specimens were briefly described. Currently
applicable solutions to these difficulties were also presented.
The subject of this thesis is to investigate in detail the impact of these difficulties and
also to propose improved solutions which make application of the technique to disbond
detection in TBC more reliable.
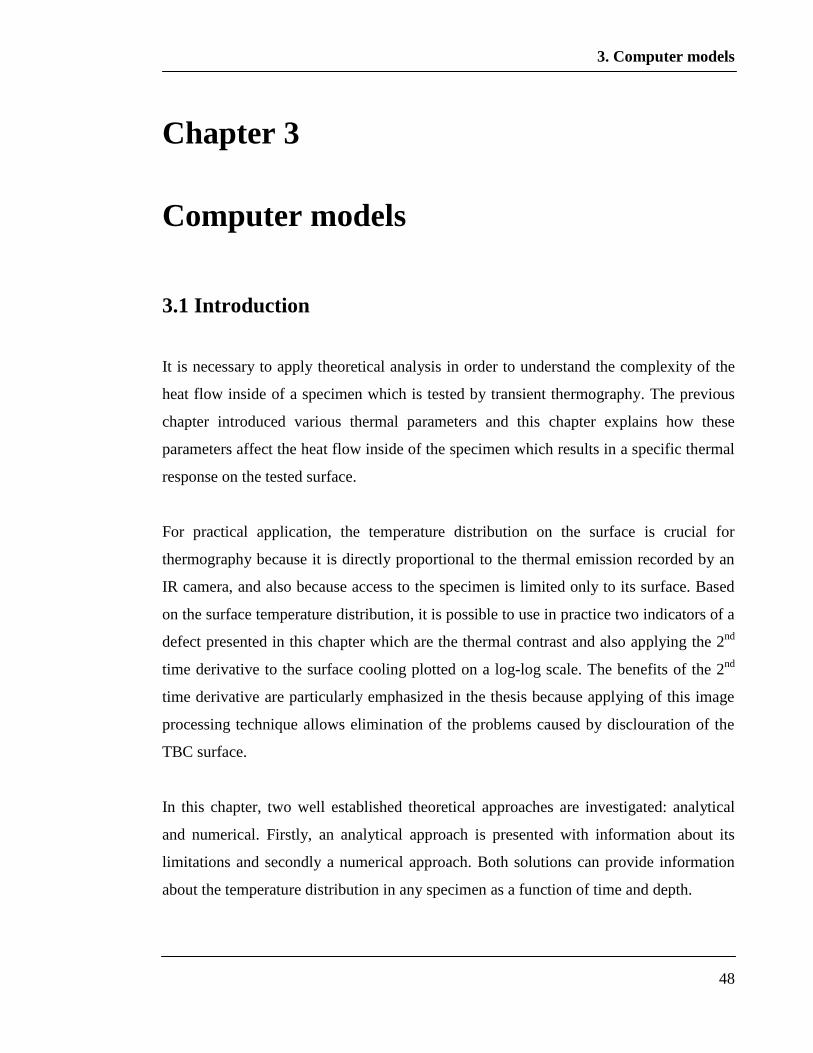
3. Computer models
48
Chapter 3
Computer models
3.1 Introduction
It is necessary to apply theoretical analysis in order to understand the complexity of the
heat flow inside of a specimen which is tested by transient thermography. The previous
chapter introduced various thermal parameters and this chapter explains how these
parameters affect the heat flow inside of the specimen which results in a specific thermal
response on the tested surface.
For practical application, the temperature distribution on the surface is crucial for
thermography because it is directly proportional to the thermal emission recorded by an
IR camera, and also because access to the specimen is limited only to its surface. Based
on the surface temperature distribution, it is possible to use in practice two indicators of a
defect presented in this chapter which are the thermal contrast and also applying the 2nd
time derivative to the surface cooling plotted on a log-log scale. The benefits of the 2nd
time derivative are particularly emphasized in the thesis because applying of this image
processing technique allows elimination of the problems caused by disclouration of the
TBC surface.
In this chapter, two well established theoretical approaches are investigated: analytical
and numerical. Firstly, an analytical approach is presented with information about its
limitations and secondly a numerical approach. Both solutions can provide information
about the temperature distribution in any specimen as a function of time and depth.
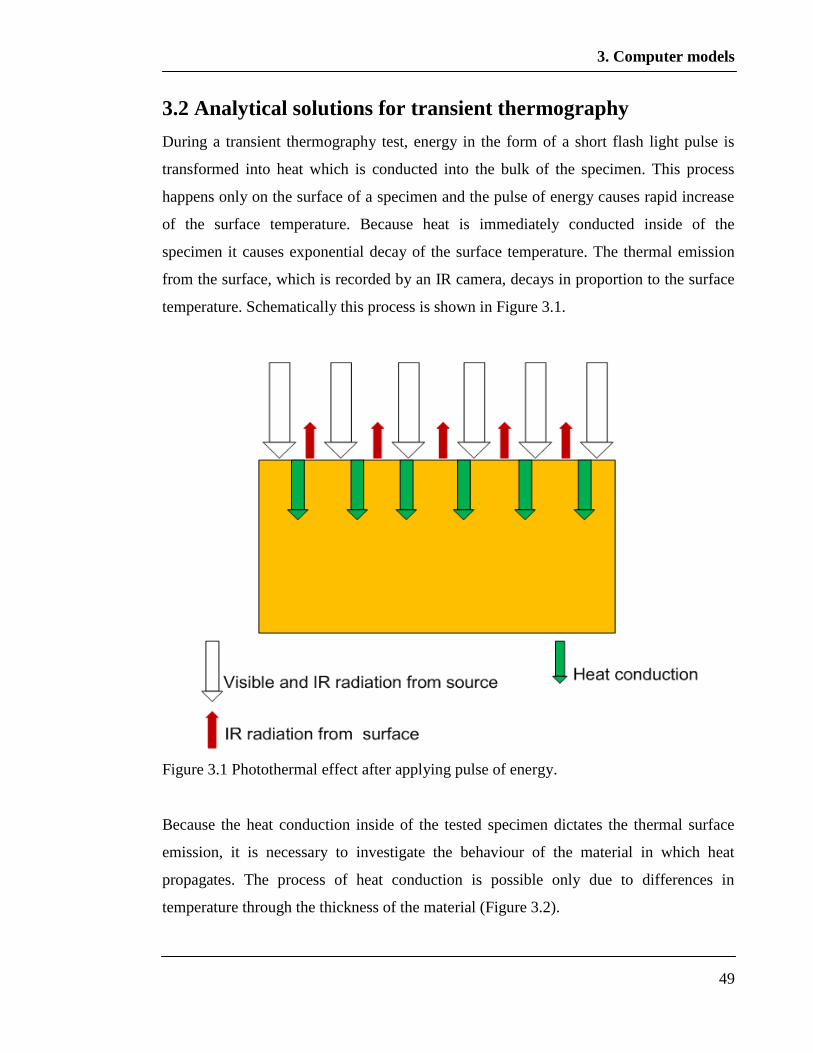
3. Computer models
49
3.2 Analytical solutions for transient thermography
During a transient thermography test, energy in the form of a short flash light pulse is
transformed into heat which is conducted into the bulk of the specimen. This process
happens only on the surface of a specimen and the pulse of energy causes rapid increase
of the surface temperature. Because heat is immediately conducted inside of the
specimen it causes exponential decay of the surface temperature. The thermal emission
from the surface, which is recorded by an IR camera, decays in proportion to the surface
temperature. Schematically this process is shown in Figure 3.1.
Figure 3.1 Photothermal effect after applying pulse of energy.
Because the heat conduction inside of the tested specimen dictates the thermal surface
emission, it is necessary to investigate the behaviour of the material in which heat
propagates. The process of heat conduction is possible only due to differences in
temperature through the thickness of the material (Figure 3.2).
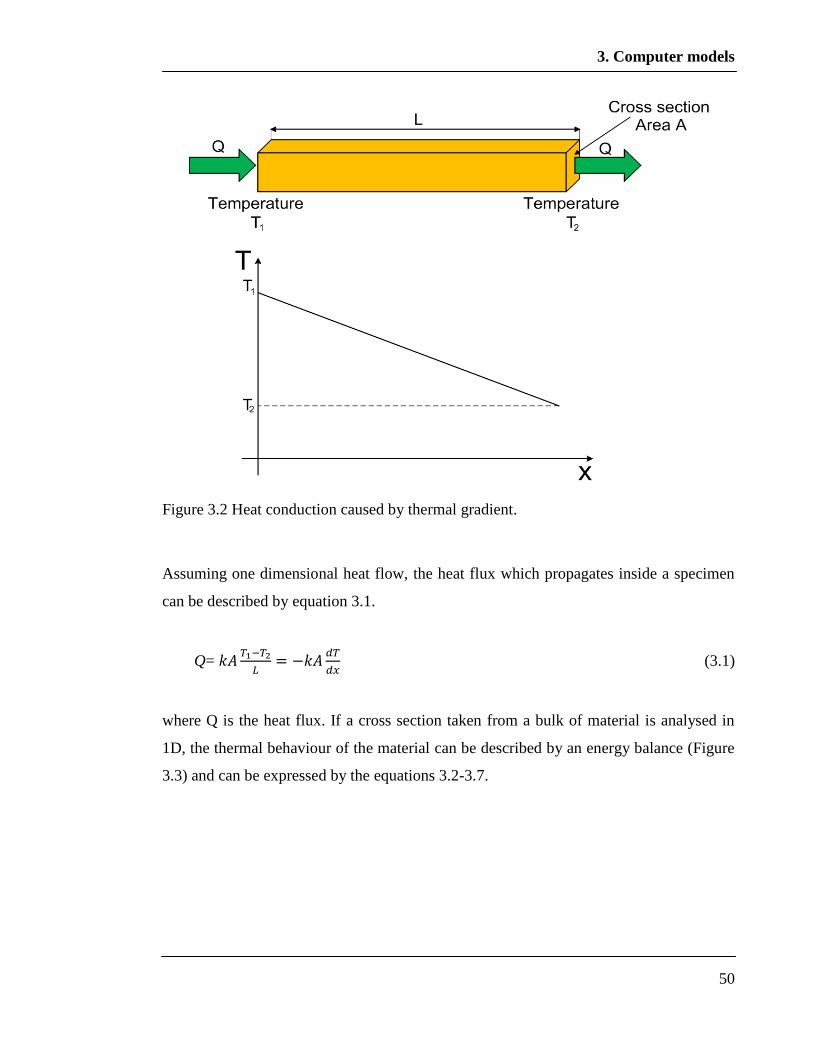
3. Computer models
50
Figure 3.2 Heat conduction caused by thermal gradient.
Assuming one dimensional heat flow, the heat flux which propagates inside a specimen
can be described by equation 3.1.
Q=
(3.1)
where Q is the heat flux. If a cross section taken from a bulk of material is analysed in
1D, the thermal behaviour of the material can be described by an energy balance (Figure
3.3) and can be expressed by the equations 3.2-3.7.
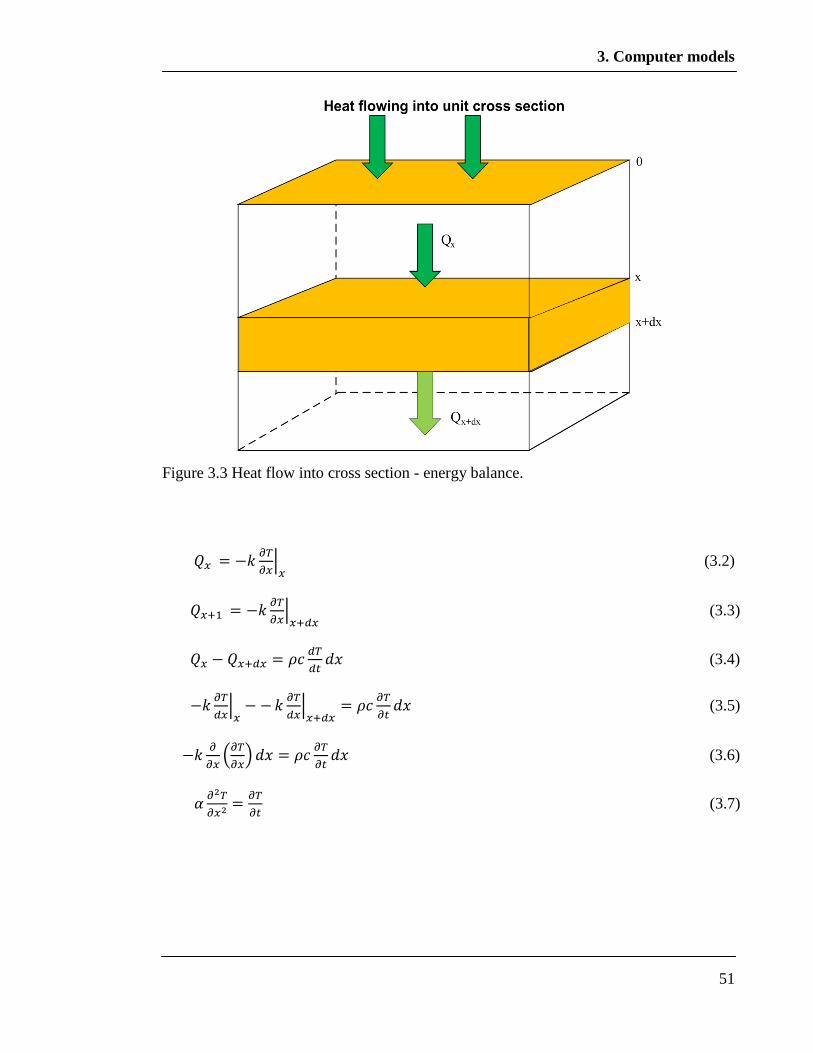
3. Computer models
51
Figure 3.3 Heat flow into cross section - energy balance.
(3.2)
(3.3)
(3.4)
(3.5)
(3.6)
(3.7)
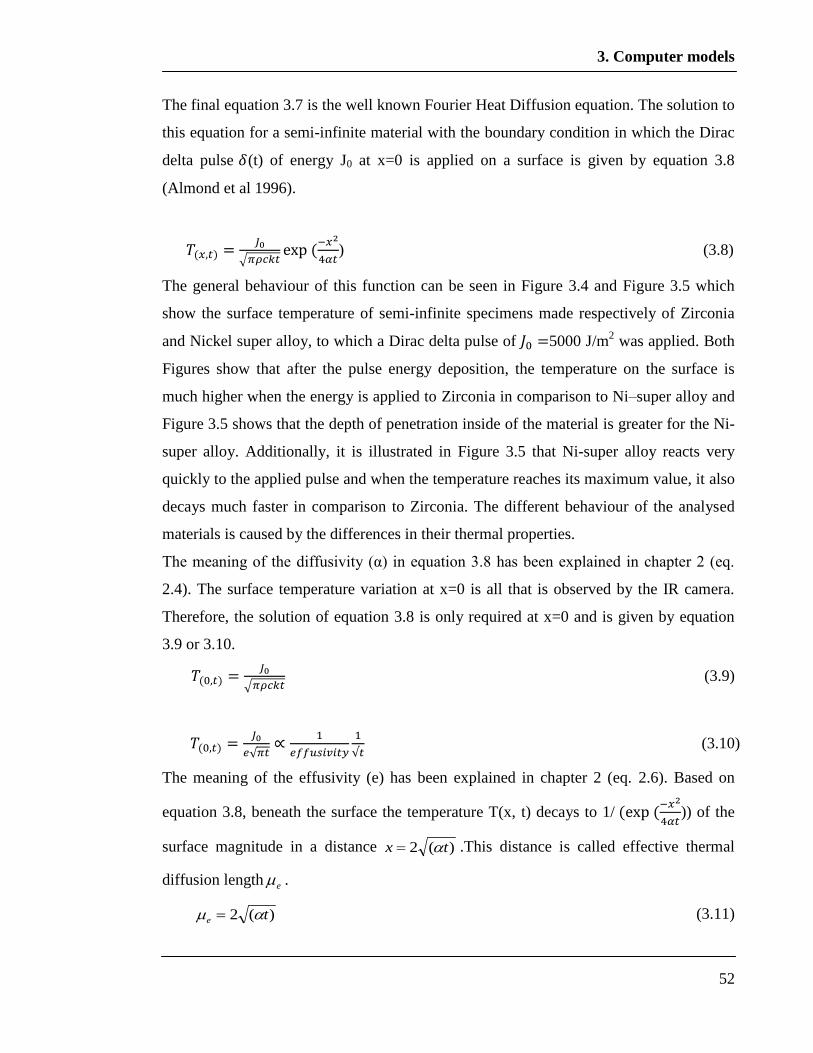
3. Computer models
52
The final equation 3.7 is the well known Fourier Heat Diffusion equation. The solution to
this equation for a semi-infinite material with the boundary condition in which the Dirac
delta pulse (t) of energy J0 at x=0 is applied on a surface is given by equation 3.8
(Almond et al 1996).
) (3.8)
The general behaviour of this function can be seen in Figure 3.4 and Figure 3.5 which
show the surface temperature of semi-infinite specimens made respectively of Zirconia
and Nickel super alloy, to which a Dirac delta pulse of 5000 J/m2 was applied. Both
Figures show that after the pulse energy deposition, the temperature on the surface is
much higher when the energy is applied to Zirconia in comparison to Ni–super alloy and
Figure 3.5 shows that the depth of penetration inside of the material is greater for the Ni-
super alloy. Additionally, it is illustrated in Figure 3.5 that Ni-super alloy reacts very
quickly to the applied pulse and when the temperature reaches its maximum value, it also
decays much faster in comparison to Zirconia. The different behaviour of the analysed
materials is caused by the differences in their thermal properties.
The meaning of the diffusivity (α) in equation 3.8 has been explained in chapter 2 (eq.
2.4). The surface temperature variation at x=0 is all that is observed by the IR camera.
Therefore, the solution of equation 3.8 is only required at x=0 and is given by equation
3.9 or 3.10.
(3.9)
(3.10)
The meaning of the effusivity (e) has been explained in chapter 2 (eq. 2.6). Based on
equation 3.8, beneath the surface the temperature T(x, t) decays to 1/
)) of the
surface magnitude in a distance )(2 tx .This distance is called effective thermal
diffusion length e .
)(2 te (3.11)
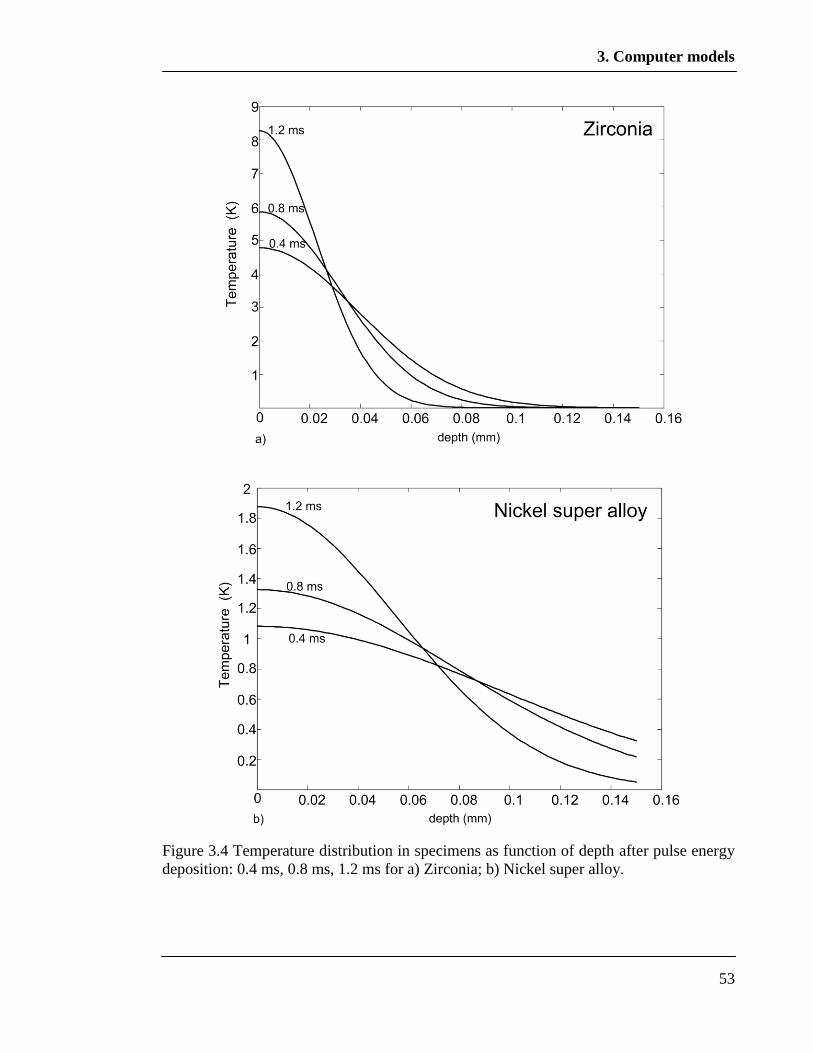
3. Computer models
53
Figure 3.4 Temperature distribution in specimens as function of depth after pulse energy
deposition: 0.4 ms, 0.8 ms, 1.2 ms for a) Zirconia; b) Nickel super alloy.

3. Computer models
54
Figure 3.5 Temperature distribution in specimens as function of time after pulse energy
at depths: 0.1mm, 0.2 mm, 0.4 mm for a) Zirconia; b) Nickel super alloy.
3. Computer models
55
This parameter gives information about the depth of penetration of the thermal energy. In
transient thermography, the short time behaviour is dominated by the fastest propagating,
high frequency components of the pulse and the longer time behaviour by the slower low
frequency components. Therefore, specimens can be treated as low frequency filters
because the high frequency components are heavily attenuated as the energy propagates
(Almond et al, 1996).
Because transient thermography is applied to a large variety of materials, knowledge
about their thermal properties as was seen previously is necessary for predictions of their
behaviour after the pulse. For example, the diffusivity (α) dictates the rate of the surface
thermal response and the effusivity (e) governs the ease of surface heating and also
defect sensitivity (Almond et al, 1996). Table 3.1 presents the thermal properties of some
solid materials commonly used in transient thermography and also air which often fills
defects present in tested specimens.
Due to the exponential decay of surface temperature caused by the pulse it is more
practical to plot the surface temperature on a log-log scale. If the log-log scale is applied
to equation 3.10 it is easy to see that the surface cools with a constant gradient, -0.5 and
the maximum temperature which a material gains depends on the material effusivity. An
increment of this parameter results in a lower temperature on the surface caused by the
pulse. Here there are clear distinctions between metals and non-metals, which is
demonstrated in Figure 3.6.
A TBC system contains two thermally different solid materials in which Zirconia is a
thermally resistive ceramic and a nickel supper alloy which is a thermally conductive
metal. The thermal conductivity of nickel–super alloy is 7 times greater than Zirconia
(Table 3.1). It is explained later that this difference can be advantageously used for
application of transient thermography to TBC systems.
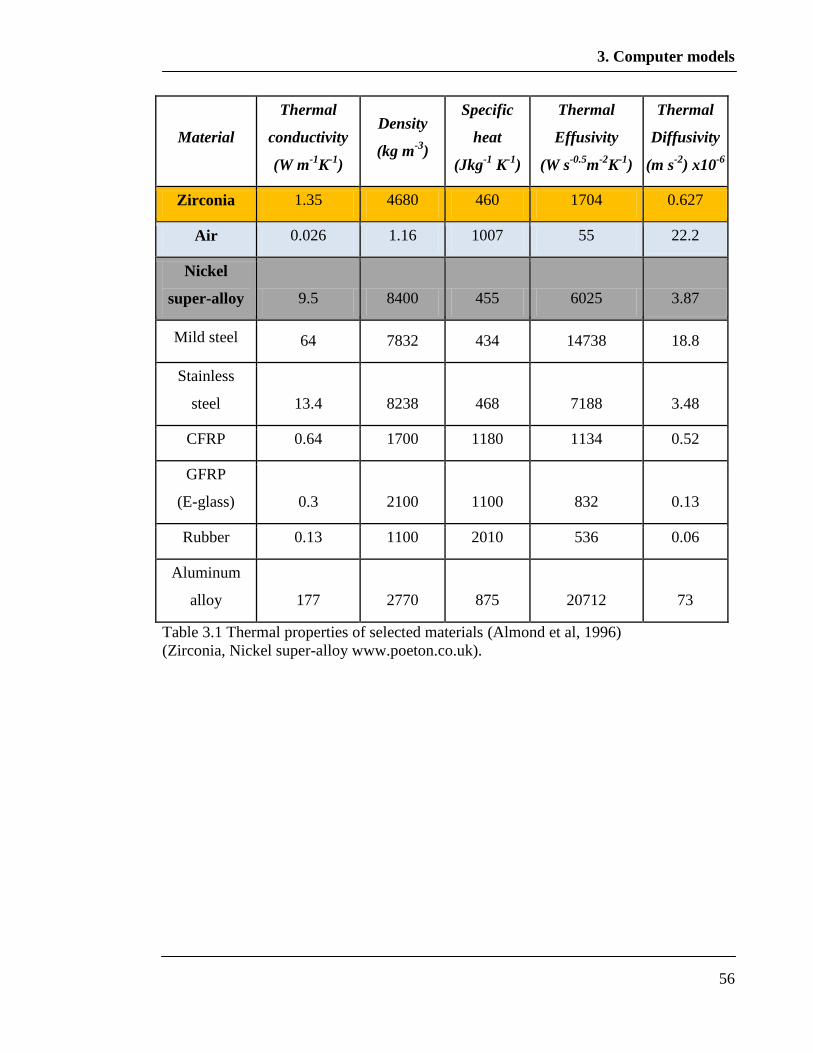
3. Computer models
56
Material
Thermal
conductivity
(W m-1
K-1
)
Density
(kg m-3
)
Specific
heat
(Jkg-1
K-1
)
Thermal
Effusivity
(W s-0.5
m-2
K-1
)
Thermal
Diffusivity
(m s-2
) x10-6
Zirconia 1.35 4680 460 1704 0.627
Air 0.026 1.16 1007 55 22.2
Nickel
super-alloy 9.5 8400 455 6025 3.87
Mild steel 64 7832 434 14738 18.8
Stainless
steel 13.4 8238 468 7188 3.48
CFRP 0.64 1700 1180 1134 0.52
GFRP
(E-glass) 0.3 2100 1100 832 0.13
Rubber 0.13 1100 2010 536 0.06
Aluminum
alloy 177 2770 875 20712 73
Table 3.1 Thermal properties of selected materials (Almond et al, 1996)
(Zirconia, Nickel super-alloy www.poeton.co.uk).
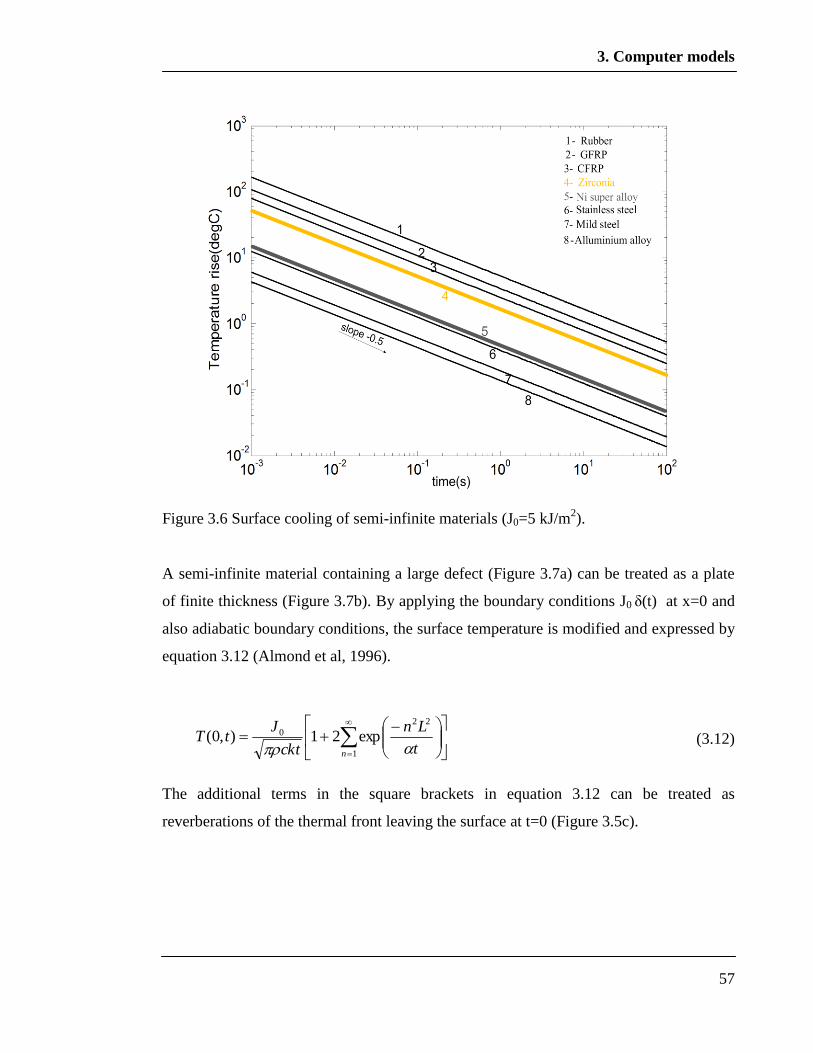
3. Computer models
57
Figure 3.6 Surface cooling of semi-infinite materials (J0=5 kJ/m2).
A semi-infinite material containing a large defect (Figure 3.7a) can be treated as a plate
of finite thickness (Figure 3.7b). By applying the boundary conditions J0 δ(t) at x=0 and
also adiabatic boundary conditions, the surface temperature is modified and expressed by
equation 3.12 (Almond et al, 1996).
(3.12)
The additional terms in the square brackets in equation 3.12 can be treated as
reverberations of the thermal front leaving the surface at t=0 (Figure 3.5c).
1
22
0 exp21),0(n t
Ln
ckt
JtT
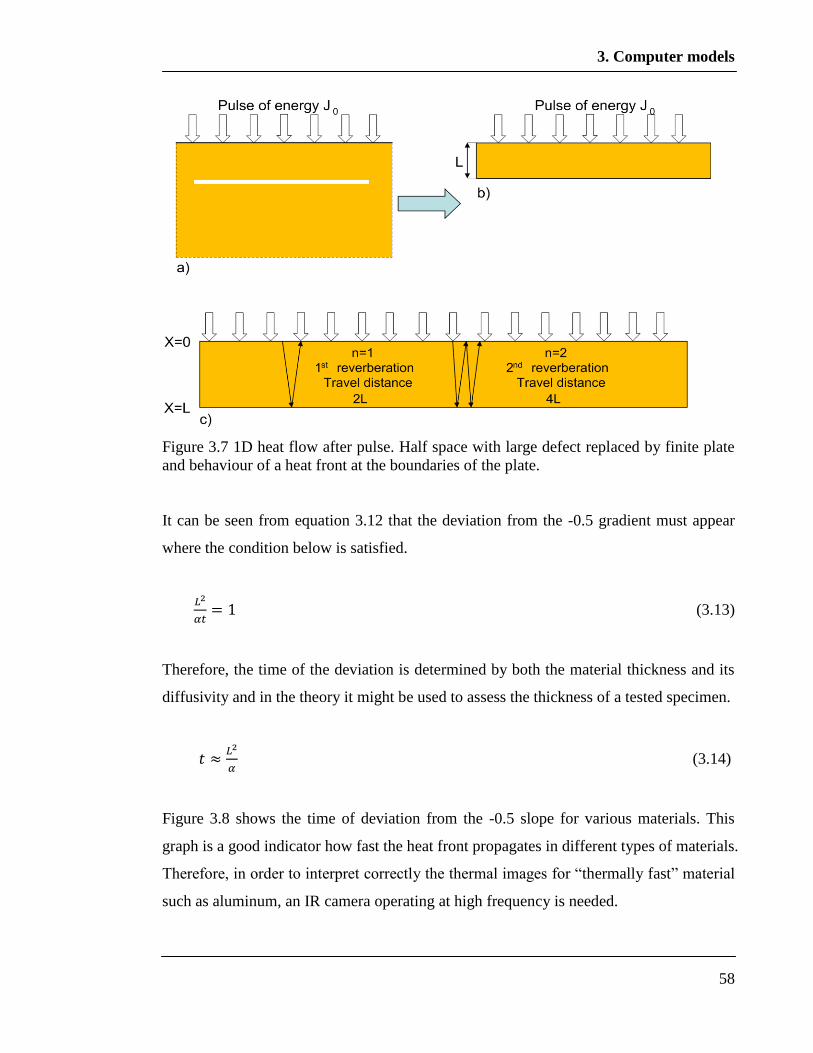
3. Computer models
58
Figure 3.7 1D heat flow after pulse. Half space with large defect replaced by finite plate
and behaviour of a heat front at the boundaries of the plate.
It can be seen from equation 3.12 that the deviation from the -0.5 gradient must appear
where the condition below is satisfied.
(3.13)
Therefore, the time of the deviation is determined by both the material thickness and its
diffusivity and in the theory it might be used to assess the thickness of a tested specimen.
(3.14)
Figure 3.8 shows the time of deviation from the -0.5 slope for various materials. This
graph is a good indicator how fast the heat front propagates in different types of materials.
Therefore, in order to interpret correctly the thermal images for “thermally fast” material
such as aluminum, an IR camera operating at high frequency is needed.

3. Computer models
59
Figure 3.8 Time of deviation from -0.5 gradient as function of layer thickness.
Figure 3.9 shows an example of plates of various thickness made of Zirconia in which
equation 3.12 has been applied. Due to the adiabatic boundary conditions meaning there
are no losses of heat to the surroundings, the cooling curves have an initial slope of -0.5
that deviates and reaches equilibrium at a residual surface temperature. As can be seen in
Figure 3.9, the residual surface temperature and the time when it appears is a function of
the plate thickness. It is quite intuitive to understand that a heat front must travel a longer
distance in the thick plate to reach the bottom boundary in comparison to the thin plate
where the distance is shorter. Therefore the time of the cooling curve deviation for the
thicker plate is longer. Figure 3.9 shows that the residual surface temperature decreases
when the thickness of the plate increases. Here also quite intuitively, like in a heat sink,
the volume of the thick plate is greater than the thin one; therefore the pulse of energy
dissipates in the larger volume of the thick plate, which results in the reduced residual
surface temperature.
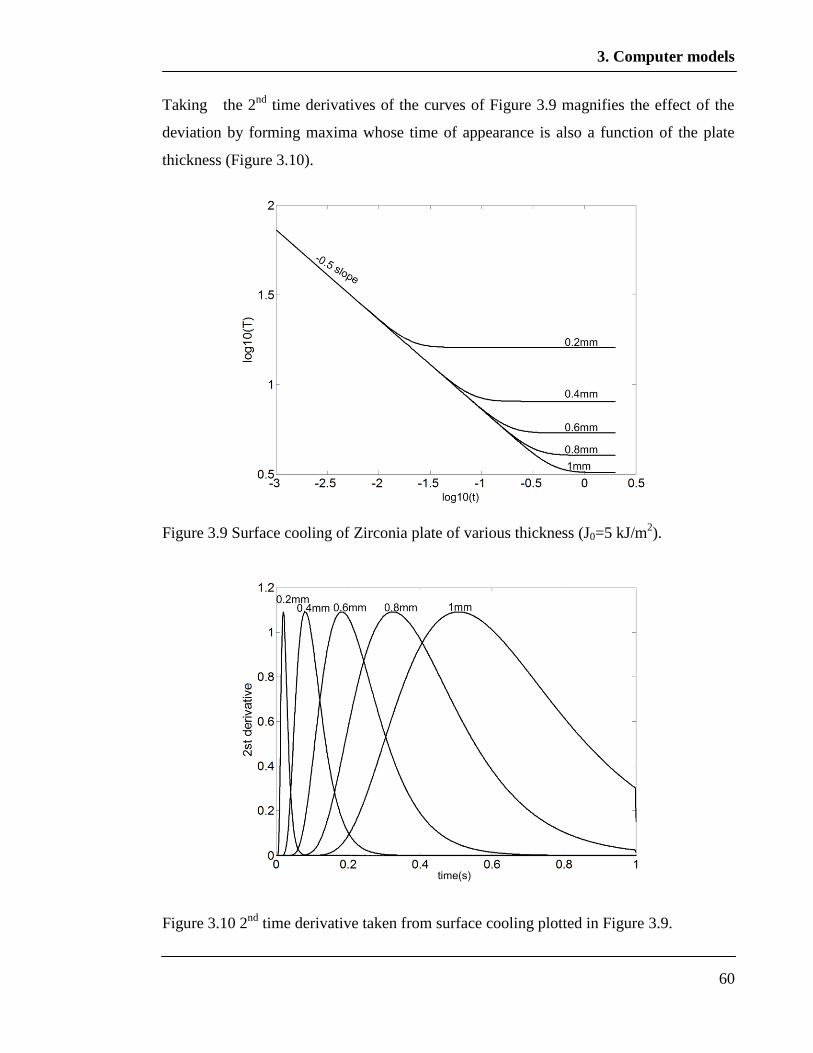
3. Computer models
60
Taking the 2nd
time derivatives of the curves of Figure 3.9 magnifies the effect of the
deviation by forming maxima whose time of appearance is also a function of the plate
thickness (Figure 3.10).
Figure 3.9 Surface cooling of Zirconia plate of various thickness (J0=5 kJ/m2).
Figure 3.10 2nd
time derivative taken from surface cooling plotted in Figure 3.9.

3. Computer models
61
It has been proposed (Balageas, 2010) to apply the time of the 2nd
derivative maximum
(td) to measure a thickness of an inspected specimen by applying equation 3.15.
(3.15)
In a case in which a layer is rigidly bonded to a substrate like in a TBC system, heat
flows into the substrate as shown schematically in Figure 3.11.
Figure 3.11 Heat front on boundaries between TBC and Nickel Super Alloy substrate.
The magnitude of the thermal reverberation terms of equation 3.12 is reduced by the
transmission into the substrate and the surface temperature is now given by (Almond et
al, 1996).
1
22
0 exp21),0(n c
n
ccct
LnR
tkc
JtT
(3.16)
where R is an effective thermal reflection coefficient for the coating-substrate interface
that is determined by the relative thermal properties of the coating and substrate.
(3.17)
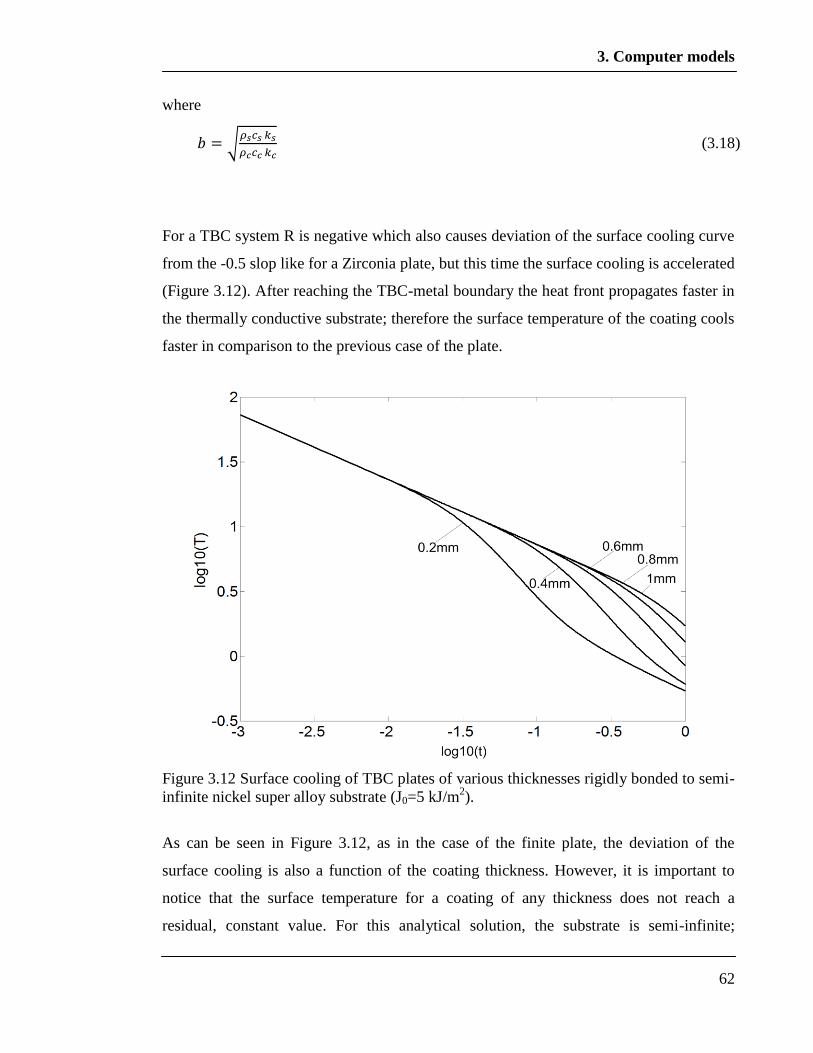
3. Computer models
62
where
(3.18)
For a TBC system R is negative which also causes deviation of the surface cooling curve
from the -0.5 slop like for a Zirconia plate, but this time the surface cooling is accelerated
(Figure 3.12). After reaching the TBC-metal boundary the heat front propagates faster in
the thermally conductive substrate; therefore the surface temperature of the coating cools
faster in comparison to the previous case of the plate.
Figure 3.12 Surface cooling of TBC plates of various thicknesses rigidly bonded to semi-
infinite nickel super alloy substrate (J0=5 kJ/m2).
As can be seen in Figure 3.12, as in the case of the finite plate, the deviation of the
surface cooling is also a function of the coating thickness. However, it is important to
notice that the surface temperature for a coating of any thickness does not reach a
residual, constant value. For this analytical solution, the substrate is semi-infinite;

3. Computer models
63
therefore all energy from the applied pulse dissipates into the substrate which is a semi-
infinite heat sink.
As in the previous case, taking the 2nd
derivative of the curves of Figure 3.12 magnifies
the effect of the deviation. However, in this case, minima rather than maxima are
obtained whose time of appearance is also a function of the coating thickness (Figure
3.13). This difference of sign is a very valuable feature of TBC systems from a transient
thermography perspective because it can be used for defect detection as explained later in
the chapter. It is interesting to note in Figure 3.13 that after the minima, the curves rise
rapidly to maxima. This is caused by slowing down of the accelerated surface cooling
with the time. At the beginning when the heat front reaches the boundaries with the
substrate the thermal gradient through the thickness is high and it is reduced with the
time of heat propagation inside the substrate.
Figure 3.13 2nd
time derivative taken from surface cooling plotted in Figure 3.12.
3. Computer models
64
Like in other NDT techniques, it is important to know the maximum depth (Lmax) of a
defect which is still detectable. Theoretically, here again the deviation from the -0.5 slope
can be applied and it must occur at a time when the surface temperature is well above
“the thermal noise” of the IR camera. Therefore, the surface temperature given by
equation 3.8 must exceed ~0.1 deg C (IR camera sensitivity) at the time t at which
equation 3.13 is satisfied (Almond et al, 1996). By combining both equations:
(3.19)
Based on equation 3.16 the maximum defect depth can be described by
(3.20)
Table 3.2 presents estimations of the maximum defect depth based on an IR camera
sensitivity of 0.1 deg C and the pulse energy being J0=5 kJ/m2.
Interestingly, the variation in the maximum thickness is small across the different
materials, which is due to the small variation in the product of density and heat capacity.
These estimations are highly dependent on the actual absorbed energy J0 and also on the
fact that a theoretical Dirac delta pulse was used. In reality, the amount of energy which
is absorbed on a tested surface depends on other factors such as the surface condition
which can be smooth of rough, the surface colour and for example the distance between
the flash lamp and the specimen. Finally, the estimations are from 1D calculations and in
reality, the maximum depth will be smaller for a finite size defect, particularly when the
defect size is small. Three dimensional effects start to influence heat propagation (Figure
3.14) as the defect length gets closer to the effective thermal diffusion length ( e )
(Almond et al, 1996). For this reason the analytical solution is applicable only for large
defects located close to the surface. Because the 1D analytical solution is inadequate for

3. Computer models
65
other cases, it needs to be complemented by a numerical solution presented in the
following subsection.
Material Density
(kg m-3
)
Specific heat
capacity
(Jkg-1
K-1
)
Maximum
Detectable
depth (mm)
Zirconia 4680 460 13.1
Nickel super-alloy 8400 455 7.7
Mild steel 7832 434 8.3
Stainless
steel 8238 468 7.3
CFRP 1700 1180 22.7
GFRP
(E-glass) 2100 1100 16.6
Rubber 1100 2010 12.7
Aluminum alloy 2770 875 11.6
Table 3.2 Estimation of maximum defect depth based on deviation of surface cooling
curve (Almond et al, 1996) (Zirconia, Nickel super-alloy www.poeton.co.uk).
Figure 3.14 Three dimensional heat flow around defect tip.
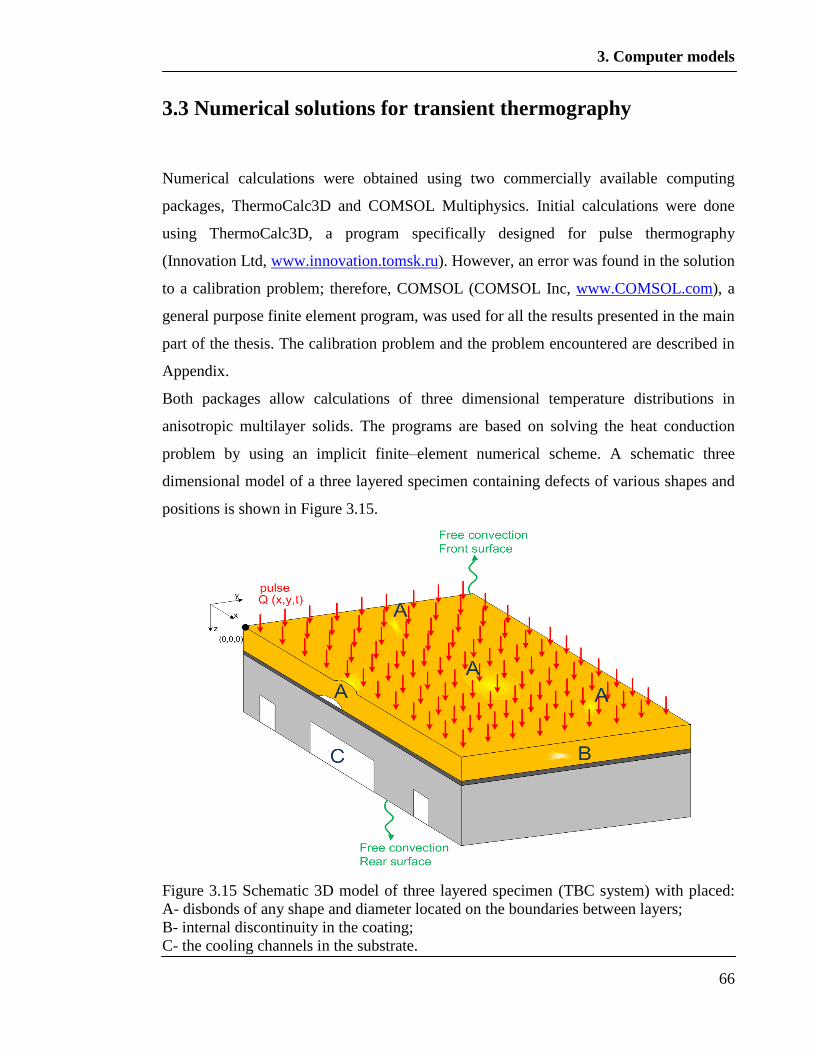
3. Computer models
66
3.3 Numerical solutions for transient thermography
Numerical calculations were obtained using two commercially available computing
packages, ThermoCalc3D and COMSOL Multiphysics. Initial calculations were done
using ThermoCalc3D, a program specifically designed for pulse thermography
(Innovation Ltd, www.innovation.tomsk.ru). However, an error was found in the solution
to a calibration problem; therefore, COMSOL (COMSOL Inc, www.COMSOL.com), a
general purpose finite element program, was used for all the results presented in the main
part of the thesis. The calibration problem and the problem encountered are described in
Appendix.
Both packages allow calculations of three dimensional temperature distributions in
anisotropic multilayer solids. The programs are based on solving the heat conduction
problem by using an implicit finite–element numerical scheme. A schematic three
dimensional model of a three layered specimen containing defects of various shapes and
positions is shown in Figure 3.15.
Figure 3.15 Schematic 3D model of three layered specimen (TBC system) with placed:
A- disbonds of any shape and diameter located on the boundaries between layers;
B- internal discontinuity in the coating;
C- the cooling channels in the substrate.
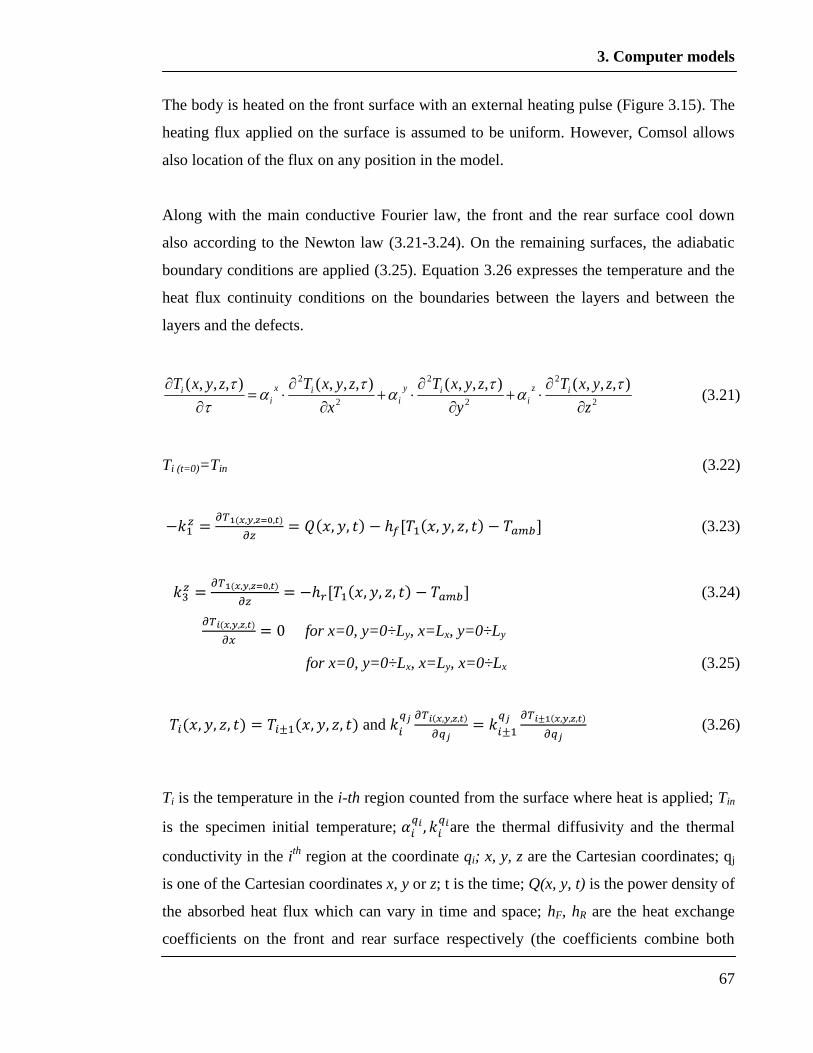
3. Computer models
67
The body is heated on the front surface with an external heating pulse (Figure 3.15). The
heating flux applied on the surface is assumed to be uniform. However, Comsol allows
also location of the flux on any position in the model.
Along with the main conductive Fourier law, the front and the rear surface cool down
also according to the Newton law (3.21-3.24). On the remaining surfaces, the adiabatic
boundary conditions are applied (3.25). Equation 3.26 expresses the temperature and the
heat flux continuity conditions on the boundaries between the layers and between the
layers and the defects.
2
2
2
2
2
2 ),,,(),,,(),,,(),,,(
z
zyxT
y
zyxT
x
zyxTzyxT iz
iiy
iix
ii
(3.21)
Ti (t=0)=Tin (3.22)
(3.23)
(3.24)
for x=0, y=0÷Ly, x=Lx, y=0÷Ly
for x=0, y=0÷Lx, x=Ly, x=0÷Lx (3.25)
and
(3.26)
Ti is the temperature in the i-th region counted from the surface where heat is applied; Tin
is the specimen initial temperature;
are the thermal diffusivity and the thermal
conductivity in the ith
region at the coordinate qi; x, y, z are the Cartesian coordinates; qj
is one of the Cartesian coordinates x, y or z; t is the time; Q(x, y, t) is the power density of
the absorbed heat flux which can vary in time and space; hF, hR are the heat exchange
coefficients on the front and rear surface respectively (the coefficients combine both

3. Computer models
68
radiation and convection heat flow); Tamb is the ambient temperature; Lx, Ly, Lz are the
specimen dimensions. The absorbed heat power density Q(x,y,t) is related to the incident
power density Qinc (x,y,t) by equation 3.27:
(3.27)
where is the surface emissivity.
The heat exchange coefficients hF and hR can be input as pure convection conditions:
;
(3.28)
or by the combination of both radiation and convection mechanisms:
;
(3.29)
In COMSOL, the values of hF and hR are specified by the user.
It has been found that even if the hf and hf vary between 10 W/m2K (commonly free
convection) and 1000 W/m2K,
the parameters
have not recordable affect on the surface
cooling curve after applying of the pulse.
COMSOL allows adjustment the shape of the heat pulse Q in order to represent the
action of a flash lamp (chapter 2 and 5) which can be seen in Figure 3.16. However, it is
important to indicate that it is idealized shape of the flash energy pulse which in reality is
more complex.

3. Computer models
69
Figure 3.16 Pulse shape used.
Because during the practical application of transient thermography, the observer has
access only to the surface temperature T(x,y,0,τ) which dictates the energy emission from
the surface (Stefan Boltzmann law eq.6.3), this temperature is investigated for all
analysed cases.
The computer simulations involved transient analysis; therefore the time step is a very
important factor. The COMSOL manual recommends the use of equations 3.30, 3.31 and
these were adopted.
(3.30)
(3.31)
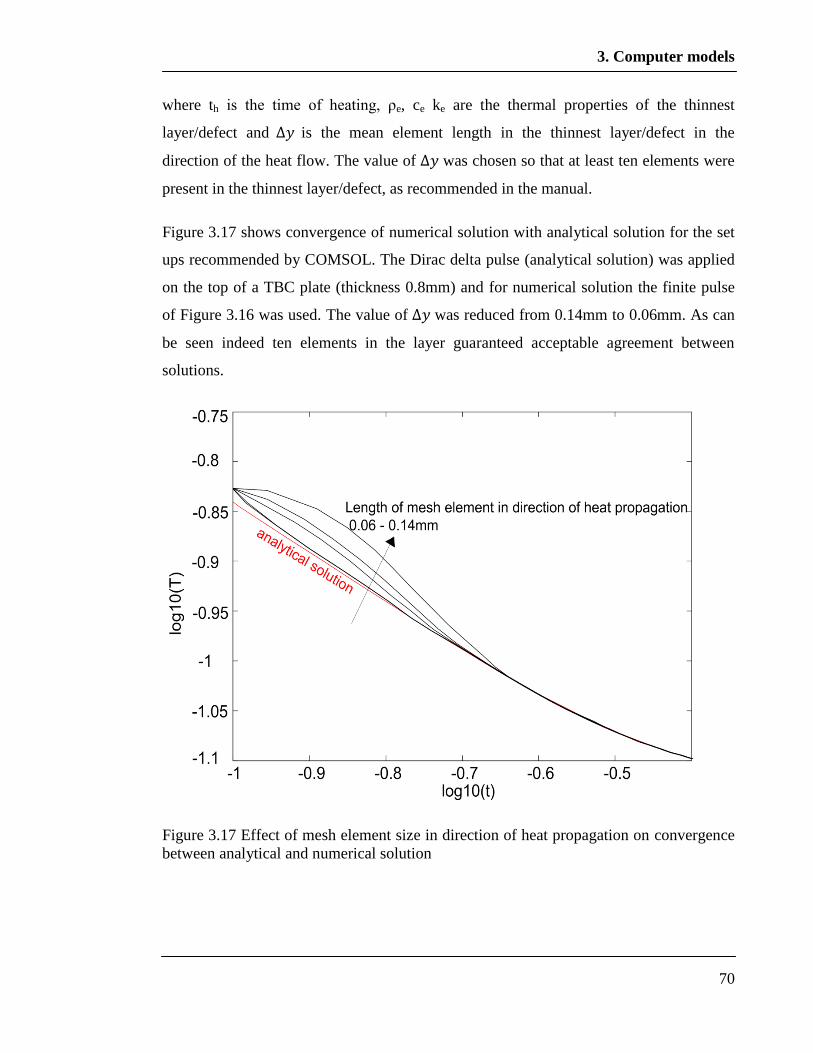
3. Computer models
70
where th is the time of heating, ρe, ce ke are the thermal properties of the thinnest
layer/defect and is the mean element length in the thinnest layer/defect in the
direction of the heat flow. The value of was chosen so that at least ten elements were
present in the thinnest layer/defect, as recommended in the manual.
Figure 3.17 shows convergence of numerical solution with analytical solution for the set
ups recommended by COMSOL. The Dirac delta pulse (analytical solution) was applied
on the top of a TBC plate (thickness 0.8mm) and for numerical solution the finite pulse
of Figure 3.16 was used. The value of was reduced from 0.14mm to 0.06mm. As can
be seen indeed ten elements in the layer guaranteed acceptable agreement between
solutions.
Figure 3.17 Effect of mesh element size in direction of heat propagation on convergence
between analytical and numerical solution
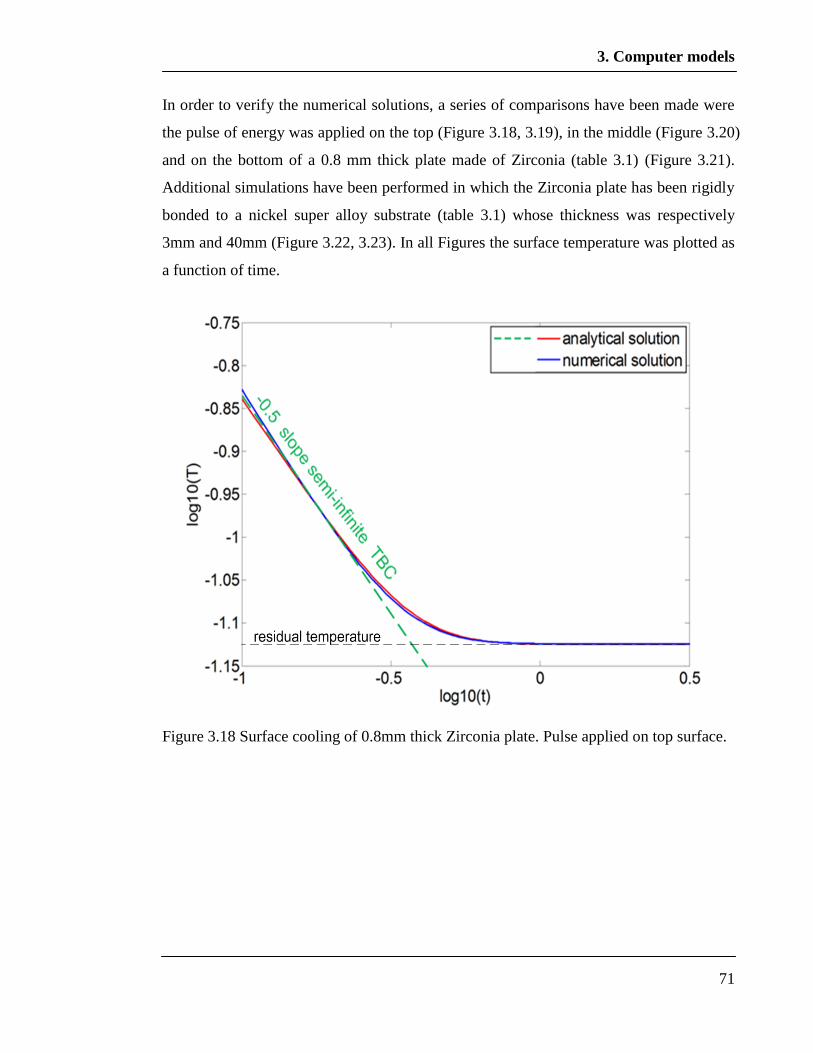
3. Computer models
71
In order to verify the numerical solutions, a series of comparisons have been made were
the pulse of energy was applied on the top (Figure 3.18, 3.19), in the middle (Figure 3.20)
and on the bottom of a 0.8 mm thick plate made of Zirconia (table 3.1) (Figure 3.21).
Additional simulations have been performed in which the Zirconia plate has been rigidly
bonded to a nickel super alloy substrate (table 3.1) whose thickness was respectively
3mm and 40mm (Figure 3.22, 3.23). In all Figures the surface temperature was plotted as
a function of time.
Figure 3.18 Surface cooling of 0.8mm thick Zirconia plate. Pulse applied on top surface.
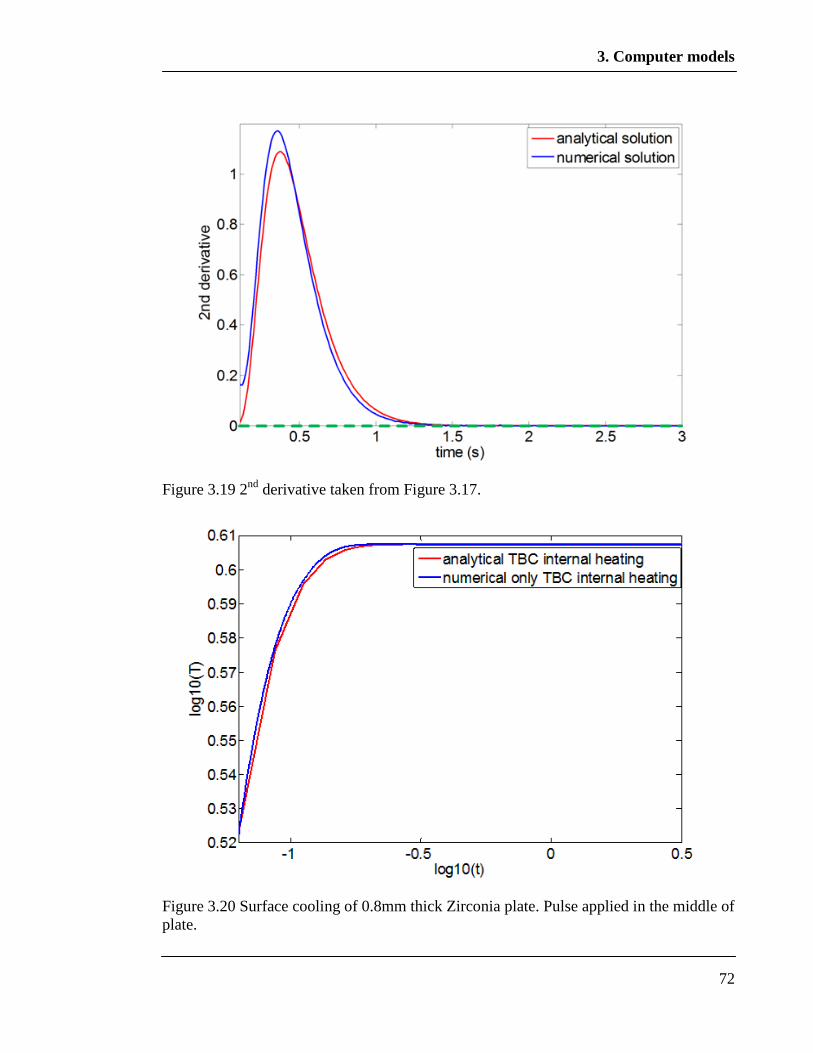
3. Computer models
72
Figure 3.19 2nd
derivative taken from Figure 3.17.
Figure 3.20 Surface cooling of 0.8mm thick Zirconia plate. Pulse applied in the middle of
plate.
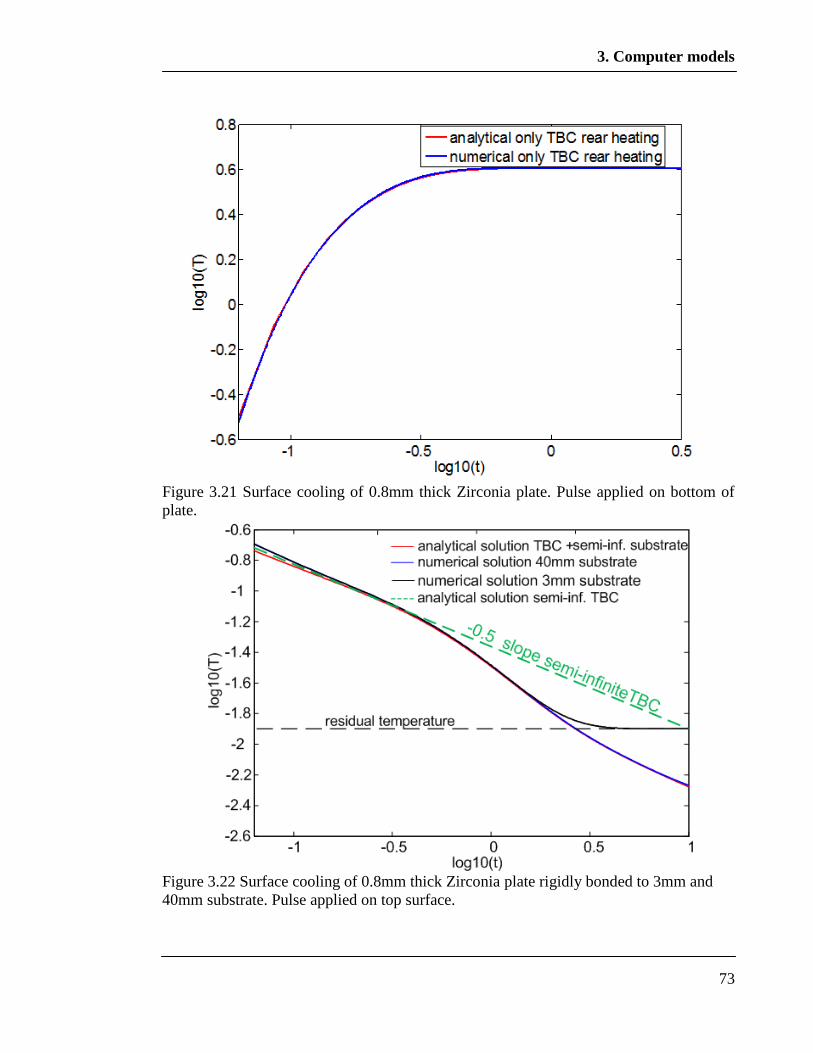
3. Computer models
73
Figure 3.21 Surface cooling of 0.8mm thick Zirconia plate. Pulse applied on bottom of
plate.
Figure 3.22 Surface cooling of 0.8mm thick Zirconia plate rigidly bonded to 3mm and
40mm substrate. Pulse applied on top surface.
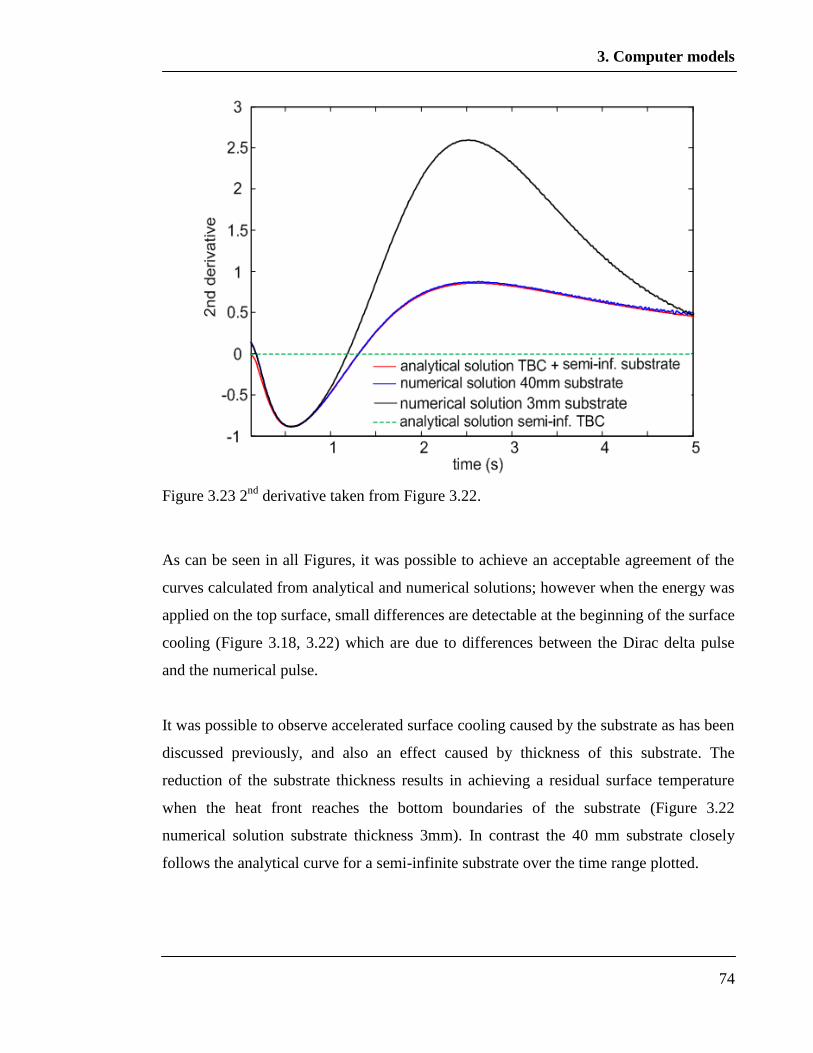
3. Computer models
74
Figure 3.23 2nd
derivative taken from Figure 3.22.
As can be seen in all Figures, it was possible to achieve an acceptable agreement of the
curves calculated from analytical and numerical solutions; however when the energy was
applied on the top surface, small differences are detectable at the beginning of the surface
cooling (Figure 3.18, 3.22) which are due to differences between the Dirac delta pulse
and the numerical pulse.
It was possible to observe accelerated surface cooling caused by the substrate as has been
discussed previously, and also an effect caused by thickness of this substrate. The
reduction of the substrate thickness results in achieving a residual surface temperature
when the heat front reaches the bottom boundaries of the substrate (Figure 3.22
numerical solution substrate thickness 3mm). In contrast the 40 mm substrate closely
follows the analytical curve for a semi-infinite substrate over the time range plotted.
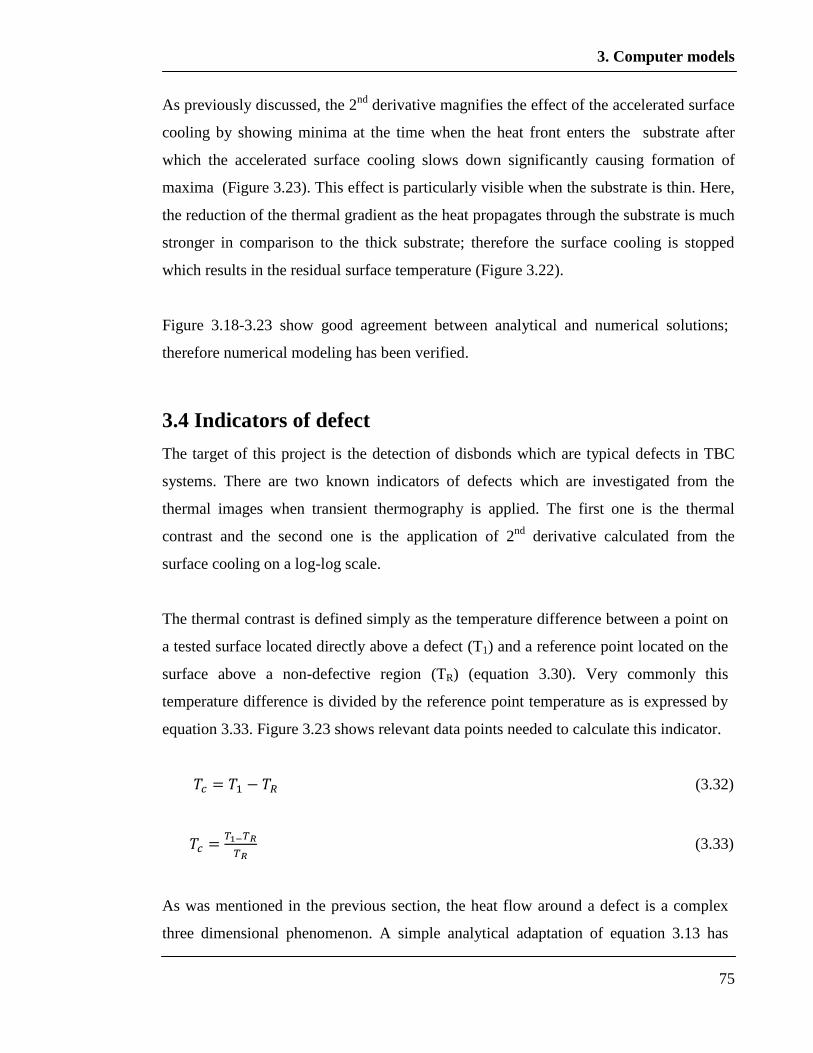
3. Computer models
75
As previously discussed, the 2nd
derivative magnifies the effect of the accelerated surface
cooling by showing minima at the time when the heat front enters the substrate after
which the accelerated surface cooling slows down significantly causing formation of
maxima (Figure 3.23). This effect is particularly visible when the substrate is thin. Here,
the reduction of the thermal gradient as the heat propagates through the substrate is much
stronger in comparison to the thick substrate; therefore the surface cooling is stopped
which results in the residual surface temperature (Figure 3.22).
Figure 3.18-3.23 show good agreement between analytical and numerical solutions;
therefore numerical modeling has been verified.
3.4 Indicators of defect
The target of this project is the detection of disbonds which are typical defects in TBC
systems. There are two known indicators of defects which are investigated from the
thermal images when transient thermography is applied. The first one is the thermal
contrast and the second one is the application of 2nd
derivative calculated from the
surface cooling on a log-log scale.
The thermal contrast is defined simply as the temperature difference between a point on
a tested surface located directly above a defect (T1) and a reference point located on the
surface above a non-defective region (TR) (equation 3.30). Very commonly this
temperature difference is divided by the reference point temperature as is expressed by
equation 3.33. Figure 3.23 shows relevant data points needed to calculate this indicator.
(3.32)
(3.33)
As was mentioned in the previous section, the heat flow around a defect is a complex
three dimensional phenomenon. A simple analytical adaptation of equation 3.13 has
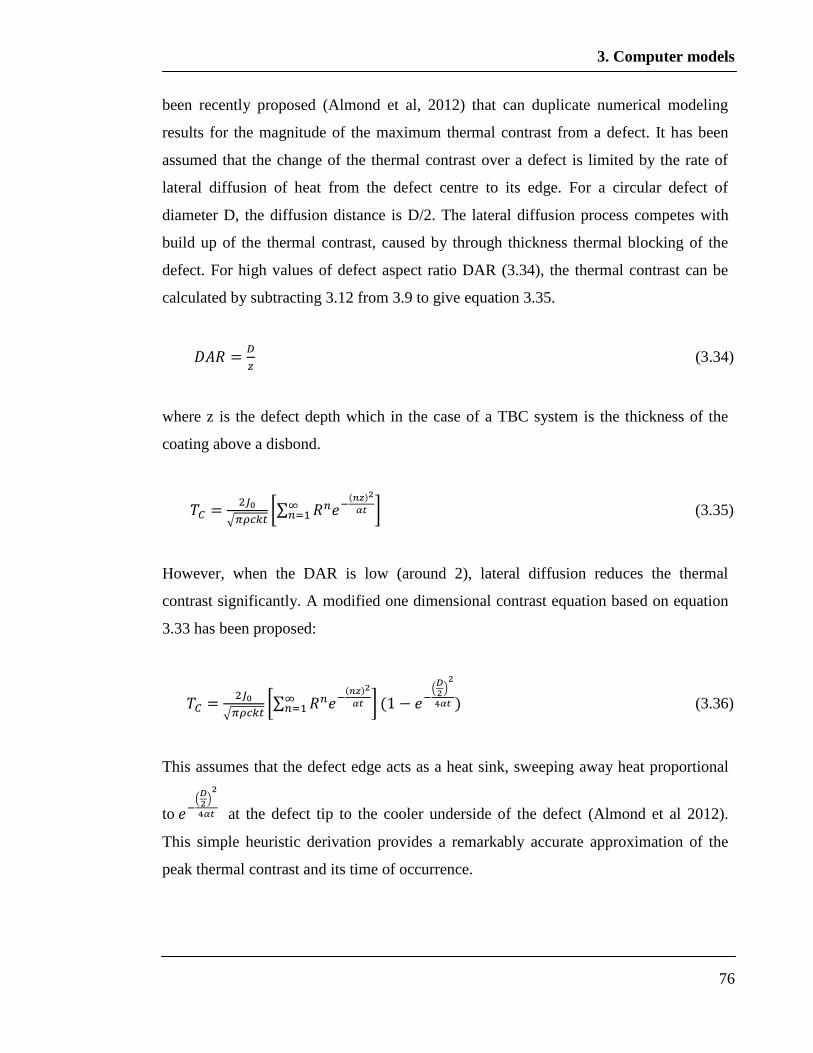
3. Computer models
76
been recently proposed (Almond et al, 2012) that can duplicate numerical modeling
results for the magnitude of the maximum thermal contrast from a defect. It has been
assumed that the change of the thermal contrast over a defect is limited by the rate of
lateral diffusion of heat from the defect centre to its edge. For a circular defect of
diameter D, the diffusion distance is D/2. The lateral diffusion process competes with
build up of the thermal contrast, caused by through thickness thermal blocking of the
defect. For high values of defect aspect ratio DAR (3.34), the thermal contrast can be
calculated by subtracting 3.12 from 3.9 to give equation 3.35.
(3.34)
where z is the defect depth which in the case of a TBC system is the thickness of the
coating above a disbond.
(3.35)
However, when the DAR is low (around 2), lateral diffusion reduces the thermal
contrast significantly. A modified one dimensional contrast equation based on equation
3.33 has been proposed:
(3.36)
This assumes that the defect edge acts as a heat sink, sweeping away heat proportional
to
at the defect tip to the cooler underside of the defect (Almond et al 2012).
This simple heuristic derivation provides a remarkably accurate approximation of the
peak thermal contrast and its time of occurrence.
3. Computer models
77
The result of equation 3.34 has been compared with the numerical solution as shown in
Figure 3.24 for a TBC system in which a defect of diameter 1-6 mm was placed below
1mm of coating and the energy applied on the surface was J0=10 kJ/m2. For numerical
models the thickness of the defect was 0.1mm and the defect was filled with a vacuum.
The thermal contrast for the numerical solution was calculated based on equation 3.36
and Figure 3.24.
Importantly, it needs to be mentioned that analytical solutions cannot replace numerical
solutions completely. Heat propagation through a defect becomes an important factor in
a case of a disbond in a TBC system which is caused by a very small air gap and
specific shape of the disbond; in this case, only numerical solution can provide more
accurate results.
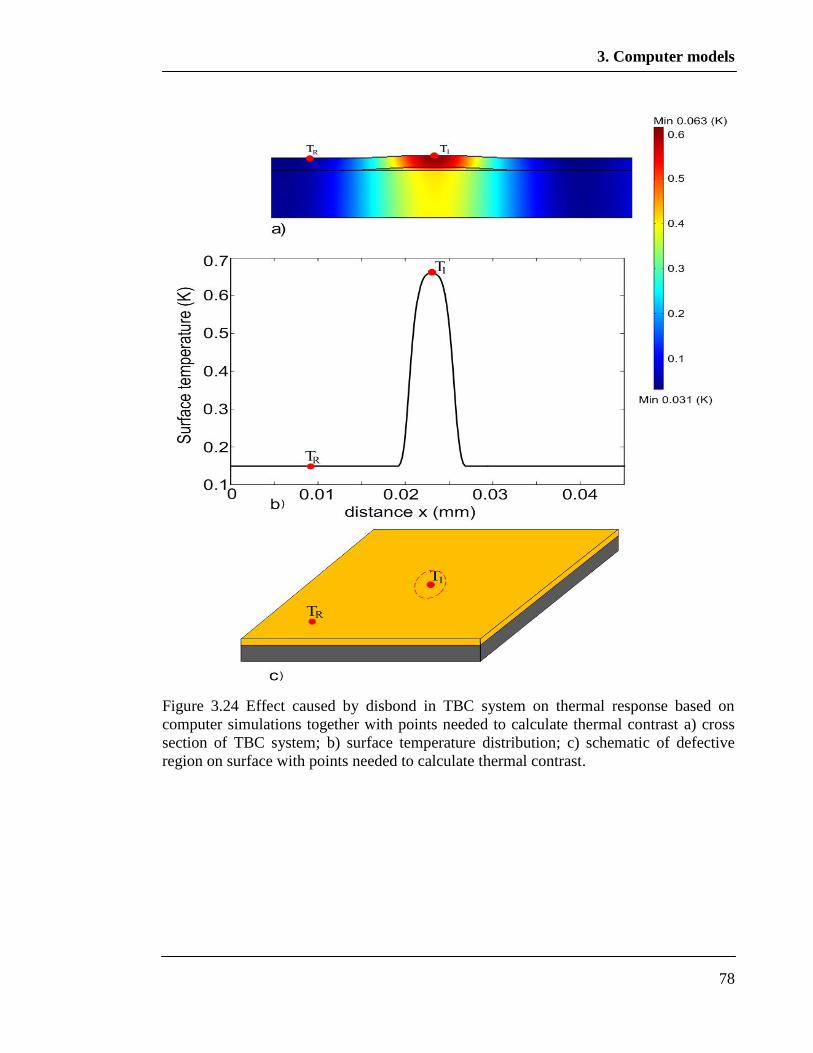
3. Computer models
78
Figure 3.24 Effect caused by disbond in TBC system on thermal response based on
computer simulations together with points needed to calculate thermal contrast a) cross
section of TBC system; b) surface temperature distribution; c) schematic of defective
region on surface with points needed to calculate thermal contrast.
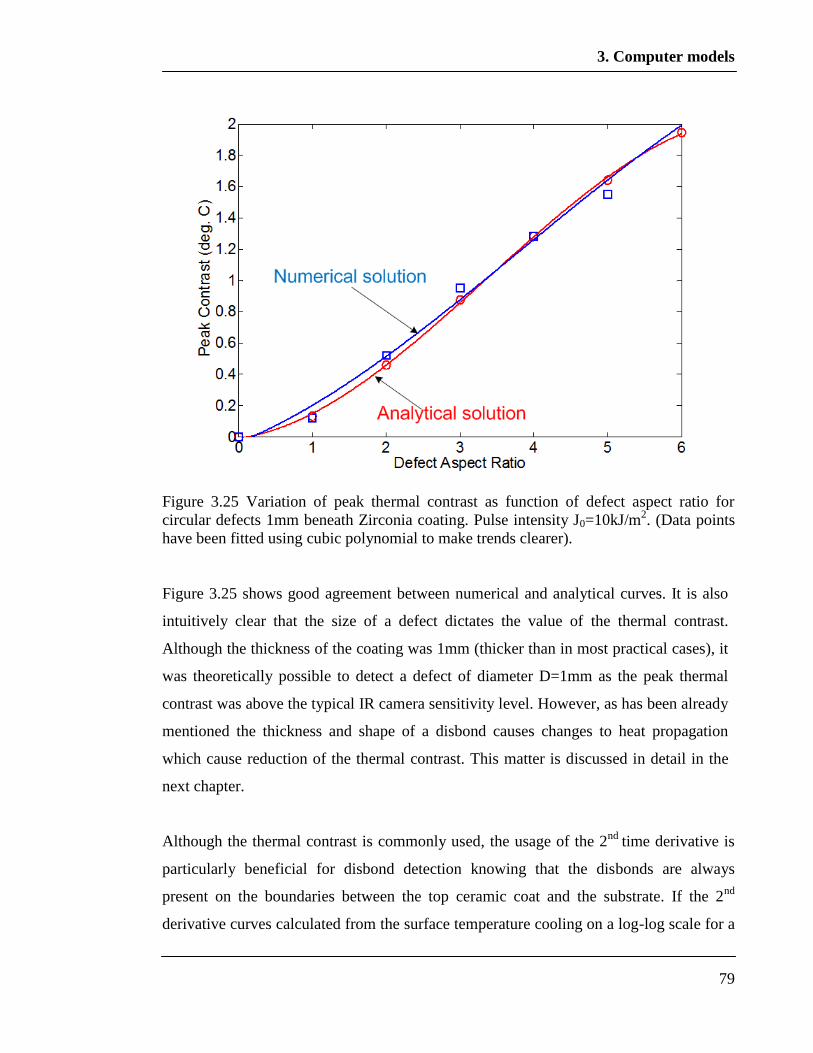
3. Computer models
79
Figure 3.25 Variation of peak thermal contrast as function of defect aspect ratio for
circular defects 1mm beneath Zirconia coating. Pulse intensity J0=10kJ/m2. (Data points
have been fitted using cubic polynomial to make trends clearer).
Figure 3.25 shows good agreement between numerical and analytical curves. It is also
intuitively clear that the size of a defect dictates the value of the thermal contrast.
Although the thickness of the coating was 1mm (thicker than in most practical cases), it
was theoretically possible to detect a defect of diameter D=1mm as the peak thermal
contrast was above the typical IR camera sensitivity level. However, as has been already
mentioned the thickness and shape of a disbond causes changes to heat propagation
which cause reduction of the thermal contrast. This matter is discussed in detail in the
next chapter.
Although the thermal contrast is commonly used, the usage of the 2nd
time derivative is
particularly beneficial for disbond detection knowing that the disbonds are always
present on the boundaries between the top ceramic coat and the substrate. If the 2nd
derivative curves calculated from the surface temperature cooling on a log-log scale for a
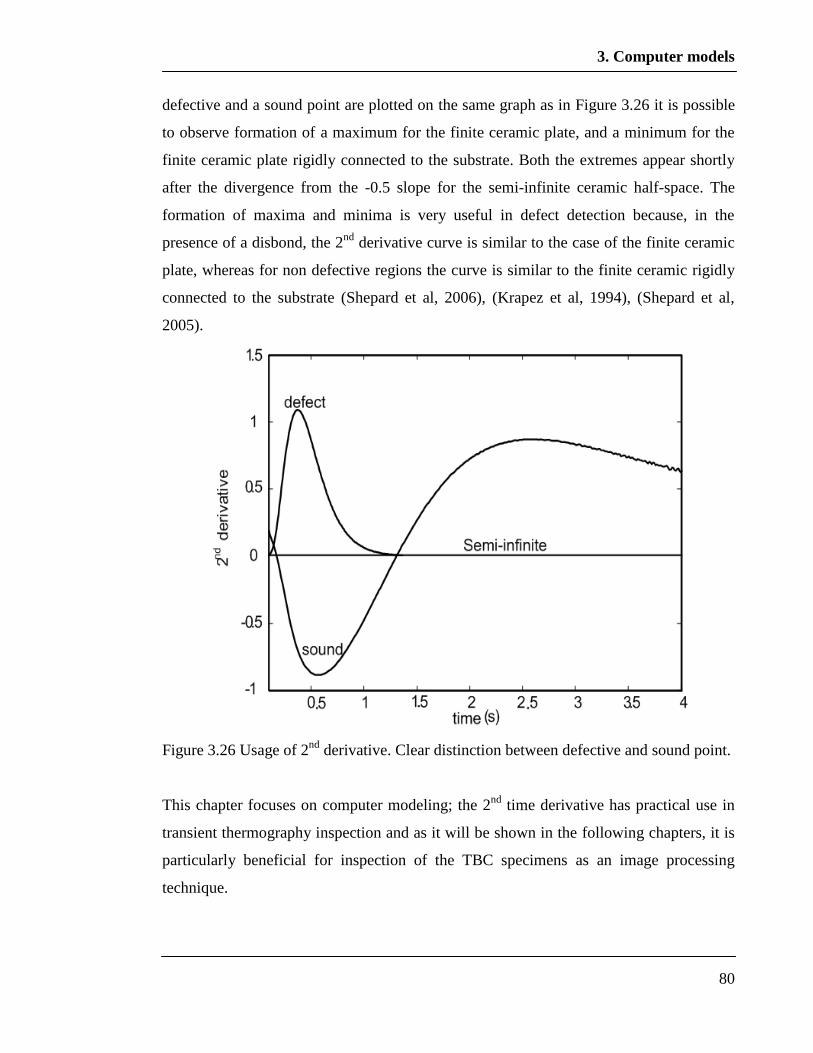
3. Computer models
80
defective and a sound point are plotted on the same graph as in Figure 3.26 it is possible
to observe formation of a maximum for the finite ceramic plate, and a minimum for the
finite ceramic plate rigidly connected to the substrate. Both the extremes appear shortly
after the divergence from the -0.5 slope for the semi-infinite ceramic half-space. The
formation of maxima and minima is very useful in defect detection because, in the
presence of a disbond, the 2nd
derivative curve is similar to the case of the finite ceramic
plate, whereas for non defective regions the curve is similar to the finite ceramic rigidly
connected to the substrate (Shepard et al, 2006), (Krapez et al, 1994), (Shepard et al,
2005).
Figure 3.26 Usage of 2nd
derivative. Clear distinction between defective and sound point.
This chapter focuses on computer modeling; the 2nd
time derivative has practical use in
transient thermography inspection and as it will be shown in the following chapters, it is
particularly beneficial for inspection of the TBC specimens as an image processing
technique.
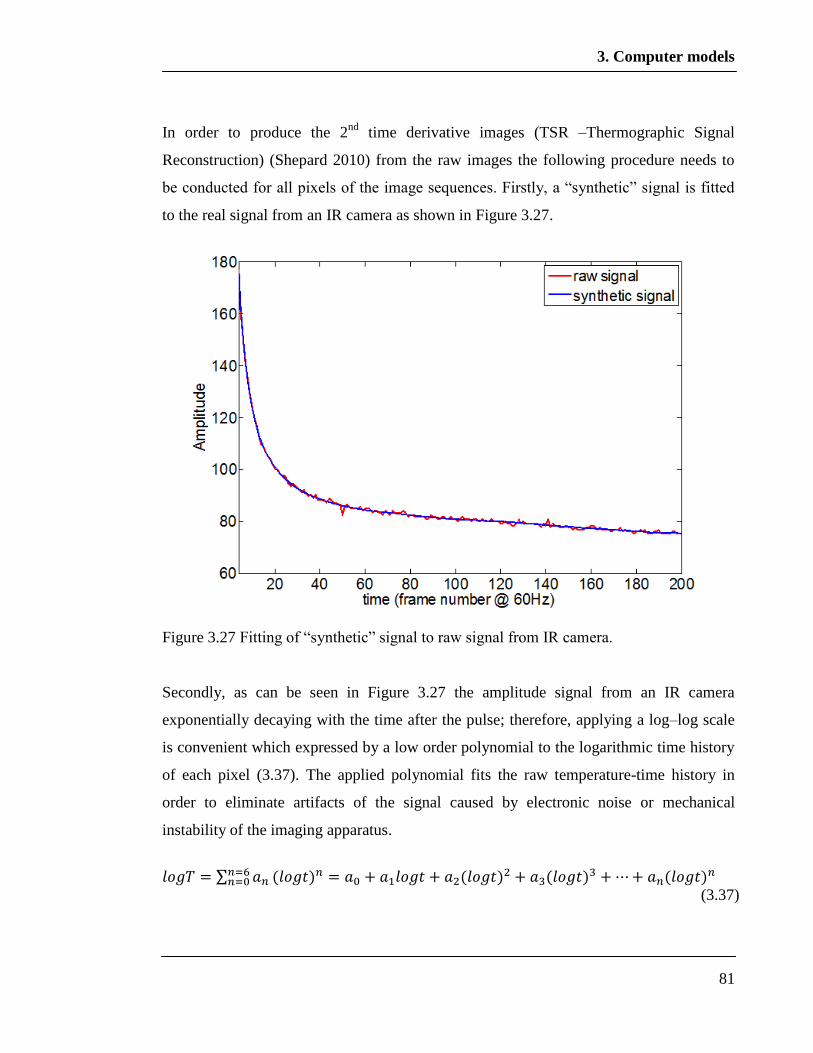
3. Computer models
81
In order to produce the 2nd
time derivative images (TSR –Thermographic Signal
Reconstruction) (Shepard 2010) from the raw images the following procedure needs to
be conducted for all pixels of the image sequences. Firstly, a “synthetic” signal is fitted
to the real signal from an IR camera as shown in Figure 3.27.
Figure 3.27 Fitting of “synthetic” signal to raw signal from IR camera.
Secondly, as can be seen in Figure 3.27 the amplitude signal from an IR camera
exponentially decaying with the time after the pulse; therefore, applying a log–log scale
is convenient which expressed by a low order polynomial to the logarithmic time history
of each pixel (3.37). The applied polynomial fits the raw temperature-time history in
order to eliminate artifacts of the signal caused by electronic noise or mechanical
instability of the imaging apparatus.
(3.37)
3. Computer models
82
Finally, the 1st and the 2
nd time derivative are calculated by using equation 3.38 and 3.39.
(3.38)
(3.39)
The pixels from the thermal images that deviate from linearity in their logarithmic time
history are enhanced by differentiation (3.36, 3.37) and easily identified by their
derivative maxima (Figure 3.24). Therefore, the described process applied to the raw
thermal images significantly improves the quality of the images in terms of sensitivity
and reduction of blurring (Shepard, 2007) which can be seen in practical application
presented in the next chapter.
3.5 Conclusions
In this chapter, analytical and numerical solutions to transient heat problems were
introduced. An analytical solution was used to discuss how the thermal properties of
tested materials affect energy propagation which results in a specific surface temperature
distribution. In order to realise this investigation, a half space, a finite plate and also a
plate rigidly bonded to a substrate were used, the latter being an example of a TBC
system. The limitations of the 1D analytical approach when lateral heat flow around a
defect occurs were described and hence a numerical solution using COMSOL
Multiphysics was employed, the basis of the code and its validation for the cases of
interest being discussed.
Indicators of a defect based on thermal contrast and application of the 2nd
time derivative
to log-log surface cooling were discussed in detail.
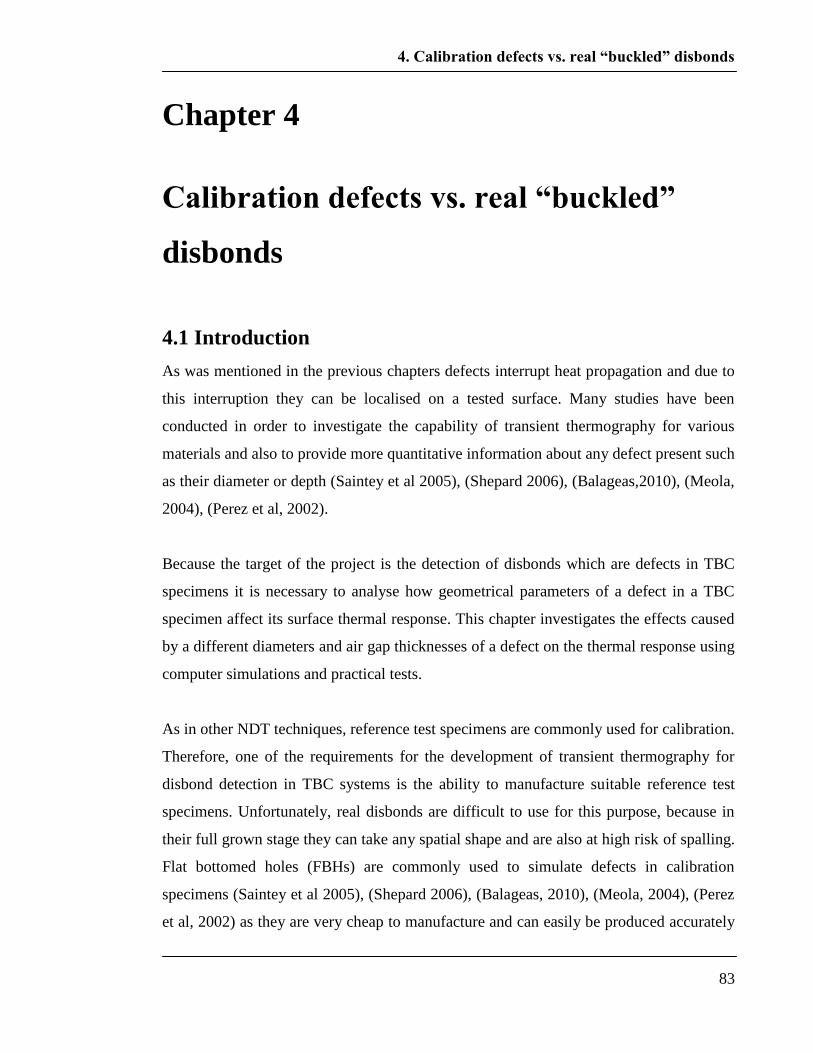
4. Calibration defects vs. real “buckled” disbonds
83
Chapter 4
Calibration defects vs. real “buckled”
disbonds
4.1 Introduction
As was mentioned in the previous chapters defects interrupt heat propagation and due to
this interruption they can be localised on a tested surface. Many studies have been
conducted in order to investigate the capability of transient thermography for various
materials and also to provide more quantitative information about any defect present such
as their diameter or depth (Saintey et al 2005), (Shepard 2006), (Balageas,2010), (Meola,
2004), (Perez et al, 2002).
Because the target of the project is the detection of disbonds which are defects in TBC
specimens it is necessary to analyse how geometrical parameters of a defect in a TBC
specimen affect its surface thermal response. This chapter investigates the effects caused
by a different diameters and air gap thicknesses of a defect on the thermal response using
computer simulations and practical tests.
As in other NDT techniques, reference test specimens are commonly used for calibration.
Therefore, one of the requirements for the development of transient thermography for
disbond detection in TBC systems is the ability to manufacture suitable reference test
specimens. Unfortunately, real disbonds are difficult to use for this purpose, because in
their full grown stage they can take any spatial shape and are also at high risk of spalling.
Flat bottomed holes (FBHs) are commonly used to simulate defects in calibration
specimens (Saintey et al 2005), (Shepard 2006), (Balageas, 2010), (Meola, 2004), (Perez
et al, 2002) as they are very cheap to manufacture and can easily be produced accurately

4. Calibration defects vs. real “buckled” disbonds
84
in a range of sizes. Unfortunately, significant differences in the morphology between a
FBH and a real disbond shown in Figure 4.1 cause noticeable changes in heat flow
during a thermographic test which can be seen in Figure 4.2. These changes consequently
result in differences between the surface temperature distributions above a FBH and a
real „buckled‟ disbond.
This chapter proposes an artificial disbond that provides a better representation of a real
disbond of a certain diameter, as shown in Figure 4.3. An FBH is modified by tapping it
and introducing a screw made of the same material as the substrate. The screw thread is
filled with thermally conductive metal grease so the material below the disbond is
effectively re-instated. Lateral heat flow below the disbond can therefore occur, as with
the real disbond. Heat can also flow through the small air gap in the disbond where the
thickness is controlled by the size of the quartz grain. This concept has been investigated
by a series of numerical simulations validated by experiments, the results of which are
presented in the chapter. The behaviour of the artificial disbond is compared to that of the
real „buckled‟ disbond of Figure 4.1 in order to determine the effects caused by
morphology of a real disbond. Lastly, a concept of a profiled artificial disbond is
proposed as an improved representation of a real “buckled” disbond for the purpose of
calibration purposes.
Figure 4.1 Real disbond between ceramic coat and substrate before spalling
(Panture et al, 2002) (a) YSZ ceramic coating; (b) BC and nickel super alloy.
500 µm
(a)
(b)
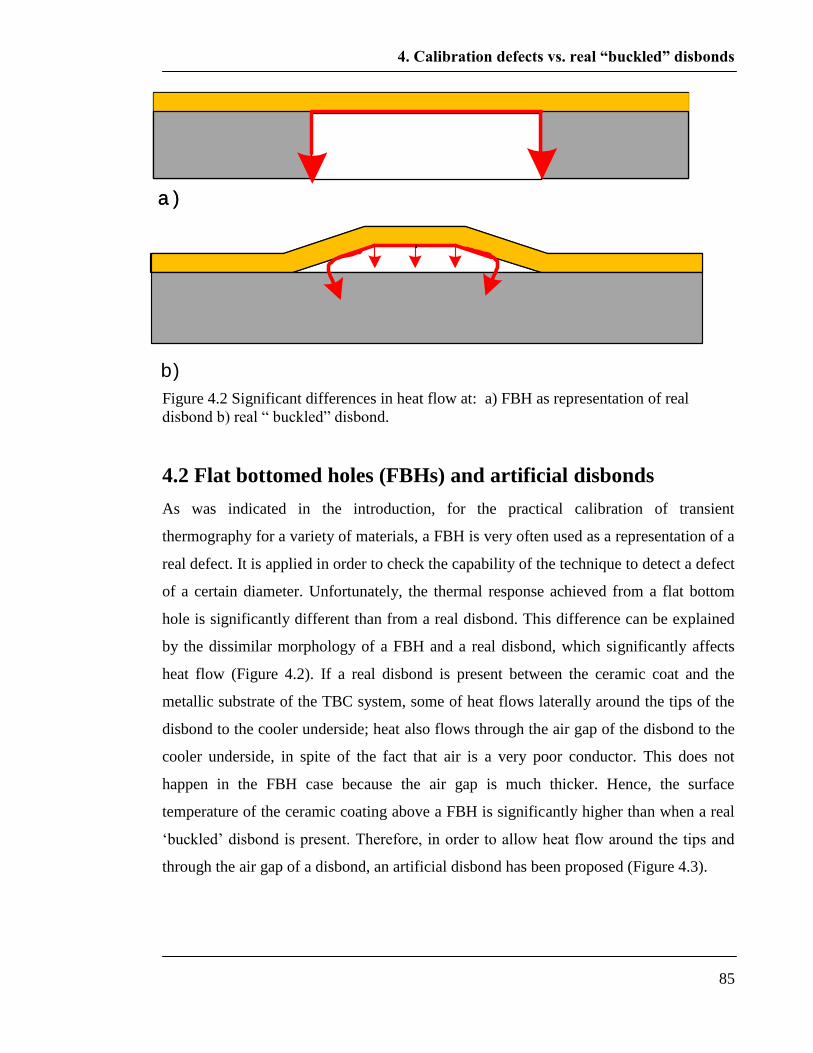
4. Calibration defects vs. real “buckled” disbonds
85
Figure 4.2 Significant differences in heat flow at: a) FBH as representation of real
disbond b) real “ buckled” disbond.
4.2 Flat bottomed holes (FBHs) and artificial disbonds
As was indicated in the introduction, for the practical calibration of transient
thermography for a variety of materials, a FBH is very often used as a representation of a
real defect. It is applied in order to check the capability of the technique to detect a defect
of a certain diameter. Unfortunately, the thermal response achieved from a flat bottom
hole is significantly different than from a real disbond. This difference can be explained
by the dissimilar morphology of a FBH and a real disbond, which significantly affects
heat flow (Figure 4.2). If a real disbond is present between the ceramic coat and the
metallic substrate of the TBC system, some of heat flows laterally around the tips of the
disbond to the cooler underside; heat also flows through the air gap of the disbond to the
cooler underside, in spite of the fact that air is a very poor conductor. This does not
happen in the FBH case because the air gap is much thicker. Hence, the surface
temperature of the ceramic coating above a FBH is significantly higher than when a real
„buckled‟ disbond is present. Therefore, in order to allow heat flow around the tips and
through the air gap of a disbond, an artificial disbond has been proposed (Figure 4.3).
a )a )
b)

4. Calibration defects vs. real “buckled” disbonds
86
Figure 4.3 Proposed artificial disbond as representation of real disbond.
Although the 2nd
time derivative approach is very useful, it requires thermal image
processing as was discussed in the previous chapter; therefore very commonly the
thermal contrast is used during a basic inspection as the simplest indicator of a defect.
This parameter shows the surface temperature differences between a defective and a
sound region for the entire time of cooling as described in chapter 3 (equation 3.31).
After the validation of the numerical software COMSOL (chapter 3), this simulation was
used for all simulations presented in the thesis from which the thermal contrast and the
2nd
time derivative are generated and discussed.
Thermally conductive
metal grease
grains of quartz
Nickel super alloy
screw
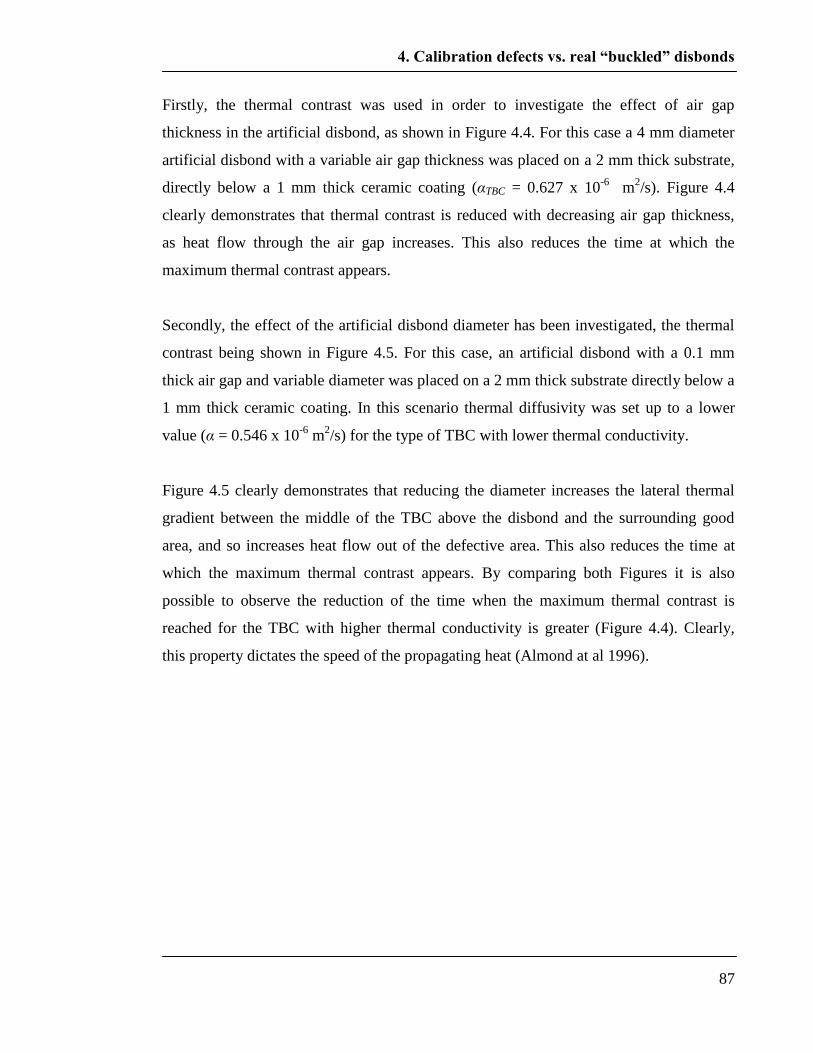
4. Calibration defects vs. real “buckled” disbonds
87
Firstly, the thermal contrast was used in order to investigate the effect of air gap
thickness in the artificial disbond, as shown in Figure 4.4. For this case a 4 mm diameter
artificial disbond with a variable air gap thickness was placed on a 2 mm thick substrate,
directly below a 1 mm thick ceramic coating (αTBC = 0.627 x 10⁻⁶
m2/s). Figure 4.4
clearly demonstrates that thermal contrast is reduced with decreasing air gap thickness,
as heat flow through the air gap increases. This also reduces the time at which the
maximum thermal contrast appears.
Secondly, the effect of the artificial disbond diameter has been investigated, the thermal
contrast being shown in Figure 4.5. For this case, an artificial disbond with a 0.1 mm
thick air gap and variable diameter was placed on a 2 mm thick substrate directly below a
1 mm thick ceramic coating. In this scenario thermal diffusivity was set up to a lower
value (α = 0.546 x 10⁻⁶
m2/s) for the type of TBC with lower thermal conductivity.
Figure 4.5 clearly demonstrates that reducing the diameter increases the lateral thermal
gradient between the middle of the TBC above the disbond and the surrounding good
area, and so increases heat flow out of the defective area. This also reduces the time at
which the maximum thermal contrast appears. By comparing both Figures it is also
possible to observe the reduction of the time when the maximum thermal contrast is
reached for the TBC with higher thermal conductivity is greater (Figure 4.4). Clearly,
this property dictates the speed of the propagating heat (Almond at al 1996).
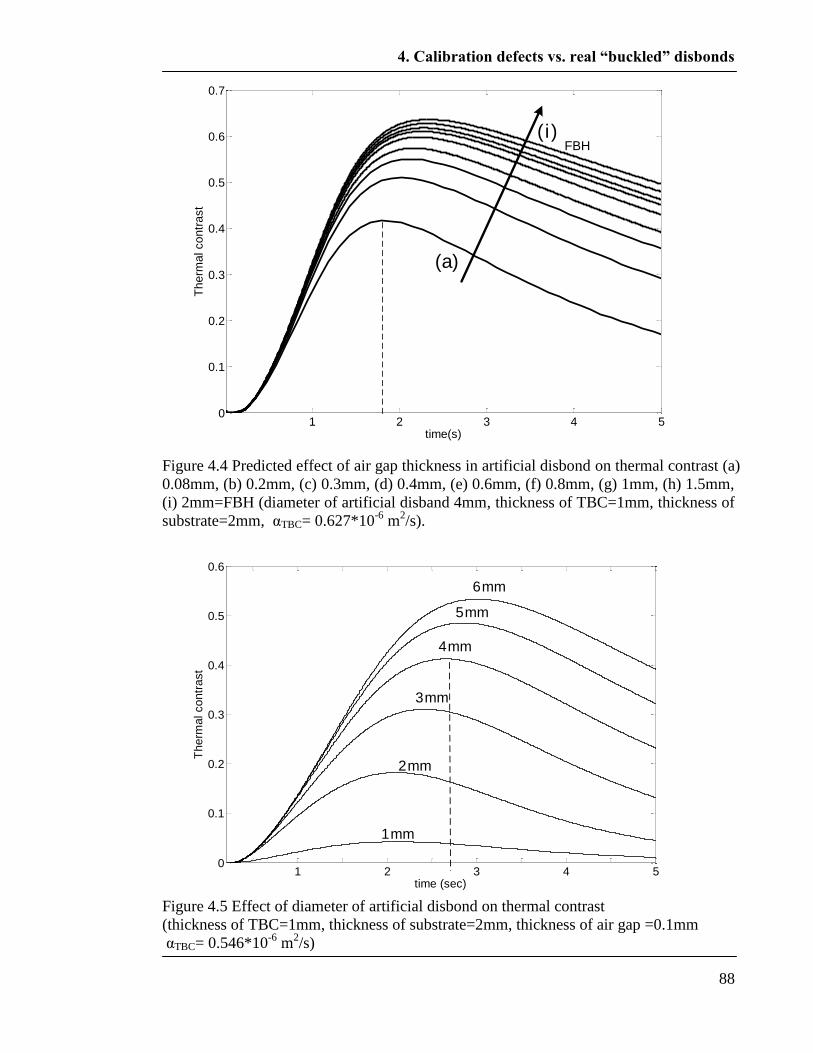
4. Calibration defects vs. real “buckled” disbonds
88
Figure 4.4 Predicted effect of air gap thickness in artificial disbond on thermal contrast (a)
0.08mm, (b) 0.2mm, (c) 0.3mm, (d) 0.4mm, (e) 0.6mm, (f) 0.8mm, (g) 1mm, (h) 1.5mm,
(i) 2mm=FBH (diameter of artificial disband 4mm, thickness of TBC=1mm, thickness of
substrate=2mm, αTBC= 0.627*10-6
m2/s).
Figure 4.5 Effect of diameter of artificial disbond on thermal contrast
(thickness of TBC=1mm, thickness of substrate=2mm, thickness of air gap =0.1mm
αTBC= 0.546*10-6
m2/s)
1 2 3 4 50
0.1
0.2
0.3
0.4
0.5
0.6
0.7
time(s)
Th
erm
al co
ntr
ast
(a)
FBH(i)
1 2 3 4 50
0.1
0.2
0.3
0.4
0.5
0.6
time (sec)
Therm
al contr
ast
1mm
2mm
3mm
4mm
5mm
6mm
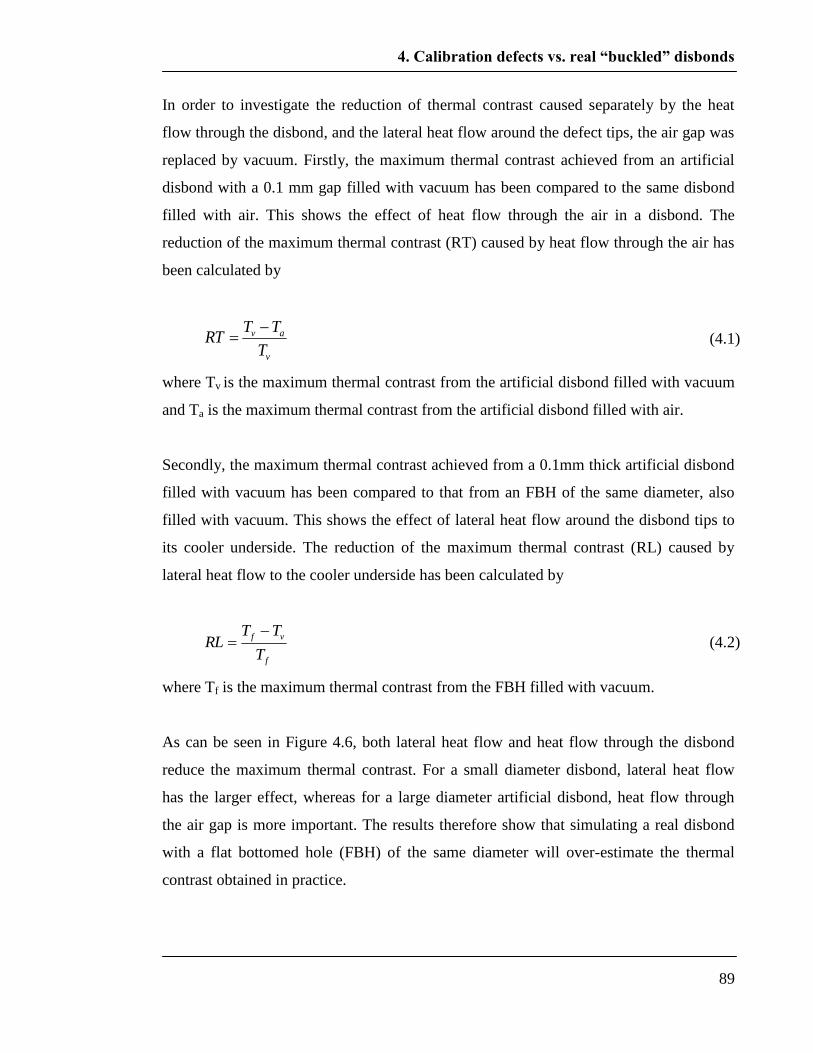
4. Calibration defects vs. real “buckled” disbonds
89
In order to investigate the reduction of thermal contrast caused separately by the heat
flow through the disbond, and the lateral heat flow around the defect tips, the air gap was
replaced by vacuum. Firstly, the maximum thermal contrast achieved from an artificial
disbond with a 0.1 mm gap filled with vacuum has been compared to the same disbond
filled with air. This shows the effect of heat flow through the air in a disbond. The
reduction of the maximum thermal contrast (RT) caused by heat flow through the air has
been calculated by
v
av
T
TTRT
(4.1)
where Tv is the maximum thermal contrast from the artificial disbond filled with vacuum
and Ta is the maximum thermal contrast from the artificial disbond filled with air.
Secondly, the maximum thermal contrast achieved from a 0.1mm thick artificial disbond
filled with vacuum has been compared to that from an FBH of the same diameter, also
filled with vacuum. This shows the effect of lateral heat flow around the disbond tips to
its cooler underside. The reduction of the maximum thermal contrast (RL) caused by
lateral heat flow to the cooler underside has been calculated by
f
vf
T
TTRL
(4.2)
where Tf is the maximum thermal contrast from the FBH filled with vacuum.
As can be seen in Figure 4.6, both lateral heat flow and heat flow through the disbond
reduce the maximum thermal contrast. For a small diameter disbond, lateral heat flow
has the larger effect, whereas for a large diameter artificial disbond, heat flow through
the air gap is more important. The results therefore show that simulating a real disbond
with a flat bottomed hole (FBH) of the same diameter will over-estimate the thermal
contrast obtained in practice.
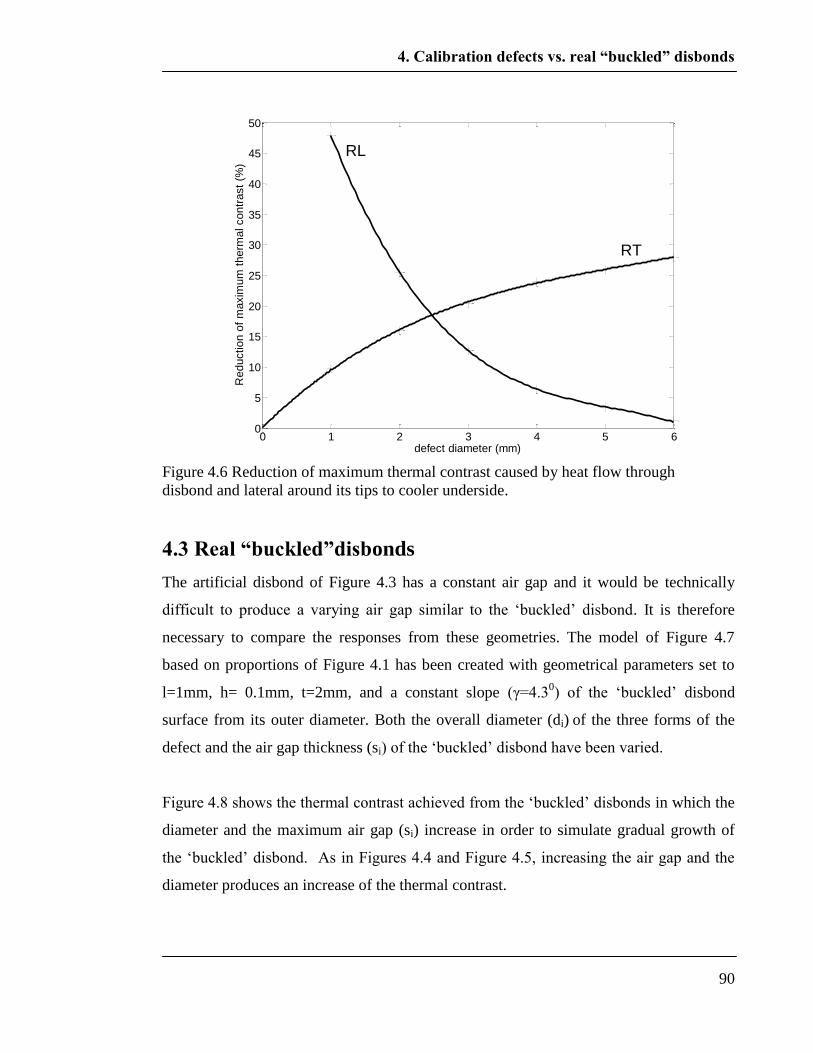
4. Calibration defects vs. real “buckled” disbonds
90
Figure 4.6 Reduction of maximum thermal contrast caused by heat flow through
disbond and lateral around its tips to cooler underside.
4.3 Real “buckled”disbonds
The artificial disbond of Figure 4.3 has a constant air gap and it would be technically
difficult to produce a varying air gap similar to the „buckled‟ disbond. It is therefore
necessary to compare the responses from these geometries. The model of Figure 4.7
based on proportions of Figure 4.1 has been created with geometrical parameters set to
l=1mm, h= 0.1mm, t=2mm, and a constant slope (γ=4.30) of the „buckled‟ disbond
surface from its outer diameter. Both the overall diameter (di) of the three forms of the
defect and the air gap thickness (si) of the „buckled‟ disbond have been varied.
Figure 4.8 shows the thermal contrast achieved from the „buckled‟ disbonds in which the
diameter and the maximum air gap (si) increase in order to simulate gradual growth of
the „buckled‟ disbond. As in Figures 4.4 and Figure 4.5, increasing the air gap and the
diameter produces an increase of the thermal contrast.
0 1 2 3 4 5 60
5
10
15
20
25
30
35
40
45
50
defect diameter (mm)
Re
ductio
n o
f m
axim
um
th
erm
al co
ntr
ast
(%)
RL
RT
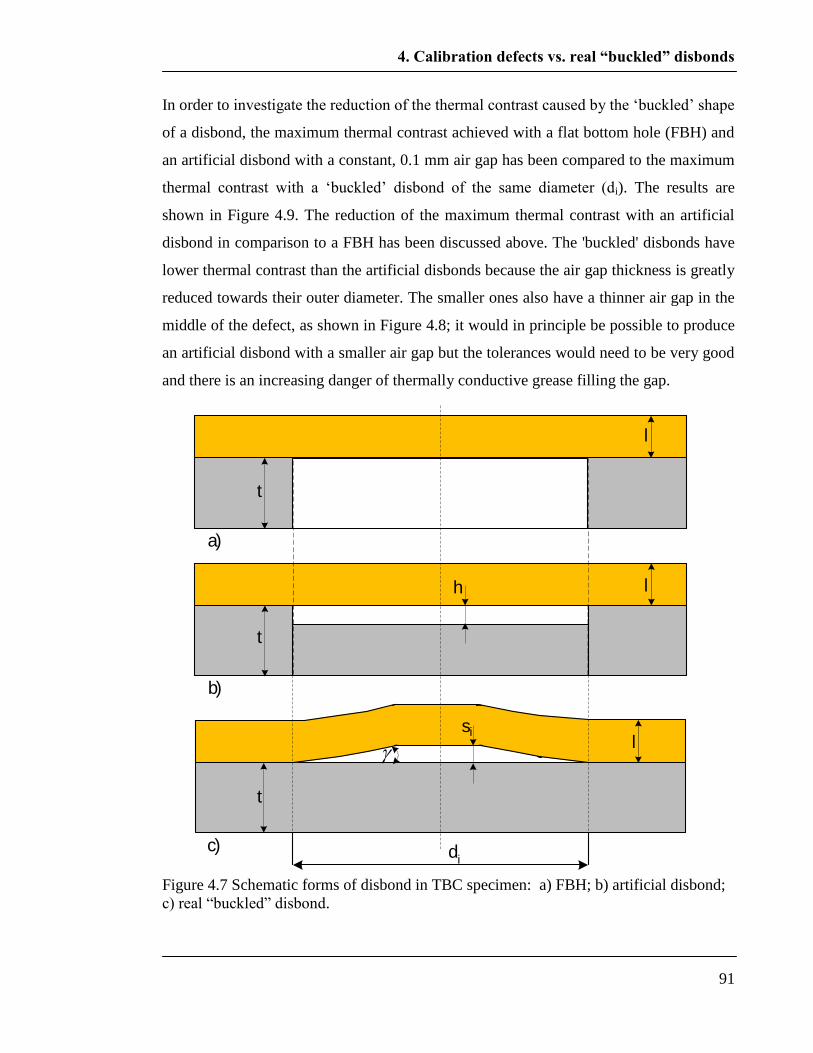
4. Calibration defects vs. real “buckled” disbonds
91
In order to investigate the reduction of the thermal contrast caused by the „buckled‟ shape
of a disbond, the maximum thermal contrast achieved with a flat bottom hole (FBH) and
an artificial disbond with a constant, 0.1 mm air gap has been compared to the maximum
thermal contrast with a „buckled‟ disbond of the same diameter (di). The results are
shown in Figure 4.9. The reduction of the maximum thermal contrast with an artificial
disbond in comparison to a FBH has been discussed above. The 'buckled' disbonds have
lower thermal contrast than the artificial disbonds because the air gap thickness is greatly
reduced towards their outer diameter. The smaller ones also have a thinner air gap in the
middle of the defect, as shown in Figure 4.8; it would in principle be possible to produce
an artificial disbond with a smaller air gap but the tolerances would need to be very good
and there is an increasing danger of thermally conductive grease filling the gap.
Figure 4.7 Schematic forms of disbond in TBC specimen: a) FBH; b) artificial disbond;
c) real “buckled” disbond.
t
l
a)
t
l
b)
h
t
lsi
di
c)
4. Calibration defects vs. real “buckled” disbonds
92
The results therefore show that simulating a „buckled‟ disbond with either a FBH or an
artificial disbond of the same diameter will always over-estimate the thermal contrast
obtained in practice. This suggests that in order to obtain the same thermal contrast with
an artificial calibration defect as that obtained with a real 'buckled' defect it will be
necessary to use a smaller diameter artificial defect (with the artificial disbond it would
in principle be possible to vary the air gap, but in practice this is difficult, as discussed
above.) Figure 4.9 shows the predicted maximum thermal contrast as a function of
diameter for the three types of defect. The dotted lines show that a 3mm 'buckled'
disbond has the same maximum thermal contrast as a 2.3 mm diameter artificial disbond
or a 1.8 mm diameter FBH; the corresponding sizes for other diameter disbonds are
shown in the inset table.
Figure 4.8 Finite element prediction for combined effect of diameter and air gap of
„buckled‟ disbond on thermal contrast (thickness of TBC=1mm, αTBC= 0.627*10-6
m2/s,
thickness of substrate =2mm)
1 2 3 4 50
0.1
0.2
0.3
0.4
0.5
time (sec)
Th
erm
al co
ntr
ast
d=1mm, s=0.025mm
d=2mm, s=0.05mm
d=3mm, s=0.075mm
d=4mm, s=0.1mm
d=5mm, s=0.125mm
d=6mm, s=0.15mm
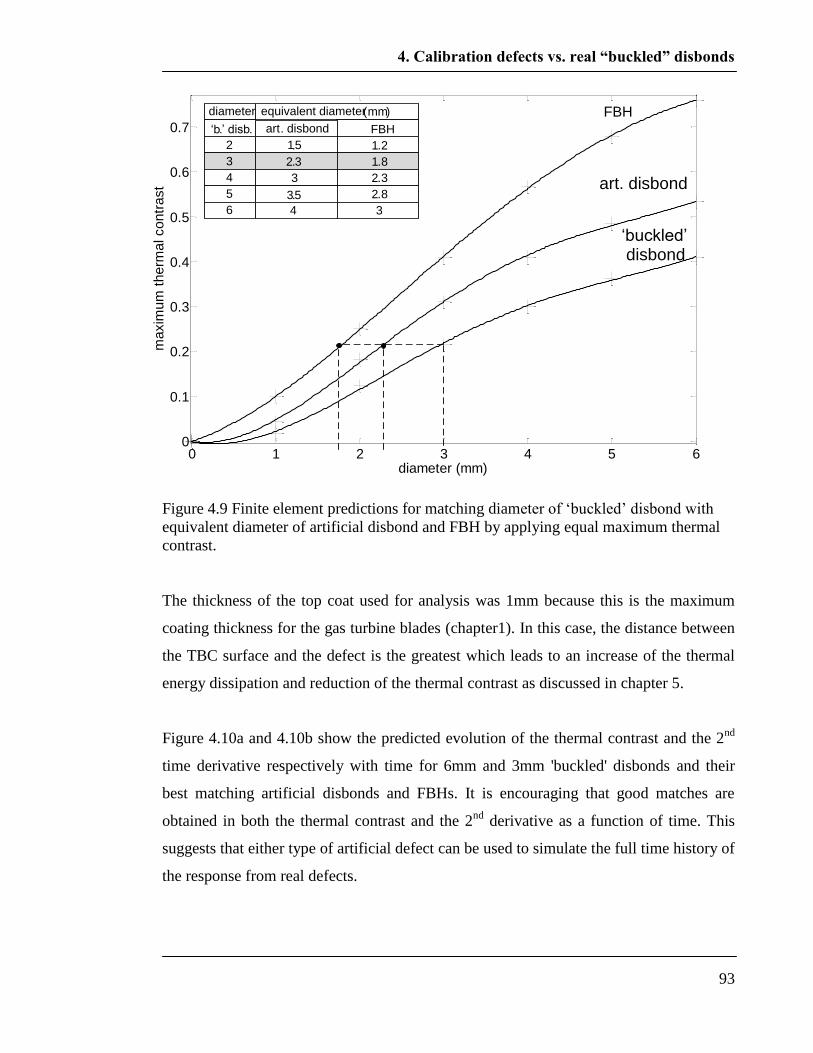
4. Calibration defects vs. real “buckled” disbonds
93
Figure 4.9 Finite element predictions for matching diameter of „buckled‟ disbond with
equivalent diameter of artificial disbond and FBH by applying equal maximum thermal
contrast.
The thickness of the top coat used for analysis was 1mm because this is the maximum
coating thickness for the gas turbine blades (chapter1). In this case, the distance between
the TBC surface and the defect is the greatest which leads to an increase of the thermal
energy dissipation and reduction of the thermal contrast as discussed in chapter 5.
Figure 4.10a and 4.10b show the predicted evolution of the thermal contrast and the 2nd
time derivative respectively with time for 6mm and 3mm 'buckled' disbonds and their
best matching artificial disbonds and FBHs. It is encouraging that good matches are
obtained in both the thermal contrast and the 2nd
derivative as a function of time. This
suggests that either type of artificial defect can be used to simulate the full time history of
the response from real defects.
0 1 2 3 4 5 60
0.1
0.2
0.3
0.4
0.5
0.6
0.7
diameter (mm)
ma
xim
um
th
erm
al co
ntr
ast
diameter
‘b.’ disb.
equivalent diameter (mm)
FBH
2
3
4
5
6
1.2
1.8
2.3
2.8
3
art. disbond
1.5
2.3
3
3.5
4
FBH
art. disbond
‘buckled’ disbond
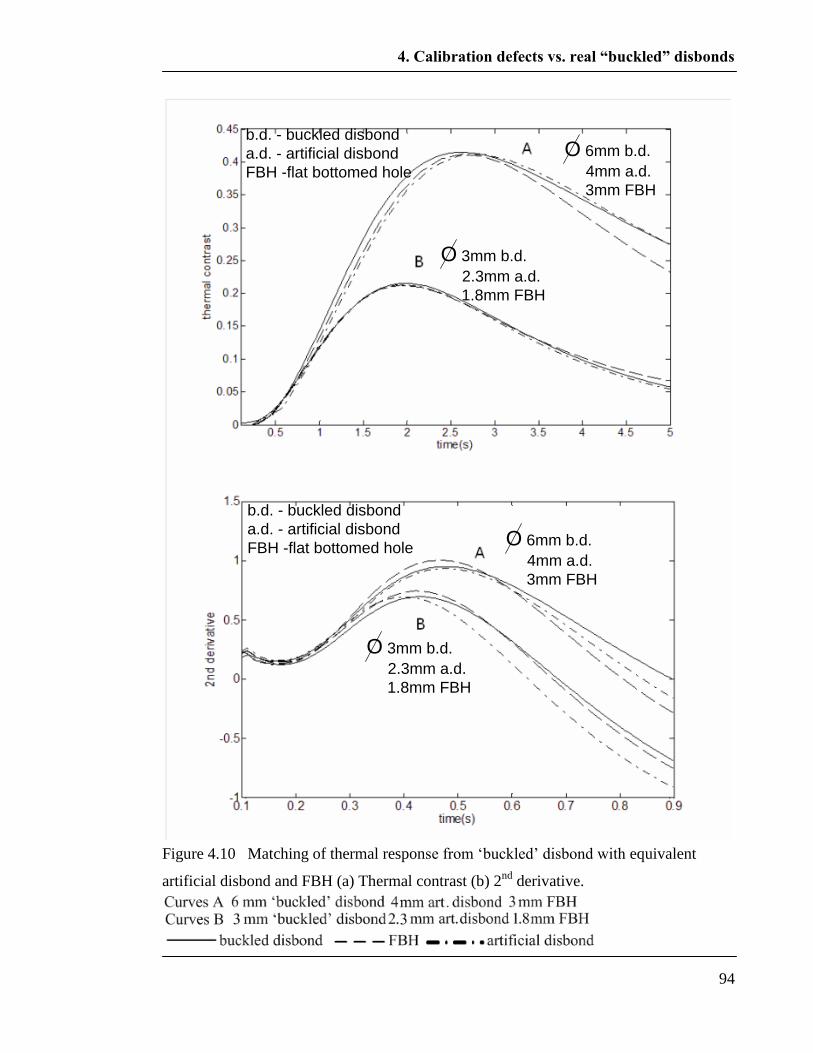
4. Calibration defects vs. real “buckled” disbonds
94
O 6mm b.d.
4mm a.d.
3mm FBH
O 6mm b.d.
4mm a.d.
3mm FBH
O 3mm b.d.
2.3mm a.d.
1.8mm FBH
O 3mm b.d.
2.3mm a.d.
1.8mm FBH
b.d. - buckled disbond
a.d. - artificial disbond
FBH -flat bottomed hole
b.d. - buckled disbond
a.d. - artificial disbond
FBH -flat bottomed hole
Figure 4.10 Matching of thermal response from „buckled‟ disbond with equivalent
artificial disbond and FBH (a) Thermal contrast (b) 2nd
derivative.
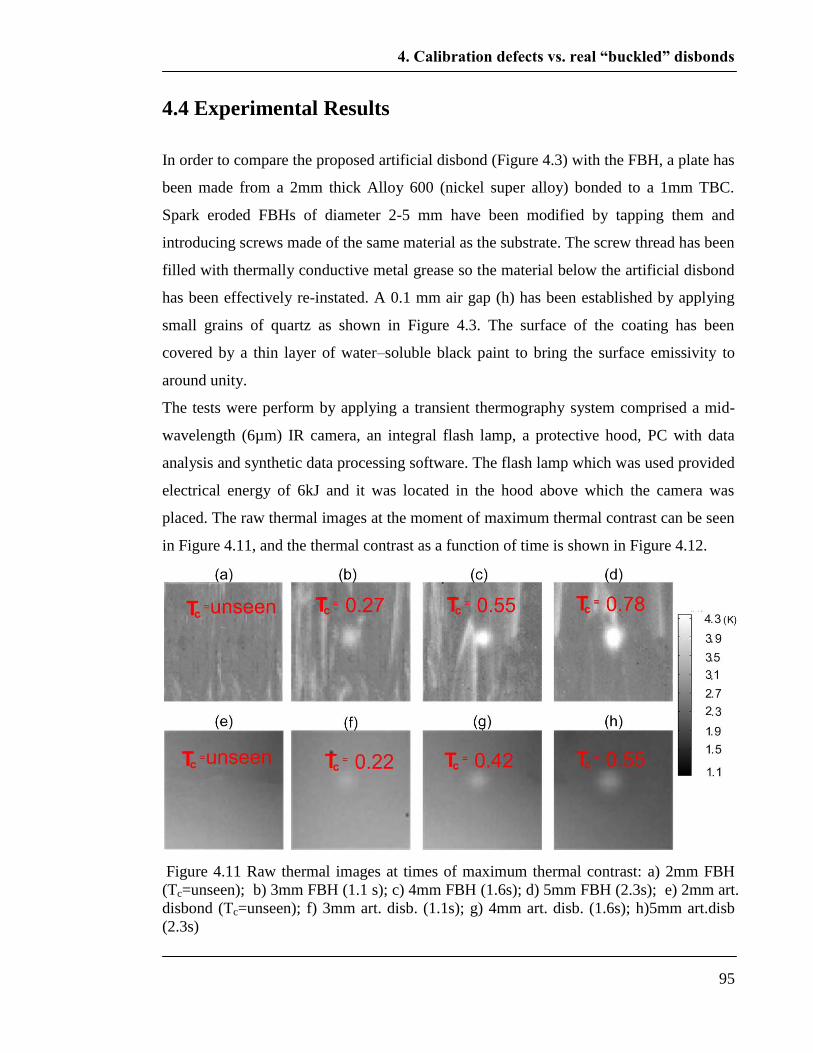
4. Calibration defects vs. real “buckled” disbonds
95
4.4 Experimental Results
In order to compare the proposed artificial disbond (Figure 4.3) with the FBH, a plate has
been made from a 2mm thick Alloy 600 (nickel super alloy) bonded to a 1mm TBC.
Spark eroded FBHs of diameter 2-5 mm have been modified by tapping them and
introducing screws made of the same material as the substrate. The screw thread has been
filled with thermally conductive metal grease so the material below the artificial disbond
has been effectively re-instated. A 0.1 mm air gap (h) has been established by applying
small grains of quartz as shown in Figure 4.3. The surface of the coating has been
covered by a thin layer of water–soluble black paint to bring the surface emissivity to
around unity.
The tests were perform by applying a transient thermography system comprised a mid-
wavelength (6µm) IR camera, an integral flash lamp, a protective hood, PC with data
analysis and synthetic data processing software. The flash lamp which was used provided
electrical energy of 6kJ and it was located in the hood above which the camera was
placed. The raw thermal images at the moment of maximum thermal contrast can be seen
in Figure 4.11, and the thermal contrast as a function of time is shown in Figure 4.12.
Figure 4.11 Raw thermal images at times of maximum thermal contrast: a) 2mm FBH
(Tc=unseen); b) 3mm FBH (1.1 s); c) 4mm FBH (1.6s); d) 5mm FBH (2.3s); e) 2mm art.
disbond (Tc=unseen); f) 3mm art. disb. (1.1s); g) 4mm art. disb. (1.6s); h)5mm art.disb
(2.3s)
4. Calibration defects vs. real “buckled” disbonds
96
The curves of Figure 4.12 have been smoothed by applying a polynominal fit in order to
reduce the influence of random noise. Figure 4.12 clearly shows the reduction of the
thermal contrast from the artificial disbonds in comparison to the FBHs of the same
diameter. It is also easy to notice the decrease of the thermal contrast together with the
diameter of the defects. The signals from 2mm FBH and the 2mm artificial disbond were
so poor that the thermal contrast in the Figure 4.11a could not be detected.
Figures 4.12a and 4.12b show reasonable agreement between the predicted and measured
evolution of the thermal contrast with time for the 5mm and 4mm diameter defects
respectively. The agreement for 3mm diameter defects in Figure 4.12c is less good,
possibly as a result of manufacturing inaccuracies. The diameter of the manufactured
3mm FBH and the artificial disbond might have been slightly smaller than in the
simulation set up; therefore, the effect of the lateral heat flow around the defect (section
4.6) could cause significant differences between the test and the simulation.
Figure 4.13 shows improvements in defect detection by applying of the 2nd
derivative
processing to the raw thermal images using MOSAIQ (www.thermalwave.com/mosaiq)
software: using this it is possible to detect the 2 mm FBH. The images shown correspond
to the times when the 2nd
derivative curves reached their maxima (see Figure 3.23).
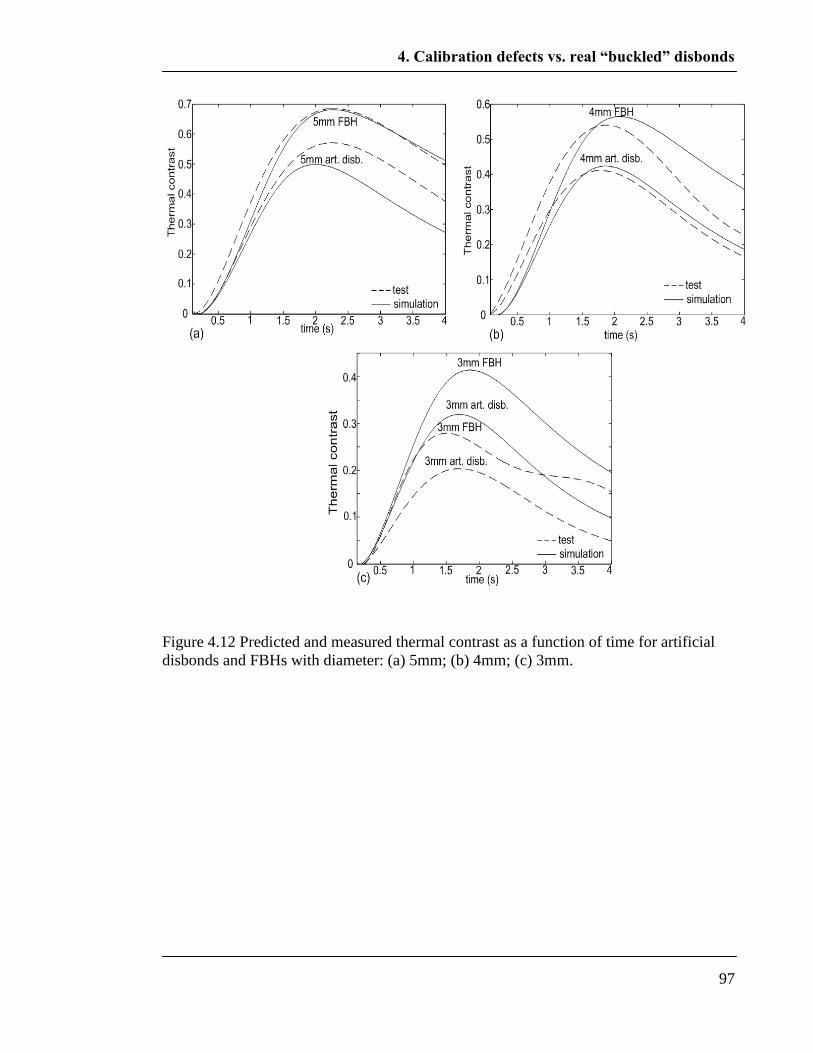
4. Calibration defects vs. real “buckled” disbonds
97
Figure 4.12 Predicted and measured thermal contrast as a function of time for artificial
disbonds and FBHs with diameter: (a) 5mm; (b) 4mm; (c) 3mm.
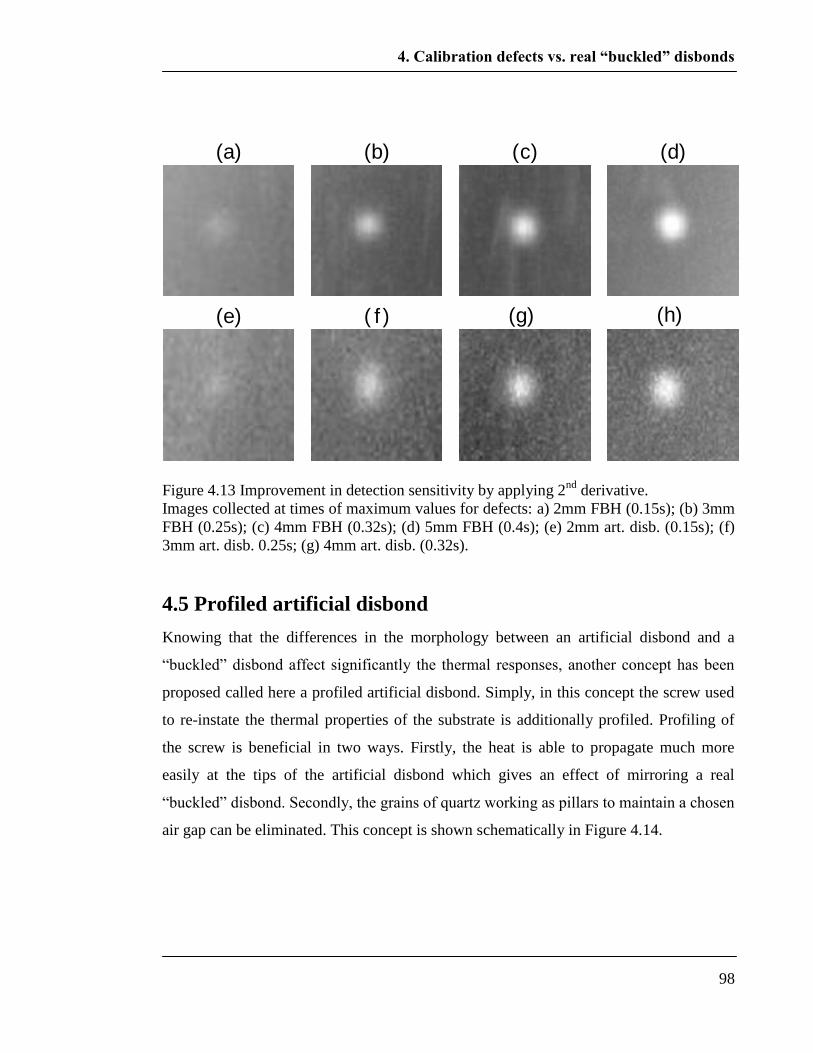
4. Calibration defects vs. real “buckled” disbonds
98
Figure 4.13 Improvement in detection sensitivity by applying 2nd
derivative.
Images collected at times of maximum values for defects: a) 2mm FBH (0.15s); (b) 3mm
FBH (0.25s); (c) 4mm FBH (0.32s); (d) 5mm FBH (0.4s); (e) 2mm art. disb. (0.15s); (f)
3mm art. disb. 0.25s; (g) 4mm art. disb. (0.32s).
4.5 Profiled artificial disbond
Knowing that the differences in the morphology between an artificial disbond and a
“buckled” disbond affect significantly the thermal responses, another concept has been
proposed called here a profiled artificial disbond. Simply, in this concept the screw used
to re-instate the thermal properties of the substrate is additionally profiled. Profiling of
the screw is beneficial in two ways. Firstly, the heat is able to propagate much more
easily at the tips of the artificial disbond which gives an effect of mirroring a real
“buckled” disbond. Secondly, the grains of quartz working as pillars to maintain a chosen
air gap can be eliminated. This concept is shown schematically in Figure 4.14.
(a) (b) (c) (d)
(e) ( f ) (g) (h)
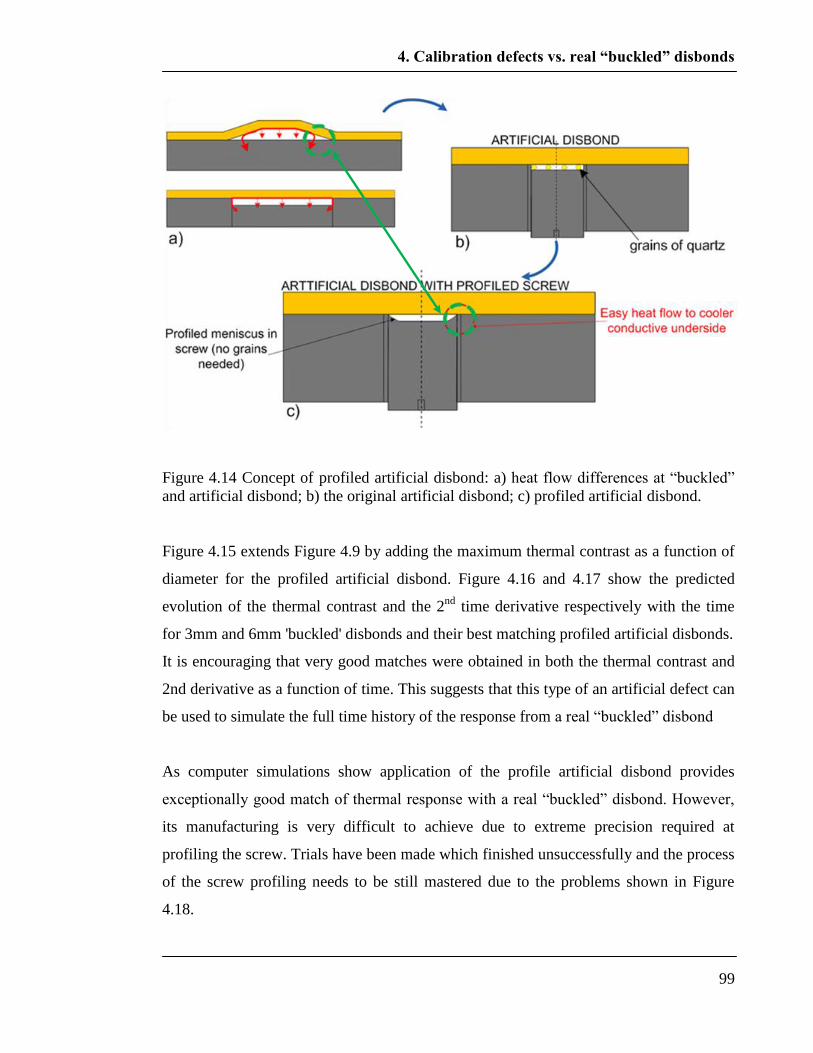
4. Calibration defects vs. real “buckled” disbonds
99
Figure 4.14 Concept of profiled artificial disbond: a) heat flow differences at “buckled”
and artificial disbond; b) the original artificial disbond; c) profiled artificial disbond.
Figure 4.15 extends Figure 4.9 by adding the maximum thermal contrast as a function of
diameter for the profiled artificial disbond. Figure 4.16 and 4.17 show the predicted
evolution of the thermal contrast and the 2nd
time derivative respectively with the time
for 3mm and 6mm 'buckled' disbonds and their best matching profiled artificial disbonds.
It is encouraging that very good matches were obtained in both the thermal contrast and
2nd derivative as a function of time. This suggests that this type of an artificial defect can
be used to simulate the full time history of the response from a real “buckled” disbond
As computer simulations show application of the profile artificial disbond provides
exceptionally good match of thermal response with a real “buckled” disbond. However,
its manufacturing is very difficult to achieve due to extreme precision required at
profiling the screw. Trials have been made which finished unsuccessfully and the process
of the screw profiling needs to be still mastered due to the problems shown in Figure
4.18.
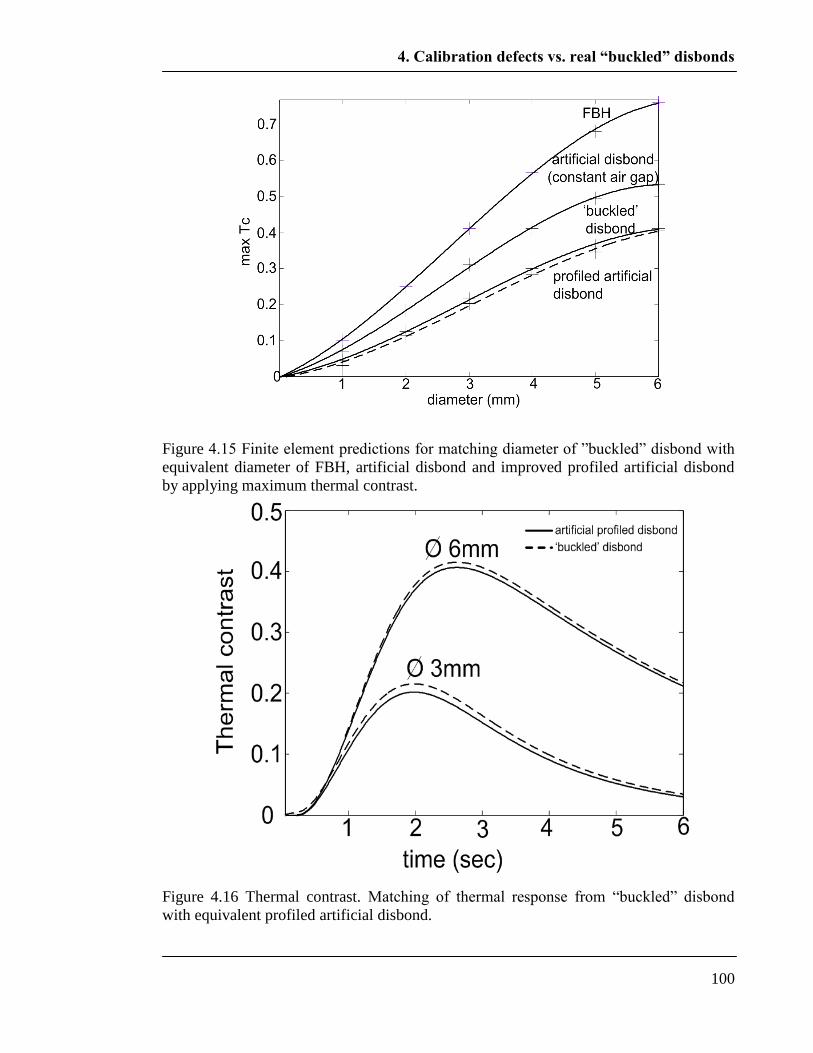
4. Calibration defects vs. real “buckled” disbonds
100
Figure 4.15 Finite element predictions for matching diameter of ”buckled” disbond with
equivalent diameter of FBH, artificial disbond and improved profiled artificial disbond
by applying maximum thermal contrast.
Figure 4.16 Thermal contrast. Matching of thermal response from “buckled” disbond
with equivalent profiled artificial disbond.
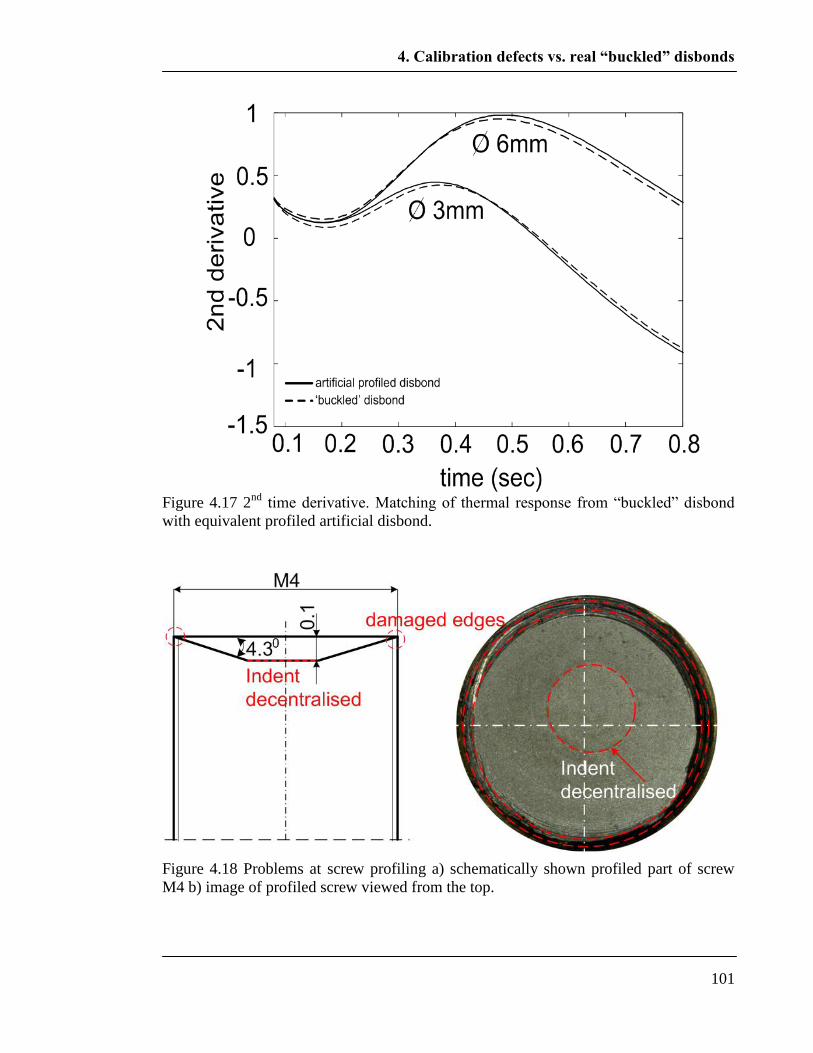
4. Calibration defects vs. real “buckled” disbonds
101
Figure 4.17 2
nd time derivative. Matching of thermal response from “buckled” disbond
with equivalent profiled artificial disbond.
Figure 4.18 Problems at screw profiling a) schematically shown profiled part of screw
M4 b) image of profiled screw viewed from the top.
4. Calibration defects vs. real “buckled” disbonds
102
4.6 Conclusions
In this chapter, it has been shown using finite element predictions and experimental tests
that a disbond or a delamination with a uniform thickness air gap can be accurately
simulated with an artificial defect formed by plugging a flat bottomed hole in order
effectively to replace the material below the disbond/delamination removed when
machining the hole. The air gap thickness is a critical parameter in the thermal response
and is maintained in the artificial defect by appropriate sized quartz particles.
Disbonds in thermal barrier coatings are often 'buckled' i.e. they have a non-uniform air
gap. It would be very difficult to simulate these defects with a similar geometry. Instead
it has been shown that they can be simulated by either an artificial disbond with constant
air gap thickness and different diameter than the real defect, or by a flat bottomed hole
(FBH), again of smaller diameter. Three dimensional finite element analysis can be used
to derive the appropriate dimensions of the artificial defects. Additionally, the chapter
proposes a concept of a profiled artificial disbond which would accurately simulate the
full time history of the thermal responses from a real “buckled” disbond; however, this
has proved very difficult to manufacture.
The predictions and experiments have been focused on defects in thermal barrier coatings
which are porous and so air will enter a disbond. If a disbond were to hold a vacuum the
thermal contrast would be increased and a flat bottomed hole of the same diameter as the
defect would become a reasonable representation, at least for larger defects.

5. Properties of TBC system and their effect on thermal response
103
Chapter 5
Properties of TBC system and their effect
on thermal response
5.1 Introduction
In a TBC gas turbine blade, geometrical parameters such as the substrate and the coating
thickness are not constant. The thickness of the substrate varies due to the specific
construction of the blade in which thicker regions of substrate form supporting ribs and
thinner areas may be above cooling channels. The coating thickness varies as well due to
some inaccuracy of the plasma spraying and also due to the erosion in service.
Because transient thermography is already applied for assessment of the cooling channels
in uncoated turbine blades it is important to investigate how the position of a disbond
located above a substrate of various thicknesses might affect the thermal response. It is
also important to investigate how the coating thickness affects the thermal responses
knowing that in the case of a thicker coating the heat must be conducted over a longer
distance in order to reach a defect.
It is also known that the coating conductivity changes during the service of a blade. It
increases at the beginning and then decreases below its original value (Sun, 2008).
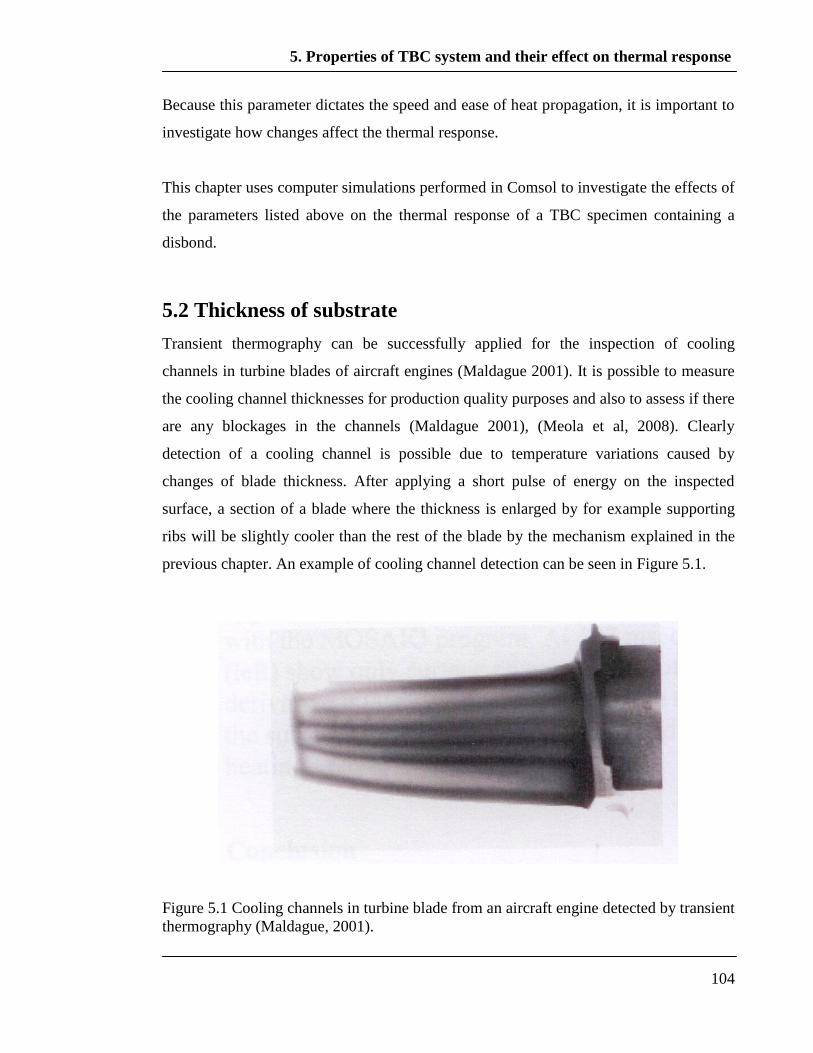
5. Properties of TBC system and their effect on thermal response
104
Because this parameter dictates the speed and ease of heat propagation, it is important to
investigate how changes affect the thermal response.
This chapter uses computer simulations performed in Comsol to investigate the effects of
the parameters listed above on the thermal response of a TBC specimen containing a
disbond.
5.2 Thickness of substrate
Transient thermography can be successfully applied for the inspection of cooling
channels in turbine blades of aircraft engines (Maldague 2001). It is possible to measure
the cooling channel thicknesses for production quality purposes and also to assess if there
are any blockages in the channels (Maldague 2001), (Meola et al, 2008). Clearly
detection of a cooling channel is possible due to temperature variations caused by
changes of blade thickness. After applying a short pulse of energy on the inspected
surface, a section of a blade where the thickness is enlarged by for example supporting
ribs will be slightly cooler than the rest of the blade by the mechanism explained in the
previous chapter. An example of cooling channel detection can be seen in Figure 5.1.
Figure 5.1 Cooling channels in turbine blade from an aircraft engine detected by transient
thermography (Maldague, 2001).

5. Properties of TBC system and their effect on thermal response
105
As can be seen, the changes in the cross section thickness affect the thermal response of
the tested surface. Because the target of the project is detection of disbonds between the
ceramic coating and the substrate in a gas turbine blade, it becomes important to
investigate how changes of the substrate thickness affect the thermal responses when a
disbond is placed in various locations. In a real situation (Figure 5.2), a disbond might
appear above a thick substrate thickness region (supporting ribs- I) above a thin thickness
region (II) or between them (III).
A set of simple 2D models based on Figure 5.2 have been created with geometrical
parameters set to the TBC thickness 0.6 mm, the diameter of artificial disbond 4mm, its
air gap thickness 0.1mm, the substrate thicknesses of 1mm, 2mm, 3mm (Figure 5.3). For
each model the pulse of energy J0=10kJ/m2 was applied and the thermal contrast and the
2nd
derivative to log-log surface cooling have been calculated by taking a point just above
a disbond (red) and a reference point (green) (Figure 5.3).
Figure 5.4 shows the thermal contrast as a function of time calculated for the
configurations of Figure 5.3. The 2nd
time derivative calculated from the points above the
disbonds and from the reference points can be seen in Figure 5.5.
Figure 5.2 Cross section of a coated gas turbine blade. I, II, III - various possible
positions of disbond (red) and (4) reference points (green). Different possible reference
points associated with the disbonds I, II, III are also shown.
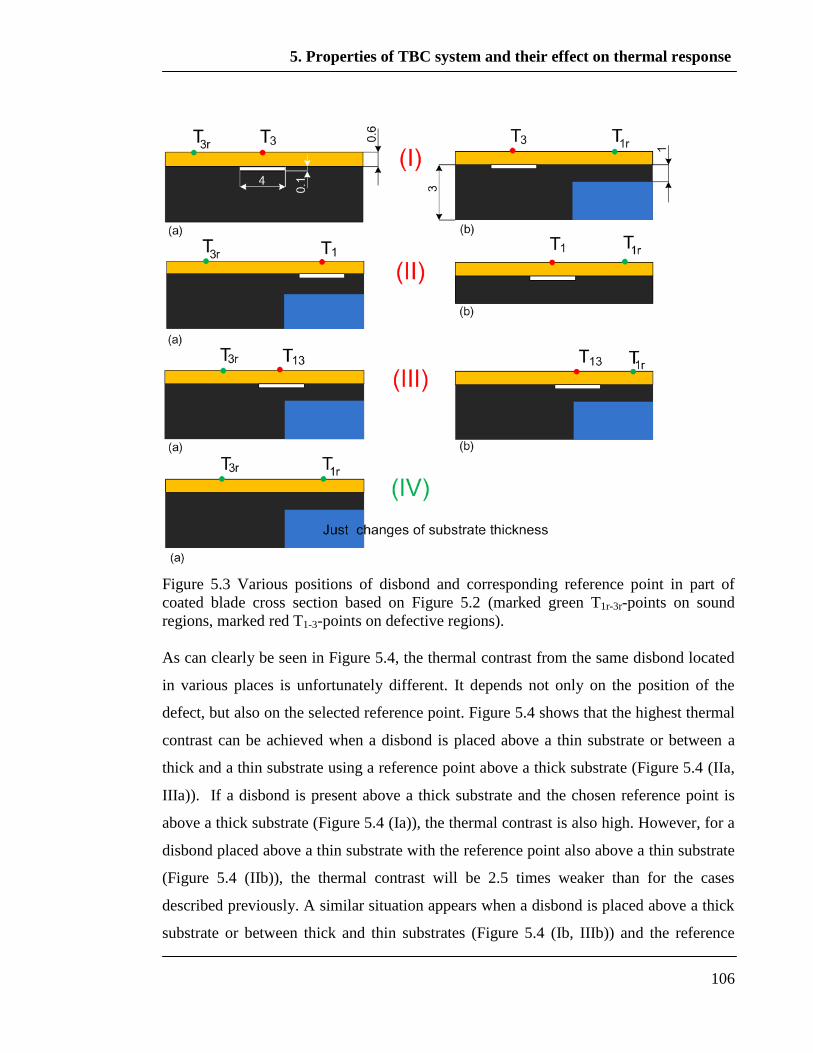
5. Properties of TBC system and their effect on thermal response
106
Figure 5.3 Various positions of disbond and corresponding reference point in part of
coated blade cross section based on Figure 5.2 (marked green T1r-3r-points on sound
regions, marked red T1-3-points on defective regions).
As can clearly be seen in Figure 5.4, the thermal contrast from the same disbond located
in various places is unfortunately different. It depends not only on the position of the
defect, but also on the selected reference point. Figure 5.4 shows that the highest thermal
contrast can be achieved when a disbond is placed above a thin substrate or between a
thick and a thin substrate using a reference point above a thick substrate (Figure 5.4 (IIa,
IIIa)). If a disbond is present above a thick substrate and the chosen reference point is
above a thick substrate (Figure 5.4 (Ia)), the thermal contrast is also high. However, for a
disbond placed above a thin substrate with the reference point also above a thin substrate
(Figure 5.4 (IIb)), the thermal contrast will be 2.5 times weaker than for the cases
described previously. A similar situation appears when a disbond is placed above a thick
substrate or between thick and thin substrates (Figure 5.4 (Ib, IIIb)) and the reference

5. Properties of TBC system and their effect on thermal response
107
point is above a thin section. It is important to remember that thermal gradients are seen
in areas where the substrate thickness is changing (Figure 5.4 (IVa)) (Figure 5.4 (IVa))
which leads to creation of thermal contrast. It is exactly this thermal contrast that allows
the detection of the cooling channels in blades (Figure 5.4) In conclusion, the thermal
contrast produced by a disbond of a certain size strongly depends on its position and the
substrate thickness at the chosen reference point. Therefore, the thermal contrast is very
inaccurate indicator of defect size.
However, a simple solution is provided by applying the 2nd
derivative processing to the
log-log cooling curves (as discussed in the previous chapter) expressed in Figure 5.5. The
disbond at any of the locations of Figure 5.4 provides similar results, as do locations
where there is no disbond but different substrate thicknesses. It is easy to distinguish a
disbond (maximum) from the good area (minimum). The result were also obtained much
faster then the maximum thermal contrast because, if the second derivative is applied,
defect detection appears shortly after the beginning of the cooling (~0.3 sec) whereas if
the thermal contrast is used, its maximum value (the best visibility) appears much later
(~2sec). As can be seen in Figure 5.5, the time of the minima for the 2nd
time derivative
from good areas of the substrate is a function of the substrate thickness. This can be
explained by accelerated surface cooling for the thicker substrate explained in the
previous chapter.
There are suggestions of using the 2nd
derivative to measure the coating thickness
(Shepard et al, 2005), (Balageas 2010) where the peak time value is used. However, as
the simulations show (Figure 5.5), the peak time value depends not only on the thickness
of the coating (in this case 0.6mm) but also on the substrate thickness which varies in
blades. Therefore the 2nd
derivative peak time could only be used to measure a coating
thickness under the condition that the substrate thickness is constant. Unfortunately,
in the case of coated blades (which all have cooling channels), applying transient
thermography to measure the coating thickness is not reliable.
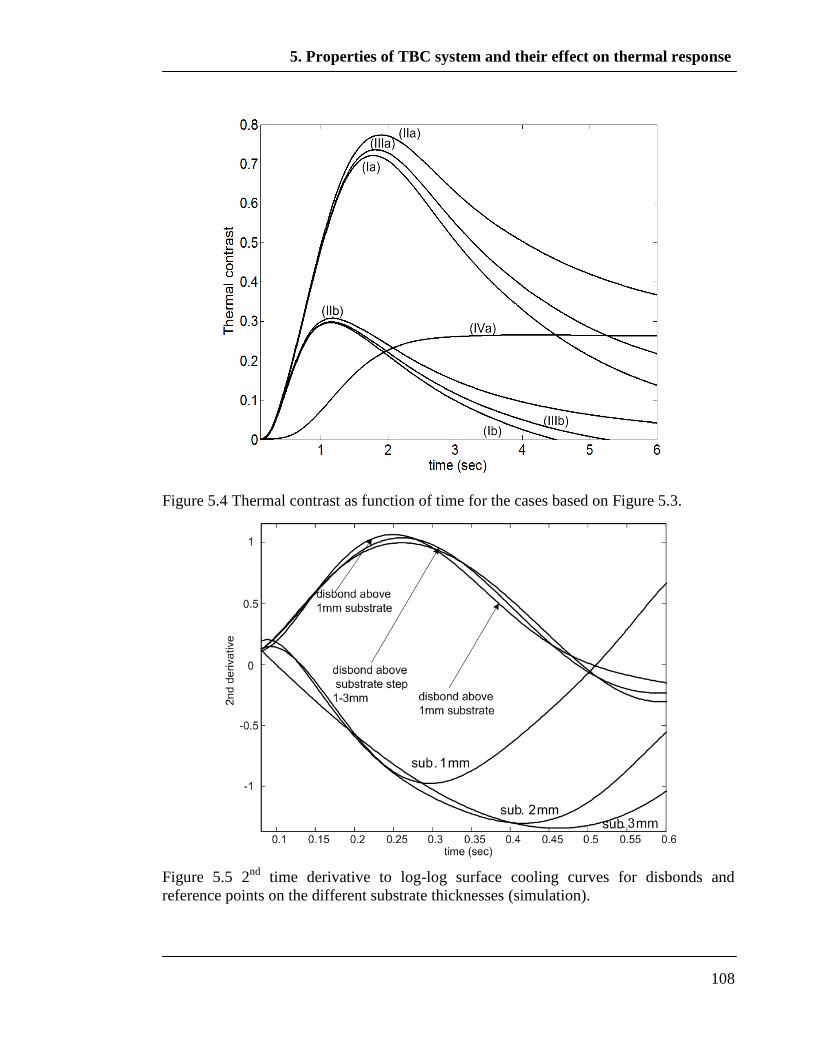
5. Properties of TBC system and their effect on thermal response
108
Figure 5.4 Thermal contrast as function of time for the cases based on Figure 5.3.
Figure 5.5 2nd
time derivative to log-log surface cooling curves for disbonds and
reference points on the different substrate thicknesses (simulation).
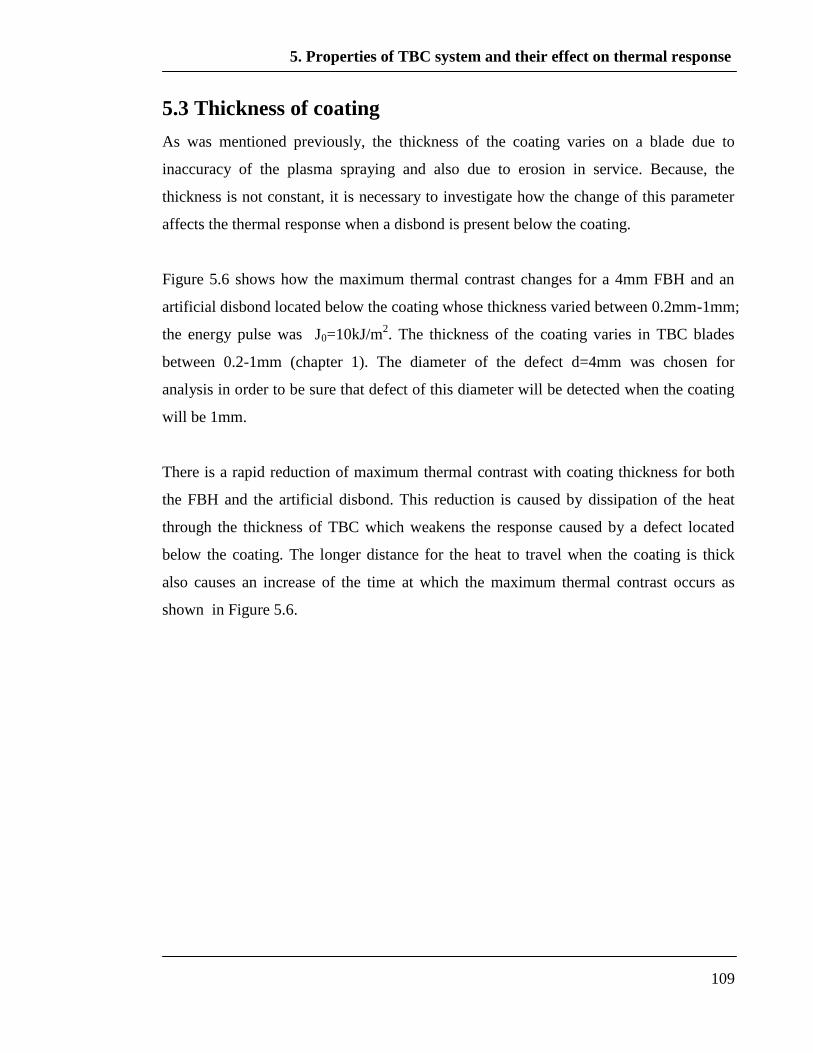
5. Properties of TBC system and their effect on thermal response
109
5.3 Thickness of coating
As was mentioned previously, the thickness of the coating varies on a blade due to
inaccuracy of the plasma spraying and also due to erosion in service. Because, the
thickness is not constant, it is necessary to investigate how the change of this parameter
affects the thermal response when a disbond is present below the coating.
Figure 5.6 shows how the maximum thermal contrast changes for a 4mm FBH and an
artificial disbond located below the coating whose thickness varied between 0.2mm-1mm;
the energy pulse was J0=10kJ/m2. The thickness of the coating varies in TBC blades
between 0.2-1mm (chapter 1). The diameter of the defect d=4mm was chosen for
analysis in order to be sure that defect of this diameter will be detected when the coating
will be 1mm.
There is a rapid reduction of maximum thermal contrast with coating thickness for both
the FBH and the artificial disbond. This reduction is caused by dissipation of the heat
through the thickness of TBC which weakens the response caused by a defect located
below the coating. The longer distance for the heat to travel when the coating is thick
also causes an increase of the time at which the maximum thermal contrast occurs as
shown in Figure 5.6.
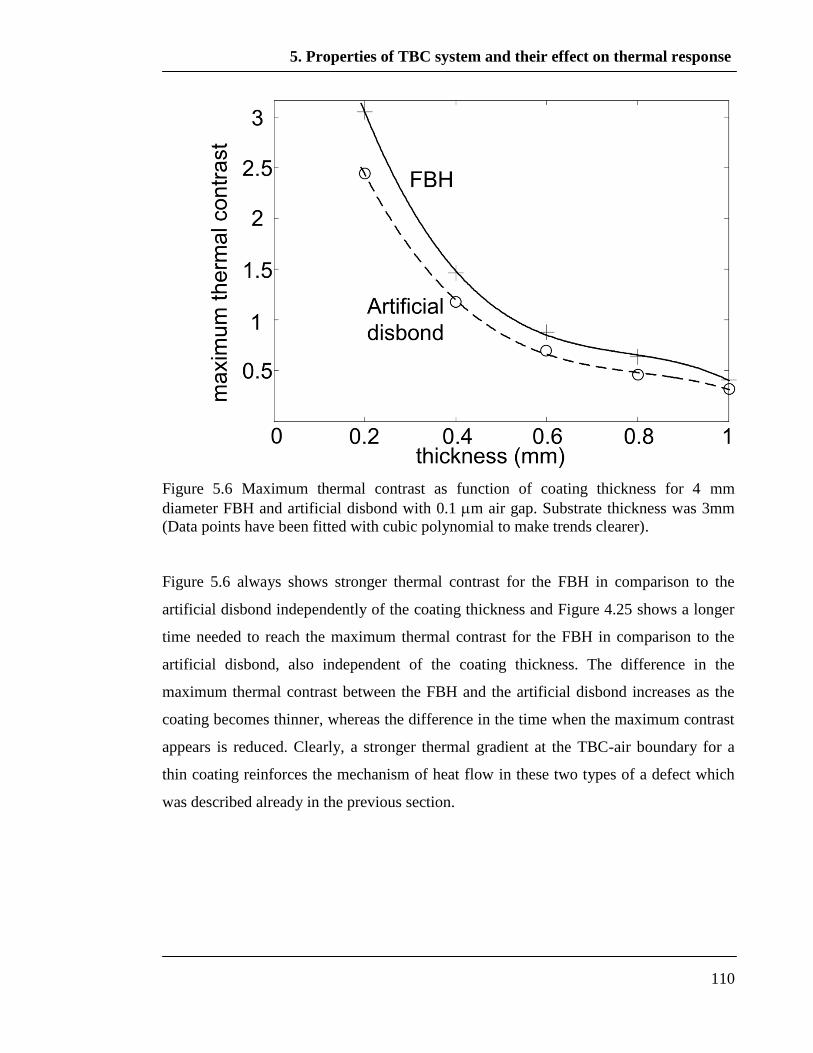
5. Properties of TBC system and their effect on thermal response
110
Figure 5.6 Maximum thermal contrast as function of coating thickness for 4 mm
diameter FBH and artificial disbond with 0.1 m air gap. Substrate thickness was 3mm
(Data points have been fitted with cubic polynomial to make trends clearer).
Figure 5.6 always shows stronger thermal contrast for the FBH in comparison to the
artificial disbond independently of the coating thickness and Figure 4.25 shows a longer
time needed to reach the maximum thermal contrast for the FBH in comparison to the
artificial disbond, also independent of the coating thickness. The difference in the
maximum thermal contrast between the FBH and the artificial disbond increases as the
coating becomes thinner, whereas the difference in the time when the maximum contrast
appears is reduced. Clearly, a stronger thermal gradient at the TBC-air boundary for a
thin coating reinforces the mechanism of heat flow in these two types of a defect which
was described already in the previous section.
5. Properties of TBC system and their effect on thermal response
111
Figure 5.7 Time of maximum thermal contrast as function of coating thickness for
defects of Figure 5.6 (Data points have been fitted with cubic polynomial to make trends
clearer).
The peak value of the 2nd
time derivative (maximum for defects and minimum for a
sound TBC system) decreases with the thickness of the coating (Figure 5.8). Clearly the
longer distance for the heat front to reach the TBC–substrate boundary in the case of a
thick coating causes dissipation of the energy and reduction of the thermal gradient on
the boundaries. For the same reason, the time of the peak value of the 2nd
derivative
increases with the thickness of the coating as shown in Figure 5.9. It is also very easy to
notice coverage of the 2nd
derivative peak time curve generated from the artificial
disbond and the FBH.
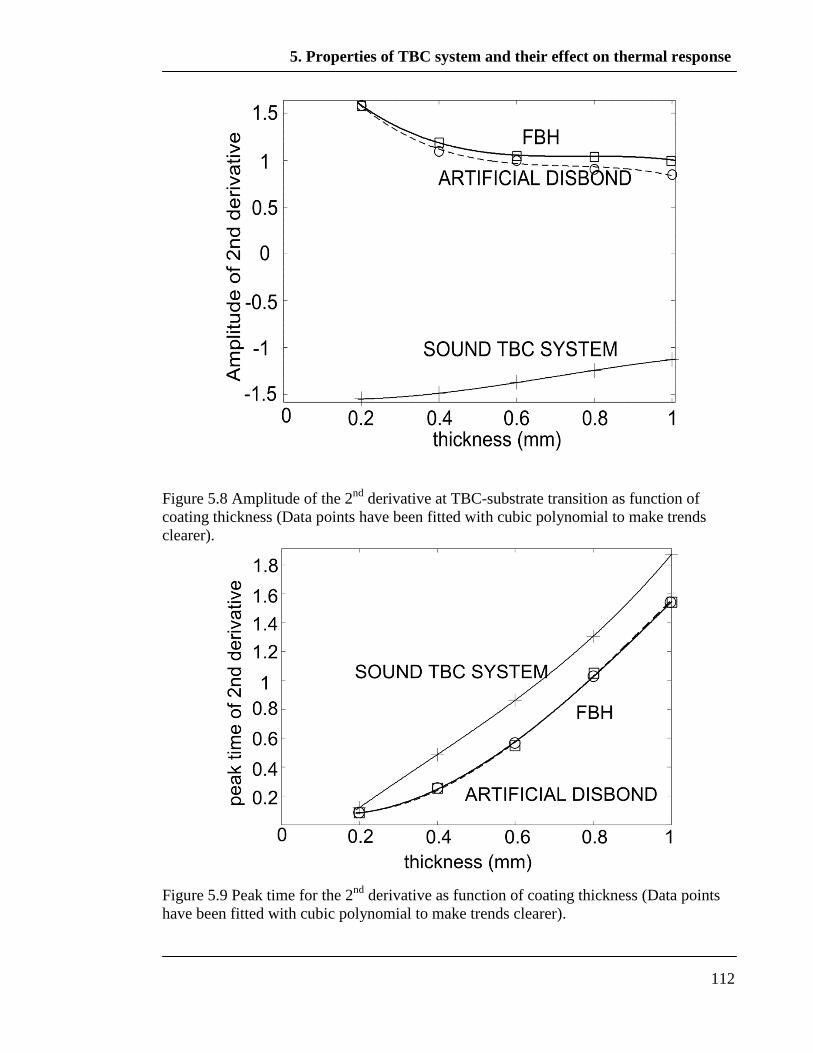
5. Properties of TBC system and their effect on thermal response
112
Figure 5.8 Amplitude of the 2nd
derivative at TBC-substrate transition as function of
coating thickness (Data points have been fitted with cubic polynomial to make trends
clearer).
Figure 5.9 Peak time for the 2nd
derivative as function of coating thickness (Data points
have been fitted with cubic polynomial to make trends clearer).
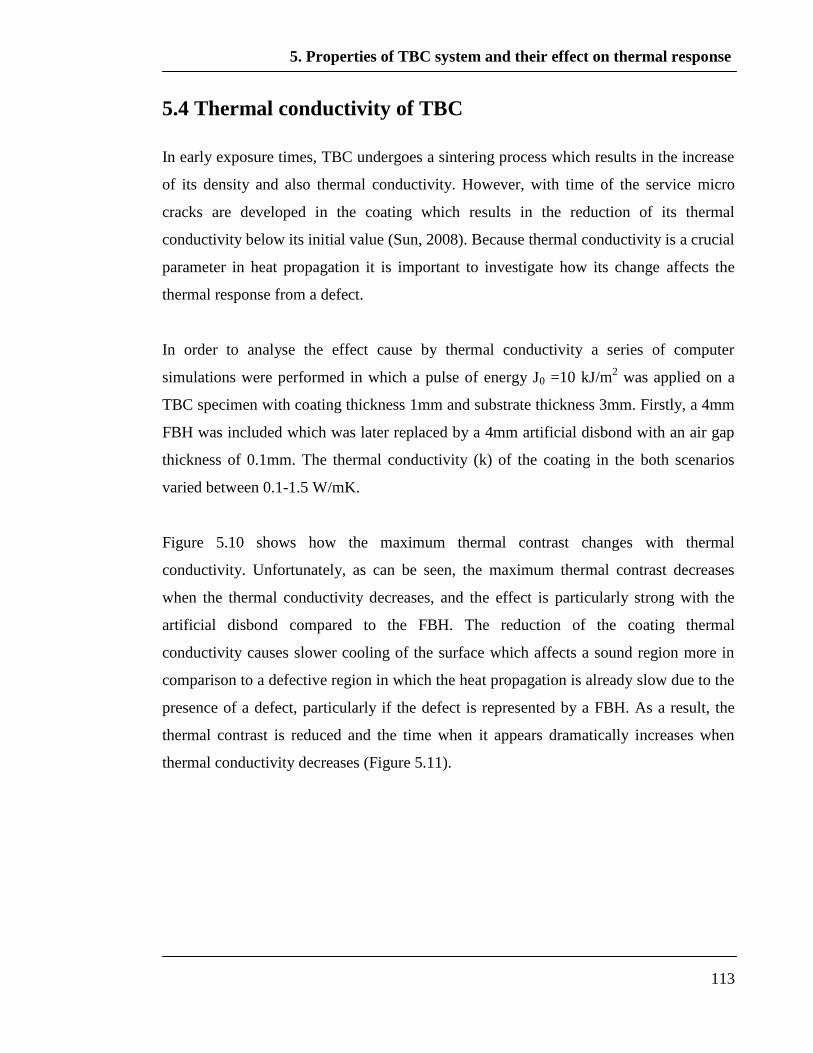
5. Properties of TBC system and their effect on thermal response
113
5.4 Thermal conductivity of TBC
In early exposure times, TBC undergoes a sintering process which results in the increase
of its density and also thermal conductivity. However, with time of the service micro
cracks are developed in the coating which results in the reduction of its thermal
conductivity below its initial value (Sun, 2008). Because thermal conductivity is a crucial
parameter in heat propagation it is important to investigate how its change affects the
thermal response from a defect.
In order to analyse the effect cause by thermal conductivity a series of computer
simulations were performed in which a pulse of energy J0 =10 kJ/m2 was applied on a
TBC specimen with coating thickness 1mm and substrate thickness 3mm. Firstly, a 4mm
FBH was included which was later replaced by a 4mm artificial disbond with an air gap
thickness of 0.1mm. The thermal conductivity (k) of the coating in the both scenarios
varied between 0.1-1.5 W/mK.
Figure 5.10 shows how the maximum thermal contrast changes with thermal
conductivity. Unfortunately, as can be seen, the maximum thermal contrast decreases
when the thermal conductivity decreases, and the effect is particularly strong with the
artificial disbond compared to the FBH. The reduction of the coating thermal
conductivity causes slower cooling of the surface which affects a sound region more in
comparison to a defective region in which the heat propagation is already slow due to the
presence of a defect, particularly if the defect is represented by a FBH. As a result, the
thermal contrast is reduced and the time when it appears dramatically increases when
thermal conductivity decreases (Figure 5.11).
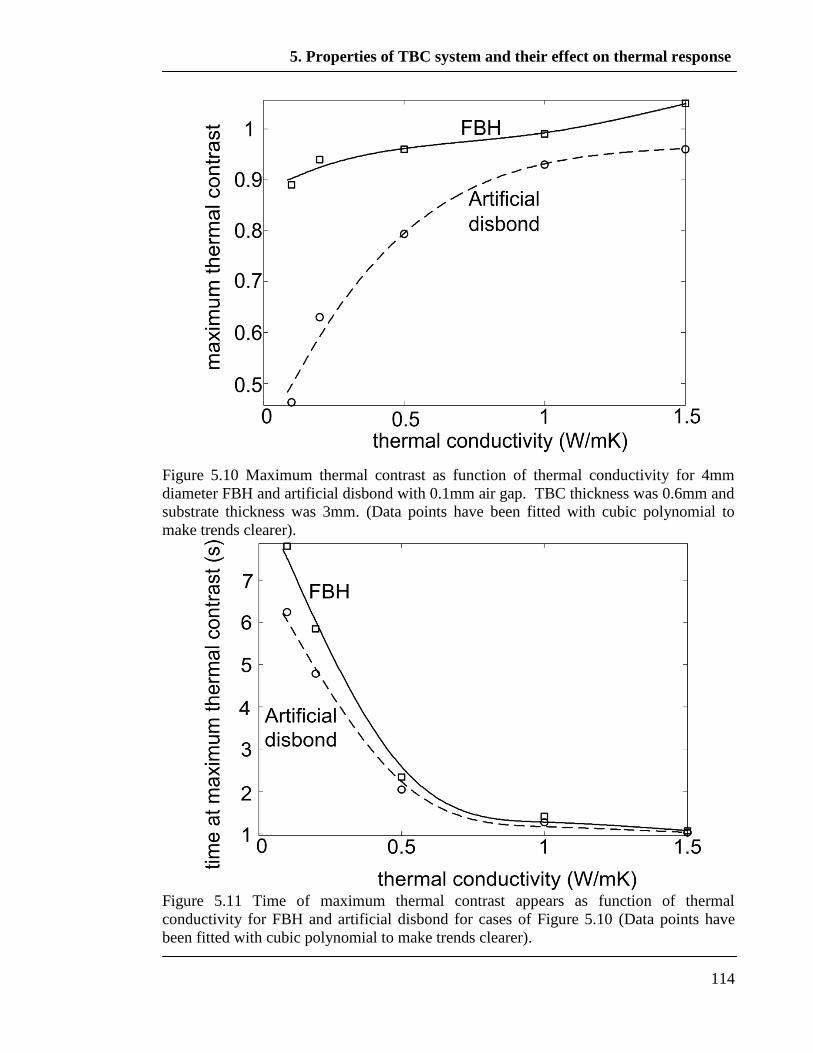
5. Properties of TBC system and their effect on thermal response
114
Figure 5.10 Maximum thermal contrast as function of thermal conductivity for 4mm
diameter FBH and artificial disbond with 0.1mm air gap. TBC thickness was 0.6mm and
substrate thickness was 3mm. (Data points have been fitted with cubic polynomial to
make trends clearer).
Figure 5.11 Time of maximum thermal contrast appears as function of thermal
conductivity for FBH and artificial disbond for cases of Figure 5.10 (Data points have
been fitted with cubic polynomial to make trends clearer).
5. Properties of TBC system and their effect on thermal response
115
Figure 5.12 Amplitude of the 2nd
derivative at transition period TBC-substrate as
function of thermal conductivity (Data points have been fitted with cubic polynomial to
make trends clearer).
Interestingly, the peak value of the 2nd
derivative (Figure 5.12) from both defects is less
affected by thermal conductivity changes in comparison to the maximum thermal
contrast curves (Figure 5.10). It is possible to observe a similar reaction from the FBH
and from the artificial disbond. As previously explained, the sound region of the TBC
specimen cools down faster when thermal conductivity of the TBC grows which can be
seen in the decrease of the negative 2nd
derivative peak (Figure 5.12). Not surprisingly
and similar to the time at which the maximum thermal contrast appears, the time when
the 2nd
derivative peak occurs dramatically decreases when the thermal conductivity
increases and reaches a constant level at around k=1.2 W/mK (Figure 5.13).
Of course the amount of the time is much shorter (Figure 5.11, Figure 5.13) because the
discussed deviation of the surface cooling (chapter 3 Figure 3.23) appears firstly after
which the thermal contrast is gradually accumulated.
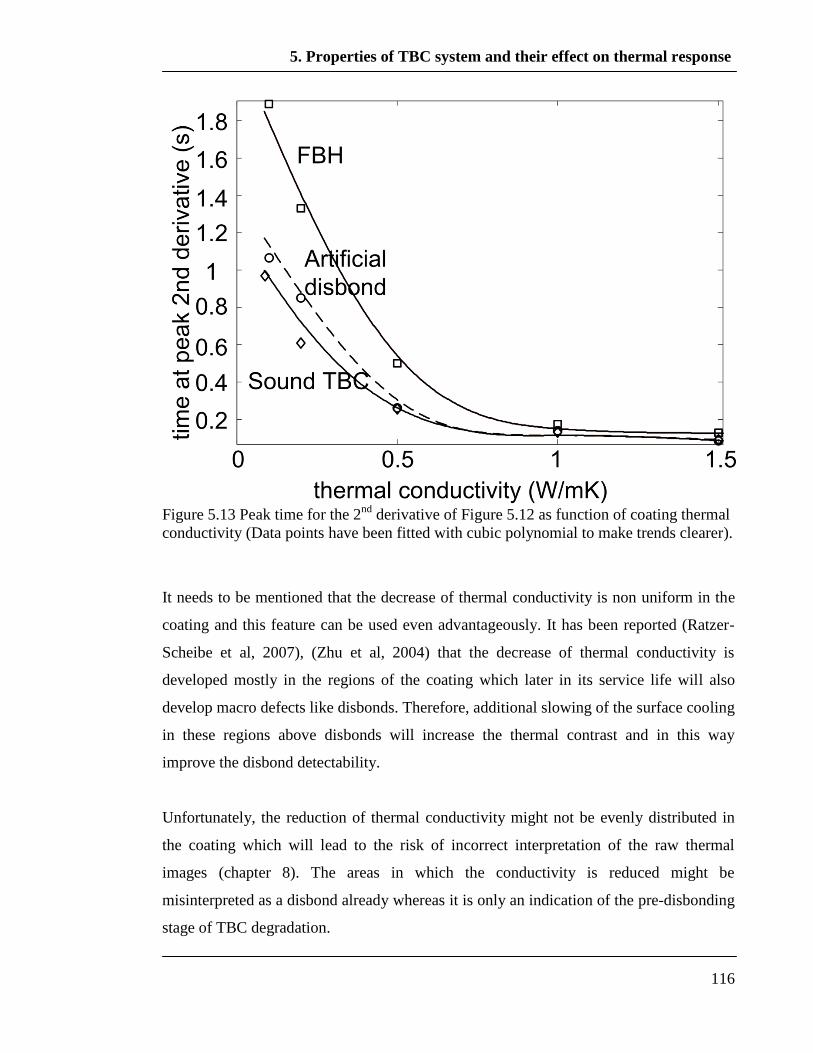
5. Properties of TBC system and their effect on thermal response
116
Figure 5.13 Peak time for the 2
nd derivative of Figure 5.12 as function of coating thermal
conductivity (Data points have been fitted with cubic polynomial to make trends clearer).
It needs to be mentioned that the decrease of thermal conductivity is non uniform in the
coating and this feature can be used even advantageously. It has been reported (Ratzer-
Scheibe et al, 2007), (Zhu et al, 2004) that the decrease of thermal conductivity is
developed mostly in the regions of the coating which later in its service life will also
develop macro defects like disbonds. Therefore, additional slowing of the surface cooling
in these regions above disbonds will increase the thermal contrast and in this way
improve the disbond detectability.
Unfortunately, the reduction of thermal conductivity might not be evenly distributed in
the coating which will lead to the risk of incorrect interpretation of the raw thermal
images (chapter 8). The areas in which the conductivity is reduced might be
misinterpreted as a disbond already whereas it is only an indication of the pre-disbonding
stage of TBC degradation.
5. Properties of TBC system and their effect on thermal response
117
5.5 Conclusions
The effects on the thermal response caused by the substrate thickness were investigated
due to a construction of a typical gas turbine blade and the effects caused by the coating
thickness and its thermal conductivity due to the influence of the harsh working
condition on these parameters.
It was shown that the value of the thermal contrast strongly depends on a position of a
disbond and of a reference point in a blade where both of the positions can be placed
above a thin, a thick or between substrate sections of the blade. Simulations indicated
inaccuracy of the thermal contrast by showing its different magnitudes and time trace for
a disbond of the same size located in various positions. It was shown that application of
the 2nd
derivative to the log-log surface cooling is insensitive to position of the disbond.
However, simulations indicated that the 2nd
derivative is sensitive to thickness of the
substrate which limits the application of this parameter to measure the thickness of TBC
only to the cases when thickness of the substrate is constant.
It was shown that the reduction of the coating thickness positively affects disbond
detection due to the decrease of the heat dissipation in the coating. The positive effects
on disbond detection manifested themselves in the increase of the maximum thermal
contrast, the peak value of the 2nd
derivative and the reduction of the time when both of
the values are present.
Computer simulations demonstrated that the reduction of the coating thermal
conductivity negatively affect disbond detection due to slowing down of the surface
cooling particularly in the sound region of TBC. These negative effects manifested
themselves in the decrease of the maximum thermal contrast, the peak value of the 2nd
time derivative and the increment of the time when both of the values are present.
6. Issues at transient thermography inspection of unpainted TBC
118
Chapter 6
Issues using transient thermography
inspection of unpainted TBC
6.1 Introduction
As discussed in chapter 2, test piece surfaces are often painted black for thermographic
inspection in order to provide a uniform emissivity of around unity. However, covering a
TBC blade with any form of paint is not acceptable to Alstom, the sponsor of the project.
The reason for this is possible contamination of the porous ceramic coating by the paint.
Painting of the blades for the thermal tests and the difficult process of paint removal
would be highly time consuming and also unacceptably expensive.
If during a standard transient thermography inspection a TBC specimen was covered by a
highly absorbing paint layer, the photo thermal effect would happen uniformly on the
surface of the specimen and after that the specimen would cool down due to conduction
of heat into the bulk of the specimen. At the same time, the specimen would emit thermal
radiation from its surface as can be seen in Figure 6.1a. Unfortunately, unpainted TBC
causes difficulties during transient thermography tests, particularly when the coating has
not been in service. This is caused by part-translucency to visible, near and middle IR
radiation; therefore, the incident pulse of visible and IR light penetrates the coating

6. Issues at transient thermography inspection of unpainted TBC
119
(Figure 6.1b) and the photo-thermal effect happens through the volume of the TBC. The
degree of translucency depends on the coating composition and its thickness (Shepard,
2006), (Sun, 2009).
a) b)
Visible and IR radiation from source
IR radiation from painted surface
IR from unpainted surface and from volume of TBC
IR reflection from TBC
heat conduction
Figure 6.1 Transient thermography effects during a test of TBC system: a) painted; b)
unpainted.
Additionally, after the pulse is switched off, the source of light emits thermal radiation
(afterglow effect) which is reflected from the TBC and interferes with the emitted
thermal radiation from the TBC (Figure 6.1b). This interference negatively affects
interpretation of the thermal images recorded by an IR camera. Furthermore, in most
thermography applications, the wavelength of the IR camera which is used to monitor
surface temperature it is not an important consideration, since sample surfaces are
generally IR opaque and emissive. However, TBC is not typical because when viewed in
the mid-IR (2-8µm) range it behaves differently to when viewed with long wave IR
camera (8-14 µm). During testing of unpainted TBC, the mid wave IR camera receives
emissions from the interior of the coating as well as the surface whereas the long wave
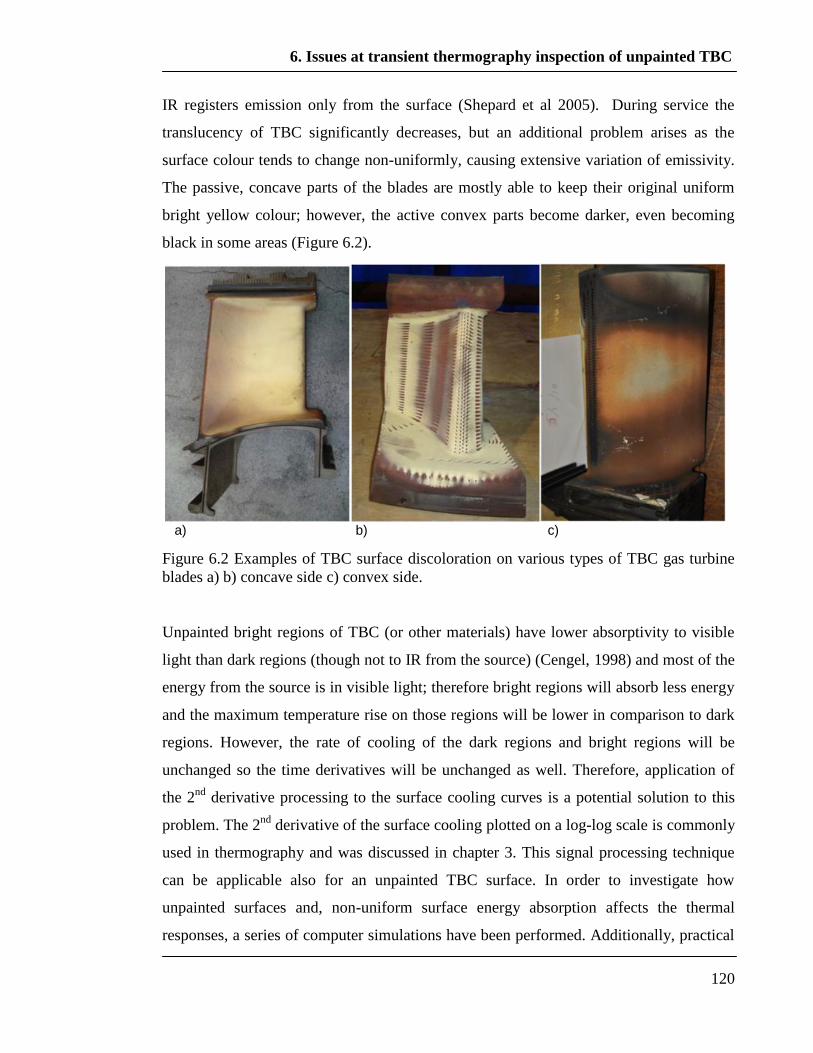
6. Issues at transient thermography inspection of unpainted TBC
120
IR registers emission only from the surface (Shepard et al 2005). During service the
translucency of TBC significantly decreases, but an additional problem arises as the
surface colour tends to change non-uniformly, causing extensive variation of emissivity.
The passive, concave parts of the blades are mostly able to keep their original uniform
bright yellow colour; however, the active convex parts become darker, even becoming
black in some areas (Figure 6.2).
a) b) c)
Figure 6.2 Examples of TBC surface discoloration on various types of TBC gas turbine
blades a) b) concave side c) convex side.
Unpainted bright regions of TBC (or other materials) have lower absorptivity to visible
light than dark regions (though not to IR from the source) (Cengel, 1998) and most of the
energy from the source is in visible light; therefore bright regions will absorb less energy
and the maximum temperature rise on those regions will be lower in comparison to dark
regions. However, the rate of cooling of the dark regions and bright regions will be
unchanged so the time derivatives will be unchanged as well. Therefore, application of
the 2nd
derivative processing to the surface cooling curves is a potential solution to this
problem. The 2nd
derivative of the surface cooling plotted on a log-log scale is commonly
used in thermography and was discussed in chapter 3. This signal processing technique
can be applicable also for an unpainted TBC surface. In order to investigate how
unpainted surfaces and, non-uniform surface energy absorption affects the thermal
responses, a series of computer simulations have been performed. Additionally, practical

6. Issues at transient thermography inspection of unpainted TBC
121
tests have been conducted in order to investigate how the sources of light and the IR
cameras used affect the thermal images.
6.2 Coating translucency
As was mentioned above, a new TBC coating absorbs optical energy not on its surface
but also through its volume. In order to investigate the volumetric energy absorption and
its effect on the TBC surface cooling, numerical simulations have been performed in
which it was assumed that the energy was absorbed unevenly through the TBC layer.
Bouguer‟s law has been applied for this purpose (Adams, 2000). The flux power density
W per unit area is given by
(6.1)
where W0 is flux power density of incident radiation, is medium absorption coefficient
(2500 1/m) (Abuhamad et al 2010) z is depth from the surface.
A 2D Comsol model has been created for 1D problem (Figure 6.3) in which a pulse of
energy with amplitude exponentially decreasing with depth from the surface was
deposited at the same time on the layers of TBC in order to simulate simultaneous
surface and volumetric energy absorption (translucency of TBC). The deposited energy
as a function of depth in the TBC can be seen in Figure 6.4. Figure 6.5 shows a
comparison of the surface cooling on a log-log scale for this model, for semi-infinite
TBC, and for black painted finite TBC rigidly attached to the substrate. The total amount
of energy deposited is identical for all cases.
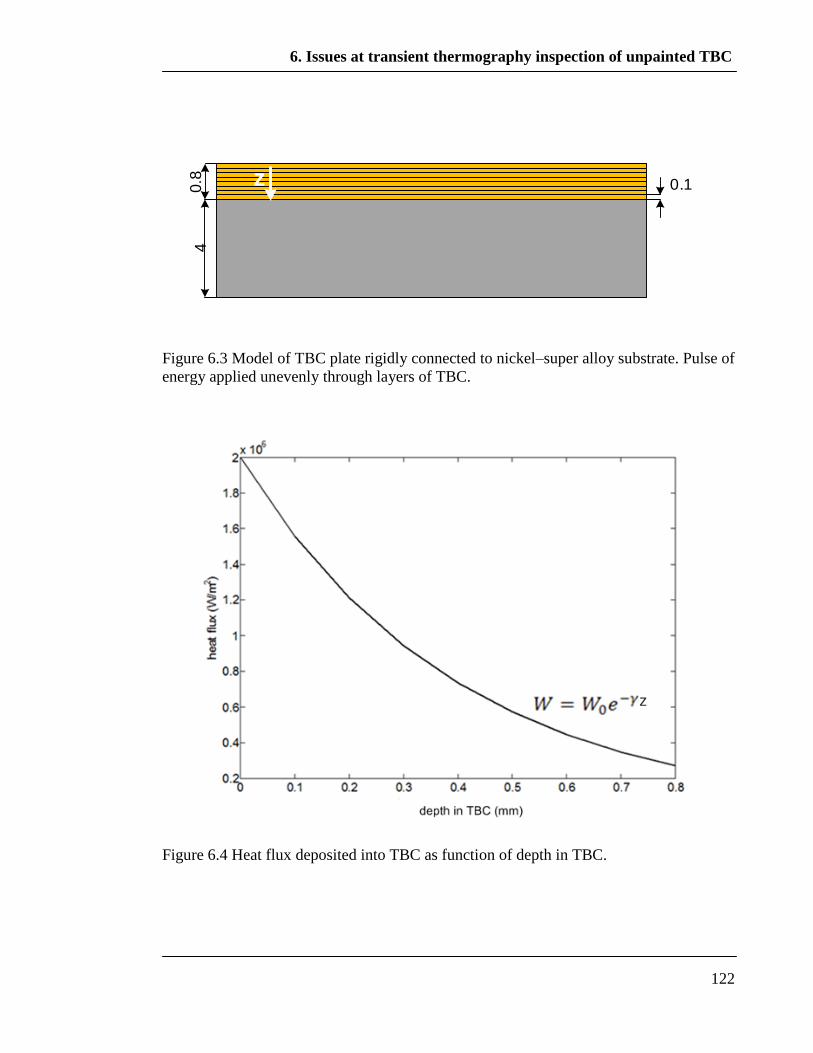
6. Issues at transient thermography inspection of unpainted TBC
122
0.14
0.8 z
Figure 6.3 Model of TBC plate rigidly connected to nickel–super alloy substrate. Pulse of
energy applied unevenly through layers of TBC.
0.1
40.8 z
z
Figure 6.4 Heat flux deposited into TBC as function of depth in TBC.
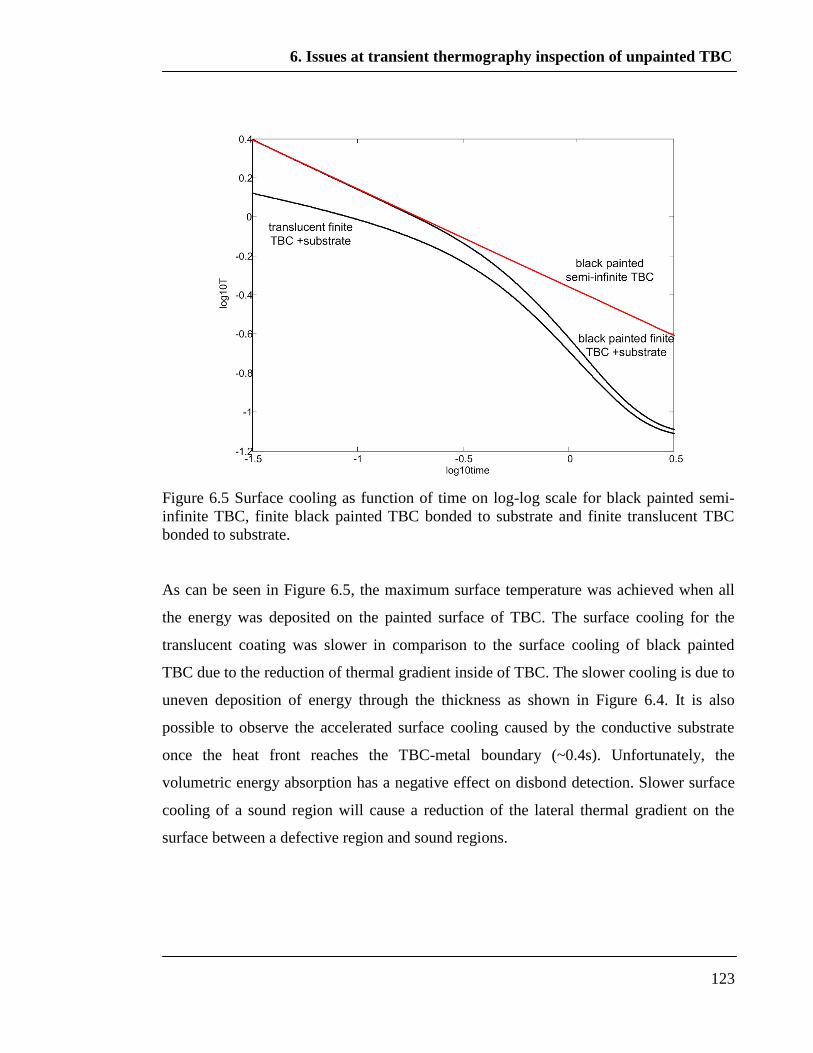
6. Issues at transient thermography inspection of unpainted TBC
123
Figure 6.5 Surface cooling as function of time on log-log scale for black painted semi-
infinite TBC, finite black painted TBC bonded to substrate and finite translucent TBC
bonded to substrate.
As can be seen in Figure 6.5, the maximum surface temperature was achieved when all
the energy was deposited on the painted surface of TBC. The surface cooling for the
translucent coating was slower in comparison to the surface cooling of black painted
TBC due to the reduction of thermal gradient inside of TBC. The slower cooling is due to
uneven deposition of energy through the thickness as shown in Figure 6.4. It is also
possible to observe the accelerated surface cooling caused by the conductive substrate
once the heat front reaches the TBC-metal boundary (~0.4s). Unfortunately, the
volumetric energy absorption has a negative effect on disbond detection. Slower surface
cooling of a sound region will cause a reduction of the lateral thermal gradient on the
surface between a defective region and sound regions.

6. Issues at transient thermography inspection of unpainted TBC
124
6.3 The afterglow effect and use of a glass filter
As was mentioned in the introduction the working environment of TBC can produce a
darkening of the surface which makes it less translucent causing photo-thermal
absorption to happen only on the surface. This improves the detectability of disbonds.
However, there are still two important problems with transient thermography testing of
TBC. One of them is caused by the afterglow effect and another is caused by non
uniform darkening of the surface. This subsection discusses how the afterglow affects the
thermal response and it also proposes a solution for this problem.
Emission of thermal radiation for pulsed thermographic testing can be estimated based on
black body emission. All bodies having temperature above 0 K emit thermal radiation.
The intensity of this radiation is a function of the temperature and also of the wave length.
The black body emission is described by Planck‟s law as a spectral intensity i W/m3 and
shown graphically in Figure 6.6.
(6.2)
where is the wavelength (m), h is Planck‟s constant (6.62x10⁻³⁴
m2kg/s), k is
Boltzmann‟s constant (1.38x10⁻²³
J/K), c is speed of light 3x10⁸ m/s.
The total emitted intensity I (or power) (W/m2) is the integration of equation 6.1 over
wavelength (Stefan- Boltzmann law):
(6.3)
where is the Stefan-Boltzmann constant (6.67x10⁻⁸
W/m2K
4) and T is the temperature
of the body K.
Thermal radiation is considered to be in the wavelength range from slightly ultraviolet
(0.3 µm) to long wave IR (1000 µm). In the following, black body radiation is used to
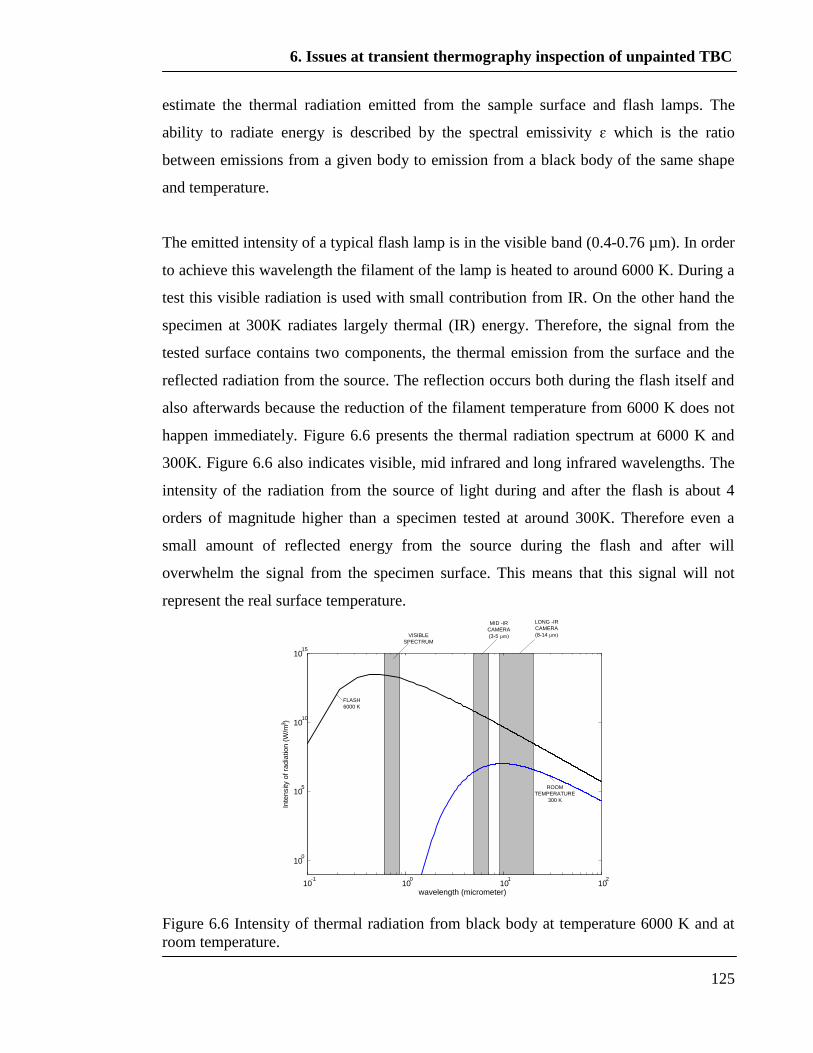
6. Issues at transient thermography inspection of unpainted TBC
125
estimate the thermal radiation emitted from the sample surface and flash lamps. The
ability to radiate energy is described by the spectral emissivity ɛ which is the ratio
between emissions from a given body to emission from a black body of the same shape
and temperature.
The emitted intensity of a typical flash lamp is in the visible band (0.4-0.76 µm). In order
to achieve this wavelength the filament of the lamp is heated to around 6000 K. During a
test this visible radiation is used with small contribution from IR. On the other hand the
specimen at 300K radiates largely thermal (IR) energy. Therefore, the signal from the
tested surface contains two components, the thermal emission from the surface and the
reflected radiation from the source. The reflection occurs both during the flash itself and
also afterwards because the reduction of the filament temperature from 6000 K does not
happen immediately. Figure 6.6 presents the thermal radiation spectrum at 6000 K and
300K. Figure 6.6 also indicates visible, mid infrared and long infrared wavelengths. The
intensity of the radiation from the source of light during and after the flash is about 4
orders of magnitude higher than a specimen tested at around 300K. Therefore even a
small amount of reflected energy from the source during the flash and after will
overwhelm the signal from the specimen surface. This means that this signal will not
represent the real surface temperature.
10-1
100
101
102
100
105
1010
1015
wavelength (micrometer)
FLASH
6000 K
VISIBLE
SPECTRUM
MID -IR
CAMERA
(3-5 µm)
LONG -IR
CAMERA
(8-14 µm)
ROOM
TEMPERATURE
300 K
Inte
nsity o
f ra
dia
tio
n (
W/m
)3
Figure 6.6 Intensity of thermal radiation from black body at temperature 6000 K and at
room temperature.
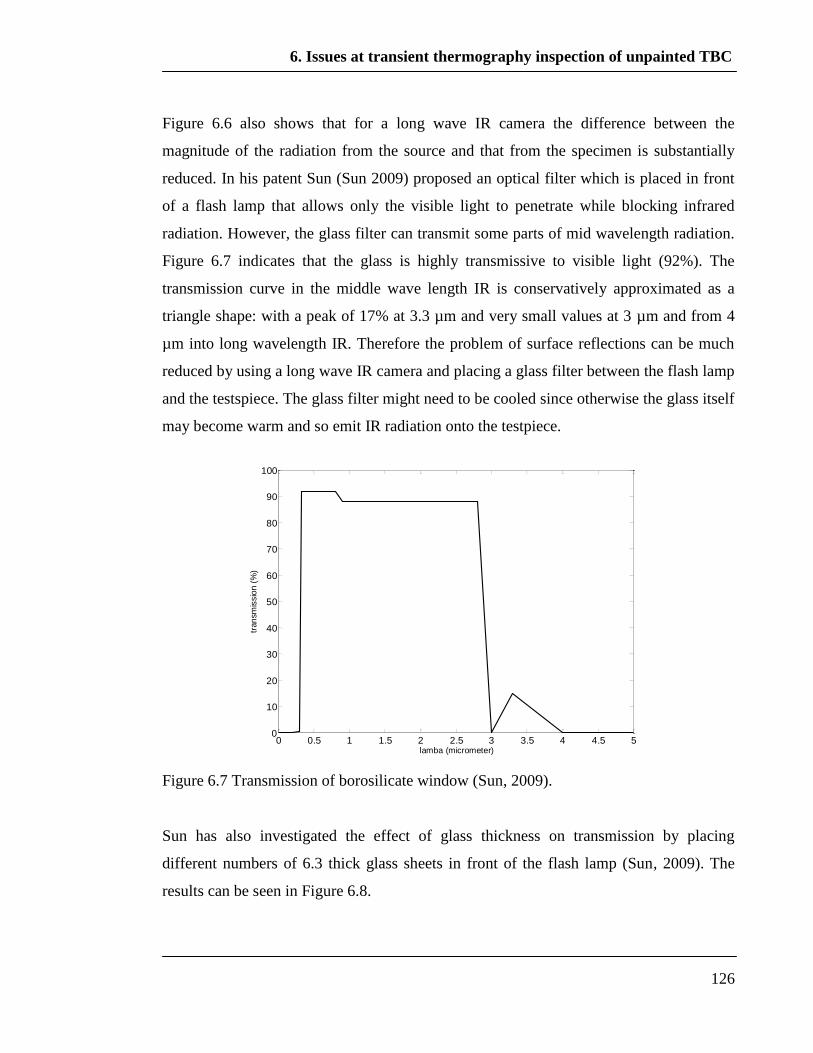
6. Issues at transient thermography inspection of unpainted TBC
126
Figure 6.6 also shows that for a long wave IR camera the difference between the
magnitude of the radiation from the source and that from the specimen is substantially
reduced. In his patent Sun (Sun 2009) proposed an optical filter which is placed in front
of a flash lamp that allows only the visible light to penetrate while blocking infrared
radiation. However, the glass filter can transmit some parts of mid wavelength radiation.
Figure 6.7 indicates that the glass is highly transmissive to visible light (92%). The
transmission curve in the middle wave length IR is conservatively approximated as a
triangle shape: with a peak of 17% at 3.3 µm and very small values at 3 µm and from 4
µm into long wavelength IR. Therefore the problem of surface reflections can be much
reduced by using a long wave IR camera and placing a glass filter between the flash lamp
and the testspiece. The glass filter might need to be cooled since otherwise the glass itself
may become warm and so emit IR radiation onto the testpiece.
0 0.5 1 1.5 2 2.5 3 3.5 4 4.5 50
10
20
30
40
50
60
70
80
90
100
lamba (micrometer)
tran
sm
issio
n (
%)
Figure 6.7 Transmission of borosilicate window (Sun, 2009).
Sun has also investigated the effect of glass thickness on transmission by placing
different numbers of 6.3 thick glass sheets in front of the flash lamp (Sun, 2009). The
results can be seen in Figure 6.8.

6. Issues at transient thermography inspection of unpainted TBC
127
5 10 15 20 25 30 35 40 4550
60
70
80
90
100
tra
nsm
issiv
ity
vis
ible
lig
ht
(%)
thickness of glass (mm)5 10 15 20 25 30 35 40 45
0
0.5
1
1.5
2
2.5
tra
nsm
issi
vity in
mid
wa
vele
ng
th I
R lig
ht
(%)
Figure 6.8 Transmission of light (visible and middle wavelength IR) as function of glass
thickness (Sun, 2009).
Not surprisingly increasing the thickness of the glass filter results in a decrease of the
transmisivity in both visible and IR bands. Because, the visible light is used to heat the
specimen during a flash test, a reduction of transmissivity in the visible band should be
avoided. Again, there is no significant long wave infrared transmission for any thickness
of a glass. Therefore, a fairly thin, cooled glass filter and use of long wavelength IR
camera provides a convenient solution to the afterglow effect.
6.4 Effect of non uniform energy absorption on surface of TBC
As was mentioned in the introduction, local changes of colour on TBC blades cause
uneven absorption of optical energy and thermal emission of energy from the surface.
Darker, and particularly black, regions will absorb and emit more energy than lighter
regions of the TBC surface. Additionally, lighter regions might cause reflection of the
radiation from the IR source. The surface temperature of TBC after applying the heating
pulse can be predicted by using a finite element model. A set of models was generated in
Comsol, which was used to simulate conductive heat flow. In the models of Figure 6.9 in
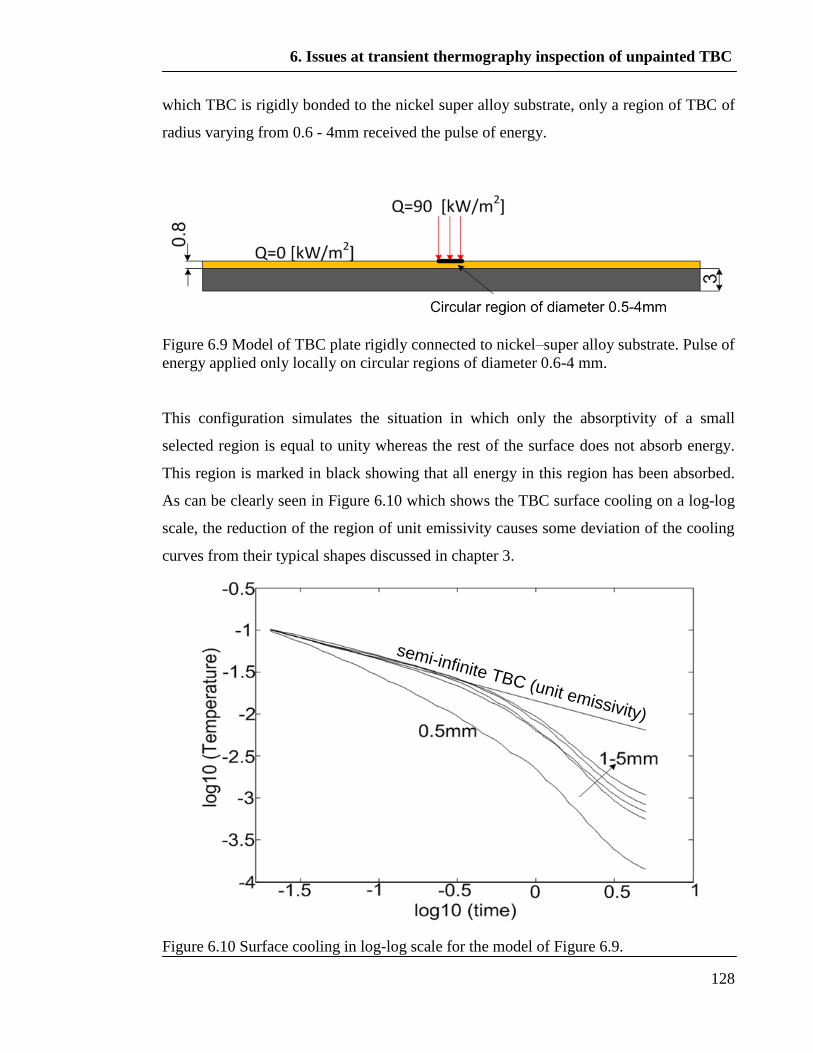
6. Issues at transient thermography inspection of unpainted TBC
128
which TBC is rigidly bonded to the nickel super alloy substrate, only a region of TBC of
radius varying from 0.6 - 4mm received the pulse of energy.
Figure 6.9 Model of TBC plate rigidly connected to nickel–super alloy substrate. Pulse of
energy applied only locally on circular regions of diameter 0.6-4 mm.
This configuration simulates the situation in which only the absorptivity of a small
selected region is equal to unity whereas the rest of the surface does not absorb energy.
This region is marked in black showing that all energy in this region has been absorbed.
As can be clearly seen in Figure 6.10 which shows the TBC surface cooling on a log-log
scale, the reduction of the region of unit emissivity causes some deviation of the cooling
curves from their typical shapes discussed in chapter 3.
semi-infinite TBC (unit emissivity)
Figure 6.10 Surface cooling in log-log scale for the model of Figure 6.9.
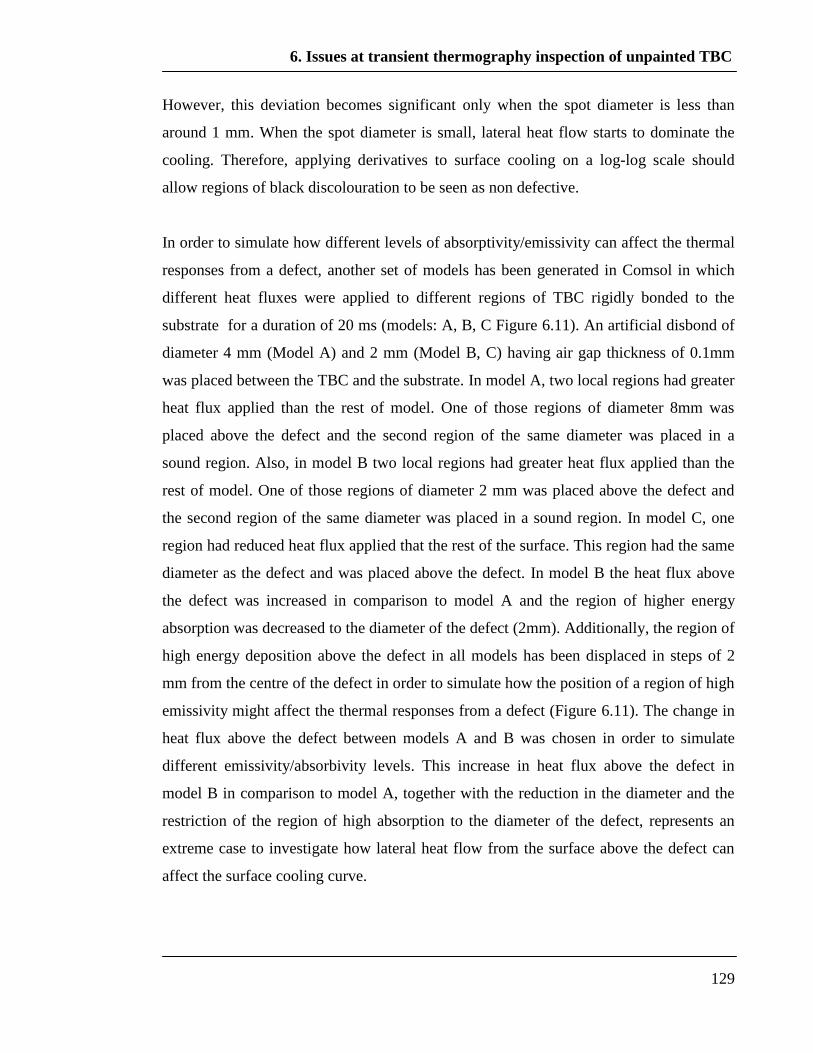
6. Issues at transient thermography inspection of unpainted TBC
129
However, this deviation becomes significant only when the spot diameter is less than
around 1 mm. When the spot diameter is small, lateral heat flow starts to dominate the
cooling. Therefore, applying derivatives to surface cooling on a log-log scale should
allow regions of black discolouration to be seen as non defective.
In order to simulate how different levels of absorptivity/emissivity can affect the thermal
responses from a defect, another set of models has been generated in Comsol in which
different heat fluxes were applied to different regions of TBC rigidly bonded to the
substrate for a duration of 20 ms (models: A, B, C Figure 6.11). An artificial disbond of
diameter 4 mm (Model A) and 2 mm (Model B, C) having air gap thickness of 0.1mm
was placed between the TBC and the substrate. In model A, two local regions had greater
heat flux applied than the rest of model. One of those regions of diameter 8mm was
placed above the defect and the second region of the same diameter was placed in a
sound region. Also, in model B two local regions had greater heat flux applied than the
rest of model. One of those regions of diameter 2 mm was placed above the defect and
the second region of the same diameter was placed in a sound region. In model C, one
region had reduced heat flux applied that the rest of the surface. This region had the same
diameter as the defect and was placed above the defect. In model B the heat flux above
the defect was increased in comparison to model A and the region of higher energy
absorption was decreased to the diameter of the defect (2mm). Additionally, the region of
high energy deposition above the defect in all models has been displaced in steps of 2
mm from the centre of the defect in order to simulate how the position of a region of high
emissivity might affect the thermal responses from a defect (Figure 6.11). The change in
heat flux above the defect between models A and B was chosen in order to simulate
different emissivity/absorbivity levels. This increase in heat flux above the defect in
model B in comparison to model A, together with the reduction in the diameter and the
restriction of the region of high absorption to the diameter of the defect, represents an
extreme case to investigate how lateral heat flow from the surface above the defect can
affect the surface cooling curve.
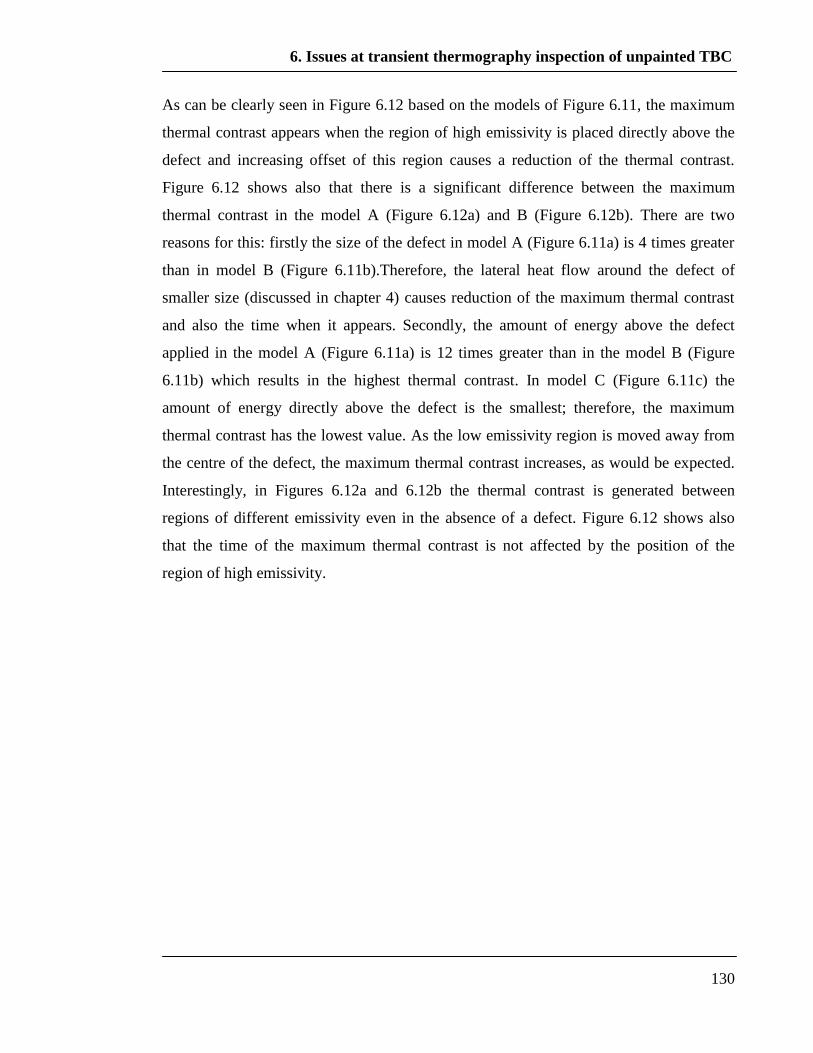
6. Issues at transient thermography inspection of unpainted TBC
130
As can be clearly seen in Figure 6.12 based on the models of Figure 6.11, the maximum
thermal contrast appears when the region of high emissivity is placed directly above the
defect and increasing offset of this region causes a reduction of the thermal contrast.
Figure 6.12 shows also that there is a significant difference between the maximum
thermal contrast in the model A (Figure 6.12a) and B (Figure 6.12b). There are two
reasons for this: firstly the size of the defect in model A (Figure 6.11a) is 4 times greater
than in model B (Figure 6.11b).Therefore, the lateral heat flow around the defect of
smaller size (discussed in chapter 4) causes reduction of the maximum thermal contrast
and also the time when it appears. Secondly, the amount of energy above the defect
applied in the model A (Figure 6.11a) is 12 times greater than in the model B (Figure
6.11b) which results in the highest thermal contrast. In model C (Figure 6.11c) the
amount of energy directly above the defect is the smallest; therefore, the maximum
thermal contrast has the lowest value. As the low emissivity region is moved away from
the centre of the defect, the maximum thermal contrast increases, as would be expected.
Interestingly, in Figures 6.12a and 6.12b the thermal contrast is generated between
regions of different emissivity even in the absence of a defect. Figure 6.12 shows also
that the time of the maximum thermal contrast is not affected by the position of the
region of high emissivity.
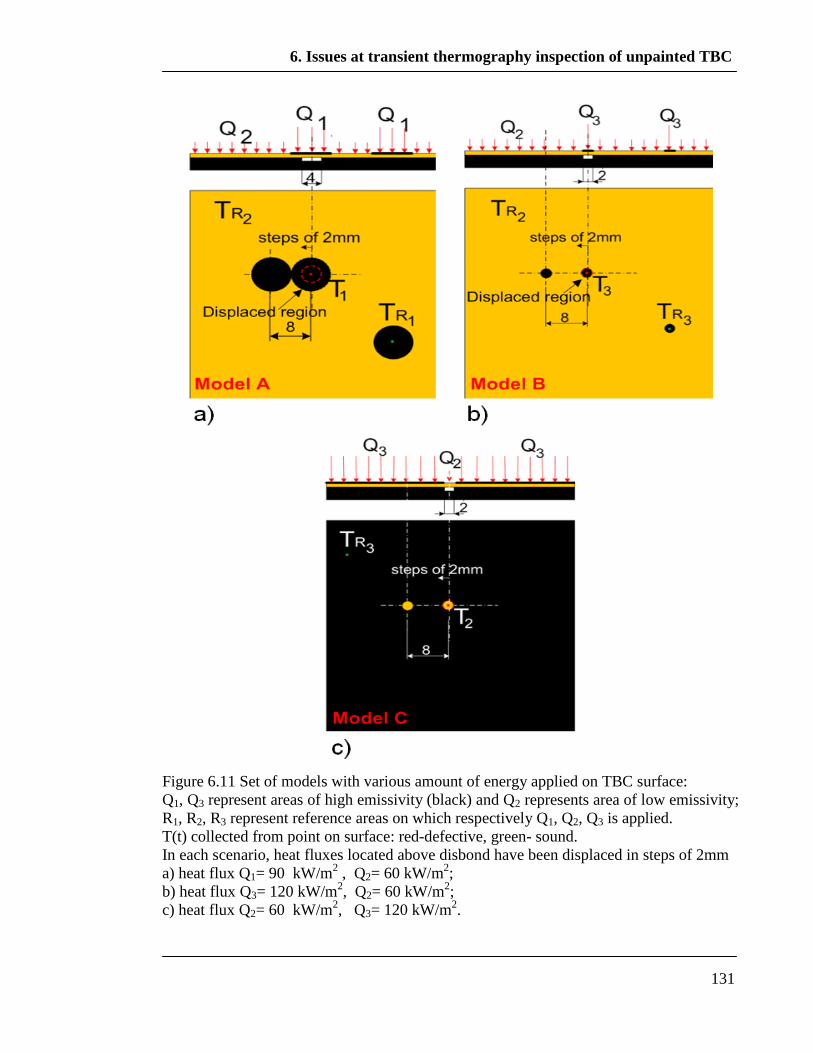
6. Issues at transient thermography inspection of unpainted TBC
131
Figure 6.11 Set of models with various amount of energy applied on TBC surface:
Q1, Q3 represent areas of high emissivity (black) and Q2 represents area of low emissivity;
R1, R2, R3 represent reference areas on which respectively Q1, Q2, Q3 is applied.
T(t) collected from point on surface: red-defective, green- sound.
In each scenario, heat fluxes located above disbond have been displaced in steps of 2mm
a) heat flux Q1= 90 kW/m2 , Q2= 60 kW/m
2;
b) heat flux Q3= 120 kW/m2, Q2= 60 kW/m
2;
c) heat flux Q2= 60 kW/m2, Q3= 120 kW/m
2.
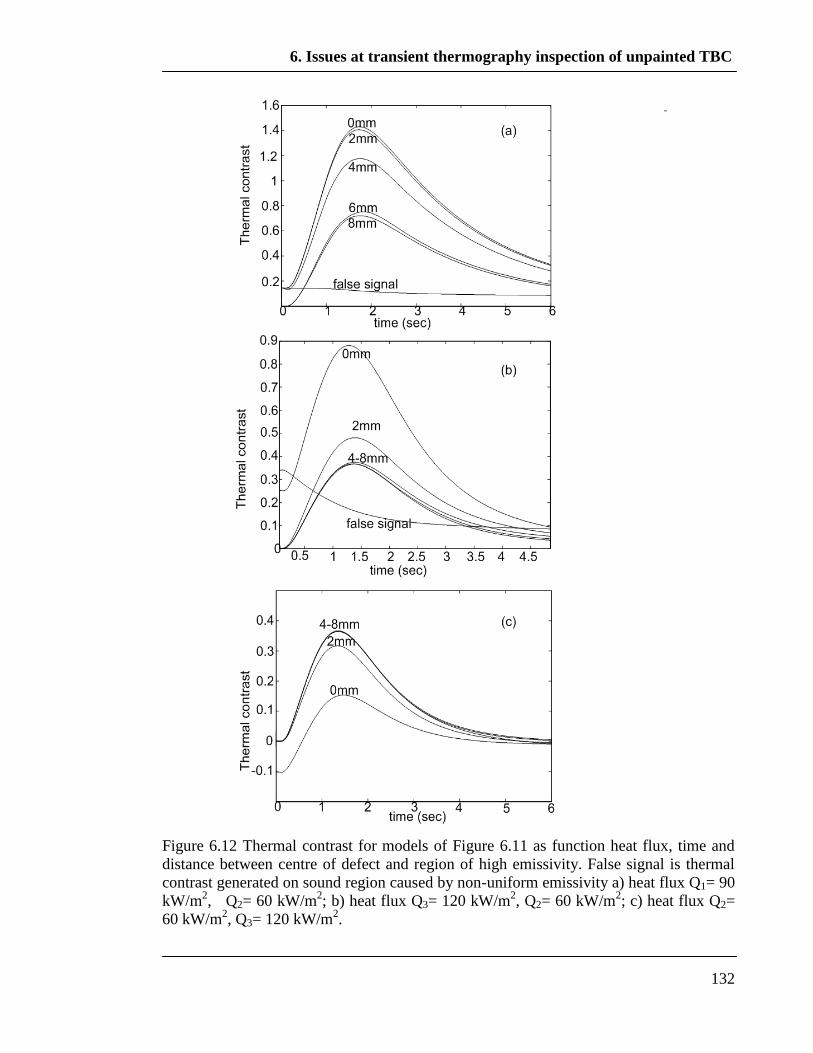
6. Issues at transient thermography inspection of unpainted TBC
132
Figure 6.12 Thermal contrast for models of Figure 6.11 as function heat flux, time and
distance between centre of defect and region of high emissivity. False signal is thermal
contrast generated on sound region caused by non-uniform emissivity a) heat flux Q1= 90
kW/m2, Q2= 60 kW/m
2; b) heat flux Q3= 120 kW/m
2, Q2= 60 kW/m
2; c) heat flux Q2=
60 kW/m2, Q3= 120 kW/m
2.

6. Issues at transient thermography inspection of unpainted TBC
133
The 2nd
derivative calculated from log-log surface cooling shown in Figure 6.13 allows
clear distinction between defective and non defective regions. Additionally, the position,
the size and the amount of energy deposited on regions of high absorptivity/emissivity
(Model A, B Figure 6.11a, b) only minimally affects the maximum value and the shape
of the curves. The same situation is present for the model C (Figure 6.11c). Therefore,
these results suggest that application of the 2nd
derivative processing for specimens
which absorb energy non-uniformly is likely to give more reliable results than simple
contrast processing.
Figure 6.13 2nd
derivative from log (T)-log (t) surface cooling for models of Figure 6.11
as function of heat flux, time and distance between centre of defect and centre of region
of high emissivity a) heat flux Q1= 90 kW/m2, Q2= 60 kW/m
2; b) heat flux Q3= 120
kW/m2, Q2= 60 kW/m
2; c) heat flux Q2= 60 kW/m
2, Q3= 120 kW/m
2.
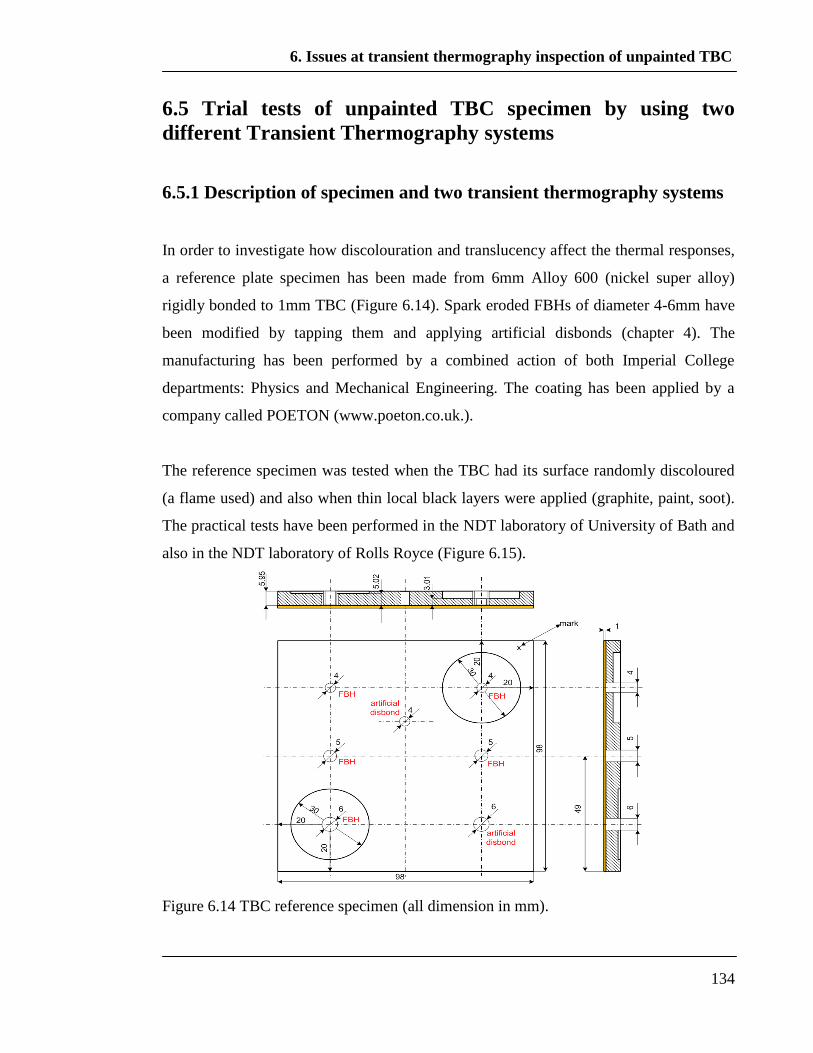
6. Issues at transient thermography inspection of unpainted TBC
134
6.5 Trial tests of unpainted TBC specimen by using two
different Transient Thermography systems
6.5.1 Description of specimen and two transient thermography systems
In order to investigate how discolouration and translucency affect the thermal responses,
a reference plate specimen has been made from 6mm Alloy 600 (nickel super alloy)
rigidly bonded to 1mm TBC (Figure 6.14). Spark eroded FBHs of diameter 4-6mm have
been modified by tapping them and applying artificial disbonds (chapter 4). The
manufacturing has been performed by a combined action of both Imperial College
departments: Physics and Mechanical Engineering. The coating has been applied by a
company called POETON (www.poeton.co.uk.).
The reference specimen was tested when the TBC had its surface randomly discoloured
(a flame used) and also when thin local black layers were applied (graphite, paint, soot).
The practical tests have been performed in the NDT laboratory of University of Bath and
also in the NDT laboratory of Rolls Royce (Figure 6.15).
Figure 6.14 TBC reference specimen (all dimension in mm).

6. Issues at transient thermography inspection of unpainted TBC
135
Figure 6.15 Two transient thermography systems: a) Bath University, b) Rolls Royce.
The system used in Bath University comprises a mid-wavelength (6µm) IR camera, an
integral flash lamp, a protective hood, PC with data analysis and synthetic data
processing software. The flash lamp which was used provides electrical energy of 6kJ
and it is located in the hood above which the camera is placed. In the Rolls Royce system
two flash lamps (6kJ each) are located in a special container with a glass front. The
container protects the lamps and the glass filters out IR radiation from the source as
shown in Figure 6.16; this removes the afterglow effect, as explained in section 6.4. A
system of cooling air is provided which cools both the lamps and the filter. The power of
the flash lamps is double that of the Bath system.
Figure 6.16 Principles of the tests conducted at the NDT lab of Bath University and at an
inspection facility of Rolls Royce.

6. Issues at transient thermography inspection of unpainted TBC
136
6.5.2 Tests and results
Bath System
An experiment has been performed by using the Bath system in which the TBC specimen
described in 6.6.1 was used. The surface of the coating was purposely randomly
discoloured by applying a flame containing burning acetylene (Figure 6.17a).
a) b)
c)
Figure 6.17 TBC specimen a) photo showing random discolouration on surface, b) raw
thermal image, c) 2nd
derivative image (Mosaiq).
Because this system does not filter IR radiation from the source after the pulse (the
afterglow effect), it is clearly seen that the raw thermal image shows many areas in which
IR emitted from the source was reflected to the camera causing difficulties in location of
the defects (Figure 6.17b). However, the application of 2nd
derivative has eliminated this
effect when the Mosaiq software (chapter 4) was applied (Figure 6.17c) (Shepard, 1995).
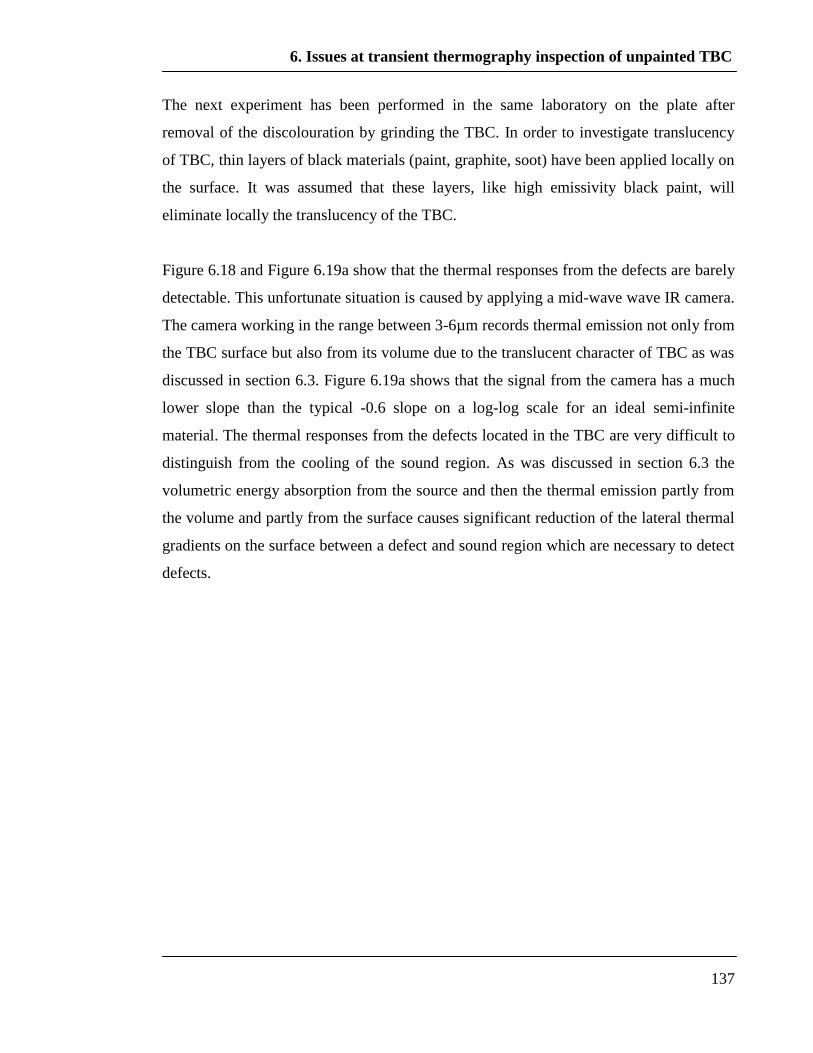
6. Issues at transient thermography inspection of unpainted TBC
137
The next experiment has been performed in the same laboratory on the plate after
removal of the discolouration by grinding the TBC. In order to investigate translucency
of TBC, thin layers of black materials (paint, graphite, soot) have been applied locally on
the surface. It was assumed that these layers, like high emissivity black paint, will
eliminate locally the translucency of the TBC.
Figure 6.18 and Figure 6.19a show that the thermal responses from the defects are barely
detectable. This unfortunate situation is caused by applying a mid-wave wave IR camera.
The camera working in the range between 3-6µm records thermal emission not only from
the TBC surface but also from its volume due to the translucent character of TBC as was
discussed in section 6.3. Figure 6.19a shows that the signal from the camera has a much
lower slope than the typical -0.6 slope on a log-log scale for an ideal semi-infinite
material. The thermal responses from the defects located in the TBC are very difficult to
distinguish from the cooling of the sound region. As was discussed in section 6.3 the
volumetric energy absorption from the source and then the thermal emission partly from
the volume and partly from the surface causes significant reduction of the lateral thermal
gradients on the surface between a defect and sound region which are necessary to detect
defects.

6. Issues at transient thermography inspection of unpainted TBC
138
Figure 6.18 Raw thermal image of TBC specimen showing defects and locally applied
discolouration (layers) of graphite, paint and soot.
The raw thermal image shown in Figure 6.18 indicates that the local high emissive layers
made of paint, graphite and soot substantially distinguish from the background. The
layers which receive more energy from the pulse in comparison to the sound region
generate the thermal contrast. This is highly unfortunate situation because any highly
emissive layer on a coated gas turbine blade which is unprepared for the inspection can
generate false indicator of a defect.
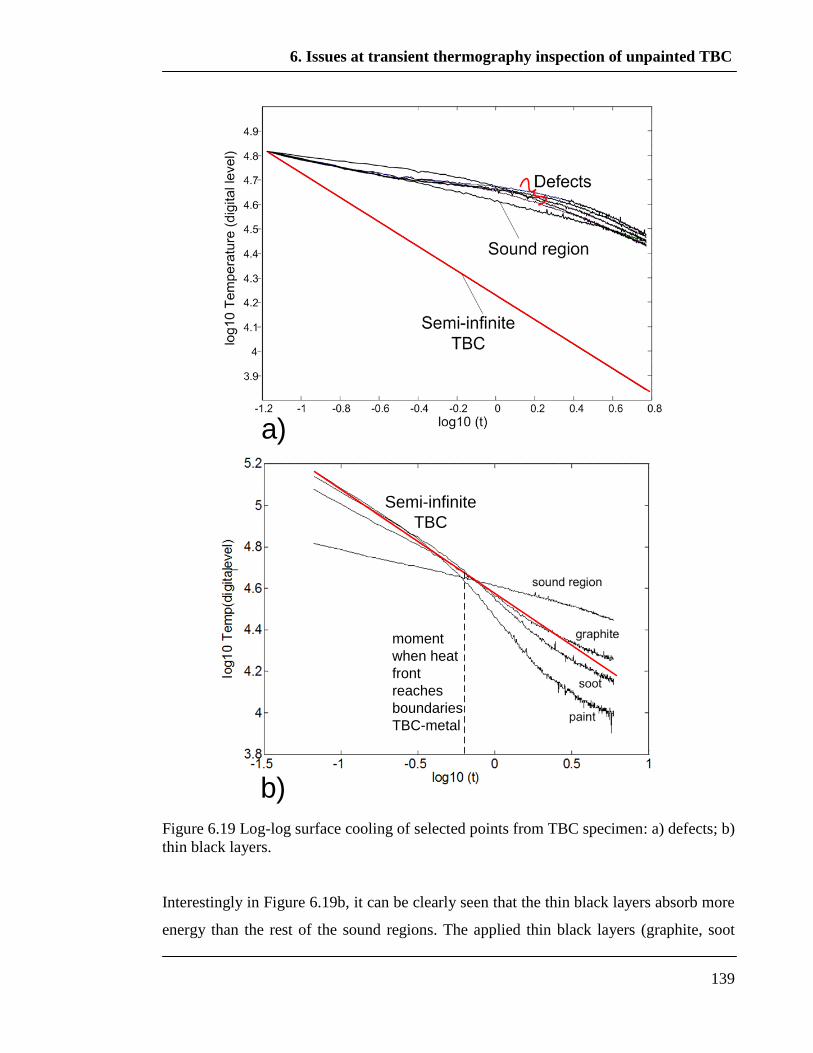
6. Issues at transient thermography inspection of unpainted TBC
139
b)
a)
Semi-infinite
TBC
moment
when heat
front
reaches
boundaries
TBC-metal
Figure 6.19 Log-log surface cooling of selected points from TBC specimen: a) defects; b)
thin black layers.
Interestingly in Figure 6.19b, it can be clearly seen that the thin black layers absorb more
energy than the rest of the sound regions. The applied thin black layers (graphite, soot

6. Issues at transient thermography inspection of unpainted TBC
140
and paint) resulted in a steeper cooling gradient, similar to the -0.5 slope given by the
semi-infinite material (Figure 6.19b). This can be interpreted as confirmation of surface
energy absorption and emission in the case of layers compared to the volumetric energy
absorption and emission of uncoated TBC. It is also clearly visible in Figure 6.19b that
when “the heat front” reaches the boundary between TBC and the substrate it causes
accelerated surface cooling for the thin applied layers (chapter 4). Both the analytical
solution and the test results indicate that this occurs at about 0.6 sec.
In order to investigate if applying a glass filter may eliminate the residual IR reflection,
an experiment has been performed in which a glass filter has been placed between the
flash lamp and TBC specimen using the Bath system. As can be seen in Figure 6.16a the
camera could not stay in the same position shown in Figure 6.16 because the emitted
radiation from the TBC specimen would be stopped by the glass filter. Therefore, the
camera was removed from the flash hood as shown schematically in Figure 6.20.
Unfortunately, the thermal image was very noisy, an example time history from one
point being shown in Figure 6.21. This is because, firstly, the Bath system contains only
one lamp and insertion of the filter inevitably removes some energy, particularly in the
low visible and near IR ranges. Secondly, a relatively large distance between the
specimen, and the flash system also weakens the thermal signal.
TBC specimen
mid IR
camerahood
con aini g:
gl
n la
flash lamp
glass filter
Figure 6.20 Schematic configuration of Bath System when a glass filter is placed
between hood and specimen.
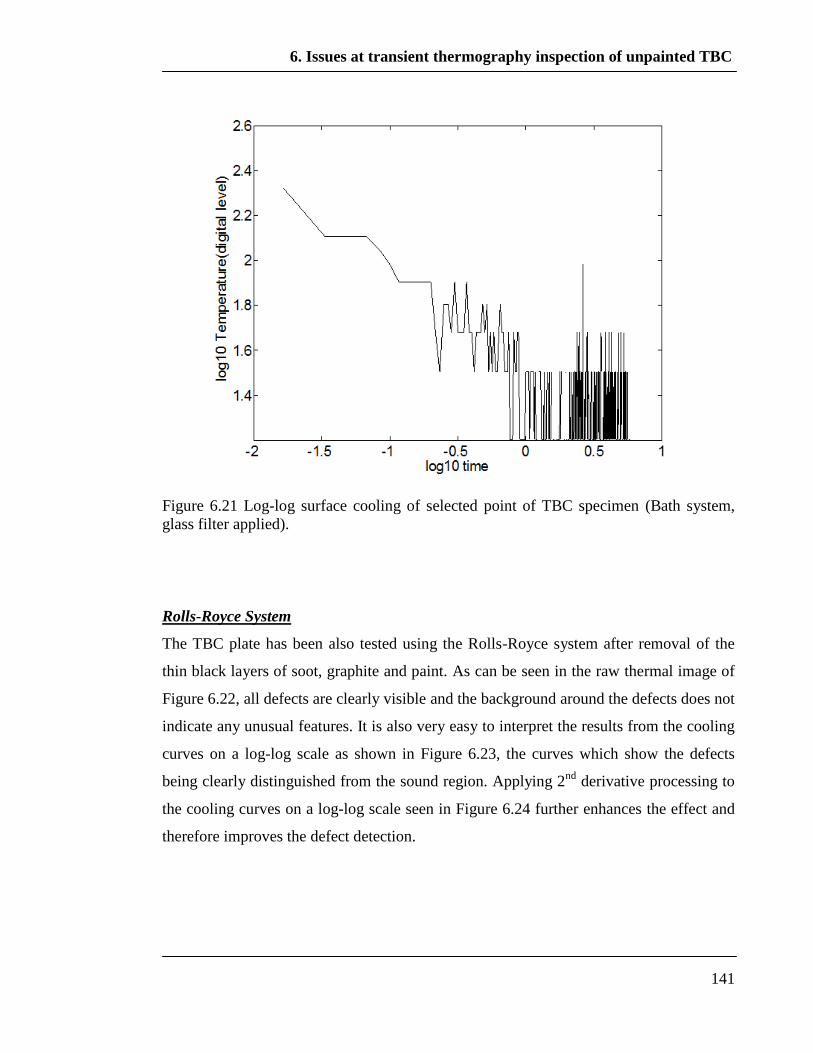
6. Issues at transient thermography inspection of unpainted TBC
141
Figure 6.21 Log-log surface cooling of selected point of TBC specimen (Bath system,
glass filter applied).
Rolls-Royce System
The TBC plate has been also tested using the Rolls-Royce system after removal of the
thin black layers of soot, graphite and paint. As can be seen in the raw thermal image of
Figure 6.22, all defects are clearly visible and the background around the defects does not
indicate any unusual features. It is also very easy to interpret the results from the cooling
curves on a log-log scale as shown in Figure 6.23, the curves which show the defects
being clearly distinguished from the sound region. Applying 2nd
derivative processing to
the cooling curves on a log-log scale seen in Figure 6.24 further enhances the effect and
therefore improves the defect detection.
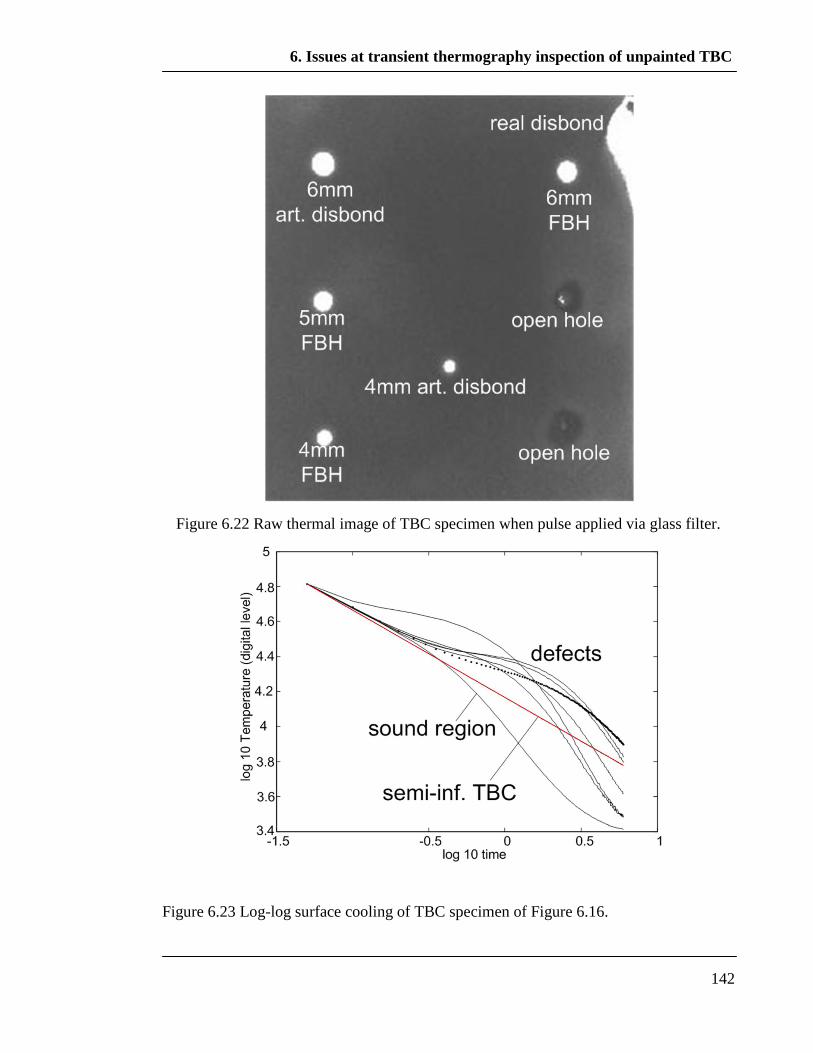
6. Issues at transient thermography inspection of unpainted TBC
142
Figure 6.22 Raw thermal image of TBC specimen when pulse applied via glass filter.
Figure 6.23 Log-log surface cooling of TBC specimen of Figure 6.16.
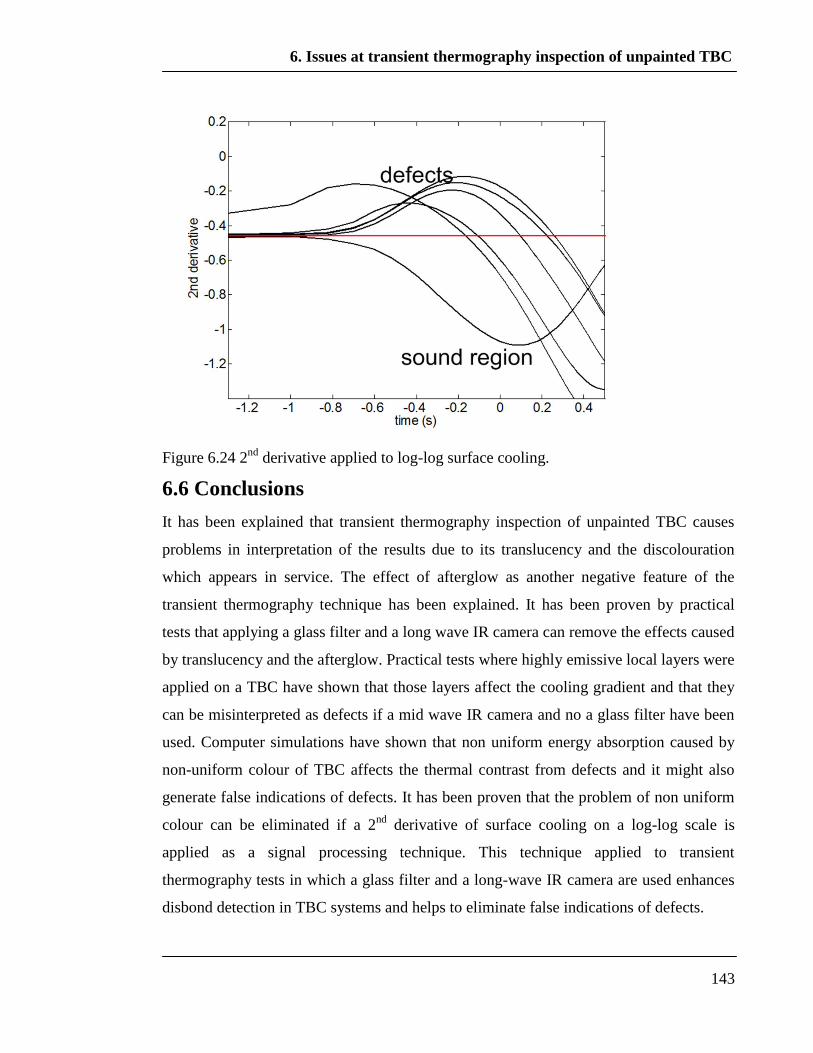
6. Issues at transient thermography inspection of unpainted TBC
143
Figure 6.24 2nd
derivative applied to log-log surface cooling.
6.6 Conclusions
It has been explained that transient thermography inspection of unpainted TBC causes
problems in interpretation of the results due to its translucency and the discolouration
which appears in service. The effect of afterglow as another negative feature of the
transient thermography technique has been explained. It has been proven by practical
tests that applying a glass filter and a long wave IR camera can remove the effects caused
by translucency and the afterglow. Practical tests where highly emissive local layers were
applied on a TBC have shown that those layers affect the cooling gradient and that they
can be misinterpreted as defects if a mid wave IR camera and no a glass filter have been
used. Computer simulations have shown that non uniform energy absorption caused by
non-uniform colour of TBC affects the thermal contrast from defects and it might also
generate false indications of defects. It has been proven that the problem of non uniform
colour can be eliminated if a 2nd
derivative of surface cooling on a log-log scale is
applied as a signal processing technique. This technique applied to transient
thermography tests in which a glass filter and a long-wave IR camera are used enhances
disbond detection in TBC systems and helps to eliminate false indications of defects.
7. Practical solution for thermography inspection of unpainted TBC in service
144
Chapter 7
Practical solution for thermography
inspection of unpainted TBC systems in
service
7.1 Introduction
The trial tests performed in the previous chapter have revealed significant improvement
in disbond detection of an unpainted TBC specimen when a long wave IR camera, a
powerful energy source and a cooled glass filter are applied (The Rolls Royce system). In
this chapter the system is tested on a more controlled set of specimens.
Because IR emission from the energy source is significantly reduced due to the glass
filter, the colour of the TBC surface becomes a very important factor in the amount of
energy absorbed and emitted from the surface as was indicated in the previous chapter.
This chapter demonstrates through practical tests how the colour of TBC affects the
absorptivity and emissivity when the advantageous setup and the recommended signal
processing technique from the previous chapter are applied. The practical tests have been
performed on a set of coloured Zirconia discs, a reference TBC specimen randomly
discoloured by a flame, and also on another TBC reference specimen containing FBHs in
which the surface of the TBC was blackened at selected locations.
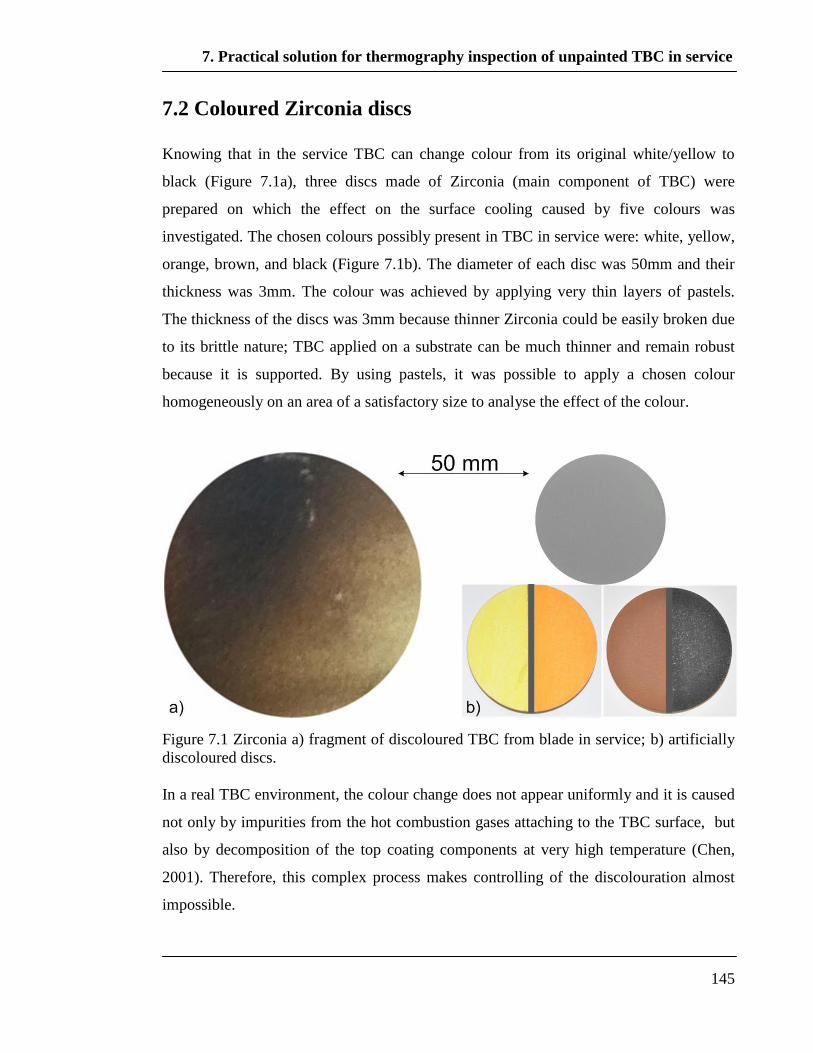
7. Practical solution for thermography inspection of unpainted TBC in service
145
7.2 Coloured Zirconia discs
Knowing that in the service TBC can change colour from its original white/yellow to
black (Figure 7.1a), three discs made of Zirconia (main component of TBC) were
prepared on which the effect on the surface cooling caused by five colours was
investigated. The chosen colours possibly present in TBC in service were: white, yellow,
orange, brown, and black (Figure 7.1b). The diameter of each disc was 50mm and their
thickness was 3mm. The colour was achieved by applying very thin layers of pastels.
The thickness of the discs was 3mm because thinner Zirconia could be easily broken due
to its brittle nature; TBC applied on a substrate can be much thinner and remain robust
because it is supported. By using pastels, it was possible to apply a chosen colour
homogeneously on an area of a satisfactory size to analyse the effect of the colour.
Figure 7.1 Zirconia a) fragment of discoloured TBC from blade in service; b) artificially
discoloured discs.
In a real TBC environment, the colour change does not appear uniformly and it is caused
not only by impurities from the hot combustion gases attaching to the TBC surface, but
also by decomposition of the top coating components at very high temperature (Chen,
2001). Therefore, this complex process makes controlling of the discolouration almost
impossible.

7. Practical solution for thermography inspection of unpainted TBC in service
146
Transient thermography tests were performed on the discs of Figure 7.1b and the thermal
emission measurements were collected from five points in each area of interest and the
averages were calculated. Figure 7.2 presents the surface cooling collected from the discs
plotted on a log-log scale together with the analytical solution for a 3mm thick Zirconia
plate. Firstly, the characteristic -0.5 cooling slope already described in chapter 3 can be
clearly seen. Secondly, the curves indicate the importance of the colour in visible light
energy absorption and its emission where very clearly dark areas (brown and black)
absorb and emit much more than the light coloured areas (white, yellow and orange). As
was indicated already in the previous chapter this uneven energy absorption and emission
has a very strong influence on the thermal responses from a TBC specimen containing a
defect which will be discussed in detail later.
The curve for the analytical solution (Figure 7.2) was arbitrarily located between the
white and yellow curves because the mixture of these colours most accurately represents
the colour of the ceramic coat. However, the surface temperature is a function of the
amount of energy deposited in the flash as well as the surface colour, its smoothness, the
distance between the specimen and the energy source and also how the source and the
specimen are positioned in relation to each other (Maldague, 1994). Therefore only the
form of the theoretical curve should be compared with the measurements – the absolute
temperature is a function of the other parameters that were not controlled in the
experiments.
Figure 7.3 shows the 2nd
time derivative calculated from the log-log surface cooling of
Figure 7.2. As can be clearly seen in Figure 7.3, the maxima discussed chapter 3 are
reached and they appear at about the time when the heat front reaches the bottom
boundary of the discs. In chapter 3 it was mentioned that the time of the 2nd
derivative
maximum (td) can be used to measure the thickness of a layer when transient
thermography is applied. Indeed, if equation 3.15 is used, a thickness L=3mm was
calculated for the Zirconia discs with properties ρ=5200 kg/m3, c=400J/kgK and k=2
W/mK. However, as can be seen in Figure 7.3 there are some small but noticeable
differences in the time of the 2nd
derivative maximum between different colours (max
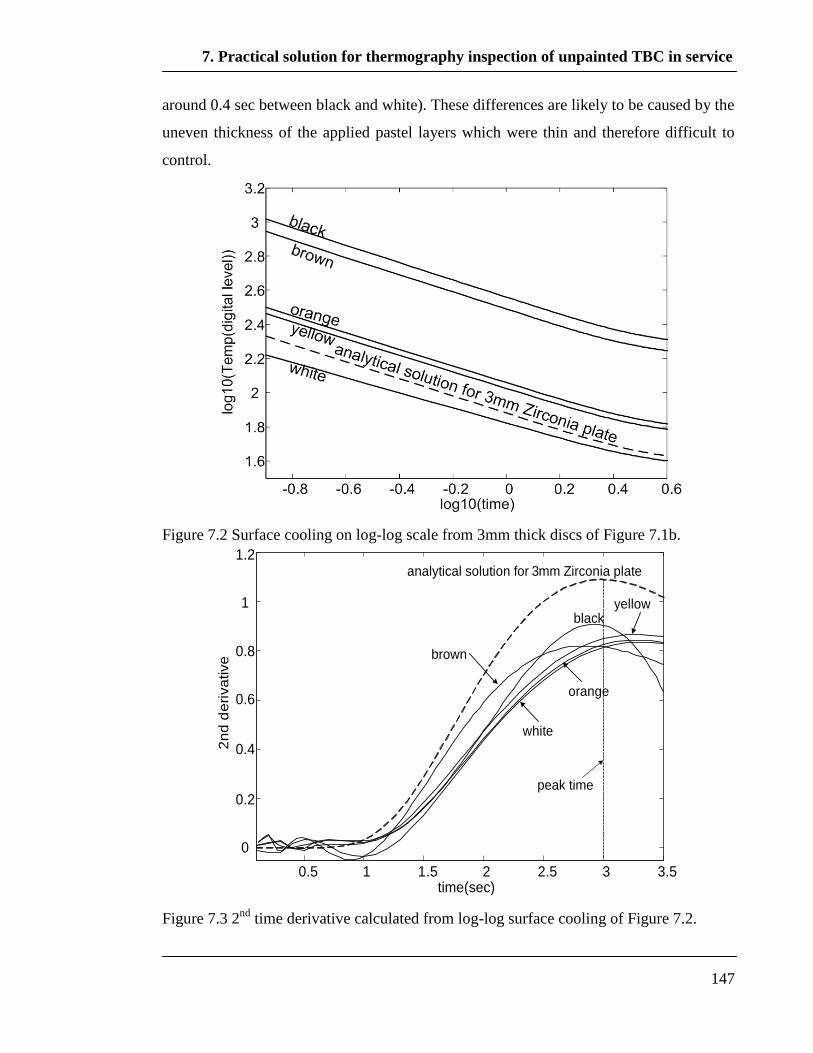
7. Practical solution for thermography inspection of unpainted TBC in service
147
around 0.4 sec between black and white). These differences are likely to be caused by the
uneven thickness of the applied pastel layers which were thin and therefore difficult to
control.
Figure 7.2 Surface cooling on log-log scale from 3mm thick discs of Figure 7.1b.
0.5 1 1.5 2 2.5 3 3.5
0
0.2
0.4
0.6
0.8
1
1.2
time(sec)
2n
d d
eri
va
tive
black
brown
orange
white
yellow
analytical solution for 3mm Zirconia plate
peak time
Figure 7.3 2nd
time derivative calculated from log-log surface cooling of Figure 7.2.
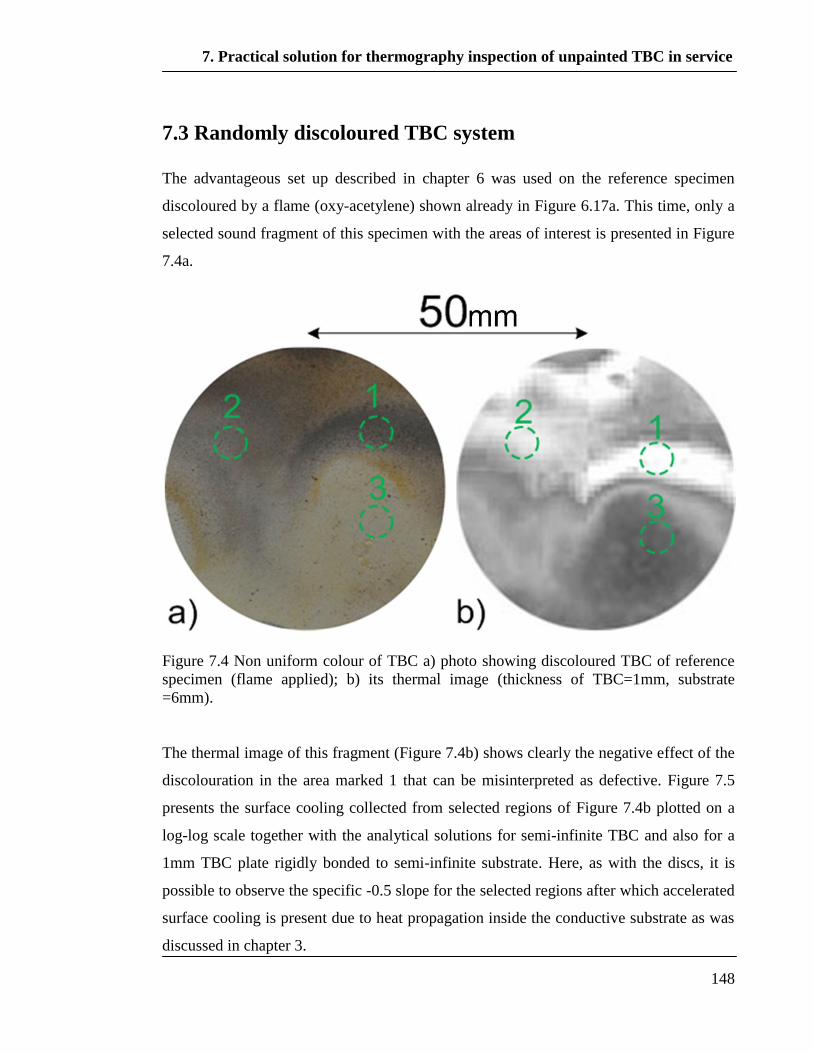
7. Practical solution for thermography inspection of unpainted TBC in service
148
7.3 Randomly discoloured TBC system
The advantageous set up described in chapter 6 was used on the reference specimen
discoloured by a flame (oxy-acetylene) shown already in Figure 6.17a. This time, only a
selected sound fragment of this specimen with the areas of interest is presented in Figure
7.4a.
Figure 7.4 Non uniform colour of TBC a) photo showing discoloured TBC of reference
specimen (flame applied); b) its thermal image (thickness of TBC=1mm, substrate
=6mm).
The thermal image of this fragment (Figure 7.4b) shows clearly the negative effect of the
discolouration in the area marked 1 that can be misinterpreted as defective. Figure 7.5
presents the surface cooling collected from selected regions of Figure 7.4b plotted on a
log-log scale together with the analytical solutions for semi-infinite TBC and also for a
1mm TBC plate rigidly bonded to semi-infinite substrate. Here, as with the discs, it is
possible to observe the specific -0.5 slope for the selected regions after which accelerated
surface cooling is present due to heat propagation inside the conductive substrate as was
discussed in chapter 3.
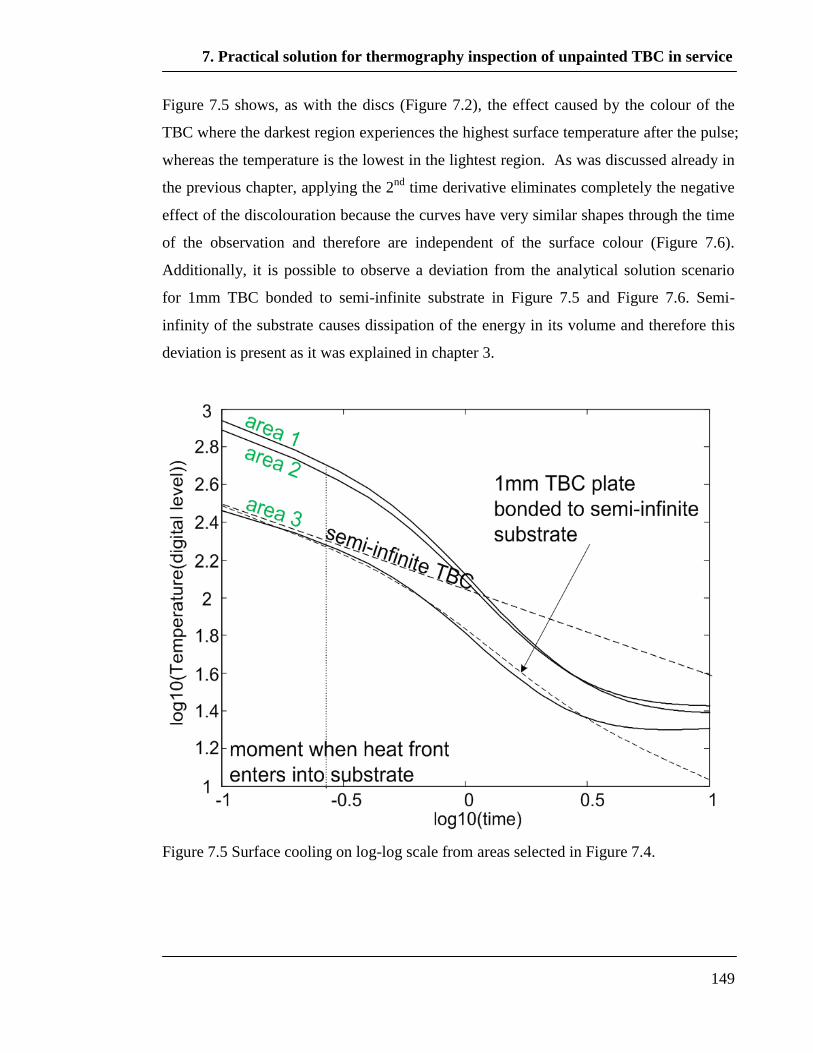
7. Practical solution for thermography inspection of unpainted TBC in service
149
Figure 7.5 shows, as with the discs (Figure 7.2), the effect caused by the colour of the
TBC where the darkest region experiences the highest surface temperature after the pulse;
whereas the temperature is the lowest in the lightest region. As was discussed already in
the previous chapter, applying the 2nd
time derivative eliminates completely the negative
effect of the discolouration because the curves have very similar shapes through the time
of the observation and therefore are independent of the surface colour (Figure 7.6).
Additionally, it is possible to observe a deviation from the analytical solution scenario
for 1mm TBC bonded to semi-infinite substrate in Figure 7.5 and Figure 7.6. Semi-
infinity of the substrate causes dissipation of the energy in its volume and therefore this
deviation is present as it was explained in chapter 3.
Figure 7.5 Surface cooling on log-log scale from areas selected in Figure 7.4.
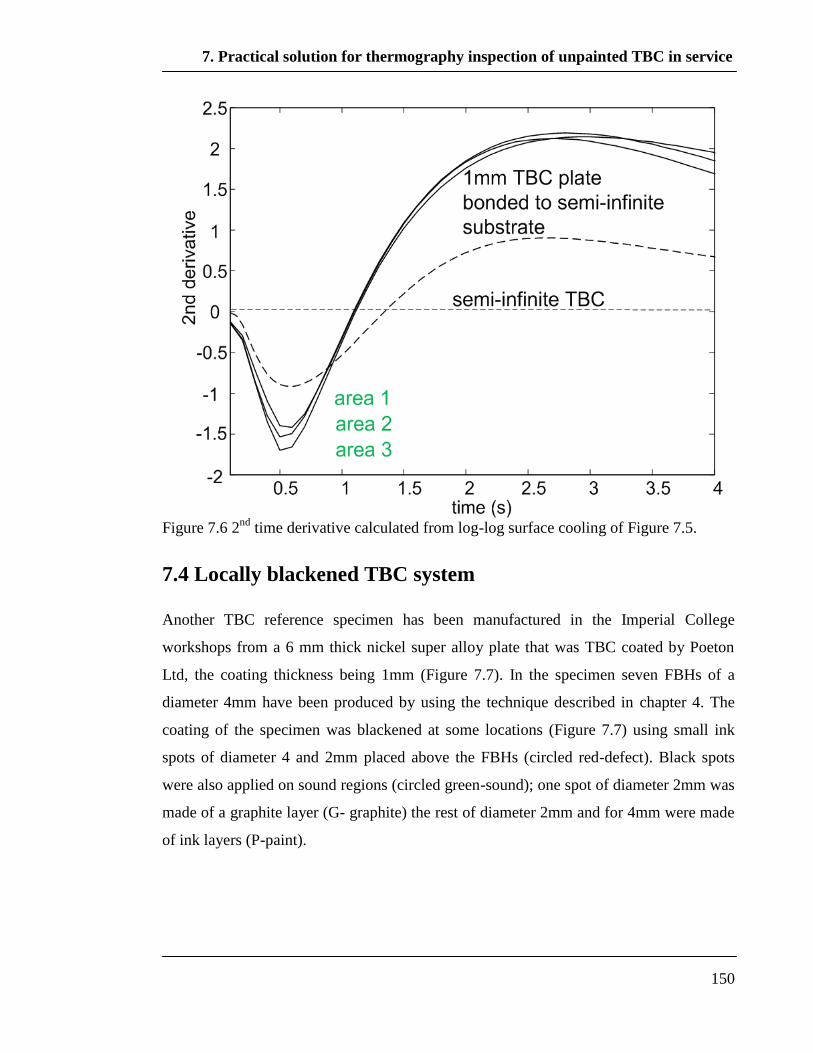
7. Practical solution for thermography inspection of unpainted TBC in service
150
Figure 7.6 2
nd time derivative calculated from log-log surface cooling of Figure 7.5.
7.4 Locally blackened TBC system
Another TBC reference specimen has been manufactured in the Imperial College
workshops from a 6 mm thick nickel super alloy plate that was TBC coated by Poeton
Ltd, the coating thickness being 1mm (Figure 7.7). In the specimen seven FBHs of a
diameter 4mm have been produced by using the technique described in chapter 4. The
coating of the specimen was blackened at some locations (Figure 7.7) using small ink
spots of diameter 4 and 2mm placed above the FBHs (circled red-defect). Black spots
were also applied on sound regions (circled green-sound); one spot of diameter 2mm was
made of a graphite layer (G- graphite) the rest of diameter 2mm and for 4mm were made
of ink layers (P-paint).
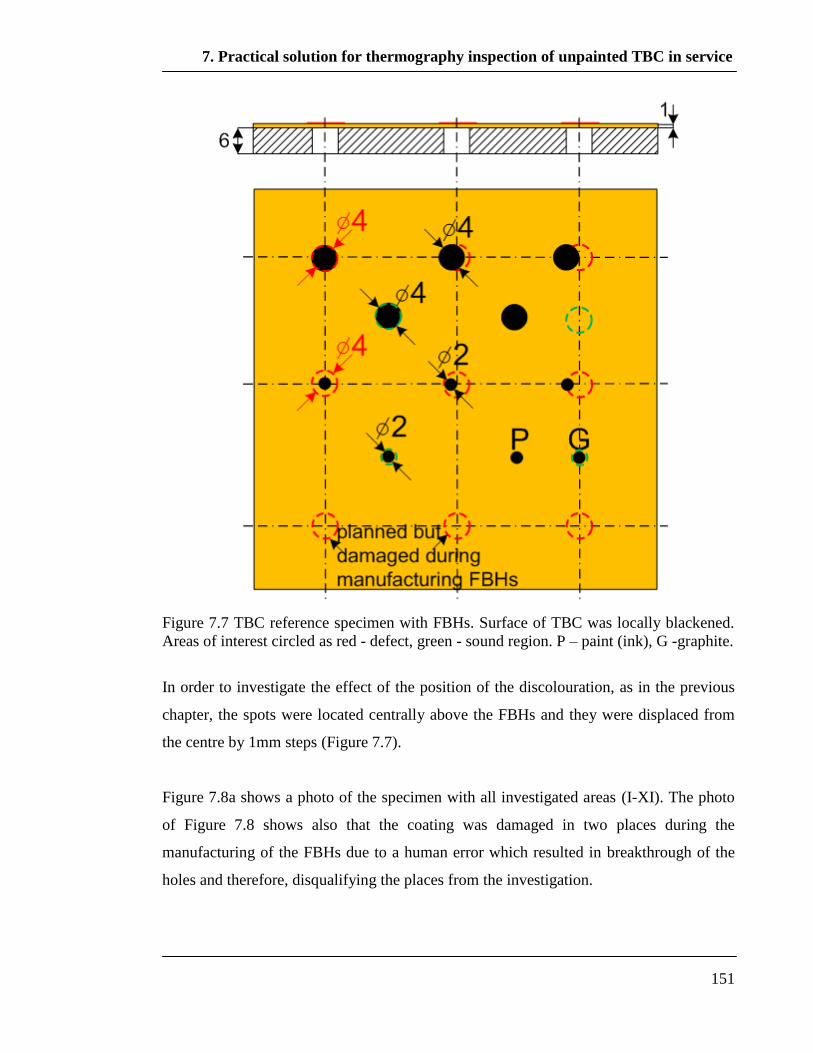
7. Practical solution for thermography inspection of unpainted TBC in service
151
Figure 7.7 TBC reference specimen with FBHs. Surface of TBC was locally blackened.
Areas of interest circled as red - defect, green - sound region. P – paint (ink), G -graphite.
In order to investigate the effect of the position of the discolouration, as in the previous
chapter, the spots were located centrally above the FBHs and they were displaced from
the centre by 1mm steps (Figure 7.7).
Figure 7.8a shows a photo of the specimen with all investigated areas (I-XI). The photo
of Figure 7.8 shows also that the coating was damaged in two places during the
manufacturing of the FBHs due to a human error which resulted in breakthrough of the
holes and therefore, disqualifying the places from the investigation.
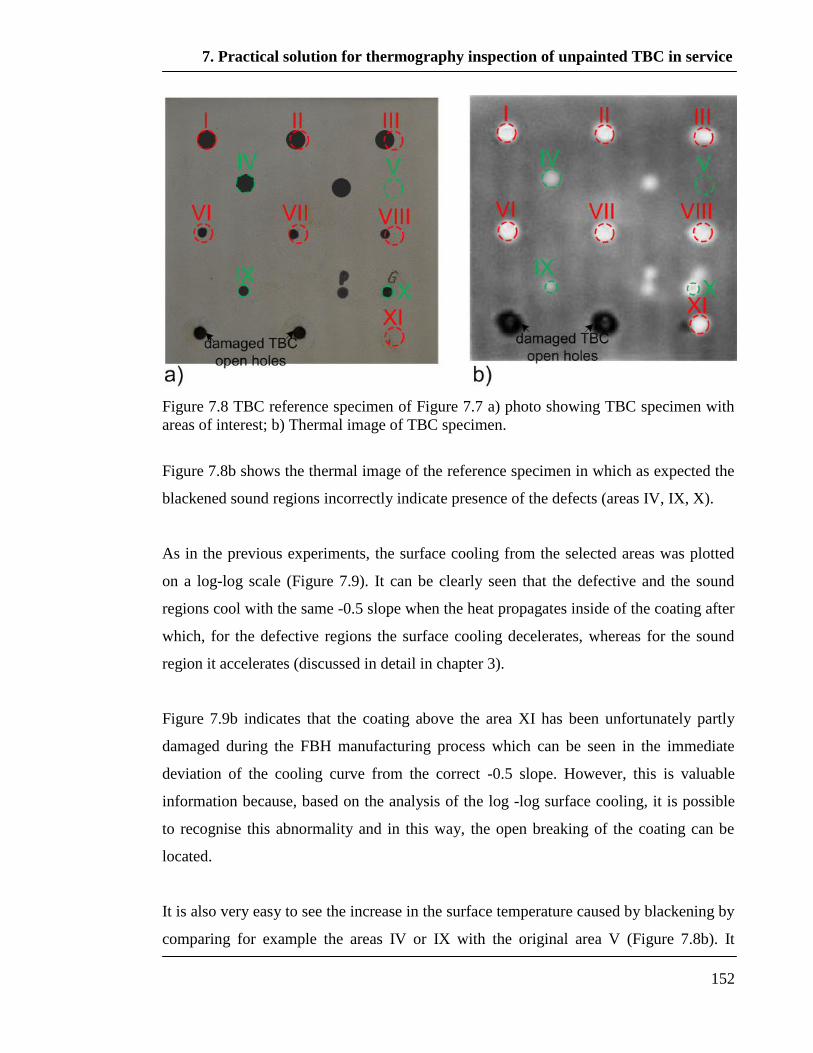
7. Practical solution for thermography inspection of unpainted TBC in service
152
Figure 7.8 TBC reference specimen of Figure 7.7 a) photo showing TBC specimen with
areas of interest; b) Thermal image of TBC specimen.
Figure 7.8b shows the thermal image of the reference specimen in which as expected the
blackened sound regions incorrectly indicate presence of the defects (areas IV, IX, X).
As in the previous experiments, the surface cooling from the selected areas was plotted
on a log-log scale (Figure 7.9). It can be clearly seen that the defective and the sound
regions cool with the same -0.5 slope when the heat propagates inside of the coating after
which, for the defective regions the surface cooling decelerates, whereas for the sound
region it accelerates (discussed in detail in chapter 3).
Figure 7.9b indicates that the coating above the area XI has been unfortunately partly
damaged during the FBH manufacturing process which can be seen in the immediate
deviation of the cooling curve from the correct -0.5 slope. However, this is valuable
information because, based on the analysis of the log -log surface cooling, it is possible
to recognise this abnormality and in this way, the open breaking of the coating can be
located.
It is also very easy to see the increase in the surface temperature caused by blackening by
comparing for example the areas IV or IX with the original area V (Figure 7.8b). It

7. Practical solution for thermography inspection of unpainted TBC in service
153
suggests that the very thin applied layers of ink (areas IV, IX Figure 7.8) cause
improvements to the radiation of thermal energy in comparison to other sound regions
represented here by the area V. Additionally, the thin layer of graphite (Figure 7.9b)
absorbs and emits even more energy than the layers of ink (area IV, IX Figure 7.9).
Indeed, the surface temperature for the areas IV, IX and X was consistently higher than
for the area V during the whole observation period (Figure 7.9).
Fortunately, the blackened areas IV, IX, X and the original area V show the characteristic
minima (chapter 3) (Figure 7.10). Interestingly however, for the area V the minimum
appears earlier than for the areas IV, IX and X and this minimum also rises rapidly to a
maximum. This rapid change was also observed for the randomly discoloured areas of
TBC surface presented in Figure 7.6. Therefore, the differences in the energy absorption
and emission caused by even a very thin layer of a material on the TBC surface affect the
time of the 2nd
derivative minimum and the behaviour immediately afterwards (Figure
7.10). An increase of the energy absorbed results in an increase of the time needed to
reach the minima and also in an increase of the time needed to turn the minima to
maxima (the behaviour of the 2nd
derivative discussed in chapter3). Fortunately however,
the characteristic minima are always present for the sound regions.
As the experiment shows, the effects caused by the applied ink layers on the 2nd
derivative are negligible for the defective regions (Figure 7.10 except damaged area XI)
by showing presence of the characteristic maxima having similar amplitudes and the time
of their appearance.
The analysis of the sound areas and the defective areas suggest that the defect
enhancement achieved by the 2nd
derivative approach is maintained (defect-maximum,
sound area-minimum). Therefore, the 2nd
derivative approach is indeed beneficial for the
inspection of TBC surfaces in service.

7. Practical solution for thermography inspection of unpainted TBC in service
154
Figure 7.9a Surface cooling on log-log scale from areas I-V of Figure 7.8.
Figure 7.9b Surface cooling on log-log scale from areas VI-XI of Figure 7.8.
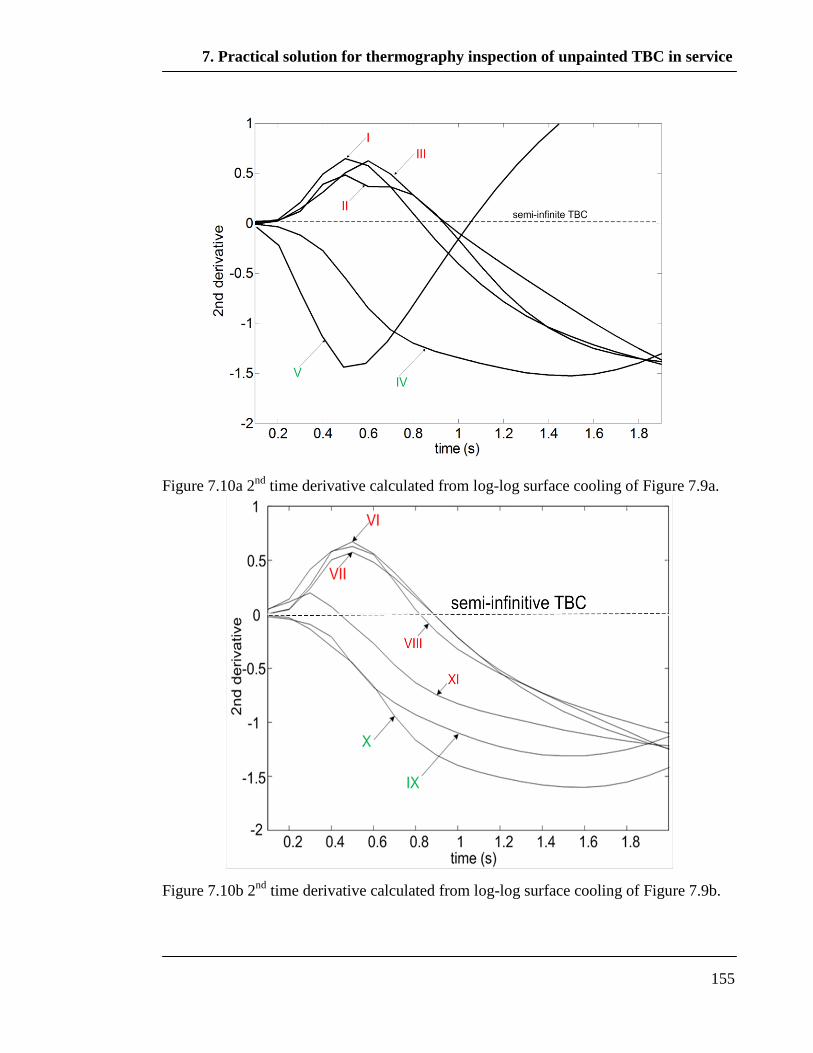
7. Practical solution for thermography inspection of unpainted TBC in service
155
Figure 7.10a 2nd
time derivative calculated from log-log surface cooling of Figure 7.9a.
Figure 7.10b 2nd
time derivative calculated from log-log surface cooling of Figure 7.9b.
7. Practical solution for thermography inspection of unpainted TBC in service
156
7.5 Conclusions
In this chapter, the practical effects of TBC discoloration on the surface thermal response
were investigated by tests on coloured Zirconia discs, a TBC reference specimen
randomly discoloured by an oxy-acetylene flame and a TBC reference specimen locally
blackened in selected areas. The advantageous set up discussed in the previous chapter
comprising a powerful energy source, a glass filter and a long wave length IR camera
(the Rolls Royce System) was used.
It has been shown that the colour of the coating is a very important factor affecting the
amount of energy absorbed and emitted from an inspected TBC surface. The experiments
demonstrated that non-uniformity in the energy absorption and its emission from a TBC
surface due to discolouration may lead to incorrect interpretation of the thermal images
in which a darkened, sound area of a TBC surface provides a thermal response very
similar to the thermal response from a disbond. This situation is present during a
significant amount of time after the pulse. Unfortunately, the risk of incorrect
interpretations of the thermal responses cannot be eliminated only by the equipment used
because the results from the experiments performed by the Bath System (previous
chapter) and the Rolls Royce System show the same issue.
However, it has been demonstrated that using the 2nd
time derivative of the log-log
surface cooling as a signal processing technique eliminates completely the problem
caused by discoloration; with this processing a defect is indicated by a characteristic
maximum and a sound area by a characteristic minimum.
8. Conclusions
157
Chapter 8
Conclusions
8.1 Thesis review
A summary of the thesis is presented below and for convenience, the main findings are
recapitulated in more concise form in the next section. In the final section, suggestions
for future work are given.
This thesis has explored the application of transient thermography for the detection of
disbonds of minimum diameter 2mm located in a thermal barrier coating (TBC) system
whose surface may be unpainted. The technique, the type/size of the defect and also the
condition of the TBC system for the inspection has been specified by Alstom Power
Switzerland, the sponsor of the EngD project (chapter 1).
In order to fulfil the task, the thermal barrier coating was described together with a set of
events which lead to development of disbonds and subsequently to coating failure by
spalling. The thesis has concentrated on transient thermography and its general principles
and the equipment used were described in chapter 2. The thesis has focused only on the
application of transient thermography to TBC specimens and has investigated issues such
as changes of the coating thermal conductivity and its thickness, the effects caused by
partial translucency of TBC to IR radiation, the uneven thickness of the substrate, the

8. Conclusions
158
afterglow effect and also the effects caused by discolouration of an unpainted coating
surface (chapter 2-7).
In order to investigate all the issues, the thesis has applied computer simulations allowing
calculations of the temperature distribution in any TBC specimen as a function of time
and space caused by a pulse of a thermal energy. Because, practically only the surface
temperature can be meausered, this temperature as a function of time has been the main
focus (chapter 3-7).
The results from the simulations have been reinforced by the results from many practical
tests on various TBC specimens (chapter 4, 6, 7). Based on the surface temperature, two
indicators of a subsurface defect in transient thermography have been defined, the
thermal contrast and application of the 2nd
time derivative to the surface cooling plotted
on a log-log scale (chapter 3).
The thesis has indicated two problems with selecting appropriate reference specimens for
transient thermography inspection of TBC. Real disbonds are very difficult to use
because it is difficult to control their size, and larger ones tend to spall. Therefore, in
order to avoid this problem, flat bottomed holes are commonly used, but these over-
estimate the thermal contrast obtained for a defect of a given diameter. The thesis has
quantified the differences in thermal response between different possible designs by
using finite element analysis validated by experiments, and has proposed a form of
artificial disbond that gives a better representation of the thermal responses seen with real
defects. Real disbonds tend to have a non-uniform gap between the disbonded surfaces
across the defect, and the effect of this on the thermal response has been evaluated using
finite element simulations. Based on this feature, a profiled artificial disbond has been
also proposed as an improvement to the artificial disbond (chapter 4).
Because the sponsor requires the inspection of unpainted TBC components both in
production and in-service, the thesis has investigated theoretically and experimentally the
effects of partial translucency of the coating to IR radiation, which negatively affects
8. Conclusions
159
disbond detection. Additionally, discolouration present on TBC surfaces after service
also negatively affects the detectability and has been investigated by researching firstly
the effects of the colour itself and secondly the effects local darkening of the TBC
surface above defective and sound regions. In order to overcome both obstacles and to
fulfill the requirements, the thesis has proposed the use of a powerful light source with
built in cooled glass filter to significantly reduce the IR radiation from the source so that
heating is primarily from the visible spectrum. A long wavelength IR camera is used to
monitor the surface temperature and an image processing technique involving the 2nd
time derivative of the surface cooling plotted on log-log scale is applied (chapter 6, 7).
It has been shown that practical usage of the powerful flash lamps, the glass filter and the
long wavelength IR camera eliminate issues with TBC translucency and the afterglow
effect (chapter 7). Additionally, processing of the raw thermal images collected from this
set up by applying the 2nd
time derivative can be very beneficial for certainty of the
inspection. The results of this image processing technique allow very clear distinction
between the defective region and the sound region even if the TBC is unpainted and
unevenly discolured due to its service.
The tests were performed on the specimen having the maximum possible thickness of
coating (1mm) and nevertheless the defects were clearly seen and distinguished from the
sound, discoloured regions when the 2nd
time derivative approach was used. Reduction of
the coating thickness caused by its erosion in service (chapter 1) improves disbond
detectablity as discussed in chapter 5.3 so disbonds of smaller diameters can be detected.
In chapter 4 it was shown that by using even the standard transient thermography set up
(used also in chapter 6) and the 2nd
derivative image processing, it was possible to detect
2mm defect in a 1mm thick reference specimen (Figure 4.13). However, specialist setup
(Rolls Royce system) of chapter7 gives more reliable results. Therefore, installation of
this set up together with the image processing application will allow the sponsor of the
project to perform reliable in service inspection on untainted, discoloured TBC gas
turbine blades and to locate 2mm disbonds.
8. Conclusions
160
8.2 Main findings of this thesis
The contributions and findings of the thesis can be briefly summarised as follows:
It has been shown that 2D finite element simulations for transient thermography
of TBC specimens under various conditions can provide useful information of
the surface thermal responses. the predictions have been validated by the results
from practical tests;
It has been shown by using the simulations that the specific “buckled” shape of a
real disbond cause substantial changes in the heat propagation in comparison to a
flat bottomed hole (FBH) of the same diameter;
An artificial disbond has been designed and successfully manufactured whose
thermal response more accurately represents a disbond with uniform air gap
thickness then the thermal response from an FBH;
A profiled artificial disbond has been also designed whose predicted thermal
response even more closely matches the thermal response from a real “buckled”
disbond of the same diameter. However this proved to be very difficult to
manufacture;
It has been proven that the afterglow effect, the partial translucency of TBC to IR
radiation and surface discolouration have very negative effects on the correct
interpretation of the thermal images if a mid wavelength IR camera is used and
the surface is not painted black;
The thesis has demonstrated that the problems listed above can be resolved and
both uniform light coloured and partially discoloured TBC specimens can be
successfully tested unpainted if a setup with a powerful light source together
with a cooled IR glass filter and a long wave length IR camera is used;
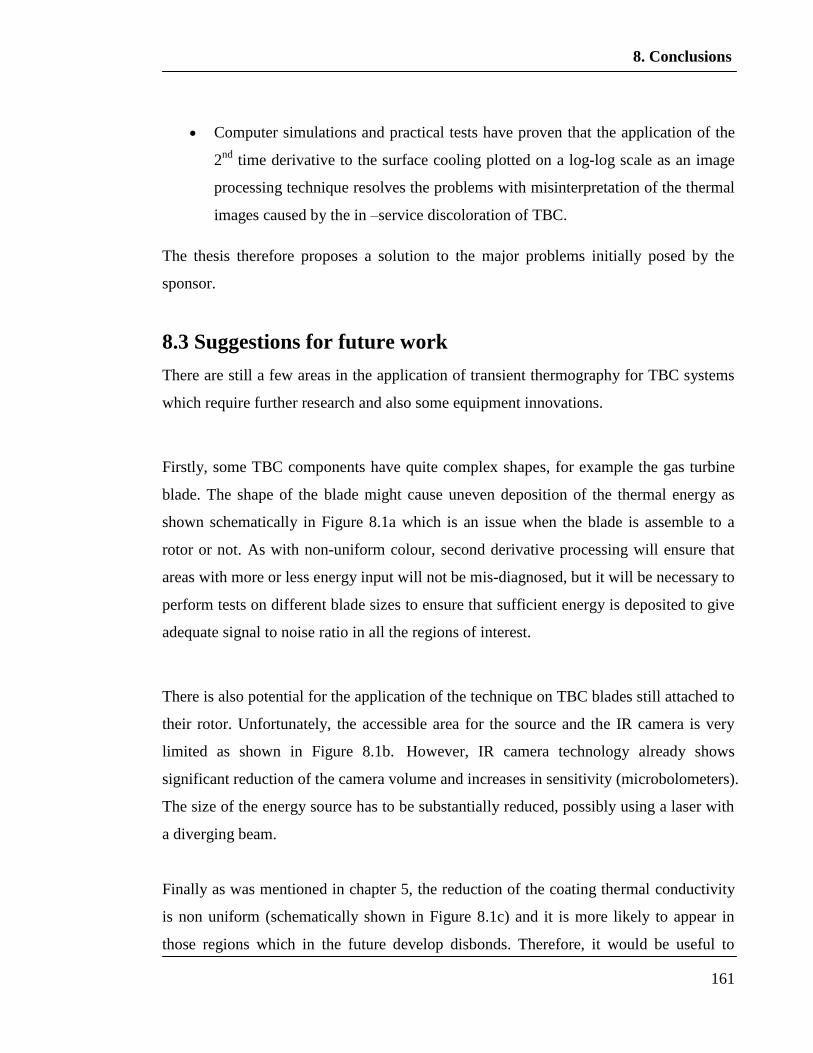
8. Conclusions
161
Computer simulations and practical tests have proven that the application of the
2nd
time derivative to the surface cooling plotted on a log-log scale as an image
processing technique resolves the problems with misinterpretation of the thermal
images caused by the in –service discoloration of TBC.
The thesis therefore proposes a solution to the major problems initially posed by the
sponsor.
8.3 Suggestions for future work
There are still a few areas in the application of transient thermography for TBC systems
which require further research and also some equipment innovations.
Firstly, some TBC components have quite complex shapes, for example the gas turbine
blade. The shape of the blade might cause uneven deposition of the thermal energy as
shown schematically in Figure 8.1a which is an issue when the blade is assemble to a
rotor or not. As with non-uniform colour, second derivative processing will ensure that
areas with more or less energy input will not be mis-diagnosed, but it will be necessary to
perform tests on different blade sizes to ensure that sufficient energy is deposited to give
adequate signal to noise ratio in all the regions of interest.
There is also potential for the application of the technique on TBC blades still attached to
their rotor. Unfortunately, the accessible area for the source and the IR camera is very
limited as shown in Figure 8.1b. However, IR camera technology already shows
significant reduction of the camera volume and increases in sensitivity (microbolometers).
The size of the energy source has to be substantially reduced, possibly using a laser with
a diverging beam.
Finally as was mentioned in chapter 5, the reduction of the coating thermal conductivity
is non uniform (schematically shown in Figure 8.1c) and it is more likely to appear in
those regions which in the future develop disbonds. Therefore, it would be useful to
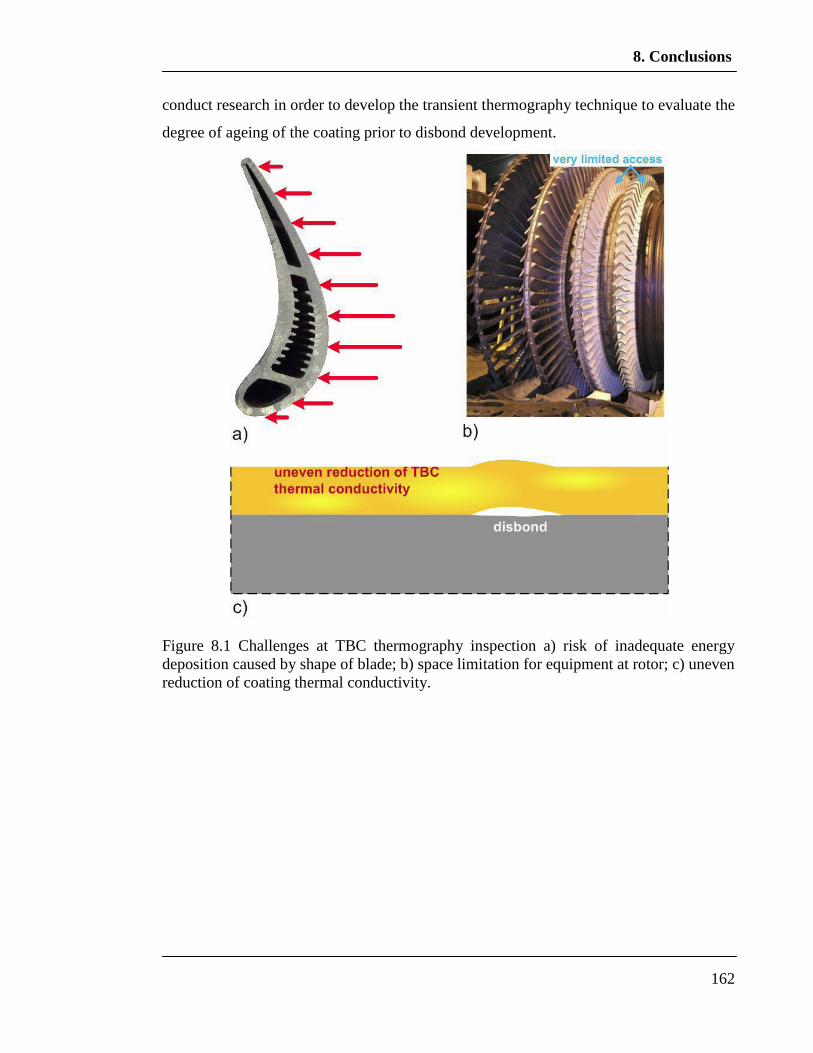
8. Conclusions
162
conduct research in order to develop the transient thermography technique to evaluate the
degree of ageing of the coating prior to disbond development.
Figure 8.1 Challenges at TBC thermography inspection a) risk of inadequate energy
deposition caused by shape of blade; b) space limitation for equipment at rotor; c) uneven
reduction of coating thermal conductivity.
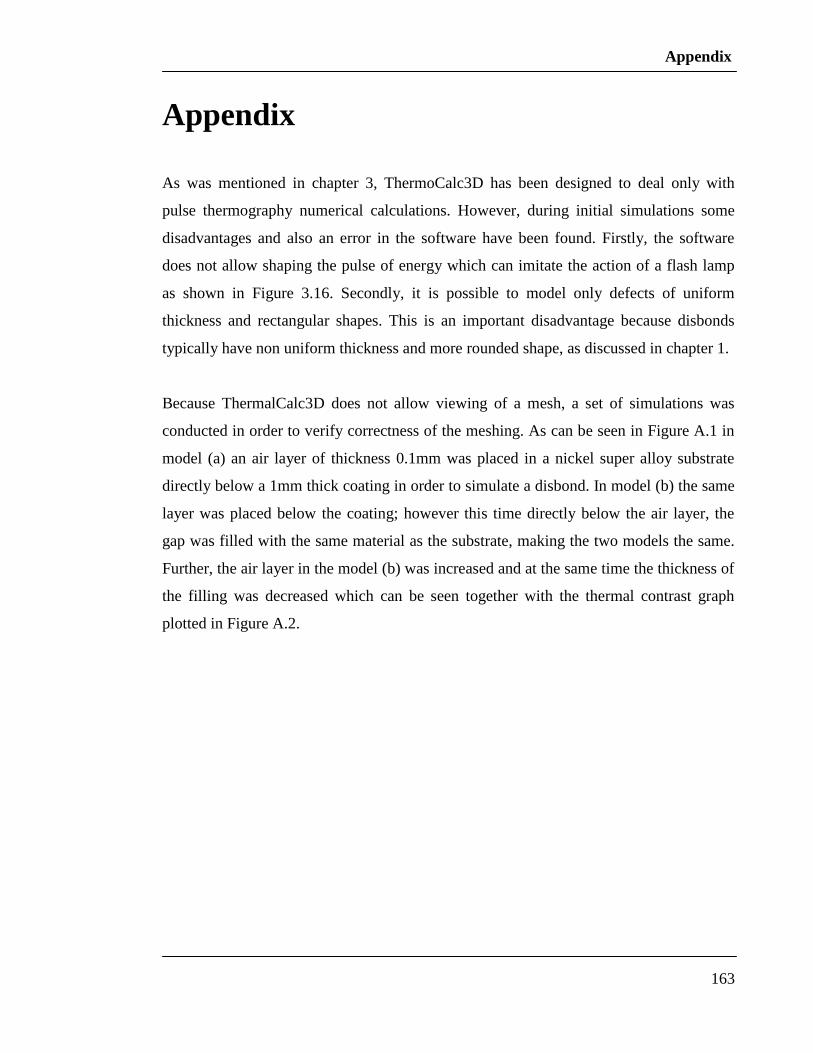
Appendix
163
Appendix
As was mentioned in chapter 3, ThermoCalc3D has been designed to deal only with
pulse thermography numerical calculations. However, during initial simulations some
disadvantages and also an error in the software have been found. Firstly, the software
does not allow shaping the pulse of energy which can imitate the action of a flash lamp
as shown in Figure 3.16. Secondly, it is possible to model only defects of uniform
thickness and rectangular shapes. This is an important disadvantage because disbonds
typically have non uniform thickness and more rounded shape, as discussed in chapter 1.
Because ThermalCalc3D does not allow viewing of a mesh, a set of simulations was
conducted in order to verify correctness of the meshing. As can be seen in Figure A.1 in
model (a) an air layer of thickness 0.1mm was placed in a nickel super alloy substrate
directly below a 1mm thick coating in order to simulate a disbond. In model (b) the same
layer was placed below the coating; however this time directly below the air layer, the
gap was filled with the same material as the substrate, making the two models the same.
Further, the air layer in the model (b) was increased and at the same time the thickness of
the filling was decreased which can be seen together with the thermal contrast graph
plotted in Figure A.2.

Appendix
164
Figure A.1 Two models with defect used to validate ThermoCalc3D
a) air gap placed below coating inside substrate; b) air gap placed below coating inside
substrate with additional filling.
As can be clearly seen in Figure A.2, after plotting the data provided byThermoCalc3D,
the value of the thermal contrast is different for two models having the same thickness of
the air gap (model a and b). These results suggest a lack of lateral connection between
the mesh elements of the filling and the rest of the substrate. This suspicion was
confirmed when the air gap was increased and at the same time the filling thickness was
reduced in the expanded model b, which did not affect the heat propagation and resulted
in an unaffected thermal contrast as shown in Figure A.2. Therefore the ThermoCalc3D
software has not been applied for further simulations.
COMSOL Multiphysics allows viewing of the mesh and the same simulations were
repeated using this package. As can be seen clearly in Figure A.3 the error is not present.
The thermal contrast from both models containing the artificial disbond of the same
diameter and thickness is the same (the red curve). Additionally, the thermal contrast
correctly varies with the size of the air gap which also can be seen in Figure A.3.
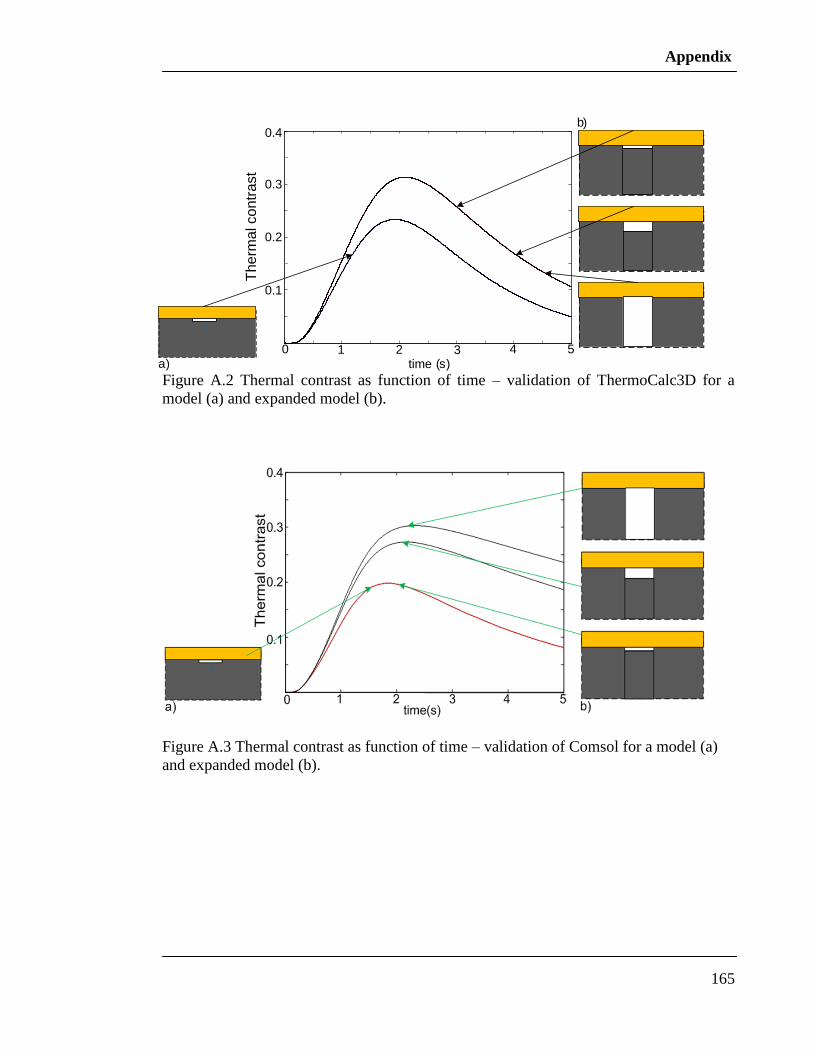
Appendix
165
Figure A.2 Thermal contrast as function of time – validation of ThermoCalc3D for a
model (a) and expanded model (b).
Figure A.3 Thermal contrast as function of time – validation of Comsol for a model (a)
and expanded model (b).
0 1 2 3 4 5
0.2
0.3
0.4
time (s)a)
b)
The
rma
l co
ntr
ast
0.1
REFERENCES
166
References
Aamodt L.S., Maclachlan J.W., Murphy J.C. (1990). ”Analysis of Characteristic of
Thermal Transient Times for Time Resolved Infrared Radiometry Studies of
Multilayered Coatings” Journal of Applied Physisc, vol.68, pp. 6087-6097.
Abuhamad M., Netzelmann U. (2010).”Dual-band active thermography on infrared
transparent materials”, 10th
International Conference on Quantitative Infrared
Thermography July 27-30, Canada.
Adams S. (2000). “Advanced Physics”, OUP Oxford UK.
Ahmed T. (1987).“Characterization of plasma sprayed coatings using thermal wave
infrared video imaging”, Journal of Nondestructive Evaluation vol. 6, pp. 169-175.
Almond D.P., Lau S.K. (1993). “Edge effects and a method of defect sizing for transient
thermography”, Applied Physics, vol.62, pp. 3369-3371.
Almond D.P., Lau S.K. (1994).”Defect sizing by transient thermography I: an analytical
treatment”, Applied Physics, vol.27, pp.1063-1069.
Almond D.P., Lau S.K. (1995).”Defect sizing by transient thermography I: a numerical
treatment”, Applied Physics, vol.28, pp.2539-2546.

REFERENCES
167
Almond D.P., Petel P.M. (1996). “Photothermal Science and Technique”, Chapman &
Hall, London.
Almond D.P., Pickering S. (2012).”An analytical study of the pulsed thermography
defect limit” Journal of Applied Physics, vol.111, pp.1234-1239.
Ammirato F., Zaticek P. (1999).”Infrared thermography field application guide”, Electric
Power Research Institute, Inc., Palo Alto, CA , Tech. Rep. TR-107142.
Ananthapad P.V. (1999). “Non-equilibrium Processing of Materials” C. Suryanarayana
Pergamon, New York, USA.
Auerkari P. (2003). “Maintenance of gas turbine –impact and implications for NDT”
NDT net, vol. 8 (2), pp. 1344-1354.
Badghaish A.A., Fleming D.C. (2008). “Non-destructive Inspection of Composites Using
Step Heating Thermography”, Journal of Composite materials, vol. 42, pp. 1337-1345.
Balageas D. (2010). “Qauntitative assessment of the improvement of the detection of
defects by pulse thermography thanks to the TSR approach in the case of smart
composite repair patch” 10th
International Conference on Quantitative Infrared
Thermography, Canada, pp 8-16.
Balageas D.(2010).”Thickness of diffusivity measurements from front-face flash
experiments using the TSR (thermographic signal reconstruction) approach”,10th
International Conference on Quantitative InfraRed Thermography, 27-30 July, Canada.
Bison P.G., Cernuschi F., Grinzato E., Marinettti S., Robba D.(2006). ”Aging evaluation
of thermal barrier coatings by thermal diffusivity”, Infrared Physics&Technology, vol.
49, pp.286-291.

REFERENCES
168
Bison P.G., Marinetti S., Grinzato E., Vavilov V.(2003). “Inspecting Thermal Barrier
Coatings by IR thermography”, Thermosense, vol.22, pp.2012-2018.
Boyce M.P. (2012). “Gas turbine engineering handbook” Elsevier, Waltham, USA.
Busse G., Wu D., Karpen W. (1992).“ Thermal wave imaging with phase sensitive
modulated thermography”, Journal of Applied Physics, vol. 71, pp 3962-3965.
Cawley P. (1994).“Rapid scanning techniques for composites”, Composites ISSN 0010-
4361, vol. 25 (32), pp 351-357.
Cengel Y. A. (1998). ” Heat transfer “The McGraw-Hill Companies, Hightstown, USA.
Cengel Y.A. (1998). “Heat transfer A practical approach”, McGraw-Hill Companies,
New York.
Chen X. (2001).”Progressive Damage and Failure of Thermal Barrier Coatings”, Ph.D.
Dissertation, Wayne State University, USA.
Choi S. R, Hutchinson J. W., Evans A.G. (1999). “Delamination of multilayer thermal
barrier coatings”, Mechanics of Mateterials vol. 31, pp. 431-447.
Cielo P.(1987). “Optothermal NDE of thermal-barrier coatings” Journal of Materials
Engineering vol.9, pp. 71-78.
Cielo P. (1984). “Pulsed Photothermal Evaluation of Layered Materials”, Journal of
Applied Physics, vol.56, pp. 230-234.
Dallaire S.(1985).“Optothermal NDE of Thermal Barrier Coatings”, International
Conference on Surface Modification and Coatings, Toronto, Canada, p.10.
REFERENCES
169
Dobbins T.A., Knight R., Mayo M.J. (2003). “HVOF thermal spray deposited Y2O3-
stabilized ZrO2 coatings for thermal barrier applications”, Journal of Thermal Spray
Technology vol. 200 pp.214- 225.
Eldrige J., Spuckler M., Martin E. (2006). ”Monitoring Delamination Progression in
Thermal Barrier Coatings by Mid-Infrared Reflactence Imaging”, International Journal
Applied Ceramic Technology, vol.3, pp.94-104.
Franke B. (2004). “Non Destructive Evaluation of Thermal Barrier Coatings with
Thermal Wave Imaging and PhotoStimulated Luminescence Spectroscopy”, M.A. Thesis,
University of Central Florida, USA.
Gaussourgues G. (1994). “Infrared thermography”, Chapman & Hall , London.
Happload P. G, Ellingson W.A. , Gardier T. , Kruger J.(1994). “Defect detection in Multi
–Layered Plasma Sprayed Coating by Time resolved IR Radiometry:AComparisson
between Analytical and Experimental Methods, Thermosense,vol. 2245, pp. 210-219.
Hartikainen J. (1989). “Inspection of plasma-sprayed coatings using fast infrared
scanning technique”, Review Scientific Instrumentation. vol. 60, pp.1334-1338.
Heida J.H. (2004). “Nondestructive evaluation of superalloy specimens with a thermal
barrier coating”, National Aerospace Laboratory report, 16th
World Conference on NDT,
Montreal, Canada.
Houlbert A. S. (1994). “Measurement of thermal diffusivity and anisotropy of plasma-
sprayed coatings” International Journal of Thermophysics vol.15, pp. 525-535.
Kidd G., Nunn J. (2011). ”Application of pulsed thermography to quality assurance of
thermal”, Journal of Aerospace Engineering, published online 19 October 2011.

REFERENCES
170
Krapez J., Belegeas D., Deom A., Lepoutre F.(1994). ”Early detection by stimulated
infrared thermography”, Advances in Signal Processing for Nondestructive Evaluation of
Materials, vol.22, pp.303-321.
Larsen C.A. (2011). “Document Flash Thermography”, M.A. Thesis, Utah State
University, Logan, Utah, USA.
Lau S.K, Almond D.P., Milne J.M. (1991). “Quantitative analysis of pulsed video
thermography”, NDT&E International, vol.24, pp. 195-202.
Lau S.K., Almond D.P., Patel P.M. (2003).“ Transient thermal wave techniques for
evaluation of surface coatings”, Journal of Applied Physics, vol. 24, pp 4280-436.
Lhota J., Shepard S.M. (2005).”Critical timing issues in flash thermography”, D.O
Thomson and D.E. Chimenti , vol.760, pp.1654-1660.
Liebert C.H. (1978). “Emittance and Absorptance of the National Aeronautics and Space
Administration Ceramic Thermal Barrier Coating”, Thin Solid Films, vol.53 pp235-240.
Maclachlan S., Kerns W.D., Aamondt L.C. (1989). “Measurement of Coating Physical
Properties and Detection of Coating Disbonds by Time Resolved Radiometry”, Journal
of NDE, vol.8, pp. 107-120.
Maclachlan Spicer J. W. (1989). “Measurement of coating physical properties and
detection of coating disbonds by time-resolved infrared radiometry”, Journal of
Nondestructive Evaluation vol.8, pp.107-115.
Maldague X. P. (2001). “Theory and Practice of Infrared Technology for Nondestructive
Testing”, A Willey-Interscience Publication, New York.
REFERENCES
171
Mao W.G, Dai C.Y, Zhou Y.C. (2007). “An experimental investigation on thermo-
mechanical buckling delamination failure characteristic of air plasma sprayed thermal
barrier coating” Surface and Coating Technology, vol. 201, pp. 6217-6227.
Marinetti S., Robba D., Cernuschi F., Bison P.G., Grinzato E. (2007). “Thermographic
Inspection of TBC coated gas turbine blades: Discrimintion between coating over
thickness and adhesion defects”, Infrared Physics&Technology, vol. 49, pp. 281-285.
Meola C. (2004). “Recent advances in the use of infrared thermography”, Institute of
physic publishing, vol.22, pp 27-58.
Meola C., Carlomano G. M., Fogia M., Natale Di. (2008). “Infrared thermography to
detect residual ceramic in gas turbine blades”, Applied physics, vol.91, pp. 685- 691.
Morbidini M., Cawley P., Barden T., Almond D.P., Duffour P.(2006).”Prediction of
thermosonic signal from fatigue cracks in metal using vibration damping measurements”,
Journal of Applied Physics, vol.100, pp. 3962-3965.
Morris J. (1988). “The influence of coating properties on the sensitivity of thermal-wave-
testing techniques”, Surface and Coatings Technology vol.34, pp. 51-60.
Netzelmann U. (2001). ”Optimized temporal excitation profiles in active
thermography”,Analytical Sciences, vol. 17, pp. 432-435.
Nicholls J.R, Wellman R.G. (2003).” Erosion and Foreign Object Damage of Thermal
Barrier Coating”, RTO AVT Specialists Meeting on “The Control and Reduction of
Wear in Military Platforms”, Williamsburg, USA.
Padture N., Gell M., Jordan E. (2002). “Thermal Barrier Coatings for Gas-Turbine
Engine Applications”, Science vol. 296, no. 5566, pp. 280-284.

REFERENCES
172
Padture N., Gell M., Jordan E. (2002). “Thermal Barrier Coatings for Gas-Turbine
Engine Applications”, Science vol. 296, no. 5566, pp. 280-284.
Patel P.M, Lau S.K., Almond D.P. (1991). ”A review of image analysis techniques
applied in transient thermographic non destructive testing”, Non destructive Testing,
vol.6, pp. 343-364.
Perez I., Han X. (2002). “Pulsed thermography modeling”, Review of Progress in
Quantitative Nondestructive Evaluation, AIP Conference Proceedings, Volume, 615, pp.
564- 571.
Pickering S.G, Almond D.P. (2007). “Automated defect detection for pulse transient
thermograpy”, Review of Quantitative Nondestructive Evaluation vol. 26, pp.1722-1728.
Ptaszek G., Cawley P., Almond A., Pickering S. (2011).”Artificial disbonds for
calibration of transient thermography inspection of thermal barrier coating systems”
NDE&E International vol.45, pp. 71-78.
Quek S., Almond D.P. (2005). “Defect detection capability of pulsed transient
thermography”, Insight 47,212-215.
Ringermacher H.I. (2002). “Method and apparatus for quantitative nondestructive
evaluation of metal airfolis using high resolution transient themography”, U.S. Patent.
6,394,646 B1.
Rousset G. (1985). “A pulsed thermo-elastic analysis of photo-thermal surface
displacements in layered materials”, Journal of Applied Physics vol. 57, pp. 4396-4402.
Shawkat M., Song S, P. X. (2002).”Evaluation of degradation of thermal barrier coatings
using Impedance spectroscopy”, Journal of European Ceramic Society, vol.22, pp. 101-
107.
REFERENCES
173
Shepard S.M., Favro L.D., Thomas R.L. (1995). “Thermal Wave NDT of Ceramic
Coatings”, Themosense, vol. 2473, pp. 190-193.
Shepard S., Hou Y., Lhota J.R., Wang D. (2005). “Thermographic measurement of
thermal barrier coating Thickness”, Themosense, vol. 5782, pp.1010-1013.
Shepard S.M, Hou Y., Ahmed T., Lhota J. (2006). “Reference-free interpretation of flash
thermography data”, Insight, vol.48, no. 5, pp. 298-301.
Shepard S.M. (2010).”System for generating thermographic images using thermogarphic”
US 7,724,925 B2
Shepard S.M., Hou Y.L., Lhota J.R., Golden J.M. (2007).”Automated Processing of
Thermographic Derivatives for Quality Assurance”, Optical Engineering ,vol. 46, pp.
510081-6.
Shepard S.M. (2006). “Synthetic processing of pulsed thermographic data for inspection
of turbine components”, BINDT Insight, vol. 43, no.9, pp. 587-589.
Shepard S.M., Hou Y., Lhota J., Wang D., Ahmed T. (2005). “Thermographic
measurement of thermal barrier coating thickness”, Thermosense XXVII, vol. 5782, pp.
167-178.
Shepard S.M., Lhota J.R, Rubadeux B.A, Wang D., Ahmed T. (2003).”Reconstruction
and Enhancement of active thermographic image sequences”, Optical Engineering,
vol.42, pp. 298-307.
Shepard S.M., Lhota J.R., Ahmed T. (2007). “ Flash thermography contrast model based
on IR camera noise characteristics” Non Destructive Testing and Evaluation, vol.22, pp.
113-120.
REFERENCES
174
Sun J.G. (2009).”Development of Nondestructive Evaluation Method for Ceramic
Coatings and Membranes”, Annual Conference in Fossil Energy materials, May 12-14,
Pittsburgh, USA.
Sun J. G., Benz J. (2005).” Flash duration effect on one sided thermal imaging”, Review
of Quantitative Nondestructive Evaluation vol. 24, pp.1522-1528.
Sun J. G. (2009). “Optical filters for flash lamps in pulsed thermal imaging”, U.S. Patent.
7,538,938 B2.
Sun J. G. (2008). “Development of Nondestructive Evaluation Method from Thermal
Barrier Coatings” Proc.22nd
annual Conference on Fossil Energy Material, Pittsburgh,
USA.
Tamarin Y. (2002). “Protective Coatings for Turbine Blades”, ASM International, USA.
Tolpygo V. K., Clarke D.R. (2003). ”Morphological evolution of thermal barrier coating
induced by cyclic oxidation”, Surface and Coating Technology, vol. 163-164, pp. 81-86.
Troitskii O. Yu. (1999) “A new approach to the flash technique for the remote sensing of
layered materials” Mechanics of Composite materials,vol. 35, pp. 271-280.
Vavilov V. P. (2005). “Thermal Nondestructive Testing of Thermal-Barrier Coatings of
Turbine Buckets Russian Journal Nondestructive Testing, vol.41, pp. 466-470.
Vavilov V. (2007). “Pulsed thermal NDT of materials: back to basics” Non destructive
testing and Evaluation, vol. 22, pp. 177-197.
Velinov T. (1990). “Thermal wave characterization of inhomogeneities in sprayed
coatings”, Revue de Physique Appliquée vol.25, pp. 817-828.
REFERENCES
175
Weeks B. D. (2011). “Investigation of Infrared Thermography NDE Techniques for Use
in Power Station Environments” EngD thesis, Imperial College London
Zhao S., Zhang C., Wu N., Wang H. (2011).” Quality evaluation for air plasma spray
thermal barrier coating with pulsed thermography”, Progress in Natural Science:
Materials International, vol. 21, pp. 301-306.
List of publications
Ptaszek G., Cawley P., Almond A., Pickering S. (2011).”Artificial disbonds for
calibration of transient thermography inspection of thermal barrier coating systems”,
Review of Progress in Quantitative Nondestructive Evaluation, Burlington USA, vol. 31a,
pp 491-498.
Ptaszek G., Cawley P., Almond A., Pickering S. (2011).”Artificial disbonds for
calibration of transient thermography inspection of thermal barrier coating systems”
NDE&E International, vol.45, pp. 71-78.
Ptaszek G., Cawley P., Almond A., Pickering S. (2012).”Transient thermography testing
of unpainted thermal barrier coatings”, Review of Progress in Quantitative
Nondestructive Evaluation, Denver USA, the paper accepted for publication.
Ptaszek G., Cawley P., Almond A., Pickering S. (2012).”Transient thermography testing
of unpainted thermal barrier coatings”, NDE&E International, the paper submitted for
review.