Joe Kaeser, President and CEO Siemens – Vision 2020 · PDF file© Siemens AG 2014....
25
© Siemens AG 2014. All rights reserved. Siemens – Vision 2020 JP Morgan Pan-European Capital Goods CEO Conference June 12, 2014 Joe Kaeser, President and CEO
Transcript of Joe Kaeser, President and CEO Siemens – Vision 2020 · PDF file© Siemens AG 2014....

© Siemens AG 2014. All rights reserved.
Siemens – Vision 2020JP Morgan Pan-European Capital Goods CEO ConferenceJune 12, 2014
Joe Kaeser, President and CEO

© Siemens AG 2014. All rights reserved.
Page 2 London, June 12, 2014 JP Morgan Conference
Safe Harbour Statement
This document contains statements related to our future business and financial performance and future events or developments involving Siemens that mayconstitute forward-looking statements. These statements may be identified by words such as “expect,” “look forward to,” “anticipate,” “intend,” “plan,” “believe,”“seek,” “estimate,” “will,” “project” or words of similar meaning. We may also make forward-looking statements in other reports, in presentations, in materialdelivered to shareholders and in press releases. In addition, our representatives may from time to time make oral forward-looking statements. Such statementsare based on the current expectations and certain assumptions of Siemens’ management, and are, therefore, subject to certain risks and uncertainties. A varietyof factors, many of which are beyond Siemens’ control, affect Siemens’ operations, performance, business strategy and results and could cause the actual results,performance or achievements of Siemens to be materially different from any future results, performance or achievements that may be expressed or implied bysuch forward-looking statements or anticipated on the basis of historical trends. These factors include in particular, but are not limited to, the matters described inItem 3: Key information—Risk factors of our most recent annual report on Form 20-F filed with the SEC, in the chapter C.9.3 Risks of our most recent annualreport prepared in accordance with the German Commercial Code, and in the chapter C.7 Risks and opportunities of our most recent interim report.
Further information about risks and uncertainties affecting Siemens is included throughout our most recent annual and interim reports, as well as our most recentearnings release, which are available on the Siemens website, www.siemens.com, and throughout our most recent annual report on Form 20-F and in our otherfilings with the SEC, which are available on the Siemens website, www.siemens.com, and on the SEC’s website, www.sec.gov. Should one or more of these risksor uncertainties materialize, or should underlying assumptions prove incorrect, actual results, performance or achievements of Siemens may vary materially fromthose described in the relevant forward-looking statement as being expected, anticipated, intended, planned, believed, sought, estimated or projected. Siemensneither intends, nor assumes any obligation, to update or revise these forward-looking statements in light of developments which differ from those anticipated.
Due to rounding, numbers presented throughout this and other documents may not add up precisely to the totals provided and percentages may not preciselyreflect the absolute figures.
All underlying margins are calculated by adjusting margins for the effects reported for the respective businesses in the relevant period. These effects are providedto assist in the analysis of the businesses' results year-over-year and may vary from period to period. Underlying margins are not necessarily indicative of futureperformance. Other companies may calculate similar measures differently.
The financial measures identified in this document are in part transitional figures attained by comparison, classification, appreciation and rounding of historicalfinancial measures; these financial measures and their transitional basis must be regarded as preliminary.

© Siemens AG 2014. All rights reserved.
Page 3 London, June 12, 2014 JP Morgan Conference
Siemens – Vision 2020: Strategic focus
"Siemens – Vision 2020"
2015
Value
2016 2017 2018 2019 2020
Foster ownership culture andleadership based on common values
Drive performancee.g. cost reduction and business excellence
Strengthen coree.g. portfolio along strategic imperatives
Scale upe.g. growth in attractive fields

© Siemens AG 2014. All rights reserved.
Page 4 London, June 12, 2014 JP Morgan Conference
Stringent resource allocation for growth fields inElectrification, Automation and Digitalization
Digitalization
Automation
Electrification
Power tolast
Drive energymanagement
Efficienturban
mobility
ShapeIndustrie
4.0
Grow inProcess
Industries
NextGenerationHealthcare
18%
x% Est. market growth2013-2020 (CAGR)
Offshore
Flexible &Small GT
8%
DistributionGrid
Automation& Software
7%
Road & CityMobility,
tolling
Selected growth fields
6%
'Digital twin'Software
7%
KeyVerticals
e.g.O&G, F&B
6%
Imageguided
Therapy,Molecular
Diagnostics,etc.
8-10%
Business Analytics & Data-driven Services Software & IT solutions 8%

© Siemens AG 2014. All rights reserved.
Page 5 London, June 12, 2014 JP Morgan Conference
Unconventional Oil & Gas opportunities remain veryattractive
Source: Rystad Ucube 2014
Global unconventional O&G supply developmentProduction, in Mbbl/d
Regional capex split for unconventionals,top 5 countries in 2025, USD billion
40
35
30
25
20
15
10
5
02000
+17%
+7%
+3%
+9%
20252020201520102005
Unconventional gasUnconventional liquids
17202
646
99
2011
147
1512
536
78
210
55
6
9.3%
272
51
4.1%
7
1.1%
7
8
88
110
2025
45
257
60
1385
52
2
119
2015
32
118
2013
190
2020
ChinaVenezuela
AustraliaSum Others
United StatesCanada
75%

© Siemens AG 2014. All rights reserved.
Page 6 London, June 12, 2014 JP Morgan Conference
Portfolio completion with key aero-derivative gas turbine technology for growthin the oil & gas industry and in decentralized power supply
Acquisition of Rolls-Royce's Aero Derivative GasTurbine business offers great value
Transaction facts
Transaction scope
Selected Rolls-Royce ADGT business financials(2013)
1) On a cash-and-debt-free basis; 2) Pre integration & transformation cost 3) Transaction rationale details – see slides in appendix
Transaction rationale 3)
• Acquisition of 100% of Rolls-Royce's aero-derivative gasturbine (ADGT) and compressor business includingrelated services business
• Only part of Rolls-Royce's Energy Business
• Purchase price of £785m 1)
• Additional £200m for 25 years exclusive access to futureRolls-Royce aero-technology developments andpreferred access to supply and engineering services
• Ramp up to £50m+ annual gross cost synergies untilFY2017 2) (~2/3 of long-term run-rate gross cost synergies)
• EVA accretive in FY2020• Closing expected by end of December 2014 subject to
regulatory approvals
• Sales: £871m, thereof ~60% service• Installed fleet: ~2,500 ADGT• EBIT: £72m (~8.3% EBIT margin)• Employees: ~2,400
ADGT's are an attractive powersupply option e.g. for offshoreoil & gas and for decentralizedpower generation
Excellent fit – complementary technologies1Strengthens focus area Oil & Gas andDecentralized Power2
Innovation leader with ''best in breed'' gas turbinessupported by access to aero-technology3
World-class global service platform4
Significant synergies and enabling business5

© Siemens AG 2014. All rights reserved.
Page 7 London, June 12, 2014 JP Morgan Conference
Digitalization: From data to business
1) Source internal: Siemens market for vertical IT
Digitalization
Automation
Electrification
Attractive market in Siemens verticals Substantial profit margins achievable
Innovative business models Key enablers
Businessmodelinnovation
• Meter data managementin the cloud
• Data Analytics enrichedplant control
• Siemens remote serviceplatform across divisions
• Cloud strategy
• Data analytics platform
• Applications on top of platforms
• Strong partnerships
100
56
2012 2020
Market (€bn)1
Software&Vertical ITSolutions
IT enhancedServices
Softwareproducts
Combined SW& HW solutions
>30%
>20%
>15%
CAGR+8%

© Siemens AG 2014. All rights reserved.
Page 8 London, June 12, 2014 JP Morgan Conference
Merging the virtual and real worlds End-to-end view of product developmentand production process
Increased efficiency Shortened time-to-market Enhanced flexibility
Digital Factory:Shaping the future of manufacturing with Industrie 4.0
Improving competitivenessthrough
-20%developmenttime
Shenyang:3 modelson 1 line
-40% energy+14% output

© Siemens AG 2014. All rights reserved.
Page 9 London, June 12, 2014 JP Morgan Conference
16.3%14.6%
12.0%
Healthcare with higher entrepreneurial flexibility –separately managed under the Siemens umbrella
Strong position, resilient performance Distinct trends at work
Healthcare with individual set-up to succeed in changing environment
• Focus flexibly on market requirements• Invest in growth opportunities to respond to paradigm shifts in the system• Focus resource allocation to address distinct Healthcare industry characteristics• Going public of Audiology
• Customer & market structures in tran-sition (e.g. value-based reimbursement,convergence of diagnosis & therapy)
• Long-term paradigm shifts:• Potential disruptive technological
changes (e.g. Big data analytics,knowledge based HC, molecular DX)
• Point of Care/Mobile HC
FY 2012
13.6
FY 2011
12.5
3-5% p.a.
FY 2020eFY 2013
13.6
Marginrange
15-19%
Revenuein €bn
Profitexcl. ppa
in % ofrevenue

© Siemens AG 2014. All rights reserved.
Page 10 London, June 12, 2014 JP Morgan Conference
Power GenerationServices
Flat and market driven organization along the valuechain will capture growth opportunities
Div
isio
ns(G
loba
lP&
L)
1) Commonwealth of Independent States
Managing Board
MarketAmericas Global
HealthcareMiddle
East, CIS1)Asia,
AustraliaEurope,Africa
FinancialServices
Powerand Gas
WindPower and
Renewables
MobilityEnergyManage-
ment
BuildingTechno-logies
DigitalFactory
ProcessIndustriesand Drives
Healthcare
Separatelymanaged
Corporate CoreCorporate Services
PG
MOPS
WP
EM BT DF PD HC SFS
Go-
to-m
arke
t

© Siemens AG 2014. All rights reserved.
Page 11 London, June 12, 2014 JP Morgan Conference
One Siemens Financial Frameworksets the aspiration
One SiemensFinancial Framework
Siemens
Capital efficiency(ROCE2))
Capital structure(Industrial net debt/EBITDA)
15-20%
Total cost productivity3)
3-5% p.a.Dividend payout ratio
40-60%4)
up to 1.0x
Profit Margin ranges of businesses (excl. PPA)5)
PG11-15%
WP5-8%
EM7-10%
BT8-11%
MO6-9%
DF14-20%
PD8-12%
HC15-19%
SFS6)
15-20%
Growth:Siemens > most
relevant competitors1)
(Comparable revenue growth)
1) ABB, ALSTOM, GE, Rockwell and Schneider, weighted 2) Based on continuing and discontinued operations 3) Productivity measures divided by functional costs (cost of sales,R&D-, SG&A-expenses) of the group 4) Of net income excluding exceptional non-cash items 5) excl. acquisition related amortization on intangibles6) SFS based on Return on equity after tax
© Siemens AG 2014. All rights reserved.
Page 12 London, June 12, 2014 JP Morgan Conference
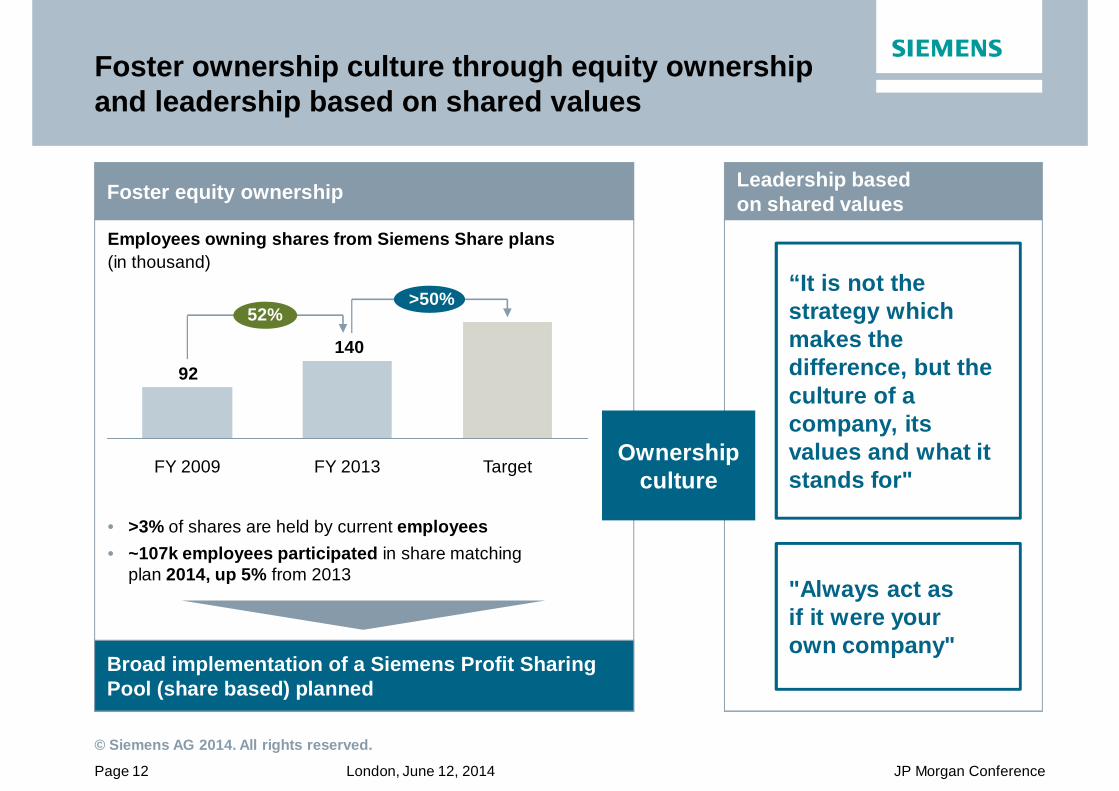
Foster ownership culture through equity ownershipand leadership based on shared values
Foster equity ownership Leadership basedon shared values
"Always act asif it were yourown company"
“It is not thestrategy whichmakes thedifference, but theculture of acompany, itsvalues and what itstands for"
Ownershipculture
• >3% of shares are held by current employees• ~107k employees participated in share matching
plan 2014, up 5% from 2013
Employees owning shares from Siemens Share plans(in thousand)
Broad implementation of a Siemens Profit SharingPool (share based) planned
14092
52%
Target
>50%
FY 2013FY 2009

© Siemens AG 2014. All rights reserved.
Page 13 London, June 12, 2014 JP Morgan Conference
Siemens – Vision 2020Value creation & Cultural change
1. Stringent company governance with effectivesupport functions (cost reduction ~€1bn)
2. 'Underperforming' businesses fixed3. Solid execution of our financial target system
• Capital efficiency: ROCE 15-20%• Growth > most relevant competitors
4. Global and decentralized managementstructures: more than 30% of Division and BUmanagement outside Germany
5. Partner of choice for customers (NPS up ≥20%)6. Employer of choice (Siemens Engagement
Survey: Employee Engagement Index,Leadership and Diversity Index: >75%)
7. Ownership culture: Increase number ofemployee shareholders by at least 50%
Siemens – Vision 2020
Innovating the electrical worldNPS: Net Promoter Score

© Siemens AG 2014. All rights reserved.
Page 14 London, June 12, 2014 JP Morgan Conference
Appendix

© Siemens AG 2014. All rights reserved.
Page 15 London, June 12, 2014 JP Morgan Conference
Increase efficiency1 Shortentime-to-market2 Enhance flexibility3
Increasingcompetitiveness
Digital FactoryShaping the future of manufacturing with Industrie 4.0
Key elements of Industrie 4.0
Production network Cyber-physical systemsIntegration of virtual
and real world

© Siemens AG 2014. All rights reserved.
Page 16 London, June 12, 2014 JP Morgan Conference
In depth analysis of businesseshas led to specific conclusions
Portfolio analysis Conclusions
• Fix underperforming businessesstarting with 'bottom 10' businesses
• Decide along the Strategic Imperatives
• Organic structural realignment
• Strategic partnerships
• Divestment (best owner concept)
• Stringent resource allocation supported byperformance culture and One Siemensframework
5. Paradigm shifts intechnology/markets?
3. Why Siemens?
4. Synergetic value?
2. Potential profit pool?
1. Areas of growth?
'Siemens – Vision 2020'
CumulatedProfit
CumulatedRevenue
Focus

© Siemens AG 2014. All rights reserved.
Page 17 London, June 12, 2014 JP Morgan Conference
Simplification leads to reductionof overhead and support function cost by ~€1bn
Key actionsTarget
• Remove additional layers (Cluster, Sectors)
• Combine certain Divisions and Businesses
• Stringent management governance throughall levels of the organization (Corporate Core)
• Optimization of Corporate Services onhighest possible level
• Full savings to mainly materialize in FY 2016
Functional cost reduction
Target
~€1bn
FY 2014e

© Siemens AG 2014. All rights reserved.
Page 18 London, June 12, 2014 JP Morgan Conference
Q2 FY 2014 – Key figures
Siemens (continuing operations, in €m) Q2 FY 13 Q2 FY 14 Change
Orders 21,235 18,430 -10%1)
Revenue 17,779 17,449 1%1)
Book-to-bill ratio 1.19x 1.06x
Total Sectors profit 1,348 1,566 16%
Net income 1,030 1,153 12%
Basic earnings per share net income (in €) 1.20 1.33 11%
Free cash flow 1,360 1,390 2%
1) Change is adjusted for portfolio and currency translation effects
© Siemens AG 2014. All rights reserved.
Page 19 London, June 12, 2014 JP Morgan Conference
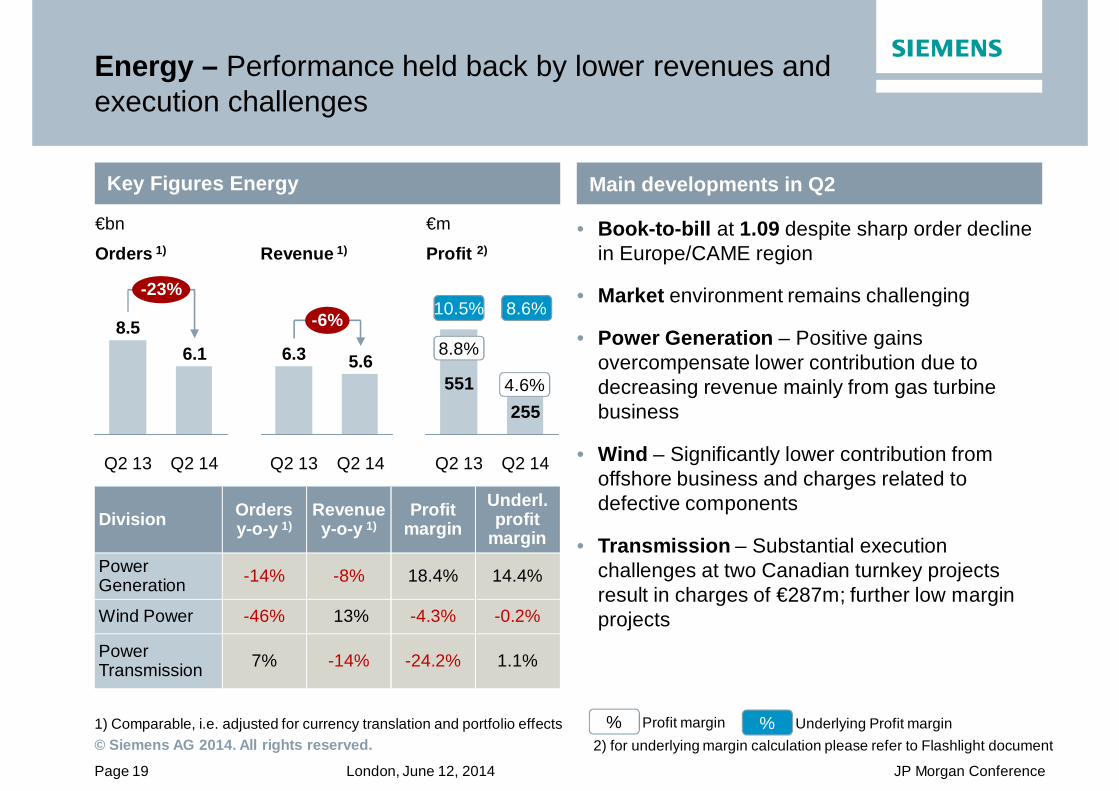
Energy – Performance held back by lower revenues andexecution challenges
Key Figures Energy Main developments in Q2
• Book-to-bill at 1.09 despite sharp order declinein Europe/CAME region
• Market environment remains challenging
• Power Generation – Positive gainsovercompensate lower contribution due todecreasing revenue mainly from gas turbinebusiness
• Wind – Significantly lower contribution fromoffshore business and charges related todefective components
• Transmission – Substantial executionchallenges at two Canadian turnkey projectsresult in charges of €287m; further low marginprojects
1) Comparable, i.e. adjusted for currency translation and portfolio effects
Division Ordersy-o-y 1)
Revenuey-o-y 1)
Profitmargin
Underl.profit
marginPowerGeneration -14% -8% 18.4% 14.4%
Wind Power -46% 13% -4.3% -0.2%
PowerTransmission 7% -14% -24.2% 1.1%
-23%
Q2 14
6.1
Q2 13
8.5 -6%
Q2 14
5.6
Q2 13
6.3
255
Q2 14Q2 13
551 4.6%
€m
Profit 2)
€bn
Orders 1) Revenue 1)
8.6%
2) for underlying margin calculation please refer to Flashlight document% Profit margin % Underlying Profit margin
8.8%
10.5%
© Siemens AG 2014. All rights reserved.
Page 20 London, June 12, 2014 JP Morgan Conference
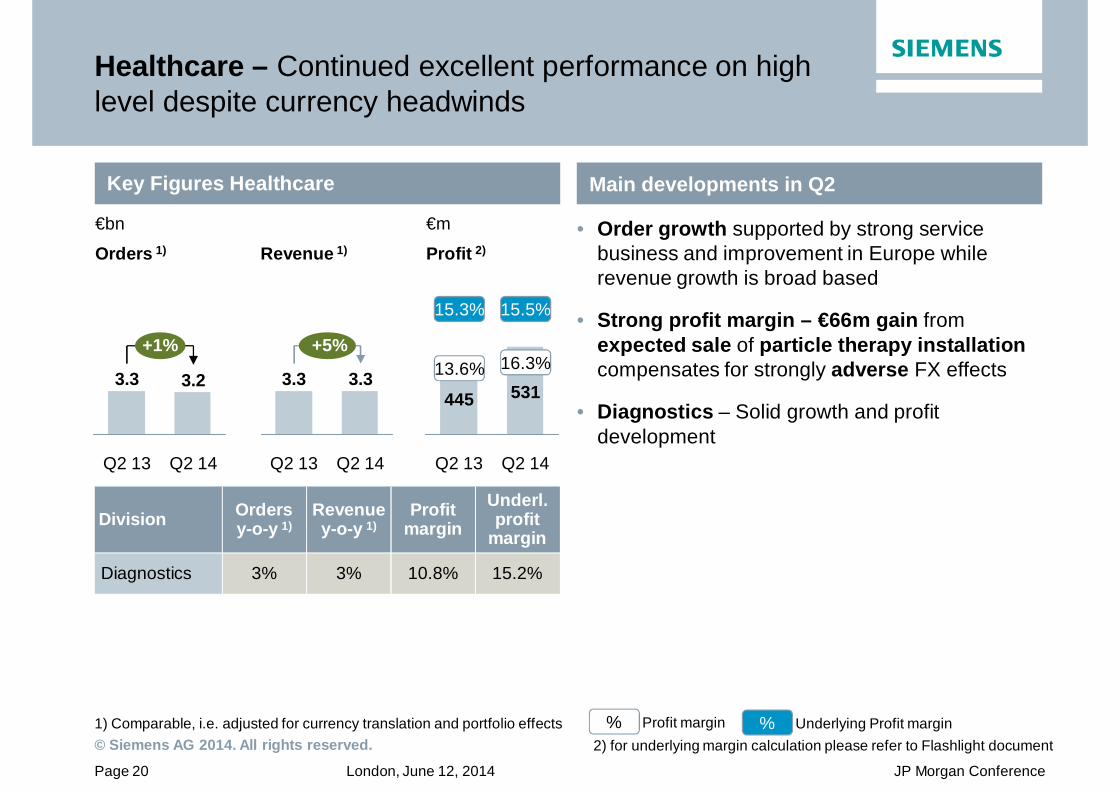
Healthcare – Continued excellent performance on highlevel despite currency headwinds
Key Figures Healthcare Main developments in Q2
• Order growth supported by strong servicebusiness and improvement in Europe whilerevenue growth is broad based
• Strong profit margin – €66m gain fromexpected sale of particle therapy installationcompensates for strongly adverse FX effects
• Diagnostics – Solid growth and profitdevelopment
1) Comparable, i.e. adjusted for currency translation and portfolio effects
Division Ordersy-o-y 1)
Revenuey-o-y 1)
Profitmargin
Underl.profit
margin
Diagnostics 3% 3% 10.8% 15.2%
+1%
Q2 14
3.2
Q2 13
3.3
+5%
Q2 14
3.3
Q2 13
3.3531
Q2 14Q2 13
445
€m
Profit 2)
€bn
Orders 1) Revenue 1)
13.6%
15.3%
16.3%
15.5%
2) for underlying margin calculation please refer to Flashlight document% Profit margin % Underlying Profit margin

© Siemens AG 2014. All rights reserved.
Page 21 London, June 12, 2014 JP Morgan Conference
Industry – Profit climbs as short cycle businessescontinue stabilizing
Key Figures Industry Main developments in Q2
• Short cycle markets show continuingstabilization, with positive order growthparticularly in Germany and China
• Industry Automation – Margin improvementdue to higher capacity utilization
• Drive Technologies – Improved cost positionand volume growth support gross margins
• Metals Technologies burdened by a project inthe US; Joint venture with Mitsubishi-HitachiHeavy Machinery signed
1) Comparable, i.e. adjusted for currency translation and portfolio effects
Division Ordersy-o-y 1)
Revenuey-o-y 1)
Profitmargin
Underl.profit
marginIndustryAutomation 11% 6% 15.8% 18.1%
DriveTechnologies 14% 5% 9.5% 9.9%
+12%
Q2 14
4.8
Q2 13
4.4
+5%
Q2 14
4.4
Q2 13
4.4
Q2 14Q2 13
345 456
€m
Profit 2)
€bn
Orders 1) Revenue 1)
7.9%
10.5%
10.3%
13.2%
2) for underlying margin calculation please refer to Flashlight document% Profit margin % Underlying Profit margin

© Siemens AG 2014. All rights reserved.
Page 22 London, June 12, 2014 JP Morgan Conference
Infrastructure & Cities – Higher profit on improvementsin execution, mix and productivity
Key Figures Infrastructure & Cities Main developments in Q2
• Positive book-to-bill of 1.05 on tough compsdue to major rail orders
• Transportation & Logistics – Improved projectexecution of large rolling stock orders
• Power Grid Solutions & Products – Mainlybenefitting from favourable mix and ‘Siemens2014’ related productivity improvements
• Building Technologies – Continuedimprovement from successful implementationof 'Siemens 2014' measures
1) Comparable, i.e. adjusted for currency translation and portfolio effects
Division Ordersy-o-y 1)
Revenuey-o-y 1)
Profitmargin
Underl.profit
marginTransportation& Logistics -29% 21% 7.0% 8.3%
Power GridSolutions& Products
9% 1% 8.2% 8.2%
BuildingTechnologies -6% -1% 6.9% 6.9%
-12%
Q2 14
4.7
Q2 13
5.2+7%
Q2 14
4.4
Q2 13
4.1
325
Q2 14Q2 13
6
€m
Profit 2)
€bn
Orders 1) Revenue 1)
0.2%
4.7%
7.3%
7.2%
2) for underlying margin calculation please refer to Flashlight document% Profit margin % Underlying Profit margin

© Siemens AG 2014. All rights reserved.
Page 23 London, June 12, 2014 JP Morgan Conference
Lower volume from large orders in Europe whileChina shows strength
Regional business split
Q2 FY 14 Order growth y-o-y1)
Q2 FY 14 Revenue growth y-o-y1)
Asia/Australia(therein China) 19%
9%
Americas(therein USA) -2%
1%
Europe/C.I.S./Africa/ME(therein Germany) -1%
-2%
Asia/Australia(therein China) +22%
+20%
Americas(therein USA) +6%
+10%
Europe/C.I.S./Africa/ME(therein Germany) -38%
-26%
1) Change is adjusted for currency translation and portfolio effects
Purchasing Managers Index
China Industry Value Added
3035404550556065
0100 131211100908070605040302 14
Eurozone Mfg PMIUS ISM Mfg PMIIndex
53.72)
53.3
5
10
15
20
1312111009080706050403020100 14
In %
8.8%
Contracting economy
Expanding economy
(Apr)
(Mar)
2) US as of March; flash reading for EZ in April

© Siemens AG 2014. All rights reserved.
Page 24 London, June 12, 2014 JP Morgan Conference
Outlook Fiscal 2014
• We expect our markets to remainchallenging in Fiscal 2014
• Our short cycle businesses are notanticipating a sustainable recovery untillate in the fiscal year
• We expect orders to exceed revenue,for a book-to-bill ratio above 1
• Assuming that revenue on an organic basisremains level year-over-year, we expectbasic earnings per share (Net Income) forFiscal 2014 to grow by at least 15% from€5.08 in Fiscal 2013
• This outlook is based on shares outstandingof 843 million as of September 30, 2013
• Furthermore it excludes impacts relatedto legal and regulatory matters
In €
Basic earnings per share (Net income)
FY 2014eFY 2013
5.08
FY 2011 FY 2012
4.74
6.55
At least 15%growth

© Siemens AG 2014. All rights reserved.
Page 25 London, June 12, 2014 JP Morgan Conference
Reconciliation and Definitions forNon-GAAP Measures
This document includes supplemental financial measures that are or may be non-GAAP financial measures.Orders and order backlog; adjusted or organic growth rates of revenue and orders; book-to-bill ratio; Total Sectors profit; return on equity (after tax), or ROE (aftertax); return on capital employed (adjusted), or ROCE (adjusted); Free cash flow, or FCF; adjusted EBITDA; adjusted EBIT; adjusted EBITDA margins, earningseffects from purchase price allocation, or PPA effects; net debt and adjusted industrial net debt are or may be such non-GAAP financial measures.These supplemental financial measures should not be viewed in isolation or as alternatives to measures of Siemens’ net assets and financial positions or results ofoperations as presented in accordance with IFRS in its Consolidated Financial Statements. Other companies that report or describe similarly titled financialmeasures may calculate them differently.Definitions of these supplemental financial measures, a discussion of the most directly comparable IFRS financial measures, information regarding the usefulnessof Siemens’ supplemental financial measures, the limitations associated with these measures and reconciliations to the most comparable IFRS financial measuresare available on Siemens’ Investor Relations website at www.siemens.com/nonGAAP. For additional information, see supplemental financial measures and therelated discussion in Siemens’ most recent annual report on Form 20-F, which can be found on our Investor Relations website or via the EDGAR system on thewebsite of the United States Securities and Exchange Commission.
Revenue growth - Performance against competition (Fiscal 2014)To illustrate management’s perspective on the Company’s performance against competition, Siemens compares its own revenue growth rate with the weightedaverage revenue growth rate of its Sectors’ most relevant competitors, including, among others, ABB, GE, Philips, Rockwell and Schneider. Revenue growth forSiemens and its competitors is calculated as the actual growth rate over a rolling four quarter period compared to the same period a year earlier. Siemenscompetitors revenue growth is derived as the weighted average growth rate of dedicated competitor baskets defined for each Siemens Sector. Each Sectorbasket's growth rate is based upon the most recent reported competitor revenues publicly available at the time of calculation. The Sector competitor basketsrevenue growth rates are weighted by the revenue of the respective Siemens Sector.This measure may provide useful information to investors with respect to management’s view on Siemens’ growth compared to competitor growth. However, wecaution investors, that this measure is subject to certain limitations, which include the following: The metric is defined by Siemens and, as such, is not based on agenerally accepted framework that is also relevant for other companies; accordingly, other companies may define a similarly titled measure differently. Incalculating this measure, Siemens relies on data published by its competitors for which Siemens assumes no responsibility. In addition, the data may not bedirectly comparable as a result of differing presentation currencies and reporting standards being used by our competitors in the data’s presentation. Furthermore,subject to limited exceptions, no adjustments are made for currency translation effects, portfolio changes and changes in reporting structure for either the Siemensor the competitor data. Because the public availability of relevant competitors’ data at the time of calculation may not coincide with the availability of Siemens’ data,some competitor data used may relate to a different time period than the Siemens data.