Job Vacancy and Hiring Survey Report 2013 Fall
73
Firm size Industries Occupations Areas Education 2013 JOB VACANCY AND HIRING SURVEY REPORT Fall Labor Market and Performance Analysis June 2014
description
Job vacancy report
Transcript of Job Vacancy and Hiring Survey Report 2013 Fall

Firm size
Industries
Occupations
Areas
Education
2013 JOB VACANCY AND HIRING SURVEY REPORTFall
Labor Market and Performance Analysis
June 2014
For more information, call the Employment Security Department Labor Market Information Center at 800-215-1617.
The Employment Security Department is an equal-opportunity employer and provider of programs and services. Auxiliary aids and services are available upon request to people with disabilities. Washington Relay Service: 711
LM-14-0394
Washington State Employment Security Department,Dale Peinecke, commissioner
Labor Market and Performance AnalysisCynthia Forland, director
Report prepared by Jami Mills, economistStatistical estimates by Alexander Roubinchtein, economistsSurvey and data collection supervised by Baba Moussa, economist
2013 Fall Job Vacancy and Hiring Survey Report
Published June 2014
“Healthcare” Photo by ©michaeljung/CanstockPhoto“Grocery Store” Photo by ©Leaf/CanstockPhoto“Lab Work” Photo by ©DarrenBaker/CanstockPhoto“Pruning Trees” Photo by © JackF/CanstockPhoto
About the job vacancy and hiring survey ............................................................ 3
Executive summary ............................................................................................... 5 Fall 2013 job-vacancy results ................................................................................................ 5 Fall 2013 hiring results .......................................................................................................... 7 Fall 2013 expected-future-vacancy results ........................................................................... 8 Fall2013relativeprobabilityoffillingjobvacancies(hazardratios) ................................. 9
Fall 2013 job-vacancy survey results .................................................................... 11
Fall 2013 hiring results .......................................................................................... 29
Fall 2013 expected future vacancies .................................................................... 43
Hazardratios:therelativelikelihoodofjobvacanciesandhiresbeingfilled in a given period of time ...................................................................................... 53
Appendices ............................................................................................................ 59
Contents
Fall 2013 Job Vacancy and Hiring Survey Report

Fall 2013 Job Vacancy and Hiring Survey Report
June 2014Page 3
Fall 2013 Job Vacancy and Hiring Survey ReportEmployment Security Department
About the job vacancy and hiring survey Each spring and fall, the Employment Security Department surveys Washington employers. In fall 2013, employers were surveyed to collect information within three components:
1. Job vacancies.2. Recent hires. 3. Expected future vacancies.1
Arecenthirewasdefinedasanynewexternalhire–aworkerhiredfromoutsidethefirm.Thisdefinitionexcludesinternalpromotions,includingthosepromotionstoanewlycreatedpositionwithinthefirm.
Thesamescientificsamplewasusedforallthreecomponentsofthe survey. This sample was drawn from the universe of employers covered by the unemployment-insurance system, after removing from the population the public-administration industry sector and private households. All estimates based on the survey and all references to total covered employment throughout this report refer to this universe.
The job-vacancy component asked employers whether they were currentlyrecruitingforanyvacanciesattheirlocation–usingtheircurrent Washington business address. The information collected revealed a snapshot-in-time of Washington’s job-vacancy situation. We learned about the estimated number of vacant positions by occupation and industry sector, the characteristics of those vacant positions and the workforce needs of employers. In the job-vacancy component, we collected the following information:
• Jobtitleofeachopening.• Numberofcurrentopenings.• Numberofcurrentopeningsthatwerenewlycreated.• Howlongthepositionshadbeenopen.• Full-timeorpart-timestatusofeachopening.• Educationlevelrequiredforeachopening.• Permanentorseasonalstatusofeachopening.• Licenseorcertificationrequirementofeachopening.• Previousexperiencerequiredforeachopening.
The hiring component asked employers whether they made any new external hires from July 1 through September 30, 2013, the third quarter of the year.
1The spring 2013 survey was the first to ask about expected future vacancies.
June 2014Page 4
Fall 2013 Job Vacancy and Hiring Survey ReportEmployment Security Department
In the hiring component, we collected the following information:
• Jobtitleofeachhire.• Numberofpositionsfilled.• Numberofpositionsfilledthatwerenewlycreated.• Howlongthepositionswereopen.• Startinghourlywagespaid.
The component about expected future vacancies asked for an estimate of expected openings 12 months in the future, plus an estimate of the newly created positions among those future vacancies.
The results were estimated separately for vacancies, hiring and expected future vacancies. These three sets of estimates should notbedirectlycompared,sincethefirmsreportinginformationwithin each component were different. See Appendix 7 to view the complete survey form.2
Publication standardsFor an estimate to be publishable, it had to pass three criteria:
• Thenumber of respondents in any given cell had to be at least four.
• Thecoefficientofvariationhadtobelessthan50percent.• Thelowerlimitofthe95percentconfidenceintervalhadto
begreaterthanzero.
In a small number of cases, estimates known to be substantively significantareincludedinthereportdespitefailingtomeetallofthesecriteria.Theseestimatesareclearlyidentifiedinthetextand tables. They are included because they are known to provide essential information on some of the state’s largest occupational and industrial groups.
Changes to the surveyThe Employment Security Department has conducted the job-vacancy survey since 2003. Beginning in 2012, hiring data were published for thefirsttime.Withthespring2013survey,questionsaboutexpectedfuture vacancies were added.
Prior to the 2012 reports, data were broken out by the 12 workforce developmentareas(WDAs).Beginningin2012,resultsweredisplayed by four types of geographic areas in the state: west urban, west rural, east urban and east rural. Appendix 1identifiesthecounties that make up these four areas.
2Although the three components are conducted as one study, the results are estimated separately for vacancies, hiring and expected future vacancies. These three components should not be directly compared, since the firms reporting information within each component are different.

June 2014Page 5
Fall 2013 Job Vacancy and Hiring Survey ReportEmployment Security Department
Executive summaryThis report presents the results of the 2013 fall job vacancy and hiring survey, which collected data by surveying 12,000 Washington employers in October through December 2013.
Estimatedjobvacanciesincreasedby23.0percent(from70,434infall2012to86,636infall2013).Estimatedhiringrosenearly10percentfrom190,182 in 2012 to an estimated 209,092 in 2013.
The fall surveys asked employers how many vacancies they expected to have 12 months in the future. Employers expected to have 154,547 vacancies during fall 2014, almost double the 86,636 vacancies they reported for fall 2013.
Fall 2013 job-vacancy resultsJob vacancies by areaEmployers reported an estimated 86,636 vacancies statewide, representing an estimated 3.2 percent of employment covered by unemployment insurance.3 Regionally, employers in the west urban area of the state reported an estimated 46,241 vacancies, accounting for more than half of the state’s vacancies. There were 17,541 vacancies in the east urban area and 5,502 vacancies in the west rural area. The total estimated vacancies for the east rural area were excluded because publicationstandardswerenotmet(Appendix 4). Top three occupationsThe three occupations with the most vacancies were:
• Farmworkersandlaborers,crop,nurseryandgreenhouse(13,037vacancies,comprising15.0percentoftotalvacancies).
• Retailsalespersons(4,482vacancies,comprising5.2percentoftotalvacancies).
• Officeclerks,general(2,046vacancies,comprising2.4percentoftotalvacancies).
Top three industry sectorsAlthough covered employment could not be estimated for occupations, this comparison could be made for industries. The three industry sectors with the most vacancies were:
• Agriculture,forestry,fishingandhunting(13,434vacancies,comprisinganestimated14.5percentofcoveredemployment).
• Educationalservices(11,620vacancies,comprisinganestimated2.5percentofcoveredemployment).
• Healthcareandsocialassistance(11,375vacancies,comprisinganestimated3.0percentoftotalcoveredemployment).
3Shares were estimated based on survey design. For more detail, see Appendix 5.
June 2014Page 6
Fall 2013 Job Vacancy and Hiring Survey ReportEmployment Security Department
Vacancy durationStatewide, job vacancies had been open for an average of 100.2 days. The longest average duration, 191.9 days, was in the east urban area.
Vacancies in newly created positionsNewlycreatedpositionsmadeup18.4percentofestimatedvacanciesstatewide. This compares to 25.2 percent of estimated vacancies in the fall 2012 survey.
Vacancies by firm employment sizeThelargestfirms,thoseemploying500ormoreworkers,hadthehighestnumberofvacanciesstatewide(25,628vacancies,29.6percentofallvacancies).
Educational requirementsMore than two-thirds of all vacancies required either no educational requirement or only a high school education.
License or certification requirementsStatewide, 29.0 percent of the vacancies required some form of license orcertification.
Experience requirementsStatewide, 56.4 percent of vacancies required some experience.
Vacancies for STEM occupationsThe increasingly competitive global market has increased the demand for workers in science, technology, engineering and mathematics (STEM)occupations.
“In the 21st century, scientific and technological innovationshave become increasingly important as we face the benefitsand challenges of both globalization and a knowledge-basedeconomy. To succeed in this new information-based and highly technological society, students need to develop their capabilities in STEM to levels much beyond what was considered acceptable in the past.”4
ThefederalDepartmentofLabor’sOccupationalInformationNetwork(O*NET)hasdesignatedcertainoccupationsasSTEMoccupations.The three STEM occupations with the most vacancies were:
• Mathematicalscienceteachers,postsecondary(1,882vacancies,comprising2.17percentoftotalvacancies).
• Computerscienceteachers,postsecondary(1,862vacancies,comprising2.15percentoftotalvacancies).
• Automotiveservicetechniciansandmechanics(806vacancies,comprising0.93percentoftotalvacancies).
4National Science Foundation. www.nsf.gov/nsb/documents/2007/stem_action.pdf
June 2014Page 7
Fall 2013 Job Vacancy and Hiring Survey ReportEmployment Security Department
Fall 2013 hiring resultsStatewide, there were an estimated 209,092 hires from July 1, 2013, through September 30, 2013 that made up 7.8 percent of covered employment at that time.
Hires by areaThe urban areas of the state accounted for 81.7 percent of all hires –aboutfiveoutofsix.Thelargestsharewasinthewesturbanarea,122,258, or 58.5 percent. Hires paid $13.69 average hourly wageIn fall 2013, the average estimated hourly wage for hires was $13.69 statewide, up slightly from the $13.48 average wage reported a year earlier. The average ranged from $14.81 in the west urban area of the state to $11.62 in the east urban area. Top three occupationsThe three occupations with the most hires were:
• Farmworkersandlaborers,crop,nurseryandgreenhouse(26,685,comprising12.8percentoftotalhires).
• Retailsalespersons(15,152,comprising7.2percentof totalhires).
• Cashiers(7,833,comprising3.7percentoftotalhires).
Top three industry sectorsAlthough total covered employment could not be estimated for occupations, this comparison could be made for industries. The three industry sectors with the most hires were:
• Retailtrade(31,335hires,comprising10.1percentof coveredemployment).
• Agriculture,forestry,fishingandhunting(28,681hires,comprising31.0percentofcoveredemployment).
• Healthcareandsocialassistance(22,432hires,comprising6.0percentofcoveredemployment).
66-day average to hireOn average, positions were open statewide for slightly more than twomonths(65.8days).Thatwaslongerthaninfall2012(about19days)andspring2013(16.2days)butcomparabletothe42-dayaveragereportedbyHelpWantedOnline(HWOL).TheHWOLprogram provides data on online-advertised job demand.5
Industry sectors with the longest time to hire were:
• Agriculture,forestry,fishingandhunting(111.2days).• Professional,scientificandtechnicalservices(92.7days).• Transportationandwarehousing(86.7days).
5www.conference-board.org/data/helpwantedonline.cfm
June 2014Page 8
Fall 2013 Job Vacancy and Hiring Survey ReportEmployment Security Department
Hiring times by firm employment size• Firmsemployingfewerthan10workersexperiencedthe
shortesttimetohire(40.0days).• Firmsemploying100through499workersexperiencedthe
longesttimetohire(89.3days).
Fall 2013 expected-future-vacancy resultsWhen asked about expected future vacancies, employers across the state reported that an estimated 154,547 jobs were expected for fall 2014. By way of context, employers reported currently having an estimated 86,636 vacancies.
Expected future vacancies by area for fall 2014Future vacancies varied by region:
• At55.0percent,thewesturbanareahadthemostexpectedfuture vacancies.
• At5.5percent,thewestruralareahadtheleastexpectedfuture vacancies.
Expected future vacancies by occupation for fall 2014In terms of expected future vacancies, the top three occupations were:
• Farmworkersandlaborers,crop,nurseryandgreenhouse(38,163,comprising24.7percentoftotalexpected futurevacancies).
• Retailsalespersons(12,700,comprising8.2percentoftotalexpectedfuturevacancies).
• Customerservicerepresentatives(4,398,comprising2.8percentoftotalexpectedfuturevacancies).
Expected future vacancies by industry sector for fall 2014In terms of expected future vacancies, the top three industry sectors were:
• Agriculture,forestry,fishingandhunting(39,745,comprising25.7percentoftotalexpectedfuturevacancies).
• Retailtrade(19,174,comprising12.4percentoftotalexpectedfuturevacancies).
• Healthcareandsocialassistance(17,425,comprising11.3percentoftotalexpectedfuturevacancies).
Expected future vacancies in newly created positionsNewjobsvariedbyarea:
• Intheeasturbanarea,40.4percentofexpectedfuturevacancies were expected to be newly created positions.
• Intheeastruralarea,10.9percentofexpectedfuturevacancies were expected to be newly created positions.
June 2014Page 9
Fall 2013 Job Vacancy and Hiring Survey ReportEmployment Security Department
Fall 2013 relative probability of filling job vacancies (hazard ratios)Hazardratioswereusedtocomparetherelativelikelihoodoffillingajobvacancybyvariouscharacteristics(e.g.,typesofgeographicareas,occupation,industry,firmsize).Baseduponboththevacancyandhiringcomponentsofthesurvey,thehazardratioshowshowrelativelyeasyitwas,intermsofagiventimeperiod,tofillagivenposition.
AreasTheeastruralareahadthelowestrelativeprobabilityoffillingitsjobvacancies within a given time period. In contrast, the west urban area hadthehighestrelativeprobabilityoffillingitsjobvacancies.
OccupationsLegaloccupationvacancieshadthehighestprobabilityofbeingfilled,while education, training and library occupations had the lowest probabilityofbeingfilled.
Industry sectorsThe wholesale-trade industry sector had the highest probability offillingitsjobvacancieswithinagiventimeperiod.Firmsintheeducational-services industry sector had the lowest probability of fillingvacanciesinagiventime.

June 2014Page 10
Fall 2013 Job Vacancy and Hiring Survey ReportEmployment Security Department
June 2014Page 11
Fall 2013 Job Vacancy and Hiring Survey ReportEmployment Security Department
Fall 2013 job-vacancy survey resultsThe job-vacancy component asked Washington state employers whether they were currently recruiting for any vacancies at their location. The information collected revealed a snapshot-in-time of Washington employment conditions. We learned the estimated number of vacant positions, the characteristics of those vacant positions, the workforce needs of employers and vacancy trends by industry sector and occupation.
Of the 12,000 employers in the survey sample, 5,789 employers provided usable responses to the job-vacancy component, for a response rate of 48.2 percent. Estimates were produced with 95 percentconfidenceintervals.Thismeasureofstatisticalreliabilitywas used for determining whether the data met Employment SecurityDepartment(ESD)publishingstandards.(Seedescriptionofpublishing standards in Appendix 4).
Vacancies by areasAn estimated 86,636 positions were vacant statewide. These vacancies represented 3.2 percent of employment covered by the unemployment-insurance program.6 Statewide, the area with the largest estimated share of vacancies as a percent of total covered employment was east urban, at a 3.7 percent share. The west urban area registered a 2.7 percent share; followed by west rural, with a 2.5 percent vacancy share. The east rural area was excluded because publication standards werenotmet(Appendix 4).
6All public administration sectors and the private households sector have been removed from the initial population. All estimates based on the survey and all references to total covered employment throughout this report refer to this adjusted universe.
June 2014Page 12
Fall 2013 Job Vacancy and Hiring Survey ReportEmployment Security Department
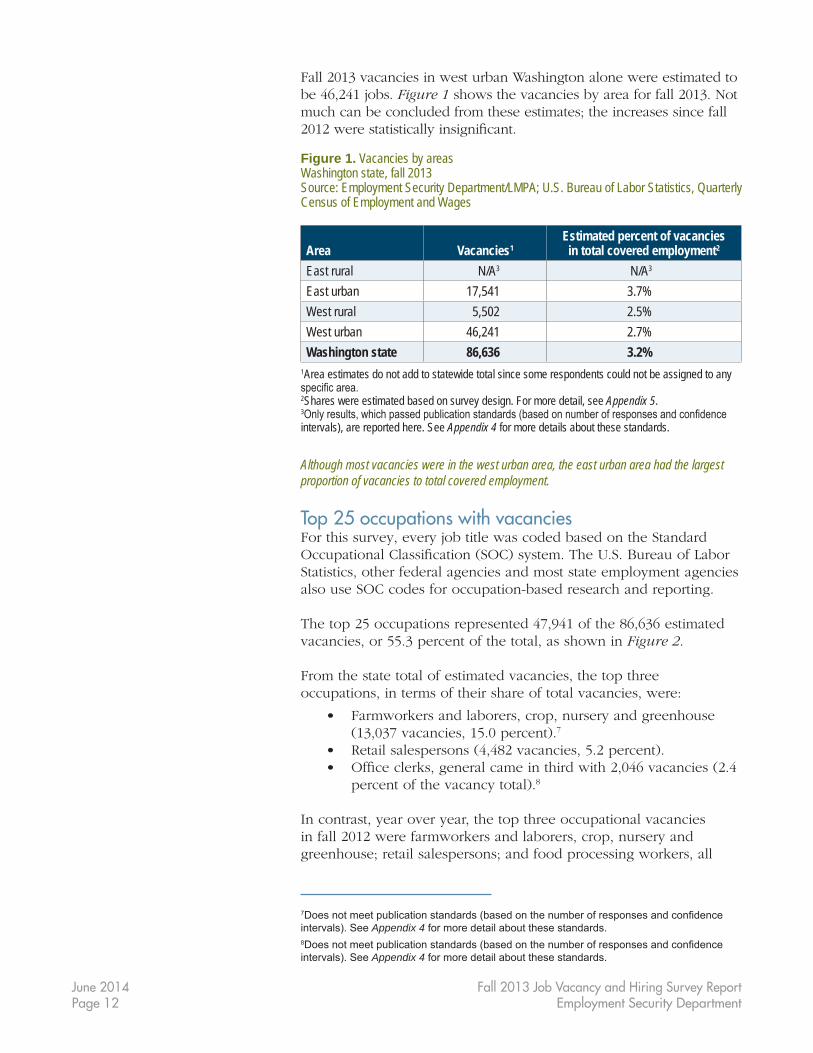
Fall 2013 vacancies in west urban Washington alone were estimated to be 46,241 jobs. Figure 1showsthevacanciesbyareaforfall2013.Notmuch can be concluded from these estimates; the increases since fall 2012werestatisticallyinsignificant.
Figure 1. Vacancies by areas Washington state, fall 2013 Source: Employment Security Department/LMPA; U.S. Bureau of Labor Statistics, Quarterly Census of Employment and Wages
Area Vacancies1Estimated percent of vacanciesin total covered employment2
East rural N/A3 N/A3
East urban 17,541 3.7%West rural 5,502 2.5%West urban 46,241 2.7%Washington state 86,636 3.2%
1Area estimates do not add to statewide total since some respondents could not be assigned to any specific area. 2Shares were estimated based on survey design. For more detail, see Appendix 5.3Only results, which passed publication standards (based on number of responses and confidence intervals), are reported here. See Appendix 4 for more details about these standards.
Although most vacancies were in the west urban area, the east urban area had the largest proportion of vacancies to total covered employment.
Top 25 occupations with vacanciesFor this survey, every job title was coded based on the Standard OccupationalClassification(SOC)system.TheU.S.BureauofLaborStatistics, other federal agencies and most state employment agencies also use SOC codes for occupation-based research and reporting.
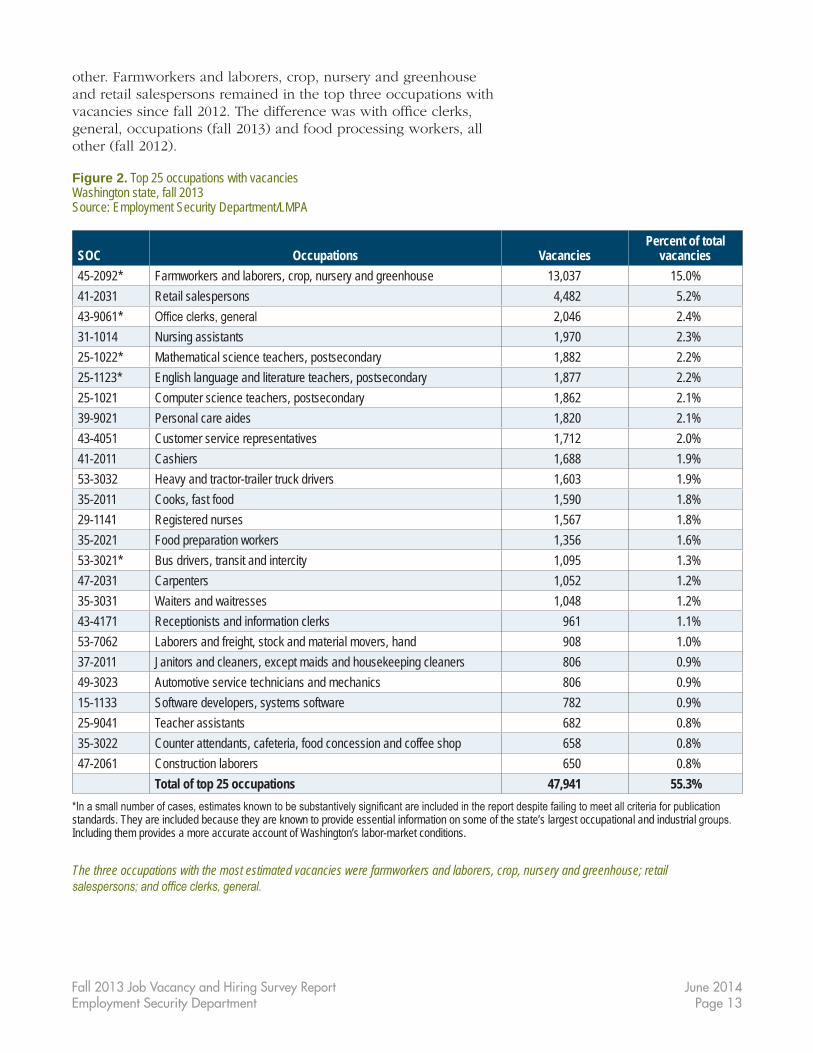
The top 25 occupations represented 47,941 of the 86,636 estimated vacancies, or 55.3 percent of the total, as shown in Figure 2.
From the state total of estimated vacancies, the top three occupations, in terms of their share of total vacancies, were:
• Farmworkersandlaborers,crop,nurseryandgreenhouse(13,037vacancies,15.0percent).7
• Retailsalespersons(4,482vacancies,5.2percent).• Officeclerks,generalcameinthirdwith2,046vacancies(2.4
percentofthevacancytotal).8
In contrast, year over year, the top three occupational vacancies in fall 2012 were farmworkers and laborers, crop, nursery and greenhouse; retail salespersons; and food processing workers, all
7Does not meet publication standards (based on the number of responses and confidence intervals). See Appendix 4 for more detail about these standards. 8Does not meet publication standards (based on the number of responses and confidence intervals). See Appendix 4 for more detail about these standards.
June 2014Page 13
Fall 2013 Job Vacancy and Hiring Survey ReportEmployment Security Department
other. Farmworkers and laborers, crop, nursery and greenhouse and retail salespersons remained in the top three occupations with vacanciessincefall2012.Thedifferencewaswithofficeclerks,general,occupations(fall2013)andfoodprocessingworkers,allother(fall2012).
Figure 2. Top 25 occupations with vacancies Washington state, fall 2013Source: Employment Security Department/LMPA
SOC Occupations VacanciesPercent of total
vacancies45-2092* Farmworkers and laborers, crop, nursery and greenhouse 13,037 15.0%41-2031 Retail salespersons 4,482 5.2%43-9061* Office clerks, general 2,046 2.4%31-1014 Nursing assistants 1,970 2.3%25-1022* Mathematical science teachers, postsecondary 1,882 2.2%25-1123* English language and literature teachers, postsecondary 1,877 2.2%25-1021 Computer science teachers, postsecondary 1,862 2.1%39-9021 Personal care aides 1,820 2.1%43-4051 Customer service representatives 1,712 2.0%41-2011 Cashiers 1,688 1.9%53-3032 Heavy and tractor-trailer truck drivers 1,603 1.9%35-2011 Cooks, fast food 1,590 1.8%29-1141 Registered nurses 1,567 1.8%35-2021 Food preparation workers 1,356 1.6%53-3021* Bus drivers, transit and intercity 1,095 1.3%47-2031 Carpenters 1,052 1.2%35-3031 Waiters and waitresses 1,048 1.2%43-4171 Receptionists and information clerks 961 1.1%53-7062 Laborers and freight, stock and material movers, hand 908 1.0%37-2011 Janitors and cleaners, except maids and housekeeping cleaners 806 0.9%49-3023 Automotive service technicians and mechanics 806 0.9%15-1133 Software developers, systems software 782 0.9%25-9041 Teacher assistants 682 0.8%35-3022 Counter attendants, cafeteria, food concession and coffee shop 658 0.8%47-2061 Construction laborers 650 0.8% Total of top 25 occupations 47,941 55.3%
*In a small number of cases, estimates known to be substantively significant are included in the report despite failing to meet all criteria for publication standards. They are included because they are known to provide essential information on some of the state’s largest occupational and industrial groups.Including them provides a more accurate account of Washington’s labor-market conditions.
The three occupations with the most estimated vacancies were farmworkers and laborers, crop, nursery and greenhouse; retail salespersons; and office clerks, general.
June 2014Page 14
Fall 2013 Job Vacancy and Hiring Survey ReportEmployment Security Department
Vacancies by industry sectorsEmployerswereclassifiedintoindustriesbasedontheNorthAmericanIndustryClassificationSystem(NAICS).TheU.S.BureauofLabor Statistics, other federal agencies and most state employment agenciesuseNAICSforindustry-basedresearchandreporting.
Although total covered employment could not be estimated for occupations, this comparison could be made for industries. The top three industry sectors for vacancies, in terms of the number of vacancies, were:
• Agriculture,forestry,fishingandhunting(13,434 vacancies, comprising an estimated 14.5 percent of total coveredemployment).
• Educationalservices(11,620vacancies,comprisinganestimated2.5percentoftotalcoveredemployment).
• Healthcareandsocialassistance(11,375vacancies,comprising an estimated 3.0 percent of total coveredemployment).
Last fall, the top three industry sectors for vacancies were: healthcare andsocialassistance;agriculture,forestry,fishingandhunting;andmanufacturing. Only one sector was different this year, education services(fall2013)ratherthanmanufacturing(fall2012).
June 2014Page 15
Fall 2013 Job Vacancy and Hiring Survey ReportEmployment Security Department
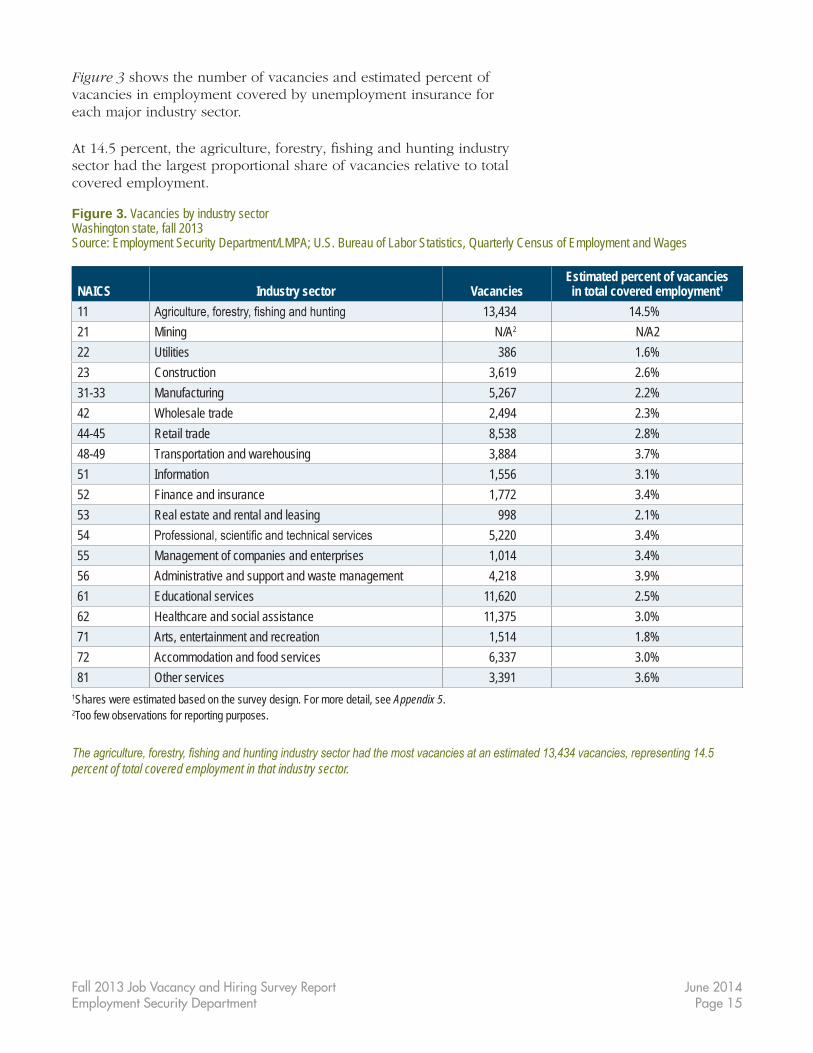
Figure 3 shows the number of vacancies and estimated percent of vacancies in employment covered by unemployment insurance for each major industry sector.
At14.5percent,theagriculture,forestry,fishingandhuntingindustrysector had the largest proportional share of vacancies relative to total covered employment.
Figure 3. Vacancies by industry sectorWashington state, fall 2013 Source: Employment Security Department/LMPA; U.S. Bureau of Labor Statistics, Quarterly Census of Employment and Wages
NAICS Industry sector VacanciesEstimated percent of vacancies in total covered employment1
11 Agriculture, forestry, fishing and hunting 13,434 14.5%21 Mining N/A2 N/A222 Utilities 386 1.6%23 Construction 3,619 2.6%31-33 Manufacturing 5,267 2.2%42 Wholesale trade 2,494 2.3%44-45 Retail trade 8,538 2.8%48-49 Transportation and warehousing 3,884 3.7%51 Information 1,556 3.1%52 Finance and insurance 1,772 3.4%53 Real estate and rental and leasing 998 2.1%54 Professional, scientific and technical services 5,220 3.4%55 Management of companies and enterprises 1,014 3.4%56 Administrative and support and waste management 4,218 3.9%61 Educational services 11,620 2.5%62 Healthcare and social assistance 11,375 3.0%71 Arts, entertainment and recreation 1,514 1.8%72 Accommodation and food services 6,337 3.0%81 Other services 3,391 3.6%
1Shares were estimated based on the survey design. For more detail, see Appendix 5.2Too few observations for reporting purposes.
The agriculture, forestry, fishing and hunting industry sector had the most vacancies at an estimated 13,434 vacancies, representing 14.5 percent of total covered employment in that industry sector.
June 2014Page 16
Fall 2013 Job Vacancy and Hiring Survey ReportEmployment Security Department
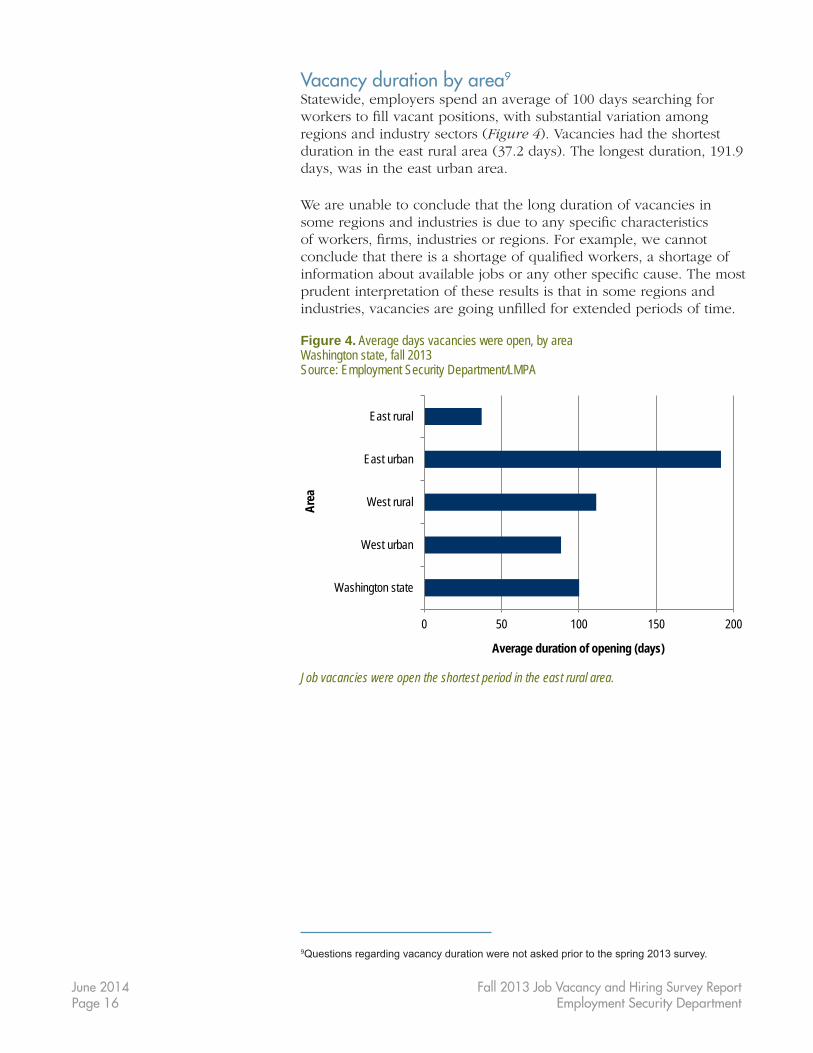
Vacancy duration by area9
Statewide, employers spend an average of 100 days searching for workerstofillvacantpositions,withsubstantialvariationamongregionsandindustrysectors(Figure 4).Vacancieshadtheshortestdurationintheeastruralarea(37.2days).Thelongestduration,191.9days, was in the east urban area.
We are unable to conclude that the long duration of vacancies in someregionsandindustriesisduetoanyspecificcharacteristicsofworkers,firms,industriesorregions.Forexample,wecannotconcludethatthereisashortageofqualifiedworkers,ashortageofinformationaboutavailablejobsoranyotherspecificcause.Themostprudent interpretation of these results is that in some regions and industries,vacanciesaregoingunfilledforextendedperiodsoftime.
Figure 4. Average days vacancies were open, by areaWashington state, fall 2013Source: Employment Security Department/LMPA
0 50 100 150 200
Washington state
West urban
West rural
East urban
East rural
Average duration of opening (days)
Area
Job vacancies were open the shortest period in the east rural area.
9Questions regarding vacancy duration were not asked prior to the spring 2013 survey.
June 2014Page 17
Fall 2013 Job Vacancy and Hiring Survey ReportEmployment Security Department
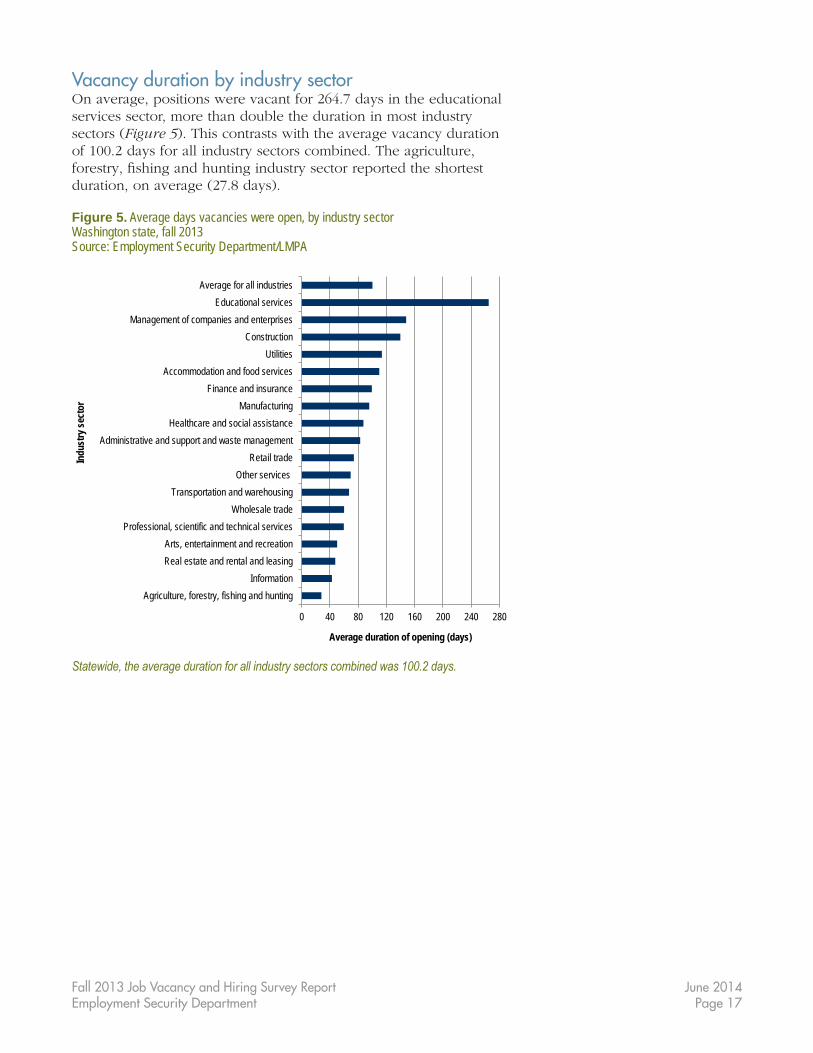
Vacancy duration by industry sectorOn average, positions were vacant for 264.7 days in the educational services sector, more than double the duration in most industry sectors(Figure 5).Thiscontrastswiththeaveragevacancydurationof 100.2 days for all industry sectors combined. The agriculture, forestry,fishingandhuntingindustrysectorreportedtheshortestduration,onaverage(27.8days).
Figure 5. Average days vacancies were open, by industry sectorWashington state, fall 2013Source: Employment Security Department/LMPA
0 40 80 120 160 200 240 280
Agriculture, forestry, fishing and huntingInformation
Real estate and rental and leasingArts, entertainment and recreation
Professional, scientific and technical servicesWholesale trade
Transportation and warehousingOther services
Retail tradeAdministrative and support and waste management
Healthcare and social assistanceManufacturing
Finance and insuranceAccommodation and food services
UtilitiesConstruction
Management of companies and enterprisesEducational services
Average for all industries
Average duration of opening (days)
Indu
stry
sect
or
Statewide, the average duration for all industry sectors combined was 100.2 days.
June 2014Page 18
Fall 2013 Job Vacancy and Hiring Survey ReportEmployment Security Department
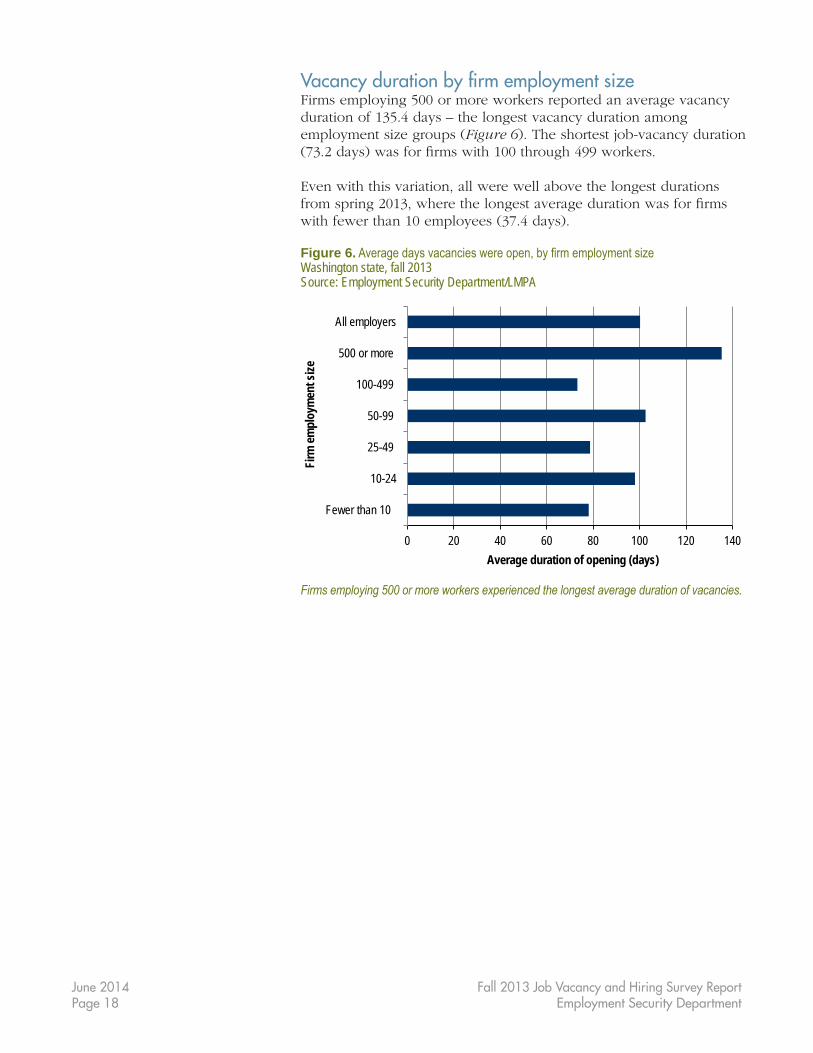
Vacancy duration by firm employment sizeFirms employing 500 or more workers reported an average vacancy durationof135.4days–thelongestvacancydurationamongemploymentsizegroups(Figure 6).Theshortestjob-vacancyduration(73.2days)wasforfirmswith100through499workers.
Even with this variation, all were well above the longest durations fromspring2013,wherethelongestaveragedurationwasforfirmswithfewerthan10employees(37.4days).
Figure 6. Average days vacancies were open, by firm employment sizeWashington state, fall 2013Source: Employment Security Department/LMPA
0 20 40 60 80 100 120 140
Fewer than 10
10-24
25-49
50-99
100-499
500 or more
All employers
Average duration of opening (days)
Firm
empl
oym
ent s
ize
Firms employing 500 or more workers experienced the longest average duration of vacancies.

June 2014Page 19
Fall 2013 Job Vacancy and Hiring Survey ReportEmployment Security Department
Nearly 1 in 5 vacancies were newly created positionsFor each reported vacancy, the survey asked employers how many of those openings were newly created positions. A newly createdpositionisdefinedinthesurveyasapositionthatwasneverpreviouslyfilled.Ingeneral,estimationsofthenewlycreatedpositions show employment growth.
Newlycreatedpositionsmadeup18.4percentofestimatedvacanciesstatewide. This compares to 25.2 percent estimated new vacancies in the fall 2012 survey. At 26.3 percent, the west urban area had the highest percent of new vacancies. The lowest percent of new vacancies,11.7percent,wasintheeasturbanarea(Figure 7).
Comparisons to the east rural area were not able to be made because estimates did not pass publication standards. This also occurred in the fall 2012 report.
Figure 7. Vacancies in newly created positions, by areaWashington state, fall 2013Source: Employment Security Department/LMPA
0% 5% 10% 15% 20% 25% 30%
Washington state
West urban
West rural
East urban
East rural*
Percent of vacancies
Are
a
*Only results, which passed publication standards (based on number of responses and confidence intervals), are reported. See Appendix 4 for more details about these standards.
The west urban area of the state had the highest share of newly created estimated vacancies, at 26.3 percent.
June 2014Page 20
Fall 2013 Job Vacancy and Hiring Survey ReportEmployment Security Department
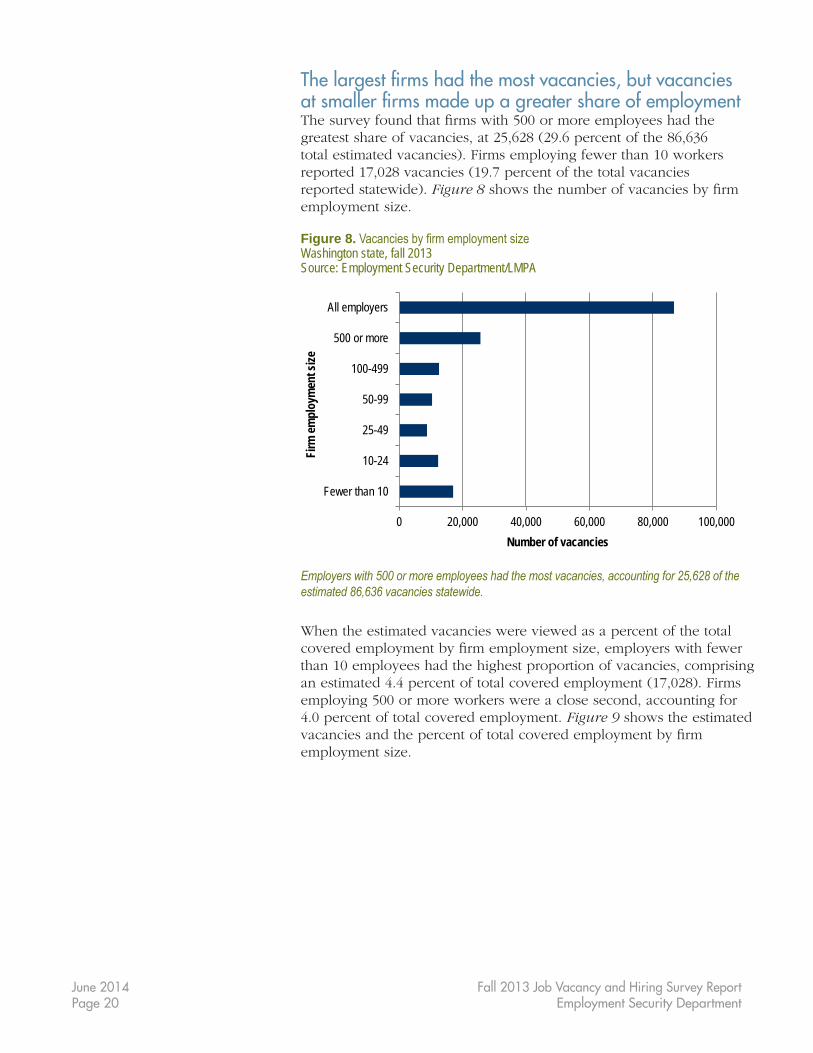
The largest firms had the most vacancies, but vacancies at smaller firms made up a greater share of employmentThesurveyfoundthatfirmswith500ormoreemployeeshadthegreatestshareofvacancies,at25,628(29.6percentofthe86,636totalestimatedvacancies).Firmsemployingfewerthan10workersreported17,028vacancies(19.7percentofthetotalvacanciesreportedstatewide).Figure 8showsthenumberofvacanciesbyfirmemploymentsize.
Figure 8. Vacancies by firm employment sizeWashington state, fall 2013Source: Employment Security Department/LMPA
0 20,000 40,000 60,000 80,000 100,000
Fewer than 10
10-24
25-49
50-99
100-499
500 or more
All employers
Number of vacancies
Firm
empl
oym
ent s
ize
Employers with 500 or more employees had the most vacancies, accounting for 25,628 of the estimated 86,636 vacancies statewide.
When the estimated vacancies were viewed as a percent of the total coveredemploymentbyfirmemploymentsize,employerswithfewerthan 10 employees had the highest proportion of vacancies, comprising anestimated4.4percentoftotalcoveredemployment(17,028).Firmsemploying 500 or more workers were a close second, accounting for 4.0 percent of total covered employment. Figure 9 shows the estimated vacanciesandthepercentoftotalcoveredemploymentbyfirmemploymentsize.
June 2014Page 21
Fall 2013 Job Vacancy and Hiring Survey ReportEmployment Security Department
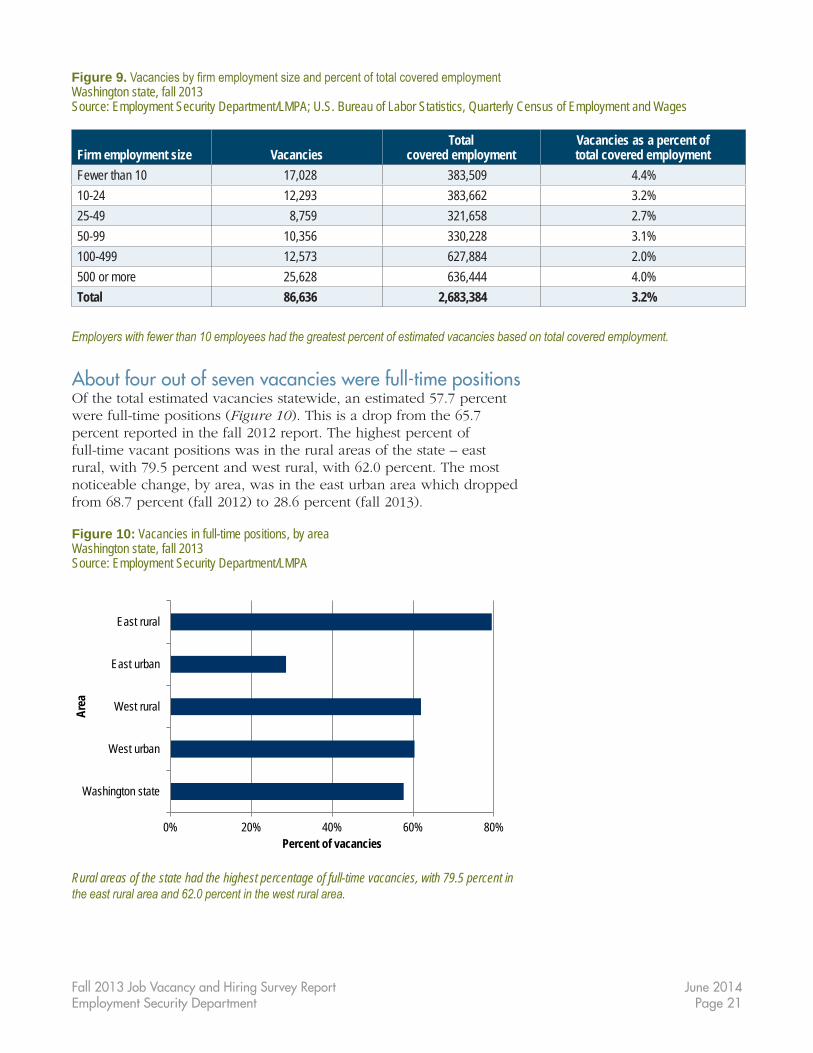
About four out of seven vacancies were full-time positionsOf the total estimated vacancies statewide, an estimated 57.7 percent werefull-timepositions(Figure 10).Thisisadropfromthe65.7percent reported in the fall 2012 report. The highest percent of full-timevacantpositionswasintheruralareasofthestate–eastrural, with 79.5 percent and west rural, with 62.0 percent. The most noticeable change, by area, was in the east urban area which dropped from68.7percent(fall2012)to28.6percent(fall2013).
Figure 10: Vacancies in full-time positions, by areaWashington state, fall 2013Source: Employment Security Department/LMPA
0% 20% 40% 60% 80%
Washington state
West urban
West rural
East urban
East rural
Percent of vacancies
Area
Rural areas of the state had the highest percentage of full-time vacancies, with 79.5 percent in the east rural area and 62.0 percent in the west rural area.
Figure 9. Vacancies by firm employment size and percent of total covered employmentWashington state, fall 2013Source: Employment Security Department/LMPA; U.S. Bureau of Labor Statistics, Quarterly Census of Employment and Wages
Firm employment size VacanciesTotal
covered employmentVacancies as a percent of total covered employment
Fewer than 10 17,028 383,509 4.4%10-24 12,293 383,662 3.2%25-49 8,759 321,658 2.7%50-99 10,356 330,228 3.1%100-499 12,573 627,884 2.0%500 or more 25,628 636,444 4.0%Total 86,636 2,683,384 3.2%
Employers with fewer than 10 employees had the greatest percent of estimated vacancies based on total covered employment.
June 2014Page 22
Fall 2013 Job Vacancy and Hiring Survey ReportEmployment Security Department
Nearly 2 in 3 vacancies were permanent positionsFor each reported vacancy, employers were asked whether the vacancywasapermanentorseasonal(non-permanent)position.Thesurveydidnotdefinepermanentorseasonalemployment.
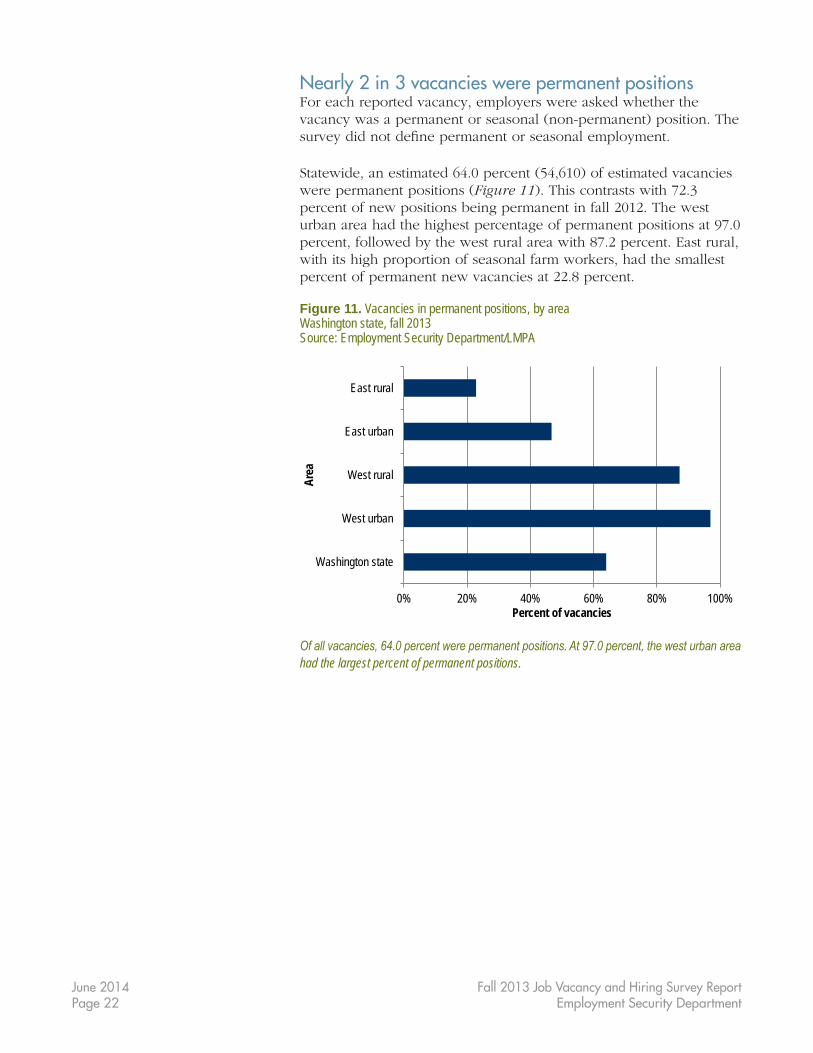
Statewide,anestimated64.0percent(54,610)ofestimatedvacancieswerepermanentpositions(Figure 11).Thiscontrastswith72.3percent of new positions being permanent in fall 2012. The west urban area had the highest percentage of permanent positions at 97.0 percent, followed by the west rural area with 87.2 percent. East rural, with its high proportion of seasonal farm workers, had the smallest percent of permanent new vacancies at 22.8 percent.
Figure 11. Vacancies in permanent positions, by areaWashington state, fall 2013Source: Employment Security Department/LMPA
0% 20% 40% 60% 80% 100%
Washington state
West urban
West rural
East urban
East rural
Percent of vacancies
Area
Of all vacancies, 64.0 percent were permanent positions. At 97.0 percent, the west urban area had the largest percent of permanent positions.
June 2014Page 23
Fall 2013 Job Vacancy and Hiring Survey ReportEmployment Security Department
Most vacancies required only a high school diploma or had no educational requirementEmployers were asked about education requirements for current job vacancies, with response options of: no requirement, high school diploma, some college, no degree, associate or vocational degree, bachelor’s degree, graduate degree, or other. The “other” category accommodateseducationrequirementsthatdidnotfitintoanyoftheavailable categories.
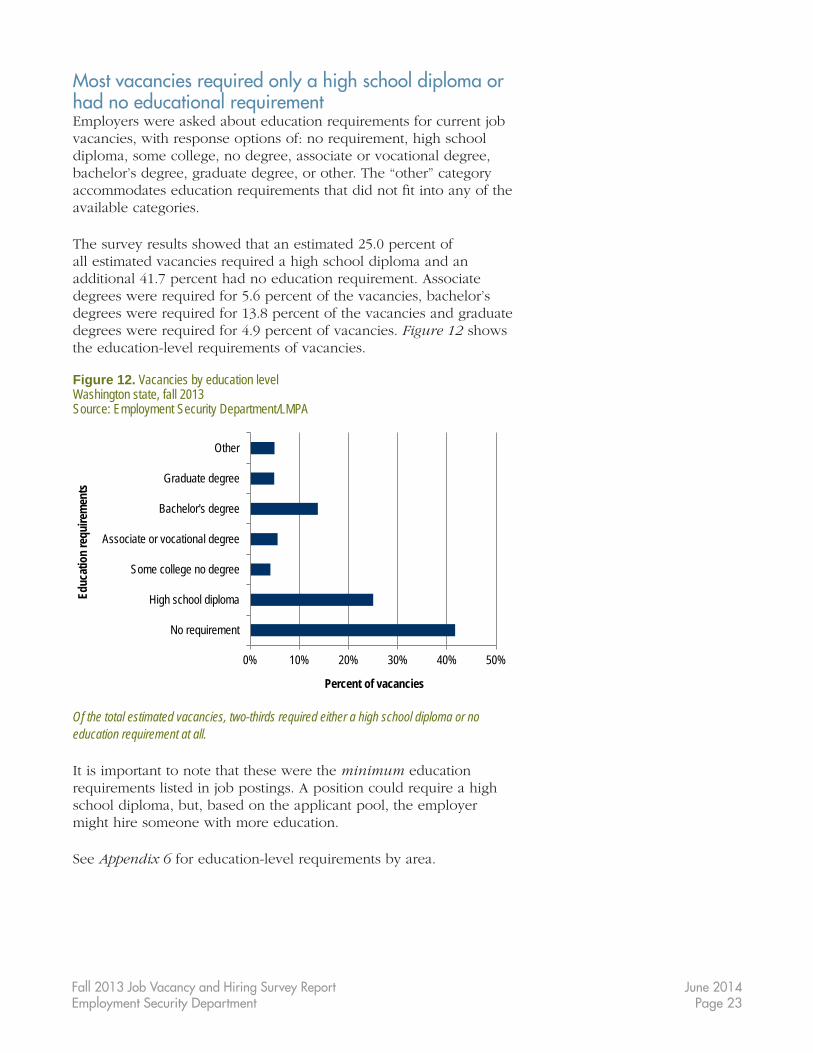
The survey results showed that an estimated 25.0 percent of all estimated vacancies required a high school diploma and an additional 41.7 percent had no education requirement. Associate degrees were required for 5.6 percent of the vacancies, bachelor’s degrees were required for 13.8 percent of the vacancies and graduate degrees were required for 4.9 percent of vacancies. Figure 12 shows the education-level requirements of vacancies.
Figure 12. Vacancies by education levelWashington state, fall 2013Source: Employment Security Department/LMPA
0% 10% 20% 30% 40% 50%
No requirement
High school diploma
Some college no degree
Associate or vocational degree
Bachelor's degree
Graduate degree
Other
Percent of vacancies
Educ
atio
n re
quire
men
ts
Of the total estimated vacancies, two-thirds required either a high school diploma or no education requirement at all.
It is important to note that these were the minimum education requirements listed in job postings. A position could require a high school diploma, but, based on the applicant pool, the employer might hire someone with more education.
See Appendix 6 for education-level requirements by area.
June 2014Page 24
Fall 2013 Job Vacancy and Hiring Survey ReportEmployment Security Department
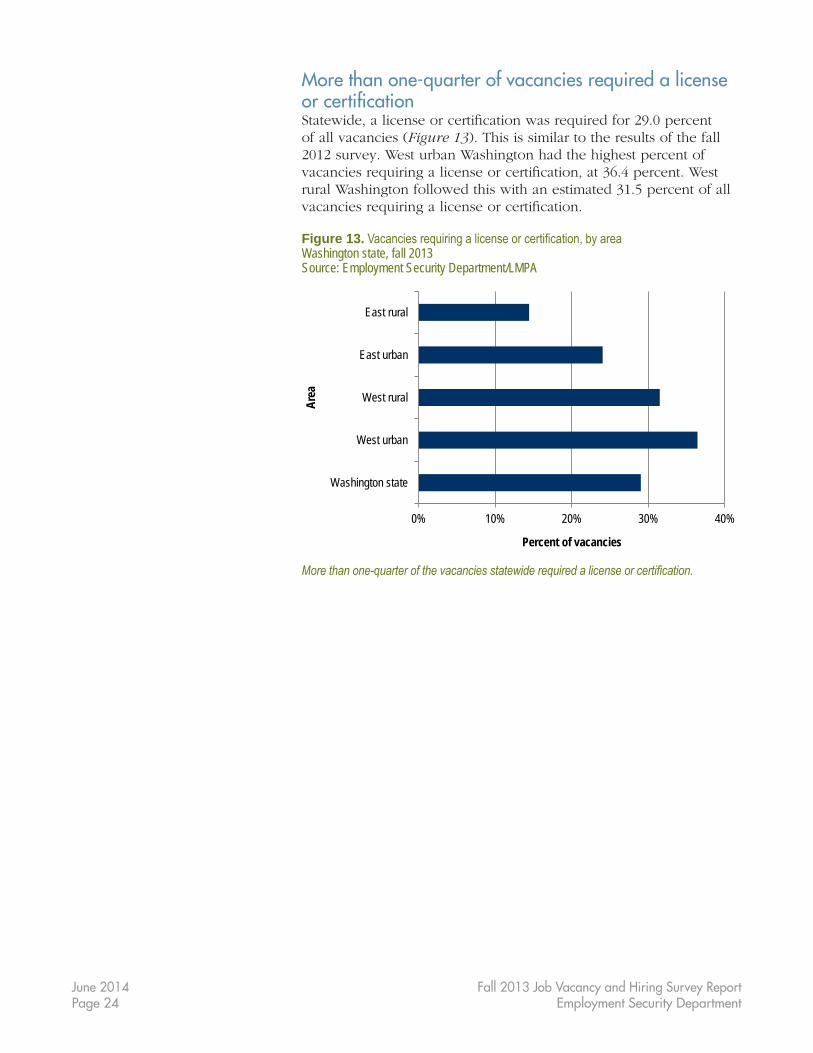
More than one-quarter of vacancies required a license or certificationStatewide,alicenseorcertificationwasrequiredfor29.0percentofallvacancies(Figure 13).Thisissimilartotheresultsofthefall2012 survey. West urban Washington had the highest percent of vacanciesrequiringalicenseorcertification,at36.4percent.Westrural Washington followed this with an estimated 31.5 percent of all vacanciesrequiringalicenseorcertification.
Figure 13. Vacancies requiring a license or certification, by areaWashington state, fall 2013Source: Employment Security Department/LMPA
0% 10% 20% 30% 40%
Washington state
West urban
West rural
East urban
East rural
Percent of vacancies
Area
More than one-quarter of the vacancies statewide required a license or certification.
June 2014Page 25
Fall 2013 Job Vacancy and Hiring Survey ReportEmployment Security Department
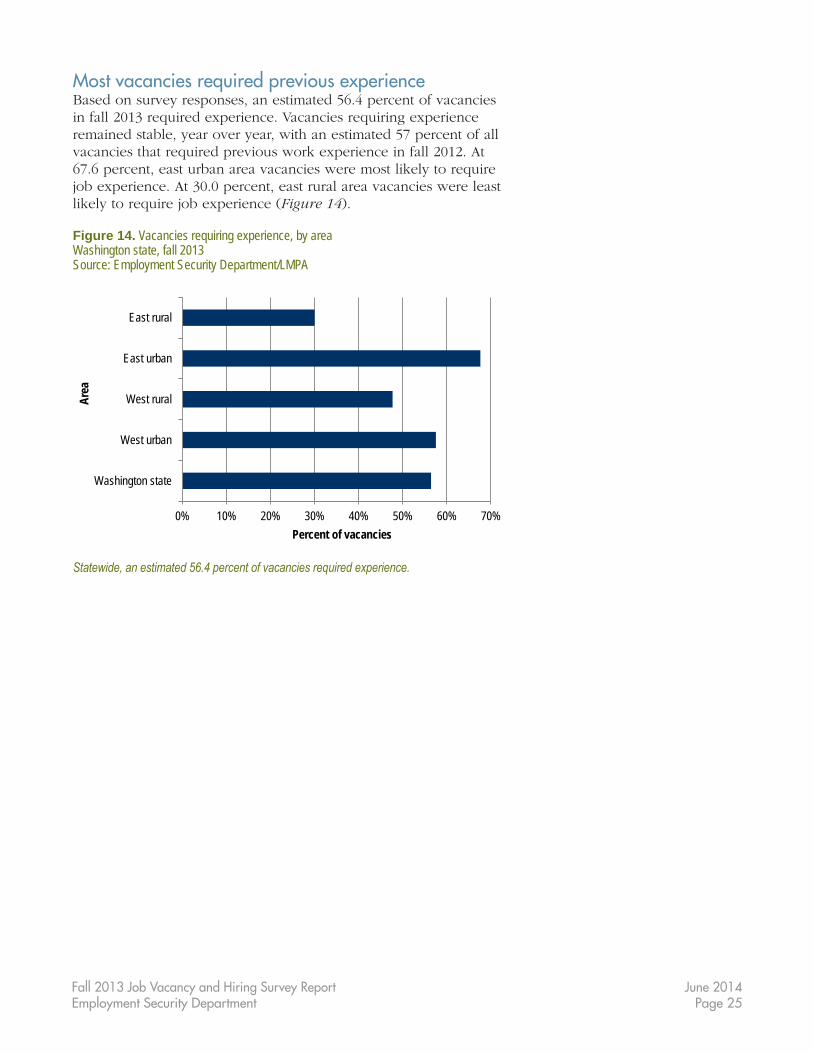
Most vacancies required previous experienceBased on survey responses, an estimated 56.4 percent of vacancies infall2013requiredexperience.Vacanciesrequiringexperienceremained stable, year over year, with an estimated 57 percent of all vacancies that required previous work experience in fall 2012. At 67.6 percent, east urban area vacancies were most likely to require job experience. At 30.0 percent, east rural area vacancies were least likelytorequirejobexperience(Figure 14).
Figure 14. Vacancies requiring experience, by areaWashington state, fall 2013Source: Employment Security Department/LMPA
0% 10% 20% 30% 40% 50% 60% 70%
Washington state
West urban
West rural
East urban
East rural
Percent of vacancies
Area
Statewide, an estimated 56.4 percent of vacancies required experience.
June 2014Page 26
Fall 2013 Job Vacancy and Hiring Survey ReportEmployment Security Department
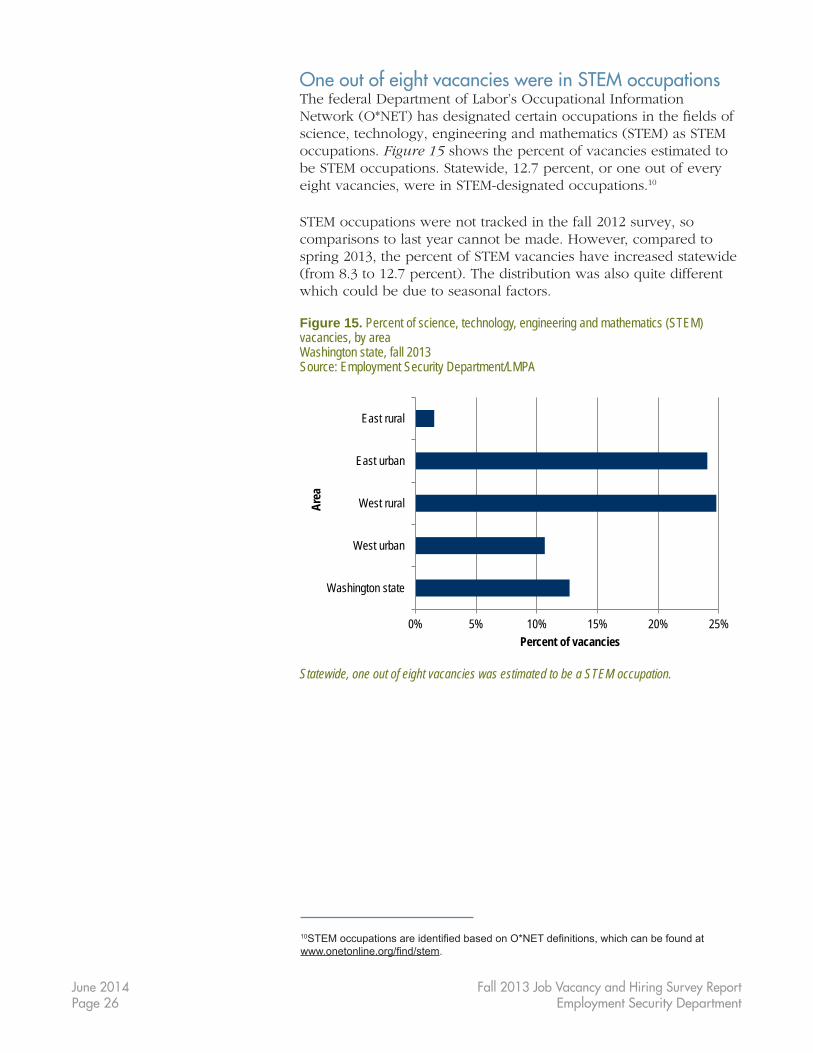
One out of eight vacancies were in STEM occupations The federal Department of Labor’s Occupational Information Network(O*NET)hasdesignatedcertainoccupationsinthefieldsofscience,technology,engineeringandmathematics(STEM)asSTEMoccupations. Figure 15 shows the percent of vacancies estimated to be STEM occupations. Statewide, 12.7 percent, or one out of every eight vacancies, were in STEM-designated occupations.10
STEM occupations were not tracked in the fall 2012 survey, so comparisons to last year cannot be made. However, compared to spring 2013, the percent of STEM vacancies have increased statewide (from8.3to12.7percent).Thedistributionwasalsoquitedifferentwhich could be due to seasonal factors.
Figure 15. Percent of science, technology, engineering and mathematics (STEM) vacancies, by areaWashington state, fall 2013Source: Employment Security Department/LMPA
0% 5% 10% 15% 20% 25%
Washington state
West urban
West rural
East urban
East rural
Percent of vacancies
Area
Statewide, one out of eight vacancies was estimated to be a STEM occupation.
10STEM occupations are identified based on O*NET definitions, which can be found at www.onetonline.org/find/stem.

June 2014Page 27
Fall 2013 Job Vacancy and Hiring Survey ReportEmployment Security Department
The top 10 occupations represented 7,434 of the 86,636 estimated vacancies, or 8.6 percent of the total, as shown in Figure 16.
The three STEM occupations with the most vacancies were:
• Mathematicalscienceteachers,postsecondary(1,882vacancies,comprising2.17percentoftotalvacancies).
• Computerscienceteachers,postsecondary(1,862vacancies,comprising2.15percentoftotalvacancies).
• Automotiveservicetechniciansandmechanics(806vacancies,comprising0.93percentoftotalvacancies).
Figure 16. Top 10 science, technology, engineering and mathematics (STEM) occupations with vacanciesWashington state, fall 2013Source: Employment Security Department/LMPA
SOC OccupationsSTEM
vacancies
Percentof totalSTEM
vacancies
Percentof total
vacancies25-1022* Mathematical science teachers, postsecondary 1,882 17.1% 2.17%25-1021* Computer science teachers, postsecondary 1,862 16.9% 2.15%49-3023 Automotive service technicians and mechanics 806 7.3% 0.93%15-1133 Software developers, systems software 782 7.1% 0.90%35-1012 First-line supervisors of food preparation and serving workers 427 3.9% 0.49%45-3011* Fishers and related fishing workers 387 3.5% 0.45%13-1199 Business operations specialists, all other 357 3.2% 0.41%19-4099* Life, physical and social science technicians, all other 349 3.2% 0.40%15-1121 Computer systems analysts 311 2.8% 0.36%27-1024 Graphic designers 270 2.5% 0.31% Total STEM occupations 10,996 67.6% 12.69%
*In a small number of cases, estimates known to be substantively significant are included in the report despite failing to meet the third of these criteria. They are included because they are known to provide essential information on some of the state’s largest occupational and industrial groups. Including them provides a more accurate account of Washington’s labor-market conditions.
The top 10 STEM occupations account for one-third of all estimated STEM vacancies (67.6 percent).

June 2014Page 28
Fall 2013 Job Vacancy and Hiring Survey ReportEmployment Security Department
June 2014Page 29
Fall 2013 Job Vacancy and Hiring Survey ReportEmployment Security Department
Fall 2013 hiring resultsThe hiring component of the survey asked employers whether they madeanynewexternalhires(workershiredfromoutsidethefirm)from July 1 through September 30, 2013. This information provided an indicator of employment growth and the relative vigor of the state economy.Welearnedtheestimatednumberofpositionsfilled,thecharacteristics of those positions, the workforce needs employers were able to meet and trends by industry sector and occupation.
Forthepurposeofthissurvey,hiresweredefinedasanynewexternal hire for both new and existing positions, excluding internal promotions.
The same employers were surveyed for the hiring and job-vacancy components of this report. The hiring component received 5,729 usable responses, with a response rate of 47.7 percent. Estimates wereproducedwith95percentconfidenceintervals.Thismeasureof statistical reliability was used to determine whether the data met EmploymentSecurityDepartment(ESD)publishingstandards.(Seethe description of publishing standards in Appendix 4.)
June 2014Page 30
Fall 2013 Job Vacancy and Hiring Survey ReportEmployment Security Department
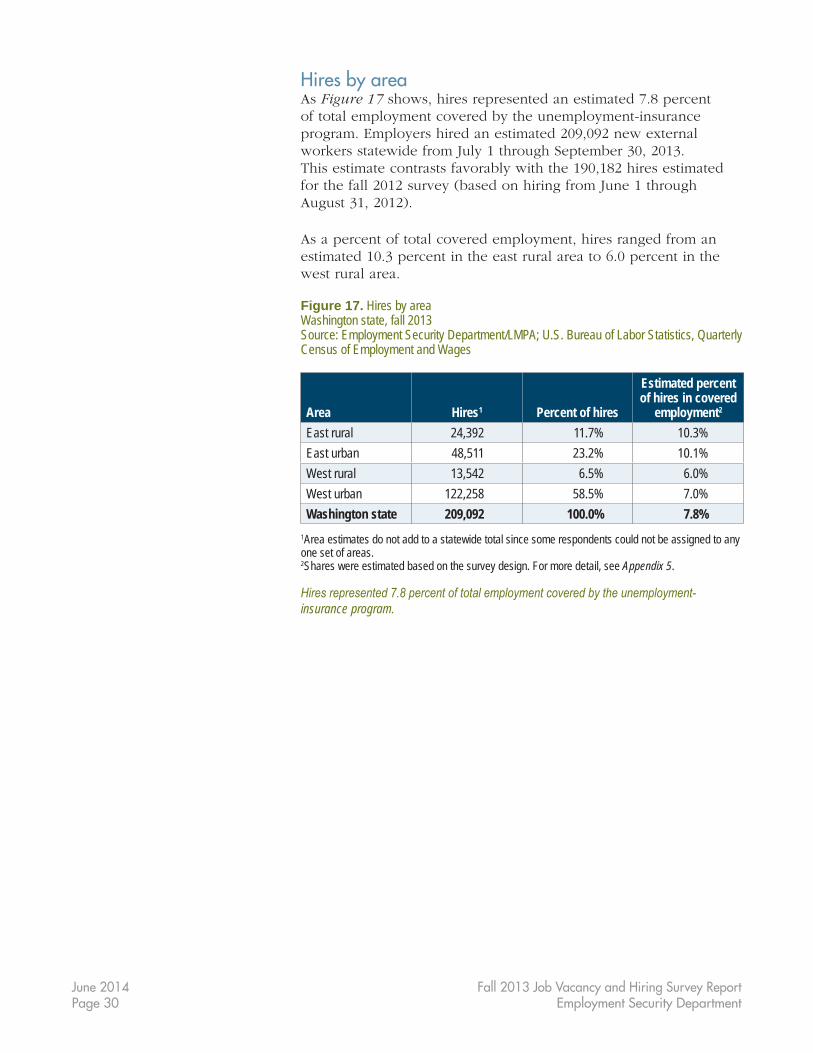
Hires by areaAs Figure 17 shows, hires represented an estimated 7.8 percent of total employment covered by the unemployment-insurance program. Employers hired an estimated 209,092 new external workers statewide from July 1 through September 30, 2013. This estimate contrasts favorably with the 190,182 hires estimated forthefall2012survey(basedonhiringfromJune1throughAugust31,2012).
As a percent of total covered employment, hires ranged from an estimated 10.3 percent in the east rural area to 6.0 percent in the west rural area.
Figure 17. Hires by areaWashington state, fall 2013Source: Employment Security Department/LMPA; U.S. Bureau of Labor Statistics, Quarterly Census of Employment and Wages
Area Hires1 Percent of hires
Estimated percent of hires in covered
employment2
East rural 24,392 11.7% 10.3%East urban 48,511 23.2% 10.1%West rural 13,542 6.5% 6.0%West urban 122,258 58.5% 7.0%Washington state 209,092 100.0% 7.8%
1Area estimates do not add to a statewide total since some respondents could not be assigned to any one set of areas. 2Shares were estimated based on the survey design. For more detail, see Appendix 5.
Hires represented 7.8 percent of total employment covered by the unemployment-insurance program.
June 2014Page 31
Fall 2013 Job Vacancy and Hiring Survey ReportEmployment Security Department
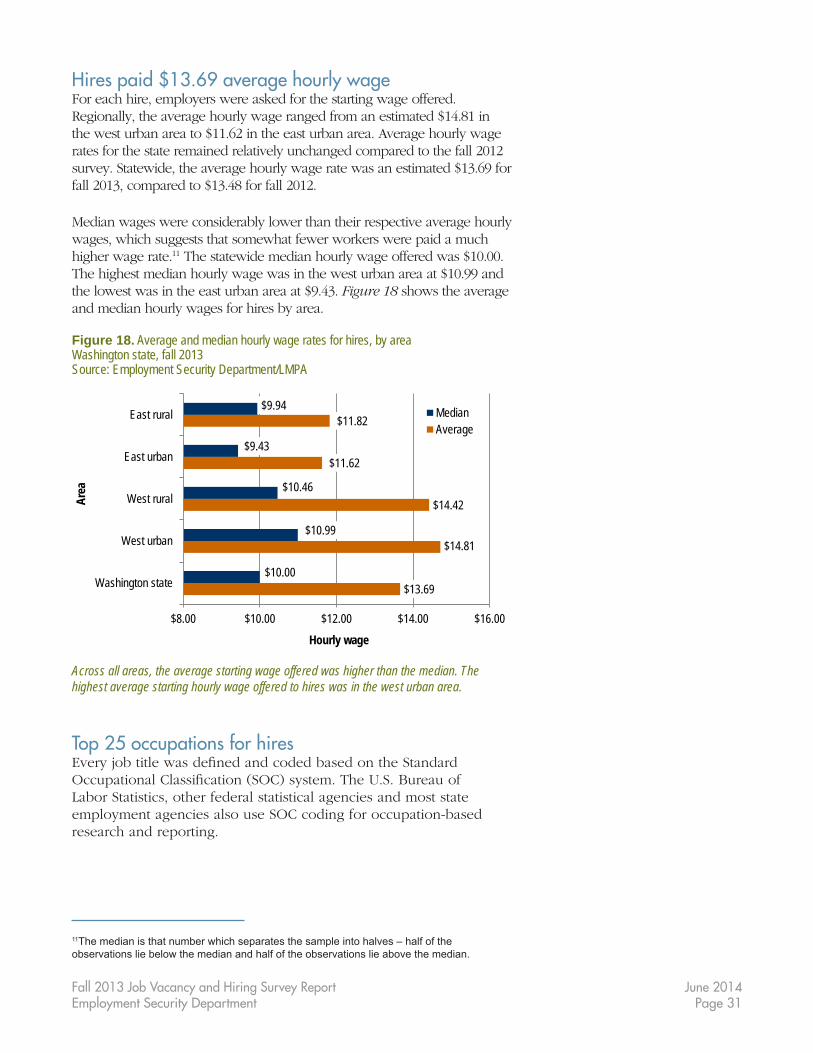
Hires paid $13.69 average hourly wageFor each hire, employers were asked for the starting wage offered. Regionally, the average hourly wage ranged from an estimated $14.81 in the west urban area to $11.62 in the east urban area. Average hourly wage rates for the state remained relatively unchanged compared to the fall 2012 survey. Statewide, the average hourly wage rate was an estimated $13.69 for fall 2013, compared to $13.48 for fall 2012.
Median wages were considerably lower than their respective average hourly wages, which suggests that somewhat fewer workers were paid a much higher wage rate.11 The statewide median hourly wage offered was $10.00. The highest median hourly wage was in the west urban area at $10.99 and the lowest was in the east urban area at $9.43. Figure 18 shows the average and median hourly wages for hires by area.
Figure 18. Average and median hourly wage rates for hires, by area Washington state, fall 2013 Source: Employment Security Department/LMPA
$13.69
$14.81
$14.42
$11.62
$11.82
$10.00
$10.99
$10.46
$9.43
$9.94
$8.00 $10.00 $12.00 $14.00 $16.00
Washington state
West urban
West rural
East urban
East rural
Hourly wage
Area
MedianAverage
Across all areas, the average starting wage offered was higher than the median. The highest average starting hourly wage offered to hires was in the west urban area.
Top 25 occupations for hiresEveryjobtitlewasdefinedandcodedbasedontheStandardOccupationalClassification(SOC)system.TheU.S.Bureauof Labor Statistics, other federal statistical agencies and most state employment agencies also use SOC coding for occupation-based research and reporting.
11The median is that number which separates the sample into halves – half of the observations lie below the median and half of the observations lie above the median.
June 2014Page 32
Fall 2013 Job Vacancy and Hiring Survey ReportEmployment Security Department
The top 25 occupations accounted for 116,278 of the estimated 209,092hires(55.6percent),asshowninFigure 19. Among the top 25 occupations, the top three by number of hires were:
• Farmworkersandlaborers,crop,nurseryandgreenhouse(26,685,comprising12.8percentoftotalhires).
• Retailsalespersons(15,152,comprising7.2percentof totalhires).
• Cashiers(7,833,comprising3.7percentoftotalhires).
Compared to fall 2012, the top three occupations by number of hires were the same.
Theaveragehourlywagerates(estimated)forthetop25hiresbyoccupation are shown in Figure 19. Among the top 25 occupations, the three occupations with the highest average hourly wage rate were:
• Secondaryschoolteachers,exceptspecialandcareer/technicaleducation($29.66perhour).
• Registerednurses($25.62perhour).• Businessoperationsspecialists,allother($21.58perhour).
With one exception, secondary school teachers, except special andcareer/technicaleducation,themedianhourlywageratewasalways less than the average hourly wage rate. For six of the 25 top hires by occupation, the median hourly wage equaled the state minimum wage.
The top three occupations in the fall 2012 survey, by average hourly wage,wereregisterednurses($27.16),businessoperationsspecialists,allother($25.16)andheavyandtractor-trailertruckdrivers($19.52).

June 2014Page 33
Fall 2013 Job Vacancy and Hiring Survey ReportEmployment Security Department
Figure 19. Starting average and median hourly wage rates for the top 25 hires by occupationWashington state, fall 2013Source: Employment Security Department/LMPA
SOC Occupations Hires
Percent of total hires
Averagehourly wage
Medianhourlywage
45-2092 Farmworkers and laborers, crop, nursery and greenhouse
26,685 12.8% $9.90 $9.19
41-2031 Retail salespersons 15,152 7.2% $9.91 $9.2341-2011 Cashiers 7,833 3.7% $9.53 $9.1943-4051 Customer service representatives 7,425 3.6% $11.30 $10.9125-2031 Secondary school teachers, except special and
career/technical education5,237 2.5% $29.66 $30.26
53-7062 Laborers and freight stock and material movers, hand 4,512 2.2% $11.38 $10.0053-3032 Heavy and tractor-trailer truck drivers 4,163 2.0% $15.06 $14.6435-3032 Waiters and waitresses 3,813 1.8% $9.41 $9.1947-2061 Construction laborers 3,375 1.6% $14.34 $12.9435-2021 Food preparation workers 3,044 1.5% $9.38 $9.1935-2011 Cooks, fast food 3,033 1.5% $9.34 $9.1925-9041 Teacher assistants 3,028 1.4% $12.26 $11.8143-4171 Receptionists and information clerks 2,940 1.4% $11.68 $10.7335-3022 Counter attendants, cafeteria, food concession and
coffee shop2,762 1.3% $9.31 $9.19
31-1014 Nursing assistants 2,651 1.3% $10.60 $10.2937-2011 Janitors and cleaners, except maids and
housekeeping cleaners2,543 1.2% $10.79 $9.84
13-1199 Business operations specialists, all other 2,506 1.2% $21.58 $19.0629-1141 Registered nurses 2,401 1.1% $25.62 $24.7737-3011 Landscaping and groundskeeping workers 2,273 1.1% $10.93 $9.9937-3011 Maids and housekeeping workers 2,247 1.1% $10.02 $9.2439-9021 Personal care aides 1,964 0.9% $10.70 $10.0851-9198* Helpers, production workers 1,774 0.8% $9.28 $9.2043-6014 Secretaries and administrative assistants, except
legal, medical and executive1,673 0.8% $15.03 $14.00
49-9071 Maintenance and repair workers, general 1,655 0.8% $13.72 $11.9743-9061 Office clerks, general 1,590 0.8% $12.44 $11.88
*In a small number of cases, estimates known to be substantively significant are included in the report despite failing to meet the third of these criteria. They are included because they are known to provide essential information on some of the state’s largest occupational and industrial groups. Including them provides a more accurate account of Washington’s labor-market conditions.
Average hourly wage rates were consistently higher than median hourly wage rates, suggesting that somewhat fewer workers were paid higher wages across occupations.

June 2014Page 34
Fall 2013 Job Vacancy and Hiring Survey ReportEmployment Security Department
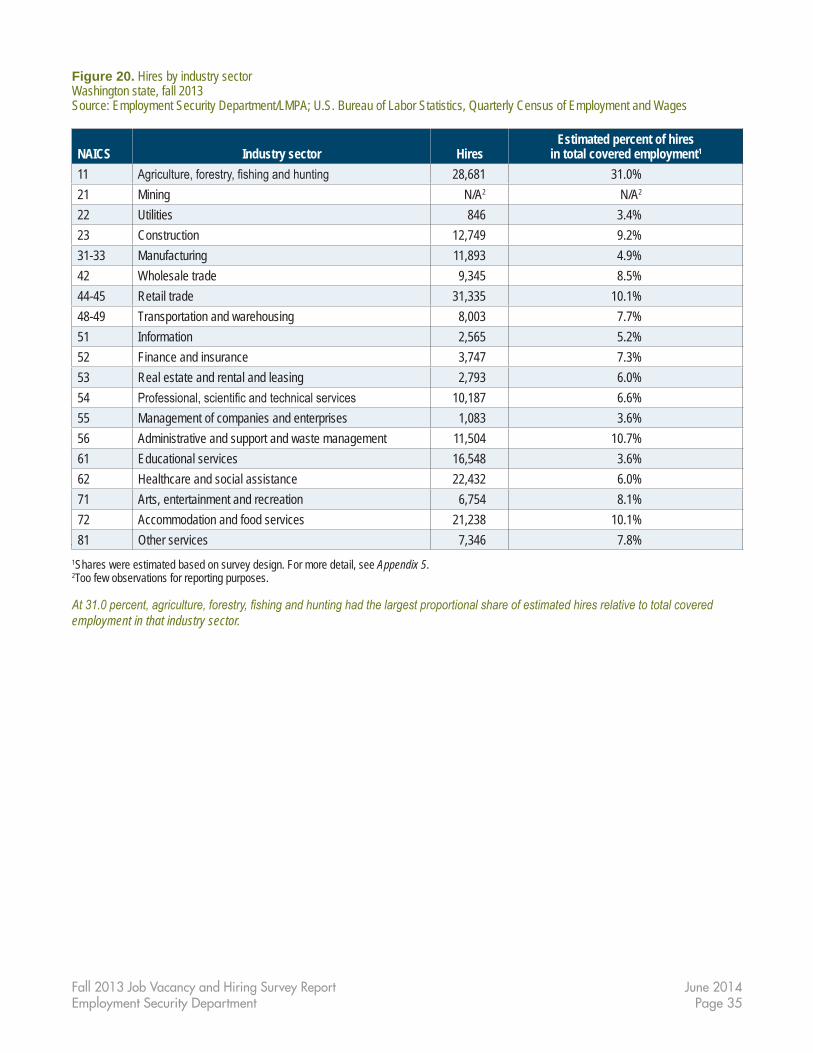
Hires by industry sectorsEmployersaredefinedandcodedintoindustriesbasedontheNorthAmericanIndustryClassificationSystem(NAICS).TheU.S.Bureauof Labor Statistics, other federal statistical agencies and most state employmentagenciesalsouseNAICSforindustry-basedresearch and reporting.
The top three industry sectors with the greatest number of estimated hires were:
• Retailtrade(31,335hires,comprising10.1percentoftotalcoveredemployment).
• Agriculture,forestry,fishingandhunting(28,681hires,comprising31.0percentoftotalcoveredemployment).
• Healthcareandsocialassistance(22,432hires,comprising6.0percentoftotalcoveredemployment).
Retail trade was the only sector, different in the top three from fall 2012. The fall 2012 estimates of the top three sectors with the greatestnumberofhireswere:agriculture,forestry,fishingandhunting(42,014at52.3percentoftotalcoveredemployment);accommodationandfoodservices(22,805at10.1percent);andhealthcareandsocialassistance(20,585at5.5percent).
Atanestimated31.0percent,theagriculture,forestry,fishingand hunting industry sector had the largest proportional share of estimated hires relative to total covered employment. Most of thesewereinagriculture,whichreflectsthenormalseasonalhiringpattern. At 3.4 percent, utilities had the smallest share of estimated hires relative to total covered employment and the smallest absolute numberofestimatedhires(846).Figure 20 shows the estimated number of hires by industry sector.
June 2014Page 35
Fall 2013 Job Vacancy and Hiring Survey ReportEmployment Security Department
Figure 20. Hires by industry sectorWashington state, fall 2013Source: Employment Security Department/LMPA; U.S. Bureau of Labor Statistics, Quarterly Census of Employment and Wages
NAICS Industry sector HiresEstimated percent of hires
in total covered employment1
11 Agriculture, forestry, fishing and hunting 28,681 31.0%21 Mining N/A2 N/A2
22 Utilities 846 3.4%23 Construction 12,749 9.2%31-33 Manufacturing 11,893 4.9%42 Wholesale trade 9,345 8.5%44-45 Retail trade 31,335 10.1%48-49 Transportation and warehousing 8,003 7.7%51 Information 2,565 5.2%52 Finance and insurance 3,747 7.3%53 Real estate and rental and leasing 2,793 6.0%54 Professional, scientific and technical services 10,187 6.6%55 Management of companies and enterprises 1,083 3.6%56 Administrative and support and waste management 11,504 10.7%61 Educational services 16,548 3.6%62 Healthcare and social assistance 22,432 6.0%71 Arts, entertainment and recreation 6,754 8.1%72 Accommodation and food services 21,238 10.1%81 Other services 7,346 7.8%
1Shares were estimated based on survey design. For more detail, see Appendix 5. 2Too few observations for reporting purposes.
At 31.0 percent, agriculture, forestry, fishing and hunting had the largest proportional share of estimated hires relative to total covered employment in that industry sector.
June 2014Page 36
Fall 2013 Job Vacancy and Hiring Survey ReportEmployment Security Department
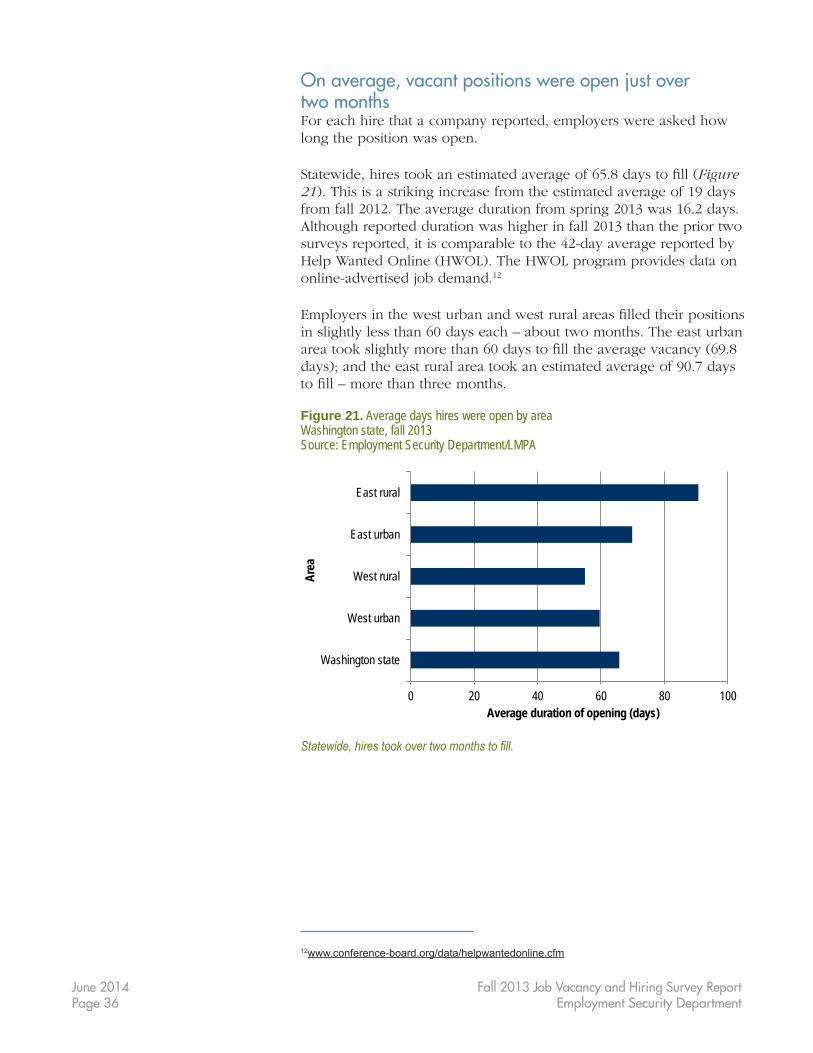
On average, vacant positions were open just over two monthsFor each hire that a company reported, employers were asked how long the position was open.
Statewide,hirestookanestimatedaverageof65.8daystofill(Figure 21).Thisisastrikingincreasefromtheestimatedaverageof19daysfrom fall 2012. The average duration from spring 2013 was 16.2 days. Although reported duration was higher in fall 2013 than the prior two surveys reported, it is comparable to the 42-day average reported by HelpWantedOnline(HWOL).TheHWOLprogramprovidesdataononline-advertised job demand.12
Employersinthewesturbanandwestruralareasfilledtheirpositionsinslightlylessthan60dayseach–abouttwomonths.Theeasturbanareatookslightlymorethan60daystofilltheaveragevacancy(69.8days);andtheeastruralareatookanestimatedaverageof90.7daystofill–morethanthreemonths.
Figure 21. Average days hires were open by area Washington state, fall 2013Source: Employment Security Department/LMPA
0 20 40 60 80 100
Washington state
West urban
West rural
East urban
East rural
Average duration of opening (days)
Area
Statewide, hires took over two months to fill.
12www.conference-board.org/data/helpwantedonline.cfm
June 2014Page 37
Fall 2013 Job Vacancy and Hiring Survey ReportEmployment Security Department
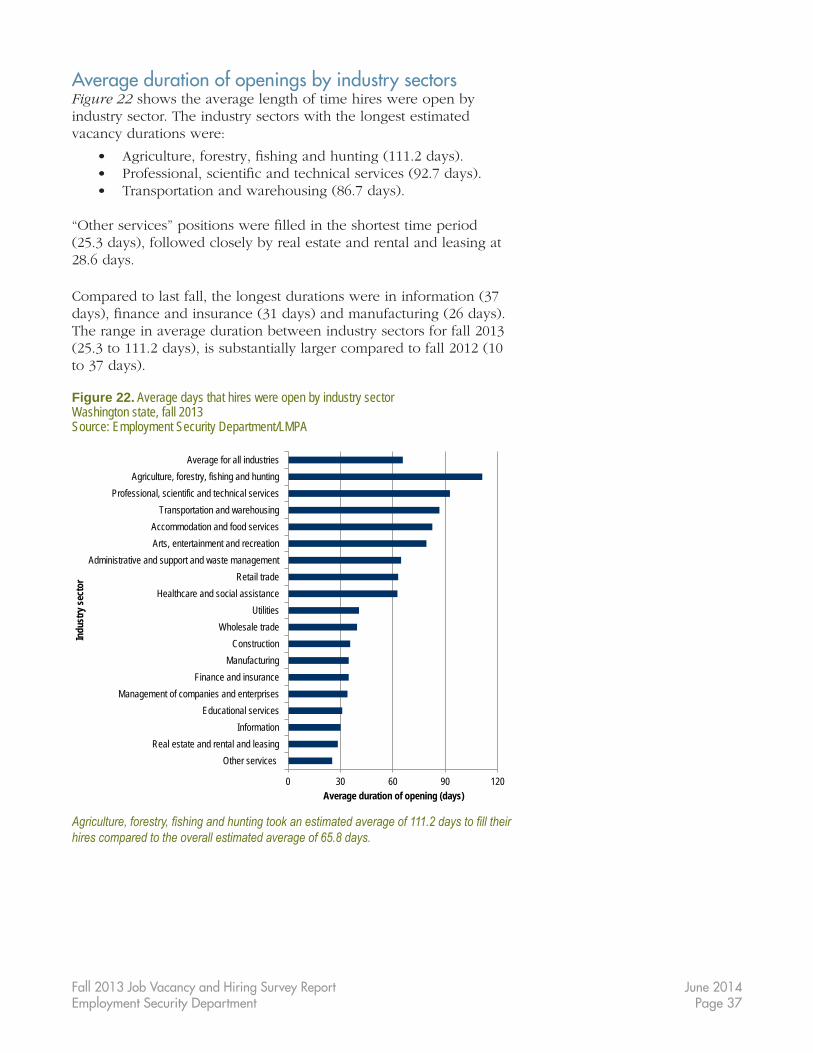
Average duration of openings by industry sectorsFigure 22 shows the average length of time hires were open by industry sector. The industry sectors with the longest estimated vacancy durations were:
• Agriculture,forestry,fishingandhunting(111.2days).• Professional,scientificandtechnicalservices(92.7days).• Transportationandwarehousing(86.7days).
“Otherservices”positionswerefilledintheshortesttimeperiod (25.3days),followedcloselybyrealestateandrentalandleasingat28.6 days.
Comparedtolastfall,thelongestdurationswereininformation(37days),financeandinsurance(31days)andmanufacturing(26days).The range in average duration between industry sectors for fall 2013 (25.3to111.2days),issubstantiallylargercomparedtofall2012(10to37days).
Figure 22. Average days that hires were open by industry sector Washington state, fall 2013Source: Employment Security Department/LMPA
0 30 60 90 120
Other servicesReal estate and rental and leasing
InformationEducational services
Management of companies and enterprisesFinance and insurance
ManufacturingConstruction
Wholesale tradeUtilities
Healthcare and social assistanceRetail trade
Administrative and support and waste managementArts, entertainment and recreationAccommodation and food services
Transportation and warehousingProfessional, scientific and technical services
Agriculture, forestry, fishing and huntingAverage for all industries
Average duration of opening (days)
Indu
stry
sect
or
Agriculture, forestry, fishing and hunting took an estimated average of 111.2 days to fill their hires compared to the overall estimated average of 65.8 days.
June 2014Page 38
Fall 2013 Job Vacancy and Hiring Survey ReportEmployment Security Department
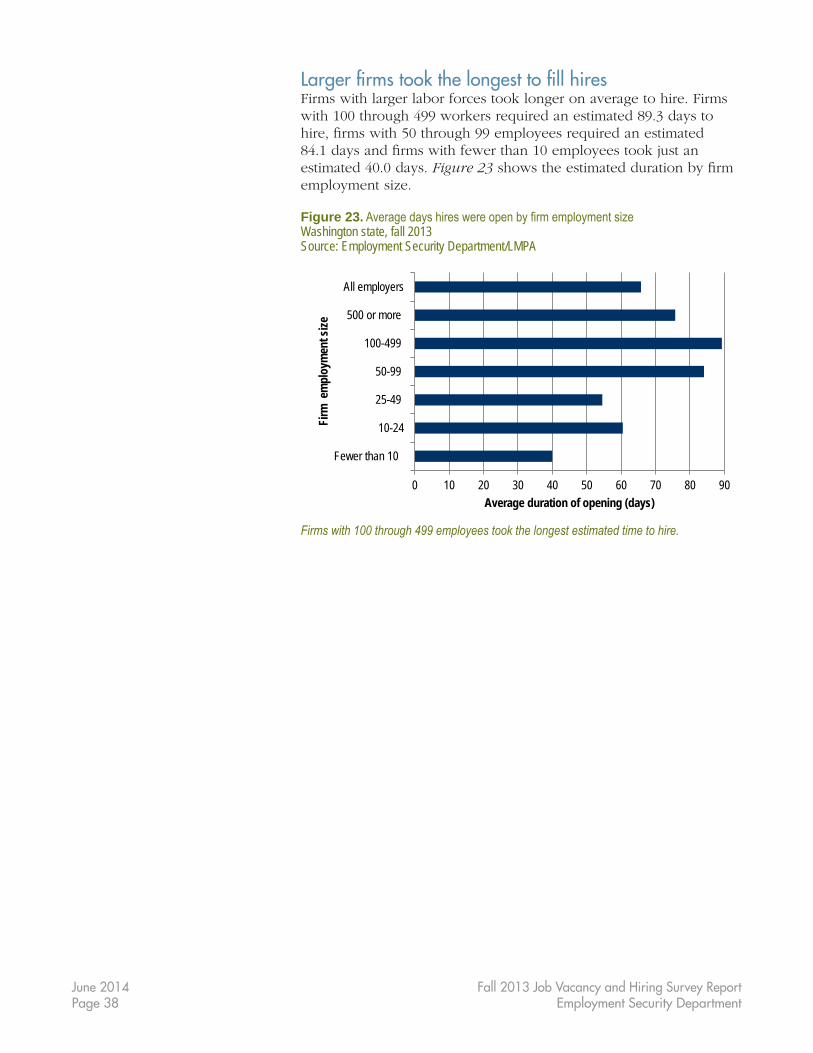
Larger firms took the longest to fill hiresFirms with larger labor forces took longer on average to hire. Firms with 100 through 499 workers required an estimated 89.3 days to hire,firmswith50through99employeesrequiredanestimated84.1daysandfirmswithfewerthan10employeestookjustanestimated 40.0 days. Figure 23showstheestimateddurationbyfirmemploymentsize.
Figure 23. Average days hires were open by firm employment size Washington state, fall 2013Source: Employment Security Department/LMPA
0 10 20 30 40 50 60 70 80 90
Fewer than 10
10-24
25-49
50-99
100-499
500 or more
All employers
Average duration of opening (days)
Firm
em
ploy
men
t size
Firms with 100 through 499 employees took the longest estimated time to hire.
June 2014Page 39
Fall 2013 Job Vacancy and Hiring Survey ReportEmployment Security Department
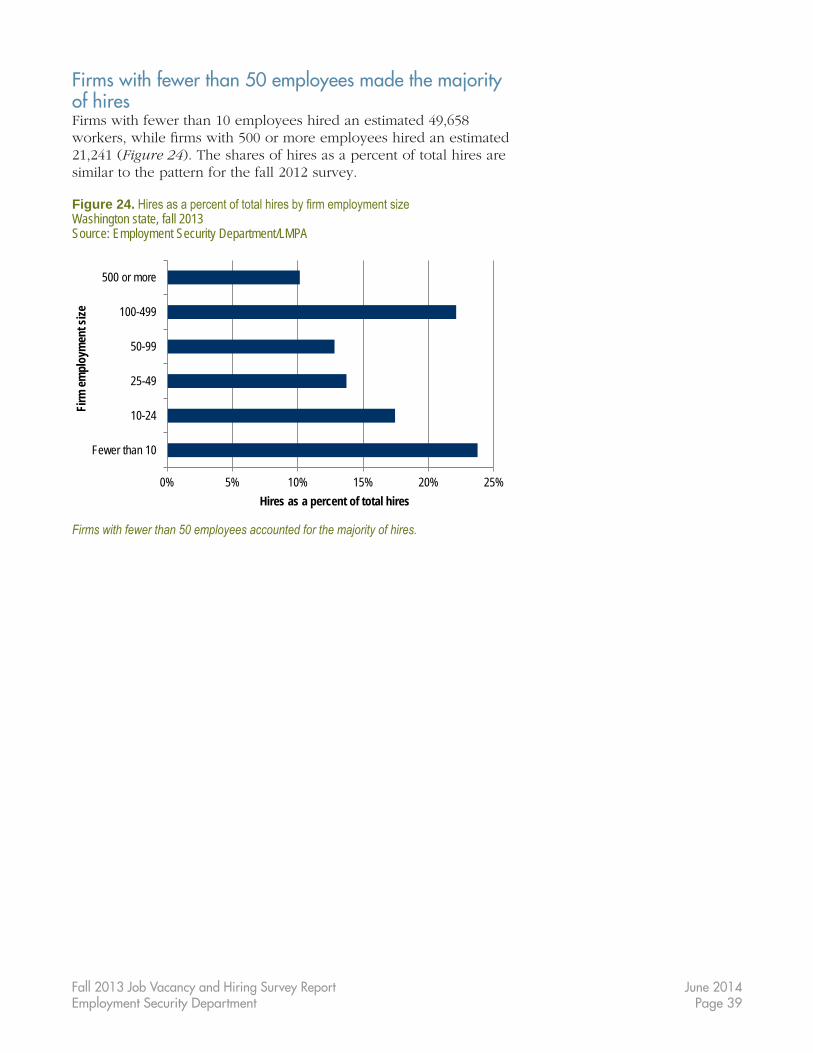
Firms with fewer than 50 employees made the majority of hiresFirms with fewer than 10 employees hired an estimated 49,658 workers,whilefirmswith500ormoreemployeeshiredanestimated21,241(Figure 24).Thesharesofhiresasapercentoftotalhiresaresimilar to the pattern for the fall 2012 survey.
Figure 24. Hires as a percent of total hires by firm employment size Washington state, fall 2013Source: Employment Security Department/LMPA
0% 5% 10% 15% 20% 25%
Fewer than 10
10-24
25-49
50-99
100-499
500 or more
Hires as a percent of total hires
Firm
empl
oym
ent s
ize
Firms with fewer than 50 employees accounted for the majority of hires.
June 2014Page 40
Fall 2013 Job Vacancy and Hiring Survey ReportEmployment Security Department
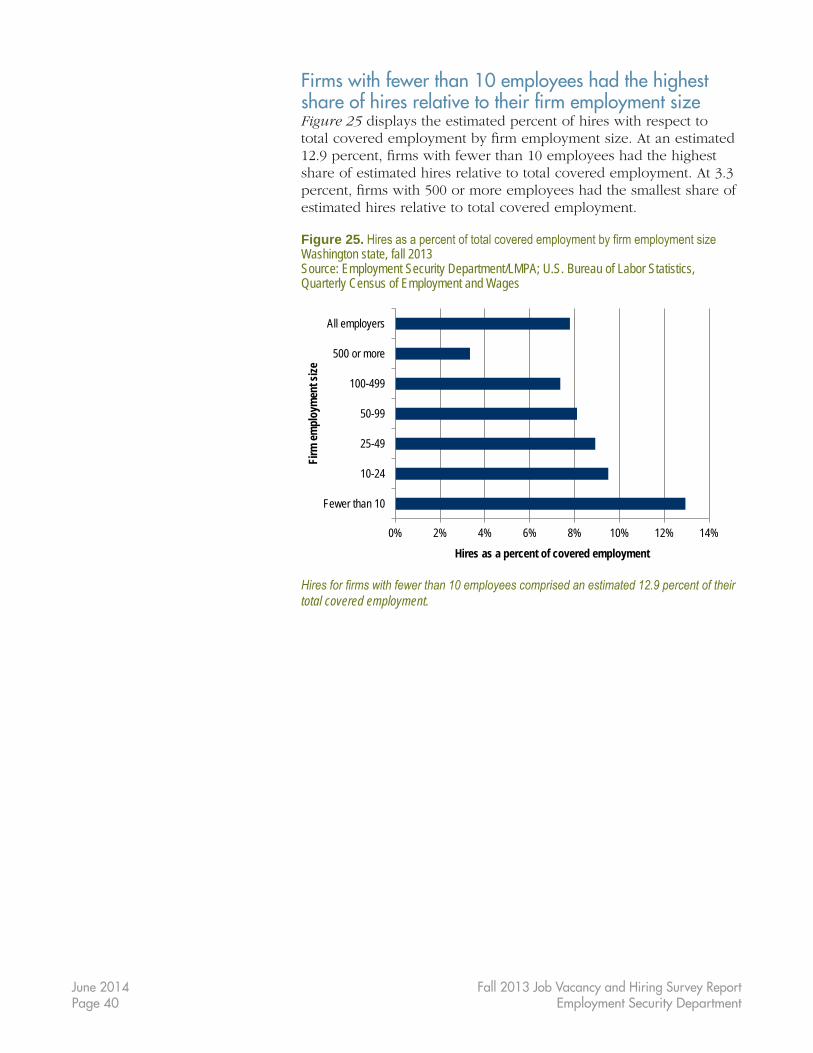
Firms with fewer than 10 employees had the highest share of hires relative to their firm employment sizeFigure 25 displays the estimated percent of hires with respect to totalcoveredemploymentbyfirmemploymentsize.Atanestimated12.9percent,firmswithfewerthan10employeeshadthehighestshare of estimated hires relative to total covered employment. At 3.3 percent,firmswith500ormoreemployeeshadthesmallestshareofestimated hires relative to total covered employment.
Figure 25. Hires as a percent of total covered employment by firm employment size Washington state, fall 2013Source: Employment Security Department/LMPA; U.S. Bureau of Labor Statistics, Quarterly Census of Employment and Wages
0% 2% 4% 6% 8% 10% 12% 14%
Fewer than 10
10-24
25-49
50-99
100-499
500 or more
All employers
Hires as a percent of covered employment
Firm
empl
oym
ent s
ize
Hires for firms with fewer than 10 employees comprised an estimated 12.9 percent of their total covered employment.
June 2014Page 41
Fall 2013 Job Vacancy and Hiring Survey ReportEmployment Security Department
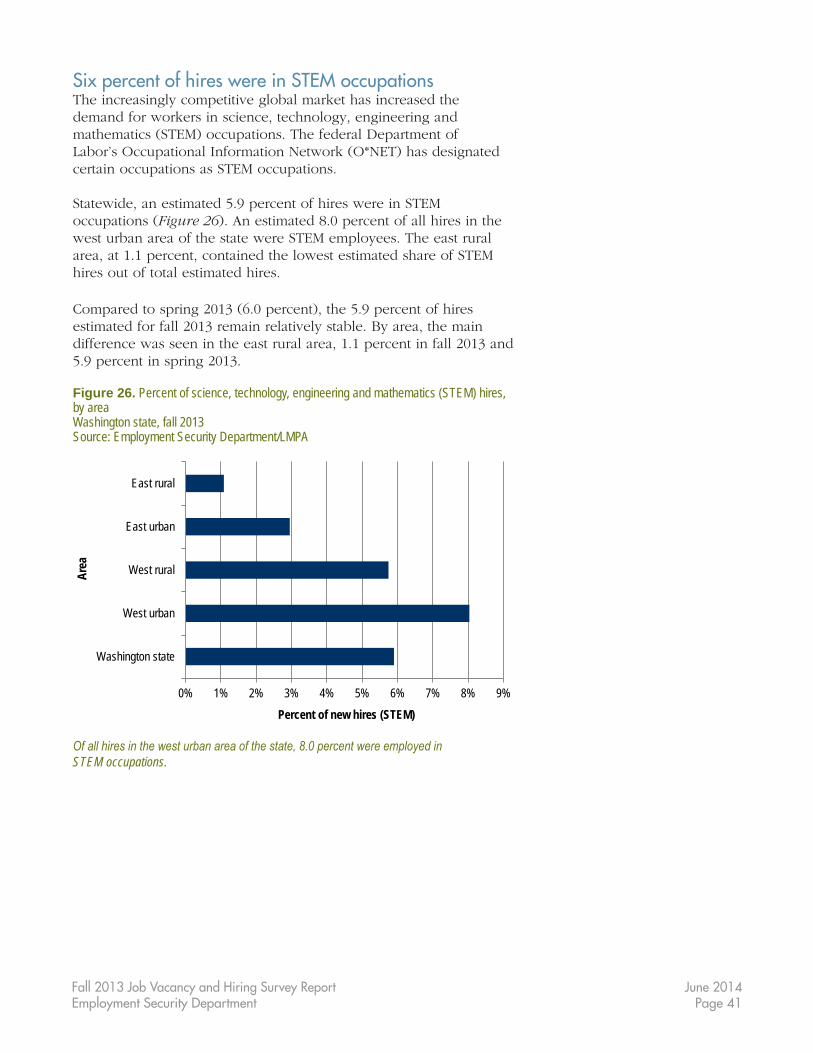
Six percent of hires were in STEM occupations The increasingly competitive global market has increased the demand for workers in science, technology, engineering and mathematics(STEM)occupations.ThefederalDepartmentofLabor’sOccupationalInformationNetwork(O*NET)hasdesignatedcertain occupations as STEM occupations.
Statewide, an estimated 5.9 percent of hires were in STEM occupations(Figure 26).Anestimated8.0percentofallhiresinthewest urban area of the state were STEM employees. The east rural area, at 1.1 percent, contained the lowest estimated share of STEM hires out of total estimated hires.
Comparedtospring2013(6.0percent),the5.9percentofhiresestimated for fall 2013 remain relatively stable. By area, the main difference was seen in the east rural area, 1.1 percent in fall 2013 and 5.9 percent in spring 2013.
Figure 26. Percent of science, technology, engineering and mathematics (STEM) hires, by area Washington state, fall 2013Source: Employment Security Department/LMPA
0% 1% 2% 3% 4% 5% 6% 7% 8% 9%
Washington state
West urban
West rural
East urban
East rural
Percent of new hires (STEM)
Area
Of all hires in the west urban area of the state, 8.0 percent were employed in STEM occupations.
June 2014Page 42
Fall 2013 Job Vacancy and Hiring Survey ReportEmployment Security Department
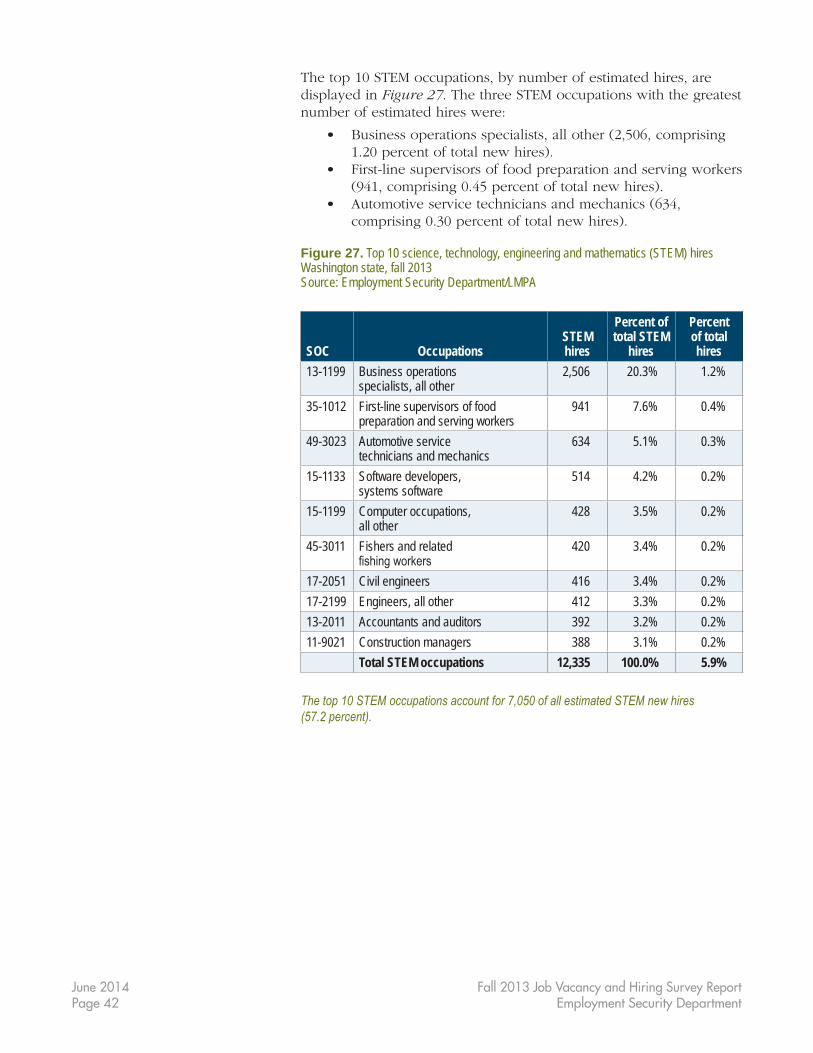
The top 10 STEM occupations, by number of estimated hires, are displayed in Figure 27. The three STEM occupations with the greatest number of estimated hires were:
• Businessoperationsspecialists,allother(2,506,comprising1.20percentoftotalnewhires).
• First-linesupervisorsoffoodpreparationandservingworkers(941,comprising0.45percentoftotalnewhires).
• Automotiveservicetechniciansandmechanics(634,comprising0.30percentoftotalnewhires).
Figure 27. Top 10 science, technology, engineering and mathematics (STEM) hires Washington state, fall 2013Source: Employment Security Department/LMPA
SOC OccupationsSTEMhires
Percent of total STEM
hires
Percent of totalhires
13-1199 Business operations specialists, all other
2,506 20.3% 1.2%
35-1012 First-line supervisors of food preparation and serving workers
941 7.6% 0.4%
49-3023 Automotive service technicians and mechanics
634 5.1% 0.3%
15-1133 Software developers, systems software
514 4.2% 0.2%
15-1199 Computer occupations, all other
428 3.5% 0.2%
45-3011 Fishers and related fishing workers
420 3.4% 0.2%
17-2051 Civil engineers 416 3.4% 0.2%17-2199 Engineers, all other 412 3.3% 0.2%13-2011 Accountants and auditors 392 3.2% 0.2%11-9021 Construction managers 388 3.1% 0.2% Total STEM occupations 12,335 100.0% 5.9%
The top 10 STEM occupations account for 7,050 of all estimated STEM new hires (57.2 percent).
June 2014Page 43
Fall 2013 Job Vacancy and Hiring Survey ReportEmployment Security Department
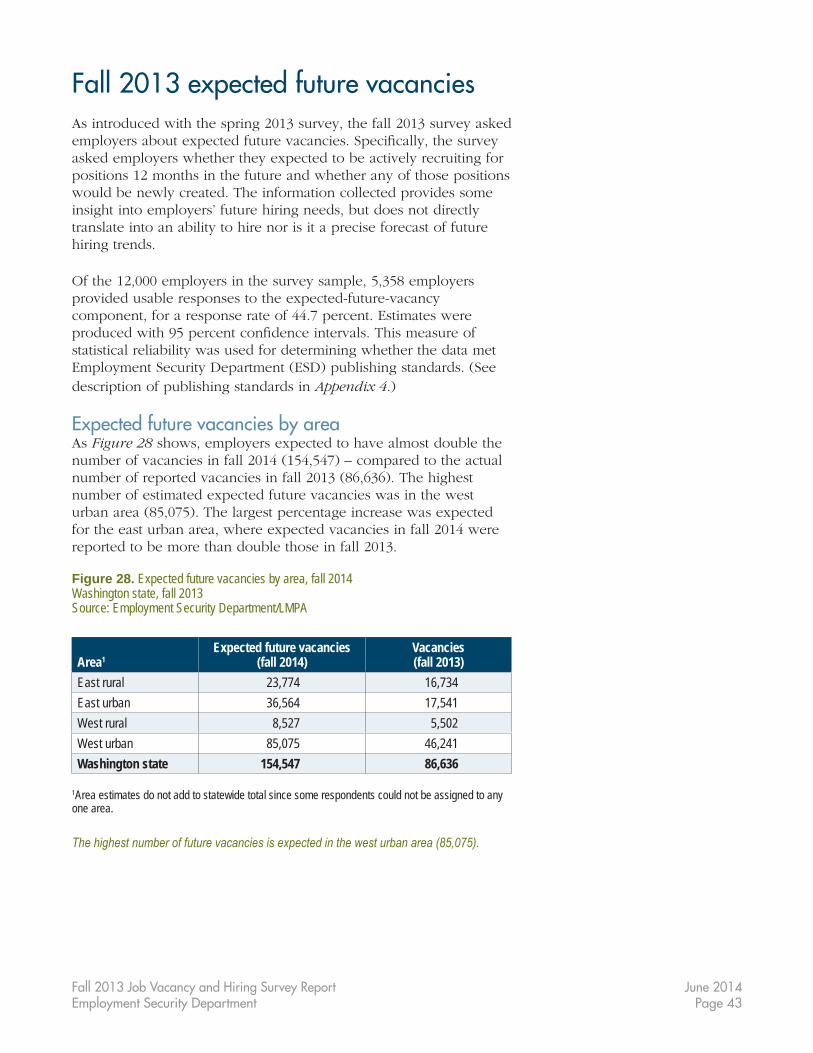
Fall 2013 expected future vacanciesAs introduced with the spring 2013 survey, the fall 2013 survey asked employersaboutexpectedfuturevacancies.Specifically,thesurveyasked employers whether they expected to be actively recruiting for positions 12 months in the future and whether any of those positions would be newly created. The information collected provides some insight into employers’ future hiring needs, but does not directly translate into an ability to hire nor is it a precise forecast of future hiring trends.
Of the 12,000 employers in the survey sample, 5,358 employers provided usable responses to the expected-future-vacancy component, for a response rate of 44.7 percent. Estimates were producedwith95percentconfidenceintervals.Thismeasureofstatistical reliability was used for determining whether the data met EmploymentSecurityDepartment(ESD)publishingstandards.(Seedescription of publishing standards in Appendix 4.)
Expected future vacancies by areaAs Figure 28 shows, employers expected to have almost double the numberofvacanciesinfall2014(154,547)–comparedtotheactualnumberofreportedvacanciesinfall2013(86,636).Thehighestnumber of estimated expected future vacancies was in the west urbanarea(85,075).Thelargestpercentageincreasewasexpectedfor the east urban area, where expected vacancies in fall 2014 were reported to be more than double those in fall 2013.
Figure 28. Expected future vacancies by area, fall 2014 Washington state, fall 2013Source: Employment Security Department/LMPA
Area1Expected future vacancies
(fall 2014) Vacancies(fall 2013)
East rural 23,774 16,734 East urban 36,564 17,541 West rural 8,527 5,502 West urban 85,075 46,241 Washington state 154,547 86,636
1Area estimates do not add to statewide total since some respondents could not be assigned to any one area.
The highest number of future vacancies is expected in the west urban area (85,075).
June 2014Page 44
Fall 2013 Job Vacancy and Hiring Survey ReportEmployment Security Department
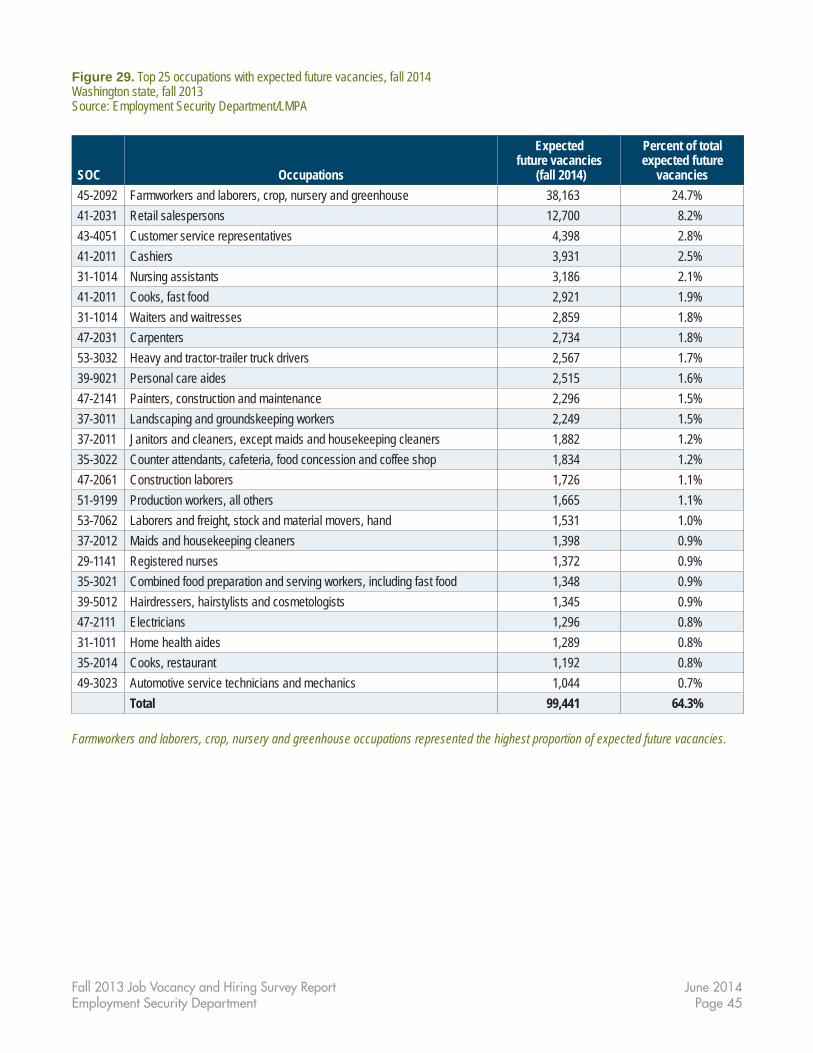
Top 25 occupations for expected future vacanciesEachjobtitlewasdefinedandcodedbasedontheStandardOccupationalClassification(SOC)system.TheU.S.BureauofLaborStatistics, other federal agencies and most state employment agencies also use SOC for occupation-based research and reporting.
Thetop25occupationsaccountedfor99,441(64.3percent)of the estimated 154,547 total expected future vacancies, as shown in Figure 29.
The top three occupations, by number of expected future vacancies, were:
• Farmworkersandlaborers,crop,nurseryandgreenhouseat38,163(24.7percentofthetotal).
• Retailsalespersonsat12,700(8.2percent).• Customerservicerepresentativesat4,398(2.8percent).
The top three occupations, by number of expected future vacancies, estimated from the spring 2013 results were similar. The only difference was laborers and freight, stock and material movers, hand(fall2013)wasinthetopthree,ratherthancustomerservicerepresentatives(spring2013).Thetopthreeoccupationsinfall2013accountedforalargershareoftotalexpectedfuturevacancies(35.7percent)thaninspring2013(26.4percent)
June 2014Page 45
Fall 2013 Job Vacancy and Hiring Survey ReportEmployment Security Department
Figure 29. Top 25 occupations with expected future vacancies, fall 2014 Washington state, fall 2013Source: Employment Security Department/LMPA
SOC Occupations
Expected future vacancies
(fall 2014)
Percent of total expected future
vacancies45-2092 Farmworkers and laborers, crop, nursery and greenhouse 38,163 24.7% 41-2031 Retail salespersons 12,700 8.2%43-4051 Customer service representatives 4,398 2.8%41-2011 Cashiers 3,931 2.5%31-1014 Nursing assistants 3,186 2.1%41-2011 Cooks, fast food 2,921 1.9%31-1014 Waiters and waitresses 2,859 1.8%47-2031 Carpenters 2,734 1.8%53-3032 Heavy and tractor-trailer truck drivers 2,567 1.7%39-9021 Personal care aides 2,515 1.6%47-2141 Painters, construction and maintenance 2,296 1.5%37-3011 Landscaping and groundskeeping workers 2,249 1.5%37-2011 Janitors and cleaners, except maids and housekeeping cleaners 1,882 1.2%35-3022 Counter attendants, cafeteria, food concession and coffee shop 1,834 1.2%47-2061 Construction laborers 1,726 1.1%51-9199 Production workers, all others 1,665 1.1%53-7062 Laborers and freight, stock and material movers, hand 1,531 1.0%37-2012 Maids and housekeeping cleaners 1,398 0.9%29-1141 Registered nurses 1,372 0.9%35-3021 Combined food preparation and serving workers, including fast food 1,348 0.9%39-5012 Hairdressers, hairstylists and cosmetologists 1,345 0.9%47-2111 Electricians 1,296 0.8%31-1011 Home health aides 1,289 0.8%35-2014 Cooks, restaurant 1,192 0.8%49-3023 Automotive service technicians and mechanics 1,044 0.7% Total 99,441 64.3%
Farmworkers and laborers, crop, nursery and greenhouse occupations represented the highest proportion of expected future vacancies.
June 2014Page 46
Fall 2013 Job Vacancy and Hiring Survey ReportEmployment Security Department
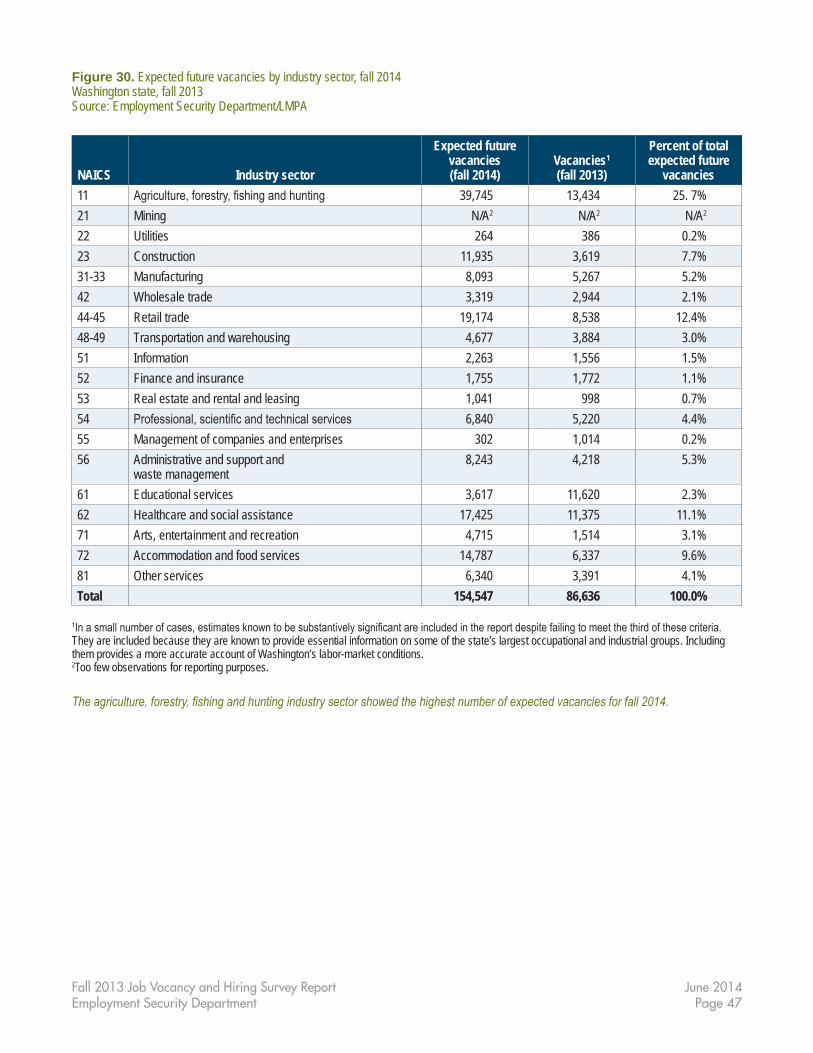
Agriculture, forestry, fishing and hunting show the largest number of industry sector expected future vacanciesEmployerswereclassifiedintoindustriesbasedontheNorthAmericanIndustryClassificationSystem(NAICS).TheU.S.BureauofLaborStatistics, other federal agencies and most state employment agencies useNAICSforindustry-basedresearchandreporting.
The top three industry sectors for number of expected future vacancies were:
• Agriculture,forestry,fishingandhuntingat39,745(25.7percentofthetotal).
• Retailtradeat19,174(12.4percent).• Healthcareandsocialassistanceat17,425(11.3percent).
These three industry sectors accounted for an estimated 49.4 percent of total expected future vacancies. At 39,745 vacancies, the agriculture, forestry,fishingandhuntingindustrysectorshowedthehighestnumberofexpectedvacanciesforfall2014(Figure 30).Withinthatsector, most of these expected vacancies were in agriculture, which experiencesfluctuatingemploymentbasedontheseasonalnatureofthis industry.
The estimated number of vacancies is expected to more than triple in two industry sectors: construction and arts, entertainment and recreation.
The top three industry sectors for expected future vacancies in spring2013wereagriculture,forestry,fishingandhunting(33,611);accommodationandfoodservices(19,879);andretailtrade(18,192).
June 2014Page 47
Fall 2013 Job Vacancy and Hiring Survey ReportEmployment Security Department
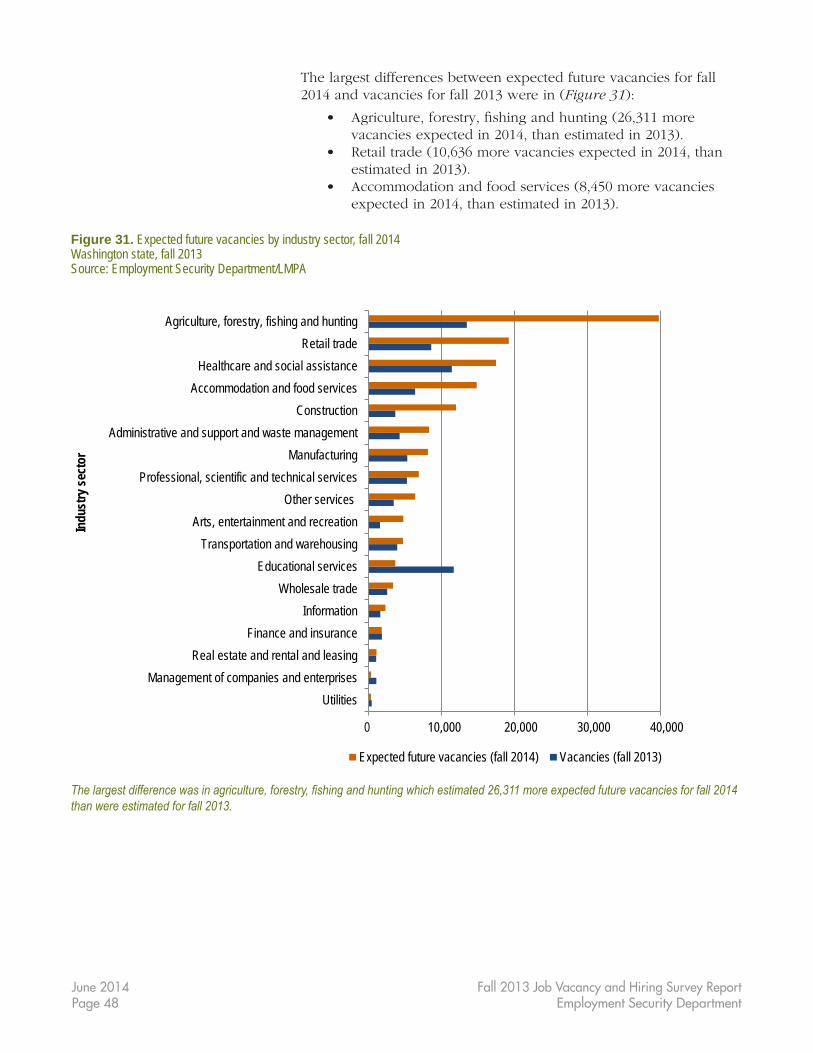
Figure 30. Expected future vacancies by industry sector, fall 2014 Washington state, fall 2013Source: Employment Security Department/LMPA
NAICS Industry sector
Expected futurevacancies (fall 2014)
Vacancies1
(fall 2013)
Percent of totalexpected future
vacancies11 Agriculture, forestry, fishing and hunting 39,745 13,434 25. 7%21 Mining N/A2 N/A2 N/A2
22 Utilities 264 386 0.2%23 Construction 11,935 3,619 7.7%31-33 Manufacturing 8,093 5,267 5.2%42 Wholesale trade 3,319 2,944 2.1%44-45 Retail trade 19,174 8,538 12.4%48-49 Transportation and warehousing 4,677 3,884 3.0%51 Information 2,263 1,556 1.5%52 Finance and insurance 1,755 1,772 1.1%53 Real estate and rental and leasing 1,041 998 0.7%54 Professional, scientific and technical services 6,840 5,220 4.4%55 Management of companies and enterprises 302 1,014 0.2% 56 Administrative and support and
waste management 8,243 4,218 5.3%
61 Educational services 3,617 11,620 2.3%62 Healthcare and social assistance 17,425 11,375 11.1%71 Arts, entertainment and recreation 4,715 1,514 3.1%72 Accommodation and food services 14,787 6,337 9.6%81 Other services 6,340 3,391 4.1%Total 154,547 86,636 100.0%
1In a small number of cases, estimates known to be substantively significant are included in the report despite failing to meet the third of these criteria. They are included because they are known to provide essential information on some of the state’s largest occupational and industrial groups. Including them provides a more accurate account of Washington’s labor-market conditions. 2Too few observations for reporting purposes.
The agriculture, forestry, fishing and hunting industry sector showed the highest number of expected vacancies for fall 2014.
June 2014Page 48
Fall 2013 Job Vacancy and Hiring Survey ReportEmployment Security Department
The largest differences between expected future vacancies for fall 2014andvacanciesforfall2013werein(Figure 31):
• Agriculture,forestry,fishingandhunting(26,311morevacanciesexpectedin2014,thanestimatedin2013).
• Retailtrade(10,636morevacanciesexpectedin2014,thanestimatedin2013).
• Accommodationandfoodservices(8,450morevacanciesexpectedin2014,thanestimatedin2013).
Figure 31. Expected future vacancies by industry sector, fall 2014 Washington state, fall 2013Source: Employment Security Department/LMPA
0 10,000 20,000 30,000 40,000
UtilitiesManagement of companies and enterprises
Real estate and rental and leasingFinance and insurance
InformationWholesale trade
Educational servicesTransportation and warehousing
Arts, entertainment and recreationOther services
Professional, scientific and technical servicesManufacturing
Administrative and support and waste managementConstruction
Accommodation and food servicesHealthcare and social assistance
Retail tradeAgriculture, forestry, fishing and hunting
Indu
stry
sect
or
Expected future vacancies (fall 2014) Vacancies (fall 2013)
The largest difference was in agriculture, forestry, fishing and hunting which estimated 26,311 more expected future vacancies for fall 2014 than were estimated for fall 2013.
June 2014Page 49
Fall 2013 Job Vacancy and Hiring Survey ReportEmployment Security Department
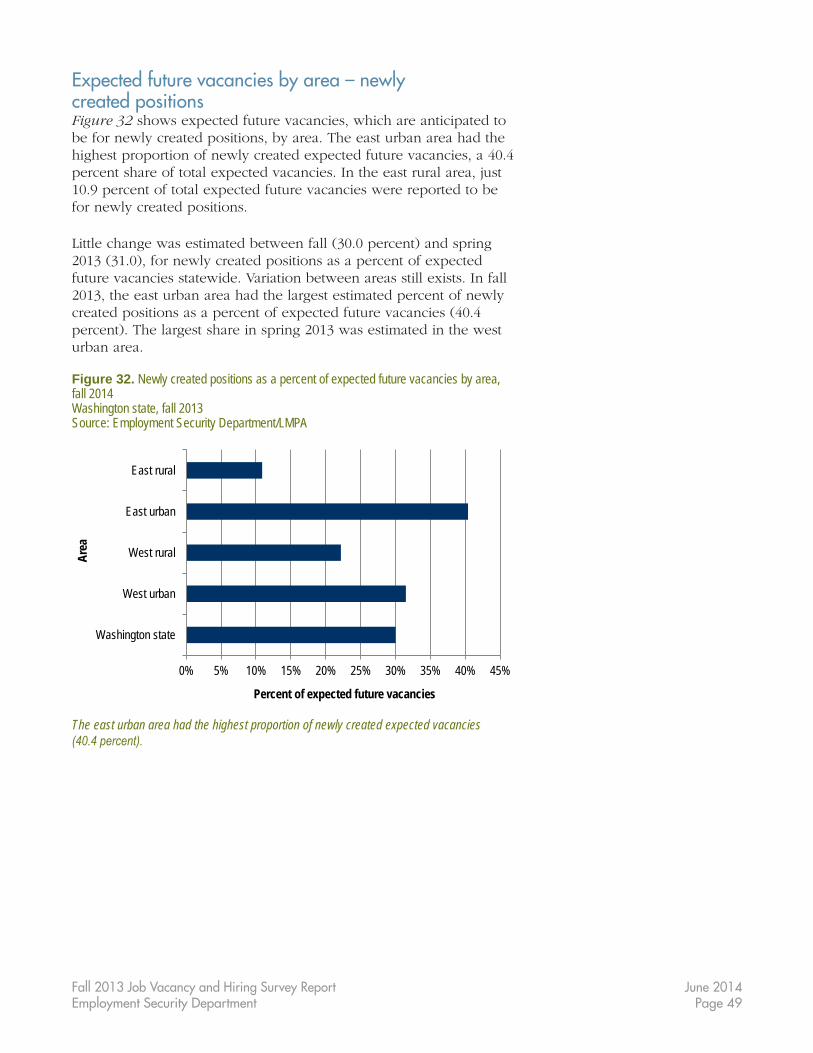
Expected future vacancies by area – newly created positionsFigure 32 shows expected future vacancies, which are anticipated to be for newly created positions, by area. The east urban area had the highest proportion of newly created expected future vacancies, a 40.4 percent share of total expected vacancies. In the east rural area, just 10.9 percent of total expected future vacancies were reported to be for newly created positions.
Littlechangewasestimatedbetweenfall(30.0percent)andspring2013(31.0),fornewlycreatedpositionsasapercentofexpectedfuturevacanciesstatewide.Variationbetweenareasstillexists.Infall2013, the east urban area had the largest estimated percent of newly createdpositionsasapercentofexpectedfuturevacancies(40.4percent).Thelargestshareinspring2013wasestimatedinthewesturban area.
Figure 32. Newly created positions as a percent of expected future vacancies by area, fall 2014Washington state, fall 2013Source: Employment Security Department/LMPA
0% 5% 10% 15% 20% 25% 30% 35% 40% 45%
Washington state
West urban
West rural
East urban
East rural
Percent of expected future vacancies
Area
The east urban area had the highest proportion of newly created expected vacancies (40.4 percent).
June 2014Page 50
Fall 2013 Job Vacancy and Hiring Survey ReportEmployment Security Department
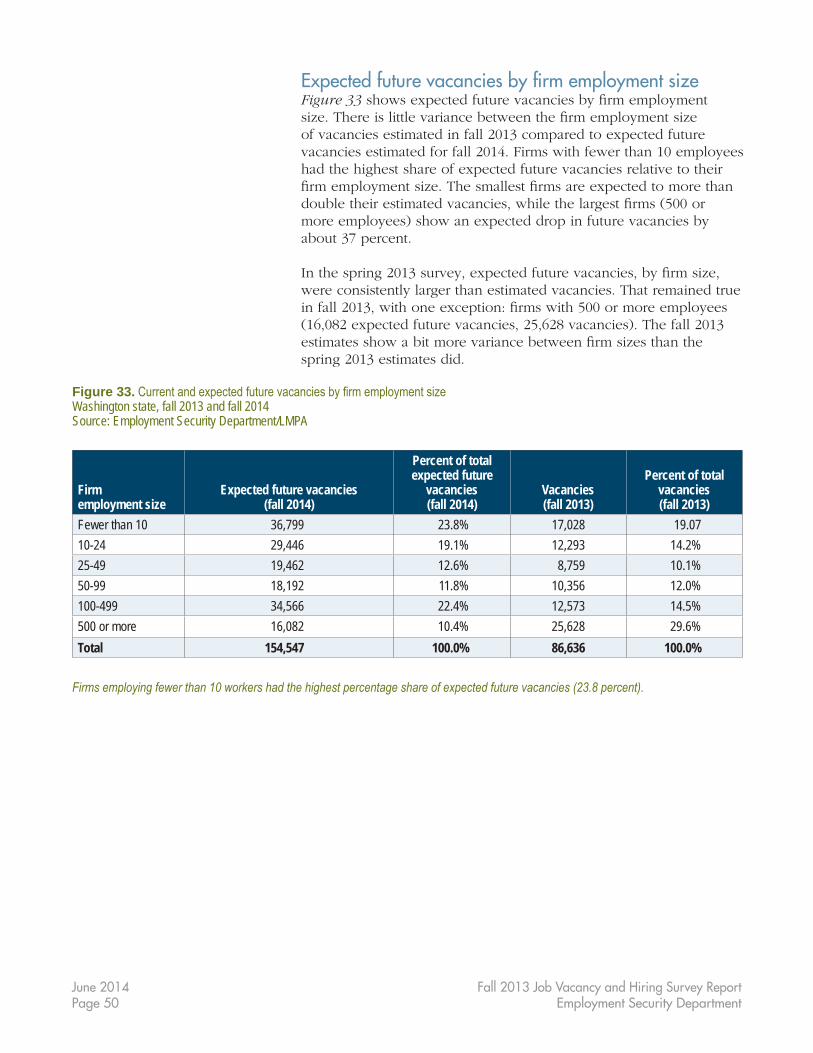
Expected future vacancies by firm employment sizeFigure 33showsexpectedfuturevacanciesbyfirmemploymentsize.Thereislittlevariancebetweenthefirmemploymentsizeof vacancies estimated in fall 2013 compared to expected future vacancies estimated for fall 2014. Firms with fewer than 10 employees had the highest share of expected future vacancies relative to their firmemploymentsize.Thesmallestfirmsareexpectedtomorethandoubletheirestimatedvacancies,whilethelargestfirms(500or moreemployees)showanexpecteddropinfuturevacanciesbyabout 37 percent.
Inthespring2013survey,expectedfuturevacancies,byfirmsize,were consistently larger than estimated vacancies. That remained true infall2013,withoneexception:firmswith500ormoreemployees(16,082expectedfuturevacancies,25,628vacancies).Thefall2013estimatesshowabitmorevariancebetweenfirmsizesthanthespring 2013 estimates did.
Figure 33. Current and expected future vacancies by firm employment size Washington state, fall 2013 and fall 2014Source: Employment Security Department/LMPA
Firm employment size
Expected future vacancies (fall 2014)
Percent of total expected future
vacancies (fall 2014)
Vacancies (fall 2013)
Percent of total vacancies (fall 2013)
Fewer than 10 36,799 23.8% 17,028 19.0710-24 29,446 19.1% 12,293 14.2%25-49 19,462 12.6% 8,759 10.1%50-99 18,192 11.8% 10,356 12.0%100-499 34,566 22.4% 12,573 14.5%500 or more 16,082 10.4% 25,628 29.6%Total 154,547 100.0% 86,636 100.0%
Firms employing fewer than 10 workers had the highest percentage share of expected future vacancies (23.8 percent).
June 2014Page 51
Fall 2013 Job Vacancy and Hiring Survey ReportEmployment Security Department
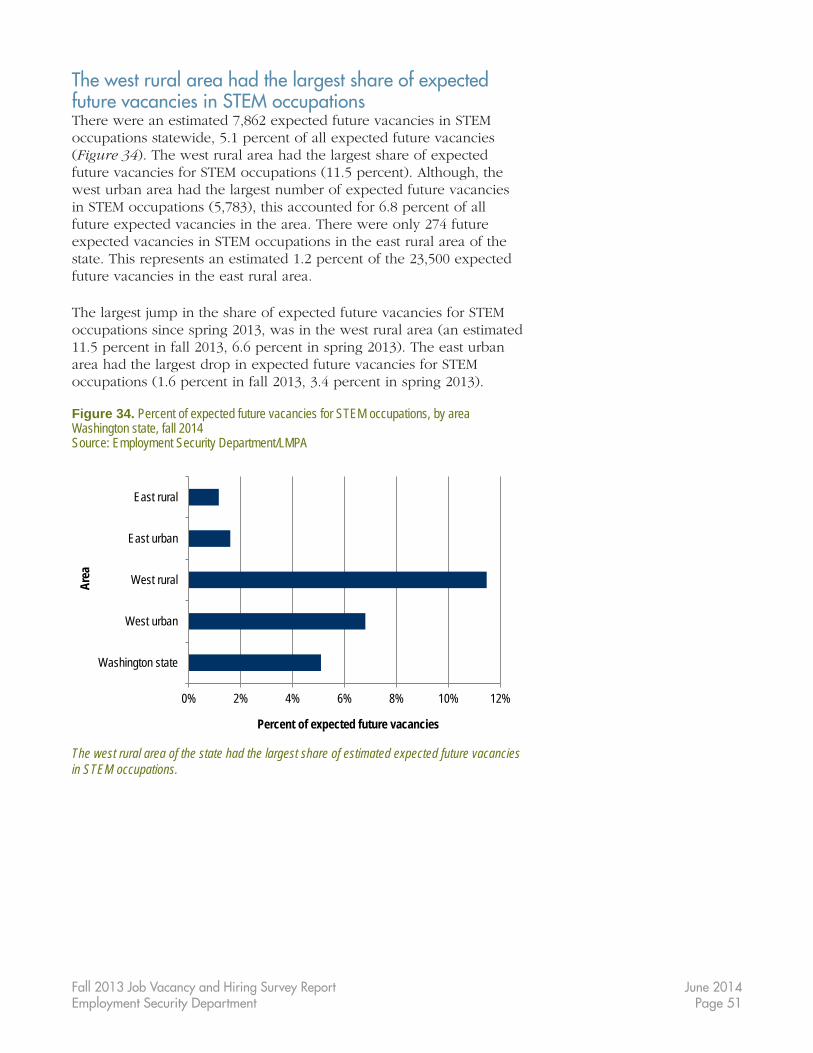
The west rural area had the largest share of expected future vacancies in STEM occupationsThere were an estimated 7,862 expected future vacancies in STEM occupations statewide, 5.1 percent of all expected future vacancies (Figure 34).ThewestruralareahadthelargestshareofexpectedfuturevacanciesforSTEMoccupations(11.5percent).Although,thewest urban area had the largest number of expected future vacancies inSTEMoccupations(5,783),thisaccountedfor6.8percentofallfuture expected vacancies in the area. There were only 274 future expected vacancies in STEM occupations in the east rural area of the state. This represents an estimated 1.2 percent of the 23,500 expected future vacancies in the east rural area.
The largest jump in the share of expected future vacancies for STEM occupationssincespring2013,wasinthewestruralarea(anestimated11.5percentinfall2013,6.6percentinspring2013).Theeasturbanarea had the largest drop in expected future vacancies for STEM occupations(1.6percentinfall2013,3.4percentinspring2013).
Figure 34. Percent of expected future vacancies for STEM occupations, by area Washington state, fall 2014Source: Employment Security Department/LMPA
0% 2% 4% 6% 8% 10% 12%
Washington state
West urban
West rural
East urban
East rural
Percent of expected future vacancies
Area
The west rural area of the state had the largest share of estimated expected future vacancies in STEM occupations.
June 2014Page 52
Fall 2013 Job Vacancy and Hiring Survey ReportEmployment Security Department
The three STEM occupations with the most expected future vacancies were:
• Automotiveservicetechniciansandmechanics(1,044,comprising0.68percentoftotalexpectedfuturevacancies).
• Businessoperationsspecialists,allother(447,comprising0.29percentoftotalexpectedfuturevacancies).
• Engineers,allother(387,comprising0.25percentoftotalexpectedfuturevacancies).
Engineers,allothers(fall2013)andsoftwaredevelopers(spring2013)weretheonlytopthreedifferencesforSTEMoccupationswith the most expected future vacancies. The top three in spring 2013werebusinessoperationsspecialists,allother(804,comprising0.94percent),automotiveservicetechniciansandmechanics(742,comprising0.87percent)andsoftwaredevelopers(713,comprising0.83percent).
June 2014Page 53
Fall 2013 Job Vacancy and Hiring Survey ReportEmployment Security Department
Hazard ratios: the relative likelihood of job vacancies and hires being filled in a given time periodHazardratiosareusedtoestimatetherelativelikelihoodoftheoccurrenceofaneventoversomeperiodoftime.Hazardratiosareexpressedasfollows:oneoftheeventsbeinganalyzedisassignedavalueof1(thebasereferencevalue)andothereventsareexpressedasmultiplesof1.Thus,aneventwithahazardratioof1.5isthreetimes more likely to occur over a given period of time than an event withahazardratioof0.5.
Inthisanalysis,wecomparedtherelativelikelihoodoffillingajobvacancyamongdifferentareas,occupations,industriesandfirmsizes.Tocalculatethehazardratio,wecombinedtheresultsrelatingtoduration from the job-vacancy and hiring components of the survey. Thehazardratiowasmeasuredfromtheperspectiveoftheemployerrather than the employee and shows how relatively easy it was, in termsofagiventimeduration,tofillagivenposition.Themodelused in this study assumed that the ratios were constant over time.
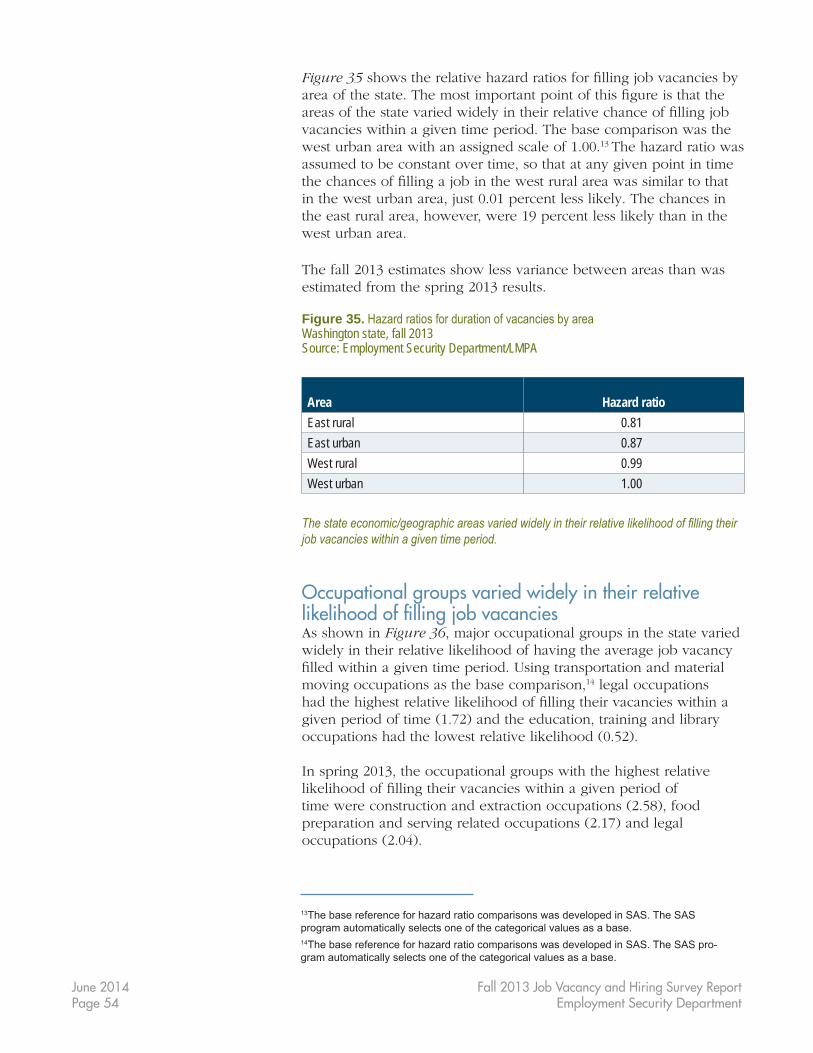
June 2014Page 54
Fall 2013 Job Vacancy and Hiring Survey ReportEmployment Security Department
Figure 35showstherelativehazardratiosforfillingjobvacanciesbyareaofthestate.Themostimportantpointofthisfigureisthattheareasofthestatevariedwidelyintheirrelativechanceoffillingjobvacancies within a given time period. The base comparison was the west urban area with an assigned scale of 1.00.13 Thehazardratiowasassumed to be constant over time, so that at any given point in time thechancesoffillingajobinthewestruralareawassimilartothatin the west urban area, just 0.01 percent less likely. The chances in the east rural area, however, were 19 percent less likely than in the west urban area.
The fall 2013 estimates show less variance between areas than was estimated from the spring 2013 results.
Figure 35. Hazard ratios for duration of vacancies by area Washington state, fall 2013Source: Employment Security Department/LMPA
Area Hazard ratioEast rural 0.81East urban 0.87West rural 0.99West urban 1.00
The state economic/geographic areas varied widely in their relative likelihood of filling their job vacancies within a given time period.
Occupational groups varied widely in their relative likelihood of filling job vacanciesAs shown in Figure 36, major occupational groups in the state varied widely in their relative likelihood of having the average job vacancy filledwithinagiventimeperiod.Usingtransportationandmaterialmoving occupations as the base comparison,14 legal occupations hadthehighestrelativelikelihoodoffillingtheirvacancieswithinagivenperiodoftime(1.72)andtheeducation,trainingandlibraryoccupationshadthelowestrelativelikelihood(0.52).
In spring 2013, the occupational groups with the highest relative likelihoodoffillingtheirvacancieswithinagivenperiodoftimewereconstructionandextractionoccupations(2.58),foodpreparationandservingrelatedoccupations(2.17)andlegaloccupations(2.04).
13The base reference for hazard ratio comparisons was developed in SAS. The SAS program automatically selects one of the categorical values as a base. 14The base reference for hazard ratio comparisons was developed in SAS. The SAS pro-gram automatically selects one of the categorical values as a base.

June 2014Page 55
Fall 2013 Job Vacancy and Hiring Survey ReportEmployment Security Department
Figure 36. Hazard ratios for duration of vacancies by occupational group Washington state, fall 2013Source: Employment Security Department/LMPA
SOC Major occupational group Hazard ratio11 Management 0.7813 Business and financial operations 0.6315 Computer and mathematical 0.5817 Architecture and engineering 0.6319 Life, physical and social science 0.8321 Community and social services 0.7223 Legal 1.7225 Education, training and library 0.5227 Arts, design, entertainment, sports and media 1.0229 Healthcare practitioners and technical 0.6931 Healthcare support 0.8433 Protective service 1.6735 Food preparation and serving related 0.9537 Building and grounds cleaning and maintenance 1.0439 Personal care and service 0.7441 Sales and related 1.0543 Office and administrative support 0.8745 Farming, fishing and forestry 0.8247 Construction and extraction 1.0949 Installation, maintenance and repair 0.9151 Production 1.2653 Transportation and material moving 1.00
Legal occupations had the highest relative likelihood of filling their vacancies within a given period of time.
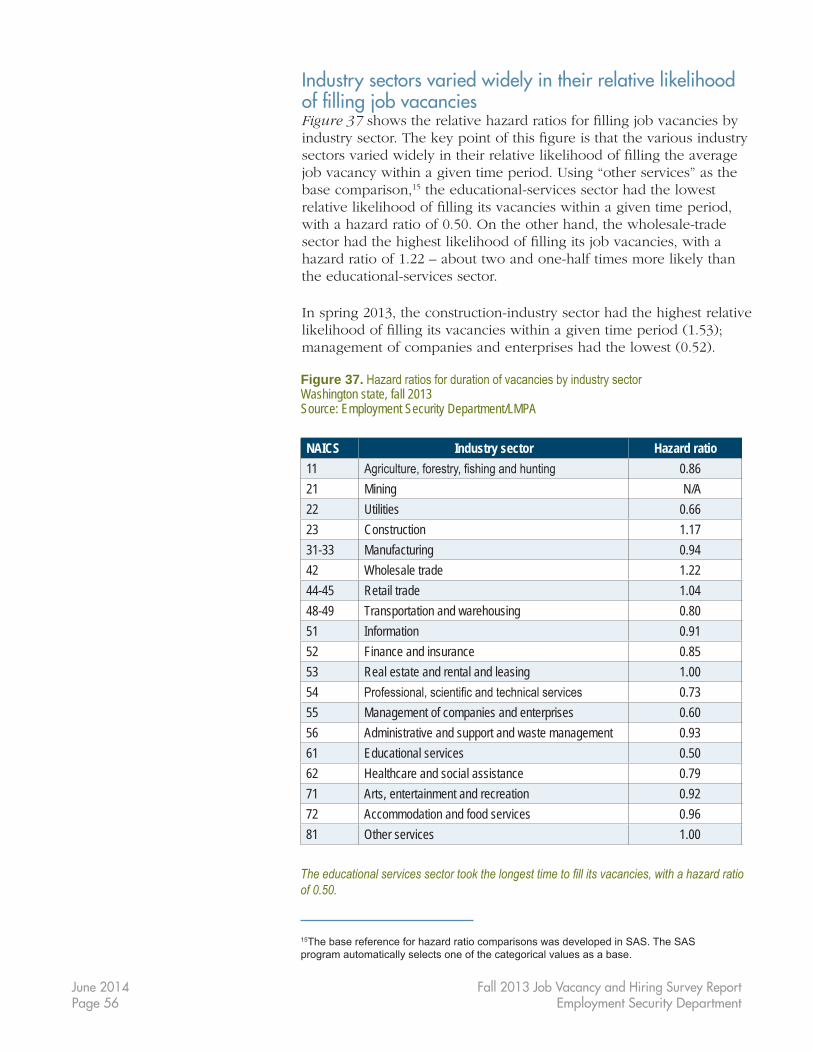
June 2014Page 56
Fall 2013 Job Vacancy and Hiring Survey ReportEmployment Security Department
Industry sectors varied widely in their relative likelihood of filling job vacanciesFigure 37showstherelativehazardratiosforfillingjobvacanciesbyindustrysector.Thekeypointofthisfigureisthatthevariousindustrysectorsvariedwidelyintheirrelativelikelihoodoffillingtheaveragejobvacancywithinagiventimeperiod.Using“otherservices”asthebase comparison,15 the educational-services sector had the lowest relativelikelihoodoffillingitsvacancieswithinagiventimeperiod,withahazardratioof0.50.Ontheotherhand,thewholesale-tradesectorhadthehighestlikelihoodoffillingitsjobvacancies,withahazardratioof1.22–abouttwoandone-halftimesmorelikelythanthe educational-services sector.
In spring 2013, the construction-industry sector had the highest relative likelihoodoffillingitsvacancieswithinagiventimeperiod(1.53);managementofcompaniesandenterpriseshadthelowest(0.52).
Figure 37. Hazard ratios for duration of vacancies by industry sector Washington state, fall 2013Source: Employment Security Department/LMPA
NAICS Industry sector Hazard ratio11 Agriculture, forestry, fishing and hunting 0.8621 Mining N/A22 Utilities 0.6623 Construction 1.1731-33 Manufacturing 0.9442 Wholesale trade 1.2244-45 Retail trade 1.0448-49 Transportation and warehousing 0.8051 Information 0.9152 Finance and insurance 0.8553 Real estate and rental and leasing 1.0054 Professional, scientific and technical services 0.7355 Management of companies and enterprises 0.6056 Administrative and support and waste management 0.9361 Educational services 0.5062 Healthcare and social assistance 0.7971 Arts, entertainment and recreation 0.9272 Accommodation and food services 0.9681 Other services 1.00
The educational services sector took the longest time to fill its vacancies, with a hazard ratio of 0.50.
15The base reference for hazard ratio comparisons was developed in SAS. The SAS program automatically selects one of the categorical values as a base.
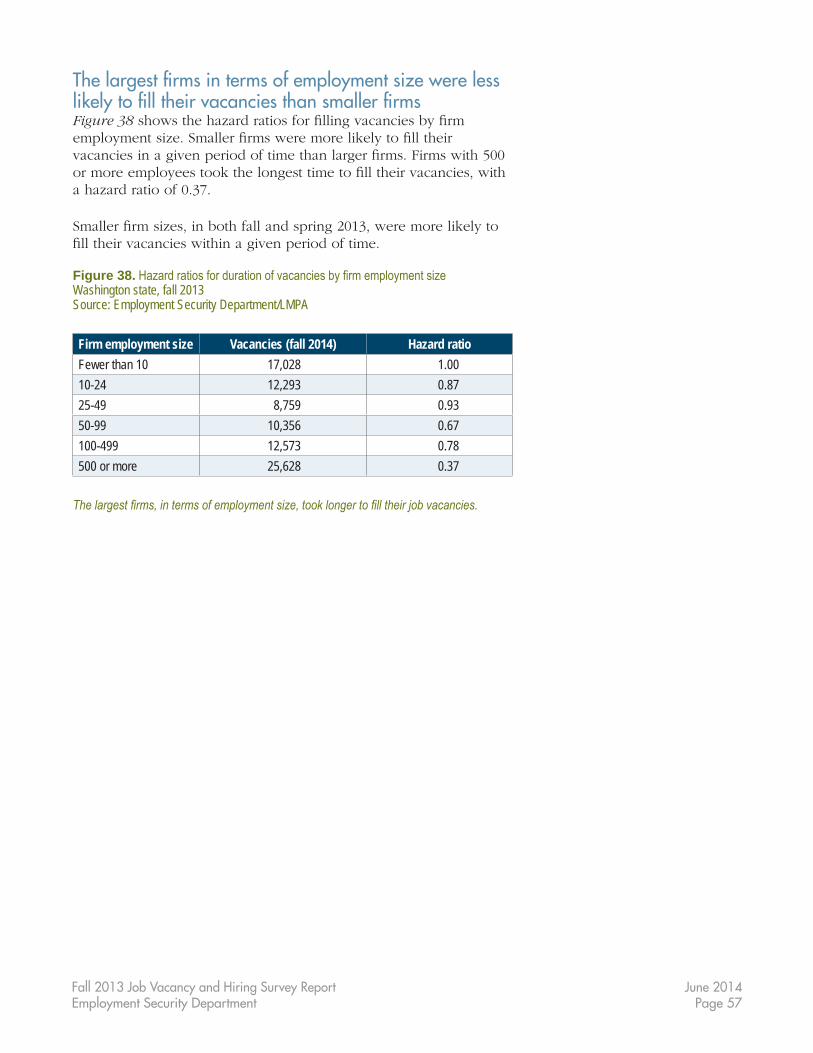
June 2014Page 57
Fall 2013 Job Vacancy and Hiring Survey ReportEmployment Security Department
The largest firms in terms of employment size were less likely to fill their vacancies than smaller firmsFigure 38showsthehazardratiosforfillingvacanciesbyfirmemploymentsize.Smallerfirmsweremorelikelytofilltheirvacanciesinagivenperiodoftimethanlargerfirms.Firmswith500ormoreemployeestookthelongesttimetofilltheirvacancies,withahazardratioof0.37.
Smallerfirmsizes,inbothfallandspring2013,weremorelikelytofilltheirvacancieswithinagivenperiodoftime.
Figure 38. Hazard ratios for duration of vacancies by firm employment size Washington state, fall 2013Source: Employment Security Department/LMPA
Firm employment size Vacancies (fall 2014) Hazard ratioFewer than 10 17,028 1.0010-24 12,293 0.8725-49 8,759 0.9350-99 10,356 0.67100-499 12,573 0.78500 or more 25,628 0.37
The largest firms, in terms of employment size, took longer to fill their job vacancies.

June 2014Page 58
Fall 2013 Job Vacancy and Hiring Survey ReportEmployment Security Department
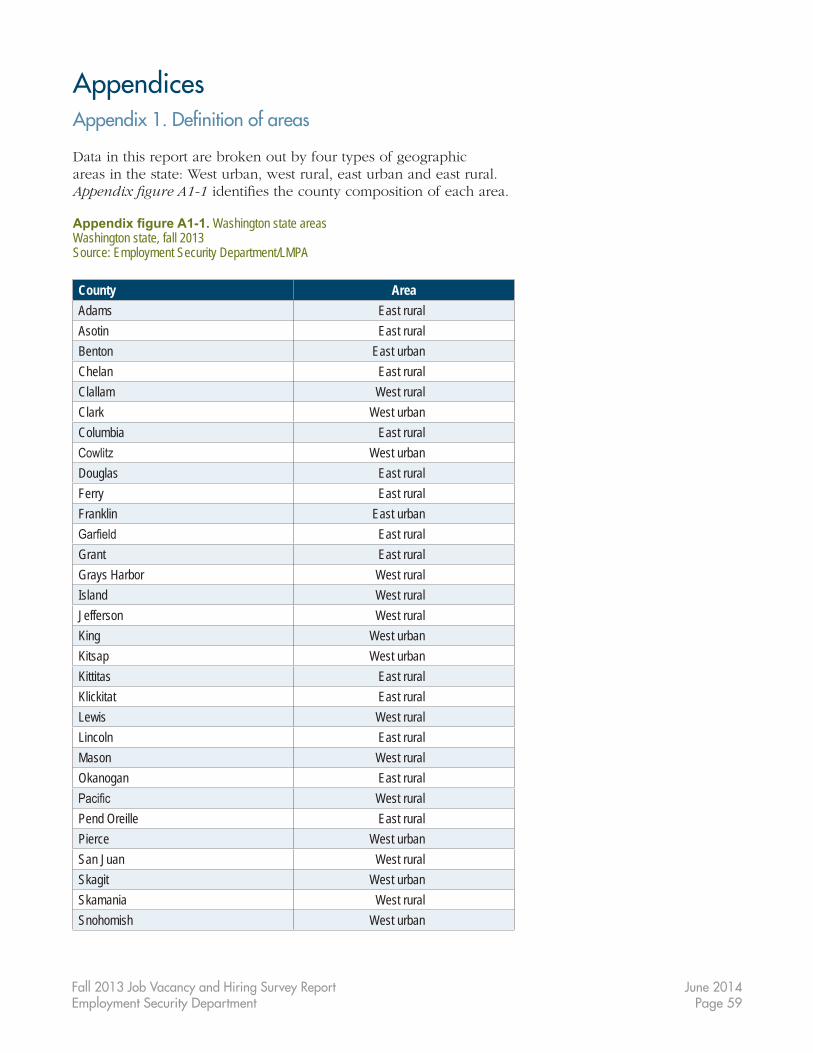
June 2014Page 59
Fall 2013 Job Vacancy and Hiring Survey ReportEmployment Security Department
AppendicesAppendix 1. Definition of areas
Data in this report are broken out by four types of geographic areas in the state: West urban, west rural, east urban and east rural. Appendix figure A1-1identifiesthecountycompositionofeacharea.
Appendix figure A1-1. Washington state areasWashington state, fall 2013Source: Employment Security Department/LMPA
County AreaAdams East ruralAsotin East ruralBenton East urbanChelan East ruralClallam West ruralClark West urbanColumbia East ruralCowlitz West urbanDouglas East ruralFerry East ruralFranklin East urbanGarfield East ruralGrant East ruralGrays Harbor West ruralIsland West ruralJefferson West ruralKing West urbanKitsap West urbanKittitas East ruralKlickitat East ruralLewis West ruralLincoln East ruralMason West ruralOkanogan East ruralPacific West ruralPend Oreille East ruralPierce West urbanSan Juan West ruralSkagit West urbanSkamania West ruralSnohomish West urban

June 2014Page 60
Fall 2013 Job Vacancy and Hiring Survey ReportEmployment Security Department
County AreaSpokane East urbanStevens East ruralThurston West urbanWahkiakum West ruralWalla Walla East ruralWhatcom West urbanWhitman East ruralYakima East urban
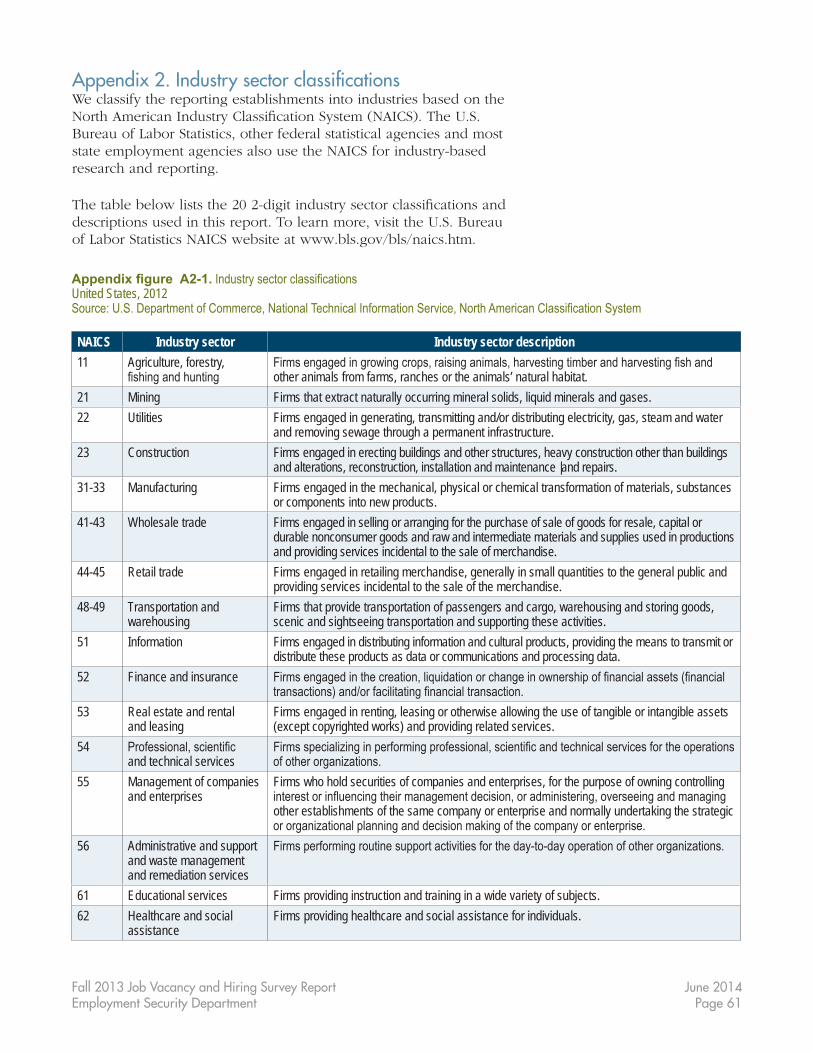
June 2014Page 61
Fall 2013 Job Vacancy and Hiring Survey ReportEmployment Security Department
Appendix 2. Industry sector classificationsWe classify the reporting establishments into industries based on the NorthAmericanIndustryClassificationSystem(NAICS).TheU.S.Bureau of Labor Statistics, other federal statistical agencies and most stateemploymentagenciesalsousetheNAICSforindustry-basedresearch and reporting.
Thetablebelowliststhe202-digitindustrysectorclassificationsanddescriptionsusedinthisreport.Tolearnmore,visittheU.S.BureauofLaborStatisticsNAICSwebsiteatwww.bls.gov/bls/naics.htm.
Appendix figure A2-1. Industry sector classificationsUnited States, 2012Source: U.S. Department of Commerce, National Technical Information Service, North American Classification System
NAICS Industry sector Industry sector description11 Agriculture, forestry,
fishing and huntingFirms engaged in growing crops, raising animals, harvesting timber and harvesting fish and other animals from farms, ranches or the animals’ natural habitat.
21 Mining Firms that extract naturally occurring mineral solids, liquid minerals and gases.22 Utilities Firms engaged in generating, transmitting and/or distributing electricity, gas, steam and water
and removing sewage through a permanent infrastructure.23 Construction Firms engaged in erecting buildings and other structures, heavy construction other than buildings
and alterations, reconstruction, installation and maintenance |and repairs.31-33 Manufacturing Firms engaged in the mechanical, physical or chemical transformation of materials, substances
or components into new products.41-43 Wholesale trade Firms engaged in selling or arranging for the purchase of sale of goods for resale, capital or
durable nonconsumer goods and raw and intermediate materials and supplies used in productions and providing services incidental to the sale of merchandise.
44-45 Retail trade Firms engaged in retailing merchandise, generally in small quantities to the general public and providing services incidental to the sale of the merchandise.
48-49 Transportation and warehousing
Firms that provide transportation of passengers and cargo, warehousing and storing goods, scenic and sightseeing transportation and supporting these activities.
51 Information Firms engaged in distributing information and cultural products, providing the means to transmit or distribute these products as data or communications and processing data.
52 Finance and insurance Firms engaged in the creation, liquidation or change in ownership of financial assets (financial transactions) and/or facilitating financial transaction.
53 Real estate and rental and leasing
Firms engaged in renting, leasing or otherwise allowing the use of tangible or intangible assets (except copyrighted works) and providing related services.
54 Professional, scientific and technical services
Firms specializing in performing professional, scientific and technical services for the operations of other organizations.
55 Management of companies and enterprises
Firms who hold securities of companies and enterprises, for the purpose of owning controlling interest or influencing their management decision, or administering, overseeing and managing other establishments of the same company or enterprise and normally undertaking the strategic or organizational planning and decision making of the company or enterprise.
56 Administrative and support and waste management and remediation services
Firms performing routine support activities for the day-to-day operation of other organizations.
61 Educational services Firms providing instruction and training in a wide variety of subjects.62 Healthcare and social
assistanceFirms providing healthcare and social assistance for individuals.

June 2014Page 62
Fall 2013 Job Vacancy and Hiring Survey ReportEmployment Security Department
NAICS Industry sector Industry sector description71 Arts, entertainment
and recreationFirms engaged in operating of facilities or providing services to meet varied cultural, entertainment and recreational interests of their patrons.
72 Accommodation and food services
Firms providing customers with lodging and/or preparing meals, snacks and beverages for immediate consumption.
81 Other services (except public administration)
Firms providing services not elsewhere specified, including repairs, religious activities, grant making, advocacy, laundry, personal care, healthcare and other personal services.
92* Public administration Federal, state and local government agencies that administer, oversee and manage public programs and have executive, legislative or judicial authority over other institutions in a given area.
*Public administration was excluded from the employer universe from which the survey sample was drawn and for which estimates were provided in this report.
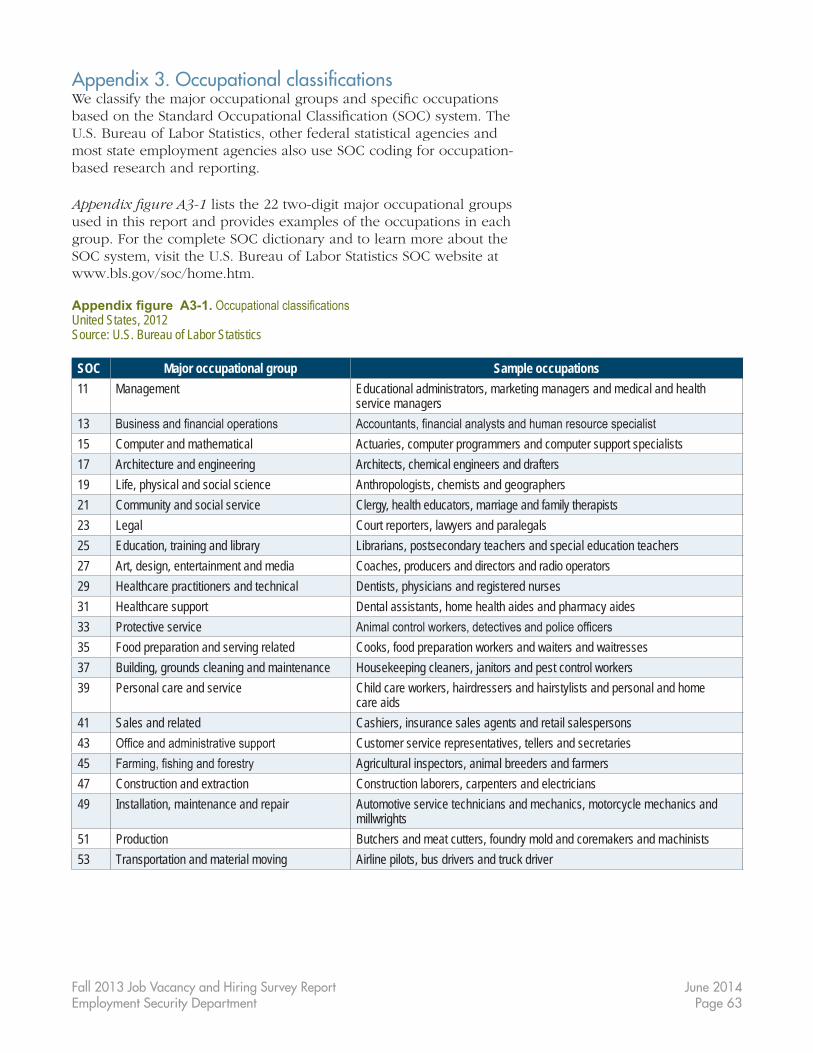
June 2014Page 63
Fall 2013 Job Vacancy and Hiring Survey ReportEmployment Security Department
Appendix 3. Occupational classificationsWeclassifythemajoroccupationalgroupsandspecificoccupationsbasedontheStandardOccupationalClassification(SOC)system.TheU.S.BureauofLaborStatistics,otherfederalstatisticalagenciesandmost state employment agencies also use SOC coding for occupation-based research and reporting.
Appendix figure A3-1 lists the 22 two-digit major occupational groups used in this report and provides examples of the occupations in each group. For the complete SOC dictionary and to learn more about the SOCsystem,visittheU.S.BureauofLaborStatisticsSOCwebsiteatwww.bls.gov/soc/home.htm.
Appendix figure A3-1. Occupational classificationsUnited States, 2012Source: U.S. Bureau of Labor Statistics
SOC Major occupational group Sample occupations11 Management Educational administrators, marketing managers and medical and health
service managers13 Business and financial operations Accountants, financial analysts and human resource specialist15 Computer and mathematical Actuaries, computer programmers and computer support specialists17 Architecture and engineering Architects, chemical engineers and drafters19 Life, physical and social science Anthropologists, chemists and geographers21 Community and social service Clergy, health educators, marriage and family therapists23 Legal Court reporters, lawyers and paralegals25 Education, training and library Librarians, postsecondary teachers and special education teachers27 Art, design, entertainment and media Coaches, producers and directors and radio operators29 Healthcare practitioners and technical Dentists, physicians and registered nurses31 Healthcare support Dental assistants, home health aides and pharmacy aides33 Protective service Animal control workers, detectives and police officers35 Food preparation and serving related Cooks, food preparation workers and waiters and waitresses37 Building, grounds cleaning and maintenance Housekeeping cleaners, janitors and pest control workers39 Personal care and service Child care workers, hairdressers and hairstylists and personal and home
care aids41 Sales and related Cashiers, insurance sales agents and retail salespersons43 Office and administrative support Customer service representatives, tellers and secretaries45 Farming, fishing and forestry Agricultural inspectors, animal breeders and farmers47 Construction and extraction Construction laborers, carpenters and electricians49 Installation, maintenance and repair Automotive service technicians and mechanics, motorcycle mechanics and
millwrights51 Production Butchers and meat cutters, foundry mold and coremakers and machinists53 Transportation and material moving Airline pilots, bus drivers and truck driver
June 2014Page 64
Fall 2013 Job Vacancy and Hiring Survey ReportEmployment Security Department
Appendix 4. Survey methodology and response rate
ApproachThe job vacancy and hiring survey is a bi-annual survey conducted by the Employment Security Department each spring and fall. Washington employers were surveyed to collect information about their current job vacancies, expected future vacancies and hires. Beginning in 2012, there were two components of this survey:
• Jobvacancies.• Recenthires.
Arecenthirewasdefinedasanynewexternalhireandexcludedinternalpromotions(evenfornewlycreatedpositions).Then,in spring 2013, a third component was added: expected future vacancies 12 months from the date surveyed.
Since the current vacancy, expected-future-vacancy and hiring components used the same base sample, the initial sampling weights used to adjust the sample statistics to the population measures were the same.
The three components of the fall 2013 survey were treated separately becausethequestionsrelevanttoeachsection(currentvacancies,expectedfuturevacanciesandhires)werenotansweredbyallrespondentsinthesample(of12,000forfall2013).Forexample,some employers answered the questions concerning vacant positions but did not answer the questions in the hiring component. As a result, the response for each set of variables was different for the three components. This is why the estimated relative shares for different variables cannot be directly compared. Sample DesignThesurveyisascientificunstratifiedsampledrawnbyusingtheprobabilityofselectionproportionaltosize(PPS)withoutreplacementmethod.TheofficialsourceforthissampleistheEnhanced Quarterly Unemployment Insurance(EQUI)fileforsecond-quarter 2013, with the sample drawn by establishment unemployment-insurance account and the accompanying address.TheEQUIfilecontainsallemploymentcoveredbytheunemployment-insurance system for Washington state. Since individual locations were used, primary accounts were removed. Private households and all public administration establishments wereremovedfromtheEQUIfile,creatingthepopulationthatwas used for this survey. From this population, a sample of 12,000 establishments was selected to be contacted. The total employment referenced in this report is the employment of the sampleweightedtoreflectthetotalpopulationfromwhichitwasdrawn. The estimated shares in total employment were based on weightsadjustedbyclasssizes.Consequently,exceptforclasssizes,
June 2014Page 65
Fall 2013 Job Vacancy and Hiring Survey ReportEmployment Security Department
multiplying these weights by total covered employment would notproducetheuniverseforthedomainsusedinthetables(forindustriesandareas).SeeAppendix 5 for more information.
ResponseThe sample frame consisted of 12,000 establishments in Washington state. The vacancy component received 5,789 usable responses, for a response rate of 48.2 percent. The expected-future-vacancy component received 5,358 usable responses, for a response rate of 44.7 percent. The hiring component received 5,729 usable responses, for a response rate of 47.7 percent. Estimates are available with95percentconfidenceinterval.Inthisreport,confidenceintervals were used to determine which cells to report and which weretobesuppressedforpublication.(Seefurtherdiscussionofpublishingstandards.) Comparability Results of the fall 2013 survey can be compared to the spring 2013, fall 2012 and spring 2012 surveys, but not to prior years’ surveys due to changes in methodology. Comparisons cannot be made to past surveys for three reasons. First, past estimations were based on data collected from online sources. This method has largely been replaced with more interactive data-collection methods. Second, the weighting method used for the surveys beginning with spring 2012hasbeenenhanced,takingfirmemploymentsizeintoaccountfor non-response adjustments. Third, for surveys prior to 2012, the samplewasstratifiedbyworkforcedevelopmentarea(WDA).Thisimposedsignificanterrorontheestimatedstatewidevaluesthatwereestimatedbythisstratifiedsample.Beginningwiththe2012survey,anun-stratifiedsamplewascreated,whichallowsestimationstobemade at the state level with far greater accuracy. In turn, this un-stratifiedsamplechangedthenatureofareaestimations. GeographyBeginningin2012,thesurveygroupedcountiesintofoureconomic/geographical areas: east urban, east rural, west urban and west rural. EastandwestweredefinedbytheCascadeRangeasadivide.Urbanandruralweredefinedbasedonpopulation.Countiesthatcontainedacitywithapopulationgreaterthan35,000weredefinedasurban.Allothercountiesweredefinedasrural.SeeAppendix Figure A1-1 for a list of counties and their type of geographic area designations.
June 2014Page 66
Fall 2013 Job Vacancy and Hiring Survey ReportEmployment Security Department
Publishing standardsFor an estimate to be publishable, it had to pass three criteria:
• Thenumberofrespondentsinanygivencellhadtobeatleast four.
• Thecoefficientofvariationhadtobelessthan50percent.• Thelowerlimitofthe95percentconfidenceintervalhadto
begreaterthanzero.
In a small number of cases, estimates known to be substantively significantareincludedinthereportdespitefailingtomeetthethird of these criteria. They are included because they are known to provide essential information on some of the state’s largest occupational and industrial groups. Including them provides a more accurate account of Washington’s labor-market conditions.
To clarify: consider agriculture, which reports the largest number of job vacancies among all industries. Taking into account the number of respondents and the variation in vacancies among them, a95percentconfidenceintervalaroundtheestimatednumberofvacanciesincludeszero.Yetweknowthatthenumberofvacanciesin agriculture is large. A similar logic lies behind the publication of relatedfiguresnotedinthetextandtables.Theproperinterpretationofsuchfiguresisthat,thoughtheyarelarge,estimatesofthemareuncertain.Thiswasnotthefirsttimesomeoftheseoccupationsfailedtomeetpublicationstandards.However,thiswasthefirsttimesuppressingspecificoccupationshadsuchaneffect.
June 2014Page 67
Fall 2013 Job Vacancy and Hiring Survey ReportEmployment Security Department
Appendix 5. Technical notes
Sample selectionSAS software was used for sample selection and estimations.
Thesamplewasnotstratified.Thesizeofeachprimarysamplingunit(PSU)wasdefinedbytheaveragetotalcoveredemploymentinsecond-quarter2012.Oncefirmemploymentsizewasdetermined,thedefaultselectionmethodwasused–theprobabilityofselectionproportionaltosize(PPS)withoutreplacement.Thismethodismorecomplex than selection with replacement, but provides the ability to produceestimationsthataremoreaccurate.UnderthePPSmethodofsample selection without options, the probability of selection for each unit is equal to:
(Unit size) x (number of units in sample)/total sample size. A “certainty” option was applied by an iteration, which provided a smooth transition of probabilities from sample units with a certainty of selectiontotheselectionofthosefirmswiththenextlargestfirmsize.After13iterations,thefirmsizethatdeterminedPPSwithcertainty(aprobabilityofselectionequalto1.0)wascalculatedtobethosefirmshaving 241 or more employees.
Toavoidextremeweightsforsmallunits,aMINSIZEoptionwasapplied,whichinterpretedeachsamplingunitofsizelessthanMINSIZEasequaltotheMINSIZEvalueforPPSselection.TheMINSIZEwasdeterminedtobeafirmwith10employees,whichallows limiting the maximum initial weight to 24.1. Weighting adjustmentsBeginning with 2012, the weight adjustments for the survey wereenhanced,takingthesizeoffirmintoaccountfornon- response adjustments.
To account for missing values due to non-responses and invalid responses,eachclasssizewasassumedtohavethesamedistributionastherespondentsintheprimarysampleunit(PSU)withvalidresponses. Primary weights were adjusted for missing values based onthisassumptionandthefinalweightsusedforthepopulationestimates were then calculated.
June 2014Page 68
Fall 2013 Job Vacancy and Hiring Survey ReportEmployment Security Department
Survey estimationsSincethesamplewasnotstratified,allestimatesofvariance(exceptformedianwagerates)wereproducedusingtheDOMAINstatementSURVEYMEANSprocedure(PROCSURVEYMEANS)inSAS.
“The DOMAIN statement names the variables that identifydomains, which are called domain variables. It is common practice to compute statistics for domains. The formation of these domains might be unrelated to the sample design. Therefore, thesamplesizesforthedomainsarerandomvariables.Inorderto incorporate this variability into the variance estimations, you shoulduseaDOMAINstatement.”16
The estimated shares in total employment are based on weights adjustedbyfirmemploymentsize.Exceptforfirmsize,multiplyingthese weights by total covered employment would not produce the sameuniverseforthedomainsusedinfigures(industriesandareas).Consequently, for each industry sector and area, multiplying the initialuniverse(QuarterlyCensusofEmploymentandWages)bytheestimated percent of vacancies in total covered employment would not produce the number of estimated vacancies.
For estimations of median wage rates, domain estimation could not be used. For these estimations, subgroup estimations were treated asifthesampleforthatsubgroupwerestratifiedbytheestimationvariable. We can produce standard errors only as a proxy for domain variances.Thesestandarderrorsweremultipliedby1.96(forthe95percentconfidencelevel)tocomparethestandarderrorswithcoefficientofvariances.
16SAS/STAT 9.2 User’s Guide, Second Edition, Chapter 85. “The SURVEYMEANS Procedure,” p. 6,485.
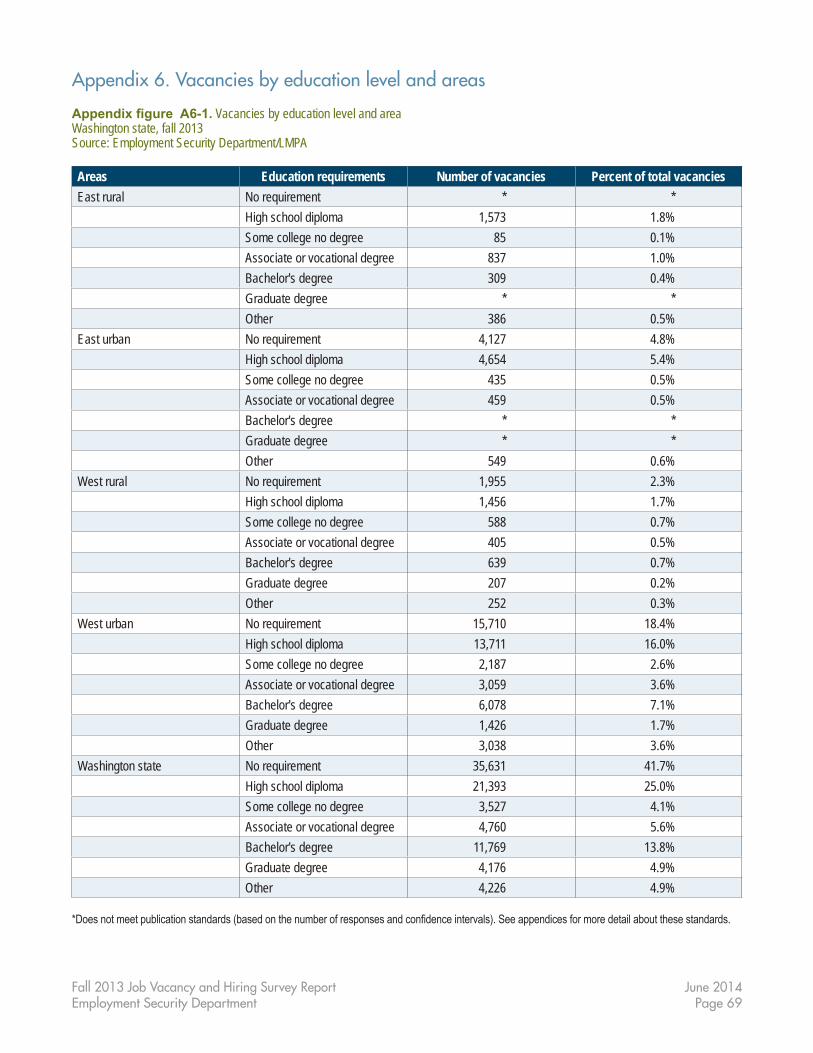
June 2014Page 69
Fall 2013 Job Vacancy and Hiring Survey ReportEmployment Security Department
Appendix 6. Vacancies by education level and areas
Appendix figure A6-1. Vacancies by education level and areaWashington state, fall 2013Source: Employment Security Department/LMPA
Areas Education requirements Number of vacancies Percent of total vacanciesEast rural No requirement * * High school diploma 1,573 1.8% Some college no degree 85 0.1% Associate or vocational degree 837 1.0% Bachelor's degree 309 0.4% Graduate degree * * Other 386 0.5%East urban No requirement 4,127 4.8% High school diploma 4,654 5.4% Some college no degree 435 0.5% Associate or vocational degree 459 0.5% Bachelor's degree * * Graduate degree * * Other 549 0.6%West rural No requirement 1,955 2.3% High school diploma 1,456 1.7% Some college no degree 588 0.7% Associate or vocational degree 405 0.5% Bachelor's degree 639 0.7% Graduate degree 207 0.2% Other 252 0.3%West urban No requirement 15,710 18.4% High school diploma 13,711 16.0% Some college no degree 2,187 2.6% Associate or vocational degree 3,059 3.6% Bachelor's degree 6,078 7.1% Graduate degree 1,426 1.7% Other 3,038 3.6%Washington state No requirement 35,631 41.7% High school diploma 21,393 25.0% Some college no degree 3,527 4.1% Associate or vocational degree 4,760 5.6% Bachelor's degree 11,769 13.8% Graduate degree 4,176 4.9% Other 4,226 4.9%
*Does not meet publication standards (based on the number of responses and confidence intervals). See appendices for more detail about these standards.
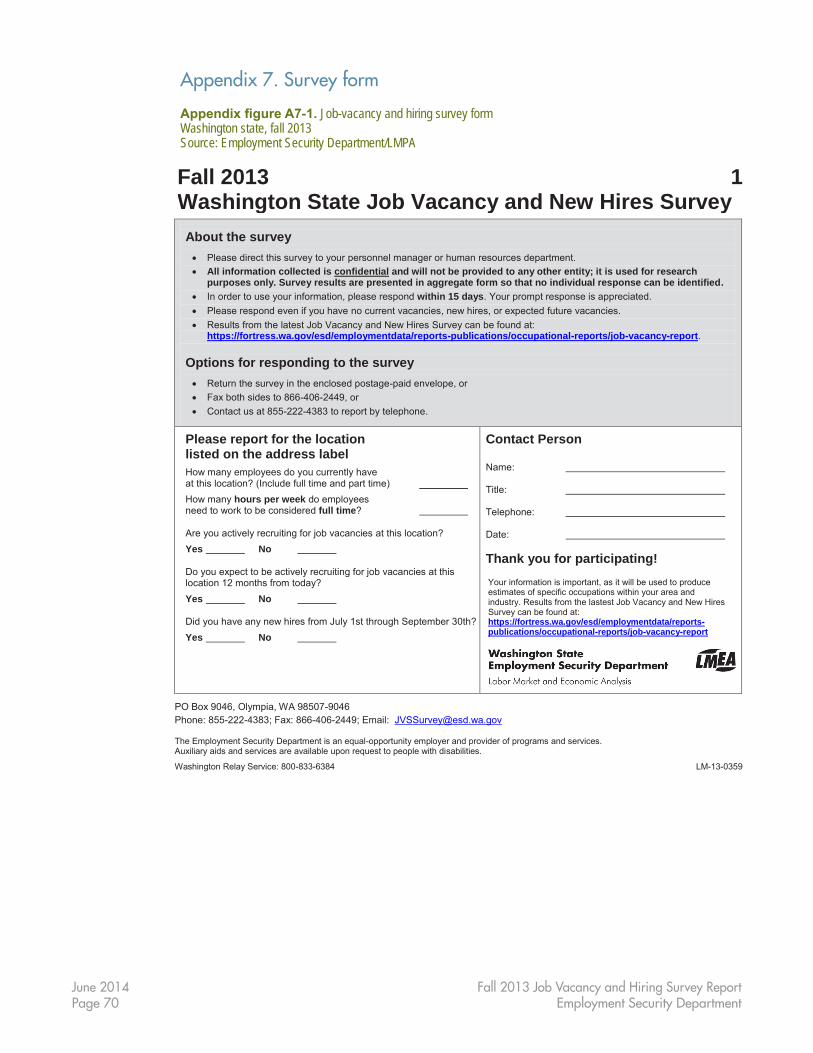
June 2014Page 70
Fall 2013 Job Vacancy and Hiring Survey ReportEmployment Security Department
Appendix 7. Survey form
Appendix figure A7-1. Job-vacancy and hiring survey formWashington state, fall 2013Source: Employment Security Department/LMPA
Fall 2013 1 Washington State Job Vacancy and New Hires Survey
About the survey
Please direct this survey to your personnel manager or human resources department. All information collected is confidential and will not be provided to any other entity; it is used for research
purposes only. Survey results are presented in aggregate form so that no individual response can be identified. In order to use your information, please respond within 15 days. Your prompt response is appreciated. Please respond even if you have no current vacancies, new hires, or expected future vacancies. Results from the latest Job Vacancy and New Hires Survey can be found at:
https://fortress.wa.gov/esd/employmentdata/reports-publications/occupational-reports/job-vacancy-report. Options for responding to the survey
Return the survey in the enclosed postage-paid envelope, or Fax both sides to 866-406-2449, or Contact us at 855-222-4383 to report by telephone.
Please report for the location listed on the address label
How many employees do you currently have at this location? (Include full time and part time)
How many hours per week do employees need to work to be considered full time? Are you actively recruiting for job vacancies at this location?
Yes No Do you expect to be actively recruiting for job vacancies at this location 12 months from today?
Yes No Did you have any new hires from July 1st through September 30th?
Yes No
Contact Person Name: Title: Telephone: Date: Thank you for participating! Your information is important, as it will be used to produce estimates of specific occupations within your area and industry. Results from the lastest Job Vacancy and New Hires Survey can be found at: https://fortress.wa.gov/esd/employmentdata/reports-publications/occupational-reports/job-vacancy-report
PO Box 9046, Olympia, WA 98507-9046 Phone: 855-222-4383; Fax: 866-406-2449; Email: [email protected]
The Employment Security Department is an equal-opportunity employer and provider of programs and services. Auxiliary aids and services are available upon request to people with disabilities.
Washington Relay Service: 800-833-6384 LM-13-0359
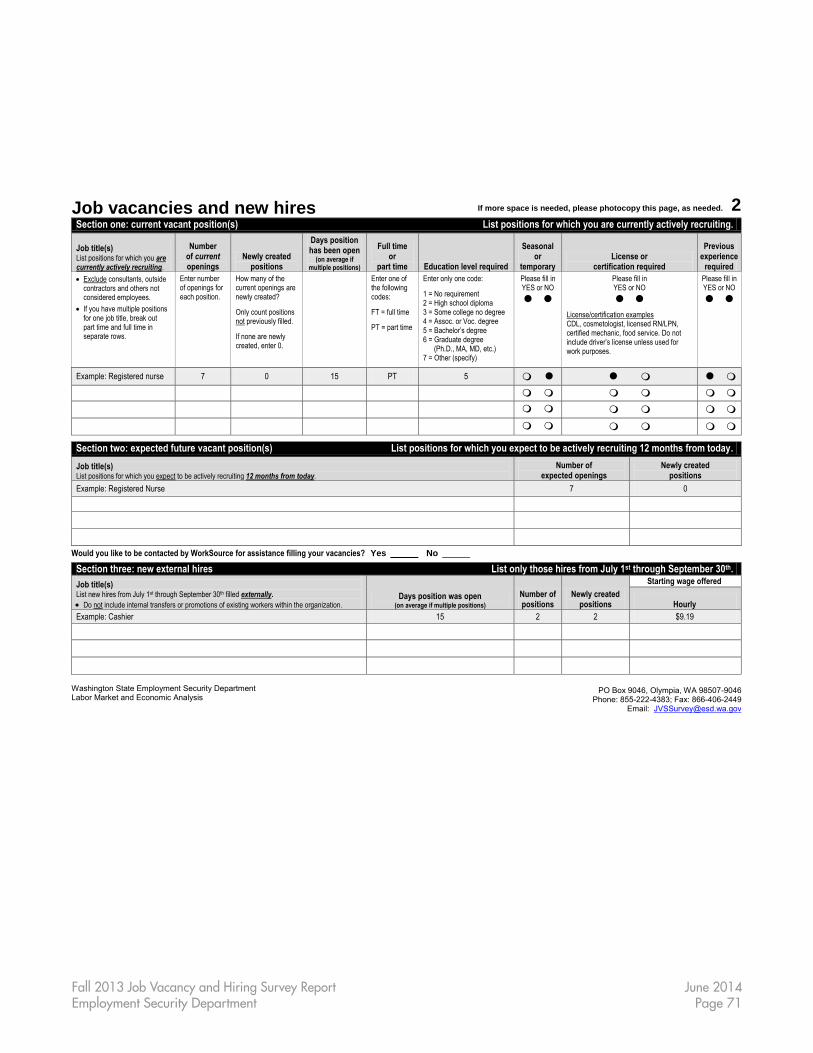
June 2014Page 71
Fall 2013 Job Vacancy and Hiring Survey ReportEmployment Security Department
Job vacancies and new hires If more space is needed, please photocopy this page, as needed. 2
Section one: current vacant position(s) List positions for which you are currently actively recruiting.
Job title(s) List positions for which you are currently actively recruiting.
Number of current openings
Newly created positions
Days position has been open
(on average if multiple positions)
Full time or
part time Education level required
Seasonal or
temporary License or
certification required
Previous experience
required
Exclude consultants, outside contractors and others not considered employees.
If you have multiple positions for one job title, break out part time and full time in separate rows.
Enter number of openings for each position.
How many of the current openings are newly created? Only count positions not previously filled. If none are newly created, enter 0.
Enter one of the following codes: FT = full time PT = part time
Enter only one code: 1 = No requirement 2 = High school diploma 3 = Some college no degree 4 = Assoc. or Voc. degree 5 = Bachelor’s degree 6 = Graduate degree (Ph.D., MA, MD, etc.) 7 = Other (specify)
Please fill in YES or NO
Please fill in YES or NO
License/certification examples CDL, cosmetologist, licensed RN/LPN, certified mechanic, food service. Do not include driver’s license unless used for work purposes.
Please fill in YES or NO
Example: Registered nurse 7 0 15 PT 5
Section two: expected future vacant position(s) List positions for which you expect to be actively recruiting 12 months from today.
Job title(s) List positions for which you expect to be actively recruiting 12 months from today.
Number of expected openings
Newly created positions
Example: Registered Nurse 7 0
Would you like to be contacted by WorkSource for assistance filling your vacancies? Yes No
Section three: new external hires List only those hires from July 1st through September 30th.
Job title(s) List new hires from July 1st through September 30th filled externally. Do not include internal transfers or promotions of existing workers within the organization.
Days position was open (on average if multiple positions)
Number of positions
Newly created positions
Starting wage offered
Hourly Example: Cashier 15 2 2 $9.19
Washington State Employment Security Department Labor Market and Economic Analysis
PO Box 9046, Olympia, WA 98507-9046 Phone: 855-222-4383; Fax: 866-406-2449
Email: [email protected]