J!lOlSAS JelnJ!JtUaA tlal le!pJeJOAW pue UO!lJUnJ Aq...
103
Al!AJleaJJ pue uoneAOUUI AlldeJ6o!pJeJ04Ja tseJtUOJ Aq passasse UO!SnJJad le!pJeJOAW pue UO!lJUnJ J!lOlSAS JelnJ!JtUaA tlal
Transcript of J!lOlSAS JelnJ!JtUaA tlal le!pJeJOAW pue UO!lJUnJ Aq...

Al!AJleaJJ pue uoneAOUUI
11N~N
AlldeJ6o!pJeJ04Ja tseJtUOJ Aq passasse UO!SnJJad
le!pJeJOAW pue UO!lJUnJ J!lOlSAS JelnJ!JtUaA tlal

Siri Malm
Left ventricular systolic function and myocardial perfusion assessed by contrast echocardiography
Thesis for the degree of doctor medicinae Trondheim, February 2007
Norwegian University of Science and Technology Faculty of Medicine Department of Circulation and Medical Imaging
IBNTNU Innovation and Creativity rSfr·AA~
~-OF

NTNU Norwegian University of Science and Technology
Thesis for the degree of doctor rnedicinae
Faculty of Medicine
Department of Circulation and Medicallrnaging
© Siri Malrn
ISBN 82-471-0041-7 [printed version)
ISBN 82-471-0055-4 [electr·onic version)
ISSN 1503-8181
Doctoral theses at NTNU, 2007:3
Printed by NTNU-trykk

Contents
ACKNOWLEDGEMENTS ........................................................................................ 3
LIST OF PAPERS ...................................................................................................... 5
ABBREVIATIONS AND ACRONYMS .................................................................... 6
INTRODUCTION ....................................................................................................... 7
ULTRASOUND CONTRAST AGENTS ........................................................................................................ 7 MICROBUBBLE RESPONSE TO ULTRASOUND .......................................................................................... 7
The relation to output power -linear vs. non-linear response .......................................................... 7 LEFT VENTRICULAR CAVITY OPACIFICATION (L VO) ............................................................................. 8 MYOCARDIAL CONTRAST IMAGING TECHNIQUES ................................................................................... 8
High-power imaging ....................................................................................................................... 8 Low-power real-time imaging ......................................................................................................... 9
CONTRAST ADMINISTRATION ............................................................................................................. 10 ARTEFACTS IN CONTRAST ECHOCARDIOGRAPHY ................................................................................. II CLINICAL APPLICATIONS OF CONTRAST ECHOCARDIOGRAPHY ............................................................. II
Measurement of LV volumes and ejection fraction ......................................................................... 11 Myocardial peifusion imaging. ...................................................................................................... 12 Contrast and tissue velocity imaging ............................................................................................. 14
THE AIMS OF THE STUDY ................................................................................... 16
MATERIAL AND METHODS ................................................................................ 17
STUDY SUBJECTS ............................................................................................................................... 17 CONTRAST AGENTS AND ADMINISTRATION ......................................................................................... 17 ECHOCARDIOGRAPHY ........................................................................................................................ I8
Applications .................................................................................................................................. 18 Imaging protocols ......................................................................................................................... 18 Data analysis ................................................................................................................................ 18 Contrast and tissue velocity imaging ............................................................................................. 20
MAGNETIC RESONANCE IMAGING ....................................................................................................... 20 QUANTITATIVE CORONARY ANGIOGRAPHY ......................................................................................... 20 STATISTICS ....................................................................................................................................... 21
SUMMARY OF RESULTS ...................................................................................... 22
Paper 1 ......................................................................................................................................... 22 Paper 11 ........................................................................................................................................ 22 Paper Ill ....................................................................................................................................... 23 Paper IV ...................................................................................................................................... 23 Paper V ....................................................................................................................................... 24 Paper V/ ...................................................................................................................................... 24
GENERAL DISCUSSION ........................................................................................ 25
STUDY SUBJECTS ............................................................................................................................... 25 LV VOLUMES AND EF ....................................................................................................................... 25
Volume underestimation vs. MRJ ................................................................................................... 26 Simultaneous trip lane imaging ...................................................................................................... 27 Reproducibility ............................................................................................................................. 28 Future perspectives ....................................................................................................................... 28
QUANTITATIVE REAL-TIMEMCE ....................................................................................................... 29

Feasibility ..................................................................................................................................... 29 Spatial and temporal variability .................................................................................................... 29 Diagnostic accuracy in chronic CAD ............................................................................................ 30 Advantages of real-time MCE ....................................................................................................... 31 Problems with/ disadvantages of real-time MCE ........................................................................... 31 Limitations of the quantitative destruction-replenishment approach ............................................... 32 Future perspectives ....................................................................................................................... 32
CONTRAST AND TISSUE VELOCITY IMAGING ........................................................................................ 33 Future perspectives ....................................................................................................................... 33
SAFETY ....................................................................................................•............•..........•................ 34
LIMITATIONS OF THE STUDY ........................................................................... 35
CONCLUSIONS ....................................................................................................... 36
REFERENCES ......................................................................................................... 37
APPENDIX ............................................................................................................... 44
2

Acknowledgements
The present work was carried out from June 2001 until May 2005 at the Department of Cardiology, Trondheim University Hospital, and the Department of Circulation and Medical Imaging (ISB), Norwegian University of Science and Technology. I am very grateful to The Norwegian Council on Cardiovascular Diseases that granted me a research fellowship. The project was also financially supported by ISB.
I am indebted to my supervisor, Professor Terje Skja:rpe, who introduced me to this field of research and who suggested the original line of investigation. He always believed in my work and constantly supported me with skilful ideas, critical advice and inspiration. He has shared with me his enormous knowledge and experience in echocardiography as an invaluable adjunct to clinical cardiology.
This work had not been possible without the close collaboration with and support from numerous technologists at ISB and GE Vingmed Ultrasound. They all contributed to a very stimulating and pleasant working environment. In particular, I am grateful to my co-worker Sigmund Frigstad for all his skilful technical support, inspiring discussions and assistance with preparing the manuscripts. I also want to thank Professor Hans Torp at ISB for sharing his enormous knowledge and enthusiasm in the art of ultrasound, and for always supplying with new ideas. I have also appreciated J0rgen Ma:hle, Vidar Lundberg, Kjetil Viggen and Stein-Inge Rabben for always being available for technical questions.
I will direct sincere thanks to our excellent research nurses, Anne-Lise Antonsen and Eli Granviken, who had very busy days trying to combine clinics and research. I am also very grateful for the co-operation with Einar Sagberg from the pioneering group of Research students at the Medical School. He participated during patient studies, technical discussions and interobserver analyses, and brought fresh and new eyes into the project. I further express great gratitude to associate professor Asbj0rn St0ylen, who with his Zarepta's cruse of knowledge combined with everlasting enthusiasm and humour, gave invaluable help with tissue Doppler imaging. I also appreciate the work of professor Rune Wiseth, who did the important interpretations of quantitative coronary angiography contributing to the fmdings of paper V.
I direct special thanks to my collaborators in the MR- department, who provided us with an external reference to echocardiography. In particular I must express my gratitude to the radiological technicians Per Arvid Steen and Gunvor Robertsen, for their patience and persistence during many late afternoons and evenings. Furthermore, to the previous head of the department, Professor Henrik Larsson, for teaching me some basic principles of recording and interpretation of cardiac MRI, and to Torgil Riise Vangberg for his valuable technical support.
When I entered the research field, I felt that I benefited from my clinical experience as a resident and consultant at the department of Medicine, Harstad County Hospital. I want to thank the former and present heads, Kare Nordgard and Helge Ulrichsen, both
3

exceptionally gifted clinicians, who have been very supportive during my research period.
Charlotte Bjork Ingul, my dear friend and colleague, gave me great support and shared with me a lot of joy and frustrations during the research period.
At last, but certainly not at least, I direct my most sincere gratitude to my dear husband, Roger, and our children, Lina, Sigurd and Jenny, for their ever-lasting patience with a busy wife and mother constantly on the move, and for reminding me on the most important things in life.
4

List of papers
This thesis is based on the following papers:
I Maim S, Frigstad S, Sagberg E, Larsson H, Skjarpe T. Accurate and reproducible measurement of left ventricular volume and ejection fraction by contrast echocardiography. A comparison with magnetic resonance imaging. JAm Coll Cardiol 2004;44:1030-5.
II MaimS, Sagberg E, Larsson H, Skjarpe T. Choosing apical long-axis instead of twochamber view gives more accurate biplane echocardiographic measurements ofleft ventricular ejection fraction. A comparison with magnetic resonance imaging. J Am Soc Echocardiogr 2005; 18: 1044-50.
III Malm S, Frigstad S, Sagberg E, Steen P A, Skjarpe T. Real-time simultaneous trip lane contrast echo cardiography gives rapid, accurate and reproducible assessment of left ventricular volumes and ejection fraction. A comparison with magnetic resonance imaging. JAm Soc Echocardiogr 2006;19;1494-1501.
IV MaimS, Frigstad S, Helland F, Oye K, Slordahl S, Skjarpe T. Quantification of resting myocardial blood flow velocity in normal humans using real-time contrast echocardiography. A feasibility study. Cardiovascular Ultrasound 2005,3:16.
v MaimS, Frigstad S, Torp H, Wiseth R, Skjarpe T. Quantitative adenosine real-time myocardial contrast echocardiography for detection of angiographically significant coronary artery disease. JAm Soc Echocardiogr 2006;19:365-72.
VI MaimS, Frigstad S, Stoylen A, Torp H, Sagberg E, Skjarpe T. Effects of ultrasound contrast during tissue velocity imaging on regional left ventricular velocity, strain and strain rate measurements. JAm Soc Echocardiogr 2006;19:40-7.
The papers will later be referred to by their Roman numerals.
5

Abbreviations and definitions
A
ANOVA APLAX
ASE
~ 2CH
2D
3D
4CH
CAD
DSE
ED
EDV
tes
EF
ES
ESV
FPS
LAD LCx
LV LVO MBF
MBV
MCE
MI
MRI
PSV
QCA
RCA
ROI
SD
SI
SRI
SRs TVI
WMA
Steady state contrast signal intensity
Analysis of variance
Apical long-axis
American Society ofEchocardiography
Contrast replenishment rate
Two-chamber
Two-dimensional
Three-dimensional
Four -chamber
Coronary artery disease
Dobutamine stress echocardiography
End-diastole/ end-diastolic
End-diastolic volume
End-systolic strain
Ejection fraction
End-systole/ end-systolic
End-systolic volume
Frames per second
Left anterior descending coronary artery
Left circumflex coronary artery
Left ventricle/ ventricular
Left ventricular opacification
Myocardial blood flow
Myocardial blood volume
Myocardial contrast echocardiography
Mechanical index
Magnetic resonance imaging
Peak systolic velocity
Quantitative coronary angiography
Right coronary artery
Region of interest
Standard deviation
Signal intensity
Strain rate imaging
Peak systolic strain rate
Tissue velocity imaging
Wall motion analysis
6

Introduction
Ultrasound contrast agents
Contrast echo cardiography is based on the use of gas micro bubbles as blood tracers exploiting their acoustic behaviour during exposure to ultrasound. Ultrasound contrast agents consist of encapsulated microbubbles filled with either air or high molecular weight gases. The first agents to be used were hand-agitated saline or glucose. These are still utilised to detect intracardiac shunts. Later, air-filled bubbles with more resistant shells were introduced (Albunex®, Levovist®). While still highly diffusible leading to rapidly decreasing bubble size and low persistence, they were able to reach the left cardiac chambers. The more recent second generation contrast agents, consisting of high molecular weight gases encapsulated by modified lipid or albumin, are less soluble and have proved to be persistent enough to give left cavity and myocardial opacification after intravenous (IV) administration (SonoVue®, Optison®, Definity®)(l-3). These microbubbles range in diameter from 1- 10 f.Lm, behave as strict intravascular tracers and are biologically relatively inert. They re-circulate with a myocardial phase of about 5 minutes and have IV contrast effect of more than 10 minutes.
Microbubble response to ultrasound
The microbubble - ultrasound interaction is complex and influenced by a number of factors, like bubble size, gas composition, shell structure, and the frequency and output power of ultrasound. When insonated, the bubbles oscillate with compressions at the peak positive pressure of the ultrasound wave and expansions at the nadir. They become themselves small acoustic sources transmitting energy in all directions, some of which are scattered back to the transducer (backscatter). The micro bubbles obtain a frequency of oscillation at which the absorption and scattering of ultrasound is particularly effective(= resonance) (4-6). It appears to be a remarkable coincidence that gas bubbles of a size required to cross the pulmonary vascular bed (1-5 f.Lm), resonate in a frequency range of 1.5- 7 MHz, precisely the range utilised in diagnostic ultrasound.
The relation to output power -linear vs. non-linear response An essential parameter for contrast imaging is the system power output displayed as mechanical index (MI), which is an estimate of the tissue effects of ultrasound exposure (Appendix A). Standard clinical echocardiography utilises aMI of around 1.0- 1.3, and the upper limit for human scanning is set to 1.9 (4). For very low MI (< 0.04), the microbubble response is mainly linear, i.e. contractions and expansions are similar in amplitude, and the resulting echoes have about the same frequency as the emitted pulses,- so-called fundamental signals. With increasing MI, the bubble expansions to an increasing degree exceed the contractions, giving non-linear oscillations with frequencies being multiples of the transmitted- so-called harmonics, and ultimately giving bubble destruction, which is pronounced in conventional echocardiography (5,6). Low to intermediate MI (0.04- 0.3) induces both linear and non-linear microbubble behaviour with less prominent destruction.
7

Recognition of the non-linear properties of contrast coincidentally led to the development of tissue (second) harmonic imaging. Even tissue that was expected to be relatively incompressible turned out to generate significant harmonic signals that could be exploited by receiving at double frequency, filtering away the fundamental frequencies. This greatly improved the quality of conventional grey-scale imaging; enhanced left ventricular (LV) endocardial delineation and improved lateral resolution (narrower beams with lower side lobes). This discovery actually decreased the interest for contrast imaging. Nevertheless, more recent contrast agents turned out to have properties that vary much more with the acoustic pressure than solid tissue, and this has been exploited to increase the agent-to-tissue and the signal-to-noise ratio.
Left ventricular cavity opacification (L VO)
With conventional two-dimensional (2D) echocardiography, blood appears black since the amplitude of red blood cell scatter is very low. Contrast microbubbles are up to 1000 times more effective as backscatterers than red blood cells, and thus greatly enhance the blood pool signal and the blood-tissue border. Contemporary L VO implies administration of a second-generation contrast agent and the use of a low to intermediate MI imaging (0.2- 0.4) depending on which detection technique is used. For L VO, the agent-to-tissue ratio is not as critical as for myocardial opacification, and adequate images can be obtained using single-pulse harmonic techniques and slow bolus administration with frame rates (25-30 per second) adequate for catching the enddiastolic (ED) and end-systolic (ES) area and to simultaneously evaluate wall motion.
Myocardial contrast imaging techniques
To evaluate perfusion by myocardial contrast echocardiography (MCE), one has to be able to detect the micro bubbles through the powerful signals from myocardial tissue. At rest, the myocardium contains no more than 5- 10% blood (7,8), giving a microbubble concentration 10- 20 times lower than that in the cavity. With standard fundamental imaging, myocardial micro bubbles are continuously destroyed, causing apical swirling and hindering replenishment of the myocardium within the beam. Changing to second harmonic imaging improves L VO, but offers little benefit for myocardial perfusion, because tissue produces significant harmonics at intermediate and high power. These problems have led to the development of contrast-specific imaging techniques aiming at increasing the agent-to-tissue ratio. To achieve visualisation of myocardial contrast, the extremes of output power have been utilised.
High-power imaging
Triggered harmonic imaging High-energy ultrasound is transmitted at specified intervals, triggered to the electrocardiogram (ECG), destroying the contrast within the beam elevation and generating high amplitude harmonic backscatter (9). The triggering intervals (number of heartbeats between imaging frames; 1:1, 1:2, 1:4, 1:8, etc.) allow the microbubbles to replenish the myocardium. The technique is improved by digital subtraction of the myocardial tissue signal, and optimised by colour coding techniques to allow better
8

extraction of bubble signals. The very first human study comparing MCE with single photon emission computed tomography (SPECT) used this technique (10). However, this method requires careful frame to frame alignment, which is difficult due to movements between imaging.
Harmonic Power Doppler Power Doppler technology was added to MCE to overcome the need for complicated off-line digital subtraction (11). This technique is suited to destructive imaging using air-filled microbubbles. Two or more pulses are sent successively along each scan line, as in traditional Doppler. The first pulse destroys the myocardial microbubbles, generating a brief, high amplitude echo, and the second pulse detects this as a frequency shift indicating movement. Colour is displayed as an overlay with intensity related to the amplitude of the moving echo. A major limitation is motion artefacts, which will be expressed like bubble destruction and generate false negative perfusion defects. This technique has been tested in numerous clinical studies and is often correlated to SPECT (12,13).
The advantage of the high MI techniques is their good sensitivity for the presence of contrast, because bubble destruction results in the highest amplitude backscatter. The disadvantages are the lack of simultaneous assessment of function and the need for reliable ECG triggering and good image alignment. The methods can thus be technically challenging and time-consuming (of particular concern in stress imaging). The problem with maintaining stable image position between long triggering intervals has been aided by the recent techniques using low MI localisation images. Nevertheless, movement artefacts are almost inevitable.
Low-power real-time imaging
To overcome these problems, techniques able to isolate even low amplitude microbubble backscatter from tissue signals were developed. The use oflow MI imaging has two major benefits; 1) The bubbles undergo stable non-linear oscillation emitting continuous fundamental and harmonic signals without being destroyed, thus enabling simultaneous assessment of wall motion and perfusion in real-time, and 2) the tissue mainly generate fundamental signals. However, the agent-to-tissue ratio is still a critical issue, hence frame rate is reduced compared to standard imaging in order to reduce bubble destruction.
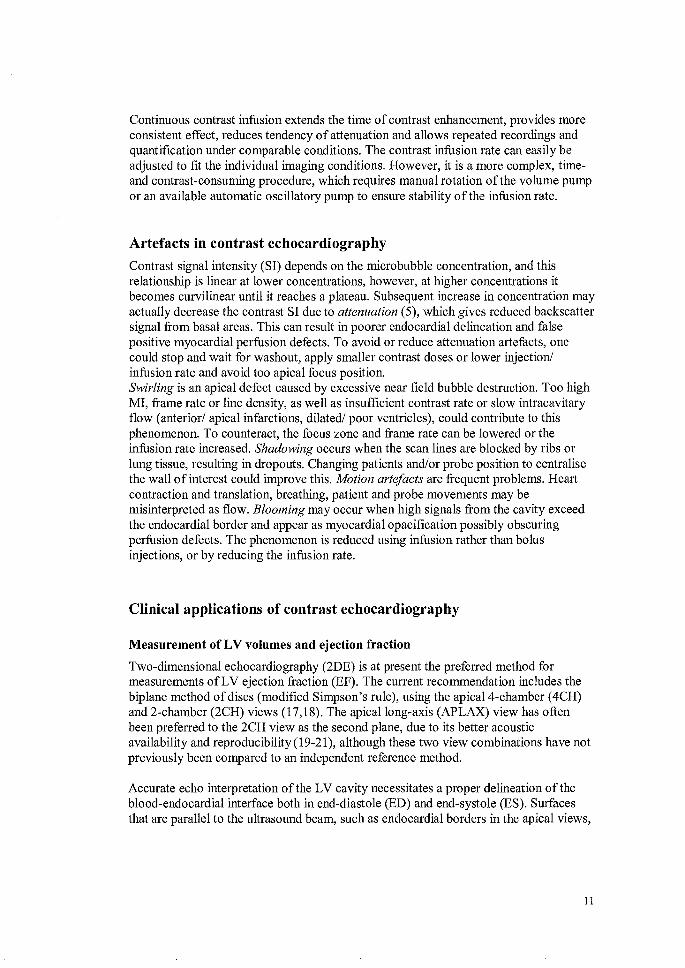
Pulse inversion Doppler In conventional imaging, the emitted pulses (one per line) have the same polarity and amplitude. By manipulating pulse amplitude and/or phase, it is possible to characterise the echoes from micro bubbles such that they can be differentiated from tissue. The first detection technique used for real-time MCE is based on pulse inversion, in which two pulses with identical amplitude and shape, but opposite phase (i.e. 180° phase shift), are emitted in rapid succession (14,15). The returning pulse pairs are added. Tissue generates mainly linear echoes at low MI, thus the sum of tissue echoes should cancel out. Conversely, microbubbles produce more non-linear backscatter and the summation of returning pulses will not equal zero, thereby a signal will be registrated (Fig. 1 ).
9

Pulse inversion
resonating icrobubbles
I Nom1al puis~] a 9 I \ 1 •
I Inverted pulse I ol I\ - bl 1 ' "
(a>b) I L Figure 1 Schematic presentation of the principle of pulse inversion at low mechanical index. Two pulses that are identical in amplitude but of opposite phase are transmitted. The echoes reflected from linear, stationary tissue are also identical, but have opposite phase, and the sum ofthese will cancel out (no signal). The echoes that are reflected from resonating microbubbles are asymmetrical due to the difference in bubble volume between the two pulses. The sum of the two echoes will not cancel out when summed up and thereby produce a signal.
Tissue motion is a major limitation, as this also creates non-linear signals. Pulse inversion is therefore combined with a Doppler signal processing technique, where a sequence of pulses with alternating phase is transmitted along each beam, and the echoes are recombined in a way to eliminate the effects of tissue motion.
During and after the clinical studies of this thesis, more low-power real-time techniques based on manipulation of pulse amplitude and/or phase have been developed, exploiting both fundamental and different degrees of harmonic signals.
Contrast administration
Bolus injections are easy to perform, they are less costly, give the highest peak enhancement and the agent is quickly used with no stability problems. By prolonging the duration of the contrast injection and particularly the saline flushing ('slow bolus'), it is possible to minimise attenuation and blooming artefacts. Limitations of the bolus technique are short contrast effect, attenuation artefacts and difficulties concerning timing and assessment of perfusion (16).
10
Continuous contrast infusion extends the time of contrast enhancement, provides more consistent effect, reduces tendency of attenuation and allows repeated recordings and quantification under comparable conditions. The contrast infusion rate can easily be adjusted to fit the individual imaging conditions. However, it is a more complex, timeand contrast-consuming procedure, which requires manual rotation of the volume pump or an available automatic oscillatory pump to ensure stability of the infusion rate.
Artefacts in contrast echocardiography
Contrast signal intensity (SI) depends on the microbubble concentration, and this relationship is linear at lower concentrations, however, at higher concentrations it becomes curvilinear until it reaches a plateau. Subsequent increase in concentration may actually decrease the contrast SI due to attenuation (5), which gives reduced backscatter signal from basal areas. This can result in poorer endocardial delineation and false positive myocardial perfusion defects. To avoid or reduce attenuation artefacts, one could stop and wait for washout, apply smaller contrast doses or lower injection/ infusion rate and avoid too apical focus position. Swirling is an apical defect caused by excessive near field bubble destruction. Too high MI, frame rate or line density, as well as insufficient contrast rate or slow intracavitary flow (anterior/ apical infarctions, dilated/ poor ventricles), could contribute to this phenomenon. To counteract, the focus zone and frame rate can be lowered or the infusion rate increased. Shadowing occurs when the scan lines are blocked by ribs or lung tissue, resulting in dropouts. Changing patients and/or probe position to centralise the wall of interest could improve this. Motion artefacts are frequent problems. Heart contraction and translation, breathing, patient and probe movements may be misinterpreted as flow. Blooming may occur when high signals from the cavity exceed the endocardial border and appear as myocardial opacification possibly obscuring perfusion defects. The phenomenon is reduced using infusion rather than bolus injections, or by reducing the infusion rate.
Clinical applications of contrast echocardiography
Measurement of LV volumes and ejection fraction
Two-dimensional echocardiography (2DE) is at present the preferred method for measurements ofLV ejection fraction (EF). The current recommendation includes the biplane method of discs (modified Simpson's rule), using the apical4-chamber ( 4CH) and 2-chamber (2CH) views (17,18). The apical long-axis (APLAX) view has often been preferred to the 2CH view as the second plane, due to its better acoustic availability and reproducibility(19-21), although these two view combinations have not previously been compared to an independent reference method.
Accurate echo interpretation of the LV cavity necessitates a proper delineation ofthe blood-endocardial interface both in end-diastole (ED) and end-systole (ES). Surfaces that are parallel to the ultrasound beam, such as endocardial borders in the apical views,
II

are difficult to resolve with echocardiography. In addition, the acoustic window is limited by obesity, emphysema, chest wall deformation and inability to lie in the left recumbent position. Native tissue harmonic imaging greatly improved the image quality and reduced the number of non-diagnostic studies. StillS- 10% of single plane exams are suboptimal at rest, and even more are of insufficient quality for biplane measurements ofEF (22-25). The imaging problems are greatly amplified in stress echocardiography and ventilated intensive care patients (26-28).
Left ventricular opacification by IV contrast significantly enhances endocardial border delineation (23,24,30-32) and increases the diagnostic accuracy of suboptimal studies, both at rest and during stress (26-32). Hundley et al demonstrated improved accuracy and reduced interobserver variability of contrast enhanced versus fundamental2D-echo in determination of LV volumes and EF compared to magnetic resonance imaging (MRI) (33). In comparison to tissue harmonic imaging, Thomson et al reported improved measurements of LV remodelling by contrast echo in 26 patients with LV dysfunction, with reference to electron beam computerised tomography (CT) (34). No clinical studies have previously validated contrast imaging and tissue harmonic imaging versus MRI in consecutive cardiac patients.
Real-time three-dimensional echocardiography (3D E) has been reported as superior to 2DE in LV volume measurements (35-39). In spite of advances in image quality, spatial resolution and acquisition times, novel 3DE is still limited by the need of data from consecutive heart cycles during held respiration and time-consuming data analysis, and in addition by a narrower sector width (volume size) than 2DE. A potentially more timesaving alternative; simultaneous multiplane imaging, is a novel technique that has not yet been clinically evaluated for measurements of LV volumes and EF.
Myocardial perfusion imaging
Different non-invasive imaging modalities exist to study myocardial perfusion, such as SPECT and more recently MRI and positron emission tomography (PET). Limited availability, high costs, long examination periods, and exposure to radiation (SPECT and PET) still limit these techniques. Ultrasound contrast micro bubbles act as pure intravascular tracers traversing the myocardial microvasculature, in contrast to MRI tracers that escape into the extravascular space and radionuclides which enter the myocytes. Thus, the detection ofmicrobubbles within the myocardium has the potential of providing both qualitative and quantitative information on microvascular integrity and regional myocardial blood flow (MBF). Other potential advantages with MCE versus SPECT, is the better availability and portability, less cost, no radiation and better spatial resolution.
Quantification of perfusion by MCE
Myocardial opacification by contrast almost entirely reflects backscatter from microbubbles flowing through the capillary compartment, which contains~ 90% of the myocardial blood volume (MBV) (40,41). Traditionally, evaluation of myocardial perfusion from MCE has been visual assessment of the myocardial contrast SI (brightness) on videotaped studies, using a semi-quantitative score. However, subtle
12

differences in intensity between vascular beds may not be visually evident, and measuring regional microbubble backscatter in dB is not necessarily proportional with perfusion. Even with substantially reduced perfusion, the blood volume could be constant or even larger than normal (42,43), and contrast microbubbles may remain for longer time in the microcirculation generating more signals. Nevertheless, the presence of a perfusion defect at rest indicates infarction or an artefact, with the former being likely ifthere are simultaneous wall motion abnormalities, and if the defect conforms to the distribution of a coronary vascular territory.
The limitations of visual interpretation led to the development of a pioneering quantitative method suggested by Wei et a! in 1998 ( 44 ). It relied on continuous IV contrast infusion and the use of intermittent high-MI imaging. When a steady state myocardial opacification was reached, several high MI pulses were delivered to destroy contrast in the imaging plane. The replenishment of new contrast into the myocardium was observed and recorded. The resulting video intensity vs. time (pulsing interval) plot resembled an exponential growth function, and was fitted to the equation
y(t) =A [l-e-P1],
where y is SI at any given time, A is the plateau (maximal) SI at steady state reflecting microvascular cross-sectional area (MBV), ~reflects the rate of rise (slope of curve) of SI, and, hence, mean microbubble velocity (MBF velocity) and t is pulsing interval (time) after 'flash'. By incrementally increasing the pulsing interval, the rate of contrast replenishment over time could be assessed, both qualitatively and quantitatively. Wei eta! demonstrated an excellent linear relationship between the absolute MBF, measured with radio labeled microspheres, and the MCE- derived MBF as calculated from the product of A and ~·
The flow in the myocardial capillaries is very slow (0.5- 1.0 mm/sec), and with a beam elevation of up to 5 mm, contrast replenishment at rest could consequently extend up to 10 heart cycles. This contributes to making intermittent imaging a rather complex and time-consuming technique. The more recent real-time MCE techniques have demonstrated similar results in animal experiments using the destruction-replenishment approach ( 45-48). In addition, newer scanners provide digital recording and storage, avoiding loss of original data quality ( 49).
Detection of coronary artery stenoses
In the presence of a significant, but non-critical coronary artery stenosis (50-75% diameter stenosis), normal blood flow is maintained at rest by arteriolar vasodilatation (50), thus MCE techniques cannot be expected to detect resting perfusion defects. During stress, a 3-6 fold increase in flow to areas supplied by normal coronary arteries has been observed (50-52). This is caused by arteriolar vasodilatation, which could give both increased red cell velocity (MBF velocity) and increased MBV (opening of dormant capillary networks). However, the application of pure vasodilator stress tends to increase MBF velocity without marked changes in overall MBV (51). In beds of significantly stenosed arteries, there will be limited augmentation of flow due to resting vasodilatation. Direct comparison between these and normal territories may reveal perfusion mismatch, but not necessarily ischemia. In critical cases the pre-capillary
13

pressure drops significantly due to low distal coronary pressure, and the steal phenomenon can occur; to maintain normal trans-capillary pressure capillary networks are shut down (capillary de-recruitment) (50,52,53).
An increasing amount of experimental and clinical data has suggested that quantitative MCE flow reserves assessed from comparing the resting and stress condition can be used to evaluate the physiological significance of coronary stenoses ( 45-49,54-60). The use of adenosine has often been preferred due to its capability to induce perfusion heterogeneity, and its fast effect and short half-life (51). While numerous studies examining various stress and imaging modalities have demonstrated concordance between MCE and SPECT, there are limited data using quantitative coronary angiography (QCA) as the reference standard (Table 1)(13,54-60).
Contrast and tissue velocity imaging
In traditional flow Doppler, the wall filter adjustments are made to minimise the effects of high-intensity, low-velocity noise from tissue. Tissue velocity imaging (TVI) is based on bypassing these high-pass wall filters. The high velocity signals from blood in the cavities are actually not filtered away in TVI, but are about 40 dB lower than the Doppler shifts, and thus too low to be displayed in the TVI image (61,62).
Strain and strain rate imaging (SRI) are novel TVI-based tools for quantification of regional myocardial function (63-66). Numerous clinical studies have reported benefit using SRI measurements in interpretation of dobutamine stress echocardiography (DSE). The combination ofTVI and myocardial contrast echocardiography might have a potential of providing more information about motion and perfusion of the myocardium in a single examination. However, modem contrast agents can remain in the circulation during more than 10 minutes and may therefore interfere with TVI based measurements. Sporadic tests with SRI and contrast injections in our lab indicated that strain rate (SR) and strain (E) measurements would be disturbed by the presence of contrast in the LV cavity or myocardium. However, no clinical data has so far been available to clarify this matter.
14

Table 1 Myocardial contrast echo studies with patients undergoing quantitative coronary angiography
CAD* No Sensitivity Specificity MCE technique Contrast agent/ Stress Freq of MCE CAD (%) (%) ad min QCA analysis
Heinle et al 12 3 75 67 Harmonic Power Optison/ Adenosine 15 of 123 Qualitative 2000 (13) Doppler infusion
Cwaig et al 32 13 87 - Accelerated Optisonand Dobutamine All of45 Qualitative 2000 (54) intermittent PESDA/ bolus and exercise
imaging
Shimoni et al 28 16 75 85 Real-time MCE Optison/ bolus Exercise 44 of 101 Qualitative 2001 (55)
Wei et al 10 16 100 Harmonic Definity/ Adenosine 15 of 54 Quantitative 2001 (56) (LAD Intermittent infusion
only) imaging
Olszowska et 44 97 93 Real-time MCE Optison/ bolus Dobutamine All of44 Qualitative al2002 (57)
Rocchi et al 12 - 89 - Harmonic Power Levovist/ Dipyridamol 12 of25 Qualitative 2003(58) Doppler infusion
Moir et al 43 27 91 70 Real-time MCE Definity/ Dipyridamol 70 of85 Qualitative 2004 (59) infusion
Peltier et al 22 13 97 82 Real-time MCE PESDA/ Dipyridamol All of35 Qualitative/ 2004 (60) infusion quantitative
* Significant CAD defined as the presence of at least 50% diameter stenosis in at least one coronary artery with a diameter:::: 2mm. CAD, coronary artery disease; LAD, left anterior descending coronary artery; MCE, myocardial contrast echocardiography; PESDA,perfluorocarbon-enhanced sonicated dextrose albumin; QCA, quantitative coronary angiography.
15
The aims of the study
I. To evaluate whether intravenous contrast echocardiography gives superior accuracy and reproducibility in assessment ofLV volumes and EF compared to state-of-the-art tissue harmonic imaging in non-selected cardiac patients.
II. To evaluate the clinical accuracy and reproducibility of biplane 2D-echo assessment ofL V volumes and EF, using 4CH combined with either APLAX or 2CH views, both without and with contrast, to assess the effect of different biplane image view combinations.
III. To evaluate the feasibility, accuracy and reproducibility of a novel simultaneous trip lane data acquisition and analysis approach for measurement of LV volumes and EF compared to conventional 2D biplane measurements, without and with contrast.
IV. To evaluate the feasibility of low power real-time MCE for visualising perfusion in normal human myocardium, and to quantify segmental myocardial blood flow velocity by using a contrast destruction-replenishment approach.
V. To evaluate the clinical feasibility of quantitative adenosine real-time MCE, and to test if stress-to-rest ratios ofMCE perfusion parameters could detect significant coronary stenoses in consecutive patients undergoing QCA.
VI. To assess the effects of contrast present in LV cavities and myocardium during TVI recording, on the measurements of tissue velocities, regional strain and strain rate. Secondly, to evaluate if increased scan line density could improve the feasibility of simultaneous tissue Doppler and contrast echocardiography.
16

Material and methods
Study subjects
The healthy subjects (paper IV and VI) were volunteers from the hospital and university staff or medical students. All patients gave informed consent to participation either as regular ward patients or as outpatients referred for routine cardiac investigations. All patients had known or suspected cardiac disease and were submitted for echocardiography. Of the 110 consecutive patients included in paper I, 55 were also included in paper II. Otherwise, no patients participated in more than one paper. In studies where coronary angiography was performed (IV and V), it was part of the routine clinical investigation and was not initiated by the study.
No screening for echo image quality was performed in paper I-IV and VI. However, in paper II patients with any of the standard apical planes technically too poor for endocardial tracing were excluded from the comparative volume analysis. In paper V, 53 patients referred for diagnostic coronary angiography were consecutively included, but 10 of these did not proceed to the stress part of the MCE study, due to inadequate image quality in standard apical views during MCE at rest. The studies conformed to the declaration of Helsinki, and the Regional Committee of Medical Ethics approved all the protocols. All study subjects gave written informed consent to participation.
Contrast agents and administration
The ultrasound contrast agent SonoVue® (sulphur hexafluoride stabilised by a phospholipid monolayer) was used in paper IV and in half of the patients in paper I and II (2). Definity™ (octafluoropropane lipid microspheres) was used in the other half of patients in paper I and II (3). Optison™ ( octafluoropropane rnicrospheres encapsulated by human serum albumin) was used in paper III, V and VI (1). For LVO (in paper I-III and VI), the contrast was administered as repeated slow bolus injections (initial doses of 0.2, 0.5 ml and 0.5 m1 for Defmity, SonoVue and Optison, respectively). All contrast injections were followed by a slow manual flush, alternatively continuous infusion, of at least 5ml of0.9% saline.
In paper IV and V, the contrast was administrated undiluted as a continuous infusion operated by a volumetric infusion pump (Braun Compact™). For Sono Vue infusion, continuous manual rotation of the pump was performed. With Optison, a slightly different set-up was used with a vertical position of the pump and the attached syringe. The contrast was advanced by a constant saline infusion (180-200 ml/h) feeding into the contrast line at 90 degrees. The contrast infusion rates ranged from 70-100 mllh (SonoVue) and 15-30 mllh (Optison) and were carefully adjusted to optimise myocardial opacification and minimise depth-dependent far-field attenuation.
17

Echocardiography
A single, experienced physician performed all echocardiographic studies.
Equipment
All studies were performed using the Vivid 7 scanner (GE Vingmed Ultrasound AS, Horten, Norway) (different software versions), and a M3S phased matrix array transducer. In paper III, Vivid 7 Dimension, sw.v.4.0.0, equipped with a novel2D-array matrix transducer (3V) connected to a real-time 3DE system, was used for simultaneous trip lane imaging. The interplane angles were by default set to 60 degrees, but could easily be adjusted.
Applications
In all papers, baseline recordings in tissue harmonic imaging (1.7/ 3.5 MHz) was performed. For L VO, a single-pulse harmonic technique (MI 0.22 to 0.31) was used in paper I, II and VI, whereas in paper III, a novel pulse inversion based detection method, Coded phase inversion, was used (1.7/ 3.4 MHz), operating at aMI of0.18 to 0.22. Contrast perfusion imaging was performed with Coded harmonic angio, a real-time application based on pulse inversion power Doppler using very low MI (Sono Vue 0.04-0.05, Optison 0.06- 0.08) and a frame rate of20 to 22Hz. In paper VI, different applications for TVI and LVO and their combinations were applied, one of these being a novel technique utilising an increased (doubled) number of scan lines compared to conventional TVI.
Imaging protocols
Standard apical LV views were carefully acquired in all studies. In the MCE studies, the standard views were at times slightly modified, i.e. by centralising the lateral or anterior walls in the scan sector to minimise attenuation and shadowing. Special care was taken to avoid off-axis imaging and to maintain image alignment during destructionreplenishment sequences. For volume studies, cine loops of at least three cardiac cycles, avoiding ectopic and post-ectopic beats, were acquired in held expiration per imaging view and modality. In the MCE studies, 15 and 20 cardiac cycles of every destructionreplenishment sequence were captured. In paper V, contrast destruction- replenishment sequences were obtained also during hyperaemic stress obtained with IV adenosine 140 j..tg/kg/min for up to 6 minutes. All echocardiographic data were digitally stored as rawdata. Further details on performance of imaging are described in the papers.
Data analysis
Analyses were performed off-line on a separate PC station using the Quantitative analysis tool in EchoP AC PC (GE Vingmed Ultrasound, Horten, Norway). Measures for LV volumes/EF and the TVI- derived parameters (paper VI), all represent the average of data from three cardiac cycles.
Endocardial tracings of all studies were manually performed according to the recommendations ofthe American Society ofEchocardiography (ASE) (17,18). The
18

definition ofED andES is described in the Methods section, paper I-III. For 2DE, the biplane Simpson's method (17)(Appendix B) was used to calculate volumes. In paper I, the APLAX view was preferred, due to its better acoustic availability and reproducibility (19-21), but if the 2CH image was ofbetter quality this was used to maximise feasibility of biplane analysis. In paper II, the two apical view combinations including the 4CH view were assessed in all patients. In the other papers, biplane assessments were performed using the APLAX and the 4CH view. On the simultaneous trip lane display (paper III), ED and ES was automatically detected, with possibility for manual adjustments. A triangular mesh was constructed by 3D interpolation between the three area traces, and volumes calculated by surface triangulation and summation of all triangles by the Divergence Theorem (67)(Appendix C). EF was calculated as [(ED volume- ES volume)/ ED volume)] x 100 %. In study II, LV cavity long-axis lengths were measured in ED and ES, as the distance from the apex to the centre of the mitral valve plane, both on echocardiography and long-axis MR images.
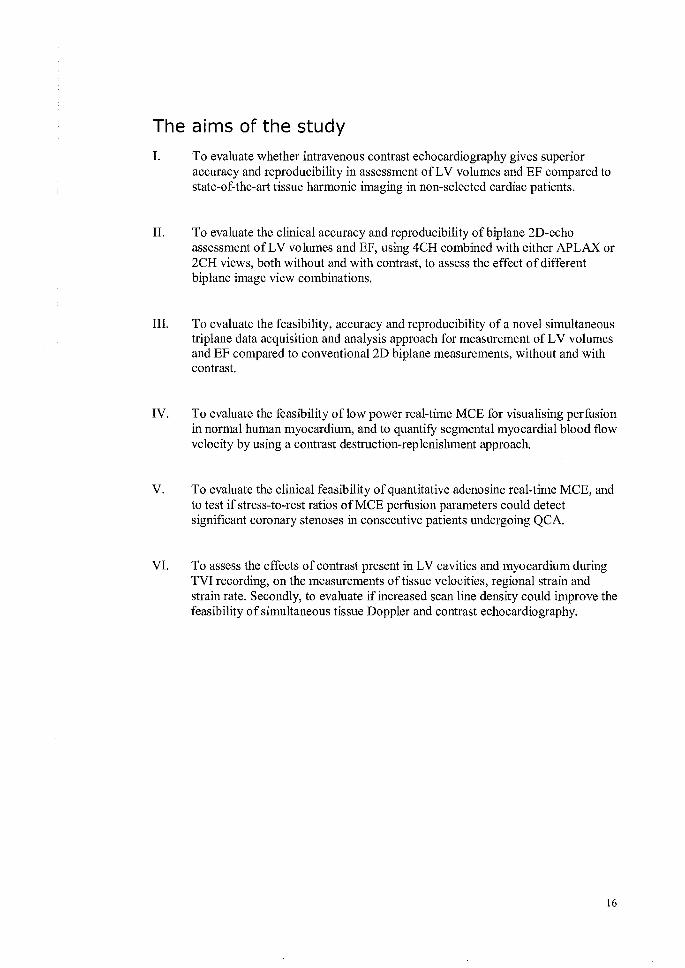
In paper IV, quantitative analysis was done separately for all-frames, and for selected ES and ED frames, whereas in study V only analysis ofES frames was performed ( 47). Segmental values of A,~ (study IV and V) and Ax~ (study V), the latter product regarded as an indicator ofMBF (44), were derived from contrast replenishment curves fitted to the modified exponential function of Wei et al (Fig. 2). Each myocardial segment was attributed to the territory of one of the three main coronary vessels, assuming a balanced coronary circulation (Fig. 3). In paper V, the vasodilator reserves (stress-rest ratios) of the MCE- parameters, termed A (MBV)- reserve,~ (MBF velocity)- reserve and Ax~ (MBF)- reserve, were evaluated on a coronary territorial level.
SI<AU)
I I I I I I l I
~ Sl~ak=A+C --.----~-------------------=.=-·J:=._;,.:.:....;;:__ ____ _ l 03'/1 j If/ ~ ' '"I I i rt:'t I 1 Cft I
~/ 7
I I I I
I I
Refilling curve: y (t) =A (1-e-J3<t-to>) + c ----r-------------------------------------1
I I I I
t=O t=fo Time (ms)
Figure 2 The SI (signal intensity) versus time curve after 'flash', as predicted by the exponential model. The function is used to derive the parameters A (reflecting microvascular cross-sectional area/ myocardial blood volume) and ~ (reflecting myocardial blood flow velocity). At t=to, the starting point after destruction, the refilling curve is not always zero because of incomplete destruction of remaining background signals from tissue. AU, acoustical units.
19

Contrast and tissue velocity imaging
To minimise the effect of artefacts and noise during contrast TVI, the velocity, SR and E
traces were derived from manually placed 3 x 3 mm fixed regions of interest (ROI) in mid septum and mid lateral wall. The offset (strain length) was also reduced compared to the default TVI settings (from 12 to 6 mm), and maximal temporal smoothing (Gaussian 80ms) was applied. Feasibility of obtaining velocity, SR and E curves from the different modalities was evaluated, and peak systolic velocity (PSV), peak systolic strain rate (SRs) and end-systolic strain (Ees) were measured and compared between the different applications without and with contrast.
Magnetic resonance imaging
The MRl studies (papers I-III) were performed with a 1.5 Tesla Symphony™ wholebody system with Quantum Gradients and Syngo 2002B software (Siemens, Erlangen, Germany). Two experienced operators performed the data acquisition. TrueFISP sequences (Fast Imaging with Steady-state free Precession) gives a very satisfactory contrast between cavity and myocardium, avoiding the need for IV MR contrast agent. Echocardiographic and MRl exams were performed within the shortest possible time interval. No change in patient medication or clinical condition between the two studies was accepted. For study I and II, mean time interval was 6 hours (maximum 24 hours for patients with recent myocardial infarction), for study III it was 18 minutes (none more than one hour).
MRl volumes and EF were calculated by a single investigator, blinded to the echo results, using custom-made software programmed in MatLab™ (Math Works, Natick, Mass). To minimise subjectivity in contour tracing, previously described criteria for the tracing of short-axis slices were used, guided by reviewing the images in cine ( 68,69). ES was defined as the first phase of the R-wave triggered sequence andES as the smallest cavity area. The most basal section to be included in the analysis had to show a wall thickness compatible with the LV myocardium that extended at least 50% ofthe circumference. The LV outflow tract was included up to the level ofthe aortic valve. Papillary muscles and rough trabeculations were included in the blood pool, according to the criteria defined for the echocardiographic analysis (17), unless inseparable from the myocardium. The LV volumes were calculated automatically by summation ofthe volume (area x thickness) of all slices. In study II, the ED and ES LV major long-axes from apex to the A V- plane were measured on the 4CH (double oblique) reference views.
Quantitative coronary angiography
An independent, experienced observer, blinded to the MCE data, did quantitative analysis of the coronary angiograms using an automated edge detection system (Phillips Medical Systems, Eindhoven, the Netherlands). The degree of coronary stenosis was expressed as the percent reduction of the internal lumen in relation to the normal, calibrated reference. A significant stenosis was defined as 2: 50% narrowing of the reference lumen diameter, and significant CAD as 2: 50% diameter stenosis of2: 1 major
20

epicardial arteries or their major branches (diameter :2: 2 mm). The significant stenoses were further divided into moderate (50- 74%) and severe(?: 75%).
4-chamber view 2-chamber view Long axis view
LAD ~Lex .. RCA
Figure 3. The different coronary artery beds and their representation in myocardial segments of the left ventricular apical views, given a balanced coronary circulation. LAD, left anterior descending coronary artery; LCx, left circumflex coronary artery; RCA, right coronary artery. Courtesy of Asbjorn Stoylen, Dept. of Circulation and Medical Imaging, NTNU, Trondheim, Norway
Statistics
Continuous data were expressed as mean ± 1 standard deviation and proportions were expressed as percent. The agreement between methods and the repeatability of echo measurements were evaluated by the Bland and Altman method (70). Interobserver and intraobserver variability was in addition calculated as the standard deviation of the mean difference expressed as a percentage ofthe mean (coefficient ofvariation). Grouped data were tested for normal (Gaussian) distribution and compared using two-tailed paired (within patient) and unpaired (between patients) t-tests, or if more than two unpaired groups with univariate analysis of variance (ANOV A) and post-hoc analyses using the Bonferroni 's correction. On paired data, Pitman's test was performed for comparison of variances between methods. The McNemar's test was performed to compare the differences between paired proportions. In paper V, the MCE parameters were averaged for all patients in each segment and coronary territory before statistical analysis, to minimise the influence of interaction. Analysis of variance was applied considering territorial and patient interaction terms. Receiver operating characteristic (ROC) curves were used to compare the predictive ability ofMCE reserves, by calculating sensitivity, specificity, accuracy and areas under the curves (AUC). Commercial software was used for all calculations (SPSS Inc., Tennessee, USA, release 11.0 and 13.0, and Microsoft® Excel 97 SR-2 with the add-in software; Analyse-It version 1.60.0.1). A significance level of .05 was selected.
21

Summary of results
Paper I Accurate and reproducible measurement ofleft ventricular volume and ejection fraction by contrast echocardiography. A comparison with magnetic resonance imaging
The accuracy and reproducibility of contrast echo cardiography was compared to conventional tissue harmonic imaging for measurements ofLV volumes and EF, with reference to MRI in 110 consecutive patients. Contrast echo significantly increased feasibility for biplane volume analysis. The volume underestimation versus MRI found at baseline significantly decreased but was not eliminated with the use of contrast. The 95% limits of agreement between echo and MRI narrowed significantly with contrast [from -18.1 to 8.3%, to -7.7 to 4.1% (EF), from -98.2 to -11.7ml, to -59.0 to 10.7ml (EDV) and from -58.8 to 21.8ml, to -38.6 to 23.9ml (ESV)]. The improved accuracy with contrast was evident even in patients with good image quality at baseline. Precontrast, EF from echo and MRI differed by 2:1 0% (EF units) in 23 patients versus none after contrast. With contrast, classification in the EF subsets < 35%, 35- 54% and 2: 55% was significantly better with reference to MRI. The 95% limits of agreement between two observers and between two readings for volumes and EF (n = 30) narrowed significantly with contrast.
Paper II Choosing apical long-axis instead of two-chamber view gives more accurate biplane echocardiographic measurements of left ventricular ejection fraction: A comparison with magnetic resonance imaging
In 100 consecutive patients, the combination ofapical4CH and 2CH views was compared to the combination of 4CH and APLAX views for biplane measurements, both without and with contrast enhancement. Multislice MRI was used as external reference. The feasibility of biplane volume measurements increased with the use of the APLAX vs. the 2CH view, but significantly only with the use of contrast. Precontrast, 95% limits of agreement for EF compared to MRI were -19.1 to 9.0% (EF units) using 2CH, narrowing to -14.6 to 6.7% using the APLAX view. With contrast, the corresponding limits narrowed from -10.5 to 6.1 %, to -7.3 to 3.8 %, respectively. The improved accuracy with APLAX was present even in patients with good image quality, as well as in patients with regional LV dyssynergy. Intra- and interobserver variability evaluated by Bland and Altman analysis (n = 30) demonstrated narrowing oflimits of agreement by substituting 2CH with APLAX view, both without and with contrast.
22

Paper Ill
Real-time simultaneous triplane contrast echocardiography gives rapid, accurate and reproducible assessment of left ventricular volumes and ejection fraction: A comparison to magnetic resonance imaging
Left ventricular volumes and EF were assessed in 53 consecutive patients by a novel echocardiographic technique simultaneously acquiring three apical planes in real-time, and compared to measurements by conventional 2D imaging and MRI. Echo cardiography was performed both without and with contrast enhancement. The simultaneous trip lane image acquisition was simple and less time-consuming than 2D imaging. Precontrast, feasibility in terms of 'traceability' was poorer for trip lane than 2D biplane images, but equally good with contrast. Bland and Altman analysis demonstrated LV volume underestimation by echo vs. MRI, but significantly less pronounced with LVO with an incremental benefit of using triplane imaging. The agreement with MRI was improved with trip lane compared to conventional 2D biplane imaging, both with and without contrast. At intra- and interobserver analysis of20 patients, limits of agreement for EF narrowed significantly with contrast trip lane compared to 2D biplane echocardiography.
Paper IV
Quantification of resting myocardial blood flow velocity in normal humans using real-time myocardial contrast echocardiography: A feasibility study
Low-power real-time MCE was evaluated in 20 subjects with normal LV wall motion; 10 healthy volunteers and 10 patients with confirmed normal coronary anatomy. Apical LV views were acquired during continuous IV infusion of Sono Vue. Following transient microbubble destruction, the myocardial contrast replenishment rate (~), reflecting MBF velocity, was derived by plotting signal intensity vs. time and fitting the data to an exponential function; y (t) =A (1-e·~(t-tO)) +C. Adequate contrast opacification, indicating myocardial perfusion, could be visualised and quantified in 65% of all myocardial segments, regardless of baseline echo image quality. Feasibility for quantification of A and ~was the best in the 4CH view segments, poorer in the 2CH and APLAX view, with a distribution of analysable segments giving adequate evaluation of the LAD territory, but low feasibility in the posterior circulation. A spatial and temporal variability in estimated MBF was found. Mean values of~ were significantly higher in medial than lateral and in basal compared to apical regions of the scan plane. Significantly higher ~-values were obtained from end-diastolic than endsystolic frames, values from all-frames analysis lying between.
23

PaperV Quantitative adenosine real-time myocardial contrast echocardiography for detection of angiographically significant coronary artery disease
Real-time low-power MCE was performed in 53 patients scheduled for quantitative coronary angiography, but 10 of these were excluded due to poor baseline and resting MCE image quality. The remaining patients proceeded to adenosine MCE, and A, ~ and Ax~ (myocardial blood flow) and their hyperaemic reserves were estimated, assigned to the coronary territories and compared to angiographic data, to evaluate if the presence of significant coronary stenoses (2': 50% lumen diameter stenosis) could be predicted. Segments not eligible due to dropouts and artefacts were mainly located basally and anteriorly. The feasibility of stress real-time MCE covering all coronary territories was 62% of consecutively enrolled patients regardless of image quality, and 77% of patients with good baseline image quality. At rest, there were no significant differences in perfusion parameters between normal and stenosed coronary territories. During hyperaemia, ~ and Ax~, but not A, increased significantly in 'normal' coronary territories, whereas in regions subtended by significantly stenosed arteries there were no significant increases. Between groups, no significant differences were noted at rest, neither for A, ~nor Ax~. During vasodilatory stress, A did not differ significantly between the stenosed and the non-stenosed group, whereas ~ and Ax~ were significantly lower in the stenosed group. Receiver operating characteristic curves indicated that ~- and Ax~ reserves, but not the A- reserve, could be sensitive parameters for detecting flow-limiting coronary stenosis in selected patients. The diagnostic accuracy was better for disease in the LAD than in the RCA and the CX territories.
Paper VI Effects of ultrasound contrast during tissue velocity imaging on regional left ventricular velocity, strain and strain rate measurements
The influence of ultrasound contrast on TVI derived curves and quantitative measurements was studied in midwall segments of the 4CH view in 40 subjects, and secondly, the effects of using double line density during TVI was evaluated. Adding IV contrast significantly reduced feasibility of velocity, SR and 10 curves with standard TVI settings, with particularly noisy data acquired from septum. Even after excluding obviously noisy curves, using cut-off values from previous TVI studies, absolute values ofSR~ and Ees were significantly higher with contrast. There were no significant differences in PSV values between baseline and contrast, neither for septal nor lateral segments. The use of increased TVI line density made contrast velocity traces feasible, and decreased the level of noise and hence the absolute values ofSRs and 10 es· Furthermore, the agreement between PSV, SRs and Ees from contrast and precontrast recordings was improved by the doubled line density. However, the improved feasibility of septal SR and 10 curves with the novel contrast TVI application is not regarded as clinically significant.
24

General discussion
Study subjects
Once inclusion was decided, patients were not excluded for poor echo quality. Feasibility evaluations were therefore made on populations that resemble patients in clinical practice. However, in study V, 10 patients at rest and further 7 during stress were lost due to inadequate MCE quality, i.e. too poor contrast detection to cover all coronary territories, and finally only 62% of consecutive patients scheduled for QCA were left with complete stress-rest-MCE evaluations. Contraindications to the ultrasound contrast agents and MRI made some selection of patients for volume studies, but there is no reason to believe that this should introduce any bias concerning echo image quality.
Because the presence of a prior myocardial infarction increases the probability of finding significant CAD close to 100%, patients with a history of prior myocardial infarction or abnormal regional LV function at rest were excluded in paper V. Twentythree percent of the enrolled patients turned out to have normal coronary arteries, which together with the baseline characteristics indicated that this was a population with intermediate pre-test probability of CAD (71). The mean EF in paper I-II was normal, but with a wide range. In paper III, relatively few patients had subnormal EFs (11% with EF <50%), however, all samples contained a variety ofLV shape and size. More than half of the patients demonstrated LV distortions and regional wall motion abnormalities (60, 55 and 58%, in paper I, II and III, respectively) and about Y4 had severely dilated LVs (23, 29 and 23%, respectively).
LV Volumes and EF
Magnetic resonance imaging provides superior visualisation ofthe LV and is at present regarded as the most accurate and reproducible tool for measurements ofLV volumes (68,69, 72-75). However, in clinical practice it is unsuitable for serial assessments due to low accessibility, lack of portability, high cost and rather long data acquisition and analysis time. Two-dimensional echocardiography is widely available, portable and rapidly performed, but is hampered by a considerable intra- and interobserver variability (76-84). The ASE currently recommends that LV EF should be routinely reported following a complete echocardiographic exam whenever technically feasible (18). The biplane method of discs (modified Simpson's rule) is the preferred method.
Hundley et al reported that, compared to MRI, the clinical use ofiV contrast echocardiography in patients with a variety of LV size, shape and function improved measurements ofEF and classification in subsets compared to native fundamental imaging (33). The advantage of contrast was seen mainly in the group of patients with poor baseline image quality. Thompson et al demonstrated similar findings in comparison with tissue harmonic imaging in 26 patients with LV remodelling due to isolated mitral regurgitation or LV dysfunction, using CT as external reference (34). The study size was small and the mean EF (68%) was surprisingly high in a sample
25

supposed to include patients with systolic LV dysfunction, however, this could be explained by a high proportion of patients with a significant mitral regurgitation
Our paper I was the first study to demonstrate that contrast echo cardiography improved feasibility, reproducibility and agreement with MRI for LV volume and EF measurements, compared to conventional tissue harmonic imaging. Our data even indicated that contrast improved accuracy of studies with good precontrast image quality. The benefits with contrast were also demonstrated in paper II and III, and improvements in accuracy were comparable for patients with regional LV dyssynergy/ distortions and for patients with normal LV s.
Volume underestimation vs. MRI
LV volumes measured by echo frequently have been found to be smaller than those measured from contrast ventriculography and radionuclide angiography (78,80,81,85). Our data demonstrated similar fmdings versus MRI-derived volumes. The underestimation was more pronounced for EDV than ESV, resulting in underestimation ofEF. This tendency was present whatever echo modality or view combination used. With contrast, the underestimation was significantly reduced, more so for the larger volumes. Hundley et al, on the other hand, reported that precontrast echo volumes were larger than the ones calculated from MRI, and that contrast reduced this relative overestimation (33). One possible explanation could be that tracing on fundamental images was done close to the LV epicardium, which could be the practical choice in patients with poor endocardial defmition, resulting in a relative overestimation of volumes. The use of the APLAX in biplane method of discs, and the use of the simultaneous triplane imaging, seemed to reduce the underestimation incrementally compared to standard biplane measurements, giving EF results that were even closer to the reference standard.
There may be several possible explanations to the systematic volume underestimation by echo compared to MRI, and to the improvements with the use of contrast;
Improved endocardial delineation Despite the advantages of tissue harmonic imaging, tracing of endocardial borders as defined by the ASE is often difficult due to trabeculations, irregularities and papillary muscles. In addition, image quality is often worsened in still frames. Ultrasound contrast fills up the intertrabecular spaces, improving the visualisation of the "true" outermost endocardial border and thereby often results in larger area traces.
Image plane position and LV long-axis foreshortening Volume measurements with transthoracic 2D echo is highly dependent on the position and orientation of imaged planes (25,82,83), which again depend on both the individual acoustic access and the operator skill. The transthorasic access is inherently limited by interfering ribs and lungs, restricting the transducer position. Even with adequate access, there are limited means to identify the correct planes in 3D space. Hence, the operator must rely on image content and knowledge of cardiac anatomy. Interpretation often involves mental 3D reconstruction for appreciation of the real shape of the beating
26

heart. A major problem is LV long-axis foreshortening. Erbel et al. reported the transducer position to be superior and anterior to the true anatomical apex in 95% of patients during simultaneous 2D echo and cine ventriculography, giving tangential or oblique imaging planes of the LV (25). Accordingly, cardiac translation could also be an important factor. Since the effect on cavity size by non-equatorial plane position may be more pronounced in systole than in diastole, one may tend to optimise plane position in systole. If the ventricle in diastole dilates non-symmetrically relative to this plane or the heart changes position by translation, the plane will not be equatorial in ED. The use of contrast may to some degree improve plane positioning by giving a better defmition of the left cavity and the endocardial motion, which might ease the recognition of standard planes. But the risk of obtaining tangential scan planes is an inherent methodological problem with the transthorasic access that for obvious reasons cannot be eliminated by contrast enhancement.
The ASE has recommended LV volumes to be computed from the apical4CH and 2CH views (17,18). Nevertheless, the APLAX has occasionally been preferred to the 2CH view due to imaging problems with the latter (19-21). In our study, using the APLAX view in biplane measurements reduced the tendency of volume underestimation. Firstly, the APLAX includes the LV outflow tract. Furthermore, the LV long-axis length was significantly longer for the APLAX than the 2CH images. The data indicated that the LV long-axis foreshortening was an important factor explaining the smaller volumes obtained from the 2CH combination, since multiplying the volumes from the 2CH combination with the APLAX/ 2CH long axis length ratio gave volumes close to those obtained by the APLAX combination. Contributing factors could be that the standard APLAX view offers more recognisable anatomical landmarks for improved identification of the plane. The rectangular shape of the transducer footprint overlying costae during 2CH imaging could reduce access and image quality. However, the most likely explanation is that, with a transducer offset versus the apex, the long axis of the LV is usually aligned with the APLAX view while it runs out of the 2CH plane, resulting in foreshortening. Because the average APLAX long-axis also was even longer than the 4CH long-axis (the 4CH long-axis length being in-between the two other planes), biplane combinations including APLAX would generally generate larger volumes than other combinations.
Simultaneous triplane imaging
Obvious advantages by using simultaneous trip lane imaging, is that once the desired apical reference view is adequately located, there is no need for moving or rotating the probe to acquire the other planes. Image planes were set at about 60 degrees interval, since covering the LV more evenly could be a geometrical advantage. In addition to be timesaving, the simultaneous real-time display simplifies the anatomical orientation and the recognition of non-equatorial plane position, and thereby decreases the risk of loosing the true apex with LV foreshortening. Because it is possible to acquire the necessary images for triplane EF measurements from one single cardiac cycle, the problems with artefacts from respiration and patient movement are reduced.
A disadvantage of trip lane imaging, however, is the lower line density, which reduces image resolution. Another practical problem is that all views are obtained from the same
27

transducer position, and individual planes cannot be optimised by probe position adjustments. These are possible reasons for the lower precontrast image quality observed, and the improvements obtained with contrast imaging. The trip lane volume analysis implies interpolation between 2D traces and thereby some geometric assumptions. Compared to true 3D echocardiography, which allows calculating volumes based on fully available geometric information, triplane imaging is therefore expected to be inferior in accuracy. Studies have reported the need for 4-8 apical views extracted from 3DE data sets to obtain accurate volume measurements in very distorted LVs (39), however, 3DE is still more complicated and time-consuming both regarding data acquisition and analysis. Other studies have demonstrated that the main improvement in bias and variability was obtained moving from uni- to biplane and from biplane to 3 or 4 apical planes, whereas further increasing the number of planes gave limited clinical benefit (82,86,87).
Reproducibility
Reproducibility ofEF measurements by echocardiography was significantly improved by the use of contrast. The choice of APLAX in biplane planimetry and the use of triplane imaging versus 2D-biplane gave incremental benefit to both interobserver and intrao bserver variability.
However, in all three papers contrast gave the largest contribution to the improvements. Our data indicate that the contrast technique has the potential to improve reliability and confidence ofless experienced investigators in evaluating LV systolic function, making serial 2D echo interpretations less operator dependent. The APLAX view generally seems to be easier to identify and trace than the 2CH view due to anatomical landmarks and better access. The change of probe position between the different views in standard 2D imaging is both time-consuming and might contribute to loosing the true apex. Previous works found significant variations between operators with respect to both the angulation and displacement of2DE imaging planes, with foreshortening of apical views as one source of variability (25,82,83). An imaging technique allowing the three apical planes to be obtained in one single operation could eliminate at least some of this variability. In this way, less experienced operators could be expected to acquire more robust LV volume data.
We did not perform assessment of inter-study variability, but we hypothesise that the use of the triplane technique might reduce the likelihood of variation being due to different cut-plane angulations between observers. Of the same reason, real-time trip lane imaging might possibly be an attractive modality in stress echocardiography, which is hampered by the operator dependency, both for acquisition and interpretation (88).
Future perspectives
An important question arising from this study is whether contrast injection should be routinely recommended for echocardiographic assessment ofL V function. The answer to this is 'no'. But there are situations where accurate measurements ofLV volumes and EF are required, particularly when following the course of a disease with serial
28

examinations for early detection ofLV remodelling and/or deterioration of global function. According to the ASE Task Force Guidelines, contrast studies for LVO should be performed in patients with suboptimal baseline echo studies, defined as those in which at least 2 of 6 contiguous segments in a standard apical view are not visualised (89). In contrast to Hundley et al.(33), we did not find that the advantage of contrast echocardiography was limited to subjects with poorer image quality at baseline. The need for contrast is obviously not mandatory for a visual or numerical assessment of EF in patients with excellent image quality. However, according to our results, contrast should be considered whenever an accurate EF or absolute volumes are required for clinical decision making, i.e. in follow-up of post-infarction LV remodelling, end-stage heart failure, heart transplants, cardiotoxic chemotherapy and for timing of valve replacement. The finding of contrast echocardiography being superior to standard echocardiography for classification of patients in the proper EF subsets compared to MRI, emphasise the soundness of such practice.
Magnetic resonance imaging has been the recommended method of choice for longitudinal follow-up of patients undergoing therapeutic interventions in clinical trials; however, conventional echocardiography has often been used for practical reasons. Due to its better reproducibility, we recommend that contrast echocardiography should be considered when LV EF is used as an inclusion or randomisation criterion or as an outcome parameter in clinical trials. As with MRI, the sample size needed to detect LV parameter changes would be reduced. The reduction in time and cost of patient examinations and care would be expected to far outweigh the increase in cost due to the contrast administration.
Quantitative real-time MCE
Feasibility
Despite the reported advances and great enthusiasm in clinical MCE, our studies demonstrate limitations of low-power MCE in quantifying contrast replenishment following transient destruction in real-time. The feasibility was limited due to imaging and technical problems, particularly during stress. The imaging problems were reduced, but not eliminated by careful adjustments of infusion rates and by repositioning the wall of interest more centrally in the scan sector. The most frequent artefacts and dropouts were observed in lateral and basal segments. The LAD area could be adequately evaluated in most study subjects, but contrast detection was more problematic in the posterior circulation, in particular in the LCx bed, as was reported also in previous studies (13,54,58).
Spatial and temporal variability
In paper IV, we demonstrated significant spatial and temporal variability of A and~. which were in accordance with previous experimental results (47,90). The A values decreased moving distally and laterally in the scan sector. Beta was also lower in lateral than more axial parts, but significantly increased at greater depths. One technical explanation to the spatial inhomogeneity is non-uniformity of the sound field (90-92). With a phased array transducer, the delivered acoustic energy is lower laterally than in
29

the centre of the sector, due to the smaller effective aperture and some directivity of the elements (93). Consequently, the resulting backscatter from microbubbles will be inhomogeneous. The effective regional 'flash' energy level could as well be nonuniform and lead to variable bubble destruction, affecting the refilling parameters. Dropouts, attenuation and shadowing artefucts decreasing backscatter, are more pronounced in the lateral and basal regions. Even if contrast infusion rates were balanced carefully relative to the focus position and MI level, the far field attenuation likely contributed to the lowered A in basal parts. The higher ~ in basal than apical segments may seem somewhat more puzzling. A possible explanation could be the narrower beam elevation in the focal zone, which was set close to the mitral valve plane. Following transient contrast destruction, the relatively thinner regions of the scan plane in basal segments could be faster replenished fi"om adjacent areas not affected by desttuction, simply due to the shorter distance.
The refilling parameters were also influenced by the selected phase of the cardiac cycle. In the experimental setting, Leong-Poi et al found that MBF derived from images obtained in ES accurately reflected radio labeled microsphere-derived MBF, whereas this correlation was poor for ED-derived values (47). We reproduced the finding of significantly higher ~ from ED than ES frames. This effect may partly be due to early bubble refilling through larger intramyocardial arterioles that may be patent in diastole, but collapsed during systole (94,95). Furthermore, the myocardium is thicker in systole making the alignment oflarger ROis easier. In diastole, when the myocardium is thinner and localised more laterally in sector, the risk of 'contamination' of strong signals from the pericardium and cavity contrast seems to be greater. Despite the higher coronary flow in diastole, the use ofES frames therefore seems preferable (47).
Furthermore, even if not visually recognised as a problem, microbubble destruction within the LV cavity during flash frames may have influenced the LV blood pool of contrast and thereby the replenishment of the imaged myocardium.
Diagnostic accuracy in chronic CAD
The semi-quantitative visual assessment of regional signal (video) intensity has been the most reported perfusion parameter in previous MCE studies. Besides physiologic aspects of changes in MBV, the assessment of regional myocardial SI is hampered by several physical and technical limitations. It depends on the concentration of microbubbles in blood, which could vary between rest and stress even with constant infusion rate. The acoustic impedance of the chest wall, the attenuation, the previously discussed variable beam elevation and inhomogeneous ultrasound field may all contribute to variations in SI (A) between different beds in different views. Visual online tracking of changes in myocardial SI during real-time imaging after "flash" is difficult because the eye has to follow both movement of myocardium, phasic changes in myocardial SI, and tissue motion artefacts that are displayed as colour signals.
It has been demonstrated that MBV at rest does not change within the rather wide autoregulatory range of coronary driving pressure, and that resting MBF is relatively unaffected in less than 80- 85% diameter stenoses (50,52,53). Myocardial perfusion imaging techniques thus cannot be expected to detect non-critical CAD at rest.
30

Accordingly, we found no differences at rest for A and ~ between areas subtended by non-stenosed and stenosed arteries. With adenosine stress, however, there was a significant increase in ~ and Ax~ in the normal group, but no corresponding increase in the stenosed group giving a significantly higher ~ and Ax~ reserves in the former. Reductions of these reserves to below cut-off values of 1. 7~ and 2.06, respectively, detected the presence of significant CAD with a diagnostic accuracy of75% and 73%, respectively. No such difference was found for A and its reserve, thus hyperaemic Areserves did not seem to have any diagnostic value for detection of significant CAD. However, in the subgroup with severe (2: 75%) diameter stenosis, even resting values of both A, ~ and Ax~ tended to be lower than in the normal group, and one possible explanation to this could be capillary de-recruitment or damaged microvasculature with inadequate collateral circulation (53).
Our fmdings are in accordance with the experimental study of Leong-Poi et al comparing real-time and intermittent harmonic imaging, and Lafitte et al using real-time MCE (47,90). They reported that A values, in contrast to~' correlated poorly with reference flow measurements using radio labeled microspheres. Our results also compares well with the clinical study of Wei et al, in which quantitative intermittent MCE was compared to coronary Doppler flow wire measurements (56). We as well noted decreasing ~ and Ax~ reserves with increasing stenosis severity. However, the limited number of patients with different degrees of stenosis precludes firm conclusions on a subgroup level. Furthermore, the presence and variable degree of collateral flow complicates interpretation of the MCE measurements. As for feasibility, the diagnostic accuracy was better in the anterior than the posterior circulation. This is not very surprising in light ofthe imaging problems and poorer contrast detection experienced in segments allocated to RCA and LCx compared to the LAD bed.
Advantages of real-time MCE
A definite advantage of real-time MCE is the short data acquisition time. Information that would require minutes with intermittent imaging was recorded during seconds, making it possible to obtain all refill frames during one breath-hold. A contrast infusion time of 5- 6 minutes allowed us to acquire several replenishment loops from each scan view in every subject. Furthermore, the low power minimises microbubble destruction and allows continuous imaging during replenishment. The frame rate about 20 Hz is much lower than in standard imaging, but gives sufficient spatial and temporal resolution to allow anatomical orientation and visual wall motion assessment.
Problems with/ disadvantages of real-time MCE
Insufficient contrast detection with low agent-to-tissue signal ratio still remains a basic problem in perfusion imaging with low power pulse inversion Doppler. Compared to destructive intermittent imaging, the backscatter from non-destructive microbubble behaviour is substantially weaker. A larger amount of contrast agent is required, which must be carefully balanced against the degree of depth-dependent attenuation. Some tissue harmonics will always remain in spite of very low power, and the movement artefacts are probably not completely eliminated by the addition of power Doppler.
31

Excessive destruction of microbubbles in the LV cavity from multiple flash frames could affect myocardial replenishment, and some microbubble destruction may also occur during imaging due to the relative high frame rates.
Limitations of the quantitative destruction-replenishment approach
Given a beam elevation of less than 5 mm at focus, it is mandatory to maintain a stable probe position during the destruction-replenishment period. Inaccurate image alignment of segmental myocardial ROis, both within each destruction- replenishment sequence, and between rest and stress, might influence their assignment to segments and coronary territories. It is important to verify that the selected ROI remains inside the myocardium in all the images of the sequence, otherwise noise corrupts the analysis. Reviewing the sequences frame-by-frame and manually adjusting the ROis is however very time consuming.
Linearity between SI and contrast concentration is usually assumed, but this is not necessarily the case in clinical studies. The non-linearity introduced by using a logarithmic scale is not supposed to be a problem as it can be mathematically corrected. However, the reliability of the perfusion parameters is limited by the goodness-of-fit of the exponential model to the perfusion process. In particular, noise in the initial part of the curve could affect the perfusion parameters. The value ofSI is proportionally scaled on they-axis assuming the intensity value of the first frame after flash to be the starting point of the best-fit procedure. However, our software allows where to set t = 0 (to), and the start of the refilling curve was set in the initial post-flash moment of minimal myocardial contrast opacification. This correction can be applied only when raw data are available, since contrast SI has to be separated from tissue signals. To further compensate for inadequate destruction or tissue signals present after flash, the software performs an intensity shift. By rescaling the minimum post-flash brightness to zero, since SI recorded at t=to is not due to the contrast agent, we added a constant term C to account for the initial value (the cross-point of they-axis). The curve fitting was thus assumed to be relatively independent of background myocardial SI. These corrections introduce modifications to the exponential equation of Wei eta!; y (t) =A (1-e-~<t- tO)) + c (Fig. 2).
Future perspectives
Despite the rapid data acquisition with real-time MCE, the method is still technically demanding and requires an experienced operator. The analysis and interpretation of data is rather difficult and time-consuming, and there is a lack of consensus about the appropriate combination ofMCE data acquisition and analysis. Interestingly, a simplified algorithm using qualitative assessment ofMBF velocity from a single intermittent stress MCE perfusion study was able to detect CAD in patients with normal LV function at rest, avoiding the need for resting MCE studies (96). The time to complete myocardial opacification after contrast destruction was used as a surrogate of MBF velocity. This approach would be time- and contrast saving, and the need for stable image alignment from rest to stress is avoided. However, in stress studies it is still
32

a challenge to maintain a stable probe position for good image alignment during longer pulsing intervals of intermittent imaging. Automated analysis with colour-coded parametric display of the MCE parameters is desirable, but so far methods for contrast detection, myocardial tracking and postprocessing have not been fast and robust enough for clinical use. Further large-scale clinical studies involving multiple centres are needed to better defme the sensitivity and specificity of real-time MCE in the diagnosis of CAD and its role for patient outcome.
Contrast and tissue velocity imaging
There may be several reasons why the presence of contrast significantly reduced the feasibility of tissue Doppler data and influenced the quantitative measurements of velocity, SR and c. The velocity ofblood inside myocardial capillaries is low (about 0.1 em/sec) compared to tissue velocities (up to 10 em/sec), thus the intramyocardial contrast moves with virtually the same velocities as the surrounding tissue (61,95). Destruction of intramyocardial bubbles by ultrasound could be expected to increase random noise in the TVI Doppler signal. However, since the noise level was similar during high and low power TVI imaging, it is unlikely that the noise increase with contrast was caused by intramyocardial bubble destruction. High amplitude backscatter from the larger contrast amounts in the cavities was more likely to influence the TVI data. Indeed, we did find that intracavitary signal increased to an amplitude level comparable to, or even higher than the tissue signals. The contrast velocity traces were thus likely results of averaging myocardial tissue signals and high velocity aliased contrast signals from the nearby cavities picked up by side-lobes. The finding of more noisy TVI data in septal than lateral segments further supported the importance of cavity contrast signals, with side-lobe effects from both cavities in the former.
Since the derivation ofSR from multiple velocity data sets is generally very susceptible to noise components, it was not surprising that the SR curves were more disturbed by contrast than the velocity traces. Using increased line density during TVI recording improved the feasibility of velocity traces and decreased the level of noise in SR and e. curves. In this application, the receiving beams are located closer to the transmitting beam (with multi-line acquisition there are receiving beams on each side of the transmit beam), probably resulting in less pronounced side-lobe effects. This was supported by our finding that the high line density application reflected tissue velocities better than both the standard TVI and the low power LVO TVI when contrast was present. To minimise the effect of noise of contrast, we reduced the spatial averaging and increased the temporal smoothing. On the other hand, these changes might have increased the variability in SR due to non-random noise.
Future perspectives
We certainly do not recommend the use of contrast to enhance poor baseline TVI signal quality. In fact, intracavitary contrast signals might contribute to relatively greater disturbing effects, both due to weaker myocardial velocity signals, and due to abenations and reverberations. In DSE, the en-or in measured tissue velocity resulting from circulating contrast can only be avoided ifTVI measurements are performed prior
33

to contrast administration. However, as recording has to be performed both at rest and during stress, and modem agents may remain in the circulation during tens of minutes, the use of contrast during TVI can ruin the comparisons of velocity during rest and stress, and between perfused and non-perfused myocardium.
Safety
As a result ofthe adverse reactions possibly related to the use ofSonoVue reported in 2004, there has lately been an increased focus on the safety with contrast echocardiography. In our studies, 321 patients received contrast, of which 73 received continuous infusions lasting up to 10 minutes with doses of9.5 and 5.4 m1 SonoVue and Optison, respectively. Mean contrast dose in the volume studies was very low compared to the recommended maximal doses from EMEA (1-3). One patient reported a slight change of taste during contrast injection, otherwise no side effects were reported nor did any adverse event or significant hemodynamic changes occur. In three patients of paper V, the protocol was aborted during simultaneous adenosine and contrast infusion due to atrial fibrillation or chest pain, interpreted as probable adverse reactions to adenosine. However, validation of safety was not an aim of this study, and blood tests were not obtained.
34

Limitations of the study
It was of obvious reasons not possible to blind the readers to the different echo modalities, views or the presence of contrast. This introduces the possibility of bias. Nevertheless, the different cineloops from each patient were analysed in random order and at different time points, and the investigators were always blinded to the results of prior measurements.
The heterogeneity of the study population in paper I and II may limit the impact of results on a subgroup level. However, by performing examinations on consecutive patients, the sample will to a greater degree reflect the population in clinical practice. The limited study size, particularly in study IV and V, precluded firm conclusions concerning subgroups. The patients fulfilling adequate rest and stress MCE for comparative perfusion analysis were selected from image quality, and the results therefore cannot be transferred to unselected patients with suspected or known CAD.
The main limitation of paper IV is that we did not induce blood flow changes, i.e. induction of hyperaemia, for comparison with baseline levels. Regional resting perfusion is difficult to interpret and is normally variable, both between segments and within and between study subjects, and this variability is further reinforced by imaging and technical problems with the applied destruction-replenishment kinetics.
In paper V, quantitative MCE data were related to anatomically significant coronary artery stenosis, and not to a reference perfusion method. At the time this study was performed, the SPECT lab at the St Olavs University Hospital was not adequately equipped for serving as reference standard. One limitation of QCA as the external reference is that we could not determine the effect of collateral flow on our measurements. Nevertheless, QCA is considered the reference standard for examination of epicardial coronary anatomy and finite diagnosis of CAD, and it is mandatory for the choice of invasive treatment.
A potential source of error and variability in MRI volume analysis is the selection of which basal slices to include or exclude. To reduce this error, special care was taken to review short-axis slice projections onto the long-axis reference views and perform tracings with support from cine movies. The chosen method of outer-border endocardial tracing in MRI, i.e. including trabeculations and papillary muscles in the blood pool, might have exaggerated differences between echo and MRI due to a greater tendency to exclude trabeculations in systole in MRI.
In our volume reproducibility studies we did not perform repeated echo examinations, only repeated analysis of digital recordings. Since previous groups have found that repeated recordings contributed the greatest source of variability to EF echo measurements (19), the adding ofinterstudy variability could have provided us with more complete and clinically relevant information about the effects of contrast enhancement.
35

Conclusions
I Contrast echocardiography gave more feasible, accurate and reproducible measurements of LV volumes and EF than conventional tissue harmonic imaging in unselected cardiac patients, regardless of baseline image quality. Contrast enhancement should be considered, not only in very difficult-to-image patients, but whenever it is considered important to have precise and repeatable measurements ofLV size and global systolic performance.
II The use of the APLAX rather than the 2CH view, in combination with the 4CH view, improved feasibility, accuracy and reproducibility of biplane EF measurements in unselected cardiac patients. These beneficial effects were also evident with contrast echocardiography. Therefore we recommend the use of APLAX rather than the 2CH view for biplane EF calculations, particularly when serial measurements are required.
III Simultaneous LV triplane imaging is clinically feasible with simple and rapid image acquisition and volume analysis. Our study indicates that triplane with LVO gives more accurate and reproducible LV EF measurements than conventional 2D biplane imaging.
IV Low-power real-time MCE can provide contrast opacification in multiple myocardial segments in normal human myocardium. However, the acquisition of flashreplenishment loops adequate for quantification was limited by imaging and technical problems. The absolute values ofMBF velocity were highly influenced by ultrasound field geometry and cardiac phase and need to be interpreted with regard to this variability. Regional MBF velocity is probably best applied by using analysis of relative changes.
v The MBF and MBF velocity reserves derived from low-power adenosine real-time MCE with pulse inversion power Doppler can accurately identify anatomically significant CAD in selected patients. However, the technique is still limited by imaging artefacts and time-consuming analysis, and the diagnostic accuracy only seems sufficient for disease involving LAD.
VI Strain rate imaging is not feasible when performed with IV contrast during TVI with conventional settings, and we do not recommend the clinical use of this combination. Increasing the beam line density made tissue velocity curves with contrast feasible with less noisy strain rate and strain curves. Due to the increased variability of strain rate and strain, which is already too high in unenhanced data, TVI and contrast in combination is still not clinically applicable even with the increased line density modification.
36

References
1. http:/ !www. eudra.org/humandocs/humans/ epar/Optison/ optison. htm. 2. http:/ /www.eudra.org/humandocs/humans/epar/Sono Vue/sonovue.htm. 3. http://www. eudra.org/humandocs/humans/ epar/Definity/ definity.htm. 4. Becher H, Bums PN ( eds ). Handbook of contrast echocardiography 2000: 48-78. 5. Wei K, Skyba DM, Firschke C, Jayaweera AR, Lindner JR, Kaul S. Interactions
between microbubbles and ultrasound: in vitro and in vivo observations. JAm Coli Cardiol1997;29:1081-1088.
6. de Jong N, Bouakaz A, Prinking P. Basic acoustic properties ofmicrobubbles. Echocardio graphy 2002; 19:229-240.
7. Wei K, Kaul S. The coronary microcirculation in health and disease. Cardiol Clin 2004;22:221-31.
8. Kaul S, Ito H. Microvasculature in acute myocardial ischemia: Part I. Evolving concepts in pathophysiology, diagnosis and treatment. Circulation 2004; 109:146-49.
9. Porter TR, Xie F, Kricsfeld D, Armbruster RW. Improved myocardial contrast with second harmonic transient ultrasound response imaging in humans using intravenous perfluorocarbon-exposed sonicated dextrose albumin. J Am Coli Cardiol1996, 27:1497-1501.
10. Kaul S, Senior R, Dittrich H, Raval U, Khattar R, Lahiri A. Detection of coronary artery disease with myocardial contrast echocardiography: comparison with 99mTcsestamibi single-photon emission computed tomography. Circulation 1997, 96:785-92.
11. Becher H, Tiemann K, SchliefR, Luderitz B, Nanda NC: Harmonic Power Doppler Contrast Echocardiography: Preliminary Clinical Results. Echocardiography 1997;14:637.
12. Senior R, Kaul S, Soman P, Lahiri A. Power Doppler harmonic imaging: A feasibility study of a new technique for the assessment of myocardial perfusion. Am Heart J 2000;139:245-51.
13. Heinle S, Noblin J, Goree-Best P, Mello A, Rayad G, MullS, et al. Assessment of myocardial perfusion by Harmonic Power Doppler Imaging at rest and during adenosine stress. Comparison with 99mTc-Sestamibi SPECT Imaging. Circulation 2000; 102:55-60.
14. Tiemann K, Lohmeier S, Kuntz S, Koster J, Pohl C, Bums P, et al. Real-time contrast echo assessment of myocardial perfusion at low emission power: First experimental and clinical results using power pulse inversion imaging. Echocardiography 1999;16:799-809.
15. Porter TR, Xie F, Silver M, Kricsfeld D, Oleary E. Real-time perfusion imaging with low mechanical index pulse inversion Doppler imaging. J Am Coli Cardiol 2001 ;37:748-53.
16. Wei K, Jayaweera AR, Firoozan S, Linka A, Skyba DM, Kaul S. Basis for detection of stenosis using venous administration ofmicrobubbles during myocardial contrast echocardiography: bolus or continuous infusion? JAm Coli Cardiol1998;32:252-60.
17. Schiller NB, Shah PM, Crawford M, DeMaria A, Devereux R, Feigenbaum H, et al. Recommendations for quantification of the left ventricle by two-dimensional echocardiography. JAm Soc Echocardiogr 1989;2:358-67.
37

18. Lang R, Bierig M, Devereux RB, et al. Recommendations for Chamber Quantification: A Report from the American Society ofEchocardiography's Guidelines and Standards Committee and the Chamber Quantification Writing Group, Developed in Conjunction with the European Association of Echocardiography, a Branch of the European Society of Cardiology. JAm Soc Echocardioagr 2005;18;1440-63.
19. Otterstad JE, Froeland G, StJohn Sutton M, Holme I. Accuracy and reproducibility of! eft ventricular dimensions and function. Eur Heart J 1997; 18 507-13.
20. Nosir YFM, Vletter WB, Boersma E, Frowijn R, Ten Cate FJ, Fioretti PM, et al. The apical long-axis rather than the two-chamber view should be used in combination with the four-chamber view for accurate assessment ofleft ventricular volumes and function. Eur Heart J 1997;18 1175-85.
21. StJohn Sutton M, Otterstad JE, Plappert T, Parker A, Sekarski D, Keane MG, et al. Quantification of left ventricular volumes and ejection fraction in post-infarction patients from biplane and single plane two-dimensional echocardiograms. A prospective longitudinal study of371 patients. Eur Heart J 1998;19 808-16.
22. Bellenger NG, Burgess MI, Ray SG. Comparison ofleft ventricular ejection fraction and volumes in heart failure by echocardiography, radionucleide ventriculography and cardiovascular magnetic resonance. Are they interchangeable? Eur Heart J 2000;21: 1387-96.
23. Spencer KT, Bednarz J, Mor-A vi V, Weinert L, Tan J, Godoy I, Lang RM. The role of echocardiographic harmonic imaging and contrast enhancement for improvement of endocardial border delineation. JAm Soc Echocardiography 2000; 13: 131-8.
24. Kasprzak JD, Paelinck B, Ten Cate FJ, et al. Comparison of native and contrastenhanced harmonic echocardiography for visualization of left ventricular endocardial border. Am J Cardiol1999;83:211-17.
25. Erbel R, Schweizer P, Lambertz H, Henn G, Meyer J, Krebs W, et al. Echo ventriculography-- a simultaneous analysis of two-dimensional echocardiography and cineventriculography. Circulation 1983;67:205-15.
26. Dolan MS, Riad K, El- Shafei A, et al. Effect of intravenous contrast for left ventricular opacification and border definition on sensitivity and specificity of dobutamine stress echocardiography compared with coronary angiography in technically difficult patients Am Heart J 142 (5):908-915, 2001.
27. Reilly JP, Tunick PA, Timmermans RJ et al. Contrast echocardiography clarifies uninterpretable wall motion in intensive care unit patients. JAm Coll Cardiol 2000;35:485-90.
28. Kornbluth M, Liang DH, Brown P, Brown P, Gessford E, Schnittger I. et al. Contrast echocardiography is superior to tissue harmonics for assessment of left ventricular function in mechanically ventilated patients. Am Heart J 2000;140:291-6.
29. Cohen JL, Cheirif J, Segar DS, et al. Improved left ventricular endocardial border delineation and opacification with Optison (FS069), a new echocardiographic contrast agent; results of a phase III multicenter trial. JAm Coll Cardiol 1998;32:746-52.
30. Senior R, Andersson 0, Caidahl Ketal. Enhanced left ventricular endocardial border delineation with an intravenous injection of Sono Vue, a new
38

echocardiographic contrast agent: A European multicenter study. Echocardiography 2000;17:705-11.
31. Malhotra V, Nwogu J, Bondmass MD, et al. Is the technically limited echocardiographic study an endangered species? Endocardial border defmition with native tissue harmonic imaging and Optison contrast: a review of200 cases. JAm Soc Echocardiogr 2000;13:771-3.
32. Yu EH, Sloggett C, Iwanochko M, Rakowski H, Siu S. Feasibility and accuracy of left ventricular volumes and ejection fraction determination by fundamental, tissue harmonic and intravenous contrast imaging in difficult-to-image patients. JAm Soc Echocardiogr 2000;13:216-24.
33. Hundley WG, Kizilbash AM, Afridi I, et al. Administration of an intravenous perfluorocarbon contrast agent improves echocardiographic determination of left ventricular volumes and ejection fraction: Comparison with cine magnetic resonance imaging. JAm Coll Cardiol1998;32:1426-32.
34. Thomson HL, Basmadjian A, Rainbird A et al. Contrast echocardiography improves the accuracy and reproducibility of left ventricular remodelling measurements. A prospective, randomly assigned, blinded study. JAm Coll Cardiol2001,38:867-75.
35. Qin JX, Jones M, Shiota T, Greenberg NL, Tsujino H, Firstenberg MS, Gupta PC, Zetts AD, Xu Y, Ping Sun J, et al. Validation of real-time three-dimensional echocardiography for quantifying left ventricular volumes in the presence of a left ventricular aneurysm: in vitro and in vivo studies. JAm Coll Cardiol2000;36:900-7.
36. Lee D, Fuisz AR, Fan PH, Hsu TL, Liu CP, Chiang HT. Real-time 3-dimensional echocardiographic evaluation ofleft ventricular volume: correlation with magnetic resonance imaging-a validation study. JAm Soc Echocardiogr 2001;14:1001-9.
37. Jenkins C, Bricknell K, Hanekom L, Marwick TH. Reproducibility and accuracy of echocardiographic measurements of left ventricular parameters using real-time three-dimensional echocardiography. JAm Coll Cardiol2004;44:878-86.
38. Bu L, Munns S, Zhang H, Disterhoft M, Dixon M, Stolpen A, et al. Rapid full volume data acquisition by real-time 3-dimensional echocardiography for assessment of left ventricular indexes in children: A validation study compared with magnetic resonance imaging. JAm Soc Echocardiogr 2005;18:299-305.
39. Gutierrez-Chico JL, Zamorano JL, Perez de Isla L, Orejas M, Almeria C, Rodrigo JL, et al. Comparison of left ventricular volumes and ejection fractions measured by three-dimensional echocardiography versus by two-dimensional echocardiography and cardiac magnetic resonance in patients with various cardiomyopathies. Am J Cardiol. 2005 Mar 15;95:809-13.
40. Uren NG, Melin JA, DeBruyne B, et al. Relation between myocardial blood flow and the severity of coronary-artery stenosis. N Eng! J Med 1994;330(25): 1782-8.
41. Gould KL, Lipscomb K. Effects of coronary artery stenoses on coronary flow reserve and resistance. Am J Cardiol1974;34:48-55.
42. Rovai D, DeMaria A, L'Abbate A. Myocardial contrast echocardiography effect: the dilemma of coronary blood flow and volume. JAm Coll Cardiol1995;26;12-17.
43. Gould KL. Detecting and assessing severity of coronary artery disease in humans. Cardiovasc Intervent Radioll990;13(1):5-13.
39

44. Wei K, Jayaweera AR, Firoozan S, Linka A, Skyba DM, Kaul S. Quantification of myocardial blood flow with ultrasound-induced destruction ofmicrobubbles administered as a constant venous infusion. Circulation 1998;97:473-83.
45. Masugata H, Peters B, Lafitte S, Strachan GM, Ohrnori K, DeMaria AN. Quantitative assessment of myocardial perfusion during graded coronary stenosis by real-time myocardial contrast echo refilling curves. JAm Coll Cardiol2001;37:262-9.
46. Masugata H, Lafitte S, Peters B, Strachan GM, DeMaria AN. Comparison of realtime and intermittent triggered myocardial contrast echocardiography for quantification of coronary stenosis severity and transmural perfusion gradient. Circulation 2001; 104:1550-56.
47. Leong-Poi H, LeE, Rim SJ, Sakuma T, Kaul S, Wei K. Quantification of myocardial perfusion and determination of coronary stenosis severity during hyperemia using real-time myocardial contrast echocardiography. J Am Soc Echocardiogr 2001; 14:1173-82.
48. Van Camp G, Ay T, Pasquet A, London V, BolA, Gisellu G, et al. Quantification of myocardial blood flow and assessment of its transmural distribution with real-time power modulation myocardial contrast echocardiography. J Am Soc Echocardiogr 2003;16:263-70.
49. Von Bibra H, BoneD, Niklasson U, Eurenius L, Hansen A. Myocardial contrast echocardiography yields best accuracy using quantitative analysis of digital data from pulse inversion technique: Comparison with second harmonic imaging and harmonic power Doppler during simultaneous Dipyridamol stress SPECT studies. Eur J Echocardiography 2002;3 :271-82.
50. Wilson RF. Assessing the severity of coronary artery stenoses. N Eng J Med 1996;334: 1735-37.
51. Ogilby JD, Heo J, Iskandrian AS. Effect of adenosine on coronary blood flow and its use as a diagnostic test for coronary artery disease. Cardiovasc Res 1993;27:48-53.
52. Jayaweera AR, Wei K, Coggins M, Bin JP, Goodman C, Kaul S. Role of capillaries in determining CBF reserve: New insights using myocardial contrast echocardiography. Am J Physiol1999;277:H 2363-72.
53. Le DE, Jayaweera AR, Wei K, Coggins MP, Lindner JR, Kaul S. Changes in myocardial blood volume over a wide range of coronary driving pressure: role of capillaries beyond the autoregulatory range. Heart 2004;90: 1199-1205.
54. Cwajg J, Xie F, O'Leary E, Kricsfeld D, Dittrich H, Porter TR. Detection of angiographically significant coronary artery disease with accelerated intermittent imaging after intravenous administration of ultrasound contrast material. Am heart J 2000;139:675-683.
55. Shimoni S, Zoghbi W A, Xie F, Kricsfeld D, Iskander S, Go bar L, et al. Real-time assessment of myocardial perfusion and wall motion during bicycle and treadmill exercise echocardiography: comparison with single photon emission computed tomography. JAm Coll Cardiol2001;37:741-47.
56. Wei K, Ragosta M, Thorpe J, Coggins M, Moos S, Kaul S. Noninvasive quantification of coronary blood flow reserve in humans using myocardial contrast echo cardiography. Circulation 2001 ;1 03:2560-65.
40

57. 0 lszowska M, Kostkiewicz M, Tracz W, Przewlocki T. Assessment of myocardial perfusion in patients with coronary artery disease. Comparison of myocardial contrast echocardiography and 99mTc MIBI single photon emission computed tomography. Int J Cardiol2002;90:49-55.
58. Rocchi G, Fallani F, Bracchetti G, Rapezzi C, Ferlito M, Levorato M, et al. Noninvasive detection of coronary artery stenosis:a comparison among power-Doppler contrast echo, 99mTc-sestami SPECT and echo wall-motion analysis, Coron Art Dis 2003;14:239-45.
59. Moir S, Haluska B, Jenkins C, et al. Incremental Benefit of Myocardial Contrast to Combined Dipyridamole-Exercise Stress Echocardiography for the Assessment of Coronary Artery Disease. Circulation. 2004; 110:1108-13.
60. Peltier M, Vancraeynest D, Pasquet A, Ay T, Roelants V, D'hondt AM, et al. Assessment of the physiologic significance of coronary disease with dipyridamole real-time myocardial contrast echocardiography. Comparison with technetium-99m sestamibi single-photon emission computed tomography and quantitative coronary angiography. JAm Coli Cardiol2004;43:257-64.
61. Sengupta PP, Mohan JC, Pandian NG. Tissue Doppler echocardiography: principles and applications. Indian Heart J 2002;54:368-78
62. Lange A, Palka P, Caso P, Fenn LN, Olszewski R, Ramo MP, et al. Doppler myocardial imaging vs. B- mode gray- scale imaging: a comparative in vitro and in vivo study into their relative efficacy in endocardial boundary detection. Ultrasound Med Biol1997;23:69-75.
63. Sutherland GR, Stewart MJ, Groundstroem KW, Moran CM, Fleming A, Guellperis FJ, et al. Color Doppler myocardial imaging: a new technique for assessment of myocardial function. JAm Soc Echocardiogr 1994;7:441-58.
64. Heimdal A, Stoylen A, Torp H, Skjaerpe T. Real-time strain rate imaging of the left ventricle by ultrasound. JAm Soc Echocardiogr 1998;11:1013-20.
65. Fleming D, Xia X, McDicken WN, Sutherland GR, Fenn L. Myocardial velocity gradients detected by Doppler imaging. Br J Radiol1994;799:679-88.
66. Sutherland G, DiSalvo G, Claus P, D'Hooge J, Bijnens B. Strain and strain rate imaging: A new clinical approach to quantifying regional myocardial function. J Am Soc Echocardiogr 2004;17:788-802.
67. Goldman RN. Area of planar polygons and volume of polyhedra. In: Graphics Gems II, Glassner A, Arvo J, Kirk D, editors: Reed Elsevier Group plc.,1994:170-71.
68. Sakuma H, Fujita N, Foo TK et al. Evaluation ofleft ventricular volume and mass with breathhold cine MR imaging. Radiology 1993;88:1715-23.
69. Alfakih K, Reid S, Jones T, Sivananthan M. Assessment of ventricular function and mass by cardiac magnetic resonance imaging. Eur Radiol2004; 14:1813-22.
70. Bland JM, Altman DG. Statistical methods for assessing agreement between two methods of clinical measurements. Lancet 1986;1:307-10.
71. Wilson PWF, D'Agostino RB, Levy D, Belanger AM, Silbershatz H, Kannel WB. Prediction of coronary heart disease using risk factor categories. Circulation 1998;97: 1837-1847.
72. Longmore DB, Klipstein RH, Underwood SR, et al. Dimensional accuracy of magnetic resonance in studies ofthe heart. Lancet 1985;1:1360-62.
41
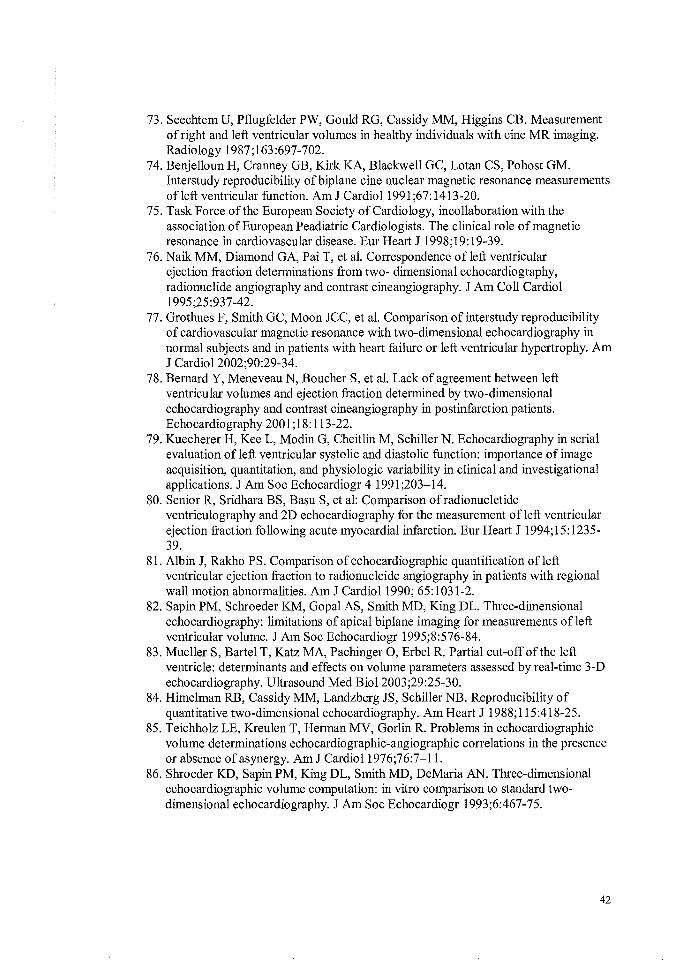
73. Seechtem U, Pflugfelder PW, Gould RG, Cassidy MM, Higgins CB. Measurement of right and left ventricular volumes in healthy individuals with cine MR imaging. Radiology 1987;163:697-702.
74. Benjelloun H, Cranney GB, Kirk KA, Blackwell GC, Lotan CS, Pohost GM. Interstudy reproducibility of biplane cine nuclear magnetic resonance measurements of left ventricular function. Am J Cardioll991 ;67: 1413-20.
75. Task Force of the European Society of Cardiology, incollaboration with the association of European Peadiatric Cardiologists. The clinical role of magnetic resonance in cardiovascular disease. Eur Heart J 1998;19:19-39.
76. Naik MM, Diamond GA, Pai T, et al. Correspondence ofleft ventricular ejection fraction determinations from two- dimensional echocardiography, radionuclide angiography and contrast cineangiography. JAm Coll Cardiol 1995;25:937-42.
77. Grothues F, Smith GC, Moon JCC, et al. Comparison of interstudy reproducibility of cardiovascular magnetic resonance with two-dimensional echocardiography in normal subjects and in patients with heart failure or left ventricular hypertrophy. Am J Cardiol2002;90:29-34.
78. BernardY, Meneveau N, Boucher S, et al. Lack of agreement between left ventricular volumes and ejection fraction determined by two-dimensional echocardiography and contrast cineangiography in postinfarction patients. Echocardiography 2001 ;18:113-22.
79. Kuecherer H, KeeL, Modin G, Cheitlin M, Schiller N. Echocardiography in serial evaluation of left ventricular systolic and diastolic function: importance of image acquisition, quantitation, and physiologic variability in clinical and investigational applications. JAm Soc Echocardiogr 4 1991;203-14.
80. Senior R, Sridhara BS, Basu S, et al: Comparison of radionucletide ventriculography and 2D echocardiography for the measurement ofleft ventricular ejection fraction following acute myocardial infarction. Eur Heart J 1994; 15:1235-39.
81. Albin J, Rakho PS. Comparison of echocardiographic quantification of left ventricular ejection fraction to radionucleide angiography in patients with regional wall motion abnormalities. Am J Cardioll990; 65:1031-2.
82. Sapin PM, Schroeder KM, Gopal AS, Smith MD, King DL. Three-dimensional echocardiography: limitations of apical biplane imaging for measurements of left ventricular volume. JAm Soc Echocardiogr 1995;8:576-84.
83. Mueller S, BartelT, Katz MA, Pachinger 0, Erbel R. Partial cut-off of the left ventricle: determinants and effects on volume parameters assessed by real-time 3-D echocardiography. Ultrasound Med Biol2003;29:25-30.
84. Himelman RB, Cassidy MM, Landzberg JS, Schiller NB. Reproducibility of quantitative two-dimensional echocardiography. Am Heart J 1988; 115:418-25.
85. Teichholz LE, Kreulen T, Herman MV, Gorlin R. Problems in echocardiographic volume determinations echocardiographic-angiographic correlations in the presence or absence of asynergy. Am J Cardiol1976;76:7-11.
86. Shroeder KD, Sapin PM, King DL, Smith MD, DeMaria AN. Three-dimensional echocardiographic volume computation: in vitro comparison to standard twodimensional echocardiography. JAm Soc Echocardiogr 1993;6:467-75.
42

87. Aakhus S, Maehle J, Bjoernstad K. A new method for echocardiographic computerized three-dimensional reconstruction of left ventricular endocardial surface: In vitro accuracy and clinical repeatability of volumes. JAm Soc Echocardiogr 1994;7:571-81.
88. Hoffmann R, Lethen H, Marwick T, Arnese M, Fioretti P, Pingitore A, et al. Analysis of interinstitutional observer agreement in interpretation of dobutamine stress echocardiograms. JAm Coll Cardiol1996;27:330-6.
89. Mulvagh S, DeMaria AN, Feinstein SB, et al. ASE position paper. Contrast echocardiography: Current and future applications. JAm Soc Echocardiogr 2000; 13:331-42.
90. Lafitte S, Masugata H, Peters B, Togni M, Strachan M, Yao B, Kwan OL, DeMaria AN: Accuracy and reproducibility of coronary flow rate assessment by real-rime contrast echocardiography: In vitro and in vivo studies. J Am Soc Echocardiogr 2001 '14: 1010-19.
91. Weyman AE: Principles and practice of echocardiography. Chap 1. Philadelphia: Lea & Febiger. p. 3- 27.
92. Porter TR, Xie F, Li S, Kricsfeld D, Deligonul U: Effect of transducer stand-off on the detection, spatial extent, and quantification of myocardial contrast defects caused by coronary stenosis. JAm Soc Echocardiogr 1999,12:951-956.
93. Angelsen BAJ: Principles of medical ultrasound imaging and measurements. In Ultrasound Imaging. Volume II. 1st edition. Trondheim: Emantec AS 2000:1.3-1.99.
94. Krams R, Sipkema P, WesterhofN: Coronary oscillatory flow amplitude is more affected by perfusion pressure than ventricular pressure. Am J Physiol 1990,258:Hl889-98.
95. Hiramatsu 0, Kimura A, Yada T, Yamamoto T, Ogasawara Y, Goto M, Tsujioka K, Kajiya F: Phasic characteristics of arterial inflow and venous outflow of right ventricular myocardium in dogs. Am J Physiol1992,262:H1422-27.
96. Wei K, Crouse L, Weiss J, Villanueva F, Schiller NB, Naqvi TZ, et al. Comparison of usefulness of dipyridamole stress myocardial contrast echocardiography to technetium.99m sestamibi single-photon emission computed tomography for detection of coronary artery disease (PB 127 Multicenter Phase 2 Trial results). Am J Cardiol2003;91 :1293-1298.
43

Appendix
Some automated corrections and calculations in the software used in the present work.
A. Mechanical index (MI)
Ml = Pneg/-./ f Pneg = peak negative pressure of the emitted ultrasound beam
f = emitted ultrasound frequency p = pressure
B. Biplane method of discs Left ventricular volume;
30
= : :E I . X bl X !. j;: 1 I · 30
ai, bi = 30 discs obtained from the apical 4CH and 2CH or APLAXview
C. LV volume calculation from triplane images
__.
Traces ofLV endocardial contours in three apical planes
' :,_ :i·~· .. 0 ,
\ ·· ... ~:; \ ' -... / ·· .l ~ · '\
. i l \ ! ! I
. ! f I
3D interpolation between the three LV contours
.D _·>+ ·· · ··J::Z..~ Surface
triangulation
v = xl~ (x j. N j )A Sj I Volume calculated by summation over all triangles according to the Divergence Theorem (67)
Asj- area of triangle Ni - unit normal vector Xj - point on triangle
44


Journal of the American College of Cardiology © 2004 by the American College of Cardiology Foundation Published by Elsevier Inc.
Vol. 44, No.5, 2004 ISSN 0735-1097/04/$30.00
doi:10.1016/j.jacc.2004.05.068
Echocardiography
Accurate and Reproducible Measurement of Left Ventricular Volume and Ejection Fraction by Contrast Echocardiography A Comparison With Magnetic Resonance Imaging Siri Malm, MD,* Sigmund Frigstad, MSc,t Einar Sagberg:j:, Henrik Larsson, MD, PHD,* Terje Skjaerpe, MD, PHD* Trondheim, Norway
OBJECTIVES We evaluated the accuracy and reproducibility of contrast echocardiography versus tissue harmonic imaging for measurements of left ventricular (LV) volumes and ejection fraction (EF) compared to magnetic resonance imaging (MRI).
METHODS Digital echo recordings of apical LV views before and after intravenous contrast were collected from 110 consecutive patients. Magnetic resonance imaging of multiple short-axis LV sections was performed with a 1.5-T scanner. Left ventricular volumes and EF were calculated of!line by method of discs. Thirty randomly selected patients were reanalyzed for intraobserver and interobserver variability.
RESULTS Compared with baseline, contrast echo increased feasibility for single-plane and biplane volume analysis from 87% to 100% and from 79% to 95%, respectively. The Bland-Altman analysis demonstrated volume underestimation by echo, but much less pronounced with contrast. Limits of agreement between echo and MRI narrowed significantly with contrast: from -18.1% to 8.3% to -7.7% to 4.1% (EF), from -98.2 to -11.7 ml to -59.0 to 10.7 ml (end-diastolic volume), and from -58.8 to 21.8 ml to -38.6 to 23.9 ml (end-systolic volume). Ejection fraction from precontrast echo and MRI differed by 2::10% (EF units) in 23 patients versus 0 after contrast (p < 0.001). At intraobserver and interobserver analysis, limits of agreement for EF narrowed significantly with contrast.
CONCLUSIONS The two-dimensional echocardiographic evaluation of LV volumes and EF in non-selected cardiac patients was found to be more accurate and reproducible when adding an intravenous contrast agent. GAm Coli Cardiol2004;44:1030-5) © 2004 by the American College of Cardiology Foundation
Measurements of left ventricular (LV) ejection fraction (EF) by two-dimensional echocardiography (2D-echo) has been marred by significant observer variability and poor agreement with reference methods (1-3). This has been improved by left ventricular opacification (LVO) by secondgeneration intravenous ultrasound contrast agents ( 4,5), the main effect being seen in difficult-to-image patients compared with fundamental imaging (4). Limited data have been reported comparing tissue harmonic to contrastenhanced imaging with adequate reference methods.
The aim of this study was to evaluate whether L VO with intravenous contrast has superior accuracy and reproducibility in 2D-echo assessment of LV volumes and EF compared to state-of-the-art tissue harmonic imaging in non-selected
From the *Department of Circulation and Medical Imaging and :!=Medical Student, Faculty of Medicine, Norwegian University of Science and Technology, Trondheim, Norway; and tGE Vingmed Ultrasound, Trondheim, Norway. The study was supported in part by a Research Fellowship grant from the Norwegian Council for Cardiovascular Diseases. Bracco (Italy) and Bristol Myers Squibb (U.S.) provided some of the contrast agent used; GE Vingmed Ultrasound (Norway) provided the research ultrasound machine and software.
Manuscript received January 17, 2004; revised manuscript received May 6, 2004, accepted May 10, 2004.
cardiac patients. Multislice magnetic resonance imaging (MRI) was used as reference standard (6,7).
METHODS
Study population. A total of 110 consecutive patients referred to the cardiologic department for known or suspected heart disease were enrolled (age above 18 years, stable clinical condition, and sinus rhythm). No screening for image quality was performed. The exclusion criteria were generally accepted contraindications for MRI (metallic implants), pregnancy or lactation, known allergy to the contrast agents, significant valve diseases or shunts, and severe extracardiac disease. All subjects gave written informed consent. The study conformed to the Declaration of Helsinki, and the Regional Committee of Medical Ethics approved the protocol. Echocardiography. Two second-generation ultrasound contrast agents were used; 55 patients received Definity (Bristol-Myers Squibb, North Billerica, Massachusetts), the other half SonoVue (Bracco, Milan, Italy). All studies were performed by an experienced physician using Vivid 7 (GE Vingmed Ultrasound, Horton, Norway) with the M3S transducer. The subjects were lying in the left lateral

JACC Vol. 44, No. 5, 2004 September 1, 2004:1030-5
Abbreviations and Acronyms
APLAX = apical long-axis ASE = American Society of Echocardiography EDV = end-diastolic volume EF = ejection fraction ESV = end-systolic volume LV = left ventricle LVO = left ventricular opacification MRI = magnetic resonance imaging 2CH = two-chamber 2D-echo = two-dimensional echocardiography 4CH = four-chamber
recumbent position. Recordings of standard apical fourchamber ( 4CH), two-chamber (2CH), and long-axis (APLAX) views were obtained in baseline tissue harmonic imaging with single and double focus, thereafter with contrast using a single-pulse harmonic mode. Power was adjusted to minimize contrast destruction (mechanical index 0.22 to 0.31). The contrast agents were administered by a trained nurse as repeat slow bolus injections of 0.2 (Definity) and 0.5 ml (Sono Vue) through a 20-G vial in a proximal forearm vein, followed by flushing with atleast 5 ml of 0.9o/o saline at a speed adjusted to optimize cavity opacification. This imaging protocol was preferred to multipulse technology with continuous contrast infusion because of simpler setup, shorter procedure time, and wider availability. Overall gain, depth, and tissue gain compensation were optimized initially and thereafter kept constant. Special care was taken to avoid foreshortening of the LV long axis. Cineloops of three cardiac cycles per imaging view and modality were digitally stored in raw-data format.
All patients fulfilling the imaging protocol were considered for volume analysis. Echocardiographic image quality, based on endocardial "traceability'' at baseline, was graded as: 1) very poor (insufficient for volume analysis), 2) poor (analysis possible but difficult), or 3) good (analysis possible with confidence).
All cine-loops were assigned random numbers and analyzed by an experienced physician unaware of MRI results and patient identity using the modified biplane Simpson's rule in EchoPacPC (GE Vingmed Ultrasound). Enddiastole was defined as the frame closest to the R-wave and end-systole as the minimal cavity area just before mitral valve opening. The inner contour of the LV cavity was manually traced according to the recommendations of the American Society of Echocardiography (ASE), leaving the papillary muscles and trabeculations within the cavity (8). The end-diastolic volume (EDV) and end-systolic volume (ESV) from three cardiac cycles were averaged, avoiding ectopic and post-ectopic beats. Ejection fraction was calculated as: ([EDV - ESV]/EDV) X 100o/o. The APLAX rather than 2CH view was used in combination with 4CH view because of its better acoustic availability and reproducibility (9,10). If the APLAX view was not available or the
Maim eta/. 1031 Contrast Echo for EF Measurements
Table 1. Patient Characteristics (n = 100)
Age (yrs) Men Height (em) Body weight (kg) Previous myocardial infarction Dilated cardiomyopathy Hypertension Diabetes mellitus LV dilation LV hypertrophy Regional LV dyssynergy
Values are mean ::': SD (range), or number of patients. LV = left ventricle.
59 :±: 11 (30-83) 89
175 :±: 7 (159-194) 80 :±: 11 (50-105)
57 16 36 11 23 34 60
2CH image was clearly of better quality, the 2CH image was used to maximize feasibility of biplane analysis.
Thirty randomly selected patients were analyzed by another less experienced observer who was blind to all other data. The experienced observer reanalyzed 30 echocardiograms in a new random order after a minimum interval of eight weeks. MRI. Two experienced operators performed the MRI studies using a 1.5-T Symphony whole-body system with Qyantum Gradients and Syngo 2002B software (Siemens, Erlangen, Germany). Long-axis reference views were used for positioning the necessary 8 to 12 perpendicular LV short-axis slices. Images were collected during breath-hold (8 to 10 s) with prospectively ECG-gated TrueFISP (Fast Imaging with Steady-State Precision) sequences. No magnetic resonance contrast agent was needed. Section thickness was 6 mm with intersection gaps of 4 mm. Acquisition time was 90o/o of the RR-interval, image matrix 256 X 150 (read/phase), field of view 380 mm, repetition time 52.05 ms, echo time 1.74 ms, flip angle 70", and 12 to 17 heart phases were acquired per repetition time interval. The images were stored and transferred digitally. Echo and MRI exams were performed within the shortest possible time interval. No change in patient medication or clinical condition between the two studies was accepted.
The MRI volumes and EF were calculated by a blinded investigator using a custom-made software programmed in MatLab (The Math Works, Natick, Massachusetts). Shortaxis endocardial contours were manually traced in enddiastole (start ofR-wave) and in end-systole (smallest cavity area). Papillary muscles and trabeculations were, according to the ASE criteria, included in the LV cavity. The end-diastolic and end-systolic cavity surface areas were summed up and volumes estimated by multiplying with interslice interval. Statistics. Continuous variables were expressed as mean ± SD. Limits of agreement between imaging methods and between readings were estimated as mean difference (bias) ± 2 SD of the differences, as described by Bland and Altman (11). Interobserver and intraobserver variability were also expressed as the standard deviation of difference between two readings in percent of the mean. McNemar's

1032 Maim etal. Contrast Echo for EF Measurements
Table 2. Left Ventricular Volumes and EF by MRI, Baseline Echocardiography, and Contrast Echocardiography
Baseline Contrast MRI Echo Echo
EDV(ml) 177.0 :':: 60.5 126.1 :':: 52.2 152.2 :':: 55.1 (90.3-395.0) (48.7-324.0) (80.8-360.7)
ESV(ml) 78.7 :':: 56.4 63.0 :':: 43.8 71.1 :':: 48.7 (22.9-298.1) (9.5-227.3) (18.1-252.5)
EF(o/o) 59:':: 14.6 54:':: 12.5 57:':: 13.3 (21-78) (18-80) (22-79)
Mean :±: SD (range). EDV = end-diastolic volume; EF = ejection fraction; ESV = end-systolic
volume; MRI = magnetic resonance imaging.
test was performed to compare the difference between paired proportions due to the dependent data samples. A significance level of 0.05 was selected.
RESULTS
A total of110 patients completed echo studies. Ten patients were excluded: four because of a percutaneous coronary intervention being performed and six because of interrupted or inadequate magnetic resonance examinations. The re-
JACC Vol. 44, No. 5, 2004 September 1, 2004:1030-5
mammg patient population (n = 100) spanned a wide variation of LV shapes, sizes, and function (Table 1). In 67 patients the MRI was performed within 1 h, in 20 within 2 days, and in the remaining within 1 week. A time interval exceeding 24 h was accepted only with normal LVs and no recent myocardial infarction. There were no significant differences in heart rate between echo and MRI studies ( 66 ± 12 beats/min vs. 68 ± 13 beats/min, p = 0.42). Mean values of LV volumes and EF are presented in Table 2. Representative precontrast and postcontrast echocardiograms are shown in Figure 1.
The patients received a mean total dose of 1.48 ml of Sono Vue or 0.63 ml Definity. With contrast, procedure time was increased by up to 10 min. Except for two patients experiencing transient taste disturbances, no side effects from contrast injection were observed. Feasibility. In 13 patients baseline echo image quality was very poor in all apical views, precluding volume analysis. By adding contrast, all these studies were converted to diagnostic. In 75 of the 87 patients analyzable at baseline, the combination of 4CH and APLAX views was adequate for biplane analysis. In 4 of the remaining 12 patients, the 2CH
Figure 1. Echocardiographic end-diastolic (top) and end-systolic (bottom) images of the apical four-chamber view from a patient before (left) and after (right) intravenous contrast.

JACC Vol. 44, No. 5, 2004 September 1, 2004:1030-5
40
e 20
;;; :;; 6 ~ ·20
> -40 0 w -60 1l ; -80
~ -100 0
-120
40
- 20 0::
oO 0
cP COo m
0
0
---- ·- _<;> _q_. -l:f'. -· -- -·-00
0
100 200 300 400
Mean EDV, Echo & MRI (ml)
~ ~ 0 0 'fi -20j~. -
0
!!!. > -40
"' B -60
fii -80
~ -100 Q
·-------·-·-·-·-q ____ _ 0 0
0 0
0
-120 +---~------~
0 100 200 300
20
~ 15
12 10
~ 5 .c
Mean ESV, Echo & MRI {ml)
0
0 •
.tl o J or!' v v • • ..a9 ... - • Elk -u. -5 w ~ -10
~ -15
~ -20 0
0
-25 +----------~ 10 30 50 70 90
Mean EF, Echo & MRI {'/~
Maim eta/. Contrast Echo for EF Measurements
40
'E 20
12 :ii' c: -20 0 (J
; -40 0 w -60 ~
-80 I u -0
c: 0
~ £ -100 Q
-120
40
'E 20
12 :ii'
~ ::: > "' w -60
~ -80 I!! ~ -100
0 100 200 300 400
Mean EOV, Contrast & MRI {ml)
0 -·-----------·---·-----
0
0
Q __ o-·-ao
Q -120 +-------~--~
20
#. 15
12 10
~ 0 !:!. 0
~ -5
g -10
~ -15 ,g i5 -20
0 100 200 300
Mean ESV, Contrast & MRI {ml)
_Q._ ___ Q._ __ ?_. ____ _
'b'b'Rf> .. ~~o •. o e
---------·-·•·e·-•
-25 +--~--~----~ 10 30 50 70 90
Mean EF, Contrast & MRI (%)
1033
Figure 2. Bland-Altman diagrams of end-diastolic volume (EDV), end-systolic volume (ESV), and ejection fraction (EF), demonstrating mean difference (solid lines) and limits of agreement (dashed lines) between baseline echocardiography and magnetic resonance imaging (MRI) (left column), and contrast echocardiography and MRI (right column). (Bottom panels) closed circles = poor baseline image quality (n = 36); open circles = good baseline image quality (n = 51).
substituted the APLAX view, and in 8 patients only 4CH single-plane analysis was feasible. Corresponding numbers after contrast were two and five patients. With contrast, feasibility of single-plane and biplane volume analysis in the total population increased from 87% to 100% and from 79% to 95%, respectively. Accuracy. In the 87 patients in whom comparisons could be performed, Bland-Altman analysis of LV volumes and EF from contrast echocardiograms showed significantly closer agreement with MRI measurements than precontrast studies (Fig. 2). Limits of agreement without and with contrast were -98.2 to 11.7 ml and -59.0 to 10.7 ml (EDV), -58.8 to 21.8 ml and -38.6 to 23.9 ml (ESV), and -18.1% to 8.3% and -7.7% to 4.1% (EF, absolute units), respectively.
Baseline echo and MRI EF differed by ?:10% (EF units) in 23 patients (26%) versus 0 with contrast (chi-square = 24.2, p < 0.001). Seventy-five patients (86%) were correctly classified by baseline echo in the appropriate EF group (EF <35%, 35% to 54%, or ?:55%) based on MRI, whereas classification was correct in 86 patients (99%) with contrast (chi-square = 8.3, p = 0.002).
Baseline image quality was judged as poor in 36 and as good in 51 of the 87 analyzable patients. For the "poor" subgroup, limits of agreement for EF were -19.9% to 7.9% at baseline, narrowing to -8.3% to 4.6% after contrast. Corresponding limits of agreement for patients with good baseline image quality were -16.7% to 9.0% and -7.3% to 4.5% (Fig. 2). Between baseline and contrast, the reduction in mean differences (bias) for EDV and ESV compared with

1034 Maim eta/. Contrast Echo for EF Measurements
JACC Vol. 44, No. 5, 2004 September 1, 2004:1030-5
Table 3. Subgroup Differences in LV Volumes and EF Between MRI and Echocardiography (n = 87)
Poor Baseline Image Quality Good Baseline Image QJtality
Baseline Contrast Baseline Contrast Subgroup Echo Echo Echo Echo
EDV(ml) -56.4 ± 47.8 -24.4 ± 23.8 -56.3 ± 41.8 -25.7 ± 24.4 ESV(ml) -16.2 ± 31.8 -6.5 ± 15.6 -21.8 ± 47.2 -9.0 ± 20.2 EF(o/o) -6.0 ± 13.9 -1.9±6.5 -3.8 ± 12.9 -1.4 ± 5.9
Values are mean differences (bias) ± 2SD of the difierences (=limits of agreement). Abbreviations as in Table 2.
MRI was 32.0 and 9.7 ml for the "poor" and 30.6 and 12.0 ml for the "good" subgroup, respectively (Table 3). Reproducibility. Comparing the readings of two observers, the limits of agreement for baseline echo were -33.3 to 18.1 ml (EDV), -23.5 to 16.5 ml (ESV), and -16.6% to 14.2% (EF). With contrast, these limits narrowed to -18.8 to 22.6 ml (EDV), -15.6 to 14.8 ml (ESV), and -5.9% to 6.9% (EF). At intraobserver analysis, the limits of agreement for EF was -11.1% to 7.8% precontrast, improving to -2.8% to 2.4% with contrast (Fig. 3). Mean inter- and intraobserver variability for EF were reduced from 13.9% to 9.6% and from 5.4% to 2.5% without and with contrast, respectively.
DISCUSSION
Our findings indicate that measurements of LV volumes and EF in a non-selected patient population are more accurate and reproducible using a second-generation intra-
15
0
-oo
0 0 0
~ 0 0 0'8'0
u. 0 ~
w ·5 Q) 0 0 0 u 0 f!·10 o oo 'q, o
~-15 0 c·-·-·-·-·-·-·--20 0 ·-·-·-·-0
10 30 50 70 Mean Efl'/~ echo (Obs 1 & Obs 2)
15
0 "' .._! 10
~ 0
0 .§. 5 0
,g 0 0 0 0 ~ 0 0
tti oo o coo aioo ~ -s Sa
~ -10 !!; 0
0 0
-15 +---~-----~ 10 30 50 70
Mean EF (%)echo (measure 1 &2)
venous contrast agent, even compared to state-of-the-art tissue harmonic imaging. Contrast injections have previously been shown to improve measurement of LV volumes and EF compared to fundamental imaging (4). Tissue harmonic imaging was indeed used by Thomson et a!. (5) studying patients post-myocardial infarction, but the sample size was relatively small (n = 26) and the reference method was computed tomography, which is less documented by prospective clinical EF studies. Our study is the first to show that LVO is in better agreement with MRI compared to tissue harmonic imaging results.
Echo volume underestimation before contrast was more pronounced for diastolic than systolic volumes (Fig. 2). With contrast, underestimation was reduced, especially for diastolic volumes. Accordingly, the accuracy of EF measurement improved with significant reduction in limits of agreement. This also indicates that despite tissue harmonic imaging, it is difficult to identifY "true" endocardial borders.
15
!f 10 ] Q. 5 w
~ 0 0 u -5 u. w ~ -10 = " :; -15 !!;
- ·-·-.-.-.-. --0-. -· -·-.-
00 %,§0
0 0
0 "'o;, 0
0
0 -20+-----------10 30 50 70
Mean EF contrast (Obs 1 & Obs 2)
15
N' ~ 10
"' " ~ 5 .§. c 0
" u. w
------·-o--~---------
0 00000 ~ 0 0 "" 0 8'
·-· -·-·-.- ·-· -·-o-e-- ·~
~
" -5
= e ~ -10
c -15
10 30 50 70
Mean EF{o/~ contrast (measure 1 &2)
Rgure 3. Bland-Altman analysis of the interobserver (upper panels) and intraobserver (lower panels) variability of ejection fraction (EF) measurements by baseline (left) compared to contrast echocardiography (right) (n = 30).

JACC Vol. 44, No. 5, 2004 September 1, 2004:1030-5
The contrast agent is filling the intertrabecular spaces, thus improving definition of the outermost endocardial lining (Fig. 1). But the addition of contrast did not eliminate volume underestimation made by echocardiography, reflecting some of the inherent limitations of transthorasic 2Decho such as image plane positioning errors, foreshortening of the LV long axis, geometric assumptions, and cardiac translation (1,12).
Our data demonstrated a clear improvement in reproducibility of EF measurements by using contrast, both between observers with different training and at repeated measurements by the same observer. The limits of agreement were reduced to one-third with contrast compared to baseline. This indicates that contrast echo has the potential to improve the confidence of less experienced investigators, making the interpretation of LV systolic function less operator dependent.
In contrast to Hundley et al. (4), we found that the advantage of contrast was also evident for patients with good image quality. According to the ASE Task Force Guidelines, contrast studies for LVO should be performed in patients with suboptimal baseline echo studies, in which at least two of six contiguous segments in a standard apical view are not visualized (13). However, according to our results, contrast should be considered whenever accurate EF or absolute volumes are required for clinical decision making. Contrast should be particularly useful in serial monitoring of smaller volume or EF changes over time, as in post-MI LV remodeling, end-stage heart failure, heart transplants, cardiotoxic chemotherapy, and timing of valve replacement in valve regurgitation. Contrast should also be considered when LV EF or volumes are used as inclusion or randomization criteria and outcome parameters in clinical trials. Conclusions. The 2D-echocardiographic evaluation of LV volumes and EF by tissue harmonic imaging was found to be more accurate and reproducible when performed after adding intravenous contrast in non-selected cardiac patients. Our results support that contrast enhancement should be considered not only in very difficult-to-image patients, but whenever it is considered important to have precise and repeatable measurements of LV size and global systolic performance.
Maim eta/. 1035 Contrast Echo for EF Measurements
Reprint requests and correspondence: Dr. Siri Maim, Department of Circulation and Medical Imaging, Norwegian University of Science and Technology, Medisinsk teknisk forskningssenter, N-7489 Trondheirn, Norway. E-mail: [email protected].
REFERENCES 1. Erbel R, Schweizer P, Lambertz H, et a!. Echoventriculography-a
simultaneous analysis of two-dimensional echocardiography and cineventriculography. Circulation 1983;67:205-15.
2. Bellenger NG, Burgess MI, Ray SG. Comparison of left ventricular ejection fraction and volumes in heart failure by echocardiography, radionucleide ventriculography and cardiovascular magnetic resonance. Are they interchangeable? Eur Heart J 2000;21:1387-96.
3. BernardY, Meneveau N, Boucher S, eta!. Lack of agreement between left ventricular volumes and ejection fraction determined by twodimensional echocardiography and contrast cineangiography in postinfarction patients. Echocardiography 2001;18:113-22.
4. Hundley WG, Kizilbash AM, Mridi I, et a!. Administration of an intravenous perfluorocarbon contrast agent improves echocardiographic determination of left ventricular volumes and ejection fraction: comparison with cine magnetic resonance imaging. J Am Coli Cardiel 1998;32:1426-32.
5. Thomson HL, Basmadjian A, Rainbird A, eta!. Contrast echocardiography improves the accuracy and reproducibility of left ventricular remodeling measurements. A prospective, randomly assigned, blinded study. JAm Col! Cardiol2001;38:867-75.
6. Longmore DB, Klipstein RH, Underwood SR, et a!. Dimensional accuracy of magnetic resonance in studies of the heart. Lancet 1985;1:1360-62.
7. Sakuma H, Fujita N, Foo TK, et a!. Evaluation of left ventricular volume and mass with breathhold cine MR imaging. Radiology 1993;88:1715-23.
8. Schiller NB, Shah PM, Crawford M, et a!. Recommendations for quantification of the left ventricle by two-dimensional echocardiography. JAm Soc Echocardiogr 1989;2:358-67.
9. OtterstadJE, Froeland G, St. John Sutton M, Holme I. Accuracy and reproducibility ofleft ventricular dimensions and function. Eur Heart J 1997;18:507-13.
10. Nosir YFM, Vletter WB, Boersma E, eta!. The apical long-axis rather than the two-charuber view should be used in combination with the four-chamber view for accurate assessment of left ventricular volumes and function. Eur Heart J 1997;18:1175-85.
11. Bland JM, Altman DG. Statistical methods for assessing agreement between two methods of clinical measurements. Lancet 1986;1:307-10.
12. Sapin PM, Schroeder KM, Gopal AS, Smith MD, King DL. Three-dimensional echocardiography: limitations of apical biplane imaging for measurements of left ventricular volume. J Am Soc Echocardiogr 1995;8:576-84.
13. Mulvagh S, DeMaria AN, Feinstein SB, eta!. ASE position paper. Contrast echocardiography: current and future applications. J Am Soc Echocardiogr 2000;13:331-42.


Choosing Apical Long-axis Instead of Two-chamber View Gives More Accurate
Biplane Echocardiographic Measurements of Left Ventricular Ejection Fraction:
A Comparison with Magnetic Resonance Imaging
Siri Maim, MD, Einar Sagberg, Henrik Larsson, MD, PhD, and Terjc Skja:rpe, MD, PhD, Trondheim, Norway
Backgrou11d: We sought to evaluate whether the use of apical long-axis (APLAX) rather than two-chamber (2CH) view, in combination with four-chamber ( 4CH) view, improved accuracy of biplane echocardiographic measurements of left ventricular (LV) ejection fraction (EF), using magnetic resonance imaging (MRI) as a reference standard. Methods: One hundred consecutive cardiac patients underwent cardiac MRI and 2D-echocardiography. Standard apical LV views were digitally acquired with baseline tissue harmonic imaging and lowpower contrast echocardiography. Echo and MRI LV volumes were calculated by manual tracing and disc summation methods. Results: Feasiblity for biplane volume measurements increased with the use of APLAX. Precontrast
Two-dimensional (2D) echocardiography using biplane Simpson's rule has been widely applied for measuring left ventricular (LV) volumes and ejection fraction (EF). However, the method is limited by geometric assumptions regarding the shape of the LV, and is highly dependent on the position and orientation of imaging planes. J.7 Incomplete visual-
From the Department of Circulation and Medical Imaging, Fac· ulty of Medicine, and School of Medicine (E.S.), Norwegian University of Science and Technology.
Supported in part by a research fellowship grant from the Norwe· gian Council for Cardiovascular Diseases. Bracco (Italy) and Bristol Myers Squibb (US) provided some of the contrast agent used, and GE Vingmed Ultrasound (Norway), the research ultrasound machine and software. No other financial payments have been made to the project leader or associates, and no obligations to or other connection with the sponsors exists.
Reprint requests: Siri Maim, MD, Department of Circulation and Medical Imaging, Norwegian University of Science and Technology, Medisinsk teknisk forskningssenter, 4 etg, nord, N-7489 Trondheim, Norway (E-mail: [email protected]).
0894-7317/$30.00
Copyright 2005 by the American Society ofEchocardiography.
doi: 10.10 16/j.echo.2005. 03.002
1044
limits of agreement (LOA) for EF compared to MRI were -19.1 to 9.0% (EF units) using 2CH, narrowing to -14.6 to 6.7% using the APLAX. With contrast, corresponding LOAs narrowed from -10.5 to 6.1%, to -7.3 to 3.8%, respectively. The improved accuracy with APLAX was evident regardless of image quality, previous MI and regional LV dyssynergy. Both intra- and interobserver variability improved by substituting 2CH with APLAX view. Co11clusiott: Using APLAX rather than 2CH in combination with 4CH view improved feasibility, accuracy and reproducibility of biplane echocardiographic EF measurements in cardiac patients, even with optimisation of endocardial borders by contrast. (JAm Soc Echocardiogr 2005;18:1044-1050.)
ization of the endocardial borders is also a wellknown limitation, but can be improved by adding intravenous contrast, giving more accurate and reproducible EF measurements.B-11
The American Society of Echocardiography (ASE) has recommended that LV volumes should be computed from the apical 4-chamber ( 4CH) and 2-chamber (2CH) views, which have been considered to be nearly orthogonal. 12 Nevertheless, the apical long-axis (APLAX) view has often been preferred to the 2CH view because of its better acoustic availability and reproducibility, 13-
16 although these two view combinations have not previously been compared with an independent reference method.
The purpose of this study was to evaluate the accuracy and reproducibility of biplane 2D echocardiographic assessment of LV volumes and EF using 4CH view combined with either APLAX or 2CH views. The comparison was also performed with contrast opacification of the LV cavity (LVO) to evaluate the effect of image view combination after optimizing endocardial delineation. Multislice cine-

Journal of the American Society ofEchocardiography Volume 18 Number 10
magnetic resonance imaging (MRI) was used as the reference standard. 17
'23
METHODS
Study Population
We studied 100 patients with known or suspected heart disease, all in sinus rhythm and stable clinical condition. All patients were regarded for feasibility, but those with any of the standard apical planes technically too poor for endocardial tracing were excluded from comparative volume analysis. The other criteria for exclusion were generally accepted contraindications for MRI, pregnancy or lactation, known allergy to the ultrasound contrast agent, significant valve diseases or shunts, and severe extracar· diac disease. All patients gave written informed consent. The study conformed to the declaration of Helsinki, and the protocol was approved by the regional committee of medical ethics.
Echocardiography
Echocardiographic studies were performed by a single experienced physician using a Vivid 7 (GE Vingmed Ultrasound, Horten, Norway) with a M3S matrix-array transducer. Patients were in the left lateral recumbent position. Starting with the transducer posterior to the palpable apex, special effort was made not to underestimate the LV major long axis. The apical 4CH view was adjusted to visualize the apex and maximize the LV long-axis and short-axis diameters of both ventricles, and to visualize excursions of the mitral and tricuspid leaflets. The apical 2CH view was obtained by counterclockwise rotation maintaining the initial imaging point, avoiding inclusion of the right ventricle and maximizing mitral annular diameter. The APLAX view was achieved by further rotation maximizing the LV outflow tract and aortic root, excluding the papillary muscle. Digital cineloops of at least 3 cardiac cycles per imaging view were acquired in held expiration, using both baseline tissue harmonic imaging and a contrast-enhanced singlepulse harmonic technique (mechanical index 0.22·0.31). Baseline imaging was also performed with double focus to optimize the near field.
For contrast studies, the second-generation agents Definity (Bristol-Myers Squibb, North Billerica, Mass) (n =
50) and SonoVue (Bracco, Milan, Italy) (n = 50) were used. The contrast was administrated by a trained nurse as repeated slow bolus injections with initial doses of 0.2 and 0.5 mL, respectively, through a 20·G vial in a proximal forearm vein. Injections were followed by a slow manual flush with at least 5 mL of 0.9% saline, at a speed adjusted to optimize cavity opacification and to avoid far-field attenuation.
All cineloops were assigned random numbers and analyzed by an experienced physician, unaware of MRI results and patient identification. Volume analysis was
Maim ct a! 1045
performed using the modified biplane Simpson's rule (Echopac PC, GE Vingmed Ultrasound). End diastole was defined as the frame closest to the initial systolic coaption of the mitral valve and end systole was defined as the minimal cavity area just before mitral valve opening. The inner contour of the LV cavity was manually traced according to ASE recommendations, leaving the papillary muscles and rough trabeculations within the cavity. 12 LV cavity long-axis length in end diastole and end systole was measured as the distance from the apex to the center of the mitral valve plane. The average end-diastolic vohune (EDV) and end-systolic volume (ESV) from 3 cycles, avoiding ectopic and postectopic beats, were calculated using the apical 4CH with either the apical 2CH or the APLAX views, both without and with contrast enhancement. EF was calculated as: [(EDV - ESV)/EDV)] X 100%. Image qualiry based on endocardial traceability at baseline was arbitrarily graded as: (1) very poor (analysis impossible, exclusion criterion); (2) poor (analysis possible, but difficult); or (3) good (analysis possible with confidence).
To determine interobserver variability, 30 echocardiograms were randomly selected and independently analyzed by another, less-experienced observer, who was blinded to patient identification, clinical data, and MRI results. For assessing intraobserver variability, the experienced observer did repeated analysis of 30 echocardiograms in a new random order after a minimum 8-week interval.
MRI
MRI studies were performed with a 1.5-T whole-body system SymphonyrM, the Quanttun Gradients, and Syngo 2002B software (Siemens, Erlangen, Germany). Long-axis reference views were used for positioning 8 to 12 perpendicular short-axis slices necessary to encompass the entire LV. Images were collected during breath hold with prospectively electrocardiographically gated fast imaging with steady-state precision sequences. No MRI contrast agent was needed. Section thickness was 6 mm with intersection gaps of 4 mm. The acquisition time window was set to 90% of the R-R interval, resulting in a breathhold period of 8 to 10 seconds tolerated by most patients. Image matrix was 256 X 150 (read/phase), field of view was 380 mm, repetition time was 52.05 milliseconds, echo time was 1. 7 4 milliseconds, flip angle was 70 degrees, and 12 to 17 heart phases were acquired per repetition time interval.
All MRI scans were obtained by two experienced operators, mean acquisition time being 20 minutes. The images were stored and transferred digitally. To minimize physiologic changes in ventricular loading and size over time, echocardiographic and MRI examinations were performed within the shortest possible time interval. To minimize biologic variations, no changes in patient medication or clinical condition between the two studies were accepted.
MRI volumes and EF were calculated by a single, blinded investigator using custom software programmed in MatLab (The MathWorks, Natick, Mass). Short-axis

1046 Malm et al
endocardial contours of all slices were manually traced in end diastole (start of R-wave-triggered sequence), and in end systole (the smallest cavity area), guided by reviewing tbe images in cine. Papillary muscles and rough trabeculations were included in the LV cavity, according to the criteria defined for the echocardiographic analysis. The cavity surface areas of end-diastolic and end-systolic sections were summed up, and LV volumes estimated by multiplying with interslice interval. The end-diastolic and end-systolic LV major long axis (apex to midatrioventricular plane) was measured on the 4CH (double oblique) reference view.
Statistics
Continuous variables were expressed as mean ± 1 SD. The agreement between methods and the repeatability of echocardiographic measurements were evaluated by the method of Bland and Altman,2
·l in which tbe difference between two measurements is plotted against their mean. The 95% limits of agreement were estimated as the mean difference (bias) ± 2 SD of the differences. Mean interobserver and intraobserver variability was in addition calculated as the SD of the mean difference expressed as a percentage of mean LV EF (coefficient of variation). Differences in LV long-axis lengths were evaluated with repeated measures of variance and post hoc analysis witb Bonferroni's correction. A significance level of .05 was selected.
RESULTS
Study Population
All 100 patients completed echocardiographic and MRI studies. In 13 patients, baseline image quality was too poor for tracing in any standard apical view, but by adding contrast all of these had at least one traceable apical view. Choosing the APLAX instead of the 2CH view increased the feasibility of biplane volume analysis at baseline from 65% to 76%, and with contrast from to 83% to 97%.
For comparative biplane volume analysis, an additional 14, 3, and 8 patients were excluded because of lack of adequate 2CH, APLAX, or both views, respectively. Among the remaining 62 patients in whom all 3 apical views were considered interpretable, there was a wide variation of LV shapes and sizes, and global and regional dysfunction. Baseline characteristics of these patients are presented in Table 1. More than half (58%) had experienced a myocardial infarction (MI) and regional LV dyssynergy. Mean values of LV volumes and EF obtained by the different imaging methods and echocardiographic view combinations are presented in Table 2. Of the 62 patients, 50 had MRI examination performed within a time interval of 1 hour, 8 patients within 2 days, and the remaining 4 within 3 to 5
Journal of the American Society of Echocardiography October 2005
Table 1 Patient characteristics ( n = 62)
Age, y Male Height, em Body weight, kg Previous myocardial infarction Dilated cardiomypathy LV dilatation LV hypertrophy Regional LV dyssynergy
60 ± ll (36-83) 49
174 ± 8 (159-194) 85 ± ll (50-110)
36 18 18 13 34
Values arc mean ± SD (range), or number of patients. LV, left ventricle.
days. A time interval exceeding 24 hours was only accepted for patients with normally shaped and functioning LV.
Accuracy
Bland-Altman analysis of LV volumes and EF demonstrated closer agreement between echocardiography and MRI using the APLAX compared with the 2CH view, both with conventional tissue harmonic imaging and LVO (Figure 1). Precontrast limits of agreement for EF were -19.1 to 9.0% (EF units) using the 2CH view, narrowing to -14.6 to 6.7% using the APLAX view (Figure 1). With contrast, the corresponding litnits of agreement narrowed from -10.5 to 6.1%, to -7.1 to 3.8%, respectively (Figure 1). Considering EDV, the mean difference (bias) was reduced from -55.8 to -45.9 mL (baseline), and from -30.0 to -21.9 mL (contrast), substituting the 2CH with the APLAX view, respectively. The corresponding bias for ESV was reduced from -18.8 to -14.6 mL (baseline) and from -9.8 to -6.0 mL (contrast).
For the subgroup with poor (analysis possible, but difficult), baseline image quality (n = 17), limits of agreement for EF were -20.9 to 4.3% (2CH) and -15.8 to 5.6% (APLAX) at baseline, and with contrast -10.5 to 4.6% and -5.4 to 2.0%, respectively. The corresponding litnits of agreement for patients with good baseline image quality (n = 45) narrowed from -17.7 to 9.8%, to -13.7 to 7.1%, and withLVO from -10.6 to 6.6%, to -7.8 to 4.4% (Table 3). Limits of agreement for EF in patients with previous MI (n = 36), were -17.4 to 9.8% (2CH) and -14.3 to 7.7% (APLAX) at baseline, and with contrast -9.3 to 5.9% and -5.9 to 3.4%, respectively. For patients with no previous MI (n = 26), the corresponding limits narrowed from -20.7 to 6.0%, to -14.7 to 5.1% (baseline), and from- 11.8 to 6.0%, to -8.0 to 3.5% (LVO) (fable 3).
Reproducibility
Between two observers, limits of agreement for EF with 2CH view were -11.7 to 14.7% (baseline) and -8.3 to 12.2% (contrast). Using APLAX view the limits narrowed to -12.2 to 9.0% and -6.2 to 6.0%,

Journal of the American Society of Echocardiography Volume 18 Number 10 Maim eta! 1047
Table 2 Left ventricular volumes and ejection fraction by magnetic resonance imaging and biplane echocardiography (n = 62)
Baseline echocardlography Contrast echocardiography
MRI 2CW APLAX' 2CH• APLAX'
EDV,mL 188.0 :!: 63.8 132.2 54.6 142.1 64.2 157.2 55.5 165.9 59.9 ESV,mL 89.1 :!: 62.5 70.3 47.3 74.4 55.9 79.2 51.2 83.1 58.0 EF,% 56 :!: 16 51 13 52 14 54 14 54 15
Values are mean ± SD. APLAX, Apical long-axis view; 2CH, 2-chambcrvicw; 4CH, 4-chamber view; EDV, end-diastolic volume; EF, ejection fraction; ESV, end-systolic volume; MR._~ magnetic resonance imaging. *Biplane calculations with 4CH as the standard view.
,;, 15 0 ,( 15
~ 1~ -----o-·oO@·-·-o-·--- :l 10
~ = 5 ·- ·----~~oc&-~-~-~-----
.a 0 <D 0 0 0 <D 00 o'b% o "' 0 r!JhO 00 0 0::0
~~ -5 0 ~~ -5
w ·10 9 ° 0 0 0 w -10
~ oSo~0 . -15 g -15
2 ------. ---·-·a·B-·-·- e !!: -20
~ -20
c -25 -25 10 30 50 70 10 30 50 70
Mean EF (%) Baseline 2CH & MRI Mean EF {%)Baseline LAX & MRI
,;, " ,( ,.
~ 10 :l 10
§ §
" " ~Ci ~~ _;~r-·-·-----·---;o-o---~ :E -10
~ -15 g
-15 2 :1! -20 !!: -20 0 -25 c -25
10 30 50 70 10 30 50 70
Mean EF (%) Contrast 2CH & MRI Mean EF (%) Contrast LAX & MRI
Figure l Bland-Altman diagrams of ejection fraction (EF) demonstrating mean difference (solid line) and limits of agreement (dashed lines) between biplane echocardiography including 2-chambcr view (2CH) and magnetic resonance imaging (MRI) (left), and biplane cchocardiography including apical long axis (LAX) and MRI (right). Baseline (base) (top) and contrast (con) (bottom) echocardiograms.
respectively (Figure 2). At repeated readings by the one observer, the corresponding limits of agreements were -9.5 to 9.6% and -4.7 to 5.2% (2CH) and -6.3 to 7.1% and -2.7 to 3.4% (APLAX), respectively (Figure 3). Interobserver variability expressed by the coefficient of variation was at baseline reduced from 12.8 (2CH) to 10.5% (APLAX), and with LVO from 7.9 to 5.6%, respectively. Corresponding numbers for intraobserver variability were from 9.3 to 6.4% (baseline) and from 4.7 to 2.7% (LVO).
LV Long-axis Length
End-diastolic and end-systolic LV cavity lengths derived from MRI and echocardiography are presented in Table 2. Both for diastole and systole, the echocardiographic LV long-axis length was significantly shorter in the 2CH than the APLAX view (8.5 ± 0.9
em vs 9.0 ± 0.9 em, and 7.5 ± 1.1 em vs 7.8 ± 1.1 em, respectively, both P < .001). This difference was evident also after the addition of contrast (8.7 ± 0.8 em vs 9.3 ± 0.9 em, and 7.4 ± 1.0 em vs 7.8 ± 1.1 em, both P < .001). Comparing all 3 echocardiographic views without and with contrast with MRI, LV long axis from echocardiographic images was significantly shorter than from MRI, with the exception of APLAX view with contrast (P = .120).
DISCUSSION
Our main finding was that using APLAX instead of 2CH view in biplane 2D echocardiography EF measurements resulted in closer agreement with values derived from MRI (Figure 1). This improvement was also evident after optimization of the endocardial delineation by LVO. Interestingly, the benefit of including APLAX view seemed to be present also for patients with previous MI and regional dyssynergy. Moreover, the results indicated improved accuracy with APLAX view both for patients with good and poor baseline image quality (fable 3). The use of APLAX view increased the feasibility of biplane volume measurements, which is beneficial especially in dilated and distorted LVs. 16
Our fmdings are in agreement with the study conducted by Nosir et a!, 15 who previously demonstrated improved accuracy and reproducibility using APLAX instead of 2CH view in biplane EF calculation. However, a limitation in their study was that the planes were derived from the reference 3-dimensional echocardiography data set, and not from separate 2D scanning. Furthermore the study was relatively small (n = 27). To our knowledge, biplane EF calculations from the two different apical view combinations, as they are conventionally obtained in clinical routine, have not been compared with an independent reference standard.
With 2D echocardiography, assumptions on ventricular geometry and the position of imaging planes are necessary to compute EF. It is often a challenge to acquire representative, standard apical views of

1048 Maim eta! Journal of the American Society of Echocardiography
October 2005
Table 3 Subgroup differences in left ventricular ejection fraction between magnetic resonance imaging and echocardiography
Baseline echocardiography Contrast echocardiography
Poor baseline image quality Good baseline image quality Previous MI No previous MI
n
17 45 36 26
2CW
-8.3 12.6 -3.9 13.8 -3.8 13.6 -7.0 13.7
APIAX' 2CW APLAX'
-5.6 11.2 -2.9 7.6 -1.7 3.7 -3.3 10.4 -2.0 8.6 -1.7 6.1 -3.3 11.0 -1.7 7.6 -1.3 4.7 -4.8 9.9 -2.9 8.9 -2.2 5.8
Values are mean diftCrences (bias) ± 2SD of the differences (:;;:::: limits of agn::cmcnt) in percent absolute ejection fraction units. APLAX, Apical long-axis view; MI, myocardial infarction; 2CH, 2-chamber view. *Biplane calculations with apical4-chamber as the standard view.
15,.. -w- •-"- •-•-~ 10
~ 5
" g
00 00
.. a .. ?. 0 o f o --····· ·o··
~ 0 w ·5 g ~ ~ e -1o 0 0
~ -15 l--------;:;:-·-·-·-o-·-·
10 30 50 70
~ ~ 10
~ ~ ~ ~ -5
~ -10
~
Mean ~%}Baso2CH(Obs 1 & 2)
____ """'tt _____ _
.... --~-~~0~-g __ _
of6 o o;8
·15.>::-------10 30 50 70
Mean B'(%) Con 2CH (Obs 1 & 2)
15
~ 10
:l 5
~ 0
! ~ -10
-. - • - <~- "o--o- -
0 0
6'
o·o- -----·······
a&~~
·---~--.?_ __ _ -151---------
15
~ 10
:i 5
~ 0
~ i -10
10 30 50 70
Mean EF(%) Base LAX (Cbs 1 & 2)
-. -o·-&. -o·og;,.-0 0 ° 0
0 ··tr·ei·· .. g·····~·-· ___ .....s;).-.Q..(I._
-151---~-~-~-10 30 50 70
Mean EF(%1 Con LAX (Obs 1 & 2)
Figure 2 Bland-Altman diagrams demonstrating interobservervariability ofbiplane echocardiographic ejection fraction (EF) measurements including 2-chamber (2CH) (left) compared with apical long-axis (LAX) (right) view (n = 30). Base, Baseline; con, contrast; Obs, observer.
the LV, and there are limited means to identify their localization in 3-dimensional space. Hence, the operator must rely on image content and knowledge of cardiac anatomy to position the planes. The APLAX view generally seems to be easier to identify than the 2CH view because of anatomic landmarks like the LV outflow tract and the aortic valve. This may explain our findings of improved reproducibility of biplane EF measurements using APLAX view. Indeed, the greatest improvement of agreement between observers and between readings of the same observer was a result of the addition of contrast. However, the reduction of both interobserver and intraobserver variability was evident using APLAX compared with 2CH view both without and with simultaneous LVO (Figures 2 and 3). This indicates that using the APLAX instead of 2CH view could contribute to less operator-dependent evaluation of global LV systolic function.
12
~ 10
~ 8 :!i 6 :r:-
l:l
0 00 0 ~0 0 0
0 000 0
~ .~ ··o··········-~·-···o···-e·····
i ~ 0 g~ 0 ~ ~ 0 0
~ -10 • .c...---.--- .. ·121------~--~
12
~ 10 .; 8
i 6
~ ii 0 ir -2 w .. ~ -6
10 30 50 70
Mean EF(%) Base 2CH (Meas.1&2)
-·-·o·--o---0 0
oo 0o Off aD
·o ·;; ··o··o····· 0 ""' 0 0
~ -8 c-1o -121---~--~---
10 30 50 70
Mean EF (o/~ Con 2CH (Meas.1 &2)
12 ~ 10
~ 8 ~ 8 >( 4 :l 2 ii 0 ~ -2 w ~ -4
; :: ~ -10
·12
12 ~ 10
~ 8 • 6
~ 4 :l 2
~ 0 ffi" -2 • -4 ~ -6
---·-a·-·o·-ro o
--~---;.0:~-~ g aJ
o'booroo
10 30 50 70
Mean EF {%) ease LAX (Meas. 1 &2)
---·-·-otr'b-o 0 0 •.• _q ••• R .. CRg. ..•. . gqsg,9 ....
g 0 CDaD -------.,--
j -~~ ·12 +--~--~-~-
10 30 50 70
Mean EF(%) Con LAX (Meas.1&2)
Figure 3 Bland-Altman diagrams demonstrating intraobservervariability ofbiplane echocardiographic ejection fraction (EF) measurements including 2-chamber (2CH) (left) compared with apical long-axis (LAX) (right) views (n = 30). Base, Baseline; cou, contrast; Meas, measure.
Our data demonstrated a general volume underestimation by 2D echocardiography compared with MRI, more so for the largest absolute LV volumes (Figure 1). This was evident whatever echocardiographic method or view combination used. Volume underestimation was less pronounced with LVO, as we have previously shown. 11 However, the substitution of 2CH with APLAX view reduced the tendency of underestimation even with contrast addition, more so for EDV. At flrst glance, agreement between 2D echocardiography and MRI seemed closer for EF than for volumes. However, although mean EF and bias did not differ significantly between view combinations, individual differences in EF were of significance. Volume underestimation was reduced to a greater extent in end diastole than

Journal of the American Society ofEchocardiography Volume 18 Number 10 Maim et al l 049
Table 4 Left ventricular long-axis lengths by magnetic resonance imaging and echocardiography (n = 62)
Baseline echocardiography Contrast echocardlography
MRI 2CH APIAX 4CH 2CH APIAX 4CH
LAED,em 9.5 ± 1.0 8.5 ± 0.9 9.0 ± 0.9 8.8 ± 0.9 8.7 ± 0.8 9.3 ± 0.9 9.2 ± 0.8 LAES, em 7.9 ± 1.2 7.5 ± 1.1 7.9 ± 1.2 7.5 ± 1.1 7.4 ± 1.1 7.9 ± 1.1 7.6 ± 1.0
Values are mean ± SD. APLAX, Apical long-axis view; LAED, left ventricular (LV) long-axis length end diastole; LABS, LV long-axis length systole; MRI, Magnetic resonance imaging; 2CH, 2-chamber view; 4CH, 4-chambcr view.
"" 1<10
1:>0
if>)
00
®
40
"" 0
"'' eDVtnu~lm EOVWf!tr;ul ESVlnSidlM esv~~t
Figure 4 Histogram illustrating single plane end-diastolic volume (EDV) and end-systolic volume (ESV) from 2-chamber (2CHJ view, apical long-axis (APLAX) view, and 2CH view multiplied with APLAX/2CH long-axis length ratio (2CH cm-r).
in end systole, resulting in reduced underestimation of EF with APLAX compared with 2CH view.
Erbel et al1 reported the transducer position to be superior and anterior to the true anatomic apex in 95% of patients during 2D echocardiography simultaneous with cineventriculography, giving tangential2CH images of the LV. However, their study did not include the APLAX view. Our data demonstrated that the LV long-axis foreshortening was significantly more pronounced in 2CH than in APLAX images (Table 4). This seems to be the single most important factor explaining the smaller volumes obtained from 2CH images, since multiplying the 2CH volumes with the APLAX/2CH long-axis length ratio gave volumes close to those obtained by APLAX images (Figure 4). A contributing factor to this may be the rectangular shape of the transducer footprint, where part of the footprint is overlying costae during 2CH imaging, reducing access and image quality.
Study Umitations
In view of the heterogeneity of the study population and the limited sample size concerning patient subgroups, the results should be verified in further, larger-scale studies. The study patients were all in sinus rhythm, thus, the results cannot be generalized to patients with arrhythmia. However, the main reason for excluding these was the risk of insufficient MRl quality. It was not possible to blind the
readers to echocardiographic view and imaging modality. Nevertheless, the cineloops were analyzed in a random sequence so that corresponding views of the same patient were not judged simultaneously. A potential source of error in MRl volumetry, especially in systole, was the selection of which basal slices to include or exclude. To reduce this error, special care was taken to review short-axis slice projections onto the long-axis reference views and perform tracings with support from cinemovies.
Conclusions
The use of APLAX rather than the 2CH view in combination with the 4CH view improved feasibility, accuracy, and reproducibility of biplane echocardiographic EF measurements in patients with cardiac conditions. These beneficial effects were also evident after adding intravenous contrast.
Therefore, we recommend the use of APLAX rather than the 2CH view for biplane EF calculations, especially when serial measurements are required for clinical decisions to be made.
REFERENCES
1. Erbcl R, Schweizer P, Lambertz H, Henn G, Meyer J, Krebs W, et a!. Echovcntriculography-a simultaneous analysis of two-dimensional echocardiography and cincventriculography. Circulation 1983;67:205-15.
2. Sapin PM, Schroeder KM, Gopal AS, Smith MD, King DL. Three-dimensional echocardiography: limitations of apical biplane imaging for measurements of left ventricular volume. JAm Soc Echocardiogr 1995;8:576-84.
3. Miller S, Bartel T, Katz MA, Pachinger 0, Erbel R. Partial cut-off of the left ventricle: determinants and effects on volume parameters assessed by real-time 3-D echocardiography. Ultrasound Med Bioi 2003;29:25-30.
4. BernardY, Menevcau N, Boucher S, Magnin D, Anguenot T, Schiele F, et a!. Lack of agreement between left ventricular volumes and ejection fraction determined by two-dimensional echocardiography and contrast cineangiography in postinfarction patients. Echocardiography 2001;18:113-22.
5. Himelman RB, Cassidy MM, Landzberg JS, Schiller NB. Reproducibility of quantitative two-dimensional echocardiography. Am Heart J 1988;115:418-25.
6. Albin G, Rahko PS. Comparison of echocardiographic quantification of left ventricular ejection fraction to radio nuclide angiography in patients with regional wall motion abnormalities. Am J Cardiol1990;65:1031-2.

1050 Maim ct al
7. Naik MM, Diamond GA, Pai T, Soffer A, Siegel RJ. Correspondence of left ventricular ejection fraction determinations from two-dimensional echocardiography, radionuclide angiography and contrast cineangiography. J Am Coli Cardiol 1995;25:937-42.
8. Hundley WG, Kizilbash AM, Afridi IW, Franco F, Peshock RM, Grayburn PA. Administration of an intravenous perfluorocarbon contrast agent improves echocardiographic determination of left ventricular volumes and ejection fraction: comparison with cine magnetic resonance imaging. J Am Coli Cardiol1998;32:1426-32.
9. Senior R, Andersson 0, Caidahl K, Car lens P, Herregods MC, J enni R, et al. Enhanced left ventricular endocardial border delineation with an intravenous injection of SonoVue, a new echocardiographic contrast agent: a European multicenter study. Echocardiography 2000;17:705-11.
10. Thomson HL, Basmadjian A, Rain bird A, Razavi M, Avierinos JF, Pellikka PA, et al. Contrast echocardiography improves the accuracy and reproducibility of left ventricular remodelling measurements: a prospective, randomly assigned, blinded study. JAm Coli Cardiol2001;38:867-75.
11. MaimS, Frigstad S, Sagberg E, Larsson H, Skjaerpc T. Accurate and reproducible measurement of left ventricular volume and ejection fraction by contrast echocardiography: a comparison with magnetic resonance imaging. J An1 Coli Cardiol 2004;44:1030-5.
12. Schiller NB, Shah PM, Crawford M, DeMaria A, Devereux R, Feigenbaum H, et al. Recommendations for quantification of the left ventricle by two-dimensional echocardiography. JAm Soc Echocardiogr 1989;2:358-67.
13. Jcnni R, Vicli A, Hess 0, Anliker M, Krayenbuehl HP. Estimation of left ventricular volume from apical orthogonal 2-D echocardiograms. Eur Heart J 1981;2:217-25.
14. Otterstad JE, Frocland G, St John Sutton M, Holme I. Accuracy and reproducibility of left ventricular dimensions and function. Eur Heart J 1997;18:507-13.
15. Nosir YFM, Vletter WB, Boersma E, Frowijn R, Ten Cate FJ, Fioretti PM, et al. The apical long-axis rather than the twochamber view should be used in combination with the four-
Journal of the American Society of Echocardiography October 2005
chamber view for accurate assessment of left ventricular volumes and fimction. Eur Heart J 1997;18:1175-85.
16. StJohn Sutton M, Otterstad JE, Plappert T, Parker A, Sekarski D, Keane MG, et al. Quantification of left ventricular volumes and ejection fraction in post-infarction patients from biplane and single plane two-dimensional echocardiograms: a prospective longitudinal study of 371 patients. Eur Heart J 1998;19:808-16.
17. Benjelloun H, Cranney GB, Kirk KA, Blackwell GG, Lotan CS, Pohost GM. Interstudy reproducibility of biplane cine nuclear magnetic resonance measurements of left ventricular function. Am J Cardiol1991;67:1413-20.
18. Longmore DB, Klipstein RH, Underwood SR, Firmin DN, Hounsfield GN, Watanabe M, ct al. Dimensional accuracy of magnetic resonance in studies of the heart. Lancet 1985;1: 1360-2.
19. Rher GB, Malloy CR, Filipchuck NG, Peshock RM. Left ventricular volumes measured by MR imaging. Radiology 1985;156:717-9.
20. Seechtem U, Pflugfelder PW, Gould RG, Cassidy MM, Higgins CB. Measurement of right and left ventricular volumes in healthy individuals with cine MR imaging. Radiology 1987; 163:697-702.
21. Sakuma H, FujitaN, Foo TK, Caputo GR, NelsonS}, Hartiala J. Evaluation ofleft ventricular volume and mass with breathhold cine MRimaging. Radiology 1993;88:1715-23.
22. Kim WY, Soergaard P, Kristensen B0, Egeblad H. Measurement of left ventricular volumes by 3-dimensional cchocardiography with tissue harmonic imaging: a comparison with magnetic resonance imaging. JAm Soc Echocardiogr 2001; 14:169-79.
23. Grothues F, Smith GC, Moon JCC, Bellenger NG, Collins P, Klein HU, ct al. Comparison of interstudy reproducibility of cardiovascular magnetic resonance with two-dimensional echocardiography in normal subjects and in patients with heart failure or left ventricular hypertrophy. Am J Cardiol 2002;90:29-34.
24. Bland JM, Altman DG. Statistical methods for assessing agreement between two methods of clinical measurements. Lancet 1986;1:307-10.


Real-time Simultaneous Triplane Contrast Echocardiography Gives Rapid, Accurate, and Reproducible Assessment of Left Ventricular
Volumes and Ejection Fraction: A Comparison with Magnetic Resonance Imaging
Siri Maim, MD, Sigmund Frigstad, MSc, Einar Sagberg, MD, Per Arvid Steen, and Terje Skjarpe, MD, PhD, Trondheim, Nonvay
Objective: We sought to compare the feasibility, accuracy, and reproducibility of simultaneous triplane echocardiography for measurements of left ventricular (LV) volumes and ejection fraction (EF) with reference to magnetic resonance imaging (MRI). Methods: Digital echocardiography recordings of apical LV views with and without intravenous contrast were collected from 53 consecutive patients with conventional 2-dimensional (2D) imaging and with simultaneous trip lane imaging. MRI of multiple LV short-axis sections was performed with a 1.5-T scanner. Endocardial borders were manually traced, and LV volumes and EF from 2D biplane echocardiography and MRI were calculated by method of disks. On triplane data, a triangular mesh was constructed by 3-dimensional interpolation and volumes calculated by the divergence theorem. Results: Triplane image acquisition was less timeconsuming than 2D biplane. Precontrast feasibility
Two-dimensional (2D) echocardiography (2DE) is widely used for assessment of left ventricular (LV) volume and ejection fraction (EF). However, it is rather time-consuming and has well-known limitations, such as LV foreshortening, inadequate
From the Department of Circulation and Medical Imaging, Faculty of Medicine, Norwegian University of Science and Technology (S.M., E.S., P.A.S., T.S.); Department of Cardiology, St Olavs University Hospital (S.M., T.S.); and GE Vingmed Ultrasound (S.F.).
Supported in part by a research fellowship grant from the Norwegian Council for Cardiovascular Diseases. GE Healthcare AS (Oslo, Norway) provided some of the contrast agent used, and GE Vingmed Ultrasound (Trondheim, Norway) provided the research ultrasound machine and software.
Reprint requests: Siri Malm, MD, Department ofinternal Medicine, Halogalandssykehuset Harstad, St Olavs gt 70, N-9480 Harstad, Norway (E-mail: [email protected]).
0894-7317/$32.00
Copyright 2006 by the American Society of Echocardiography.
doi:1 0.10 16/j.echo.2006.06.021
1494
was 72% for trip lane and 82% for 2D biplane images, increasing to 98% and 100% with contrast, respectively. Bland-Altman analysis demonstrated LV volume underestimation by echocardiography versus MRI, which was significantly reduced by contrast and triplane imaging. The 95% limits of agreement for EF between echocardiography and MRI narrowed using triplane compared with 2D biplane (precontrast -12.5 to 6.7% vs -17.2 to 9.9%, and with contrast -7.1 to 5.8% vs -9.4 to 6.4%, respectively). At intraobserver and interobserver analysis of 20 patients, limits of agreement for EF narrowed with contrast triplane compared with 2D biplane. Conclusion: Simultaneous LV triplane imaging is feasible with simple and rapid image acquisition and volume analysis, and with contrast enhancement it gives accurate and reproducible LV EF measurements compared with MRI. (J Am Soc Echocardiogr 2006;19:1494-1501.)
endocardial border defrnition, and geometric assumptions. 1-6 The introduction of tissue harmonic imaging and LV cavity opacification (LVO) has improved accuracy and reproducibility of EF measurements?-12 Real-time 3-dimensional (3D) echocardiography (3DE) has been shown to be superior to 2DE, 13-16 but has not yet been integrated into routine clinical practice. The 3DE techniques are still limited by the need for data from consecutive breath-hold cardiac cycles, lower spatial and temporal resolution, time-consuming analysis, and a narrower sector width (volume size) than 2DE.
The objective of this study was to evaluate the clinical feasibility, accuracy, and reproducibility of real-time simultaneous triplane data acquisition and analysis for echocardiographic measurements of LV volumes and EF. This novel method was compared with conventional 2D biplane measurements, both without and with addition of intravenous contrast. Cine-magnetic resonance (MR) imaging (MRl) was used as reference method. 17
-20

Journal of the American Society of Echocardiography Volume 19 Number 12 Maim eta! 1495
Figure 1 Simultaneous triplane echocardiography from patient before (A) and after (B) intravenous contrast administration. Three apical views are displayed in quad view \vith 4-chamber reference view (top left). Intcrplane angles are 60 degrees. Bottom 1'ight, Interposition of imaged planes.
METHODS
Study Population
In all, 53 consecutive patients submitted to echocardiography were prospectively enrolled, inclusion criteria being age above 18 years and a stable hemodynamic condition. No screening for image quality was performed. The exclusion criteria were atrial fibrillation, generally accepted contraindications to MRI, contraindications to the contrast agent Optison (GE Healthcare, Oslo, Norway), severe extracardiac disease, and significant changes in hemodynamic or clinical condition between echocardiography and MRI studies. All participants gave written informed consent to participation. The study conformed to the declaration of Helsinki, and the regional committee of medical ethics approved the protocol.
Echocardiography
Echocardiographic studies (Vivid 7 Dimension, GE Vingmed Ultrasmmd, Trondheim, Norway) were performed by a single experienced operator with participants in the left lateral recumbent position. Conventional 2D recordings of the standard apical LV views were collected with a M3S transducer. Simultaneous triplane imaging was performed using a novel 2D-array transducer (3V) and a real-time 3DE system. The apical 4-chamber view served as the reference image, and the two other planes were by default imaged and displayed with interplane angles set to 60 degrees, but could easily be steered electronically to any desired angle. A figure showing the interposition of imaged planes was simultaneously displayed in the quadscreen (Figure 1). With anatomic and functional real-time information of 3 apical planes, particularly their apical region and long-axis length, off-axis imaging giving foreshortening could more easily be disclosed and adjusted for.
Optison was administered intravenously in a proximal forearm vein as slow bolus injections with initial dose of 0.5 mL and repeated doses of 0.2 to 0.3 mL. The contrast was advanced by a slow manual flush, alternatively a slow infusion, of 0.9% saline at a speed adjusted to optimize cavity opacification and avoid far-field attenuation. Precontrast recordings were performed with tissue harmonic imaging (1.7/3.5 MHz). For LVO, a pulse inversion-based detection method, coded phase inversion, was used (1. 7 I 3.4 MHz), operating at a mechanical index of 0.18 to 0.22 and a depth dependent frame rate of 27 to 33 Hz. Cineloops of 3 cardiac cycles per apical view in 2D, and 3 cycles of the triplane quadscreen, were digitally stored in raw data format.
The saved 2D and triplane cineloops were transferred to an offline personal computer and analyzed by a blinded experienced operator using EchoPAC PC (GE Vingmed Ultrasound). End diastole (ED) was defined as the frame closest to the initial systolic coaptation of the mitral valve. End systole (ES) was defined as the minimal cavity area before mitral valve opening. Endocardial borders were manually traced according to the American Society of Echocardiography (ASE) recommendations, leaving d1e papillary muscles and rough trabeculations within the cavity.21 The LV volumes from 2D inlages were assessed using the biplane Simpson's rule.21 The apical long-axis rather than the 2-chamber view was used because of its better acoustic availability and improved accuracy for LV EF measurements22
•23 Triplane
inlages were simultaneously displayed in a quadscreen, and ED and ES were automatically detected and endocardial tracing performed manually. A triangular mesh was constructed by 3D interpolation between the traces, and ED volume (EDV) and ES volume (ESV) calculated by surface triangulation and summation of all triangles by the divergence theorem. 24 The volumes from 3 cardiac cycles were averaged and EF calculated as: [(EDV- ESV)JEDV] X 100%.

1496 Maim et al
To determine interobserver variability, 20 patients were randomly selected and independently analyzed by another observer blinded to patient data and previous results. For assessment of intraobserver variability, one of the observers did repeated analysis of 20 echocardiograms in a new random order after a minimum 8-week interval. Both observers were blinded to MRI results.
MRI
The MRI studies were performed with a 1.5-T system (Symphony with Quantum Gradients and Syngo 2002B software, Siemens, Erlangen, Germany). Both 2-chamber (oblique) and 4-chamber (horizontal) long-axis views were used as reference when multiple breath-hold short-axis slices of the LV were collected using a prospectively electrocardiographically gated fast imaging with steadystate free precession sequence. No MR contrast agent was needed. The slices were positioned perpendicular to the LV long axis with section thickness of 6 mm and intersection gaps of 4 mm, giving an interslice interval of 10 mm. The acquisition time window was 90% of the R-R interval resulting in breath-hold periods of 8 to 10 seconds, which was tolerated by most patients. Image matrix was 256 X 150 (read/phase), field of view 380 mm, repetition time 52.05 milliseconds, echocardiographic time 1.74 milliseconds, flip angle 70 degrees, and 14 to 21 heart phases were acquired per repetition time interval. The images were stored and transferred digitally for subsequent recall and analysis. To minimize physiologic changes in LV loading condition and size over time, echocardiographic and MRI examinations were performed within 1 hour.
An investigator blinded to patient data and echocardiographic results analyzed MRI data using custom-made, personal computer- based software (programmed in MatLab, The Math Works, Natick, Mass). To minimize subjectivity in contour tracing, we used previously described criteria for the tracing of short-axis slices, guided by reviewing the images in cine. 18
•20 ED was defined as the
first phase of the R wave-triggered sequence andES as the smallest cavity area. The most basal section to be included had to show a wall thickness compatible with the LV myocardium that extended at least 50% of the circumference. The LV outflow tract was included up to the level of the aortic valve. Papillary muscles and rough trabeculations were included in the blood pool, according to the criteria defined for echocardiography, unless inseparable from the myocardium. The LV volumes were calculated automatically by summation of the product (area X thickness) of all slices.
Statistics
Continuous data are expressed as mean ± 1SD. The agreement between methods and the repeatability of echocardiographic measurements were evaluated by analysis of Bland and Altman.Z5 The 95% limits of agreement were estimated as the mean difference (bias) ± 2SD of the differences. lnterobserver and intraobserver variability was in addition calculated as the SO of the mean differ-
Journal of the American Society of Echocardiography December 2006
Table 1 Baseline patient characteristics (n = 50)
Age, y Male BMI,kg/m2
Previous myocardial infarction Dilated eardiomypathy Hypertension Regional LV dyssynergy Distortion of LV shape LV aneurysm LV EDV > 150 mL
57 :':: 9 (37-75) 38
27.9 :':: 3.1 28
5 13 26 19
4 23
BMI, Body mass index; EDV, end-diastolic volume; LV, left ventricle. Values are mean ± lSD (range) or number of patients unless otherwise indicated.
ence expressed as a percentage of the mean (coefficient of variation). Paired ttests and analysis of variance were used for comparison of dependent data (within patients), with Bonferroni's correction for post hoc analyses. Pitman's test was performed for comparison of variances between methods. A P value of less than .05 was considered statistically significant.
RESULTS
The acquisition of real-time simultaneous triplane data was successful in all 53 patients, with the LV completely included in the maximum 90-degree scan sector. However, 3 patients were excluded because of intermpted (claustrophobia, n = 2) or technically inadequate (n = 1) MRI. There were no significant differences in heart rate between echocardiographic and MRI studies (66 ± 12 vs 68 ± 13/min, P = 0.42) and no patients were excluded because of changes in other hemodynamic or clinical conditions between studies. More than half of the patients had experienced previous myocardial infarctions and the population spanned a variation of LV shape, size, and regional function. Some baseline and LV echocardiographic characteristics are presented in Table 1. Mean values of LV volumes and EF are presented in Table 2. Representative triplane echocardiograms from one of the participants are illustrated in Figure 1.
Feasibility and Timing
The feasibility of traceable precontrast triplane images was 72% of patients compared with 82% for 2D imaging. Contrast increased this feasibility to 98% and 100%, respectively. Time interval between echocardiography and MRI was 18 ± 5 minutes. The data acquisition times for the required views, calculated from the initial placing of the transducer in the apical position, were 25 ± 8 seconds for 2D biplane and 8 ± 4 seconds for simultaneous triplane imaging (P = .0011). The offline EF analysis times were 5 ± 1 and 3 ± 2 minutes, respectively. The correspond-

Journal of the American Society ofEchocarcliography Volume 19 Number 12 Maim eta! 1497
Table 2 Left ventricular volumes and ejection fraction by magnetic resonance imaging, 2-dimensional biplane, and simultaneous triplane echocardiography (n = 50)
Precontrast echocardiography Contrast echocardiography
MRI 2D biplane* Trip lane 2D biplane* Trip lane
EDV,mL 170.3 :!: 66.6 136.2 :!: 52.6 149.1 :!: 58.0 153.2 :!: 46.8 159.3 :!: 47.4 ESV,mL 80.9 :!: 69.4 69.8 :!: 48.0 71.4 :!: 53.7 72.1 :!: 48.6 73.1 :!: 49.9 EF,% 57.7 :!: 16.0 52.5 :!: 13.0 53.5 :!: 13.7 55.2 :!: 14.0 56.8 :!: 13.6
EDV, End-diastolic volume; EF, ejection fraction; ESV, end-systolic volume; MRI, magnetic resonance imaging; 2D, 2-dimcnsional. *Biplane calculation with the apical4-chamber and long-axis views. Values are mean :±: lSD.
Table 3 Differences in left ventricular volumes and ejection fraction between magnetic resonance imaging and echocardiography
Precontrast echocardiography Contrast echocardiography
2D biplane* Trlplane 2D biplane• Trlplane
EDV,mL ESV,mL EF,%
-44.9 60.1 -27.3 50.1 t -21.5 47.5 -11.5 42.7t -16.8 40.7 -9.3 30.3:j: -8.3 28.3 -5.7 26.0:): -3.7 13.6 -2.9 9.6§ -1.5 7.9 -0.7 6.1§
EDV, End-diastolic volume; EJ-: ejection fraction; ESV, end-systolic volume. *Biplane calculation with apical4-chamber and long-axis views. tP < .01, :f:P < .05, and §nonsignificant versus 2-climcnsional biplane.
Values are mean difference (bias)± 2SD of the difference (=95% limits of agreement).
ing MRI acquisition and analysis times were 17 ± 5 and 20 ± 6 minutes.
Accuracy
There were significant differences in EF between precontrast and contrast echocardiography, both for 2D biplane and triplane (both P < .001), but no significant differences between 2D biplane and triplane measures (P = .34 precontrast and P = .14 with LVO) (Table 3). However, analysis of Bland and Altman25 of LV volumes and EF demonstrated closer agreement between echocardiography and MRI using triplane imaging, both precontrast and with LVO (Figure 2). There was a systematic volume underestimation by echocardiography compared with MRI (Table 3). The bias for EDV was significantly reduced from -44.9 to -27.3 mL precontrast (P .0019) and from -21.5 to -11.5 mL with contrast (P = .0024), comparing 2D biplane and triplane measures, respectively. The corresponding bias for ESV was also reduced with triplane versus 2D biplane, but relatively less than for EDV: 9.3 versus -16.8 mL precontrast (P = .020) and -5.7 versus 8.3 mL with contrast (P = .043), respectively. The 95% limits of agreement for EF between precontrast echocardiography and MRI were -17.2 to 9.9% (EF units) using 2D biplane and -12.5 to 6.7% for triplane data (Table 3 and Figure 2). With LVO, corresponding limits were -9.4 to 6.4%, and -7.1 to 5.8%, respectively (Table 3 and Figure 2). The variance of EF by echocardiography compared with MRI was significantly reduced by triplane
~ .. -· m&lbod•
Pr~e<m\ms\
-~><-• rn~ti'Wa$:
C<:>fllilll$l
20 biplane
.. __. .......................... ...... Q
0
" .... ~:ft;! u. nD.,
<>4!6 ~ -" - .. -= t.>- ,. ----
00 fj) ffi
t;< ):.1: OCf ro
Triplaoo
-~~-'" ..... ~-
" "" O j., cc-"-•••""~il.lff',;:<>"'
t~~t) -wJ _____ ji, ____ _ -~1
"' "' >o
Me-an otm~thcds., EF~%}
Figure 2 Bland-Airman bias plots illustrating agreement in ejection fraction ( EF) measurements between echocardiography and magnetic resonance imaging (MRI) for conventional 2-dimensional biplane (left) and simultaneous triplane (right) measurements, precontrast (top) and with contrast (bottom). Central horizontal line, Mean bias or systematic difference; upper and lower solid horizontal lines, 95% confidence interval of differences (limits of agreement).
compared with biplane, both precontrast (t = 5.036, P = .0014) and with contrast (t = 6.783, p = .0008).
The 95% limits of agreement for EF in patients with regional LV dyssynergy (n = 26) were at

1498 Maim et al Journal of the American Society of Echocardiography
December 2006
Table 4 Subgroup difference in left ventricular ejection fraction between magnetic resonance imaging and echocardiography
Precontrast echocardiography Contrast echocardiography
No. of patients 20 biplane* Trlplane 20 biplane* Trlplane
Regional LV dyssynergy No regional LV dyssynergy
26 24
-3.6 :':: 13.5 -3.1 :':: 9.9 -1.6 :':: 8.1 -0.6 :':: 6.4 -4.0 :':: 13.4 -2.8 :':: 9.4 -1.4 :':: 7.7 -0.8 :':: 6.5
LV, Left ventricular. *Biplane calculation with apical 4-chamber and long-axis views. Values arc mean differences (bias) ± 2SD of the difference ( = 95% limits of agreement) in percent absolute ejection fraction units.
Precontrast 2Dbiplane
1&
i ·~1-.-.-.- . .2...q
I 0
i -~
·10
d~
<)
0
8 0 ° ···················;,;~:;'O·c,···
""' "o" 0 g ., _ _.._.,_ .. _ .. _
·21!+----.----...----.
"' 10 ~ ~
~ ~ - 2
fu! -~ ·4
·• 4 ·10 ·1l
10
10
:lll M 10
M .. n IW(Ob$1&0bli~l
'6 ~8 "
-·--~·--·o--·· ·-n---Or;;r·f:? ..
" 0" .,<~> 0 .. ___ ... ____ _ 30 ~· 10
Me;!l" Ef tMI};t:S 1&2:)
IS
·~
Triplane
" _ ... _1*_1>-~~-"
:l··e;··--······ .. .,.g .. o. •• '(r~--0 ,gil'>
·10
dS
•20 +---~--------
•• .. 10 ~0 so 7Q
Mu:n-ff(Obi.1&.0bU)
: 1- • - • - • - • - io-"' ""'
... +-------~--~ 10 ,. •• ,.
M&uEftMUt~:1U.
Contrast
,. w
,s
... vr!l-
lZ tO ~
10
2Dbiplane
- ~- ~- w~- , .. f:J._
.o.. s"-:1"' ·· 0
.. ~_ .. _ .. _" 0 .,_+
:u~ $~ ,. MUll £1 (Ott«tlOU..:l}
:t-.-.-.-. ~--; ....... ~., .. ., ..... '?~.~ ..... . :! "'b"" 0----- ... ---·&
·• ·10 .,~-~--~-----~
10 3D so 10
Mun IW(Mo•~ 1&2}
Triplane
" ,. -"'-o:---~-"-
'···· e. ooooo o ···w··
>1.... 0 . I •-.- • .!1. ,'h ~tll" ,.,_,_.
"" ., ...... ________ _ '"
12 w $
•
lO ~Q 1'~
MUDi &: (Ob!i1 & Obd}
~[·¢--·~--~~-~~):-~~ -1 .. - p_ .. ~ ... -9~ .. -~ ..
·10 .,. I---~--~--~
10 "' '"' 10
M.,.an fF'MtHj~ t.$2}
Figure 3 Bland-Airman plot illustrating interobserver (top) and intraobserver (bottom) agreement for ejection fraction measurements with conventional 2-dimensional biplane (first and third column) and simultaneous trip lane (second and fourth column), both precontrast (two left columns) and contrast (two right columns). N = 20.
baseline -17.1 to 9.9% (2D biplane) and -13.0 to 6.8% (triplane), and with contrast -9.7 to 6.5% and -7.0 to 5.8%, respectively. In the subgroup with normal LV wall motion (n = 24), the limits of agreement for EF at basline were -17.4 to 9.4% (2D biplane) and -12.2 to 6.6% (triplane), and with contrast -9.1 to 6.3% and -7.3 to 5.7%, respectively (Table 4). For patients with EDV greater than 150 mL, the precontrast limits of agreement for EF were -14.3 to 10.6% for 2D biplane versus -11.7 to 7.3% for triplane. With contrast, the corresponding limits were -9.0 to 7.9% versus -7.8 to 6.4%, respectively.
Reproducibility
Comparing the readings of two observers (Figure 3), the limits of agreement for precontrast EF were -15.6 to 8.6% (2D biplane) and -13.0 to 6.6%
(triplane). With contrast, the limits narrowed to -7.3 to 8.4% and -5.8 to 7.7%, respectively. From intraobserver analysis, the corresponding limits of agreement were -10.9 to 7.9% and -7.4 to 6.2% precontrast, improving to -4.8 to 4.8% and -3.2 to 3.3% with contrast (Figure 3). The interobserver coefficient of variation for EF was precontrast 12.0% for 2D biplane and 9.4% for triplane, with contrast 6.9% and 5.7%, respectively. The corresponding numbers for intraobserver variability were 9.0 versus 6.4% (precontrast) and 5.3 versus 3.2% (contrast).
Safety and Tolerability
The patients received a mean total dose of 1.1 mL of Optison. There were no significant changes in the study patients' blood pressure, heart rate, or rhythm

Journal of the American Society ofEchocardiography Volume 19 Number 12
and no discomfort or adverse effects were reported or observed after contrast injections.
DISCUSSION
This study demonstrated that: (1) simultaneous triplane contrast echocardiography is feasible in unselected patients; (2) echocardiography is associated with volume underestimation compared with MRI, but significantly less with contrast; and (3) simultaneous triplane imaging incrementally decreases volume underestimation and improves agreement with MRI and reproducibility of EF measurements.
The improvement in accuracy compared with MRI was indeed significant only after contrast enhancement. However, the triplane approach seemed to give an incremental benefit in accuracy that even accounted for patients with asymmetric, dyssynergic, or dilated LVs.
To our knowledge, this is the first clinical study on real-time simultaneous triplane echocardiography for LV volume and EF measurements; however, the feasibility of biplane imaging was previously tested on exercise stress echocardiography.Z6
Feasibility and Timing
The acquisition time for triplane imaging was reduced because the transducer did not have to be moved to obtain data from multiple views. The display gave a good overview of LV size, shape, and performance. The user interface and dataset manipulation was simple and intuitive, preventing prolonged analysis time compared with 2D biplane.
Precontrast, more patients were lost with triplane (28%) than with 2D (18%) imaging. To image 3 planes simultaneously, the total line density is increased on the expense of frame rate, but the number of beams per plane is still reduced compared with conventional imaging giving poorer spatial resolution. Furthermore, triplane imaging requires all views to be simultaneously available with the probe in the same position, and is, hence, more limited by the acoustic window. We believe that this explains the lower precontrast traceability for the triplane images. However, by adding contrast the clinical feasibility was comparable with that of contrast 2D imaging.
Accuracy
Our data demonstrated a general volmne underestimation by echocardiography, compared with MRI, as previously demonstrated. 1
'12
•23 By adding contrast,
the volume underestimation was significantly reduced. Indeed, the main proportion of gain in accuracy between echocardiography and MRI seemed to be related to the application of contrast. Simultaneous
Malm et al 1499
triplane intaging, nevertheless, gave an incremental reduction in volume underestimation, more so for EDV than ESV, and significantly reduced the bias compared with MRI. Not surprisingly, triplane contrast imaging did not eliminate the volume underestimation, as this is still dependent on the acoustic window. The triplane volume analysis further relies on interpolation between 2D traces, and this could introduce geometric errors, particularly in seriously distorted LVs. Compared with true 3DE, which allows calculating volumes based on fully available geometric information, triplane imaging is expected to be inferior in accuracy. Nevertheless, the triplane technique improved accuracy compared with 2D biplane measurements, both without and with contrast. This is in line with previous studies, in which the greatest improvement in accuracy took place moving from uniplane to biplane, and increasing to 3 or 4 planes gave incremental benefit, whereas further increases gave limited benefit even for asymmetric objects and distorted LVs.Z7
•28 A recent study
indeed reported that as much as 4 and 8 planes extracted from 3D datasets were needed to accurately assess EDV and ESV, respectively, in severely distorted LVs. 16 However, volumetric 3DE is still rather time-consuming and complicated, and does not have a similar benefit in symmetric or dilated LVs.
Reproducibility
The greatest improvement in agreement between observers and repeated readings was also a result of the addition of contrast, confirming the fmdings in previous studies.U·12
•24 Nevertheless, both interob
server and intraobserver variability of EF measurements was further reduced by the use of triplane compared with 2D biplane measurements, both without and with simultaneous LVO (Figure 3).
Previous works found significant variations between operators with respect to both the angulation and displacement of 2DE imaging planes, with foreshortening of apical views. 3-6 An imaging technique obtaining 3 apical planes in one single operation, without having to rotate the transducer, could eliminate at least some of this variability. In addition to being timesaving, the simultaneous display gives a better overview of the LV size and shape, and simplifies the anatomic orientation and the recognition of nonequatorial plane position. In this way, less experienced operators could be expected to acquire more robust LV volume data. Because it is possible to acquire images for triplane EF measurements from one single cardiac cycle, this could even reduce the problems with artifacts from respiration and patient movement. Assessment of interstudy variability was not performed, but we hypothesize that using the triplane technique might reduce the

1500 Maim eta!
likelihood of variation being a result of different cut-plane angulations.
Future Perspectives
The incremental benefit of triplane compared with 2D biplane imaging could seem relatively modest, and contrast addition was necessary to achieve an acceptable clinical feasibility with this first application. However, this technique supplies another plane to the LV volume calculation in a fast and simple way, moving 2D volume measures even closer to the reference standard. With further improvements in image quality it holds promise as an interesting future tool for evaluation of LV performance. In particular, this might be an attractive and timesaving modality for stress echocardiography, in which the operator dependency is an important limiting factor. 26
•29 In the current volume study,
image planes were set at 60-degree intervals, because covering the LV more evenly could be a geometric advantage. However, in stress echocardiography the angles should be adjusted to acquire the standard apical planes and myocardial segments to cover the coronary territories according to the ASE.30
Study Limitations
The study sample size was small, and in view of the small subgroups the results should be verified in further, larger-scale studies. The sample included distorted and dilated LVs, but the consecutive enrollment resulted in a majority of patients with EFs within the normal range.
The study patients were all in sinus rhythm; thus, the results cannot be generalized to patients with arrhythmia. However, the reason for excluding these was the risk of inadequate MRl quality. A potential limitation of MRl volumetry was the selection of which basal slices to include or exclude, particularly in systole. To reduce this source of error, special care was taken to review short-axis slice projections onto the long-axis reference views and perform the tracings with support from cinemovies.
Conclusions
Simultaneous trip lane echocardiography of the LV was feasible with simple and rapid image acquisition and volume analysis. Triplane imaging with contrast gave more accurate and reproducible LV EF measurements than conventional 2D biplane echocardiography compared with MRl reference values. The trip lane display gave a quick overview of LV size, shape, and performance, and may become an interesting future tool for serial evaluation of the LV systolic function, and for stress echocardiography.
Journal of the American Society ofEchocardiography December 2006
REFERENCES
1. BernardY, Meneveau N, Boucher S, Magnin D, Anguenot T, Schiele F, et al. Lack of agreement between left ventricular volumes and ejection fraction determined by two-dimensional echocardiography and contrast cineangiography in postinfarction patients. Echocardiography 2001;18:113-22.
2. Naik MM, Diamond GA, Pai T, Soffer A, Siegel RJ. Correspondence of left ventricular ejection fraction determinations from two-dimensional echocardiography, radionuclide angiography and contrast cineangiography. J Am Coli Cardiol 1995;25:937-42.
3. Erbel R, Schweizer P, Lambertz H, Henn G, Meyer J, Krebs W, et al. Echoventriculography: a simultaneous analysis of two-dimensional cchocardiography and cineventriculography. Circulation 1983;67:205-15.
4. Sapin PM, Schroeder KM, Gopal AS, Smith MD, King DL. Three-dimensional echocardiography: limitations of apical biplane imaging for measurement of left ventricular volume. JAm Soc Echocardiogr 1995;8:576-84.
5. Teichholz LE, Kreulen T, Herman MV, Godin R Problems in echocarcliographic volume determinations echocardiographic-angiographic correlations in the presence or absence of asynergy. Am J Carcliol1976;76:7-11.
6. Albin J, Rakho PS. Comparison of echocarcliographic quantification of left ventricular ejection fraction to raclionuclcide angiography in patients with regional wall motion abnormalities. Am J Carcliol1990;65:1031-2.
7. Cohen JL, Cheirif J, Segar DS, Gillam LD, Gottdiencr JS, Hausnerova E, et al. Improved left ventricular endocardial border delineation and opacification with Optison (FS069), a new echocardiographic contrast agent; results of a phase III multicenter trial. JAm Coli Carcliol1998;32:746-52.
8. Senior R, Andersson 0, Caidahl K, Car!ens P, Herregods MC, J enni R, et al. Enhanced left ventricular endocardial border delineation with an intravenous injection of Sonovue, a new echocardiographic contrast agent: a European multicenter study. Echocardiography 2000;17:705-11.
9. Hundley WG, Kizilbash AM, Afridi IW, Franco F, Peshock RM, Gray burn PA. Administration of an intravenous perfluorocarbon contrast agent improves echocardiographic determination of left ventricular volumes and ejection fraction: comparison with cine magnetic resonance imaging. J Am Coil Cardioll998;32:1426-32.
10. Thomson HL, Basmadjian A, RainbirdA, Razavi M, Avierinos JF, Pellikka PA, et al. Contrast cchocarcliography improves the accuracy and reproducibility of left ventricular remodelling measurements: a prospective, randomly assigned, blinded study. JAm Coli Cardia! 2001;38:867-75.
11. MaimS, Frigstad S, Sagbcrg E, Larsson H, Skjaerpe T. Accurate and reproducible measurement of left ventricular volume and ejection fraction by contrast cchocardiography: a comparison with magnetic resonance imaging. J Am Coli Cardia! 2004;44:1030-5.
12. Hoffmann R, von Bardeleben S, ten Cate F, Borges AC, Kasprzak J, Firschke C, et al. Assessment of systolic left ventricular function: a multi-center comparison of cineventriculography, cardiac magnetic resonance imaging, unenhanccd and contrast enhanced echocardiography. Eur Heart J 2005; 26:607-16.
13. Mannaerts HF, Van Der Heides JA, Kamp 0, Papavassiliu T, Marcus )T, Beck A, et al. Quantification of left ventricular volumes and ejection fraction using freehand transthoracic three-

Journal of the American Society ofEchocardiography Volume 19 Number 12
dimensional cchocardiography: comparison with magnetic resonance imaging. JAm Soc Echocardiogr 2003;16:101-9.
14. Klihl HP, Schreckenberg M, Rulands D, Katoh M, SchaferW, Schummers G, et al. High-resolution transthoracic real-time three-dimensional echocardiography: quantitation of cardiac volumes and function using semi-automatic border detection and comparison with cardiac magnetic resonance imaging. Echocardiography 2004;43:2083-90.
15. Jenkins C, Bricknell K, Hanekom L, Marwick TH. Reproducibility and accuracy of echocardiographic measurements ofleft ventricular parameters using real-time three-dimensional echocardiography. JAm Call Cardia! 2004;44:878-86.
16. Gutierrez-Chico JL, Zamorano JL, Perez de Isla L, Orejas M, Almeria C, Rodrigo JL, et al. Comparison of left ventricular volumes and ejection fractions measured by three-dimensional echocardiography versus by two-dimensional echocardiography and cardiac magnetic resonance in patients with various cardiomyopathies. Am J Cardio\2005;95:809·13.
17. Benjelloun H, Cranney GB, Kirk KA, Blackwell GC, Lotan CS, Pohost GM. Interstudy reproducibility of biplane cine nuclear magnetic resonance measurements of left ventricular function. Am J Cardio\1991;67:1413-20.
18. Sakuma H, Fujita N, Foo TK, et al. Evaluation of left ventricular volume and mass with breath-hold cine MR imaging. Radiology 1993;188:377-80.
19. Grothues F, Smith GC, Moon JCC, Bellenger NG, Collins P, Klein HU, et al. Comparison of interstudy reproducibility of cardiovascular magnetic resonance with two-dimensional echocardiography in normal subjects and in patients with heart failure or left ventricular hypertrophy. Am J Cardiol 2002;90:29-34.
20. Alfakih K, Reid S, Jones T, Sivananthan M. Assessment of ventricular function and mass by cardiac magnetic resonance imaging. Eur Radio! 2004;14:1813-22.
21. Schiller NB, Shah PM, Crawford M, DeMaria A, Devereux R, Feigenbaum H, et al. Recommendations for quantification of the left ventricle by two-dimensional echocardiography. JAm Soc Echocardiogr 1989;2:358-67.
Maim eta! 1501
22. Nosir YFM, Vletter WB, Boersma E, Frowijn R, Ten Cate FJ, Fioretti PM, et al. The apical long-axis rather than the twochamber view should be used in combination with the four· chamber view for accurate assessment of left ventricular volumes and function. Eur Heart J 1997;18:1175-85.
23. Malm S, Sagberg E, Larsson H, Skjarpc T. Choosing apical long-axis instead of two-chamber view gives more accurate biplane echocardiographic measurements of left ventricular ejection fraction: a comparison with magnetic resonance imaging. JAm Soc Echocardiogr 2005;18:1044-50.
24. Goldman RN. Area of planar polygons and volume ofpolyhe· dra. In: Arvo J, editor. Graphics Gems II. San Diego: Aca· demic Press; 2004.
25. Bland JM, Altman DG. Statistical methods for assessing agree· mcnt between two methods of clinical measurements. Lancet 1986;1:307-10.
26. Sugeng L, Kirkpatrick J, Lang RM, Bednarz JE, Decara JM, Weinert L, et al. Biplane stress echocardiography using a prototype matrix-array transducer. J Am Soc Echocardiogr 2003;16:937-41.
27. Shroeder KD, Sapin PM, King DL, Smith MD, DeMaria AN. Three-dimensional echocardiographic volume computation: in vitro comparison to standard two-dimensional echocardiography. JAm Soc Echocardiogr 1993;6:467-75.
28. Aakhus S, Maehle J, Bjoernstad K. A new method for echocardiographic computerized three-dimensional reconstruction of left ventricular endocardial surface: in vitro accuracy and clinical repeatability of volumes. J Am Soc Echocardiogr 1994;7:571-81.
29. Hoffmann R, Lethen H, Marwick T, Arnese M, Fioretti P, Pingitore A, et al. Analysis of interinstitutional observer agree· ment in interpretation of dobutaminc stress echocardiograms. JAm Col! Cardio\1996;27:330-6.
30. Armstrong WF, Pellikka PA, Ryan T, Crouse L, Zoghbi WA. Stress echocardiography: recommendations for performance and interpretation of stress echocardiography; stress echocardiography task force of the nomenclature and standards com· mittce of the American Society of Echocardiography. J Am Soc Echocardiogr 1998;11:97-104.


() Cardiovascular Ultrasound BioMed Central
Research Quantification of resting myocardial blood flow velocity in normal humans using real-time contrast echocardiography. A feasibility study Siri Malm*l, Sigmund Frigstad2, Frode Helland1, Kjetil Oye1, Stig Slordahll and Terje Skjarpel
Address: 1Department of Circulation and Medical Imaging, Faculty of Medicine, Norwegian University of Science and Technology, Trondheim, Norway and 2GE Healthcare Technologies, Ultrasound R&D, Trondheim, Norway
Email: Siri Maim* - [email protected]; Sigmund Frigstad- [email protected]; Frode Helland- [email protected]; Kjetil Oye- [email protected]; Stig Slordahl- [email protected]; Terje Skjarpe- [email protected]
* Corresponding author
Published: 16 June 2005
Cardiovascular Ultrasound 2005, 3:16 doi:l 0.1186/1476-7120-3-16
Received: 30 April 2005 Accepted: 16 June 2005
This article is available from: http://www.cardiovascularultrasound.com/content/3/l/ 16
© 2005 Maim et al; licensee BioMed Central Ltd. This is an Open Access article distributed under the terms of the Creative Commons Attribution License (bttp·/lcreatiyecommons org/ljcenses/by/2 0), which permits unrestricted use, distribution, and reproduction in any medium, provided the original work is properly cited.
Abstract
Background: Real-time myocardial contrast echocardiography (MCE) is a novel method for assessing myocardial perfusion. The aim of this study was to evaluate the feasibility of a very low-power real-time MCE for quantification of regional resting myocardial blood flow (MBF) velocity in normal human myocardium.
Methods: Twenty study subjects with normal left ventricular (LV) wall motion and normal coronary arteries, underwent low-power real-time MCE based on color-coded pulse inversion Doppler. Standard apical LV views were acquired during constant IV. infusion of SonoVue®. Following transient microbubble destruction, the contrast replenishment rate (~). reflecting MBF velocity, was derived by plotting signal intensity vs. time and fitting data to the exponential function; y (t) =A ( 1-e·P(t-tO)) + C.
Results: Quantification was feasible in 82%, 49% and 63% of four-chamber, two-chamber and apical long-axis view segments, respectively. The LAD (left anterior descending artery) and RCA (right coronary artery) territories could potentially be evaluated in most, but contrast detection in the LCx (left circumflex artery) bed
was poor. Depending on localisation and which frames to be analysed, mean values of ~ were 0.21-0.69 s-1, with
higher values in medial than lateral, and in basal compared to apical regions of scan plane (p = 0.03 and p < 0.0 I). Higher ~-values were obtained from end-diastole than end-systole (p < 0.00 I), values from all-frames analysis lying between.
Conclusion: Low-power real-time MCE did have the potential to give contrast enhancement for quantification of resting regional MBF velocity. However, the technique is difficult and subjected to several limitations. Significant variability in ~ suggests that this parameter is best suited for with-in patient changes, comparing values of stress studies to baseline.
Page 1 of9 (page number not for citation purposes)

Cardiovascular Ultrasound 2005, 3:16
Background MCE is an emerging technique for non-invasive evaluation of myocardial perfusion and coronary heart disease (CAD) [1-ll). Recent advances in multipulse technology have made real-time MCE feasible with low acoustic power [12-17), giving minimal contrast destruction and frame rates that facilitate evaluation of scan plane and wall motion. However, technical difficulties concerning tailored ultrasound equipment, imaging techniques, dataanalysis and interpretation still remain to be solved.
The majority of MCE studies have reported data relying on visual assessment somewhat limited by its subjective approach (18). Wei and coworkers pioneered a method for more objective quantification of MBF with contrast microbubbles administered as constant intravenous infusion [ 5). From the time course of video intensity during progressively prolonged pulsing intervals, both MBF velocity and myocardial blood volume (MBV) could be assessed. The product of these two parameters was shown to correlate well with radiolabeled microsphere-derived MBF (5,17,19,20). This quantitative approach has also been applied to real-time MCE techniques (14-16,19). A strong linear correlation between the rate of signal intensity (SI) rise and volumetric flow has been reported, both at rest and during hyperemia (14, 16,22). On the other hand, steady state SI has not been found to correlate as well with flow measurements (14, 17), indicating that the microbubble replenishment rate might be the major MCE perfusion parameter.
The quantification of replenishment rates is often limited to selected myocardial regions due to imaging problems (19,22). To our knowledge there are limited human studies reporting resting replenishment rates for all standard myocardial segments measured in different cardiac phases. The aim of this study was 1) to evaluate the feasibility of a very low-power real-time MCE technique for visualising the perfusion in normal human myocardium, and 2) to quantify the MBF velocity, ~' of all myocardial segments of the apical scan views by using the destructionreplenishment approach.
Methods Study subjects Twenty study subjects were enrolled; ten healthy male volunteers (age 24 ± 3) and ten patients (age 55± 5), five of them female. The study subjects were not screened for echocardiographic image quality, the only inclusion criteria being an age above 18 and confirmed normal left ventricular regional and global systolic function by conventional echocardiography. The ten patients had undergone coronary angiography due to chest pain, with the findings of open and normal coronary arteries and normal left ventricular end-diastolic pressures. The
http://www .cardiovascularultrasound .com/content/3/1/16
healthy volunteers were assumed to have normal coronary anatomy and myocardial perfusion, due to the abscence of CAD risk factors and symptoms, and normal findings on standard echocardiography. All the subjects were in sinus rhythm. Exclusion criteria were pregnancy or lactation, known allergy to the contrast agent, significant valve diseases or shunts, severe pulmonary hypertension, and severe extra-cardiac disease. All the subjects gave their written informed consent to the participation. The study conformed to the declaration of Helsinki, and the Regional Commitee of Medical Ethics approved the protocol.
Contrast agent The ultrasound contrast agent Sonovue (Bracco, Milan, Italy) was used, consisting of microspheres of sulphur hexafluoride gas (SF G) stabilised by a phospholipid monolayer in an aqueous solution. So no Vue®was infused continuously by a manually rotated volume pump through a 20G vial in a proximal forearm vein. There were slight individual changes of the infusion rate (70-1 00 ml/ hour) to optimize the myocardial opacification and minimize the far-field attenuation. Once steady state was reached and the recording started, the infusion rate was held constant in every individual study.
MCE technique Imaging was performed with Vivid T'" (GE Vingmed Ultrasound, Horten, Norway) with a M3S matrix array transducer. The contrast-specific application, Coded Harmonic Angion', is a very low power, real-time technique based on pulse inversion combined with power Doppler, operating at a frame rate of 20 Hz. With this choice of application and contrast agent, the optimal agent-tissueratio was achieved with a mechanical index (MI) as low as 0.04-0.05. The signal amplitudes were color-coded by the Angio mode and displayed as overlays on fundamental tissue grey-scale images. The focus was set basally, close to the mitral valve plane. The depth was set to let the left ventricle fill the image sector, and color gain was adjusted to reduce the signal-to-noise ratio to the point that hardly any noise was observed within tissue and cavity. The time gain compensation was adjusted to obtain homogenous SI and to reduce the noise from the myocardium, the epi/ pericardium and the mitral valves. After the initial adjustments all settings were held constant in every individual study.
Baseline imaging was acquired in tissue harmonic mode for confirmation of normal anatomy and wall motion. MCE was performed in the apical four-chamber, twochamber and long-axis views. Standard views were at times slightly modified, i.e. by centralising the lateral or anterior walls in the scan sector, to optimize the contrast detection and avoid attenuation and shadowing. When
Page 2 of9 (page number not for citation purposes)

Cardiovascular Ultrasound 2005, 3:16
the myocardial contrast opacification reached a steady state, a 'flash' of 15 frames ofhigh MI (1.0), timed to cover at least the entire systole, was applied for transient microbubble destruction. This was followed by immediate, automatic return to low MI continuous imaging of microbubble replenishment in end-expiration (See Additional file: 1 Movie demonstrating a real-time destructionreplenishment loop of the LV apical long-axis view). The procedure was repeated twice for every scan view. Fifteen cardiac cycles of every destruction-replenishment sequence, at least 10 after 'flash', were captured and stored digitally as raw-data.
Image analysis The MCE data were analysed off-line on a PC workstation. Analyses of the cineloops were performed blinded in random order using EchoPAC PC'" ( GE Vingmed Ultrasound, Harten, Norway). Measurement of mean signal intensity (dB) was done in manually placed, equally sized and shaped regions of interest (ROI) in the 16 standard myocardial segments [23), plus the two apical segments of the apical long-axis view. The RO!s were large, avoiding high intensity signals from the cavity and the epi-and endocardium. When necessary, their position was slightly adjusted to compensate for the translation of the heart. The depth of the ROI position was not changed. Finally, all RO!s were 'anchored' for each frame.
The myocardial SI was plotted against time (t) and fitted to the exponential function: y (t) =A (1-e·P<t-tOJ) + C, where y is SI at any time during the contrast replenishment, A is the plateau SI corresponding to MBV, ~ is the rate of SI rise reflecting the mean bubble velocity or MBF velocity, and C is the intercept at the origin reflecting the background intensity level [ 5). The introduction of t0 simply reflects that the analysis software allowed one to choose where to set t = 0. To further compensate for a possible non-zero initial value after flash, the constant C was added, implicating that the curve fitting was relatively independent of background myocardial Sl. The RO!s were positioned and anchored before the curve fitting was applied. Segmental values of A and ~ were derived from the replenishment cycles by careful frame-by-frame analysis. Separate quantitative analysis was performed both for all-frames, for selected end-systolic (end ofT-waves) and end-diastolic (close to peak R-wave) frames.
The myocardial segments were assigned to the coronary artery perfusion territories (Figure 1 ), and the feasibility for evaluating perfusion at a territorial level was assessed. Because the LV wall motion was normal, any lack of myocardial contrast opacification was considered to be due to attenuation or inadequate detection, and the current segment was excluded from the quantitative analysis. Since the healthy volunteers all had normal regional and global
http://www.cardiovascularultrasound.com/content/311 /16
LV function, it seemed acceptable to make this assumption even if coronary angiography was not performed.
Statistics Continuous variables are presented as mean± 1SD. Comparison between groups was performed with linear regression analysis (ANOVA), a posthoc analysis was done using Bonferroni's correction. Differences were considered statistically significant at p less than 0.05 (two-sided) with a power of 0.80.
Results Some visible myocardial contrast enhancement was obtained in all views of all the study subjects. Precontrast myocardial tissue SI was negligible, but in spite of careful adjustment of the time-gain compensation we noticed relatively strong precontrast signals from the mitral valve and basal epi-and pericardium. On average 6 minutes of infusion time was spent to aquire repeated replenishment cineloops in the apical views. Myocardial contrast first appeared around one minute after the infusion was started, and steady-state SI was reached after a mean period of2.5 minutes. After the 'flash' an almost complete disappearance of myocardial color signals was observed, leaving the myocardium dark Real-time visual grading of myocardial SI during post-destruction wash-in was difficult due to cardiac contraction, translation and cyclic changes of myocardial Sl, both between systole and diastole and from beat to beat. By reviewing selected endsystolic frames, refilling was first observed in the mid-septum progressing to full opacification in 3 to 5 heartbeats. However, when observed in end-diastole the refilling clearly appeared faster, yet variable. Selected end-systolic images of destruction-refill sequences of the apical LV views are presented in Figure 2.
Feasibility of quantitative analysis All360 myocardial segments were evaluated regardless of baseline image quality. Since the LV wall motion was normal, any contrast defect was considered to be due to attenuation or inadequate detection, and the current segment was thus excluded from the quantitative analysis. Following this, the myocardial opacification was regarded as sufficient for quantification in 98 of 120 (82%) of the fourchamber view segments (Table 1). The septum filled in completely during wash-in, while enhancement of the lateral wall was more pathcy. In two-chamber and long-axis views, the number of feasible segments was lower; 59 of 120 (49%) and 76 of 120 (63%), respectively (Table 1) Thus, a total of233 of360 (65%) of myocardial segments were feasible for quantification. For healthy, young normals and patients the feasibility was 118 ( 66%) and 115 ( 64%) of segments, respectively. The most frequent dropouts were observed in the mid and basal segments of the lateral and anterior wall, and in the basal segment of the
Page 3 of9 (page number not for citation purposes)

Cardiovascular Ultrasound 2005, 3:16 http://www .cardiovascularultrasound .com/content/3/1/16
4-chamberview 2-chamber view Long axis view
LAD LCx - RCA
Figure I The different coronary artery beds and their representation in myocardial segments of the LV apical views, given a balanced coronary circulation. LAD = left anterior descending artery; LCx = left circumflex artery; LV = left ventricle; RCA = right coronary artery. Courtesy of Asbjorn Stay/en, dept of Circulation and Medica/Imaging, Norwegian University of Science and Technology, Trondheim, Norway.
inferolateral wall. In these we only obtained myocardial opacification in half of the study subjects.
Evaluated on a territorial level, perfusion in the LAD area could be assessed in all 20 subjects. Segments usually assigned to the RCA could be evaluated in 15 subjects, whereas the LCx supply area was analysable in only half of the subjects.
MCE parameters Beta-values were derived by curve fitting in the 233 feasible segments (Figure 3). Depending on localisation and which frames of the heart cycle to be analysed, we found mean values of P ranging from 0.21 to 0.69 s-1 with SDs of 0.09 to 0.29 s·1 (Table 1). Segmental mean values of A ranged from 6.01 to 12.29 dB with SDs of 2.1 to 4.9 dB. Mean end-systolic P-values was found to be higher in medial than lateral parts of the scan plane (0.3 7 ± 0.13 vs. 0.32 ± 0.14 s-1, p = 0.03), and at greater depths (basal; 0.45 ± 0.16 s·1 vs. apical; 0.36 ± 0.14 s-1, p < 0.01). The A parameter similarly was found to be higher in medial
(9.89 ± 2.7 dB) than lateral regions (7.99 ± 3.6 dB, p < 0.01 ), while it was significantly lower in basal than apical segments (7.87 ± 3.0 vs. 9.13 ± 2.74, p < 0.01).
By using the software's capability to perform an off-line ECG triggering, we did separate analysis from end-systolic and end-diastolic images (Figure 3). Significantly higher P-values were obtained when end-diastolic frames were analysed compared to end-systolic ones (0.49 ± 0.16 s-1
and 0.35 ± 0.13 s-1 respectively, p < 0.001 ). The P-values from all-frames analysis were lying between (0.43 ± 0.17 s-1 ), significantly different from both end-systolic and end-diastolic values (p = 0.002 and p = 0.001, respectively). Approximately the same level of differences was found between cardiac phases for A-values.
There were no significant differences in mean end-systolic P between four-chamber, two-chamber and long-axis views (0.34 ± 0.12 vs 0.35 ± 0.15 vs. 0.36 ± 0.14 s-1, respectively) nor between healthy volunteers and patients (0.36 ± 0.14 vs. 0.35 ± 0.13 s-1).
Page 4 of 9 (page number not for citation purposes)

Cardiovascular Ultrasound 2005, 3: 16 http://www .card iovascularultrasound .com/contenU3/1 /16
Steady-state First cycle post-tlash Jrd cycle post-tlash New steady-state
A
B
c
Figure 2
..;- y
•
f..P .~
.
' .' v
••• --··· ~ .· -
-:. v ...
_:-1~
• v ..• ~ :~: . ....... _ ... ,
: ~ ;,. : -! • . . .
. -~. ~ - .
: v
-I--tt... . ~~-, .... -"' .. .- ~ .. ~ ·-. 7· ..
. , ,. ·" ...... ,... .. .
• v
•
·.ijit,,
. ,
· - ·~:
•'~ . .... i::., • ~ ... ,_ ·. •· . , . .. . ....
'- = .. -.. ___ ··~ ':: ~ .. Some selected end-systolic images from destruction-replenishment sequences. A. 4-chamber view, B. 2-chamber view, C. Apical long-axis view.
Hemodynamic and safety parameters There were no significant changes in the study subjects' blood pressure, heart rate or rythm during performance of the MCE examinations. Each subject received a total dose of9.5 ml ofSonoVue•, and none of them experienced any adverse effect in the observation period, nor were any observed.
Discussion Despite recent advances in contrast-specific imaging, our study demonstrates some of the difficulties with and the still limited ability of low-power real-time MCE for quantitative assessment of regional myocardial perfusion. The contrast detection was better in the segments with good precontrast myocardial image quality, the lateral and anterior walls being the poorest with frequent dropouts. The MCE imaging problems were reduced, but not eliminated by adjustment of infusion rates and by carefully repositioning the wall of interest more centrally in the scan sector. Nevertheless, two thirds of segments were fea-
sible for quantitative analysis, and by assigning segments to the coronary territories, the LAD and RCA areas could potentially be evaluated. On the other hand, limited co ntrast detection made assessment of the LCx area difficult in more than half of the subjects.
Our study was not designed to test specific machine settings or examination variables. Nevertheless, we observed decreas ing A values moving distally and laterally in the scan sector. ~ was similarly found to be lower in lateral than more axial parts, but in opposite to A it significantly increased at greater depths of the sector. This is in accordance with results from in vitro flow phantom and animal models [14,16], but has previously not been reported in human studies.
The exact mechanism for this spatial variability is uncertain. Variations in beam elevation and non-uniformity of the sound field are probably contributing factors [6,24,25 ]. With a phased array transducer, the acoustic
Page 5 of 9 (page number not for citation purposes)


Effects of Ultrasound Contrast During Tissue Velocity Imaging on Regional Left Ventricular
Velocity, Strain, and Strain Rate Measurements
Siri Maim, MD, Sigmund Frigstad, MSc, Asbjorn Stoylcn, MD, PhD, Hans Torp, Dr Tech, Einar Sagberg, and Terje Skjarpe, MD, PhD, Trondheim, Norway
Background: Strain (e) rate (SR) imaging and left ventricular (LV) opacification with intravenous (IV) contrast both potentially decrease operator dependency in interpretation of stress echocardiography. The aim of this study was to evaluate whether contrast present during tissue velocity imaging (TVI) significantly affected measurements of velocity, e, and SR. Secondly, we sought to evaluate whether increased scan line density improved feasibility of simultaneous TVI and contrast echocardiography. Methods: The 4-chamber LV view in 15 healthy volunteers and 25 patients was acquired at rest before and after IV injections of contrast using: (1) conventional TVI; (2) LV opacification with standard TVI added; and (3) modified LV opacification with doubled TVI line density. Velocity, SR, and e curves, along with peak systolic velocity, peak systolic SR, and end-systolic e, were assessed from midwall segments. Results: IV contrast significantly reduced feasibility of TVI with standard settings, giving noisy data for
Strain (e) and e rate (SR) imaging (SRI) are novel tools for quantification of regional myocardial function, based on tissue velocity imaging (TVl).1-9 e and SR are, contrary to regional tissue velocities, shown to be relatively independent of tethering by adjacent segments and cardiac translation.4-9 Dobutamine stress echocardiography (DSE) is an established clin-
From the Department of Circulation and Medical Imaging, Norwegian University of Science and Technology, Trondheim, Norway (S.M., A.S., T.S.); and GE Vingmed Ultrasound (S.F.).
Supported in part by a research fCllowship grant from the Norwegian Council for Cardiovascular Diseases. GE Vingmed Ultrasound (Norway) provided the research ultrasound machine and software.
Reprint requests: Siri Maim, MD, Department of Circulation and Medical Imaging, Norwegian University of Science and Technology, Medisinsk teknisk forskningssenter, 4 etg, nord, N-7489 Troncll1eim, Norway (E-mail: [email protected]).
0894-7317/$32.00
Copyright 2006 by the American Society of Echocardiography.
doi: 10.1 016/j.echo.2005 .07. 017
40
SR and e, particularly in the septum. Absolute values of peak systolic SR and end-systolic e from adequately shaped curves were significantly higher with contrast compared with baseline. However, increased TVI line density significantly improved feasibility of velocity traces with contrast and decreased the level of noise in SR and e. Furthermore, higher line density improved agreement between peak systolic velocity, peak systolic SR, and endsystolic e measured with contrast, and corresponding precontrast values from the conventional TVI setting. Conclusions: SR imaging was not feasible performed with IV contrast during conventional TVI settings, and we do not recommend the clinical use of this combination. Increased TVI line density made velocity curves with contrast feasible and resulted in less noisy SR and e curves, but variability in SR and e measurements with contrast is still too high for clinical use. (JAm Soc Echocardiogr 2006;19: 40-47.)
ical method for diagnosis of coronary artery disease based on visual detection of regional contractile dysfunction. However, DSE has been found to be highly dependent on observer experience with a considerable interobserver variability10·11
; although better with second harmonic imaging, 12 reproducibility still remains an issue. SRl applied in DSE can potentially be a less operator-dependent supplement for interpretation of regional myocardial function.13,14
Visual segmental wall-motion analysis in DSE requires adequate delineation of left ventricular (LV) endocardial borders. At peak stress, poor endocardial definition is a frequent problem in patients with suboptimal image quality. LV opacification (L VO) by intravenous contrast improves endocardial visualization and wall-motion analysis, even at peak stress, improving the accuracy and reproducibility of DSE. 15
-19 The possibility
of combining SRl and DSE and their benefits has been raised as an issue. To our knowledge

Journal of the American Society ofEchocardiography Volume 19 Number 1
there are to date no clinical data addressing this matter.
Sporadic tests with SRI during and after contrast injections in our laboratory indicated that SR signals are disturbed by the presence of contrast in the LV cavity or myocardium. To obtain the high frame rate (FR) normally used in TVI (>90 frames/s [FPS]), the number of scan lines is sparse, typically 16 beams for a sector angle encompassing the entire LV. We hypothesized that because of the relatively low number of scan lines and the ftlter settings used for TVI acquisition, strong velocity signals from bubbles in the LV cavity are picked up and interfere with the tissue motion signals and consequently the SR in the myocardium. The purpose of this study was, therefore, to assess the effects of contrast present in LV cavities and myocardium during TVI recording, on the measurements of tissue velocities, regional E,
and SR. Secondly, we sought to evaluate whether increased scan liue density could improve the feasibility of simultaneous tissue Doppler and contrast echocardiography.
METHODS
Study Participants
In all, 15 healthy volunteers and 25 consecutive, clinically stable patients scheduled for echocardiography on cliuical grounds were studied. No screening for echocardiographic image quality was performed. Exclusion criteria were pregnancy or lactation, known allergy to blood products or the contrast agent, significant valve diseases or shunts, severe pulmonary hypertension, uncontrolled systemic hypertension, and severe extracardiac disease. All participants gave written informed consent. The study conformed to the declaration of Helsinki, and the protocol was approved by the regional committee of medical ethics. The participant characteristics are given in Table 1.
Data Acquisition
Echocardiographic studies were performed with Vivid 7 (SW Version 3.1.3, GE Vingmed Ultrasound, Horten, Norway) and a M3S matrix-array transducer. The patients were examined in the left lateral recumbent position. A second-generation contrast agent, Optison (GE Healthcare, Oslo, Norway), was administered by a trained nurse through a 20-G vial in a large forearm vein as repeated slow boluses, with an initial dose of 0.5 mL. The injection was followed by slow flushing with 0.9% saliue in an infusion liue at a speed adjusted to optimize cavity opacification and avoid far-field attenuation. The contrast recordings were started when optimal LVO was achieved, in average half a minute after the
Maim eta! 41
Table 1 Sn1dy participant characteristics (n = 40)
Age, y Male Height, em Body weight, kg Previous myocardial infarction Dilated cardiomypathy LV dilatation LV hypertrophy Regional LV dyssynergy Ejection fraction
LV, left ventricle.
Healthy volunteers (n = 15)
32 ± 11 9
174 ± 7 74 ± 7
63 ± 5
Values are mean± SD, or number of patients.
Patients (n = 25)
59± 10 19
178 ± 11 85 ± 10
17 3 5 9 15
54± 11
initial injection. Repeated injections of 0.2 to 0.3 mL were given to maintain adequate and comparable L VO during recording in all applications.
Three consecutive cardiac cycles in tlie apical 4-chamber view were acquired before and after contrast injection in the following 3 color TVI settings: (1) cardiac application with conventional tissue harmonic imaging witli TVI FR of 140 to 170 FPS and mechanical index of 1.2; (2) LV contrast application with image setting as during conventional LVO with TVI of 90 to 100 FPS added; and (3) high liue density (HLD) LVO application with TVI of 100 to 110 FPS. In the latter, the TVI mode of the LV contrast application was modified by doubling the number of TVI scan liues (typically from 16-32 in a full sector), maintaining the FR by reducing the underlying number of B-mode scan liues correspondingly (80-71). Except from the increased number of scan liues, the HLD L VO had identical settings to the conventional LV contrast application. Both LV contrast and HLD L VO were operated at a mechanical index of 0.22 to 0.31. The HLD LVO application is at present commercially available on the scanner used.
The cineloops were obtained in raw data format and digitally stored for offline analysis.
Data Analysis
Analysis of TVI data was performed using the software Echopac PC (GE Vingmed Ultrasound). Cineloops were analyzed in a random sequence so that the different applications from the same study participant were not judged simultaneously. Traces of velocity, SR, and E were derived from manually placed, fixed region of interest (ROI) in midseptum and midlateral wall.
To reduce random noise in SRI, one normally would increase both ROI and offset length (distance for calculating longitudinal velocity). However, increased spatial averaging gives increased risk of incorporating regional artefacts and noise. To avoid

42 Malmetal Journal of the American Society of Echocardiography
Jan nary 2006
A
B
c
D
Velocity (cm/s)
Nr\ :
} @
I
Zl,OO ,~····~· ········~············- ·······~··~~-····~ ...... ,
1();001' L 0,00 ,.,jl '"··~ ... '''q
40.oo]N .ZJ,OO ·~
11),00
1~.00
0,00
40,00
.:11),00
-15,00
·10,00 ·'·
Strain rate (1/s) :I ... """~\
... Strain(%)
""'~~-. ' ,..., \ p4' /~ '
·>~• \([1 r .. /-'/ ; -r\.. ~· I A
·1M / ~.,/ .,.,., ' ~'ll~l ~ ./
.~l ..... . ·>l'.O
:hfrl ~~ :!···· ........... ~-·· I
>6,00 l --· .. ,, ~· ~ .• ~. Ml., I ·.: ····-··-··/'~--~--···"
4~00] . 41.0 ·Z.OO [ 4Mj
2.00
--= ~- ' ""'O'''W<; ~1 ~{1:
.. ~
(\A!\ N ~ J. V t,:::FJ j/'ijv•"-J!
/"'"""' ; J ·'
-<n\0
400.0
'*10.0
~· 5,0
•$,0
·10,0
4~,0
-~o.o
•U,O .L. . .............. ...!
Figure l Myocardial velocity, strain (E) rate (SR), and E curves from one study participant. A, Cardiac baseline. B, Cardiac with contrast. C, Left ventricular (LV) contrast with contrast. D, High line density (HLD) LV opacification (LVO) with contrast. There was little difference between baseline registrations in 3 applications, therefore, baseline LV contrast and HLD LVO are not shown. Notice that vertical (y·axis) scaling is not equal in all plots of same parameter. Because of high velocities and aliasing picked up from both cavities during conventional tissue velocity imaging settings (cardiac and LV contrast), septal curves are very noisy with implausibly high absolute peak systolic velocity, peak systolic SR, and end-systolic E
values. With higher line density corresponding traces with contrast were similar to cardiac baseline. Black t1·ace, midsepmm;gray t1·ace, midlateral wall.
this, the size ofROI was, therefore, set to 3 X 3 mm, and offset was reduced from 12 mm (default TVI setting) to 6 mm. On the other hand, maximal temporal smoothing (gaussian 80 milliseconds) was applied. These settings were applied during postprocessing of both precontrast and contrast data.
Feasibility of obtaining velocity, SR, and e curves in the different settings was evaluated, determined by the ability to measure a given waveform by its conformity to an expected shape (Figure 1, top panel). Segments with visible aliasing in the velocity curves and implausibly high peak values were ex-
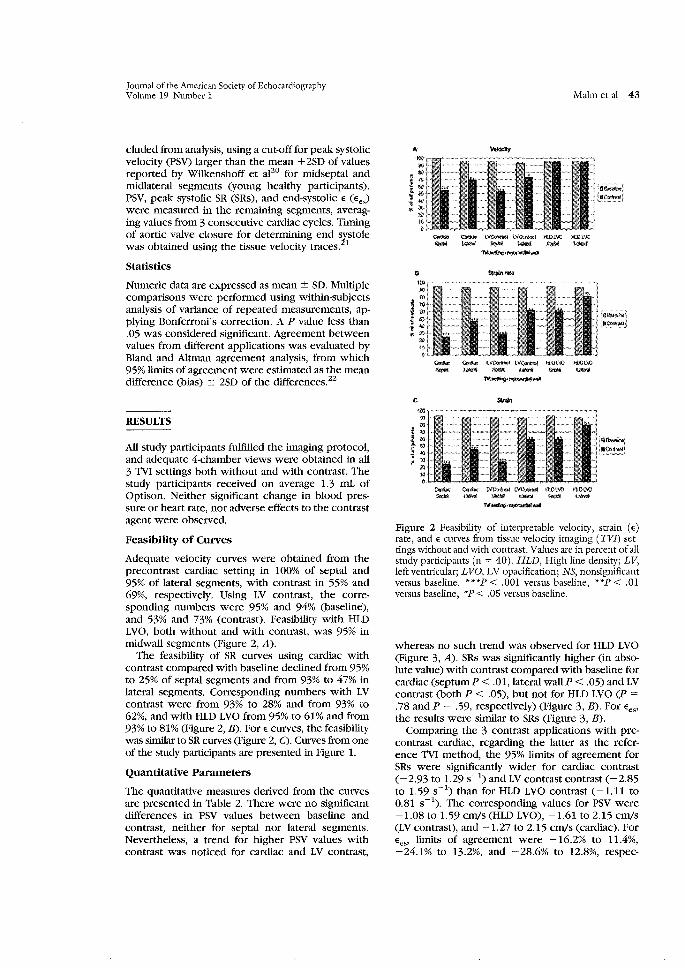
Journal of the American Society ofEchocardiography Volume 19 Number l
eluded from analysis, using a cut-off for peak systolic velocity (PSV) larger than the mean + 2SD of values reported by Wilkenshoff et af0 for midseptal and midlateral segments (young healthy participants). PSV, peak systolic SR (SRs), and end-systolic E (Ee,) were measured in the remaining segments, averaging values from 3 consecutive cardiac cycles. Timing of aortic valve closure for determining end s:t;stole was obtained using the tissue velocity traces. 1
Statistics
Numeric data are expressed as mean± SD. Multiple comparisons were performed using within-subjects analysis of variance of repeated measurements, applying Bonferroni's correction. A P value less than .05 was considered significant. Agreement between values from different applications was evaluated by Bland and Altman agreement analysis, from which 95% limits of agreement were estimated as the mean difference (bias) ± 2SD of the differences.Z2
RESULTS
All study participants fulfilled the imaging protocol, and adequate 4-chamber views were obtained in all 3 TVl settings both without and with contrast. The study participants received on average 1.3 mL of Optison. Neither significant change in blood pressure or heart rate, nor adverse effects to the contrast agent were observed.
Feasibility of Curves
Adequate velocity curves were obtained from the precontrast cardiac setting in 100% of septal and 95% of lateral segments, with contrast in 55% and 69%, respectively. Using LV contrast, the corresponding numbers were 95% and 94% (baseline), and 53% and 73% (contrast). Feasibility with HLD LVO, both without and with contrast, was 95% in midwall segments (Figure 2, A).
The feasibility of SR curves using cardiac with contrast compared with baseline declined from 95% to 25% of septal segments and from 93% to 47% in lateral segments. Corresponding numbers with LV contrast were from 93% to 28% and from 93% to 62%, and with HLD LVO from 95% to 61% and from 93% to 81% (Figure 2, B). ForE curves, the feasibility was similar to SR curves (Figure 2, C). Curves from one of the study participants are presented in Figure 1.
Quantitative Parameters
The quantitative measures derived from the curves are presented in Table 2. There were no significant differences in PSV values between baseline and contrast, neither for septal nor lateral segments. Nevertheless, a trend for higher PSV values with contrast was noticed for cardiac and LV contrast,
Maim ct al 43
A 1/elodty
a
c
~ ~ tVQ)i~ tVt);t>~~~ H.DLW ll.Dl..W
-""""-""""-"""" .... _._ .... --
~ ~ !.;¥fu'#;)sl PI~ HJH.\.0 ti.Ol\G ~~~~~~
"'-·-""" -~ O;ri{ll; t.V~ L'IO'~ ft.Ol.\U H.Dl\C - ....... -""""-"""" lVI~·~itol!llil
~:;;J
·o~
:·~J
Figure 2 Feasibility of interpretable velocity, strain (E) rate, and E curves from tissue velocity imaging ( TVI) settings without and with contrast. Values are in percent of all study participants (n = 40). HLD, High line density; LV, left ventricular; L VO, LV opacification; NS, nonsignificant versus baseline. ***P < .001 versus baseline, **P < .01 versus baseline, *P < .05 versus baseline.
whereas no such trend was observed for HLD LVO (Figure 3, A). SRs was significantly higher (in absolute value) with contrast compared with baseline for cardiac (septumP < .01, lateral wallP < .05) and LV contrast (both P < .05), but not for HLD LVO (P = .78 and P = .59, respectively) (Figure 3, B). For Ees' the results were similar to SRs (Figure 3, B).
Comparing the 3 contrast applications with precontrast cardiac, regarding the latter as the reference TVl method, the 95% limits of agreement for SRs were significantly wider for cardiac contrast ( -2.93 to 1.29 s- 1
) and LV contrast contrast (-2.85 to 1.59 s- 1
) than for HLD LVO contrast (-1.11 to 0.81 s-1
). The corresponding values for PSV were -1.08 to 1.59 cm/s (HLD LVO), -1.61 to 2.15 Cm/S (LV contrast), and -1.27 to 2.15 cm/s (cardiac). For Ees> limits of agreement were -16.2% to 11.4%, -24.1% to 13.2%, and -28.6% to 12.8%, respec-

44 Malmetal Journal of the American Society ofEchocardiography
Jan nary 2006
Table 2 Peak systolic velocity, peak systolic strain rate, and end-systolic strain measurements from the different tissue velocity imaging settings
PSV, cm/s (n) SRs, s- 1 (n) £e8 ,% (n)
Baseline Contrast Baseline Contrast Baseline Contrast
Cardiac Septal 3.33 :':: 1.30 3.56 :':: 1.95 -1.15 :':: 0.58 -2.32 :':: 0.79 -14.3 :':: 6.5 -24.3 :':: 12.9
(40) (22) (38) (10) (37) (10) Lateral 3.87 :':: 0.90 4.13 :':: 1.70 -1.13 :':: 0.43 -1.70 :':: 1.14 -14.9 :':: 4.5 -24.4 :':: 11.9
(38) (27) (37) (19) (36) (18) LV contrast
Septal 3.42 :':: 1.01 3.55 :':: 1.00 -1.14 :':: 0.62 -2.11 :':: 1.38 -15.0 :':: 7.8 -19.9 :':: 10.4 (38) (21) (37) (11) (36) (11)
Lateral 3.74 :':: 0.99 4.09 :':: 1.79 -1.12 :':: 0.59 -1.65 :':: 0.67 -14.9 :':: 6.9 -18.9 :':: 6.2 (37) (29) (37) (25) (36) (24)
HLDLVO Septal 3.63 :':: 1.04 3.59 :':: 1.20 -1.10 :':: 0.45 -1.33 :':: 0.49 -16.2 :':: 6.5 -17.6 :':: 6.4
(38) (38) (38) (24) (37) (24) Lateral 4.18 :':: 1.74 4.21 :':: 1.67 -1.12 :':: 0.46 -1.24 :':: 0.52 -15.3 :':: 4.6 -17.0 :':: 5.3
(38) (38) (37) (32) (36) (32)
Ee.v end-systolic strain; HLn High line density; LVO, left ventricular opacification; PS"V; peak systolic velocity; SR.s, peak systolic strain rate. Values are mean ± lSD.
tively. This difference was more pronounced for septal than lateral segments.
The SRs (in absolute value) increased significantly more in midseptum than midlateral wall after contrast injection, using cardiac and LV contrast (P < .01) (Figure 3, B). There was no such increase in segmental difference neither for SRs in the HLD L VO application, nor for PSV or Ees in any of the 3 TV! applications performed with contrast.
DISCUSSION
Our main ftnding was that the presence of contrast significantly reduced feasibility of Doppler tissue data acquisition and influenced the quantitative measurements of velocity, SR, and E assessed from TV! recordings at rest. With the conventional settings for TV! (cardiac) and LVO with TV! added (LV contrast), contrast seemed to preclude interpretation of SR and E as a result of substantial noise and aliasing in the velocity data. However, increased line density during TV! recording improved feasibility of velocity traces and decreased the level of noise in SR and E
curves. Furthermore, the agreement between PSV, SRs, and Ees with contrast, and conventional TV! precontrast examinations was improved. Nevertheless, the variability of SR data was still too high to recommend the method for routine clinical use.
Generally SR has lower signal-to-noise ratio than velocity measures, because of spatial derivation of the velocity data sets. Indeed, with conventional TV! settings, the increase in noise with contrast was more evident in the SR and E than in the velocity curves. This occurred even after exclusion of seg-
ments with obvious aliasing in the velocity data, resulting in too high absolute values for SRs and Ees·
Effects of Intramyocardial Contrast on TVI Measurements
The volume of myocardial blood compared with tissue is relatively small (5% of total myocardial volume), and the velocity of blood inside myocardial capillaries is low (about 0.1 cm/s)23
-25 compared
with tissue velocities (:o;IO cm/s). 1•26
•27 Thus, the
intramyocardial contrast moves with virtually the same velocities as the surrounding tissue (the low flow velocities randomly either adding to, or subtracting from tissue velocities). Destruction of the microbubbles by ultrasound would be expected to result in increased random noise in the TV! Doppler signal. However, as we observed no difference in noise between the high-power cardiac and the lowpower LV contrast traces when contrast was present, it is unlikely that the observed noise with contrast was caused by intramyocardial bubble destruction. This may also indicate that the influence of intramyocardial contrast on TV! data was relatively less important than the one caused by intracavitary contrast. Indeed, some destruction of bubbles does occur even at the low acoustic pressures used for LVO, but we did not evaluate whether further lowering of mechanical index could give a significant reduction in noise.
Effects of Intracavitary Contrast on TVI Measurements
TV! is based on bypassing the high-pass wall ftlters, which in conventional blood flow Doppler are used to eliminate the low-velocity signals of myocardial

Journal of the American Society of Echocardiography Volume 19 Number l
A PSV
_4,$
I$,.: ~ 3 t i,$
1! 2
~ ·~ -:M I. 0
'"'""" """"" tV <%«tW>1 lV ~{!rl,fm1 ;tt.Dl.:VO '"'DL\'0
"'*"'' .... ~ """"" ,_~
'""""" """" a SR$
ew~ """"" ~.V~M.t.%t tv~Mt HO~VO· ti.tH.Vfj;
~¢pt.ltM ""'" "4tfM~ "'"" $.jffi!),ffi "''"'
c &!;;~
)! ·> i «11)
i "15
110
~~ ~~ tV«lf1t!'~ lVfm,rool tlOJ.VQ KOI.VO ~ ~$ G.ll¢\lffl ~$ i!.~~ ~@:
~ L,,,,~::~~'''~~:.,.,~-w<.wo•-'"''''''''''~'''~'''~''"-'""~d Figure 3 Quantitative tissue velocity imaging measurements (mean values) derived from velocity (A), strain (e) rate (B), and E curves (C). HLD, High line density; LV, left ventricular; LVO, LV opacification; NS, nonsignificant versus baseline; PSV, peak systolic velocity; SRs, peak systolic SR; E"' end-systolic e. **P< .Ol versus baseline; *P< .05 vs baseline.
walls. Secondly, lower gain amplification is used to eliminate the weaker intensity blood flow signals and remove stationary clutters, thereby enhancing signals from myocardial tissue. The high-velocity signals from blood in the cavities are actually not filtered away, but are at baseline too weak to be detected, typically 40-dB lower than the Doppler shifts obtained from tissue motion. 1
•26
•27 Conse
quently, blood signals are normally not displayed in the TVI. With no contrast present, the velocities measured in the cavity were found to be very similar to those measured in the myocardium. This may be explained by side lobes picking up signals from myocardium, dominating the low-amplitude blood signals.
However, with contrast microbubbles generating high-amplitude backscatter in the cavity, one would expect blood velocities from the cavities to start appearing in the TVI data. Indeed, we did fmd that signals from intracavitary blood increased to an
Maim et al 45
amplitude level comparable with, or even higher than, the tissue signals. By plotting blood velocities versus time in the LV cavity, aliasing was frequently observed, probably as a result of the relatively high microbubble velocities compared with the low pulse repetition frequency used to image the low myocardial velocities. Consequently, our contrast velocity traces from myocardium were likely results of averaging myocardial tissue signals and highvelocity aliased contrast signals from the nearby cavities. Even when sampling with a narrow ROI inside the myocardium, strong contrast signals from the cavity may be picked up and mixed with the tissue velocities as a result of side lobes in the cavities. In the scanner used, the lateral averaging and radial averaging were turned off by default during TVI acquisition, giving no direct averaging between scan lines or radial samples.
The fmding of more noisy data in septal than lateral segments further supported the strong influence of cavity contrast signals on the TVI data. The side-lobe effect is even more evident in septum with cavities on both sides, whereas lateral wall measurements are susceptible only to the LV cavity contrast. Using a flxed ROI on a contracting and translating myocardium further enhances the risk of picking up cavity contrast signals. Because the derivation of SR from two velocity data sets is very susceptible to any noise component, it was not unexpected that the SR curves were even more disturbed by contrast than the velocity traces.
In addition to the contrast velocity signals, noise originating from destruction of intracavitary microbubbles could be expected to contribute to the aliasing. But as previously discussed, we observed no significant differences between the high- and low-power TVI with contrast, indicating that bubble destruction did not significantly contribute to the signal noise.
In the HLD application, the receive beams are located closer to the transmit beam, and the sidelobe effect is believed to be less pronounced. This was supported by our fmding that the HLD L VO application reflected tissue velocities better than the standard cardiac and LV contrast applications when contrast was present in the cavities. With increased line density, the difference in noise level between septum and the lateral wall was still present, but less pronounced than in recordings with conventional TVI with contrast.
The inherent variability of SR measurements is large, and normally we aim to reduce random noise by spatial averaging (increased ROI and offset). With contrast, we chose to reduce the spatial averaging and increase temporal smoothing to minimize the effect of regional noise, particularly the one anticipated to origin from cavity contrast. By doing this, the variability in SR caused by nonrandom noise

46 Malmctal
might increase. We particularly do not recommend using contrast to enhance poor baseline TVI signals. The contaminating intracavitary contrast signals are expected to give a relatively stronger effect with poor image quality, because of weaker myocardial velocity signals along with aberrations and reverberations. This separates the use of contrast with TVI from the standard use of LVO, where it has been regarded as particularly beneficial when baseline quality is poor.
The only change of settings in the modified LVO application was increased line density, giving better overlap between the beams. It could be questioned if different beam widths might also give further improvements in TVI with contrast. However, because this would complicate the interpretation of the results, particularly with respect to destruction of the microbubbles, we chose to explore the effects of increased line density alone.
Limitations
The use of repeated bolus administration of contrast did not ensure a constant microbubble concentration during each individual study. On the other hand, the contrast dose and timing of recording after injections were equal for all applications, and the possible variation in contrast concentration would hardly be expected to affect the amount of cavity contrast significantly. The study was only performed in the midwall segments. The angle deviation between sampling distance in the radial direction (ROI and offset) and the myocardium is usually greater in the basal segments, resulting in even more chance of acquiring cavity signals in this location.
The ideal for comparison would be to have an independent gold standard, but for SR such a standard does not yet exist for clinical studies. Because of the low achievable FR with tagged magnetic resonance imaging, this can only be regarded as a reference standard for e measurements,28 not for velocity or SR. Sonomicrometry, with ultrasonic crystals implanted in the myocardium, is the only independent reference standard for SR measurements, but this is applicable in animal models only?9
Conclusions
The current study indicated that SRI was not feasible when performed with intravenous contrast during TVI with conventional settings, and we do not recommend the clinical use of this combination. The hyperdynamic state during DSE and poor image quality would be expected to further increase these disturbing contrast effects. Increasing the beam line density of the LV contrast TVI application made tissue velocity curves with contrast feasible with less noisy SR and e curves. But because of the increased variability of SR and E, which is already too high for
Journal of the American Society ofEchocardiography January 2006
unenhanced data, the method, even with the increased line density modification, is still not clinically applicable. Further modifications ofTVI modalities have to be made and tested with contrast in future clinical studies.
REFERENCES
1. Sutherland GR, Stewart MJ, Groundstroem KW, Moran CM, Fleming A, Guell-Peris FJ, et al. Color Doppler myocardial imaging: a new technique for assessment of myocardial function. JAm Soc Echocardiogr 1994;7:441-58.
2. Heimdal A, Stoylen A, Torp H, Skjaerpe T. Real-time strain rate imaging of the left ventricle by ultrasound. J Am Soc Echocardiogr 1998;11:1013-20.
3. Fleming D, Xia X, McDicken WN, Sutherland GR, Fenn L. Myocardial velocity gradients detected by Doppler imaging. Br J Radiol1994;799:679-88.
4. Sutherland G, Di Salvo G, Claus P, D'Hooge J, Bijnens B. Strain and strain rate imaging: a new clinical approach to quantifying regional myocardial function. J Am Soc Echocardiogr 2004;17:788-802.
5. Abraham TP, Nishimura RA, Holmes DR, Belohlavek M, Seward JB. Strain rate imaging for assessment of regional myocardial function. Circulation 2002;105:1403-6.
6. Stoylen A, Heimdal A Bjornstad K, Wiseth R, Vik-Mo H, Torp H, et al. Strain rate imaging by ultrasound in the diagnosis of coronary artery disease. JAm Soc Echocardiogr 2000; 13:1053-64.
7. Stoylen A, Heimdal A, Bjornstad K, Torp H, Skjaerpe T. Strain rate imaging in the diagnosis of regional dysflmction of the left ventricle. Echocardiography 1999;16:321-9.
8. Jamal F, Kukulski T, D'hooge J, DeSchcerder I, Sutherland G. Abnormal post-systolic thickening in acutely ischemic myocardium during coronary angioplasty: a velocity, strain, and strain rate Doppler myocardial imaging study. J Am Soc Echocardiogr 1999;12:994-6.
9. Kowalski M, Kukulski T, Jamal F, D'Hoogc J, Weidemann F, Radem F, et al. Can natural strain and strain rate quantify regional myocardial deformation? A study in healthy subjects. Ultrasound Med Bio\2001;27:1087-97.
10. Picano E, Lattanzi F, Orlandini A, Marini C, L'Abbate A. Stress echocardiography and the human factor: the importance of being expert. JAm Col! Cardio\1991;17:66-9.
11. Hoffmann R, Lethen H, Marwick T, Arnese M, Fioretti P, Pingitore A, et al. Analysis ofinterinstitutional observer agreement in interpretation of dobutamine stress echocardiograms. JAm Call Cardia! 1996;27:330-6.
12. Hoffman R, Marwick TH, Poldermans D, Lethen H, Ciani R, van der Meer P, et al. Refinements in stress echocardiographic techniques improves interinstitutional agreement in interpretation of dobutamine stress echocardiograms. Eur Heart J 2002;23:821-9.
13. Voigt JU, NixdorffU, Bogdan R, Exner B, Schmiedehausen K, Platsch G, et al. Comparison of deformation imaging and velocity imaging for detecting regional inducible ischemia during dobutamine stress cchocardiography. Eur Heart J 2004;25:1517-25.
14. Voight JU, Exner B, Schmiedhausen K, Huehzermeyer C, Reulbach U, Nixdorff U, et al. Strain-rate imaging during dobutamine stress echocardiography provides objective evi .. dence of inducible ischemia. Circulation 2003;107:2120-6.

Journal of the American Society of Echocardiography Volume 19 Number 1
15. Vlassak I, Rubin DN, Odabashian JA, Garcia MJ, King LM, Lin SS, et al. Contrast and harmonic imaging improves accuracy and efficiency of novice readers for dobutamine stress echocardiography. Echocardiography 2002;19:483-8.
16. Ikonomidis I, Holmes E, Narbuvold H, et al. Assessment of left ventricular wall motion and delineation of the endocardial border after intravenous injection of Infoson during dobutamine stress echocardiography. Coron Artery Dis 1998;9: 567-76.
17. Malhotra V, Nwogu J, Bondmass MD, Bean M, Bieniartz T, Tcrtcll M, et al. Is the technically limited echocardiographic study an endangered species? Endocardial border definition with native tissue harmonic imaging and Optison contrast: a review of 200 cases. J Am Soc Echocardiogr 2000;13:771-3.
18. Rainbird AJ, Mulvagh SL, Oh JK, McCully RB, Klarich KW, Shub C, ct al. Contrast dobutamine stress echocardiography: clinical practice assessment in 300 consecutive patients. J Am Soc Echocardiogr 2001;14:378-85.
19. Dolan MS, Riad K, El-Shafei A, Puri S, Tamirisa K, Bierig M, et al. Effect of intravenous contrast for left ventricular opacification and border definition on sensitivity and specificity of dobutamine stress cchocardiography compared with coronary angiography in technically difficult patients. Am Heart J 200 1; 142:908-15.
20. Wilkenshoff UM, Sovany A, Wigstr0m L, Olstad B, Lindstr0m L, Engvall J, et al. Regional mean systolic myocardial velocity estimation by real-time color Doppler myocardial imaging: a new technique for quantifYing regional systolic function. JAm Soc Echocardiogr 1998;11:683-92.
Maim ct a! 47
21. St0ylcn A, Maim S, Aase SA, Sag berg E. Aortic closure can be timed by tissue Doppler [abstract]. Eur J Echocardiogr 2004; 5:S159.
22. Bland JM, Altman DG. Statistical methods for assessing agreement between two methods of clinical measurements. Lancet 1986;1:307-10.
23. Wei K, Kaul S. The coronary microcirculation in health and disease. Cardia! Clin 2004;22:221-31.
24. Kaul S, Ito H. Microvasculature in acute myocardial ischemia, part I: evolving concepts in pathophysiology, diagnosis and treatment. Circulation 2004;109:146-9.
25. Kaul S, Ito H. Microvasculature in acute myocardial ischemia, part II: evolving concepts in pathophysiology, diagnosis and treatment. Circulation 2004;109:310-5.
26. Sengupta PP, Mohan JC, Pandian NG. Tissue Doppler echocardiography: principles and applications. Indian Heart J 2002;54:368-78.
27. Lange A, Palka P, Caso P, Fenn LN, Olszewski R, Ramo MP, et al. Doppler myocardial imaging vs B-mode gray-scale imaging: a comparative in vitro and in vivo study into their relative efficacy in endocardial boundary detection. Ultrasound Mcd Biol 1997;23:69-75.
28. Edvardsen T, Gerber BL, Garot J, Bluemke DA, Lima JAC, Smiseth OA. Quantitative assessment of intrinsic regional myocardial deformation by Doppler strain rate cchocardiography in humans: validation against three-dimensional tagged magnetic resonance imaging. Circulation 2002;106:50.
29. Urheim S, Edvardsen T, Torp H, Angelsen B, Smiseth OA. Myocardial strain by Doppler echocardiography: validation of a new method to quantifY regional myocardial function. Circulation 2000;102:1158-64.
Access to Journal of the American Society of Echocardiography Online is now reserved for print subscribers!
Full-text access to Journal of the American Society of Echocardiography Online is available for all print subscribers. To activate your individual online subscription, please visit Journal of the American Society of Echocardiography Online, point your browser to http://www.mosby.com/eclw, follow the prompts to activate your online access, and follow the instructions. To activate your account, you will need your subscriber account number, which you can find on your mailing label (note: the number of digits in your subscriber account number varies from 6 to 10). See the example below in which the subscriber account number has been circled:
This is your subscription account number
Sample mailing label
**************************3-DIGITOOJ SJ P1
FEBOO J027 C: f~ U 05/00 Q: 1 J.H.DOE,MD 531 MAIN ST CENTER CITY, NY 10001-001
Personal subscriptions to Journal of the American Society of Echocardiography Online are for individual use only and may not be transferred. Use of Joumal of the American Society of Echocardiography Online is subject to agreement to the terms and conditions as indicated online.


Dissertations at the Faculty of Medicine, NTNU
1977 I. Knut Joachim Berg: EFFECT OF ACETYLSALICYLIC ACID ON RENAL FUNCTION 2. Karl Erik Viken and Arne 0degaard: STUDIES ON HUMAN MONOCYTES CULTURED IN
VITRO 1978 3. Karel Bj9lrn Cyvin: CONGENITAL DISLOCATION OF THE HIP JOINT. 4. Alf 0. Brubakk: METHODS FOR STUDYING FLOW DYNAMICS IN THE LEFT VENTRICLE
AND THE AORTA IN MAN. 1979 5. Geirmund Unsgaard: CYTOSTATIC AND IMMUNOREGULATORY ABILITIES OF HUMAN
BLOOD MONOCYTES CULTURED IN VITRO 1980 6. St9lrker J9lrstad: URAEMIC TOXINS 7. Arne Olav Jenssen: SOME RHEOLOGICAL, CHEMICAL AND STRUCTURAL PROPERTIES
OF MUCOID SPUTUM FROM PATIENTS WITH CHRONIC OBSTRUCTIVE BRONCHITIS 1981 8. Jens Hammerstr9)m: CYTOSTATIC AND CYTOLYTIC ACTIVITY OF HUMAN MONOCYTES
AND EFFUSION MACROPHAGES AGAINST TUMOR CELLS IN VITRO 1983 9. Tore Syversen: EFFECTS OF METHYLMERCURY ON RAT BRAIN PROTEIN. 10. Torbj9lrn Iversen: SQUAMOUS CELL CARCINOMA OF THE VULVA. 1984 II. Tor-Erik Wider9)e: ASPECTS OF CONTINUOUS AMBULATORY PERITONEAL DIALYSIS. 12. Anton Hole: ALTERATIONS OF MONOCYTE AND LYMPHOCYTE FUNCTIONS IN
REALTION TO SURGERY UNDER EPIDURAL OR GENERAL ANAESTHESIA. 13. Terje Terjesen: FRACTURE HEALING AN STRESS-PROTECTION AFTER METAL PLATE
FIXATION AND EXTERNAL FIXATION. 14. Carsten Saunte: CLUSTER HEADACHE SYNDROME. 15. Inggard Lereim: TRAFFIC ACCIDENTS AND THEIR CONSEQUENCES. 16. Bj9lrn Magne Eggen: STUDIES IN CYTOTOXICITY IN HUMAN ADHERENT
MONONUCLEAR BLOOD CELLS. 17. Trond Haug: FACTORS REGULATING BEHAVIORAL EFFECTS OG DRUGS. 1985 18. Sven Erik Gisvold: RESUSCITATION AFTER COMPLETE GLOBAL BRAIN ISCHEMIA. 19. Terje Espevik: THE CYTOSKELETON OF HUMAN MONOCYTES. 20. Lars Bevanger: STUDIES OF THE Ibc (c) PROTEIN ANTIGENS OF GROUP B
STREPTOCOCCI. 21. Ole-Jan Iversen: RETROVIRUS-LIKE PARTICLES IN THE PATHOGENESIS OF PSORIASIS. 22. Lasse Eriksen: EVALUATION AND TREATMENT OF ALCOHOL DEPENDENT BEHAVIOUR. 23. Per I. Lundmo: ANDROGEN METABOLISM IN THE PROSTATE. 1986 24. Dagfinn Berntzen: ANALYSIS AND MANAGEMENT OF EXPERIMENTAL AND CLINICAL
PAIN. 25. Odd Arnold Kildahl-Andersen: PRODUCTION AND CHARACTERIZATION OF MONOCYTE-
DERIVED CYTOTOXIN AND ITS ROLE IN MONOCYTE-MEDIATED CYTOTOXICITY. 26. Ola Dale: VOLATILE ANAESTHETICS. 1987 27. Per Martin Kleveland: STUDIES ON GASTRIN. 28. Audun N. 0ksendal: THE CALCIUM PARADOX AND THE HEART. 29. Vilhjalmur R. Finsen: HIP FRACTURES 1988 30. Rigmor Austgulen: TUMOR NECROSIS FACTOR: A MONOCYTE-DERIVED REGULATOR OF
CELLULAR GROWTH. 31. Tom-Harald Edna: HEAD INJURIES ADMITTED TO HOSPITAL. 32. Joseph D. Borsi: NEW ASPECTS OF THE CLINICAL PHARMACOKINETICS OF
METHOTREXATE.

33. Olav F. M. Sellevold: GLUCOCORTICOIDS IN MYOCARDIAL PROTECTION. 34. Terje Skjrerpe: NONINVASIVE QUANTITATION OF GLOBAL PARAMETERS ON LEFT
VENTRICULAR FUNCTION: THE SYSTOLIC PULMONARY ARTERY PRESSURE AND CARDIAC OUTPUT.
35. Eyvind Rodahl: STUDIES OF IMMUNE COMPLEXES AND RETROVIRUS-LIKE ANTIGENS IN PATIENTS WITH ANKYLOSING SPONDYLITIS.
36. Ketil Thorstensen: STUDIES ON THE MECHANISMS OF CELLULAR UPTAKE OF IRON FROM TRANSFERRIN.
37. Anna Midelfart: STUDIES OF THE MECHANISMS OF ION AND FLUID TRANSPORT IN THE BOVINE CORNEA.
38. Eirik Helseth: GROWTH AND PLASMINOGEN ACTIVATOR ACTIVITY OF HUMAN GLIOMAS AND BRAIN METASTASES- WITH SPECIAL REFERENCE TO TRANSFORMING GROWTH FACTOR BETA AND THE EPIDERMAL GROWTH FACTOR RECEPTOR.
39. Petter C. Borchgrevink: MAGNESIUM AND THE ISCHEMIC HEART. 40. Kjell-Arne Rein: THE EFFECT OF EXTRACORPOREAL CIRCULATION ON
SUBCUTANEOUS TRANSCAPILLARY FLUID BALANCE. 41. Arne Kristian Sandvik: RAT GASTRIC HISTAMINE. 42. Carl Bredo Dahl: ANIMAL MODELS IN PSYCHIATRY. 1989 43. Torbjorn A. Fredriksen: CERVICOGENIC HEADACHE. 44. Rolf A. Walstad: CEFTAZIDIME. 45. Rolf Salvesen: THE PUPIL IN CLUSTER HEADACHE. 46. Nils Petter Jorgensen: DRUG EXPOSURE IN EARLY PREGNANCY. 47. Johan C. Rreder: PREMEDICATION AND GENERAL ANAESTHESIA IN OUTPATIENT
GYNECOLOGICAL SURGERY. 48. M. R. Shalaby: IMMUNOREGULATORY PROPERTIES OF TNF-a AND THE RELATED
CYTOKINES. 49. Anders Waage: THE COMPLEX PATTERN OF CYTOKINES IN SEPTIC SHOCK. 50. Bjarne Christian Eriksen: ELECTROSTIMULATION OF THE PEL VIC FLOOR IN FEMALE
URINARY INCONTINENCE. 51. Tore B. Halvorsen: PROGNOSTIC FACTORS IN COLORECTAL CANCER. 1990 52. Asbjorn Nordby: CELLULAR TOXICITY OF ROENTGEN CONTRAST MEDIA. 53. Kare E. Tvedt: X-RAY MICROANALYSIS OF BIOLOGICAL MATERIAL. 54. Tore C. Stiles: COGNITIVE VULNERABILITY FACTORS IN THE DEVELOPMENT AND
MAINTENANCE OF DEPRESSION. 55. Eva Hofsli: TUMOR NECROSIS FACTOR AND MULTIDRUG RESISTANCE. 56. Helge S. Haarstad: TROPHIC EFFECTS OF CHOLECYSTOKININ AND SECRETIN ON THE
RAT PANCREAS. 57. Lars Engebretsen: TREATMENT OF ACUTE ANTERIOR CRUCIATE LIGAMENT INJURIES. 58. Tarjei Rygnestad: DELIBERATE SELF-POISONING IN TRONDHEIM. 59. Arne Z. Henriksen: STUDIES ON CONSERVED ANTIGENIC DOMAINS ON MAJOR OUTER
MEMBRANE PROTEINS FROM ENTEROBACTERIA. 60. Steinar Westin: UNEMPLOYMENT AND HEALTH: Medical and social consequences of a factory
closure in a ten-year controlled follow-up study. 61. Ylva Sahlin: INJURY REGISTRATION, a tool for accident preventive work. 62. Helge Bjornstad Pettersen: BIOSYNTHESIS OF COMPLEMENT BY HUMAN ALVEOLAR
MACROPHAGES WITH SPECIAL REFERENCE TO SARCOIDOSIS. 63. Berit Schei: TRAPPED IN PAINFUL LOVE. 64. Lars J. Vatten: PROSPECTIVE STUDIES OF THE RISK OF BREAST CANCER IN A COHORT
OF NORWEGIAN WOMAN. 1991 65. Kare Bergh: APPLICATIONS OF ANTI-C5a SPECIFIC MONOCLONAL ANTIBODIES FOR
THE ASSESSMENT OF COMPLEMENT ACTIVATION. 66. Svein Svenningsen: THE CLINICAL SIGNIFICANCE OF INCREASED FEMORAL
ANTEVERSION. 67. Olbjorn Klepp: NONSEMINOMATOUS GERM CELL TESTIS CANCER: THERAPEUTIC
OUTCOME AND PROGNOSTIC FACTORS.

68. Trond Sand: THE EFFECTS OF CLICK POLARITY ON BRAIN STEM AUDITORY EVOKED POTENTIALS AMPLITUDE, DISPERSION, AND LATENCY VARIABLES.
69. Kjetil B. Asbakk: STUDIES OF A PROTEIN FROM PSORIATIC SCALE, PSO P27, WITH RESPECT TO ITS POTENTIAL ROLE IN IMMUNE REACTIONS IN PSORIASIS.
70. ArnulfHestnes: STUDIES ON DOWN'S SYNDROME. 71. Randi Nygaard: LONG-TERM SURVIVAL IN CHILDHOOD LEUKEMIA. 72. Bjylrn Hagen: THIO-TEPA. 73. Svein Anda: EVALUATION OF THE HIP JOINT BY COMPUTED TOMOGRAMPHY AND
ULTRASONOGRAPHY. 1992 74. Martin Svartberg: AN INVESTIGATION OF PROCESS AND OUTCOME OF SHORT-TERM
PSYCHODYNAMIC PSYCHOTHERAPY. 75. Stig Arild Sl¢rdahl: AORTIC REGURGITATION. 76. Harold C Sexton: STUDIES RELATING TO THE TREATMENT OF SYMPTOMATIC NON-
PSYCHOTIC PATIENTS. 77. Maurice B. Vincent: VASOACTIVE PEPTIDES IN THE OCULAR/FOREHEAD AREA. 78. Terje Johannessen: CONTROLLED TRIALS IN SINGLE SUBJECTS. 79. Turid Nilsen: PYROPHOSPHATE IN HEPATOCYTE IRON METABOLISM. 80. Olav Haraldseth: NMR SPECTROSCOPY OF CEREBRAL ISCHEMIA AND REPERFUSION IN
RAT. 81. Eiliv Brenna: REGULATION OF FUNCTION AND GROWTH OF THE OXYNTIC MUCOSA. 1993 82. Gunnar Bovim: CERVICOGENIC HEADACHE. 83. Jar! Arne Kahn: ASSISTED PROCREATION. 84. Bj¢rn Naume: IMMUNOREGULATORY EFFECTS OF CYTOKINES ON NK CELLS. 85. Rune Wiseth: AORTIC VALVE REPLACEMENT. 86. Jie Ming Shen: BLOOD FLOW VELOCITY AND RESPIRATORY STUDIES. 87. Piotr Kruszewski: SUNCT SYNDROME WITH SPECIAL REFERENCE TO THE AUTONOMIC
NERVOUS SYSTEM. 88. Mette Haase Moen: ENDOMETRIOSIS. 89. Anne Vik: VASCULAR GAS EMBOLISM DURING AIR INFUSION AND AFTER
DECOMPRESSION IN PIGS. 90. Lars Jacob Stovner: THE CHIARI TYPE I MALFORMATION. 91. Kjell A. Salvesen: ROUTINE ULTRASONOGRAPHY IN UTERO AND DEVELOPMENT IN
CHILDHOOD. 1994 92. Nina-Beate Liabakk: DEVELOPMENT OF IMMUNOASSA YS FOR TNF AND ITS SOLUBLE
RECEPTORS. 93. Sverre Helge Torp: erbB ONCOGENES IN HUMAN GLIOMAS AND MENINGIOMAS. 94. Olav M. Linaker: MENTAL RETARDATION AND PSYCHIATRY. Past and present. 95. Per Oscar Feet: INCREASED ANTIDEPRESSANT AND ANTIPANIC EFFECT IN COMBINED
TREATMENT WITH DIXYRAZINE AND TRICYCLIC ANTIDEPRESSANTS. 96. Stein Olav Samstad: CROSS SECTIONAL FLOW VELOCITY PROFILES FROM TWO-
DIMENSIONAL DOPPLER ULTRASOUND: Studies on early mitral blood flow. 97. Bj¢rn Backe: STUDIES IN ANTENATAL CARE. 98. Gerd Inger Ringdal: QUALITY OF LIFE IN CANCER PATIENTS. 99. Torvid Kiserud: THE DUCTUS VENOSUS IN THE HUMAN FETUS. lOO.Hans E. Fj¢sne: HORMONAL REGULATION OF PROSTATIC METABOLISM. IOI.Eylert Brodtkorb: CLINICAL ASPECTS OF EPILEPSY IN THE MENTALLY RETARDED. 102.Roar Juul: PEPTIDERGIC MECHANISMS IN HUMAN SUBARACHNOID HEMORRHAGE. 103.Unni Syversen: CHROMOGRANIN A. Phsysiological and Clinical Role. 1995 104.0dd Gunnar Brakstad: THERMOSTABLE NUCLEASE AND THE nuc GENE IN THE
DIAGNOSIS OF Staphylococcus aureus INFECTIONS. 105.Terje Engan: NUCLEAR MAGNETIC RESONANCE (NMR) SPECTROSCOPY OF PLASMA IN
MALIGNANT DISEASE. 106.Kirsten Rasmussen: VIOLENCE IN THE MENTALLY DISORDERED. 107.Finn Egil Skjeldestad: INDUCED ABORTION: Timetrends and Determinants.
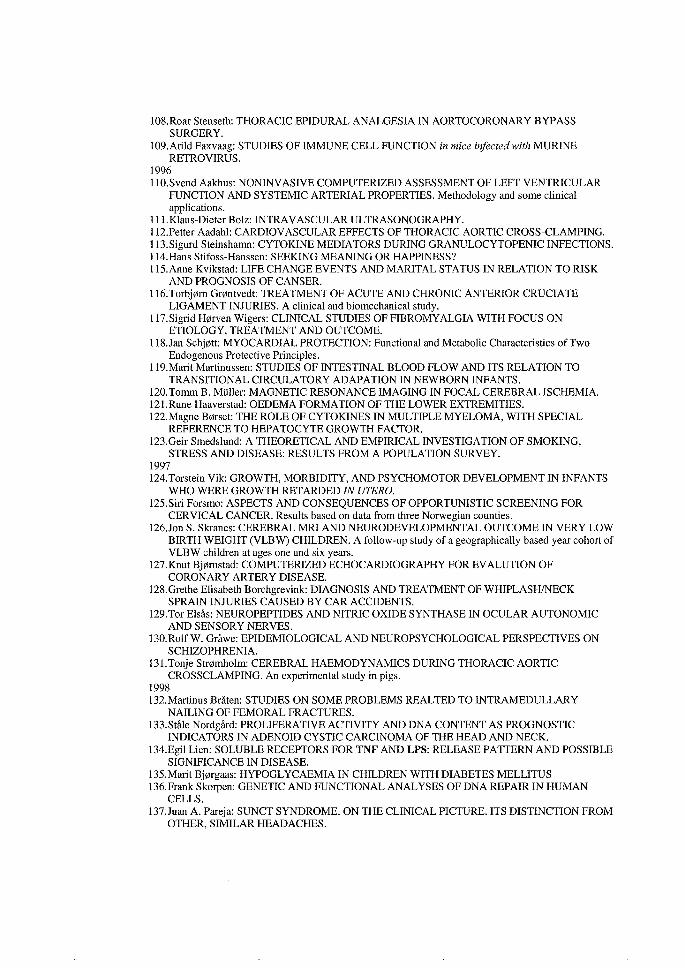
!OS. Roar Stenseth: THORACIC EPIDURAL ANALGESIA IN AORTOCORONARY BYPASS SURGERY.
109.Arild Faxvaag: STUDIES OF IMMUNE CELL FUNCTION in mice infected with MURINE RETROVIRUS.
1996 llO.Svend Aakhus: NONINVASIVE COMPUTERIZED ASSESSMENT OF LEFT VENTRICULAR
FUNCTION AND SYSTEMIC ARTERIAL PROPERTIES. Methodology and some clinical applications.
111.Klaus-Dieter Bolz: INTRA VASCULAR ULTRASONOGRAPHY. 112.Petter Aadahl: CARDIOVASCULAR EFFECTS OF THORACIC AORTIC CROSS-CLAMPING. 113.Sigurd Steinshamn: CYTOKINE MEDIATORS DURING GRANULOCYTOPENIC INFECTIONS. 114.Hans Stifoss-Hanssen: SEEKING MEANING OR HAPPINESS? 115.Anne Kvikstad: LIFE CHANGE EVENTS AND MARITAL STATUS IN RELATION TO RISK
AND PROGNOSIS OF CANSER. 116.Torbj0m Gr0ntvedt: TREATMENT OF ACUTE AND CHRONIC ANTERIOR CRUCIATE
LIGAMENT INJURIES. A clinical and biomechanical study. 117 .Sigrid H0rven Wigers: CLINICAL STUDIES OF FIBROMY ALGIA WITH FOCUS ON
ETIOLOGY, TREATMENT AND OUTCOME. 118.Jan Schj0tt: MYOCARDIAL PROTECTION: Functional and Metabolic Characteristics of Two
Endogenous Protective Principles. 119.Marit Martinussen: STUDIES OF INTESTINAL BLOOD FLOW AND ITS RELATION TO
TRANSITIONAL CIRCULATORY ADAPATION IN NEWBORN INFANTS. 120. Tomm B. Miiller: MAGNETIC RESONANCE IMAGING IN FOCAL CEREBRAL ISCHEMIA. 121.Rune Haaverstad: OEDEMA FORMATION OF THE LOWER EXTREMITIES. 122.Magne B0rset: THE ROLE OF CYTOKINES IN MULTIPLE MYELOMA, WITH SPECIAL
REFERENCE TO HEPATOCYTE GROWTH FACTOR. 123.Geir Smedslund: A THEORETICAL AND EMPIRICAL INVESTIGATION OF SMOKING,
STRESS AND DISEASE: RESULTS FROM A POPULATION SURVEY. 1997 124.Torstein Vik: GROWTH, MORBIDITY, AND PSYCHOMOTOR DEVELOPMENT IN INFANTS
WHO WERE GROWTH RETARDED IN UTERO. 125.Siri Forsmo: ASPECTS AND CONSEQUENCES OF OPPORTUNISTIC SCREENING FOR
CERVICAL CANCER. Results based on data from three Norwegian counties. 126.Jon S. Skranes: CEREBRAL MRI AND NEURODEVELOPMENTAL OUTCOME IN VERY LOW
BIRTH WEIGHT (VLBW) CHILDREN. A follow-up study of a geographically based year cohort of VLBW children at ages one and six years.
127.Knut Bj0mstad: COMPUTERIZED ECHOCARDIOGRAPHY FOR EVALUTION OF CORONARY ARTERY DISEASE.
128.Grethe Elisabeth Borchgrevink: DIAGNOSIS AND TREATMENT OF WHIPLASH/NECK SPRAIN INJURIES CAUSED BY CAR ACCIDENTS.
129.Tor Elsas: NEUROPEPTIDES AND NITRIC OXIDE SYNTHASE IN OCULAR AUTONOMIC AND SENSORY NERVES.
130.RolfW. Grawe: EPIDEMIOLOGICAL AND NEUROPSYCHOLOGICAL PERSPECTIVES ON SCHIZOPHRENIA.
131.Tonje Str0mholm: CEREBRAL HAEMODYNAMICS DURING THORACIC AORTIC CROSSCLAMPING. An experimental study in pigs.
1998 132.Martinus Briiten: STUDIES ON SOME PROBLEMS REAL TED TO INTRAMEDULLARY
NAILING OF FEMORAL FRACTURES. 133.Stale Nordgiird: PROLIFERATIVE ACTIVITY AND DNA CONTENT AS PROGNOSTIC
INDICATORS IN ADENOID CYSTIC CARCINOMA OF THE HEAD AND NECK. 134.Egil Lien: SOLUBLE RECEPTORS FOR TNF AND LPS: RELEASE PATTERN AND POSSIBLE
SIGNIFICANCE IN DISEASE. 135.Marit Bj0rgaas: HYPOGL YCAEMIA IN CHILDREN WITH DIABETES MELLITUS 136.Frank Skorpen: GENETIC AND FUNCTIONAL ANALYSES OF DNA REPAIR IN HUMAN
CELLS. 137.Juan A. Pareja: SUNCT SYNDROME. ON THE CLINICAL PICTURE. ITS DISTINCTION FROM
OTHER, SIMILAR HEADACHES.

138.Anders Angelsen: NEUROENDOCRINE CELLS IN HUMAN PROSTATIC CARCINOMAS AND THE PROSTATIC COMPLEX OF RAT, GUINEA PIG, CAT AND DOG.
139.Fabio Antonaci: CHRONIC PAROXYSMAL HEMICRANIA AND HEMICRANIA CONTINUA: TWO DIFFERENT ENTITIES?
140.Sven M. Carlsen: ENDOCRINE AND METABOLIC EFFECTS OF METFORMIN WITH SPECIAL EMPHASIS ON CARDIOVASCULAR RISK FACTORES.
1999 14l.Terje A. Murberg: DEPRESSIVE SYMPTOMS AND COPING AMONG PATIENTS WITH
CONGESTIVE HEART FAILURE. 142.Harrn-Gerd Karl Blaas: THE EMBRYONIC EXAMINATION. Ultrasound studies on the
development of the human embryo. 143.Noemi Becser Andersen:THE CEPHALIC SENSORY NERVES IN UNILATERAL HEADACHES.
Anatomical background and neurophysiological evaluation. 144.Eli-Janne Fiskerstrand: LASER TREATMENT OF PORT WINE STAINS. A study of the efficacy
and limitations of the pulsed dye laser. Clinical and morfological analyses aimed at improving the therapeutic outcome.
145.Bard Kulseng: A STUDY OF ALGINATE CAPSULE PROPERTIES AND CYTOKINES IN RELATION TO INSULIN DEPENDENT DIABETES MELLITUS.
146.Terje Haug: STRUCTURE AND REGULATION OF THE HUMAN UNG GENE ENCODING URACIL-DNA GL YCOSYLASE.
147.Heidi Brurok: MANGANESE AND THE HEART. A Magic Metal with Diagnostic and Therapeutic Possibilites.
148.Agnes Kathrine Lie: DIAGNOSIS AND PREVALENCE OF HUMAN PAPILLOMA VIRUS INFECTION IN CERVICAL INTRAEPITELIAL NEOPLASIA. Relationship to Cell Cycle Regulatory Proteins and HLA DQBI Genes.
149.Ronald Marvik: PHARMACOLOGICAL, PHYSIOLOGICAL AND PATHOPHYSIOLOGICAL STUDIES ON ISOLATED STOMACS.
150.Ketil Jar! Holen: THE ROLE OF ULTRASONOGRAPHY IN THE DIAGNOSIS AND TREATMENT OF HIP DYSPLASIA IN NEWBORNS.
15l.lrene Hetlevik: THE ROLE OF CLINICAL GUIDELINES IN CARDIOVASCULAR RISK INTERVENTION IN GENERAL PRACTICE.
152.Katarina Tunon: ULTRASOUND AND PREDICTION OF GESTATIONAL AGE. 153.Johannes Soma: INTERACTION BETWEEN THE LEFT VENTRICLE AND THE SYSTEMIC
ARTERIES. 154.Arild Aamodt: DEVELOPMENT AND PRE-CLINICAL EVALUATION OF A CUSTOM-MADE
FEMORAL STEM. 155.Agnar Tegnander: DIAGNOSIS AND FOLLOW-UP OF CHILDREN WITH SUSPECTED OR
KNOWN HIP DYSPLASIA. 156.Bent Indredavik: STROKE UNIT TREATMENT: SHORT AND LONG-TERM EFFECTS 157.Jolanta Vanagaite Vingen: PHOTOPHOBIA AND PHONOPHOBIA IN PRIMARY HEADACHES 2000 158.0la Dalsegg Srether: PATHOPHYSIOLOGY DURING PROXIMAL AORTIC CROSS
CLAMPING CLINICAL AND EXPERIMENTAL STUDIES 159.xxxxxxxxx (blind number) 160.Christina Vogt Isaksen: PRENATAL ULTRASOUND AND POSTMORTEM FINDINGS- A TEN
YEAR CORRELATIVE STUDY OF FETUSES AND INFANTS WITH DEVELOPMENTAL ANOMALIES.
16l.Holger Seidel: HIGH-DOSE METHOTREXATE THERAPY IN CHILDREN WITH ACUTE LYMPHOCYTIC LEUKEMIA: DOSE, CONCENTRATION, AND EFFECT CONSIDERATIONS.
162.Stein Hallan: IMPLEMENTATION OF MODERN MEDICAL DECISION ANALYSIS INTO CLINICAL DIAGNOSIS AND TREATMENT.
163.Malcolm Sue-Chu: INVASIVE AND NON-INVASIVE STUDIES IN CROSS-COUNTRY SKIERS WITH ASTHMA-LIKE SYMPTOMS.
164.0le-Lars Brekke: EFFECTS OF ANTIOXIDANTS AND FATTY ACIDS ON TUMOR NECROSIS FACTOR-INDUCED CYTOTOXICITY.
165.Jan Lundbom: AORTOCORONARY BYPASS SURGERY: CLINICAL ASPECTS, COST CONSIDERATIONS AND WORKING ABILITY.

166.John-Anker Zwart: LUMBAR NERVE ROOT COMPRESSION, BIOCHEMICAL AND NEUROPHYSIOLOGICAL ASPECTS.
167.Geir Falck: HYPEROSMOLALITY AND THE HEART. 168.Eirik Skogvoll: CARDIAC ARREST Incidence, Intervention and Outcome. 169.Dalius Bansevicius: SHOULDER-NECK REGION IN CERTAIN HEADACHES AND CHRONIC
PAIN SYNDROMES. 170.Bettina Kinge: REFRACTIVE ERRORS AND BIOMETRIC CHANGES AMONG UNIVERSITY
STUDENTS IN NORWAY. 17l.Gunnar Qvigstad: CONSEQUENCES OF HYPERGASTRINEMIA IN MAN 172.Hanne Ellekjrer: EPIDEMIOLOGICAL STUDIES OF STROKE IN A NORWEGIAN
POPULATION. INCIDENCE, RISK FACTORS AND PROGNOSIS 173.Hilde Grimstad: VIOLENCE AGAINST WOMEN AND PREGNANCY OUTCOME. 174.Astrid Hjelde: SURFACE TENSION AND COMPLEMENT ACTIVATION: Factors influencing
bubble formation and bubble effects after decompression. 175.Kjell A. Kvistad: MR IN BREAST CANCER- A CLINICAL STUDY. 176.1var Rossvoll: ELECTIVE ORTHOPAEDIC SURGERY IN A DEFINED POPULATION. Studies
on demand, waiting time for treatment and incapacity for work. 177.Carina Seidel: PROGNOSTIC VALUE AND BIOLOGICAL EFFECTS OF HEPATOCYTE
GROWTH FACTOR AND SYNDECAN-1 IN MULTIPLE MYELOMA. 2001 178.Alexander Wahba: THE INFLUENCE OF CARDIOPULMONARY BYPASS ON PLATELET
FUNCTION AND BLOOD COAGULATION- DETERMINANTS AND CLINICAL CONSEQUENSES
179.Marcus Schmitt-Egenolf: THE RELEVANCE OF THE MAJOR hiSTOCOMPATIBILITY COMPLEX FOR THE GENETICS OF PSORIASIS
lSO.Odrun Arna Gederaas: BIOLOGICAL MECHANISMS INVOLVED IN 5-AMINOLEVULINIC ACID BASED PHOTODYNAMIC THERAPY
lSl.PiU Richard Romundstad: CANCER INCIDENCE AMONG NORWEGIAN ALUMINIUM WORKERS
182.Henrik Hjorth-Hansen: NOVEL CYTOKINES IN GROWTH CONTROL AND BONE DISEASE OF MULTIPLE MYELOMA
183.Gunnar Morken: SEASONAL VARIATION OF HUMAN MOOD AND BEHAVIOUR 184.Bjpm Olav Haugen: MEASUREMENT OF CARDIAC OUTPUT AND STUDIES OF VELOCITY
PROFILES IN AORTIC AND MITRAL FLOW USING TWO- AND THREE-DIMENSIONAL COLOUR FLOW IMAGING
185.Geir Brathen: THE CLASSIFICATION AND CLINICAL DIAGNOSIS OF ALCOHOL-RELATED SEIZURES
186.Knut Ivar Aasarpd: RENAL INVOLVEMENT IN INFLAMMATORY RHEUMATIC DISEASE. A Study of Renal Disease in Wegener's Granulomatosis and in Primary Sjogren's Syndrome
187.Trude Helen Flo: RESEPTORS INVOLVED IN CELL ACTIVATION BY DEFINED URONIC ACID POLYMERS AND BACTERIAL COMPONENTS
188.Bodil Kavli: HUMAN URACIL-DNA GLYCOSYLASES FROM THE UNG GENE: STRUCTRUAL BASIS FOR SUBSTRATE SPECIFICITY AND REPAIR
189.Liv Thommesen: MOLECULAR MECHANISMS INVOLVED IN TNF- AND GASTRINMEDIATED GENE REGULATION
190.Turid Lingaas Holmen: SMOKING AND HEALTH IN ADOLESCENCE; THE NORDTR0NDELAG HEALTH STUDY, 1995-97
191.0yvind Hjertner: MULTIPLE MYELOMA: INTERACTIONS BETWEEN MALIGNANT PLASMA CELLS AND THE BONE MICROENVIRONMENT
192.Asbj0m Stpylen: STRAIN RATE IMAGING OF THE LEFT VENTRICLE BY ULTRASOUND. FEASIBILITY, CLINICAL VALIDATION AND PHYSIOLOGICAL ASPECTS
193.Kristian Midthjell: DIABETES IN ADULTS IN NORD-TR0NDELAG. PUBLIC HEALTH ASPECTS OF DIABETES MELLITUS IN A LARGE, NON-SELECTED NORWEGIAN POPULATION.
194.Guanglin Cui: FUNCTIONAL ASPECTS OF THE ECL CELL IN RODENTS 195.Ulrik Wislpff: CARDIAC EFFECTS OF AEROBIC ENDURANCE TRAINING: HYPERTROPHY,
CONTRACTILITY AND CALCUIM HANDLING IN NORMAL AND FAILING HEART

196.0yvind Halaas: MECHANISMS OF IMMUNOMODULATION AND CELL-MEDIATED CYTOTOXICITY INDUCED BY BACTERIAL PRODUCTS
197.Tore Amundsen: PERFUSION MR IMAGING IN THE DIAGNOSIS OF PULMONARY EMBOLISM
198.Nanna Kurtze: THE SIGNIFICANCE OF ANXIETY AND DEPRESSION IN FATIQUE AND PATTERNS OF PAIN AMONG INDIVIDUALS DIAGNOSED WITH FIBROMY ALOIA: RELATIONS WITH QUALITY OF LIFE, FUNCTIONAL DISABILITY, LIFESTYLE, EMPLOYMENT STATUS, CO-MORBIDITY AND GENDER
199. Tom lvar Lund Nilsen: PROSPECTIVE STUDIES OF CANCER RISK IN NORD-TR0NDELAG: THE HUNT STUDY. Associations with anthropometric, socioeconomic, and lifestyle risk factors
200.Asta Kristine Hilberg: A NEW APPROACH TO THE STUDY OF MIDDLE CEREBRAL ARTERY OCCLUSION IN THE RAT USING MAGNETIC RESONANCE TECHNIQUES
2002 201. Knut J¢rgen Arntzen: PREGNANCY AND CYTOKINES 202.Henrik D¢11ner: INFLAMMATORY MEDIATORS IN PERINATAL INFECTIONS 203.Asta Bye: LOW FAT, LOW LACTOSE DIET USED AS PROPHYLACTIC TREATMENT OF
ACUTE INTESTINAL REACTIONS DURING PELVIC RADIOTHERAPY. A PROSPECTIVE RANDOMISED STUDY.
204.Sylvester Moyo: STUDIES ON STREPTOCOCCUS AGALACTIAE (GROUP B STREPTOCOCCUS) SURFACE-ANCHORED MARKERS WITH EMPHASIS ON STRAINS AND HUMAN SERA FROM ZIMBABWE.
205.Knut Hagen: HEAD-HUNT: THE EPIDEMIOLOGY OF HEADACHE IN NORD-TR0NDELAG 206.Li Lixin: ON THE REGULATION AND ROLE OF UNCOUPLING PROTEIN-2 IN INSULIN
PRODUCING B-CELLS 207 .Anne Hildur Henriksen: SYMPTOMS OF ALLERGY AND ASTHMA VERSUS MARKERS OF
LOWER AIRWAY INFLAMMATION AMONG ADOLESCENTS 208.Egil Andreas Fors: NON-MALIGNANT PAIN IN RELATION TO PSYCHOLOGICAL AND
ENVIRONTENTAL FACTORS. EXPERIENTAL AND CLINICAL STUDES OF PAIN WITH FOCUS ON FIBROMY ALOIA
209.Pal Klepstad: MORPHINE FOR CANCER PAIN 210.Ingunn Bakke: MECHANISMS AND CONSEQUENCES OF PEROXISOME PROLIFERATOR
INDUCED HYPERFUNCTION OF THE RAT GASTRIN PRODUCING CELL 2ll.Ingrid Susann Gribbestad: MAGNETIC RESONANCE IMAGING AND SPECTROSCOPY OF
BREAST CANCER 212.R¢nnaug Astri 0degiird: PREECLAMPSIA- MATERNAL RISK FACTORS AND FETAL
GROWTH 213.Johan Haux: STUDIES ON CYTOTOXICITY INDUCED BY HUMAN NATURAL KILLER
CELLS AND DIGITOXIN 214.Turid Suzanne Berg-Nielsen: PARENTING PRACTICES AND MENTALLY DISORDERED
ADOLESCENTS 215.Astrid Rydning: BLOOD FLOW AS A PROTECTIVE FACTOR FOR THE STOMACH MUCOSA.
AN EXPERIMENTAL STUDY ON THE ROLE OF MAST CELLS AND SENSORY AFFERENT NEURONS
2003 216.Jan Pal Loennechen: HEART FAILURE AFTER MYOCARDIAL INFARCTION. Regional
Differences, Myocyte Function, Gene Expression, and Response to Cariporide, Losartan, and Exercise Training.
217.Elisabeth Qvigstad: EFFECTS OF FATTY ACIDS AND OVER-STIMULATION ON INSULIN SECRETION IN MAN
218.Arne A.sberg: EPIDEMIOLOGICAL STUDIES IN HEREDITARY HEMOCHROMATOSIS: PREVALENCE, MORBIDITY AND BENEFIT OF SCREENING.
219.Johan Fredrik Skomsvoll: REPRODUCTIVE OUTCOME IN WOMEN WITH RHEUMATIC DISEASE. A population registry based study of the effects of inflammatory rheumatic disease and connective tissue disease on reproductive outcome in Norwegian women in 1967-1995.
220.Siv M¢rkved: URINARY INCONTINENCE DURING PREGNANCY AND AFTER DELIVERY: EFFECT OF PEL VIC FLOOR MUSCLE TRAINING IN PREVENTION AND TREATMENT
22l.Marit S. Jordh¢y: THE IMPACT OF COMPREHENSIVE PALLIATIVE CARE

222.Tom Christian Martinsen: HYPERGASTRINEMIA AND HYPOACIDITY IN RODENTSCAUSES AND CONSEQUENCES
223.Solveig Tingulstad: CENTRALIZATION OF PRIMARY SURGERY FOR OVARAIN CANCER. FEASIBILITY AND IMPACT ON SURVIVAL
224.Haytham Eloqayli: METABOLIC CHANGES IN THE BRAIN CAUSED BY EPILEPTIC SEIZURES
225.Torunn Bruland: STUDIES OF EARLY RETROVIRUS-HOST INTERACTIONS- VIRAL DETERMINANTS FOR PATHOGENESIS AND THE INFLUENCE OF SEX ON THE SUSCEPTIBILITY TO FRIEND MURINE LEUKAEMIA VIRUS INFECTION
226.Torstein Hole: DOPPLER ECHOCARDIOGRAPHIC EVALUATION OF LEFT VENTRICULAR FUNCTION IN PATIENTS WITH ACUTE MYOCARDIAL INFARCTION
227. Vibeke Nossum: THE EFFECT OF VASCULAR BUBBLES ON ENDOTHELIAL FUNCTION 228.Sigurd Fasting: ROUTINE BASED RECORDING OF ADVERSE EVENTS DURING
ANAESTHESIA- APPLICATION IN QUALITY IMPROVEMENT AND SAFETY 229.Solfrid Romundstad: EPIDEMIOLOGICAL STUDIES OF MICROALBUMINURIA. THE NORD
TR0NDELAG HEALTH STUDY 1995-97 (HUNT 2) 230.Geir Torheim: PROCESSING OF DYNAMIC DATA SETS IN MAGNETIC RESONANCE
IMAGING 23l.Catrine Ahlen: SKIN INFECTIONS IN OCCUPATIONAL SATURATION DIVERS IN THE
NORTH SEA AND THE IMPACT OF THE ENVIRONMENT 232.AmulfLanghammer: RESPIRATORY SYMPTOMS, LUNG FUNCTION AND BONE MINERAL
DENSITY IN A COMPREHENSIVE POPULATION SURVEY. THE NORD-TR0NDELAG HEALTH STUDY 1995-97. THE BRONCHIAL OBSTRUCTION IN NORD-TR0NDELAG STUDY
233.Einar Kjelsas: EATING DISORDERS AND PHYSICAL ACTIVITY IN NON-CLINICAL SAMPLES
234.Ame Wibe: RECTAL CANCER TREATMENT IN NORWAY- STANDARDISATION OF SURGERY AND QUALITY ASSURANCE
2004 235.Eivind Witsjil: BONE GRAFT AS AN ANTIBIOTIC CARRIER 236.Anne Mari Sund: DEVELOPMENT OF DEPRESSIVE SYMPTOMS IN EARLY ADOLESCENCE 237.Hallvard Lrerum: EVALUATION OF ELECTRONIC MEDICAL RECORDS- A CLINICAL
TASK PERSPECTIVE 238.Gustav Mikkelsen: ACCESSIBILITY OF INFORMATION IN ELECTRONIC PATIENT
RECORDS; AN EVALUATION OF THE ROLE OF DATA QUALITY 239.Steinar Krokstad: SOCIOECONOMIC INEQUALITIES IN HEALTH AND DISABILITY. SOCIAL
EPIDEMIOLOGY IN THE NORD-TR0NDELAG HEALTH STUDY (HUNT), NORWAY 240.Ame Kristian Myhre: NORMAL VARIATION IN ANOGENIT AL ANATOMY AND
MICROBIOLOGY IN NON-ABUSED PRESCHOOL CHILDREN 24l.Ingunn Dybedal: NEGATIVE REGULATORS OF HEMATOPOIETEC STEM AND
PROGENITOR CELLS 242.Beate Sitter: TISSUE CHARACTERIZATION BY HIGH RESOLUTION MAGIC ANGLE
SPINNING MR SPECTROSCOPY 243.Per Arne Aas: MACROMOLECULAR MAINTENANCE IN HUMAN CELLS- REPAIR OF
URACIL IN DNA AND METHYLATIONS IN DNA AND RNA 244.Anna Bofin: FINE NEEDLE ASPIRATION CYTOLOGY IN THE PRIMARY INVESTIGATION
OF BREAST TUMOURS AND IN THE DETERMINATION OF TREATMENT STRATEGIES 245.Jim A age Niilttestad: DEINSTITUTIONALIZA TION AND MENTAL HEALTH CHANGES
AMONG PEOPLE WITH MENTAL RETARDATION 246.Reidar Fossmark: GASTRIC CANCER IN JAPANESE COTTON RATS 247.Wibeke Nordh!ily: MANGANESE AND THE HEART, INTRACELLULAR MR RELAXATION
AND WATER EXCHANGE ACROSS THE CARDIAC CELL MEMBRANE 2005 248.Sturla Molden: QUANTITATIVE ANALYSES OF SINGLE UNITS RECORDED FROM THE
HIPPOCAMPUS AND ENTORHINAL CORTEX OF BEHAVING RATS 249. Wenche Brenne Dr!ilyvold: EPIDEMIOLOGICAL STUDIES ON WEIGHT CHANGE AND
HEALTH IN A LARGE POPULATION. THE NORD-TR0NDELAG HEALTH STUDY (HUNT)

250.Ragnhild St¢en: ENDOTHELIUM-DEPENDENT VASODILATION IN THE FEMORAL ARTERY OF DEVELOPING PIGLETS
25l.Aslak Steinsbekk: HOMEOPATHY IN THE PREVENTION OF UPPER RESPIRATORY TRACT INFECTIONS IN CHILDREN
252.Hill-Aina Steffenach: MEMORY IN HIPPOCAMPAL AND CORTICO-HIPPOCAMPAL CIRCUITS
253.Eystein Stordal: ASPECTS OF THE EPIDEMIOLOGY OF DEPRESSIONS BASED ON SELFRATING IN A LARGE GENERAL HEALTH STUDY (THE HUNT-2 STUDY)
254.Viggo Pettersen: FROM MUSCLES TO SINGING: THE ACTIVITY OF ACCESSORY BREATHING MUSCLES AND THORAX MOVEMENT IN CLASSICAL SINGING
255.Marianne Fyhn: SPATIAL MAPS IN THE HIPPOCAMPUS AND ENTORHINAL CORTEX 256.Robert Valderhaug: OBSESSIVE-COMPULSIVE DISORDER AMONG CHILDREN AND
ADOLESCENTS: CHARACTERISTICS AND PSYCHOLOGICAL MANAGEMENT OF PATIENTS IN OUTPATIENT PSYCHIATRIC CLINICS
257.Erik Skaaheim Haug: INFRARENAL ABDOMINAL AORTIC ANEURYSMS- COMORBIDITY AND RESULTS FOLLOWING OPEN SURGERY
258.Daniel Kondziella: GLIAL-NEURONAL INTERACTIONS IN EXPERIMENTAL BRAIN DISORDERS
259.Vegard Heimly Brun: ROUTES TO SPATIAL MEMORY IN HIPPOCAMPAL PLACE CELLS 260.Kenneth McMillan: PHYSIOLOGICAL ASSESSMENT AND TRAINING OF ENDURANCE
AND STRENGTH IN PROFESSIONAL YOUTH SOCCER PLAYERS 261.Marit Sreb¢ Indredavik: MENTAL HEALTH AND CEREBRAL MAGNETIC RESONANCE
IMAGING IN ADOLESCENTS WITH LOW BIRTH WEIGHT 262.0le Johan Kemi: ON THE CELLULAR BASIS OF AEROBIC FITNESS, INTENSITY
DEPENDENCE AND TIME-COURSE OF CARDIOMYOCYTE AND ENDOTHELIAL ADAPTATIONS TO EXERCISE TRAINING
263.Eszter Vanky: POLYCYSTIC OVARY SYNDROME- METFORMIN TREATMENT IN PREGNANCY
264.Hild Fjrertoft: EXTENDED STROKE UNIT SERVICE AND EARLY SUPPORTED DISCHARGE. SHORT AND LONG-TERM EFFECTS
265.Grete Dyb: POSTTRAUMATIC STRESS REACTIONS IN CHILDREN AND ADOLESCENTS 266.Vidar Fykse: SOMATOSTATIN AND THE STOMACH 267.Kirsti Berg: OXIDATIVE STRESS AND THE ISCHEMIC HEART: A STUDY IN PATIENTS
UNDERGOING CORONARY REVASCULARIZATION 268.Bjom lnge Gustafsson: THE SEROTONIN PRODUCING ENTEROCHROMAFFIN CELL, AND
EFFECTS OF HYPERSEROTONINEMIA ON HEART AND BONE 2006 269.Torstein BaadeR¢: EFFECTS OF BONE MORPHOGENETIC PROTEINS, HEPATOCYTE
GROWTH FACTOR AND INTERLEUKIN-21 IN MULTIPLE MYELOMA 270.May-Britt Tessem: METABOLIC EFFECTS OF ULTRAVIOLET RADIATION ON THE
ANTERIOR PART OF THE EYE 271.Anne-Sofie Helvik: COPING AND EVERYDAY LIFE IN A POPULATION OF ADULTS WITH
HEARING IMPAIRMENT 272. Therese Standal: MULTIPLE MYELOMA: THE INTERPLAY BETWEEN MALIGNANT
PLASMA CELLS AND THE BONE MARROW MICROENVIRONMENT 273.lngvild Saltvedt: TREATMENT OF ACUTELY SICK, FRAIL ELDERLY PATIENTS IN A
GERIATRIC EVALUATION AND MANAGEMENT UNIT- RESULTS FROM A PROSPECTIVE RANDO MIS ED TRIAL
274.Birger Henning Endreseth: STRATEGIES IN RECTAL CANCER TREATMENT- FOCUS ON EARLY RECTAL CANCER AND THE INFLUENCE OF AGE ON PROGNOSIS
275.Anne Mari Aukan Rokstad: ALGINATE CAPSULES AS BIOREACTORS FOR CELL THERAPY 276.Mansour Akbari: HUMAN BASE EXCISION REPAIR FOR PRESERVATION OF GENOMIC
STABILITY 277 .Stein Sundstr¢m: IMPROVING TREATMENT IN PATIENTS WITH LUNG CANCER
RESULTS FROM TWO MULITCENTRE RANDOMISED STUDIES 278.Hilde Pleym: BLEEDING AFTER CORONARY ARTERY BYPASS SURGERY- STUDIES
ON HEMOSTATIC MECHANISMS, PROPHYLACTIC DRUG TREATMENT AND EFFECTS OF AUTOTRANSFUSION

279.Line Merethe Oldervoll: PHYSICAL ACTIVITY AND EXERCISE INTERVENTIONS IN CANCER PATIENTS
280.Boye Weide: THE SIGNIFICANCE OF ENDURANCE TRAINING, RESISTANCE TRAINING AND MOTIVATIONAL STYLES IN ATHLETIC PERFORMANCE AMONG ELITE JUNIOR CROSS-COUNTRY SKIERS
281.Per Olav Vandvik: IRRITABLE BOWEL SYNDROME IN NORWAY, STUDIES OF PREY ALENCE, DIAGNOSIS AND CHARACTERISTICS IN GENERAL PRACTICE AND IN THE POPULATION
282.Idar Kirkeby-Garstad: CLINICAL PHYSIOLOGY OF EARLY MOBILIZATION AFTER CARDIAC SURGERY
283.Linn Getz: SUSTAINABLE AND RESPONSIBLE PREVENTIVE MEDICINE. CONCEPTUALISING ETHICAL DILEMMAS ARISING FROM CLINICAL IMPLEMENTATION OF ADVANCING MEDICAL TECHNOLOGY
284.Eva Tegnander: DETECTION OF CONGENITAL HEART DEFECTS IN A NON-SELECTED POPULATION OF 42,381 FETUSES
285.Kristin Gabestad N0rsett: GENE EXPRESSION STUDIES IN GASTROINTESTINAL PATHOPHYSIOLOGY AND NEOPLASIA
286.Per Magnus Haram: GENETIC VS. AQUIRED FITNESS: METABOLIC, VASCULAR AND CARDIOMYOCYTE ADAPTATIONS
287.Agneta Johansson: GENERAL RISK FACTORS FOR GAMBLING PROBLEMS AND THE PREVALENCE OG PATHOLOGICAL GAMBLING IN NORWAY
288.Svein Artur Jensen: THE PREVALENCE OF SYMPTOMATIC ARTERIAL DISEASE OF THE LOWER LIMB
289.Charlotte Bjork Ingul: QUANITIFICATION OF REGIONAL MYOCARDIAL FUNCTION BY STRAIN RATE AND STRAIN FOR EVALUATION OF CORONARY ARTERY DISEASE. AUTOMATED VERSUS MANUAL ANALYSIS DURING ACUTE MYOCARDIAL INFARCTION AND DOBUTAMINE STRESS ECHOCARDIOGRAPHY
290.Jakob Nakling: RESULTS AND CONSEQUENCES OF ROUTINE ULTRASOUND SCREENING IN PREGNANCY -A GEOGRAPHIC BASED POPULATION STUDY
291.Anne Engum: DEPRESSION AND ANXIETY- THEIR RELATIONS TO THYROID DYSFUNCTION AND DIABETES IN A LARGE EPIDEMIOLOGICAL STUDY
292.0ttar Bjerkeset: ANXIETY AND DEPRESSION IN THE GENERAL POPULATION: RISK FACTORS, INTERVENTION AND OUTCOME- THE NORD-TR0NDELAG HEALTH STUDY (HUNT)
293.Jon Olav Drogset: RESULTS AFTER SURGICAL TREATMENT OF ANTERIOR CRUCIATE LIGAMENT INJURIES -A CLINICAL STUDY
294.Lars Fosse: MECHANICAL BEHAVIOUR OF COMPACTED MORSELLISED BONE- AN EXPERIMENTAL IN VITRO STUDY
295.Gunilla Klensmeden Fosse: MENTAL HEALTH OF PSYCHIATRIC OUTPATIENTS BULLIED IN CHILDHOOD
296.Paul Jarle Mork: MUSCLE ACTIVITY IN WORK AND LEISURE AND ITS ASSOCIATION TO MUSCULOSKELETAL PAIN
297.Bjorn Stenstrom: LESSONS FROM RODENTS: I: MECHANISMS OF OBESITY SURGERYROLE OF STOMACH. II: CARCINOGENIC EFFECTS OF HELICOBACTER PYLORI AND SNUS IN THE STOMACH
298.Haakon R. Skogseth: INVASIVE PROPERTIES OF CANCER- A TREATMENT TARGET? IN VITRO STUDIES IN HUMAN PROSTATE CANCER CELL LINES
299.Janniche Hammer: GLUTAMATE METABOLISM AND CYCLING IN MESIAL TEMPORAL LOBE EPILEPSY
300.May Britt Drugli: YOUNG CHILDREN TREATED BECAUSE OF ODD/CD: CONDUCT PROBLEMS AND SOCIAL COMPETENCIES IN DAY-CARE AND SCHOOL SETTINGS
30l.Ame Skjold: MAGNETIC RESONANCE KINETICS OF MANGANESE DIPYRIDOXYL DIPHOSPHATE (MnDPDP) IN HUMAN MYOCARDIUM. STUDIES IN HEALTHY VOLUNTEERS AND IN PATIENTS WITH RECENT MYOCARDIAL INFARCTION
302.Siri Maim: LEFT VENTRICULAR SYSTOLIC FUNCTION AND MYOCARDIAL PERFUSION ASSESSED BY CONTRAST ECHOCARDIOGRAPHY