JK Tyre & Industries Ltd Chennai Tyre Plant
33
© Confederation of Indian Industry 1 Name Designation E Mail Id S.K Satpathy Head Engineering [email protected] B.Rameshkumar Head EEI [email protected] M Pandiarajan Head Utility [email protected] JK Tyre & Industries Ltd Chennai Tyre Plant Team Members CII - NATIONAL AWARD FOR EXCELLENCE IN ENERGY MANAGEMENT 2021
Transcript of JK Tyre & Industries Ltd Chennai Tyre Plant

© Confederation of Indian Industry 1
Name Designation E Mail Id
S.K Satpathy Head Engineering [email protected]
B.Rameshkumar Head EEI [email protected]
M Pandiarajan Head Utility [email protected]
JK Tyre & Industries LtdChennai Tyre Plant
Team Members
CII - NATIONAL AWARD FOR EXCELLENCE IN ENERGY MANAGEMENT 2021

© Confederation of Indian Industry
1. COMPANY PROFILE
2
Late Lala
Juggilal Singhania
Late Lala
Kamlapat Singhania
Established tyre business in 1977, JK Tyre is amongst the leading tyre manufacturer in India
Pioneer of radial technology in India
Presence across product verticals starting from 2 kg to 3.4 ton
Annual capacity of 32mn Tyres with 12 manufacturing plants globally
Among the Most energy efficient tyre companies in the world (9.50 Gj/Ton)
1st Indian tyre company to have certified for ISO 50001 (Energy Management)
1st Indian tyre company to have verified Carbon Footprint as per IS-14064
Our plant : 8.52 Gj/Ton
Chennai Tyre Plant in Tamil Nadu is the 6th manufacturing plant of JK Tyre which went onstream on 05th February 2012 presently produces 45 Lakhs Passenger Car Radial (PCR) tyresand 12 Lakhs Truck / Bus Radial (TBR) tyres per annum.
Salient Features of Chennai Tyre Plant
❖ Location Selection – Automobile Hub
❖ Most technologically advanced plant
❖ Equipment Selection for high Energy Efficiency
❖ Environment friendly technology considered during Plant Inception itself
❖ Zero Liquid Discharge Plant
❖ Usage of Maximum Day lights
❖ Highly optimized WIP material flow
❖ Modular designs for seamless expansion

© Confederation of Indian Industry
2.MANUFACTURING PROCESS
3
Raw Materials
Mixing & Calendering
Tyre Components Building & Inspection
Rubber Bales Rubber Chemicals
Textiles Steels
Banbury Mixer
Tyre Building
Tyre Curing
Visual Inspection
Uniformity ,X Ray , Balancing
& QA Inspection
Finished Tyre
Tread & Sidewall Extruder
Inner Liner Calendering
Body Ply Cutter
Belt CutterCalendering
Bead Preparation

© Confederation of Indian Industry
3.IMPACT ON COVID -19
4
Apr'20 to Sep'20 ( High impact due to Covid -19 )• Electrical specific power : 0.992 Kwh/Kg of product• Thermal specific energy : 1589 Kcal/Kg of product• Total specific energy : 10.21 Gj/Ton of product
Oct'20 - Mar'21 (Post Covid with relaxation)• Electrical specific power : 0.812 Kwh/Kg of product• Thermal specific energy : 1286 Kcal/Kg of product• Total specific energy : 8.30 Gj/Ton of product
Energy performance Comparison
10
.21
8.3
0
8.5
1
0.002.004.006.008.00
10.0012.00
Apr - Sep Oct - Mar 2020-21
Gj/
Ton
of
Pro
du
ctio
n
Total Specific Energy Consumption
Achieved High impact
Less Impact

© Confederation of Indian Industry
4. OVERALL ENERGY CONSUMPTION & PRODUCTION DATA – LAST 3 YEARS
5
Plant absolute Energy consumption (in TJ)
0
250
500
750
1000
FY 18-19 FY 19-20 FY 20-21
803.7
635.6 658.7
Ene
rgy
in T
J
150
200
250
300
FY 18-19 FY 19-20 FY 20-21
263
220233
Ene
rgy
in T
J
Plant Production (in Tons Per Day)

© Confederation of Indian Industry
4. ENERGY MAPPING 2020-21
6
0
10
20
30
40
50
60
7065
35
Pe
rce
nta
ge (
% )
THERMAL POWER
Plant Source wise Energy consumption (Kcal)
Thermal Energy64.9%
Electrical Power35.1%
DIV A
DIV B
DIV C
UTILITY
MIXER EXTRUDER
STOCK TYRE BUILDING
CURING FINAL FINISHING
COMPRESSOR & LIGHTING
PUMPS AND FANS
53.5%
0.4 %
11.0%
19.2 %
0.7%
1.6 %
13.6 %
19.6 %
1.6 %
54.2 %
24.6 %
13.7 %
0.9 %
53.0 %
4.7 % 19.9 %
1.2 %
0.7 %
5.9 %
Plant Area/Equipment wise Energy consumption (Kcal)

© Confederation of Indian Industry7
4. SPECIFIC ENERGY CONSUMPTION (THERMAL & ELECTRICAL) TREND
14
23
13
39
13
16
13
13
1200
1300
1400
2017-18 2018-19 2019-20 2020-21
KC
al/
KG
0.9
41
0.8
88
0.8
78
0.8
38
0.7
0.8
0.9
1
2017-18 2018-19 2019-20 2020-21
KW
H /
KG
2232
2103 20712034
1900
2000
2100
2200
2300
2017-18 2018-19 2019-20 2020-21
Kca
l / K
g
Specific Energy Consumption – Electrical & Thermal (Kcal/Kg of finished product)
8.9% reduction
Specific Thermal consumption (KCal / Kg of finished product) Specific Power Consumption (Kwh / Kg of finished product)

© Confederation of Indian Industry8
Internal context
Tyre technology development trials
Scrap and reworks
Machine availability
Employee involvement
Effective Energy Management System
External context
Pandemic Situation (Covid-19)
Capacity utilization because of market changes
Climatic condition
OEM/Customer requirements/ No of SKU’s in market
Fuel price and availability in market
Factors influence SEC variation
4.REASONS FOR SEC VARIATION

© Confederation of Indian Industry9
5. BENCHMARKING
361
269
195236
201239
182
266
0
200
400
VTPIIIOTR
BTPPCR RAD
VTPIITBR RAD
VTPITBR BIAS
KTPTBR BIAS
LTPTBR BIAS/RAD/2W
CTPTBR RAD
CTPPCR RAD
Kca
l / K
G o
f FO
Eq
uiv
ale
nt
JK Tyre plants, India
Plant Specific Energy Consumption
Internal Benchmarking
Chennai Tyre Plant is the most Energy Efficient plant among JK Tyre group, having six plants located various parts in India (FY 20-21)

© Confederation of Indian Industry10
1.5
00
1.4
75
1.4
50
1.4
25
1.200
1.300
1.400
1.500
2021-22 2022-23 2023-24 2024-25
KG
/ K
GSpecific Steam consumption (Kg / Kg of finished product)
0.7
90
0.7
75
0.7
65
0.7
50
0.700
0.750
0.800
2021-22 2022-23 2023-24 2024-25
KW
H /
KG
Specific Power Consumption (Kwh / Kg of finished product)
19001867
1834
1790
1700
1750
1800
1850
1900
1950
2021-22 2022-23 2023-24 2024-25
Kca
l / K
g
Overall SEC(Kcal/Kg of finished product)
Action Plan to achieve target
▪ 9 Crore rupess budget allotment for energy projects
in next 3 years
▪ Strengthening the Team on Energy Conservation by
SGA & MFT concept
▪ Participating in National Conferences to understand
the New Technologies in Energy Front
5. LONG TERM VISION ON ENERGY EFFICIENCY

© Confederation of Indian Industry11
5. LIST OF MAJOR ENCON PROJECTS PLANNED FY 21-22
S.No Short description of the EnCon Project TargetProject Cost(Rs. in Lacs)
Savings(Rs. in Lacs)
ROI(Year)
1Increasing Boiler feed water temperature from 105 to 115 by using flash steam.
Jan’22 4.5 14.38 0.3
2 Cogged belt and pulley replacement @ ventilation system (20 Nos) Dec’21 10 22.39 0.4
3To improve the Energy Performance in Mixer Batch off Fan group by optimizing the Speed (Air Flow) of Fan - 5 Mixers
Dec’21 6 11.27 0.5
4 Quintoplex & Triplex Extruder BD water recovery Dec’21 2.30 2.84 0.8
5 NIBR Boiler for 4RC for startup Mar’22 8.5 8.02 1.1
6 Air handling unit and Ventilation performance improvement - 4 Nos Mar’22 37.8 31.46 1.2
7TBR hydraulic pressure optimization. Pressure reduction from 23Kg/Cm2 to 19 Kg/Cm2
Jan’22 11.0 9.33 1.2
8 VFD on FAN with temperature controller @ Process CT & VAM Dec’21 3.5 2.032 1.7
9Shed Provide in TS-2 & TS-3 substation Distribution transformers to reduce transformer losses
Jan’22 3 1.75 1.7
TOTAL 86.62 103.5 0.84

© Confederation of Indian Industry12
6. ENERGY SAVING PROJECTS IMPLEMENTED IN LAST 3 YEARS
2015 - 16
2016 - 17
2017 - 18
DESCRIPTION ZERO INVESTMENT WITH INVESTMENT TOTAL
Projects in (Nos) 7 9 16Total savings in (Million Kcal) 776 3373 4149Total Savings in (Million Rs) 33.83Total Investment in (Million Rs) 7.92Payback in (Months) 3
DESCRIPTION ZERO INVESTMENT WITH INVESTMENT TOTAL
Projects in (Nos) 4 8 12Total savings in (Million Kcal) 1689 8669 10358Total Savings in (Million Rs) 30.91Total Investment in (Million Rs) 10.98Payback in (Months) 4
DESCRIPTION ZERO INVESTMENT WITH INVESTMENT TOTAL
Projects in (Nos) 4 15 19Total savings in (Million Kcal) 1077 1595 2672Total Savings in (Million Rs) 24.67Total Investment in (Million Rs) 13.39Payback in (Months) 7
2018 - 19
2019 - 20
2020-21
DESCRIPTION ZERO INVESTMENT WITH INVESTMENT TOTAL
Projects in (Nos) 2 8 10Total savings in (Million Kcal) 517 2233 2750Total Savings in (Million Rs) 9.47Total Investment in (Million Rs) 3.82Payback in (Months) 5
DESCRIPTION ZERO INVESTMENT WITH INVESTMENT TOTAL
Projects in (Nos) 5 4 9Total savings in (Million Kcal) 1287 3214 4501Total Savings in (Million Rs) 15.2Total Investment in (Million Rs) 6.4Payback in (Months) 5
DESCRIPTION ZERO INVESTMENT WITH INVESTMENT TOTAL
Projects in (Nos) 0 8 8Total savings in (Million Kcal) 0 3837 3837Total Savings in (Million Rs) 13.24Total Investment in (Million Rs) 13.59Payback in (Months) 12

© Confederation of Indian Industry13
7.INNOVATIVE PROJECT
Problem/Present status : Flash steam pressure from curing process varies from 0.7 to 1.3 Kg/Cm2. This flash steam is used in boiler to increase the feed water temperature at deaerator to 105°C @ 0.23 Kg/Cm2 and excess flash vented to atmosphere through flash tank. Excess Flash not recovered back to the process which results in Energy Loss
FLASH VESSEL
Curing Process
CRS Pump
Co
nd
en
sate
to
Bo
iler BFP
Deaerator 0.23Kg/Cm2, 105°C
Boiler
Flash vent to atmosphere
Excess Flash
Flas
h s
team
@ 0
.7 –
1.3
K
g/cm
2
Project Name: Fuel Consumption reduction by Effective Utilization of Flash Steam from Curing Process

© Confederation of Indian Industry14
Solution : Deaerator Operating Working Pressure enhanced to 1.3Kg/Cm2 to utilize the excess flash steam by looping with pegging steam line and introduced the control valve to maintain the Deaerator Pressure
FLASH VESSEL
Curing Process
CRS Pump
Co
nd
en
sate
to
Bo
iler
BFPBoiler
Flas
h s
team
@ 0
.7 –
1.3
Kg/
cm2
Flash Condensate pump stopped
Flash vent to atmosphere Eliminated
Control Valve Set Pr 1.5 Kg/Cm2
Deaerator1.3 Kg/Cm2,
125°C
7.INNOVATIVE PROJECT

© Confederation of Indian Industry15
DescriptionSteam flow
Enthalpy of steam
Enthalpy of water
GCV of Coal
Boiler Effciency
Coal consumption
Coal Savings by increasing FWT
Feed water Temperature
TPH Kcal/kg % MT/Hr MT/DayMT/Annu
m
Rs in Lacs/Annu
m
105 Deg°C 22 669 105 4073 75 4.063.46 1104.48 49.7
120 Deg°C 22 669 125 4073 75 3.92
Investment : 2 Lacs ROI: Less than a Month
Cost Saving GHG Emission
reduction : 1807
t CO2
Why innovative : Out of box thinking – In-house Innovation by modifying the deaerator operating conditions to utilize the excess flash steam, which contributes to the saving of 1100 MT of Coal/Annum saving
Take away: Horizontally can be deployed to the similar process industries. Where we are being parallel implemented in our other plants of JK Tyre.
7.INNOVATIVE PROJECT
© Confederation of Indian Industry16
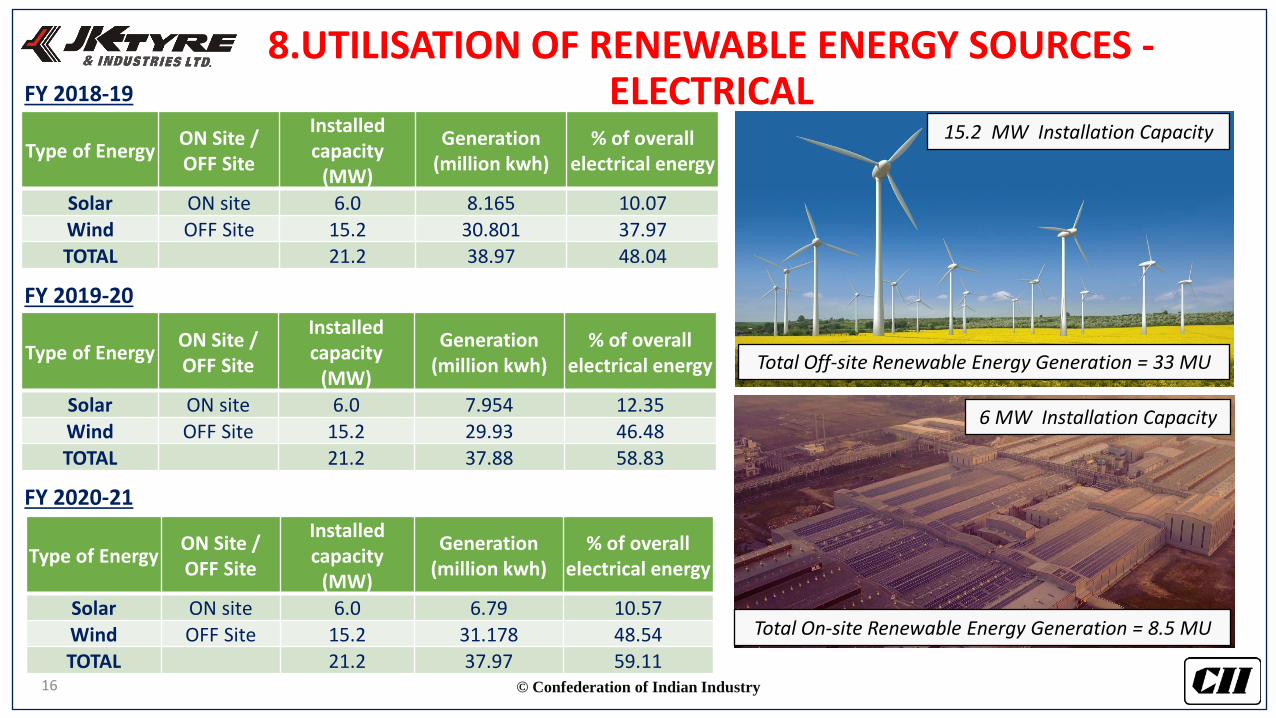
8.UTILISATION OF RENEWABLE ENERGY SOURCES -ELECTRICAL
Type of EnergyON Site / OFF Site
Installed capacity
(MW)
Generation(million kwh)
% of overall electrical energy
Solar ON site 6.0 8.165 10.07Wind OFF Site 15.2 30.801 37.97
TOTAL 21.2 38.97 48.04
FY 2018-19
Type of EnergyON Site / OFF Site
Installed capacity
(MW)
Generation(million kwh)
% of overall electrical energy
Solar ON site 6.0 7.954 12.35
Wind OFF Site 15.2 29.93 46.48TOTAL 21.2 37.88 58.83
FY 2019-20
Type of EnergyON Site / OFF Site
Installed capacity
(MW)
Generation(million kwh)
% of overall electrical energy
Solar ON site 6.0 6.79 10.57Wind OFF Site 15.2 31.178 48.54TOTAL 21.2 37.97 59.11
FY 2020-21
Total On-site Renewable Energy Generation = 8.5 MU
Total Off-site Renewable Energy Generation = 33 MU
15.2 MW Installation Capacity
6 MW Installation Capacity

© Confederation of Indian Industry17
Type of EnergyON Site / OFF Site
Equivalent energy savings (Mkcal)
% of overall Thermal energy
Biomass ON site 4244 3.35
Wood/Garden ON site 140 0.11
TOTAL 4384 3.46
FY 2018-19
Type of EnergyON Site / OFF Site
Equivalent energy savings (Mkcal)
% of overall Thermal energy
Biomass ON site 6088 5.92
Wood/Garden ON site 180 0.18
TOTAL 6268 6.10
FY 2019-20
Type of EnergyON Site / OFF Site
Equivalent energy savings (Mkcal)
% of overall Thermal energy
Biomass ON site 5398 5.01
Wood/Garden ON site 165 0.15
TOTAL 5563 5.16
FY 2020-21
Saw dust mix with Coal (23%)
Dried Leaves ,Wooden waste with Coal
8.UTILISATION OF RENEWABLE ENERGY SOURCES -THERMAL

© Confederation of Indian Industry18
9.WASTE UTILIZATION AND MANAGEMENT
ASH RECYCLING FOR UNBURNT REDUCTIONBed Ashes are collected from the Boiler Bank Zone, Economizer & APH
Hopers where Un burnt content is high. Collected Ashes are recycled in the Boilerfor further combustion.
PLANT VEGETATION WASTE USED AS FUEL FOR BOILER:Plant Vegetation Waste has been sent to Recycler and then Crushed into
Wooden Dust. Then Wooden dust mixed with Coal in 20% ratio and used in Boiler
Waste Unit 2018-19 2019-20 2020-21 Generation Recycle /Reuse Disposal
A Metal scrap Tons 157.56 83.83 61.88Maintenance
ActivityReused to make MS parts
Sent to authorized recycler for reuse
B Rubber Tons 576.61 363.07 191.13 Process Reused for Rubber Parts
C Paper Tons 319.33 240.59 234.99 Office Reused for making cardboard
& paper bags.
D E-Wastes Tons 0.79 4.16 1.41 IT &EEI RecycledSent to authorized
vendor for recycling.
E Polythene Tons 297.71 236.03 226.81 Process Reused for making Tarpaulin
and Poly ropesSent to authorized recycler for reuse

© Confederation of Indian Industry19
10. GHG INVENTORISATION
Carbon foot print of any entity is the measure ofthe Green House Gas (GHG) emitted due to theactivities of that entity.
• All Plant (decentralized level) GHG Inventorisation
• Rolling up the inventory to Corporate Level
Identification of GHG Sources and Sinks
Selection of Quantification Methodology
Selection and collection of GHG Activity Data
Selection of GHG Emission Factor
Calculation of GHG Emission and Removal
Setting GHG Operational Boundaries Emission Sources:
Emission Sources Scope of Emission
Diesel for internal material transport
Direct Emission (scope 1)
Diesel for generators
Boiler coal
HSD (High speed diesel)
Company vehicle‐Diesel
Company vehicle‐Petrol
LPG consumption ( GH)
Release of refrigerant
Use of Acetylene
Weight of CO2 released from fire extinguishers
Overall purchase of Electricity Energy Indirect Emission (scope 2)
Material Logistics (Raw Material & FGTransportation)
Other Indirect Emission (Scope 3)
Business Travel
Employee Commute
Waste Disposal

© Confederation of Indian Industry20
10. GHG INVENTORISATION
1.73
1.40 1.44
1.28
1.010.90 0.90 0.86
0.00
0.20
0.40
0.60
0.80
1.00
1.20
1.40
1.60
1.80
2.00
2013-14 2014-15 2015-16 2016-17 2017-18 2018-19 2019-20 2020-21
Inte
nsi
ty
EMISSION INTENSITY GRAPH (CO2E TON/TON OF TYRE
Scope 1 & 2Emission Intensity
50.2 % reduction from the base year
0.132
0.118
0.106 0.104
0.000
0.020
0.040
0.060
0.080
0.100
0.120
0.140
2017-18 2018-19 2019-20 2020-21
Inte
nsi
tyEMISSION INTENSITY GRAPH (CO2E TON/TON OF TYRE
Scope 3Emission Intensity
21.2 % reduction in Last 3 year

© Confederation of Indian Industry21
10. GHG INVENTORISATION
1st Indian tyre company to have verified Carbon Footprint as per IS-14064
© Confederation of Indian Industry22
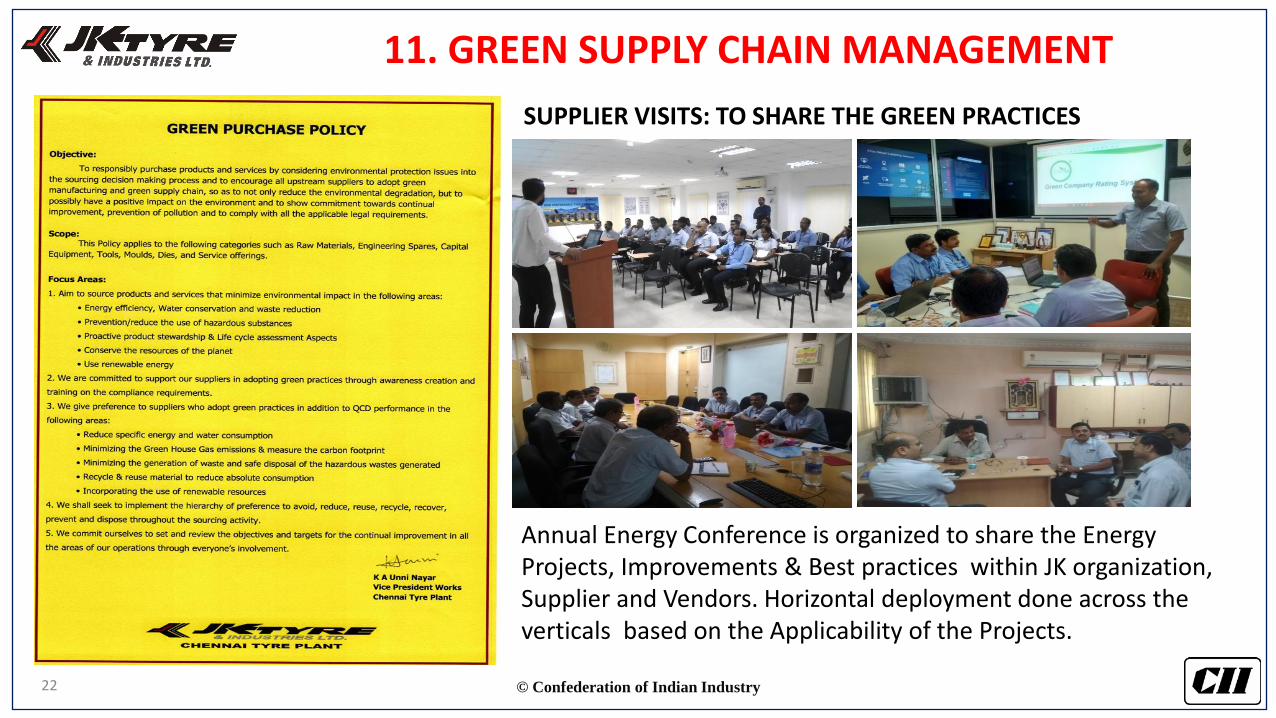
11. GREEN SUPPLY CHAIN MANAGEMENT
Annual Energy Conference is organized to share the Energy Projects, Improvements & Best practices within JK organization, Supplier and Vendors. Horizontal deployment done across the verticals based on the Applicability of the Projects.
SUPPLIER VISITS: TO SHARE THE GREEN PRACTICES

© Confederation of Indian Industry23
11. GREEN SUPPLY CHAIN MANAGEMENT
S.No
Material Green Procurement Guideline
1Energy Products
100% Procurement of BEE Starrated products (Motors, AC’s , LED etc)
High Energy Efficiency Motor
▪ Requirement of energy efficiency gets reflected in all Purchase documents
▪ Transport route optimization: Raw material supply truck used to carry our finished goods to various customers and depots.
▪ We minimise the transit distance by selecting the vendor which is near to our plant.
▪ Coins type stuffing to Lacing type stuffing for increasing load capacity and reduce trucks & fuel.
OTHER INITIATIVES:

© Confederation of Indian Industry24
12. TEAM WORK , EMPLOYEE INVOLVEMENT & MONITORING
Energy Management System – Plus Breaker Control – Plant over all architecture ✓IOT based advance Energy management system connected with 1013 Energy meters and 256 Nos Breakers
✓EMS plus breaker controlling system to control energy
✓System alerts the excess energy consumption immediately thro Auto SMS, and E-mail helps to take appropriate actions immediately rather than afterward investigation
✓System records Sag/swell and transients and all electrical parameters at the sampling rate of 1024 samples/cycle

© Confederation of Indian Industry25
IOT based advance Energy management system
Provides added information to themanagement and equipment operators
Helps real time control on machineenergy performance
Helping to assess product, manpower,time wise energy performance
Online alerts and control measures.
12. TEAM WORK , EMPLOYEE INVOLVEMENT & MONITORING
Steam Flow monitoring – Flow meters
Utility Energy parameters monitor & Control - SCADA
© Confederation of Indian Industry26
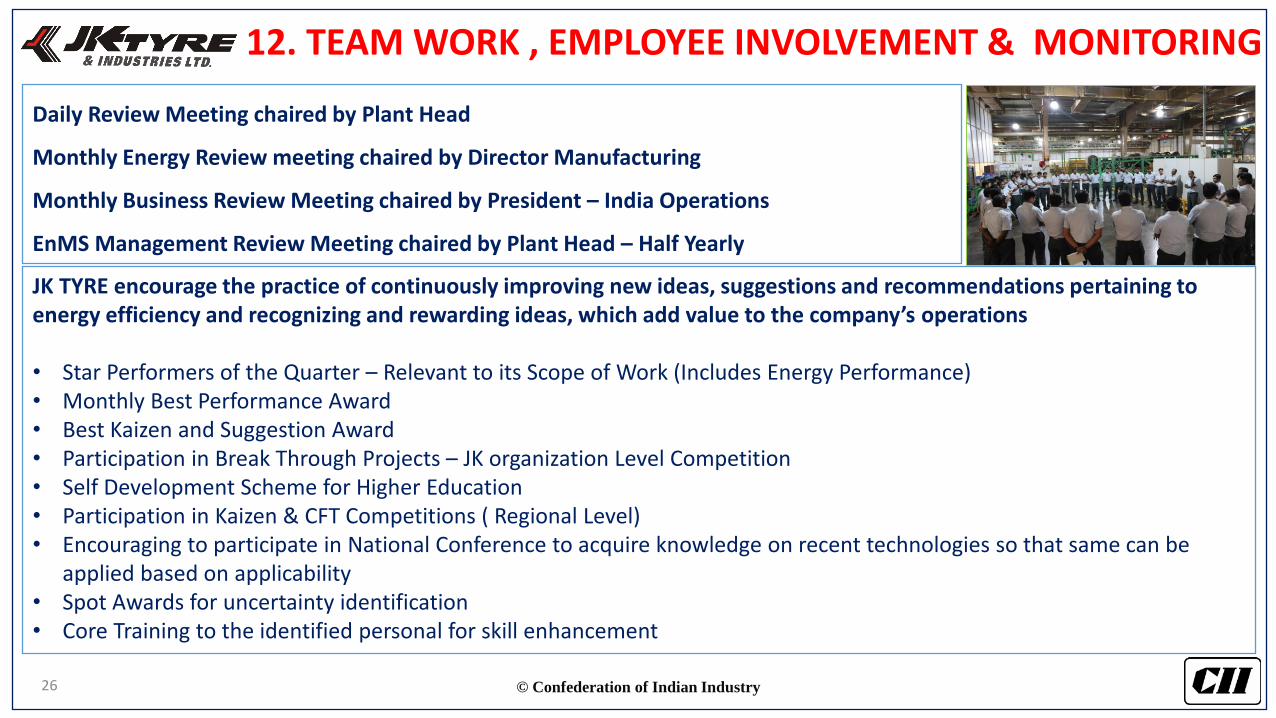
Daily Review Meeting chaired by Plant Head
Monthly Energy Review meeting chaired by Director Manufacturing
Monthly Business Review Meeting chaired by President – India Operations
EnMS Management Review Meeting chaired by Plant Head – Half Yearly
JK TYRE encourage the practice of continuously improving new ideas, suggestions and recommendations pertaining to energy efficiency and recognizing and rewarding ideas, which add value to the company’s operations
• Star Performers of the Quarter – Relevant to its Scope of Work (Includes Energy Performance) • Monthly Best Performance Award• Best Kaizen and Suggestion Award• Participation in Break Through Projects – JK organization Level Competition • Self Development Scheme for Higher Education• Participation in Kaizen & CFT Competitions ( Regional Level)• Encouraging to participate in National Conference to acquire knowledge on recent technologies so that same can be
applied based on applicability• Spot Awards for uncertainty identification• Core Training to the identified personal for skill enhancement
12. TEAM WORK , EMPLOYEE INVOLVEMENT & MONITORING

© Confederation of Indian Industry27
12. AWARENESS CREATION FOR STAKEHOLDERS1. Class room training –All Employees and relevant stakeholders were trained with Green Initiatives like plant
Energy consumption & Energy efficiency methodology in planned intervals
2. Visual aids – Training has been taken with different visual aids for better understanding on Green Initiatives.
3. Displaying posters – On shop floor stickers/posters were pasted to create awareness in every individual.
4. Cross Functional Team /Kaizens – In shop floor, CFT Approach followed to understand the Energy
consumption & process of their equipment/machine.
5. Motivation by Awards & Recognition – Awards & recognition has been given to employee and stakeholders
upon their performance which can be indicated as KAIZEN’s etc., Employee AwardTraining & Interaction
Annual Energy Conference is organized to share the Energy Projects, Improvements & Best practices within JK organization, Supplier and Vendors. Horizontal deployment done across the verticals based on the Applicability of the Projects.
SUPPLIER VISITS: TRAINING – CAPACITY BUILDING & SMALL GROUP ACTIVITIES
ENERGY AWARENESS – NEAR BY SCHOOLS & CONTRACT EMPLOYEES

© Confederation of Indian Industry28
12.ENERGY MANAGEMENT TEAM
ELECTRICITY
THERMAL
K.A. UNNI NAYAR VP (W)
S.K. SATHPATY (GM-ENGG)
MR.SIMON (PROD)MR.NIKIL (PROD)
MR.MANOJKUMAR (ELEC)MR. VIJAYABASKAR
(ENGG)
MR.RAGAVENDRA (ELEC)MR.RAJESHKUMAR (INST)
B.RAMESH KUMAR (ELECTRICAL ENERGY)
MR.VASU BABU (MIXING)MR.ANIL (EXTRUDER)MR.KARTHICK (ELEC)
MR.TAMILARASAN (MECH)
MR. SURESH (TECH)MR.GOPI (PURCHASE)
MR.SATHYA (ELEC)MR. SURESH RAJAN (MECH)
MR. PRABHU (UTILITY)MR.AJOY (BOILER)
M.PANDIARAJAN (THERMAL ENERGY)
T.JAYAKANTHAN EM (Reg.No.16700/20)
Corporate Energy Cell
❑ Energy Auditors As per ISO 50002:20143 Nos
❑ BEE EM Certified – 2 Nos

© Confederation of Indian Industry29
13. ENERGY BUDGET
YEARPROJECT
NOS.
BUDGET ALLOCATED(Rs. in Lacs)
SAVINGS REALISED
(Rs. in Lacs)
ROI(Years)
2021-22 9 86.62 103.5 0.84
2020-21 9 64.1 152.0 0.42
2019-20 10 38.2 94.7 0.40
2018-19 8 135.9 132.4 1.0
2017-18 12 109.8 309.1 0.36
ENERGY PROJECT ANNUAL BUDGET
ENERGY CAPEX BUDGET
YEARBUDGET ALLOCATED
(Rs. in Lacs)PROJECT DETAIL
2021-22 25 BIO MASS STORAGE
2019-20 600 IOT BASED ENERGY MONITORING
2017-18 1500 3MW ROOF TOP SOLAR
2016-17 105ADVANCED EMS SYSTEM & BREAKER
CONTROL
2016-17 2000 3MW ROOF TOP SOLAR
PROJECT IMPLEMENTED THROUGH KAIZENS
1483
21312451
2152 1942
2016-17 2017-18 2018-19 2019-20 2020-21
Year wise - Kaizen Trend
ANNUAL
CAPEX
4.9 %
AVG INVESTMENT % ON TOTAL TURNOVER

© Confederation of Indian Industry30
13. ISO 50001/Green Co/IGBC RATING
ISO 50001 : 2011 Certified on July 2013

© Confederation of Indian Industry31
14. LEARNING FROM CII AND OTHER AWARD PROGRAM
• CII National Award for Excellence in Energy Management is an excellent platform to
benchmark our Energy Performance and to showcase the efforts and achievements.
• Imparting the requirements stated in the Energy award program supported us to
improve our Energy performance by means of systems, methods, knowledge and
technology development which has raised our capabilities to work and receive this
National Energy leader award.
• The award builds our BRAND and National wide recognition
• The preparation for award application helps to inspire and align the entire workforce and
rapidly accelerates the PACE OF SYSTEM IMPROVEMENT.

© Confederation of Indian Industry32
AWARDS AND ACCOLADES
Golden Peacock Energy Efficiency Award 2017
SEEM National Energy Management Award 2016,2017,2018&2019
CII –National Energy Leader 2018,2019&2020
BEE – National Energy Conservation Award 2014 & 2015
CII - Green Co Certification 2019 - Platinum
CEM Global award - Excellence in Energy Management 2019 – First company from India