Jewish Life in Greater Toronto - · PDF fileJewish Life in Greater Toronto . ... education,...
69
Transcript of Jewish Life in Greater Toronto - · PDF fileJewish Life in Greater Toronto . ... education,...

Jewish Life in Greater Toronto
A Survey of the Attitudes & Behaviours of Greater Toronto’s
Jewish Community
By Charles Shahar
& Tina Rosenbaum

Acknowledgements
UJA Federation of Greater Toronto would like to thank the leadership of the Community Planning & Allocations Committee for their support of the Jewish community study, as well as
many other lay leaders and professionals who have contributed their knowledge and insights regarding the Toronto Jewish Community.
The researchers would like to acknowledge Ed Segalowitz, Gary Siepser and Susan Jackson, for their invaluable assistance and guidance.
UJA Federation would also like to thank Fay Rotman, Project Supervisor, for her dedication and significant contribution to the successful completion of this study. Without her help this report
would not be possible.
The researchers would like to recognize the diligence and commitment of the research assistants and, in particular, the important contributions of the following individuals: Clare Adam, Miriam Daniels, Yona Maierovitz, Lil Nobel, Ellen Rajzman,
Shelly Rotman, and Jennifer Turack.
The researchers would also like to thank Dr. Seymour Epstein and Yael Seliger of the Board of Jewish Education, and Len Rudner of Canadian Jewish Congress, for providing their guidance. A
special thanks is extended to Joyce Levine of the Board of Jewish Education, for her expertise and insights in carefully editing this manuscript.
Finally, UJA Federation would like to express appreciation to Professor Stuart Schoenfeld and Dr. Randal Schnoor for their helpful suggestions in reviewing this document.

Highlights of Results
• A total of 654 individuals successfully completed the survey. 11.2% of the sample resided in the
Downtown area, 48.2% in the Central Jewish Community, 35.3% in York Region, and 5.4% in
“Other Areas” of Greater Toronto.
• 14.2% of respondents described themselves as Orthodox, 36.9% said they were Conservative, 18.7%
Reform, and 1.7% Reconstructionist. Less than one in ten (9%) were secular Jews, and 17.2%
preferred the more ambiguous designation of “Just Jewish”. A very small proportion said they were
Humanist (1.9%) or Jewish New Age (0.5%).
• The Jewish community of Toronto has a high level of Orthodox Jews relative to other North
American communities, is in the middle of the distribution as far as Conservative and unaffiliated
Jews are concerned, and has a lower percentage of Reform Jews as compared to other North
American communities.
• The majority of respondents attend synagogue only on High Holidays, or on High Holidays and a few
other times (50.8%). 17.2% attend only on special occasions, and 8.3% attend rarely or never. In
short, about three-quarters (76.3%) of Toronto Jews do not attend synagogue on a regular basis. A
small percentage (4.5%) attend at least once a month, 5.8% several times a month, 8.3% about once
per week, and 5.1% more than once per week.
• Intermarried individuals, immigrants from the FSU, those who don’t live in traditionally Jewish
neighbourhoods, and those with no spouse or family, are particularly likely to feel disconnected from
synagogue life.
• In terms of keeping kosher, 22.4% of respondents said they keep “strictly kosher” at home, and
10.2% keep “strictly kosher” outside the home. Only one in ten (10.1%) keep strictly kosher both in
and out of the home. This finding suggests that there is generally a low level of strict kashrut
observance among respondents.
• Certain religious customs (such as attending a Passover Seder or lighting Chanukah candles) are
prominent in the lives of the great majority of unaffiliated Jews, although they may not interpret these
practices in strictly religious ways. Reading about Israel / Jewish subjects is another way that the
majority of unaffiliated individuals connect to Judaism.

• Of respondents living in intermarried households (where the spouse did not convert), 29.7% of
respondents said their children were being brought up within the Jewish faith, 2.7% said according to
the spouse’s faith, 37.8% within both faiths, and 29.7% with no religion. • 80% of respondents who live well outside the sphere of Jewish neighbourhoods have children who
married non-Jews, suggesting that such geographic detachment from the community may relate to
lower levels of affiliation and connection that stretch across even generational lines.
• Almost half (45.2%) of respondents said their children have had a Jewish elementary school
education, 19% said their children have had a Jewish high school education, 46.6% said a Jewish
supplementary education, 53% private tutoring, and 10.5% post-secondary Jewish studies. • The most prominent factors that relate to whether or not respondents have had their children attend
Jewish day schools include geographic proximity to Jewish neighbourhoods, whether the parents are
intermarried or not, the level of household ritual observance, and the economic status of the
household.
• Almost half of the sample (48.2%) said they donated to United Jewish Appeal in the past year; 30%
said they did not donate, but had in the past; and 21.8% said they had never donated. More than three-
quarters (77.8%) of respondents said they donated to non-Jewish charities.
• Of a total of 654 respondents, (45.6%) did not report use of any Jewish service or organization;
20.5% used one service; 12.4% used two services; 10.1% used three services; and 11.5% used four or
more services. In short, almost half of the sample did not use any services, whereas about a fifth used
at least three community services.
• About three-quarters (73.9%) of respondents said they have been to Israel at least once. Almost half
the sample (47.1%) said they felt “very close” to Israel, 32% said “somewhat close”, 13.4% said
“somewhat distant”, 4.3% said “very distant”, and 3.1% said they weren’t sure.
• More than one in ten respondents (11%) said they had a personal experience with antisemitism in the
last 2 years, 29.6% said they experienced antisemitism but not recently, more than half (55.6%) never
had a personal experience with antisemitism, and 3.8% were not sure. Of respondents who recently
had such an experience, the most likely venue was in the workplace or was job-related, followed by in
the neighbourhood where they live.
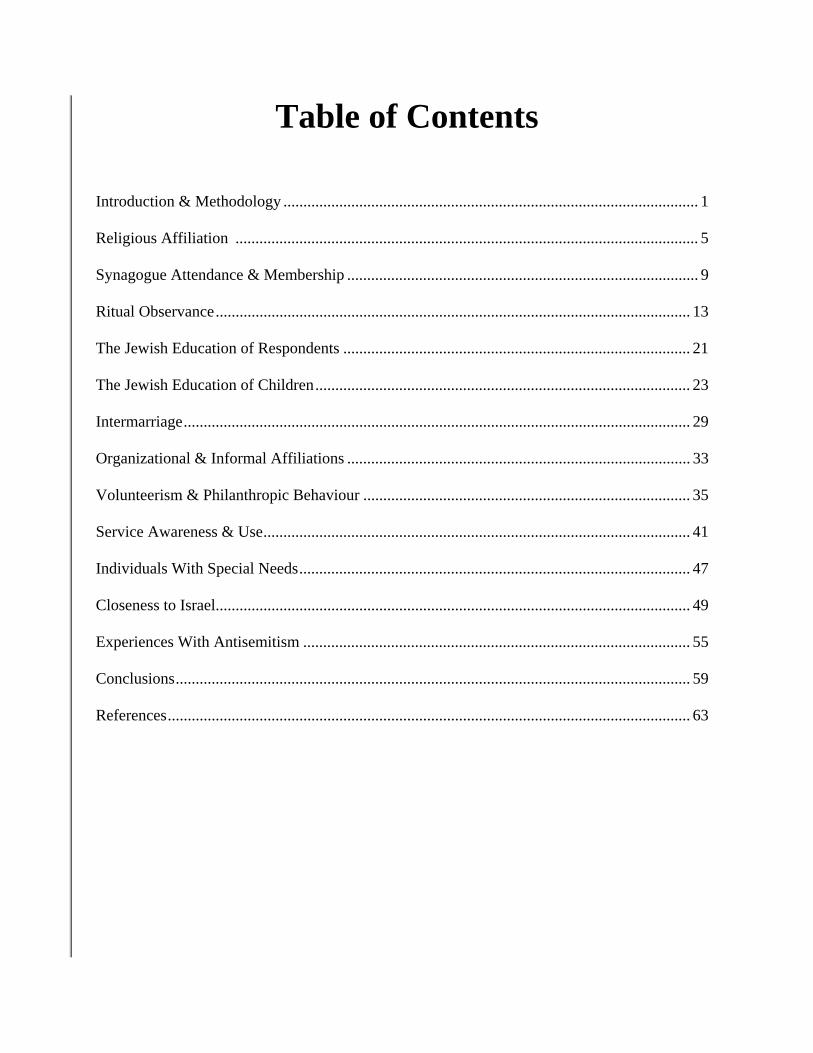
Table of Contents
Introduction & Methodology ........................................................................................................ 1 Religious Affiliation .................................................................................................................... 5 Synagogue Attendance & Membership ........................................................................................ 9 Ritual Observance....................................................................................................................... 13 The Jewish Education of Respondents ....................................................................................... 21 The Jewish Education of Children.............................................................................................. 23 Intermarriage............................................................................................................................... 29 Organizational & Informal Affiliations ...................................................................................... 33 Volunteerism & Philanthropic Behaviour .................................................................................. 35 Service Awareness & Use........................................................................................................... 41 Individuals With Special Needs.................................................................................................. 47 Closeness to Israel....................................................................................................................... 49 Experiences With Antisemitism ................................................................................................. 55 Conclusions................................................................................................................................. 59 References................................................................................................................................... 63
Introduction & Methodology The following is a summary of the results of
a comprehensive survey of the attitudes,
beliefs and behaviours of Jews living in the
Greater Toronto Area. The Strategic
Planning & Community Engagement
Department of UJA Federation undertook
this study. It was felt that it was important to
have a “snapshot” of the community to
understand the challenges it faces as it looks
to the future.
The Greater Toronto Area has a
cosmopolitan and rapidly growing Jewish
population. The community here is close-
knit and enjoys a vibrant cultural and
religious life. It has a large network of
services designed to meet the needs of its
members, and strong economic and political
representation in the wider milieu. All in all,
the Greater Toronto community represents
one of the major centres of Jewish life in
North America.
It is important that the leadership of the
organized community has a “finger on the
pulse” of its constituency, and that it takes
steps to directly hear from its members. It is
not sufficient to rely on anecdotal sources of
information that may be subjective in nature.
Rather, this survey is an attempt to engage
in scientific fact-finding regarding the state
of the Greater Toronto Jewish community
today, and to ultimately respond to the
concerns and needs expressed by its
members.
How was the sample drawn from the Greater Toronto Jewish population? A sample pool of 6,000 Jewish-sounding
names (including Russian, Sephardic and
Israeli-sounding names) was drawn from a
computerized telephone directory. The list
was stratified by geographic area. Potential
respondents were chosen randomly from this
list, and contacted by telephone. A screener
was used to ensure that the potential
respondent was in fact Jewish, and that they
were the primary household maintainer, or
their spouse. Dependent adults were not
interviewed in this study.
A total of 654 individuals successfully
completed the survey. Of these individuals,
290 (44.4%) filled out an
e-mail attachment, 352 (53.8%) had the
1

survey delivered to their home, and 12
(1.8%) were interviewed by telephone.
Telephone interviews were conducted by
research assistants who were trained to
remain neutral and to ask questions in a
standardized way.
Almost two-thirds of the sample were non-
immigrants (63.4%), 29.5% immigrated
before 1990, and 7.1% after 1990.
Regarding the education level of
respondents, 14.3% of the sample had
completed elementary or high school, 26.5%
had a technical or college education, 22.7%
had a university undergraduate degree, and
36.6% had a university graduate degree.
The Basic Demographics of the Sample
In terms of geographic districts, 11.2% of
the sample resided in the Downtown area,
48.2% in the Central Jewish Community,
35.3% in York Region, and 5.4% in “Other
Areas” of Greater Toronto.
Finally, 10.8% of the households sampled
earned under $30,000 per year, 40.5%
earned between $30,000 - $99,999, and
48.7% earned at least $100,000.
More than half (53.8%) of survey
respondents were females, and 46.2% were
males.
A comparison with the 2001 Census data
(see Figures 1A to 1C) suggests that the
geographic stratification for this survey was
largely successful. The gender and marital
breakdowns were likewise comparable. On
the other hand, the current sample appears to
have a somewhat stronger representation
among middle-aged, Canadian-born, more
affluent and more educated Jews.
Regarding the age of respondents, 10.9% of
the survey sample were 17-34 years, 17.2%
were 35-44 years, 29.1% were 45-54 years,
19.8% were 55-64 years, and 23% were 65+
years.
In terms of marital status, 71.6% of the
sample were married, 7.3% were divorced or
separated, 8.4% were widowed, 9.5% were
single, and 3.2% were living in common law
arrangements.
This type of “skewing” is not unusual since
it is precisely these groups that are more
inclined to fill out such surveys in the first
place. The issue of self-selection is one that
is prevalent among almost all population /
2

attitudinal surveys, even those employing
random-digit dialling as a sampling
technique. While the results of the survey
can be generalized to the great majority of
members within the Jewish community, the
reader should keep in mind that there are
some under-representations of certain
demographic segments and therefore the
results should be viewed as indicative rather
than as an absolute reflection of the Toronto
Jewish community.
3. To provide an even broader context,
comparisons will also be made with results
obtained from surveys conducted by other
Jewish communities across North America.
Most of these data were gleaned from
Sheskin’s (2001) review of American
Jewish population studies.1
4. Finally, comparisons will be made with the
2000-2001 National Jewish Population
Survey (NJPS), a comprehensive study of
Jewish life in the United States implemented
by United Jewish Communities (UJC).
How will this report be presented? In terms of the boundaries of geographic
areas referred to in this report: The
Given the large amount of information
contained herein, it may be useful to outline
the general presentation of this report. Four
basic analyses will be presented throughout:
Downtown Area stretches from Lake
Ontario to St. Clair. Central Toronto spans
the area from St. Clair to Steeles. Finally,
York Region includes the municipalities of
Vaughan, Richmond Hill, and Markham.
Few respondents in this survey were drawn
from other areas of York Region such as
Aurora or King, where there are much
smaller populations of Jews.
1. General breakdowns will look at
percentages of responses for most variables.
For instance: What percentage of
respondents are synagogue members? What
percentage have visited Israel?
2. “High-Low Analyses” will look at the
segments of respondents (young adults,
living in York Region, Orthodox, high
income, divorced, recent immigrants, etc.),
who are most or least inclined to
demonstrate a particular behaviour or
attitude.
All other individuals (not living in
Downtown Toronto, Central Toronto, or
York Region) were considered living in
“Other Areas” of Greater Toronto. These
areas comprised mostly of Scarborough,
Mississauga, and Oakville. These areas
typically have small concentrations of Jews.
3

Figures 1A-1C Comparisons of Current Survey & 2001 Census
Area of Residence (%)
11.2
48.2
5.4
35.3
11.26.0
32.4
50.5
0
10
20
30
40
50
60
Downtown Central York Region Other
Current Survey2001 Census
Age Breakdowns (%)
10.9
17.219.8
23.0
29.1
16.0
23.2
14.1
25.421.3
0
5
10
15
20
25
30
35
17-34 35-44 45-54 55-64 65+
Current Survey2001 Census
Education Level (%)
14.3
26.5
36.6
22.7
17.6
27.524.1
30.9
0
5
10
15
20
25
30
35
40
Elementary / High School
Technical/College
UniversityUndergrad
UniversityGraduate
Current Survey2001 Census
4

Religious Affiliation
How do respondents describe themselves Jewishly?
The survey asked respondents to describe
their current denomination and how they
were raised in terms of their affiliation. They
were also asked comparable questions about
their spouse.
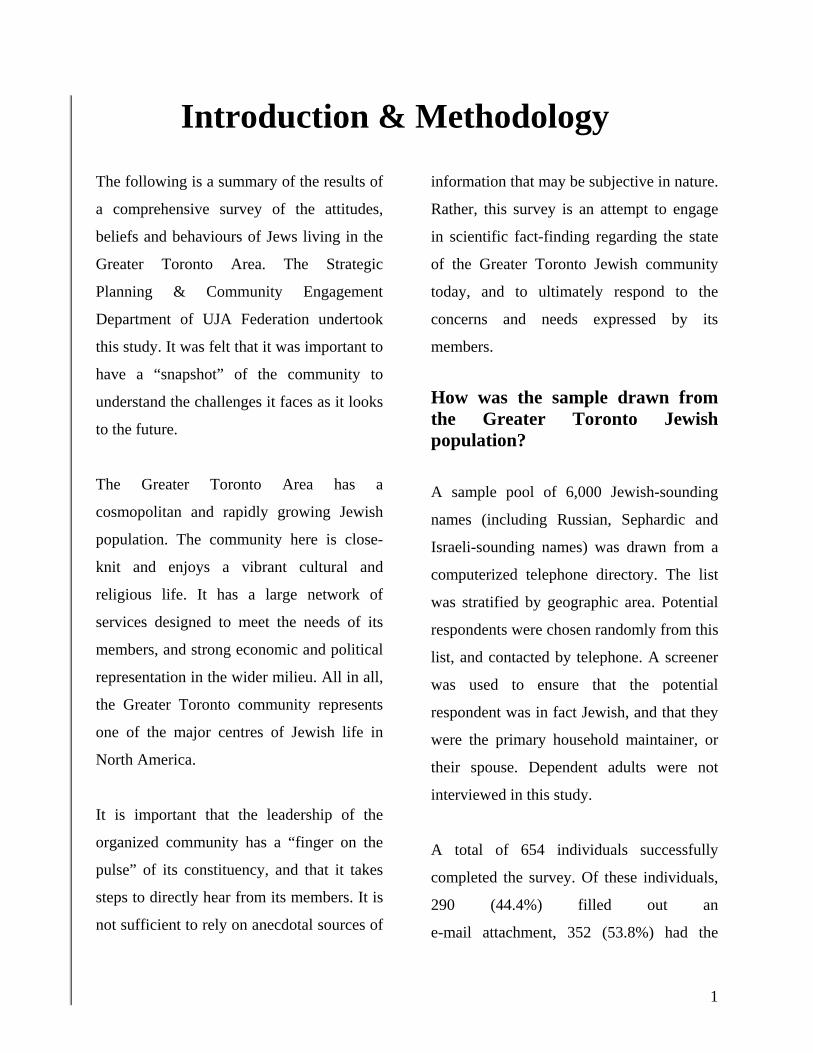
About one in seven respondents (14.2%)
described themselves as Orthodox, 36.9%
said they were Conservative, 18.7% Reform,
and 1.7% Reconstructionist (Figure 2). One
in eleven respondents (9%) were secular
Jews, and 17.2% preferred the more
ambiguous designation of “Just Jewish”. A
very small proportion said they were
Humanist (1.9%) or Jewish New Age
(0.5%). All in all, there was a remarkable
variability in terms of the affiliations of
Greater Toronto Jews.
It should be noted that the question of
denominational affiliation is based on self-
identification. Many individuals often
ascribe their affiliation according to the
denomination of their synagogue, and this
does not necessarily imply a perfect
correlation between affiliation and level of
ritual adherence.
Some individuals have chosen to self-
identify using a more ambiguous
designation, such as “Just Jewish”. In the
present study, an effort was made to be as
inclusive as possible by including non-
mainstream affiliations, such as “Humanist”
and “Jewish New Age”. It was felt that such
choices were appropriate given the varied
expressions of “Jewishness” in modern life.
In other communities across North America,
the proportions of Orthodox range from 1%
to 22.2%. The 14.2% Orthodox obtained in
this study is at the high end of the
distribution. In fact, only Montreal (22.2%)
and Baltimore (20%) have higher
percentages of Orthodox Jews than the
Toronto community. On the other hand,
New York (13%), Miami (9%), Los Angeles
(4%), Philadelphia (4%), and San Francisco
(3%) have lower percentages of Orthodox.
The proportion of Orthodox Jews in the
United States is 10%.
5
The level of Conservative affiliation varies
from 15% to 48% for communities across
the continent. The Toronto community is in
the middle of the distribution with 36.9%.
The level of Conservative affiliation in the
United States is 27%, somewhat below the
Toronto figure. It is 29.7% for the Montreal
community.
In terms of Reform Jews, the proportion
varies from 22% to 60% for communities
across the United States. According to the
National Jewish Population Survey (2000-
2001), 35% of American Jews affiliate with
Reform. The levels of Reform Jews are
much lower in Canadian cities, such as
Toronto (18.7%) and Montreal (4.5%).
Finally, regarding Jews who don’t affiliate
with any mainstream denomination, the
proportions range from 9% to 43% across
North American communities. The
percentage of unaffiliated is very high in
the West Coast of the continent, in cities
such as Seattle (43%) and San Francisco
(36%). It is 26% for the United States as a
whole. The Toronto figure for unaffiliated
Jews (28.6%) is in the middle of the
distribution, similar to the percentage for
Montreal (28.1%).
Figure 2
Denomination of Respondents (%)
14.2%
36.9%
18.7%
26.2%
4.1%
OrthodoxConservativeReformSecular / Just JewishOther
6

In summary, the Jewish community of
Toronto has a high level of Orthodox Jews
relative to other North American
communities, is in the middle of the
distribution as far as Conservative and
unaffiliated Jews are concerned, and has a
lower percentage of Reform Jews as
compared to American communities.
Have the denominations of respondents changed since their childhood?
In terms of how respondents were raised,
23% said they were raised as Orthodox,
39.9% as Conservative, 10.8% as Reform,
0.3% as Reconstructionist, 1.1% as
Humanist, 16.4% as Just Jewish and 6.8% as
secular. It is evident that when one compares
current to childhood affiliation, there is a
smaller proportion of Orthodox, a similar
proportion of Conservatives, and greater
percentages of Reform, secular and “Just
Jews”.
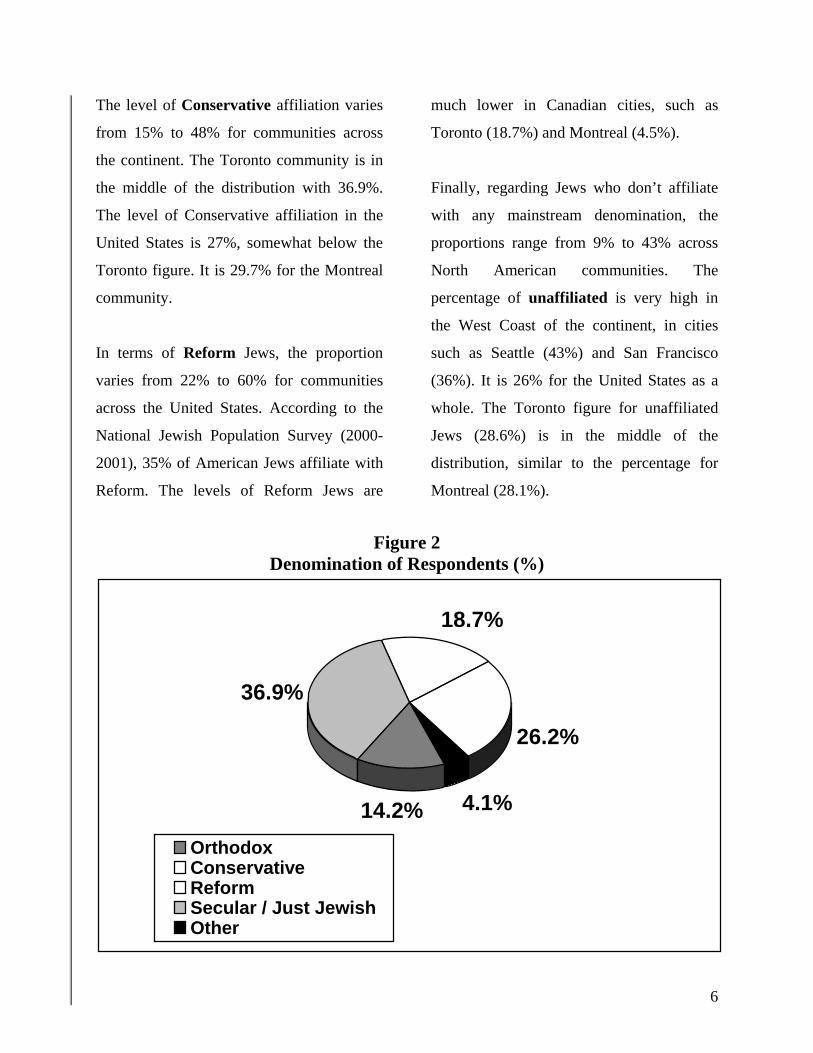
A closer examination of the interaction
between current and childhood affiliations
reveals some interesting trends (Figure 3).
Of 144 respondents who said they were
raised as Orthodox Jews: 41% retained their
affiliation, 47.9% became Conservative,
6.9% became Reform, and 4.2% became
Secular / Just Jews. Of those who were
raised as Conservative Jews: 8.9% became
Orthodox, 58.1% retained their affiliation,
17.5% became Reform, and 15.4% became
Secular / Just Jews.
Of those who were raised as Reform Jews:
3% became Orthodox, 10.6% became
Conservative, 72.7% retained their
affiliation, and 13.6% became Secular / Just
Jews. Finally, of those who were raised as
Secular or Just Jews, 4.2% became
Orthodox, 11.2% became Conservative,
11.2% became Reform, and 73.4% retained
their lack of affiliation.
In summary, the most significant
“migration” of affiliation appears to be from
Orthodox to Conservative. The greatest level
of adherence to their upbringing seems to be
among Secular / Just Jews (73.4%), but
there is also a high level of adherence
among Reform Jews (72.7%). Very few
among those who were raised as Reform or
Secular / Just Jews migrated to the other end
of the religious spectrum and became
Orthodox.
7
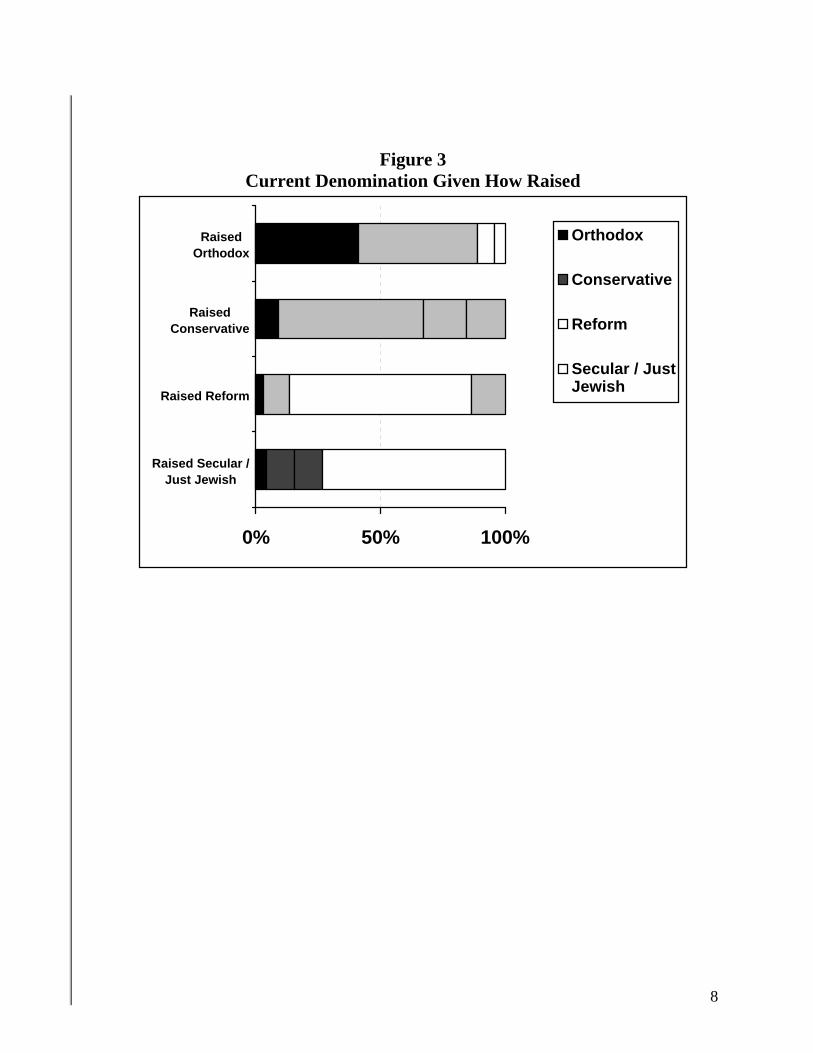
Figure 3 Current Denomination Given How Raised
0% 50% 100%
Raised Secular /Just Jewish
Raised Reform
RaisedConservative
RaisedOrthodox
Orthodox
Conservative
Reform
Secular / JustJewish
8

Synagogue Attendance & Membership
The role of the synagogue in Jewish
communal life is critical. The synagogue
remains a central meeting place for Jews of
all denominations. It has traditionally been a
place of spiritual communion, although now
it can be said to be as much a focal point for
social and educational, as well as spiritual,
activities.
Membership in a synagogue does not
necessarily imply a high rate of attendance.
For some Jews, simply being a member and
attending on the High Holidays, is the extent
of their participation in Jewish life.
How often do respondents attend synagogue?
The majority of respondents attend only on
High Holidays, or on High Holidays and a
few other times (50.8%) (Figure 4). 17.2%
attend only on special occasions, and 8.3%
attend very rarely or never. In short, about
three-quarters (76.3%) of Toronto Jews do
not attend synagogue on a regular basis.
A small percentage (4.5%) attend at least
once a month, 5.8% several times a month,
8.3% about once per week, and 5.1% more
than once per week. Thus, about one in four
respondents (23.7%) attend synagogue
regularly.
The level of regular synagogue attendance
(at least once per month) varies from 9% to
31% across Jewish communities in North
America. Toronto Jews are in the middle of
the distribution as far as regular synagogue
attendance is concerned (23.7%). The
Montreal figure is 23.4%, almost identical to
the Toronto figure of 23.7%.
What segments of the community attend synagogue most often? A “High-Low Analysis” of the percentage
distribution of attendance across various
variables reveals that certain segments of the
Jewish community are much more likely to
attend synagogue regularly (at least once per
month) than others (Figure 5). Not
surprisingly, individuals with high levels of
ritual adherence (77.3%) and the Orthodox
(70.7%) are particularly likely to attend
synagogue regularly.
9

Figure 4 Level of Synagogue Attendance (%)
13.4%10.3%
50.8%17.2%
8.3%
At least once per wk At least once per monthHigh Holidays Special OccasionsRarely / Never
Figure 5 Attends Synagogue at Least Once a Month (%)
“High-Low Analysis” of Selected Segments
1.92.73.06.18.2
26.826.8
34.070.7
77.3
0 20 40 60 80 100
Intermarried
Low Ritual Adherence
Secular / Just Jewish
Birthplace FSU
Lives in Downtown
35-44 Years
Hsld Income > $125K
Birthplace E. Europe
Orthodox Jews
High Ritual Adherence
Note: Only the five segments with the highest and lowest percentages are included in this chart.
10
Other segments with higher levels of
synagogue attendance include those born in
Eastern Europe (34%), those living in
households earning at least $125K (26.8%),
those between 35-44 years of age (26.8%),
and those living in Central Toronto (26.7%).
At the other end of the continuum,
respondents least likely to regularly attend
synagogue include those living in
intermarried households (1.9%), those with
low levels of ritual adherence (2.7%), those
who are Secular / Just Jews (3%), those born
in the Former Soviet Union (6.1%), and
those who live in Downtown Toronto
(8.2%).
Also less likely to attend synagogues
regularly are divorced or separated persons
(8.3%), those who live in “Other Areas” of
Greater Toronto (8.6%), those who are
single (11.3%), and Reform Jews (15.7%).
These breakdowns are instructive because
they suggest that there are several distinct
groups who may feel distant from
synagogue life. Aside from those who are
not observant, there is an association
between being less likely to regularly attend
synagogue, and being intermarried, an
immigrant from the FSU, not living in
traditionally Jewish neighbourhoods, and
having no spouse or family.
What is the level of synagogue membership in greater Toronto? Individuals sometimes indicate their
synagogue membership on the basis of
attendance, rather than on whether or not
they pay dues. To avoid such a
misunderstanding, the choices in the current
questionnaire took these perceptions into
account.
Half of respondents (49.6%) report they are
paying members of a synagogue. A smaller
percentage (11.2%) consider themselves
members, but do not pay. Finally, 39.2% are
not members at all.
Which segments of the community are more likely to be synagogue members? A “High-Low Analysis” of those who are
paying synagogue members reveals the
following: The highest levels of membership
are found among those with high ritual
adherence (84.4%), the Orthodox (77.2%),
Conservative Jews (66.5%), those living in
households earning at least $125K (66.4%),
Jews living in Central Toronto (56.4%),
widowed individuals (56.4%), persons with
11

university graduate degrees (55.7%) and
non-immigrants (54.7%) (Figure 6).
The above profile is similar to that found for
synagogue attendance. There are certain
segments of the community who have very
low levels of synagogue membership. Aside
from those who are not observant to begin
with, it seems that synagogue membership is
less accessible to those who are
intermarried, those who do not live in
traditionally Jewish neighbourhoods, those
who are not married and/or do not have a
family, recent immigrants, and those who
live in low-income households.
The lowest levels of membership are found
among Secular / Just Jews (10.1%), those
living in intermarried families (13%), those
living in “Other Areas” of Greater Toronto
(14.3%), those whose place of birth is the
FSU (16.7%), single individuals (17.7%),
divorced or separated persons (20.8%),
recent immigrants (23.9%), those with low
ritual adherence (31%), and those living in
households earning under $40K (33.3%).
Figure 6 Paid Synagogue Membership (%)
“High-Low Analysis” of Selected Segments
10.113.014.316.717.7
56.466.466.5
77.284.4
0 20 40 60 80 100
Secular / Just Jews
Intermarried
Lives in "Other Areas"
Birthplace FSU
Single Individuals
Lives in Central TO
Hsld Income > $125K
Conservative Jews
Orthodox Jews
High Ritual Adherence
Note: Only the five segments with the highest and lowest percentages are included in this chart.
12

Ritual Observance
The tendency of Jews in North America has
been to assimilate toward the dominant
culture around them. Particularly in the
United States, research has shown that with
every generation the commitment to uphold
traditions has diminished. Jews have
increasingly identified themselves along
ethnic and cultural lines, rather than
according to the strict observance of Jewish
law.
For example, even Jews with a tenuous
commitment to their heritage, will usually
take part in important symbolic ritual
practices. Some of the best examples are the
Jewish rites of passage (such as
circumcision, Bar / Bat Mitzvah, Jewish
wedding, funeral). The emphasis of this type
of expression is communal and ethnic
solidarity. Keeping the Sabbath or the laws
of kashrut are no longer seen to be as
fundamental as marrying a fellow Jew and
maintaining some form of ethnic identity.2
In Canada, as in other countries, certain
ritual practices are more popularly observed
than others. The rituals that more people
practice include Passover Seder, Chanukah,
and the High Holidays.3 These rituals occur
only once a year and are not as demanding
to observe as many other Jewish
requirements. Both Chanukah and the
Passover Seder reinforce solidarity through
large family gatherings. In addition, both
holidays contain aspects of ritual behaviour
which directly involve and attract children.
This helps parents pass on their Jewish
identity to their offspring.
What are the levels of ritual observance in the Toronto Jewish community?
What is the percentage of individuals who
light Shabbat candles? About a third
(33.4%) of respondents said they light
candles “all the time”, 13.6% said “usually”,
25.7% said “sometimes”, and 27.3% said
“never” (Figure 7). In short, almost half
(47%) of the sample said they light Shabbat
candles “usually” or “all the time”.
The percentage of respondents who said
they light Shabbat candles “usually” or “all
the time” ranges from 13% to 50.8%, among
Jewish communities in North America. The
overall level in the United States is 28%.
13

Toronto (47%) has the second highest level
of adherence to this ritual in North America,
following Montreal (50.8%).
Figure 7
Observance Levels of Specific Rituals (%) Percent Responding Always or Usually
0 20 40 60 80 100
SeparateDishes
ChanukahCandles
PassoverSeder
ShabbatCandles
Always
Usually
In terms of attending a Passover Seder,
85.4% of respondents said they attend “all
the time”, 6.6% said “usually”, 6% said
“sometimes”, and 2% said “never” (Figure 7).
In short, the great majority of the sample
(92%) said they attend a Passover Seder
“usually” or “all the time”.
The level of attendance (“usually” or “all the
time”) for Passover Seders ranges from 62%
to 95% across Jewish communities in North
America. The overall level in the United
States is 77%. The Toronto level (92%) is at
the high end of the distribution, with only
Montreal (95%) having a higher percentage.
Almost three-quarters (71.1%) of
respondents said they light Chanukah
candles “all the time”, 13.1% said
“usually”, 8.2% said “sometimes”, and 7.7%
said “never” (Figure 7). In other words, the
great majority of respondents (84.2%)
observe lighting Chanukah candles
“usually” or “all the time”.
14

The level of respondents lighting Chanukah
candles “usually” or “all the time” varies
from 59% to 95% for communities across
North America. The overall level for the
United States is 66%. Toronto is at the high
end of the distribution (84.2%), with only
Boston (95%) and Montreal (88.5%) having
higher levels.
Finally, almost three-quarters of the sample
(71.7%) said they fast on Yom Kippur,
whereas 28.3% said they do not. The United
States level for fasting on Yom Kippur is
46%.
Do respondents observe kashrut, and how does that compare to their parents?
In terms of keeping kosher at home, 22.4%
of respondents said they keep “strictly
kosher”, 28% said “somewhat kosher”, and
49.5% said “not at all”. The levels for
keeping kosher outside the home are
lower. Only 10.2% keep “strictly kosher”
outside the home, whereas 23.5% keep
“somewhat kosher” and 66.3% do not keep
kosher at all.
What percentage of respondents keep kosher
in and out of the home? Only one in ten
(10.1%) keep strictly kosher both in and out
of the home. This would suggest that there
is generally a low level of strict kashrut
observance among respondents.
The survey also asked respondents whether
their parents kept a kosher home. A third
(33.2%) said their parents kept a “strictly
kosher” home, 29% said “somewhat
kosher”, and 37.7% said “not at all”. When
the level of kosher observance of
respondents is compared to that of their
parents, it seems that the level of this
practice has declined somewhat across
generational lines.
For instance, less than a quarter of
respondents currently keep a “strictly
kosher” home, compared to a third of their
parents. Half of respondents do not keep
kosher at all, compared to just over a third of
their parents.
A further analysis reveals that of
respondents whose parents kept a “strictly
kosher” home: 44.8% currently keep a
“strictly kosher” home, 30.7% “somewhat
kosher”, and 24.5% “not kosher at all”
(Figure 8). Of those whose parents observed
a “somewhat kosher” home: 14.8% currently
keep a “strictly kosher” home, 47.3%
“somewhat kosher” and 37.9% “not kosher
15

What other rituals do Toronto Jews practice?
at all”. Finally, of those whose parents did
not keep kosher at all: 8.2% currently keep a
“strictly kosher” home, 10.7% “somewhat
kosher”, and 81.1% “not kosher at all”.
The above examined the level of observance
of the most widely practiced rituals. Certain
practices are less common among Jewish
households. Some, such as fasting on the
Feast of Esther, are practiced by only a
small minority of individuals.
What do these findings suggest? As far as
kashrut observance in the home is
concerned, if the parents kept strictly kosher
at home, the chances were far greater that
their children would as well. Nonetheless, a
remarkable proportion (55.2%) have
diverged from the strictly kosher practices of
their parents.
Regarding having separate dishes at home,
36% of respondents in the present study said
“all the time”, 2.8% said “usually”, 4.3%
said “sometimes” and 57% said “never”. In
short, just over a third of respondents keep
separate dishes at home “usually” or “all the
time”.
Figure 8 Current Level of Kashrut Observance Given How Raised
0% 20% 40% 60% 80% 100%
Raised not at allKosher
RaisedSomewhat
Kosher
Raised StrictlyKosher
StrictlyKosherSomewhatKosherNot at allKosher
16

Regarding avoiding work on Shabbat,
24.9% of respondents said they do and
75.1% said they do not. It is not clear
whether respondents generally interpreted
this question in a religious sense, because
some may not work or exert themselves on
Shabbat for other reasons.
Do respondents keep a Christmas tree at home?
Whether or not a Jewish household has a
Christmas tree at home has been taken as an
indication of their level of assimilation to
Christian culture and traditions. A very low
proportion (4.3%) of respondents said they
have a Christmas tree “all the time”,
whereas 1.9% said “usually”, 4.1% said
“sometimes”, and 89.7% said “never”. In
short, the great majority of respondents
never have a Christmas tree, but about one
in ten (10.3%) have a tree at least
sometimes.
Fasting on the Feast of Esther is observed
by 7.5% of respondents, whereas 92.5% do
not fast on this holiday. Finally, a small
proportion (8%) of male respondents said
they put on tfillin daily, whereas 92% do
not.
These latter two rituals are often considered
part of an Orthodox way of life. However,
only 45.3% of Orthodox respondents said
they fast on the Feast of Esther, and only
40% of Orthodox males said they put on
tfillin daily. This finding suggests that a
person’s perceptions of their level of
religiosity may not necessarily reflect their
actual behaviours. This issue will be
examined more extensively in the next page,
looking at the Ritual Adherence Index.
The levels of having a Christmas tree “all
the time”, “usually” or “sometimes” range
from 5% to 33% across North American
Jewish communities. Toronto is at the low
end of the North American distribution
(10.3%), with only Montreal (5.8%) and
South Palm Beach (5%) having lower
proportions.
Which segments of the local community
tend to have a Christmas tree at home “all
the time” or “usually”? The highest
percentage is found among respondents
living in intermarried families (50%),
followed by those born in the Former Soviet
Union (25.6%), those who immigrated
17

between 1990-2004 (23.8%), and those
living in “Other Areas” of Greater Toronto
(22.9%).
Also tending to have higher levels of having
Christmas trees at home include respondents
considering themselves as Secular / Just
Jews (15.1%), those living in Downtown
Toronto (12.7%), those 35-44 years
(11.9%), and those with low levels of ritual
adherence (11.8%).
How do various denominations score on a measure of ritual adherence? Adapting a technique from Fishman &
Goldstein (1993)4, a “Ritual Adherence
Index” was developed to measure a
respondent’s level of ritual observance, or
adherence to various Jewish customs and
traditions. The Index was constructed as a
composite of fourteen practices, including
synagogue attendance. Because these
practices varied in intensity and frequency,
they were given different weights.
For example, fasting on Yom Kippur was
given a score of 5, yet keeping kosher at
home was assigned a score of 10. This was
done not to minimize the importance of
fasting on Yom Kippur, but rather, to
emphasize a wider commitment to
upholding various traditions. The maximum
score possible for this Adherence Index was
100. Only one respondent of 654 actually
attained this maximum score, whereas 17
had a score of zero.
As expected, Orthodox Jews had the highest
mean score on this index (68.22), whereas
Conservative and Reform Jews had mean
scores of 35.18 and 21.12, respectively.
Reconstructionist Jews had a mean score of
24.18, slightly higher than Reform, but
below that of Conservatives. Secular
respondents had a score of 13.14, and those
who were “Just Jews” had a score of 12.54.
Finally, Humanists had a slightly higher
score (15.75) than Secular Jews.
A question remains as to why those who
claimed to be “Orthodox” did not score
higher on this index, receiving a mean of
68.22. An explanation relates to the high
standard deviation registered by Orthodox
respondents (23.78). The standard deviation
(SD) is a measure of variability of scores. A
high SD suggests that while some
individuals may identify themselves as
Orthodox, they do not necessarily lead an
Orthodox lifestyle, and do not necessarily
translate their self-identification into actual
practice.
18
Why do individuals identify themselves as
“Orthodox”, yet do not necessarily follow
rituals that reflect a high level of adherence?
The answer is complex. Some persons are
members of an Orthodox Shul and identify
themselves according to this affiliation;
whereas others were brought up as Orthodox
and may continue to see themselves as such,
despite the fact that their level of practice is
not consistent with that of their parents. The
bottom line is, when it comes to religious
identification, how people see themselves
may not necessarily correspond to how they
actually behave.
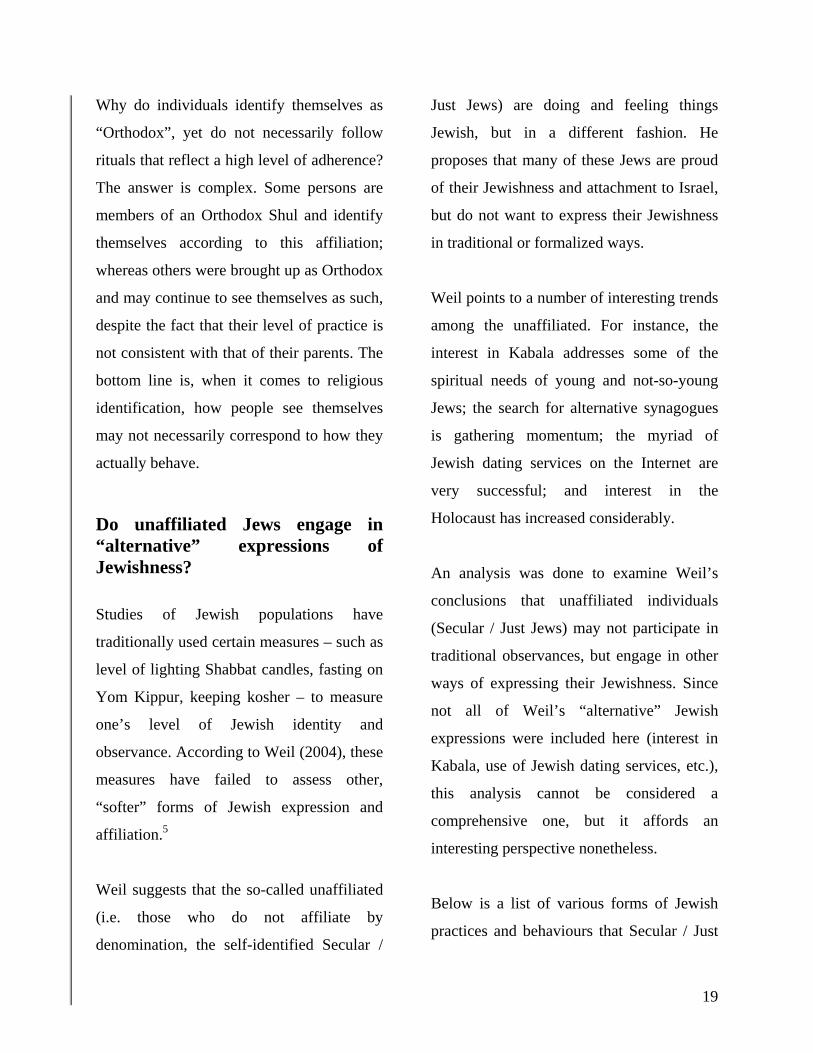
Do unaffiliated Jews engage in “alternative” expressions of Jewishness?
Studies of Jewish populations have
traditionally used certain measures – such as
level of lighting Shabbat candles, fasting on
Yom Kippur, keeping kosher – to measure
one’s level of Jewish identity and
observance. According to Weil (2004), these
measures have failed to assess other,
“softer” forms of Jewish expression and
affiliation.5
Weil suggests that the so-called unaffiliated
(i.e. those who do not affiliate by
denomination, the self-identified Secular /
Just Jews) are doing and feeling things
Jewish, but in a different fashion. He
proposes that many of these Jews are proud
of their Jewishness and attachment to Israel,
but do not want to express their Jewishness
in traditional or formalized ways.
Weil points to a number of interesting trends
among the unaffiliated. For instance, the
interest in Kabala addresses some of the
spiritual needs of young and not-so-young
Jews; the search for alternative synagogues
is gathering momentum; the myriad of
Jewish dating services on the Internet are
very successful; and interest in the
Holocaust has increased considerably.
An analysis was done to examine Weil’s
conclusions that unaffiliated individuals
(Secular / Just Jews) may not participate in
traditional observances, but engage in other
ways of expressing their Jewishness. Since
not all of Weil’s “alternative” Jewish
expressions were included here (interest in
Kabala, use of Jewish dating services, etc.),
this analysis cannot be considered a
comprehensive one, but it affords an
interesting perspective nonetheless.
Below is a list of various forms of Jewish
practices and behaviours that Secular / Just
19

Jews claim they maintain “sometimes”,
“often” or “all the time”. Questions that only
require yes / no responses (such as whether
they fast on Yom Kippur) were also
included for comparison purposes. Finally,
also included to round out the profile were
questions related to membership in Jewish
organizations and Jewish volunteerism.
Belong to a Jewish organization 20.1 Keep kosher at home 17.9 Volunteer for a Jewish organization 15.1 Keep kosher outside home 11.4
It can be seen that certain religious customs
(such as attending a Passover Seder or
lighting Chanukah candles) are prominent in
the lives of the great majority of unaffiliated
Jews, although they may not interpret these
practices in strictly religious ways (see also
Figure 9). Reading about Israel / Jewish
subjects is another way that the majority of
unaffiliated individuals connect to Judaism,
suggesting an underlying interest in
“keeping in touch” with their faith or what is
happening in the Jewish world generally.
Jewish Practices and Behaviours of the Unaffiliated: %
Attend Passover Seder 93.4 Light Chanukah candles 77.2 Read about Israel/Jewish subjects 63.9 Fast on Yom Kippur 42.9 Eat in Jewish / kosher restaurants 38.7 Listen to Jewish / Israeli music 38.6 Light candles on Friday night 36.1 Donation to non-UJA Jewish charities 35.8 Watch Israeli / Jewish films 33.7 Donation to UJA 28.3 Rallies / political activities for Israel 23.5
Figure 9 Jewish Practices & Behaviours of the Unaffiliated (%)
28.333.735.836.138.638.7
42.963.9
77.293.4
0 20 40 60 80 100
Donate to UJA
Watch Israeli/Jewish Films
Donate non-UJA Jewish Causes
Light Shabbat Candles
Listen Jewish/Israeli Music
Eat Jewish/Kosher Restaurants
Fast on Yom Kippur
Read Israel/Jewish Subjects
Light Chanukah Candles
Attend Passover Seder
20

The Jewish Education of Respondents
Throughout history, Jews have placed a high
value on education. There is no doubt this is
one of the contributing factors to the
unprecedented occupational and financial
success enjoyed by North American Jews. It
can be argued that in modern times the
traditional dedication to religious education
among Jews has been applied to secular
studies. Indeed, Jews are disproportionately
represented in the professional fields.
This is not to say that Jews have abandoned
their commitment to religious education.
Jewish day school is still seen as a priority
among North American communities. In
fact, a childhood Jewish education has been
identified as playing a significant role in
terms of instilling the values and beliefs that
form essential ingredients of one’s
“Jewishness”.
Studies in the United States and Canada
have shown that a Jewish day school
education positively impacts on a person’s
adherence to Jewish customs, their level of
involvement with Jewish organizations,
raising one’s own children Jewishly,
resisting intermarriage, and supporting Israel
in a variety of ways.6
What percentage of respondents have received a formal Jewish education?
Respondents were asked whether they ever
received any type of Jewish education,
including attending Jewish day schools,
attending Jewish supplementary schools,
receiving private tutoring, or pursuing post-
secondary Jewish studies. More than three-
quarters (79.2%) of respondents said they
received some type of Jewish education, and
20.8% said they did not.
The levels of formal Jewish education
among adults range from 65% to 87% across
North American communities, with an
overall level of 73% for the United States.
The Toronto community is in the middle of
the distribution, with 79.2%.
What groups of respondents in the present
study were most likely to have had a Jewish
education? The highest levels of Jewish
education were found among those with
21
high ritual adherence (91.3%), households
with incomes above $125K (90.6%), male
respondents (89%), Orthodox Jews (89%),
and those with a university undergraduate
degree (87.4%).
Least inclined to have had a Jewish
education were those born in the Former
Soviet Union (36.7%), those who
immigrated between 1990-2004 (48.9%),
Secular / Just Jews (62.1%), those 55-64
years (67.4%), and widowed individuals
(69.1%).
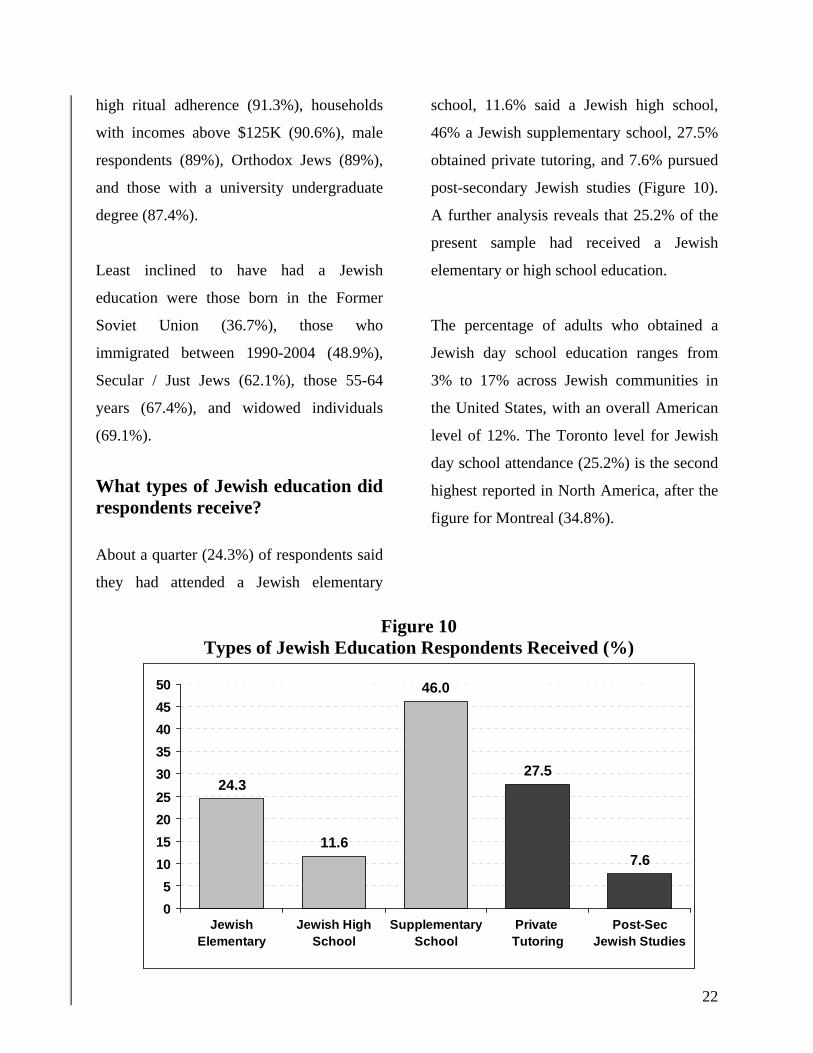
What types of Jewish education did respondents receive?
About a quarter (24.3%) of respondents said
they had attended a Jewish elementary
school, 11.6% said a Jewish high school,
46% a Jewish supplementary school, 27.5%
obtained private tutoring, and 7.6% pursued
post-secondary Jewish studies (Figure 10).
A further analysis reveals that 25.2% of the
present sample had received a Jewish
elementary or high school education.
The percentage of adults who obtained a
Jewish day school education ranges from
3% to 17% across Jewish communities in
the United States, with an overall American
level of 12%. The Toronto level for Jewish
day school attendance (25.2%) is the second
highest reported in North America, after the
figure for Montreal (34.8%).
Figure 10
Types of Jewish Education Respondents Received (%)
24.3
11.6
46.0
27.5
7.6
05
101520253035404550
JewishElementary
Jewish HighSchool
SupplementarySchool
Private Tutoring
Post-SecJewish Studies
22

The Jewish Education of Children
What types of Jewish education did the children of respondents ever receive?
A number of important issues have recently
arisen regarding the system of Jewish
schools in the Greater Toronto area. For
instance, while the proportion of children
attending Jewish day schools has increased
in the past fifteen years, the proportion
attending supplementary schools has
decreased, leading to a small overall decline
in the percentage of children receiving
Jewish education of any kind.7
Almost half (45.2%) of respondents said
their children have had a Jewish elementary
school education, 19% said their children
have had a Jewish high school education,
46.6% said a Jewish supplementary
education, 53% private tutoring, and 10.5%
post-secondary Jewish studies (Figure 11). As well, many families cannot afford to send
their children to Jewish day schools. The
situation is exacerbated by the fact that
currently there is no provincial funding to
support private education.
A further analysis reveals that 47% of
respondents reported that their children have
received a Jewish day school (elementary
and/or high school) education. According to
the National Jewish Population Survey
(2000-2001), 29% of children of
respondents have had a Jewish day school
education in the United States, a figure
significantly below that of the local findings.
Another consideration is that there is an
under-representation of enrolment among
the children of Jewish immigrants in the day
school system. They represent a source of
new vitality, and an important link for the
future continuity of the community, yet
many are not furthering their Jewish
education.
The segments of the present sample most
inclined to have children who have attended
Jewish day schools include the Orthodox
(83.8%), those with high levels of ritual
adherence (78.8%), those living in
households with an income of at least
$125K (56.5%), those between 45-54 years
The present study sought to lend further
insights into some of these issues.
23
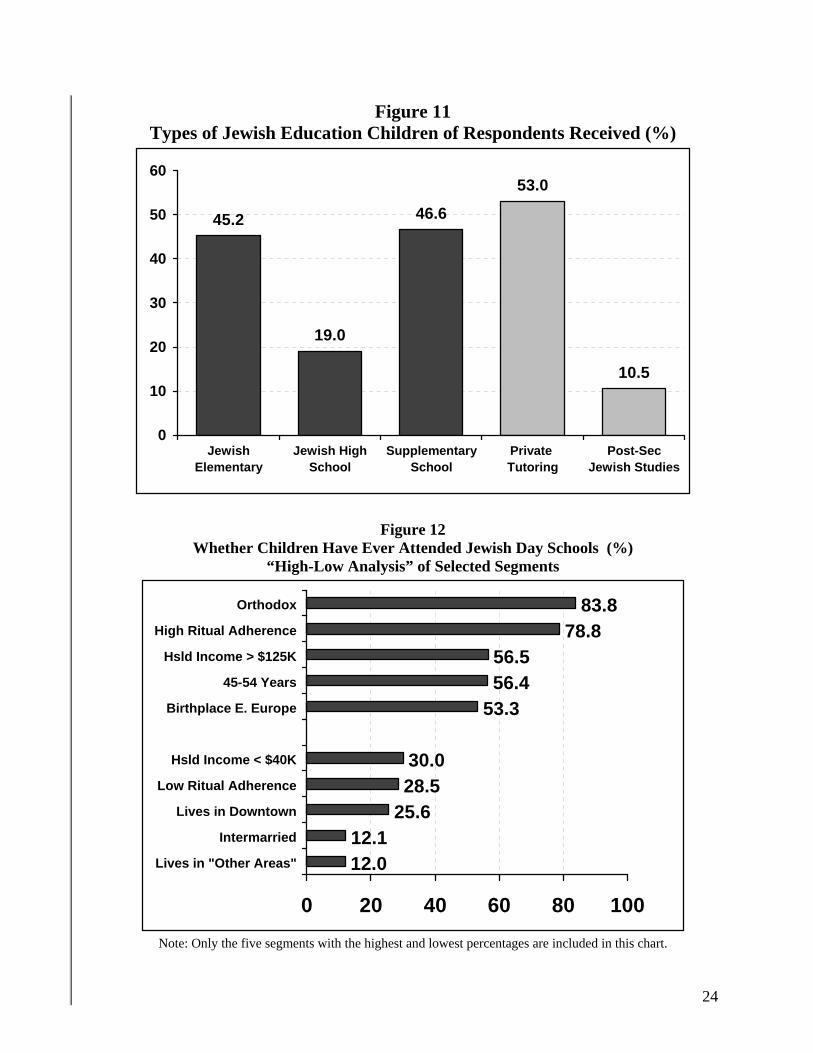
Figure 11 Types of Jewish Education Children of Respondents Received (%)
45.2
19.0
46.6
53.0
10.5
0
10
20
30
40
50
60
JewishElementary
Jewish HighSchool
SupplementarySchool
Private Tutoring
Post-SecJewish Studies
Figure 12 Whether Children Have Ever Attended Jewish Day Schools (%)
“High-Low Analysis” of Selected Segments
12.012.1
25.628.530.0
53.356.456.5
78.883.8
0 20 40 60 80 100
Lives in "Other Areas"
Intermarried
Lives in Downtown
Low Ritual Adherence
Hsld Income < $40K
Birthplace E. Europe
45-54 Years
Hsld Income > $125K
High Ritual Adherence
Orthodox
Note: Only the five segments with the highest and lowest percentages are included in this chart.
24

of age (56.4%), and those whose place of
birth is Eastern Europe (53.3%) (Figure 12).
Least inclined to have had their children
attend Jewish day schools are those who live
in “Other Areas” of Greater Toronto (12%),
intermarried individuals (12.1%), those who
live in the downtown area (25.6%), those
who have low ritual adherence (28.5%),
those living in households earning under
$40K (30%), and those living in households
earning $75K-$124K (30.5%).
It is clear that the most prominent
associations related to whether or not
respondents have had their children attend
Jewish day schools include geographic
proximity to Jewish neighbourhoods,
whether the parents are intermarried or not,
the level of household ritual observance,
and the economic status of the household.
Are the children of respondents currently attending Jewish or non-Jewish schools?
Of 184 respondents with children 6-18
years, 63 (34.2%) said their children
currently attend Jewish day schools, 100
(54.3%) said they attend non-Jewish public
schools, 12 (6.5%) said non-Jewish private
schools, 6 (3.3%) said Jewish and public
schools, and 3 (1.6%) said public and
private schools.
The level of children currently attending
Jewish day schools ranges from 6% to 26%
for Jewish communities across the United
States. Among Canadian centres, Montreal
(64%) has a higher level of children
currently attending Jewish day schools than
Toronto (34.2%), although since the survey
was done in Montreal, the community has
seen a diminishment in the size of its
mainstream day school population.
What types of respondents are currently
sending their children to Jewish day
schools? The Orthodox have the highest
percentage of children attending Jewish day
schools (80.5%), followed by those with a
high level of ritual adherence (76%), those
who live in Central Toronto (45.1%), those
who immigrated before 1990 (43.5%), and
respondents with a university graduate
degree (43%).
Least inclined to have children currently
attending Jewish day schools are those who
live in “Other” areas of Greater Toronto
(0.0%), those living in the downtown area
(5.9%), intermarried individuals (6.3%),
those living in households earning between
25

$40K-$74K (6.3%), those born in the
Former Soviet Union (6.7%), and
individuals who are divorced or separated
(10%).
It seems that location of residence has a
strong association with whether or not
parents currently send their children to
Jewish day schools. It is interesting that
middle-income families earning between
$40K-$74K also have a low percentage of
children attending Jewish day schools. In
addition, only a small percentage (6.7%) of
respondents born in the FSU have their
children enrolled in a Jewish day school.
Why have parents chosen not to send their children to a Jewish day school?
The major reason parents gave for not
having their child attend a Jewish day school
was that they wanted the child to socialize in
a wider social milieu (42.1%). Financial
constraints were likewise an important issue
for many parents (41.3%).
Other reasons mentioned were that: Jewish
education was not a priority for the
respondent (20.7%); their child was not
interested (14.9%); their child was not able
to cope with the workload (9.9%); and
adequate transportation was not available
(9.1%). More reasons for not enrolling the
child in Jewish day schools included:
academic supports were insufficient (5.8%);
the day school in their area was too religious
(5.8%); and their spouse did not agree with
such a choice (5.8%).
The above were multiple-choice
alternatives, but some parents had further
reasons for not sending their child to a
Jewish day school, which they indicated in
an open-ended format. These reasons
included (frequencies in parentheses): The
child’s needs were not being met in a Jewish
school (3), and the child had special needs /
learning disabilities (2). Single responses
included: The child did not have a choice of
campus; the spouse was not Jewish; the child
was not Jewish; parent wanted French
immersion for their child; parents didn’t
attend a Jewish day school; parent had no
personal faith and wasn’t sure what kind of
religious orientation should be provided for
the child; would like to send child to non-
religious Jewish school similar to Israeli high
schools; half the public school is Jewish
anyway.
Interestingly, none of the reasons mentioned
above were critical of the quality of
26

Those most likely to provide supplementary
education for their children included Reform
Jews (67.7%), those with moderate levels of
ritual adherence (64.9%), those living in
Central Toronto (60.5%), and non-
immigrants (60.3%).
education provided in the Jewish day
schools. On the other hand, an issue for
some parents was that their child could not
cope with the difficulty of the curriculum
(perhaps suggesting there is not sufficient
help for those students struggling with an
extensive workload).
Least likely to provide supplementary
education for their children included
respondents born in the Former Soviet
Union (16.7%), those who immigrated
between 1990-2004 (18.7%), those who live
in “Other Areas” of Greater Toronto
(22.2%), and Secular / Just Jews (28.1%).
Financial issues were also a significant
reason as to why some parents did not send
their children to a Jewish day school. The
issue of not being able to afford a Jewish
education for their children is a difficult one
for some families. In terms of reinforcing
later Jewish identity, it is an open question
as to whether household observance can
sufficiently compensate for the lack of a
formalized Jewish education, given the
pressures of assimilation inherent in modern
life.
It seems that for those households where
adherence levels are moderate,
supplementary education is seen as an
alternative to Jewish day schools. It also
appears that recently immigrated Jewish
families are the least inclined to consider
alternative Jewish education for their
children.
Are children who are not attending a Jewish day school receiving a supplementary education?
About half (48.3%) of parents whose
children were not attending Jewish day
schools said their children were receiving a
supplementary education, and 51.7% said
they were not.
Interestingly, a third (33.3%) of intermarried
respondents are providing a supplementary
education for their children who are not
attending Jewish day schools. This is an
important finding which suggests that at
least some Jewish parents in intermarried
27

28
households want to provide Jewish exposure
for their children.
Why have parents chosen to send their children to a Jewish day school? Parents were asked to specify why they have
chosen to send their children to a Jewish day
school. It was hoped that some insights
would be gained into what made a Jewish
day school education important and
attractive for parents. Note that more than
one response was allowed.
Of 63 respondents, 45 (71.4%) said that it
was to teach Jewish values and provide
Jewish grounding for the future of their
children; 27 (42.9%) said it was to provide a
sense of Jewish identity; 12 (19%) said these
were quality schools with high standards; and
7 (11.1%) said to provide an introduction to
Judaism for their child.
Have children attended a Jewish camp in the last five years?
Parents were asked whether their children
(6-18 years) had attended a Jewish camp in
the last five years. The majority (54.6%) of
parents said their children had attended a
Jewish camp. More specifically, 14.6% said
a Jewish day camp, 23.8% a Jewish sleep
over camp, and 16.2% said both. Less than
half (45.4%) said their children had not
attended a Jewish camp. It should be noted
that the percentage of children attending
Jewish camps (54.6%) may be inflated
because some parents considered certain
non-denominational camps with high Jewish
enrolment as Jewish camps.
A further analysis revealed that of children
not attending Jewish day schools: 47.1%
attended Jewish camps in the last five years,
and 52.9% did not. In short, almost half of
children who were not enrolled in Jewish
days schools attended Jewish camps. It would
seem that camps provide an important Jewish
milieu for many children who might
otherwise not have it through Jewish schools.

Intermarriage Until the 1960’s North American Jews
showed a strong tendency to marry within
their own ethnic / religious group. That
decade saw a significant increase in
intermarriages. According to the National
Jewish Population Survey (2000-2001) the
intermarriage rate of American Jews married
between 1996-2001 is approximately 47%
(the rates are lower in Canada).8
While intermarriage rates are lower for Jews
than for most other ethnic groups in Canada,
given the particularly low fertility rates
among Jews, and the increasing levels of
assimilation, intermarriage represents a
serious threat for Jewish continuity.
Unfortunately, intermarriage levels derived
from the present study must be interpreted
cautiously. The methodology of using
Jewish-sounding names likely excluded
women who married outside the faith and
assumed their husband’s name. Also,
because no information was obtained
regarding the year respondents were
married, rates cannot be calculated as a
function of time period, as they are in the
National Jewish Population Survey of 2000-
2001.
What intermarriage & conversion levels were found among respondents?
Despite the limitations of methodology
described above, intermarriage levels were
calculated for the sample. Of 489
respondents who were married or living in
common law arrangements, 55 (11.2%) said
their spouse was not Jewish. In short, more
than one in ten couples were intermarried.
The intermarriage level varies from 5% to
47% across communities in the United
States, with an overall American rate of
31%. The Toronto level (11.2%) is at the
low end of the distribution, with only Jewish
communities in Rhode Island (8%) and
Atlantic County (New Jersey) (5%) having
lower figures.
In terms of the conversion status of the
spouse, of 79 respondents and spouses in the
present study who were raised as non-Jews,
24 (30.4%) converted to Judaism, and 55
(69.6%) did not. In other words, a
29
significant majority did not convert to
Judaism.
The conversion rate of 30.4% found in the
current study is at the high end of the
distribution as far as Jewish communities
across North America are concerned. The
rates range from 10% in Buffalo to 50% in
Montreal. The conversionary rates for some
major American Jewish communities
include: 15% in Seattle, 19% in
Philadelphia, 21% in Los Angeles, and 28%
in Miami.
If we total the status of the 489 couple
households considered in the present study:
55 (11.2%) are intermarried, 24 (4.9%) are
conversionary in-marriages, and 410
(83.8%) are in-marriages between two born
Jews.
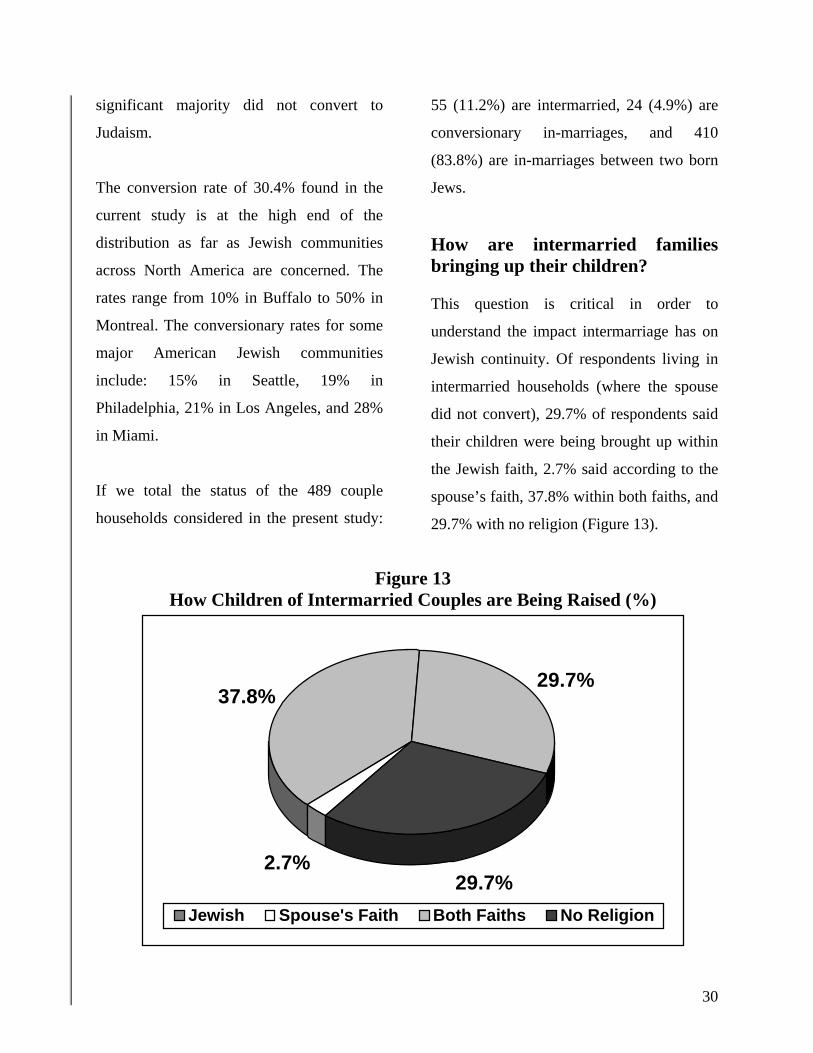
How are intermarried families bringing up their children? This question is critical in order to
understand the impact intermarriage has on
Jewish continuity. Of respondents living in
intermarried households (where the spouse
did not convert), 29.7% of respondents said
their children were being brought up within
the Jewish faith, 2.7% said according to the
spouse’s faith, 37.8% within both faiths, and
29.7% with no religion (Figure 13).
Figure 13 How Children of Intermarried Couples are Being Raised (%)
29.7%2.7%
37.8%29.7%
Jewish Spouse's Faith Both Faiths No Religion
30

These findings suggest that in an
intermarried household, the religion of the
non-Jewish spouse does not necessarily take
precedence. Rather, in the majority of cases
(67.5%), either both religions have equal
weight, or no religion is emphasized. In
either case, there is no doubt that Jewish
exposure is more limited for the children
involved. This is also borne out by the low
levels of affiliation reported by respondents
living in intermarried households, across the
various measures of Jewish identification
and adherence described in this study.
How would respondents react if their child was considering marrying a non-Jew? If their child was considering marrying a
non-Jew, the majority of respondents
(51.4%) would actively oppose such a
marriage, and would express their opinion
openly; 12.1% would oppose the union, but
would not express their opinion; 16.7%
would be neutral about the matter; 10.3%
would support it openly; and 9.5% are not
sure. In short, 63.5% would oppose such a
marriage.
Most likely to oppose such a marriage were
those with high ritual adherence (96.5%),
Orthodox Jews (96.3%), those with
elementary or high school as their highest
level of education (78.9%), those born in
Eastern Europe (76.2%), and widowed
individuals (74.4%).
Least likely to oppose such a marriage were
intermarried individuals (0%), those living
in “Other Areas” of Greater Toronto (24%),
those living in Downtown Toronto (27.5%),
Secular / Just Jews (39.8%); those with low
ritual adherence (45%); and divorced /
separated individuals (51.4%). It is clear
that, given their personal circumstances,
intermarried individuals had the least basis
for opposition to such a union.
What if their child considered marrying
someone who would convert? About one in
ten respondents (10.9%) would actively
oppose such a marriage, and would express
this opinion openly; 5.2% would oppose
such a union, but would not express their
opinion; 14.9% would be neutral about the
matter; 57.5% would support the marriage
openly; and 11.5% were not sure. In short,
respondents were much more conciliatory
toward such a marriage when the eventuality
of conversion was introduced.
31

32
What proportion of respondents have children who have intermarried? More than a quarter (28.6%) of respondents
said their children had married non-Jews,
and 71.4% said their children had not. The
figure of 28.6% can be taken as a very rough
measure of the intermarriage rate among
young adult Jews, although some of these
young adults may no longer be living in the
Greater Toronto area.
Those most likely to say their children had
married non-Jews included individuals
living in “Other Areas” of Greater Toronto
(80%), intermarried individuals (64.3%),
Secular / Just Jews (45.7%), Reform Jews
(38.1%), and those with low levels of ritual
adherence (38%).
The fact that 80% of respondents who live
well outside the sphere of Jewish
neighbourhoods have children who married
non-Jews, suggests that such geographic
detachment from the community may be
associated with lower levels of affiliation
and connection that stretch across even
generational lines. It is also evident that
children who are raised in intermarried
families, are more likely to intermarry
themselves.
Would single respondents consider dating or marrying a non-Jew?
Single and divorced respondents were asked
whether they currently date Jews, non-Jews
or both. In terms of single respondents,
25.9% said they only date Jews, 1.7% said
only non-Jews, 51.7% both Jews and non-
Jews, and 20.7% don’t date. In short, the
majority of single individuals are open to
dating non-Jews. Regarding divorced
individuals, 22% said they only date Jews,
2.4% said only non-Jews, 36.6% date both
Jews and non-Jews, and 39% don’t date.
Would single individuals consider marrying
a non-Jew? 59.6% said yes, whether the
individual converted or not; 21.1% would
consider marriage only if the individual
converted; and 19.3% would not consider it
under any circumstances. In other words,
about 60% of single respondents consider
intermarriage a viable option for their future.
In terms of divorced persons, 58.1% would
consider marriage to a non-Jew, whether the
person converted or not; 16.3% would
consider it only if the person converted; and
25.6% would not consider it under any
circumstances. As with single individuals,
the majority of divorced persons consider
intermarriage a viable option.

Organizational & Informal Affiliations
One expression of a community’s
cohesiveness relates to the involvement of
its members in its organizations and
institutions. Whereas synagogues were once
the traditional meeting places for Jews,
secular organizations are now the social and
cultural focus for many individuals.
What percentage of respondents belong to Jewish organizations? A quarter of respondents (25%) said they
belong to a Jewish organization, fraternity or
club, and 75% said they do not. Respondents
most inclined to belong to a Jewish
organization included widowed individuals
(49.1%), those whose place of birth was
Eastern Europe (46.8%), respondents 65+
years (40%), those with elementary /high
school as their highest level of education
(39.8%), and those who live in Central
Toronto (32.2%). In short, seniors seem to be
most inclined to belong to Jewish
organizations, particularly if they have lost
their spouse.
Least inclined to belong to Jewish
organizations were those living in “Other
Areas” of Greater Toronto (6.1%),
intermarried individuals (7.7%), those whose
place of birth was the Former Soviet Union
(10.2%), those who immigrated between
1990-2004 (13%), those living in York
Region (18.1%), and single individuals
(18.3%).
It seems that location of residence,
intermarried status, and recent immigration
are three variables that are strongly
associated with whether or not a person
belongs to Jewish organizations.
Interestingly, residents from York Region
have a relatively low percentage of
membership, possibly because they have a
large representation of immigrants (FSU
Jews and Israelis) in their midst.
How strong are the informal affiliations of respondents?
Almost half (44.6%) of respondents said “all
or almost all” of their close friends are
Jewish, 34.2% said “most” are Jewish,
15.2% said “some” are Jewish, 3.7% said
“few” are Jewish, and 2.3% said “none” are
Jewish. In short, there is a high degree of
33

What are the affiliation patterns of the children of respondents?
Jewish association in the friendship patterns
of respondents. Almost 80% said that at
least most of their friends are Jewish.
About a quarter (23.7%) of parents (with
children living at home) said their children
belong to Jewish youth groups, and 76.3%
said they do not.
The segments of respondents most inclined
to say “all or almost all” of their closest
friends are Jewish in the present study,
include the Orthodox (78%), those with high
levels of ritual adherence (76.4%), those
with elementary or high school as their
highest level of education (68.2%), widowed
individuals (60%), and those living in York
Region (60%).
To which youth groups did respondents say
their children belong? Frequencies are in
parentheses (n=44). The most common
youth group mentioned was NCSY (12),
followed by B’nai Akiva (9). Three
mentions were given for: Bnos, NELFTY,
and Hashomer Hatzair. Two mentions were
given for BBYO. Single responses were
given for: Abir Yaakob Youth Program,
Agudah, Habonim Dror, LOTTSY, USY,
and Young Judea.
Least inclined to say “all or almost all” of
their friends are Jewish include intermarried
individuals (0%), those living in “Other
Areas” of Greater Toronto (11.4%), those
living in Downtown Toronto (13.7%), single
persons (19.4%), and Secular / Just Jews
(25.6%).
Almost half of respondents (43%) said that
“all, or almost all” of their children’s friends
are Jewish, 26.3% said “most” are Jewish,
21.5% said “some” are Jewish, 5.4% said
“few” are Jewish, and 3.8% said “none” are
Jewish. In short, almost 70% said that “all”
or “most” of their children’s friends are
Jewish.
About three-quarters (75.7%) of respondents
said they feel “very close” to the Jewish
people, 19.9% said “somewhat close”, 2.9%
said “a little close”, 1.2% said “not close at
all”, and 0.3% were unsure. In short, the
great majority of respondents feel very
connected to the Jewish people, and a very
small percentage feels little or no
connection.
34

Volunteerism & Philanthropic Behaviour The spirit of “tzedakah” (charity) is an
integral part of the Jewish way of life. Jews
are obligated, both spiritually and morally,
to assist fellow Jews who are needy, who
cannot look after themselves, or who are
experiencing distress in some way. Giving
charity is a duty that cannot be forsaken
even by those who are themselves in need.
Some sages have said that tzedakah is the
highest of all commandments.
Respondents most likely to have volunteered
for a Jewish organization include those with
high ritual adherence (54.3%), the Orthodox
(52.7%), those living in households earning
at least $125K (36.8%), those with a
university graduate degree (36.4%), and
those with a university undergraduate degree
(35.5%) (Figure 14). It seems that volunteer
activity is more prevalent among those who
are most observant, affluent and educated.
The Toronto Jewish community has
historically risen to the challenge of looking
after its most vulnerable segments. This has
been made possible by the generosity of its
members, both in terms of financial
donations, and their contributions of time,
effort and expertise as lay leaders and
volunteers. Such dedication ensures that the
local community remains a vibrant and
cohesive one.
Least likely to have volunteered for a Jewish
organization were respondents living in
“Other Areas” of Greater Toronto (2.9%),
intermarried individuals (9.4%), those born
in the Former Soviet Union (14.6%), Secular
/ Just Jews (15.1%), single persons (18%),
and divorced / separated individuals
(19.1%). These are also among the least
affiliated segments of the Toronto Jewish
community.
Almost one in four respondents (22.3%)
have volunteered for a non-Jewish
organization in the past year, whereas 77.7%
have not. This level of volunteerism is lower
than that for Jewish organizations (30.6%).
What is the level of volunteerism among respondents?
Almost a third of respondents (30.6%) have
volunteered for a Jewish organization in the
past year, and 69.4% have not.
35

Figure 14 Has Volunteered for a Jewish Organization (%)
“High-Low Analysis” of Selected Segments
2.99.4
14.615.1
18.0
35.536.436.8
52.754.3
0 20 40 60
Lives in "Other Areas"
Intermarried
Birthplace FSU
Secular / Just Jewish
Single Persons
Univ Undergrad Degree
University Grad Degree
Hsld Income >$125K
Orthodox
High Ritual Adherence
.
Figure 15 Segments Most Inclined to Have Volunteered
for a Non-Jewish Organization (%)
28.2
28.8
30.3
31.1
34.7
38.0
0 10 20 30 4
17-34 Years
Intermarried
University GradDegree
Single
Reform Jew
Lives inDowntown
0
36

37
Which segments of respondents were most
inclined to volunteer for non-Jewish
organizations (Figure 15)? The highest
percentages were reported by those living in
Downtown Toronto (38%), followed by
Reform Jews (34.7%), single individuals
(31.1%), those with a university graduate
degree (30.3%), intermarried individuals
(28.8%), and those 17-34 years (28.2%).
Least inclined to volunteer for a non-Jewish
organization were those born in the Former
Soviet Union (4.2%), those living in
households earning less than $40K (6.3%),
those who immigrated between 1990-2004
(6.5%), those with elementary / high school
as their highest education (6.7%), and the
Orthodox (12.2%).
It seems that those who are most educated
have high levels of volunteer activity for
both Jewish and non-Jewish organizations.
Younger and single adults prefer donating
their time to non-Jewish causes. Immigrants
from the Former Soviet Union seem least
inclined to volunteer for any organization.
What percentage of respondents contribute to United Jewish Appeal? Almost half of the sample (48.2%) said they
donated to United Jewish Appeal in the past
year; 30% said they did not donate, but had
in the past; and 21.8% said they had never
donated.
Respondents most inclined to give to UJA in
the current study were those living in
households earning at least $125K (67.2%),
those with high levels of ritual adherence
(65.1%), seniors (62.4%), those born in
Eastern Europe (60.4%), widowed
individuals (60%), those with moderate
levels of ritual adherence (59%),
Conservative Jews (59%), and those living in
Central Toronto (56.1%) (Figure 16).
Least inclined to give to UJA included those
living in “Other Areas” of Greater Toronto
(12.1%), single persons (16.1%), those who
immigrated between 1990-2004 (20%),
intermarried individuals (22.6%), those living
in households that earn under $40K (27.7%),
Secular / Just Jews (28.3%), those 17-34
years (28.6%), and those born in the Former
Soviet Union (30.6%). Also reporting low
levels of giving to UJA were divorced /
separated individuals (31.3%), and those
living in Downtown Toronto (33.3%).
It is clear that geographic area of residence,
age of respondent, immigration status, level
of affiliation, economic condition, and

Figure 16 Has Contributed to UJA (%)
“High-Low Analysis” of Selected Segments
12.116.1
20.022.6
27.7
60.060.462.4
65.167.2
0 20 40 60 80
Lives in "Other Areas"
Single Persons
Immigrated 1990-2004
Intermarried
Hsld Income <$40K
Widowed Individuals
Birthplace E. Europe
65+ Years
High Ritual Adherence
Hsld Income >$125K
.
Figure 17 Segments Most Inclined to Have Donated to Non-Jewish Charities (%)
84.3
85.3
85.7
86.1
91.2
80 82 84 86 88 90 92
Univ UndergradDegree
Conservative Jew
Reform Jew
Lives inDowntown
Hsld Income>$125K
38
marital status interact to determine the
percentage of UJA donors among
respondents. There are certain segments of
the community that whether due to their stage
of life, or lack of affiliation, do not support
the federation financially. Some of these
groups represent challenges for donor
outreach initiatives.
What proportion of respondents donated to other Jewish organizations? Aside from UJA, 59.6% of respondents
donated to other Jewish charities, and 40.4%
did not. Respondents mentioned more than
80 organizations as targets for giving. The
level of giving to other Jewish organizations
(59.6%) was higher than that for UJA
(48.2%).
Segments of respondents most inclined to
donate to other Jewish causes included those
with high levels of adherence (86.5%), the
Orthodox (82.2%), widowed individuals
(79.6%), seniors (74.1%), those born in
Eastern Europe (73.9%), and those living in
households earning at least $125K (68.6%).
Least inclined to donate to other Jewish
charities included those living in “Other
Areas” of Greater Toronto (18.2%),
intermarried individuals (30.2%), single
persons (30.6%), those 17-34 years (31%),
those who immigrated between 1990-2004
(33.3%), and Secular / Just Jews (35.8%).
What percentage of respondents donated to non-Jewish charities? More than three-quarters (77.8%) of
respondents said they donated to non-Jewish
charities, whereas 22.2% said they did not.
The percentage giving to non-Jewish
charities was higher than that reported for
United Jewish Appeal (48.2%), and for other
Jewish charities (59.6%).
Most inclined to donate to non-Jewish
charities were those in households earning at
least $125K (91.2%), those living in
Downtown Toronto (86.1%), Reform Jews
(85.7%), Conservative Jews (85.3%), and
those with a university undergraduate degree
(84.3%) (Figure 17).
Least likely to contribute to non-Jewish
charities were respondents born in the
Former Soviet Union (38.3%), those who
immigrated between 1990-2004 (43.2%),
those living in households earning under
$40K (52.3%), single persons (60%), and
those 17-34 years of age (60.3%).
39

40
What are the overall giving patterns of respondents? Only a small minority of the sample (13%)
did not donate to any charity. This seems to
suggest that the Jewish community is
generally a generous group when it comes to
supporting various causes. More than a third
of the sample (35%) donated to all three
types of charities (UJA, other Jewish, and
non-Jewish).
A very small proportion (1.6%) donated
only to UJA, whereas 4.7% donated only to
other Jewish charities, and 16.9% gave only
to non-Jewish charities. This finding
suggests that UJA donors tend to give to
other charities as well. But respondents who
give to non-Jewish charities are less inclined
to give to Jewish ones as well.
Finally, 3.2% of the sample donated to both
UJA and other Jewish causes; 8.9% to UJA
and non-Jewish charities; and 16.8% gave to
other Jewish and non-Jewish causes. There
is a greater tendency for other Jewish causes
to overlap with non-Jewish causes, than is
the case for other combinations.
These findings suggest that non-donors to
UJA can be divided into the following
groups: those who donated only to non-
Jewish charities (16.9%); those who donated
to other Jewish & non-Jewish charities
(16.8%); those who did not donate at all
(13%); and those who donated to other
Jewish charities only (4.7%). If one totals
the percentage share of donors for the three
types of charities, non-Jewish causes clearly
provide the most competition to UJA for
donor dollars.

Service Awareness &Use
UJA Federation of Greater Toronto provides
funding for a wide range of services and
programs, designed to meet the needs of a
large and growing Jewish community. It is
important for the Federation to determine
whether members of the community are
aware of available services, and whether
they are using them. An additional question
looked at what respondents think should be
the main priorities for the local Jewish
community in the next five years.
Are respondents aware of community services? Respondents were given a list of 23 Jewish
programs and organizations, and asked to
indicate whether they had heard of them or
not (Table 1). The level of awareness ranged
from 16.7% to 90.5%. The great majority of
respondents had heard of the Bathurst Jewish
Community Centre (90.5%). This is not
surprising since it is a central address for
Jewish services in Greater Toronto. There
was also a very high level of recognition for
the Canadian Jewish Congress (87%), and
Jewish Family & Child Service (81.7%).
Also showing high levels of recognition
were: Hillel (77.4%), the Holocaust Centre of
Toronto (76.5%), Reena (72.8%), the
Bernard Betel Centre for Creative Living
(69%), BBYO (65.1%), Jews for Judaism
(63.9%), and the Board of Jewish Education
(62.4%). More than half of the sample
recognized the Jewish Public Library
(58.7%), followed by Jewish Immigrant Aid
Services (57.3%), and the Miles Nadal JCC
(56%).
Less than half of respondents have heard of
the Ashkenaz Festival (47.7%), the Jewish
Camp Council (46.5%), Jewish Russian
Community Centre (46.2%), Jewish
Information Service (45.3%), JVS Toronto
(44%), and Circle of Care (36.5%). Less than
a third of respondents have heard of Toronto
Jewish Free Loan Cassa (30.3%), the Ontario
Jewish Archives (28.1%), Israel Experience
Center (22.9%), and the Kehilla Residential
Programme (16.7%).
Of a total of 654 respondents, 14 (2.1%) were
not familiar with any services or
organizations; 74 (11.3%) were familiar with
1-5; 150 (22.9%) were familiar with 6-10;
180 (27.5%) were familiar with 11-15; and
236 (36.1%) were familiar with 16-23. In
short, more than a third of the sample had a
41
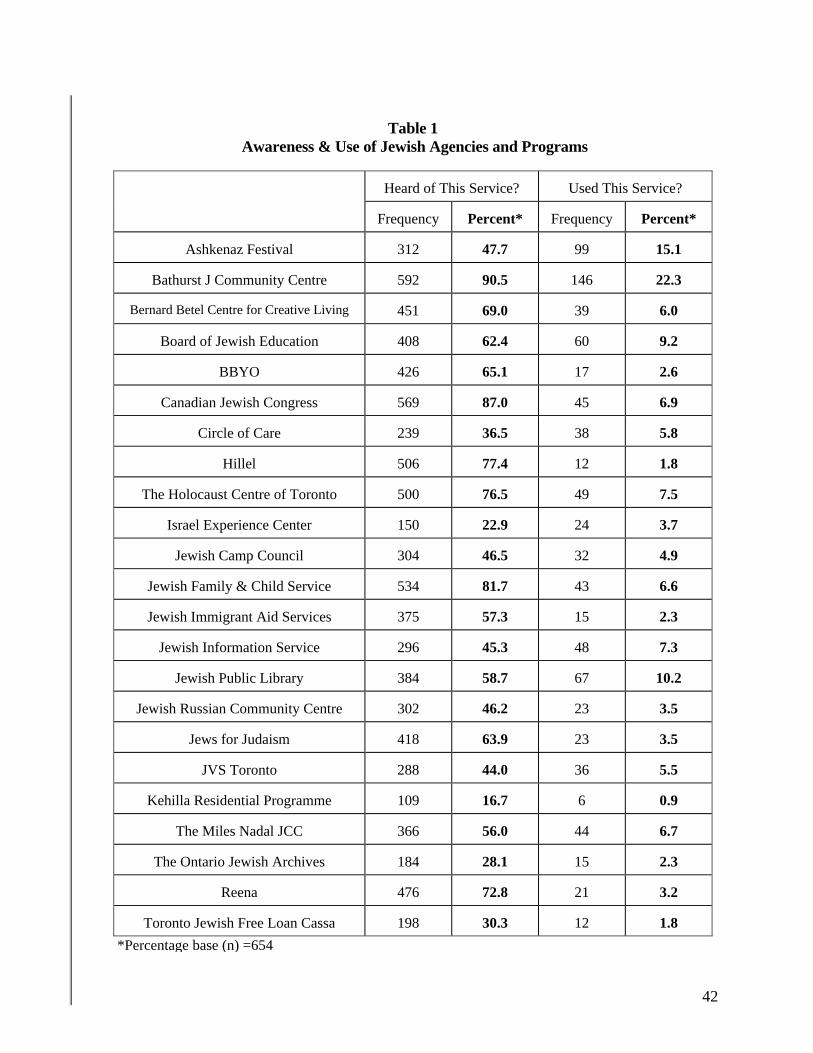
Table 1
Awareness & Use of Jewish Agencies and Programs
42
Heard of This Service? Used This Service?
Percent* Percent* Frequency Frequency
47.7 15.1 Ashkenaz Festival 312 99
90.5 22.3 Bathurst J Community Centre 592 146
69.0 6.0 451 39 Bernard Betel Centre for Creative Living
62.4 9.2 Board of Jewish Education 408 60
BBYO 426 65.1 2.6 17
87.0 6.9 Canadian Jewish Congress 569 45
36.5 5.8 Circle of Care 239 38
Hillel 506 77.4 1.8 12
76.5 7.5 The Holocaust Centre of Toronto 500 49
22.9 3.7 Israel Experience Center 150 24
46.5 4.9 Jewish Camp Council 304 32
81.7 6.6 Jewish Family & Child Service 534 43
57.3 2.3 Jewish Immigrant Aid Services 375 15
45.3 7.3 Jewish Information Service 296 48
58.7 10.2 Jewish Public Library 384 67
46.2 3.5 Jewish Russian Community Centre 302 23
63.9 3.5 Jews for Judaism 418 23
44.0 5.5 JVS Toronto 288 36
16.7 0.9 Kehilla Residential Programme 109 6
56.0 6.7 The Miles Nadal JCC 366 44
28.1 2.3 The Ontario Jewish Archives 184 15
Reena 476 72.8 3.2 21
30.3 1.8 Toronto Jewish Free Loan Cassa 198 12 *Percentage base (n) =654

43
high level of recognition of community
agencies and organizations.
The recognition scores of respondents were
totalled across various segments of the
community, to develop a profile of the
Jewish public’s awareness of programs and
services. For instance, respondents with the
highest mean awareness scores were those
with high levels of ritual adherence (15.92),
followed by the Orthodox (15.08), those with
moderate levels of ritual adherence (14.43),
Conservative Jews (14.42), those born in
Eastern Europe (14.30), widowed individuals
(14.27), and those 65+ years (13.95).
Least familiar with community services and
organizations were those living in “Other
Areas” of Greater Toronto (6.57), those born
in the Former Soviet Union (7.57), those who
immigrated between 1990-2004 (8.00),
intermarried individuals (8.09), single persons
(8.87), Secular / Just Jews (9.21), those living
in Downtown Toronto (9.82), those 17-34
years (10.15), and those with low levels of
ritual adherence (10.74). It is clear that
individuals who are more geographically
isolated from the Jewish community, and
recent immigrants, are among the least aware
of community programs and services.
Which community services do respondents use? Respondents were asked whether they had
used various Jewish community services in
the last two years (Table 1). The Bathurst
Jewish Community Centre had the highest
level of reported use, by 146 of 654
respondents, or 22.3%. The next highest level
of use was reported for the Ashkenaz
Festival, by 99 individuals, or 15.1% of
respondents. The next highest level of use
was recorded for the Jewish Public Library,
by 67 persons, or 10.2% of the sample.
Fewer individuals said they used the Board of
Jewish Education (60), the Holocaust Centre
of Toronto (49), Jewish Information Service
(48), Canadian Jewish Congress (45), The
Miles Nadal JCC (44), and Jewish Family &
Child Service (43). Also registering a lower
level of use were: Bernard Betel Centre for
Creative Living (39), Circle of Care (38),
JVS Toronto (36), Jewish Camp Council
(32), Israel Experience Center (24), the
Jewish Russian Community Centre (23),
Jews for Judaism (23), and Reena (21).
The lowest levels of use were indicated for
BBYO (17), Jewish Immigrant Aid Services
(15), the Ontario Jewish Archives (15), Hillel

(12), Toronto Jewish Free Loan Cassa (12),
and the Kehilla Residential Program (6).
Of a total of 654 respondents, 298 (45.6%)
did not report use of any service or
organization; 134 (20.5%) used one service;
81 (12.4%) used two services; 66 (10.1%)
used three services; 28 (4.3%) used four
services; and 47 (7.2%) used five or more
services (Figure 18). In short, almost half of
the sample did not use any services, whereas
about a fifth used at least three community
services.
It is important to note that some community
services are only geared to certain
subpopulations, such as the elderly, the
disabled, or immigrants. On the other hand,
some organizations are mandated to serve the
community as a whole and not solely specific
populations. Finally, the survey findings
reflect self-reported usage and may thus
result in an under-reporting by those
individuals not wishing to disclose services
they or their families may have utilized.
Hence, the fact that a significant proportion
did not use Jewish services is not necessarily
an indication of the level of need or quality of
the services offered, but may simply reflect
the specificity of the populations involved or
under-reporting by respondents.
Figure 18 Level of Use of Jewish Community Organizations & Services (%)
45.6%
20.5%12.4%
10.1%
4.3%
7.2%
None One Two Three Four Five or More
44

Which segments were most inclined to use
community services and organizations?
Those with high ritual adherence had the
highest level of use (mean=2.07
organizations used), followed by individuals
17-34 years (1.99), those living in households
earning $40K-$74K (1.93), the Orthodox
(1.87), those living in Central Toronto (1.65),
and those with moderate levels of ritual
adherence (1.63).
Least inclined to use services were
respondents living in “Other Areas” of
Greater Toronto (0.66), those living in
Downtown Toronto (0.70), intermarried
individuals (0.89), Secular / Just Jews (0.91),
those with low levels of ritual adherence
(1.01), individuals living in households
earning under $40K (1.02), those 35-44 years
(1.13), those who immigrated between 1990-
2004 (1.15), and single persons (1.19). In
short, it is evident that location of residence
has the most prominent association with
lower service use.
What concerns does the community feel its leadership should focus upon?
Respondents in the present survey were
asked to indicate which local concerns they
think should be major priorities for the
Toronto Jewish community in the next five
years. A list of 13 items was provided, and
the respondent had to choose the five most
important priorities.
Figure 19 is a summary of their responses.
The most important priority mentioned by
respondents was “services for the elderly”
(68.5%), followed by “fighting local
antisemitism” (67.4%), and “services for the
Jewish poor” (63.3%). These three areas
received significantly higher priority ratings
than the rest of the items.
The next highest ratings were for “Jewish
education” (43.7%) and “services for
children or adults with disabilities” (41.4%).
These two items placed in the middle of the
distribution, and although not as highly rated
as the above categories, they nonetheless
received significantly higher scores than the
items below.
The next highest rated items were:
“promoting Jewish culture / arts” (27.4%),
“supporting youth groups for teens and
young adults” (26.9%), “providing security
for local Jewish community institutions”
(25.7%), “outreach to Jewish students on
university / college campuses” (24.9%), and
“Jewish political advocacy” (24.2%).
45

The lowest ratings were reported for:
“integration of immigrants into the Jewish
community” (20%), “outreach to unaffiliated
Jews” (18.5%), and “supporting synagogue
activities” (8%).
46
Respondents were asked whether there were
other services, not mentioned in the above
list, that they felt represented priority
concerns for them. Two individuals each
mentioned: “making Jewish education more
affordable” and “the need for job
promotion”. The following single responses
were given: “free, or pay as you can, access
to Temple on holidays”, “outreach to the
Jewish gay community”, “cemetery
maintenance”, “support groups for needy
families”, “more accurate publicity or news
regarding Israel”, and “strengthen Diaspora-
Israel relations, with programs such as
Birthright”.
Other single responses included: “programs
and services for Jewish singles”,
“wheelchair provisions at most Jewish
facilities”, “tutoring programs for special
needs children”, “programs dealing with
violence / abuse of women and children”,
“advocating on behalf of Jews regarding
social justice issues in the greater society”.
Figure 19 Community Priorities & Concerns Specified by Respondents (%)
20.024.224.925.726.927.4
41.443.7
63.367.468.5
0 20 40 60 80
Integration of Immigrants
Jewish Political Advocacy
J. Students in Univ/College
Security for Local J. Organiz
Supporting Youth Groups
Jewish Culture / Arts
Services for Disabled
Jewish Education
Services for Jewish Poor
Fighting Local Antisemitism
Services for Jewish Elderly
Note: Figures show the percentage of individuals who considered a specific category to be among the five most important priorities under consideration. “Outreach to Unaffiliated” and “Supporting Synagogue Activities” were not included in the above chart. Their ratings were lower than 20%.

Individuals with Special Needs Little data is available on the prevalence of
special needs individuals in the community,
particularly for all age groups below seniors.
How to respond to the unmet needs of such
individuals through effective intervention
has been a communal focus, especially as
the issue of special needs and inclusion has
come to the forefront of public awareness.
Of the 95 respondents in the present study
who said there was a special needs
individual living in their household, 83
(87.4%) said there was one such person, and
12 (12.6%) said there were two. In short, the
654 sampled households had a total of 107
special needs individuals residing in them.
In terms of the age distribution of the special
needs individuals identified in this study, 14
(13.6%) were between 0-14 years, 21
(20.4%) were 15-34 years, 17 (16.5%) were
35-54 years, 24 (23.3%) were 55-74 years,
and 27 (26.2%) were 75+ years.
What is the incidence and age distribution of individuals with special needs?
Respondents were asked whether there were
any persons with special needs living in
their household. Of 654 respondents, 95
(14.5%) said there was at least one special
needs person living in their household, and
559 (85.5%) said there was not.
Regarding the types of disabilities of the
special needs individuals, 59 (57.8%) had a
physical disability, 18 (17.6%) had an
intellectual disability, 12 (11.8%) had an
emotional disability, 6 (5.9%) had an
intellectual & emotional disability, 4 (3.9%)
had a physical & intellectual disability, 1
(1%) had a physical & emotional disability,
and 2 (2%) had disabilities on all three
levels.
The incidence of special needs among
Jewish communities across North America
varies from 6% to 23% of households.
Particularly high percentages are found
among communities in Florida where there
are large concentrations of Jewish seniors.
The Toronto community falls in the middle
of the distribution (14.5%).
How severe was the disability of the special
needs individual, in terms of impeding their
47

activities of daily life? Of 103 individuals,
21 (20.4%) had a disability which “very
much” impeded their daily life, 59 (57.3%)
had a disability that “somewhat” impeded
their daily life, and 23 (22.3%) had a
disability that did not impede their daily life
at all.
What were the characteristics of children with special needs?
As noted above, 14 of the special needs
individuals identified in this study were
children less than 15 years. Of the 351
children aged 0-14 years residing in the
households sampled in the present study, 4%
were special needs children. This figure can
be regarded as a rough indicator of the
incidence of disability among children less
than 15 years in the Greater Toronto Jewish
community.
However, it should also be noted that
surveys typically underestimate the
incidence of special needs children, firstly
because low-level learning disabilities are
often under-reported, and also because of
the perceived stigma sometimes associated
with such reporting.
Of special needs children less than 15 years
old: 3 had a physical disability, 4 had an
intellectual disability, 2 had an emotional
disability, 3 had an intellectual & emotional
disability, and 1 had disabilities on all three
levels. Calculating the relative incidence of
these different disabilities, of 351 total
children in the present sample of households
(including overlapping disabilities): 1.1%
had a physical disability, 2.3% had an
intellectual disability, and 1.7% had an
emotional disability.
None of the special needs children identified
in this study were “very much” impeded by
their disability in terms of their daily
activities, 10 were “somewhat” impeded,
and 4 were not impeded at all.
Are children with special needs receiving any form of Jewish education?
Of 12 respondents, 9 (75%) said their
special needs child was receiving some form
of Jewish education, and 3 said their child
was not. What types of Jewish education
were these children receiving? Three
respondents said “She’arim”. Two each said
“private tutoring” and “Jewish day school”.
Single responses were given for “special
remediation”, “synagogue / youth groups”,
“Hillel cooperative – Sunday School”, and
“Hebrew school (extra-curricular)”.
48

Closeness to Israel Throughout history, Israel has played a
critical role in the collective consciousness
of Jewish people throughout the world.
North American Jews are no exception.
Research has shown that commitment and
support for Israel, whether it is financial or
ideological, is a central component of the
identity of Jews in North America,
regardless of their individual level of
religiosity.9
North American and Israeli Jews have much
in common. They share a common ancestry
and history that forms the basis of their
identity. Both groups enjoy the unique
position of living in two of the most secure
conditions that Jews, throughout their long
history have ever found themselves.
There are also important differences,
however. North American Jews are a
minority in a multi-ethnic society, in
contrast to Israeli Jews who are a strong
majority in the only Jewish state. Another
important distinction is found in the
different interpretations of Zionism. For
Israeli Jews, Zionism signifies the actual
living or a strong aspiration to live in Israel;
whereas for the North American Jew, it
signifies a strong commitment to Israel, as a
central characteristic of one’s Jewish
identity.10
Have respondents ever been to Israel, and if so, how often?
About three-quarters (73.9%) of respondents
said they have been to Israel, and 26.1% have
not. In short, a significant majority of
respondents have been to Israel at least once.
In terms of cross-community comparisons,
many of the North American Jewish
population surveys ask whether anyone in the
household has been to Israel, a question not
directly comparable to that of the present
study. The level of whether the respondent
has ever been to Israel is 35% for the United
States, a figure significantly below that of the
present finding. For Montreal Jews it is
74.5%, very similar to the Toronto level. All
in all, the local community has among the
highest levels of having been to Israel, of any
Jewish centre in North America.
49

Figure 20 Has Ever Been to Israel (%)
“High-Low Analysis” of Selected Segments
37.158.559.7
63.664.1
83.286.089.1
93.594.5
0 20 40 60 80 100
Lives in "Other Areas"
Intermarried
Single Persons
Hsld Income <$40K
Tech School / College Educ
Immigrated Before 1990
Birthplace E. Europe
Immigrated 1990-2004
Orthodox Jews
High Ritual Adherence
Note: Only the five segments with the highest and lowest percentages are included in this chart.
Figure 21
Number of Times Respondents Have Been to Israel (%)
25.5%
25.2%
15.1%8.4%
25.7%
None Once Twice Three Times Four or More
50

Which segments of respondents were most inclined to have visited Israel at least once?
The most likely were those with high ritual
adherence (94.5%), followed by the
Orthodox (93.5%), those who immigrated
between 1990-2004 (89.1%), those whose
place of birth was Eastern Europe (86%), and
those who immigrated before 1990 (83.2%)
(Figure 20).
Least inclined to have ever visited Israel,
were those living in “Other Areas” of Greater
Toronto (37.1%), intermarried individuals
(58.5%), single persons (59.7%), those living
in households earning under $40,000
(63.6%), those with a technical school /
college education (64.1%), and those with
low levels of ritual adherence (64.4%).
In terms of the number of times respondents
have been to Israel, 25.5% of the sample said
never, 25.2% said once, 15.1% said twice,
8.4% said three times, and 25.7% said at least
four times (Figure 21). Note that the figure
obtained for those who have never been to
Israel (25.5%) is slightly different than the
percentage found in a previous question
mentioned on page 49 (26.1%). The
discrepancy relates to the fact that those who
were born in Israel were not included in the
percentage base of the latter question.
Almost a third (31.9%) of respondents who
had ever been to Israel, said the year of their
last trip was between 2000-2004, about
another third (32.3%) said it was between
1990-1999, 16.6% said between 1980-1989,
16.4% between 1970-1979, and 2.8% before
1970.
Respondents who have not been to Israel in
the last five years were asked why not
(Figure 22). Multiple responses were possible
(n=316). One hundred and forty-one (44.6%)
said it was because of “financial constraints”,
109 (34.5%) said they “have other priorities”,
102 (32.3%) said due to “security concerns”,
41 (13%) said “health won’t allow me to
travel”, and 16 (5.1%) were simply “not
interested”.
Other reasons for not having visited Israel in
the last five years included (frequencies in
parentheses): “time constraints” (12), “have
very young children” (6), and “don’t like to
fly” (4). Three mentions were given for:
“family constraints”, “want different holiday
alternatives”, and “political objections”. Two
responses were given for: “in school” and
“too old”.
51
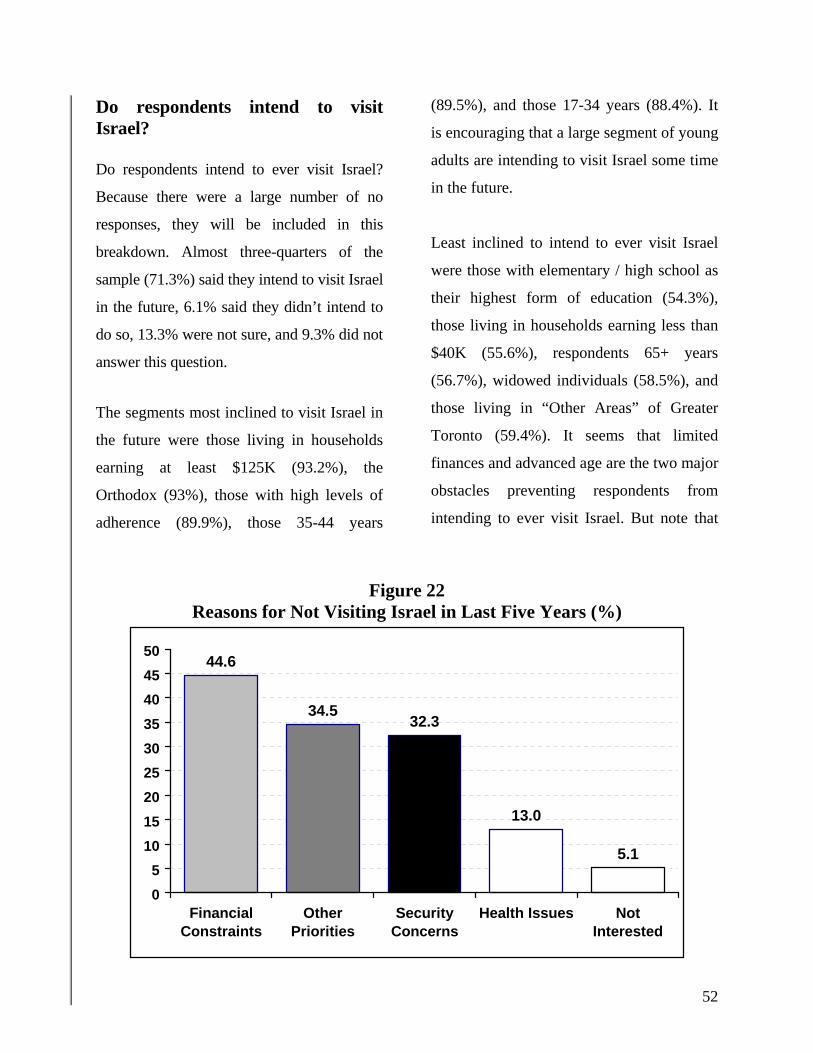
Do respondents intend to visit Israel?
52
Do respondents intend to ever visit Israel?
Because there were a large number of no
responses, they will be included in this
breakdown. Almost three-quarters of the
sample (71.3%) said they intend to visit Israel
in the future, 6.1% said they didn’t intend to
do so, 13.3% were not sure, and 9.3% did not
answer this question.
The segments most inclined to visit Israel in
the future were those living in households
earning at least $125K (93.2%), the
Orthodox (93%), those with high levels of
adherence (89.9%), those 35-44 years
(89.5%), and those 17-34 years (88.4%). It
is encouraging that a large segment of young
adults are intending to visit Israel some time
in the future.
Least inclined to intend to ever visit Israel
were those with elementary / high school as
their highest form of education (54.3%),
those living in households earning less than
$40K (55.6%), respondents 65+ years
(56.7%), widowed individuals (58.5%), and
those living in “Other Areas” of Greater
Toronto (59.4%). It seems that limited
finances and advanced age are the two major
obstacles preventing respondents from
intending to ever visit Israel. But note that
Figure 22 Reasons for Not Visiting Israel in Last Five Years (%)
44.6
34.532.3
13.0
5.1
05
101520253035404550
FinancialConstraints
OtherPriorities
SecurityConcerns
Health Issues NotInterested

more than half of the respondents across all
segments said they intended to visit Israel
some time in the future.
Have respondents seriously considered living in Israel?
A small percentage of the sample (13%) said
they have seriously considered living in
Israel, 55.8% said they have not, 4% were
not sure, and 27.2% did not answer this
question (it is likely they represent negative
responses that respondents did not bother to
register).
Segments of respondents most inclined to
have considered living in Israel included the
Orthodox (43.5%), those with high levels of
ritual adherence (41.1%), those 17-34 years
(26.7%), those in non-professional
occupations (26.7%), and those 45-54 years
(21.4%). It is interesting that more than a
quarter of young adults sampled in this
survey said they have seriously considered
living in Israel.
Least inclined to have considered living in
Israel were intermarried individuals (2.2%),
widowed persons (5.1%), those 65+ years
(8.3%), those whose place of birth was
Eastern Europe (8.6%), those with
elementary / high school as their highest
form of education (8.8%), individuals with
low levels of ritual adherence (10.3%), those
who live in “Other Areas” of Greater
Toronto (10.3%), and Secular / Just Jews
(10.6%).
How closely do respondents feel connected to Israel?
Almost half the sample (47.1%) said they
felt “very close” to Israel, 32% said
“somewhat close”, 13.4% said “somewhat
distant”, 4.3% said “very distant”, and 3.1%
said they weren’t sure (Figure 23).
Those segments most inclined to feel “very
close” to Israel included those with high
levels of ritual adherence (85.2%), the
Orthodox (80.4%), those who were born in
Eastern Europe (74%), those who
immigrated before 1990 (64.9%), and those
who were born in the Former Soviet Union
(64.6%). It is noteworthy that despite the
fact they generally have low levels of
affiliation along a number of measures
indicated in this study, individuals born in
the FSU have among the highest levels of
attachment to Israel. This is likely because
many had lived in Israel before immigrating
to Canada.
53
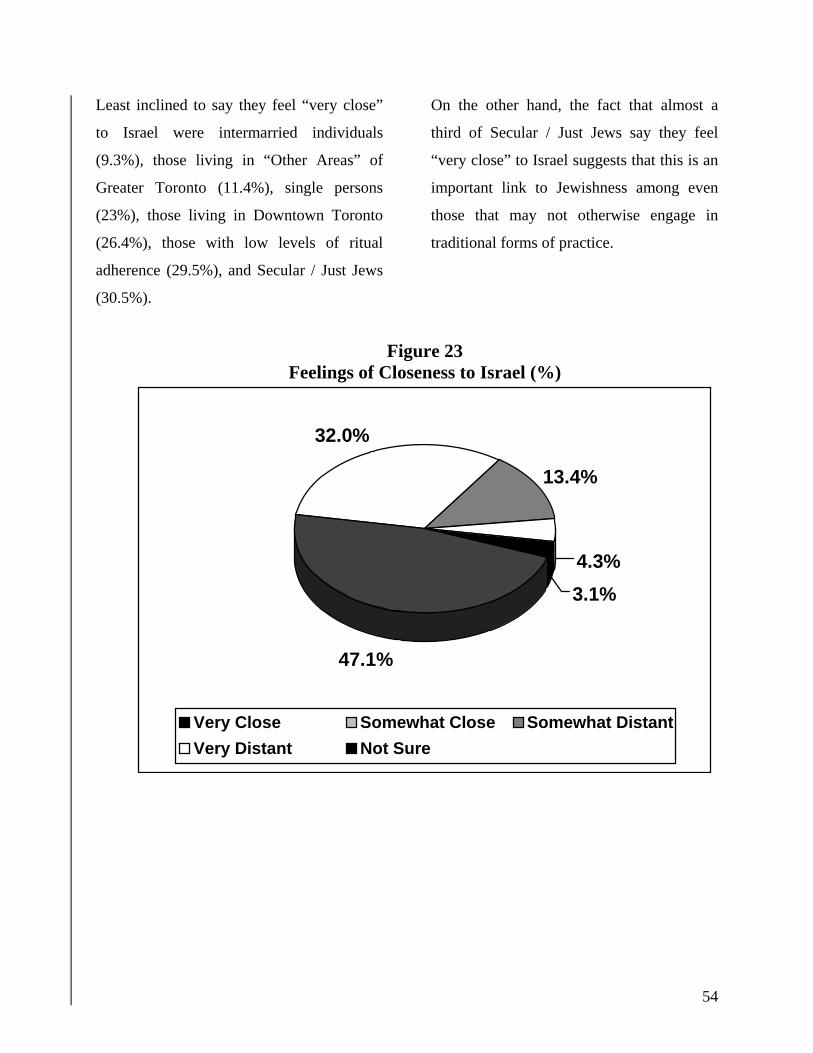
Least inclined to say they feel “very close”
to Israel were intermarried individuals
(9.3%), those living in “Other Areas” of
Greater Toronto (11.4%), single persons
(23%), those living in Downtown Toronto
(26.4%), those with low levels of ritual
adherence (29.5%), and Secular / Just Jews
(30.5%).
On the other hand, the fact that almost a
third of Secular / Just Jews say they feel
“very close” to Israel suggests that this is an
important link to Jewishness among even
those that may not otherwise engage in
traditional forms of practice.
Figure 23 Feelings of Closeness to Israel (%)
47.1%
32.0%
13.4%
4.3%3.1%
Very Close Somewhat Close Somewhat DistantVery Distant Not Sure
54

Experiences With Antisemitism
To what extent do respondents believe there is antisemitism in Toronto?
A measure of a civilized society is often
considered to be the level of tolerance
displayed to its minorities. Jews in North
America have experienced an unprecedented
degree of freedoms and privileges that have
historically been denied to them in many
other parts of the Diaspora. But this does not
mean that Jews haven’t experienced
discrimination or violence here due to their
specific religion or ethnicity.
A little more than one in ten respondents
(12.8%) believe there is “a great deal” of
antisemitism in Toronto, 64.9% believe
there is “some level” of antisemitism, 19.5%
think there is “a little” antisemitism here,
0.5% believe there is no antisemitism here,
and 2.3% don’t know (Figure 24).
A number of antisemitic incidences occurred
during the implementation of this survey.
For instance, there were several acts of
vandalism at local Jewish cemeteries, and an
elderly Holocaust Survivor had a swastika
painted on her property. Earlier, in 2002, the
fatal stabbing of an Orthodox Jew was
initially reported in the media as a hate
crime.
The level of those who believe there is a
“great deal” of antisemitism in their
respective communities varies from 5% to
30% across North America. But such
surveys were done over a wide range of
years, mostly from 1990 to 1999, and it is
difficult to know whether perceptions have
changed over time.
In the current study, most likely to say there
is “a great deal” of antisemitism in Toronto
were those with elementary / high school as
their highest level of education (26.7%),
widowed individuals (23.6%), those 65+
years (18.7%), and those living in “Other
Areas” of Greater Toronto (17.1%).
It is very likely that such occurrences
influenced the reactions of Toronto Jews to
antisemitism generally, and heightened the
feelings of tension and concern they
experienced. The following responses
should therefore be considered in the context
of the prevailing atmosphere at the time of
the survey.
55

Figure 24
Perceived Levels of Antisemitism in Toronto (%)
12.8%
64.9%
19.5%
0.5%
2.3%
A Great Deal Some A Little None Don't Know
Figure 25 Where Antisemitic Experience Occurred (%)
(Filter= Respondents Who Had an Antisemitic Experience in Last Two Years)
39.1
33.3
13.0 11.68.7
0
5
10
15
20
25
30
35
40
45
Workplace /Job-Related
In Area NearResidence
In a PublicPlace
School /University
PublicServices
56

Least likely to say there is a “great deal” of
antisemitism in Toronto were those who
immigrated between 1990-2004 (6.5%),
those in professional or managerial
occupations (7.7%), single persons (8.2%),
university graduates (8.3%), and individuals
born in the Former Soviet Union (8.3%). In
short, immigrants are less inclined to
perceive antisemitism here, likely because
there are much greater levels of antisemitism
in their home countries.
Has antisemitism in Toronto increased or
decreased in the last two years? About a
third (32.7%) of the sample thinks
antisemitism has “increased a lot” in the last
two years, whereas 43.8% believe it has
“increased slightly”, 14.2% believe it has
“stayed the same”, 0.3% believe it has
“decreased slightly”, 0.3% think it has
“decreased a lot”, and 8.7% are not sure.
Have respondents had a recent experience with antisemitism in Toronto? More than one in ten respondents (11%) said
they had a personal experience with
antisemitism in the last 2 years, 29.6% said
they experienced antisemitism but not
recently, more than half (55.6%) never had a
personal experience with antisemitism, and
3.8% were not sure.
The level of individuals who had recent
personal experiences with antisemitism
ranges from 11% to 31% for communities
across North America. The level of
antisemitism recently experienced by
members of Toronto’s community falls at
the bottom of this distribution, suggesting
that individuals here are less likely to
encounter such situations. Nonetheless, the
fact remains that about one in ten Toronto
Jews have recently experienced antisemitism
here.
Of 69 respondents who recently had such an
experience (multiple responses possible), 27
said it happened in the workplace or was
job-related, 23 said it happened in the
neighbourhood where they live, 9 said it
happened in a public place, 8 at a school or
university, 6 while getting public services, 3
were victims of antisemitic markings or
vandalism, and 2 were subjected to
antisemitic remarks by cab drivers (Figure 25).
Single mentions for venues included: “on
the way to Hebrew school by a policeman”,
“my husband was pushed, yelled at, and spit
57

58
upon”, “jokes / inappropriate comments”, and
“at a hockey game”.
The segments most likely to mention recent
antisemitic experiences were single persons
(23%), those living in “Other Areas” of
Greater Toronto (22.9%), those 17-34 years
(18.8%), those living in households earning
under $40K (17.2%), and those in non-
professional occupations (16.5%).
Least inclined to have recently experienced
antisemitic incidences were those 65+ years
(4.2%), those whose birth place was Eastern
Europe (4.3%), widowed individuals (6%),
Secular / Just Jews (6.3%), those living in
Downtown Toronto (8.5%), and those living
in York Region (8.8%). In short, the elderly
were the least likely to be victims of
antisemitic encounters.

Conclusions
Jews residing in metropolitan Toronto enjoy
a very high quality of Jewish life.
Specifically, they have among the highest
levels of ritual adherence, synagogue
membership, levels of Jewish education, and
connection to Israel of any Jewish centre on
this continent. They live in a growing
community with a wide base of services and
a dynamic cultural and religious life.
These individuals have limited access to
synagogues, as well as Jewish services,
schools, and stores. In the present report
these persons are designated as living in
“Other Areas” of Greater Toronto. Those
living outside the spheres of Jewish
neighbourhoods tend to rank among the least
affiliated, least involved and least connected
of any segments of Jews.
However, the current findings also suggest a
number of important challenges facing the
community that relate to questions of
diversity and accessibility. These issues
involve segments that seem less involved
with the Jewish mainstream, and that may
feel alienated or distanced from communal
life.
Individuals living at the fringes of Jewish
life are also least likely to give their children
a Jewish education, and most likely to have
children who intermarry. As mentioned in
this report, the cost of their disassociation
might have generational implications.
What can be done to reach out to those who
live in geographically marginal areas? Small
grass-roots organizations that promote
community building in these areas should be
encouraged, especially if they are run by
committed Jews who wish to mobilize
others into greater participation. Satellite
representation of Jewish services and
agencies in these areas may also represent
important bridges, particularly if they
The term “Jewish sprawl” has been used to
refer to the spread of Jewish populations
into areas outside of “traditional” Jewish
neighbourhoods. As the population of Jews
in Greater Toronto continues to increase,
some will choose to live in areas distant
from the major centres of Jewish life.
59
address real needs experienced by these
populations.
It should be noted that not only individuals
living in “Other Areas” of Greater Toronto
show lower levels of Jewish involvement,
but those in the Downtown area as well.
Interestingly, Downtown Jews report among
the highest levels of attendance at the
Ashkenaz Festival, suggesting they have an
interest in participation, if offered programs
that are attractive and innovative enough to
meet their needs.
The intermarried are also a group that
show low levels of affiliation, participation
and ritual adherence. This suggests that
intermarriage is a serious threat to Jewish
continuity, and a strong impetus for
assimilation.
Intermarriage has implications across
generational lines. Only 29.7% of
intermarried couples are bringing up their
children strictly as Jews. Intermarried Jews
are also much more likely to have children
who themselves intermarry.
What types of programs can attract
intermarried couples? There have been
initiatives across North America that
provide intermarried families with an
opportunity to participate in communal life.
Such programs include workshops that
introduce the non-Jewish spouse to the
richness of Judaism, support groups that
help the couple deal with acceptance issues,
and programs that introduce the children of
such families to various aspects of Jewish
tradition.
Secular / Just Jews represent the
unaffiliated segments of the community. The
unaffiliated are by no means divorced from
Judaism. Although their Jewish expressions
may be more cultural in orientation, 93.4%
of the unaffiliated attend Passover Seder,
and 77.2% light Chanukah candles. The
question of how to get the unaffiliated more
involved in Jewish life might involve
programs that meet their needs in a “Jewish”
setting that fosters greater connection with
community.
Another segment of note includes recent
immigrants, particularly those from the
Former Soviet Union. Some of these latter
individuals have come from Israel, and thus
have had previous exposure to Judaism and
a Western lifestyle. The findings of this
study, however, suggest that recent
60

immigrants from the FSU tend to have low
involvement in community life.
The question is how to attract such
individuals by making their experience of
acculturation and integration a positive one.
A critical issue relates to making Jewish day
schools more accessible for the children of
immigrants. For instance, less than one in
ten immigrants from the FSU currently have
their children enrolled in Jewish day
schools, and are also not likely to provide a
supplementary Jewish education for their
children.
On the other hand, immigrants from the FSU
have among the highest levels of use of the
BJCC, and among the highest levels of
attachment to Israel. Hence, opportunities
exist for fostering stronger community ties
among this group.
The less affluent also often find their
participation in Jewish life to be limited by
their financial circumstances. As the
findings suggest, they are among the least
likely to be synagogue members, to have
children attend a Jewish day school, to use
Jewish community services, and to have
ever visited Israel. They are also more likely
to report having a recent antisemitic
experience.
There are other challenges facing the Jewish
community of Greater Toronto. Although
there is relatively high awareness of
available Jewish services and programs, the
level of reported use by the Jewish public
suggests there is a significant proportion that
are not using such services.
On the other hand, as mentioned previously,
many of the services in question are geared
toward specific subpopulations, whereas
some organizations are mandated to serve the
community as a whole and not solely specific
individuals or populations. In addition, some
respondents may have chosen not to report
usage of services.
The level of usage may hence not necessarily
reflect a lack of need, or questions related to
quality or accessibility, but is rather a
reflection of the specificity of the populations
being serviced or a reluctance to disclose use
of services.
It is particularly interesting that respondents
from York Region, who comprise a
significant proportion of the sample, placed
61

62
in the middle of the distribution across most
measures of participation and involvement.
However, the picture for the Jewish
community in York Region is a little more
complicated than at first glance. For
instance, 50.2% of York Region Jews are
paying members of a synagogue, 36% have
children currently attending a Jewish day
school, 32.2% have recently volunteered for
a Jewish organization, and 47.4% made a
contribution to UJA in the last year. These
figures suggest that there is a strong core
representation of Jews in this part of Greater
Toronto, but there is also potential for more
affiliation and involvement.
In terms of financial planning, there is little
doubt that UJA has strong competition for
market share from other types of charities.
The challenge will be to penetrate those
segments of the community that have
traditionally not funded Federation. Many of
the groups described above (geographically
isolated, intermarried, unaffiliated, recent
immigrants) may represent potential pools
of donors.
In summary, there are many strengths
related to the local Jewish community, but
there are also significant challenges. The
Toronto Jewish community has many
reasons to be optimistic regarding its future;
however, it must continue to address
challenges that relate to issues of diversity
and accessibility in order to remain one of
the best places for Jews to live in North
America.

References
1. Sheskin, I. M. How Jewish Communities Differ: Variations in the Findings of Local Jewish Population Studies. North American Jewish Data Bank, 2001.
2. Goldstein, S. & Goldscheider, C. Jewish Religiosity: Ideological and Ritualistic Dimensions. In “The Jews in American Society”, ed. Marshall Sklare (New York: Berhman House, 1974.
3. Brodbar, J. et al. An Overview of the Canadian Jewish Community. In “The Jews in Canada”, ed. Robert J. Brym et al. Toronto: Oxford University Press, 1993.
4. Fishman, S.B. and Goldstein, A. When They are Grown They Will Not Depart: Jewish Education and the Jewish Behavior of American Adults. Cohen Center for Modern Jewish Studies, Brandeis University, 1993.
5. Weil, M. J. Rethinking Unaffiliated Jews. Jerusalem Post: Online Edition. March 8, 2004.
6. References include: Fishman, S.B. & Goldstein, A. When They Are Grown They Will Not Depart: Jewish Education and the Jewish Behavior of American Adults. Cohen Center for Modern Jewish Studies, Brandeis University, 1993. Schiff, A. I. And Schneider, M. The Jewishness Quotient of Jewish day School Graduates: Studying the Effects of Jewish
Education on Adult Jewish Behavior. New York, David J. Azrieli Graduate Institute, Report 1, 1994. Shahar, C. The Jewish High School Experience: Its Implications for the Evolution of Jewish Identity in Young Adults. The Jewish Education Council of Montreal, Montreal, 1998. Cohen, S.M. & Kotler-Berkowitz, L. The Impact of Childhood Jewish Education on Adults’ Jewish Identity. Report Series on the National Jewish Population Survey 2000-2001. United Jewish Communities, July 2004.
7. Schnoor, Randal F. "Which school is right for my child? Educational choices of Jewish parents." Toronto: Board of Jewish Education. February 2004. See also the Board of Jewish Education Population Survey, 2004.
8. The National Jewish Population Survey 2000-01: Strength, Challenge and Diversity in the American Jewish Population. United Jewish Communities, September 2003.
9. Woocher, J. Sacred Survival: The Civil Religion of American Jews. Bloomington: Indiana University Press, 1986.
10. Cohen, S. M. & Liebman, C.S. Two Worlds of Judaism: The Israeli and American Experience. New Haven: Yale University Press, 1990.
63