Jefferies Global Energy Conference · NYSE: NFX November 28, 2012 Jefferies Global Energy...
13
www.newfield.com NYSE: NFX November 28, 2012 Jefferies Global Energy Conference
Transcript of Jefferies Global Energy Conference · NYSE: NFX November 28, 2012 Jefferies Global Energy...

www.newfield.com NYSE: NFX
November 28, 2012
Jefferies Global Energy Conference
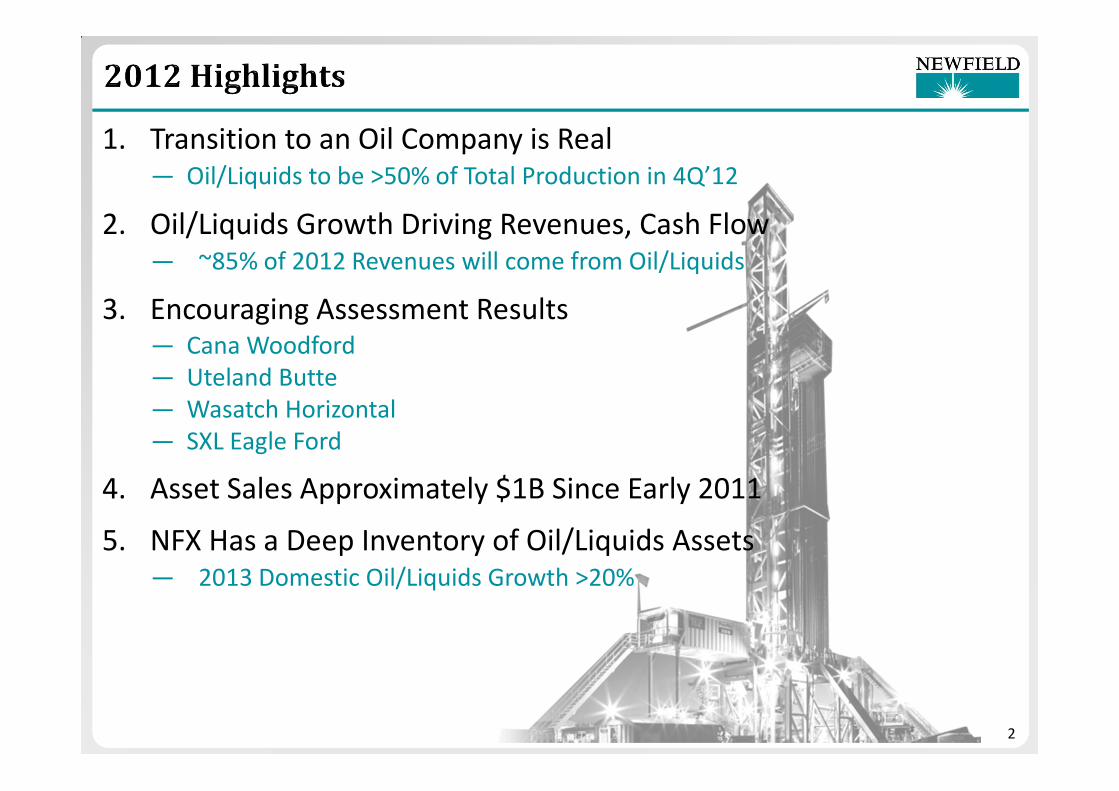
1. Transition to an Oil Company is Real ― Oil/Liquids to be >50% of Total Production in 4Q’12
2. Oil/Liquids Growth Driving Revenues, Cash Flow― ~85% of 2012 Revenues will come from Oil/Liquids
3. Encouraging Assessment Results — Cana Woodford
— Uteland Butte
— Wasatch Horizontal
— SXL Eagle Ford
4. Asset Sales Approximately $1B Since Early 2011
5. NFX Has a Deep Inventory of Oil/Liquids Assets― 2013 Domestic Oil/Liquids Growth >20%
2

3
1. Proven History in Oklahoma Woodford Formation― Arkoma Woodford ~500 Total Wells (374 HZTs)
― 310,000 Net Acres Prospective for the Woodford Shale
Formation
2. Assessing the Anadarko Basin― Oil/Liquids-Rich Basin
― Thick, Quality Resource with Multiple Horizons
― >200,000 Net Acres
3. Cana Woodford ― 142,000 Net Acres
― Up to 1 Billion BOE of Net Unrisked Resource Potential

4
Key Statistics: • Current
― 4 NFX Operated Rigs Running (24 Total Industry Rigs)
― 19 NFX Horizontal Wells Producing
― 5 Wells Waiting on Completion
• 2013 Plan
― Up to 8 NFX Operated Rigs
0
1,000
2,000
3,000
4,000
5,000
6,000
7,000
8,000
9,000
10,000
11,000
JAN
FEB
MA
R
AP
R
MA
Y
JUN
JUL
AU
G
SEP
OC
T
NO
V
DE
C
JAN
FEB
MA
R
AP
R
MA
Y
JUN
JUL
AU
G
SEP
OC
T
NO
V
DE
C
JAN
FEB
MA
R
AP
R
MA
Y
JUN
JUL
AU
G
SEP
2010 2011 2012
Ne
t B
OE
PD
Gas Sales
NGL
Oil
Legacy Production / Cana Leasing Exploration Assessment
NFX Commences
HZT Drilling
26%
41%
33%
Product Composition
Oil
Gas Sales
NGL

5
Key Takeaways
• 142,000 Net Acres
• 9,300 BOEPD Net Production
― 60% Liquids
• Active Development/Assessment
― 4-6 NFX Operated Rigs
South Cana Results YTD
• 9 Producing Wells (Avg. 75% WI)
• 1,215 BOEPD Avg. IP (32% Oil)
• 901 BOEPD Avg. 30 Day Rate
• 792 BOEPD Avg. 100 Day Rate
North Cana (Klade Well)
• 925 BOEPD (93% Oil)
• 660 BOEPD Avg. 30 Day Rate
• 99% WI
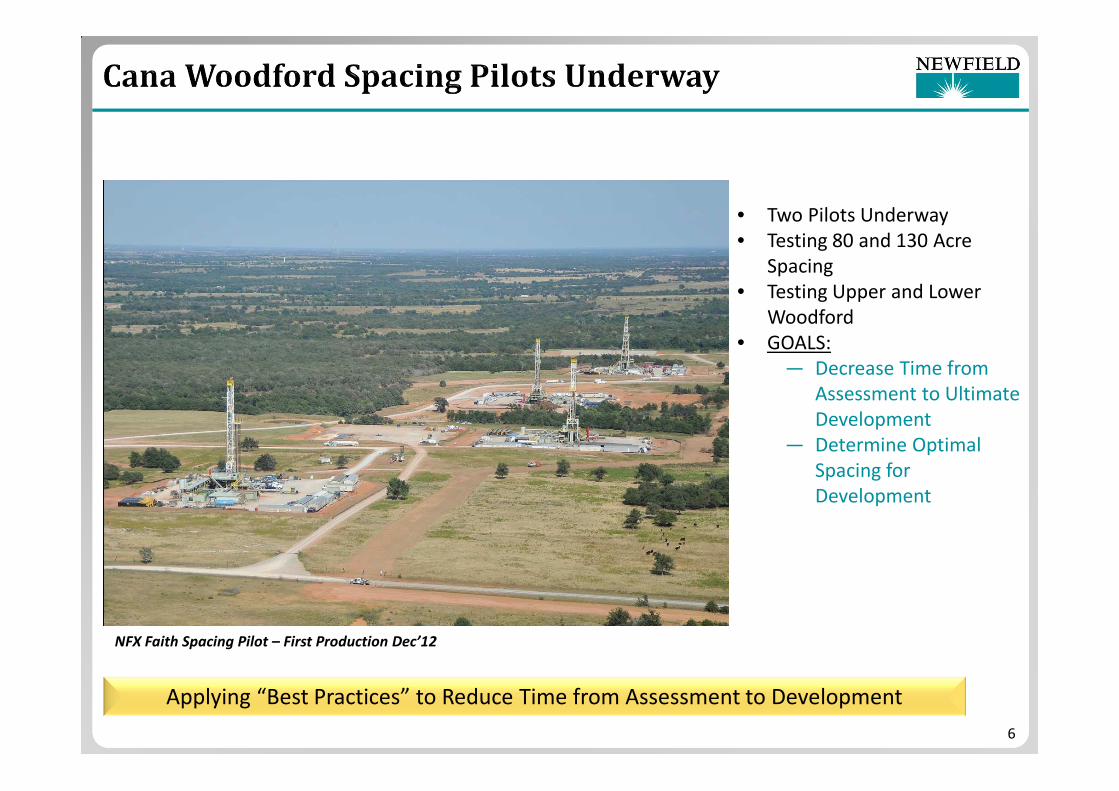
• Two Pilots Underway
• Testing 80 and 130 Acre
Spacing
• Testing Upper and Lower
Woodford
• GOALS:
― Decrease Time from
Assessment to Ultimate
Development
― Determine Optimal
Spacing for
Development
Applying “Best Practices” to Reduce Time from Assessment to Development
NFX Faith Spacing Pilot – First Production Dec’12
6
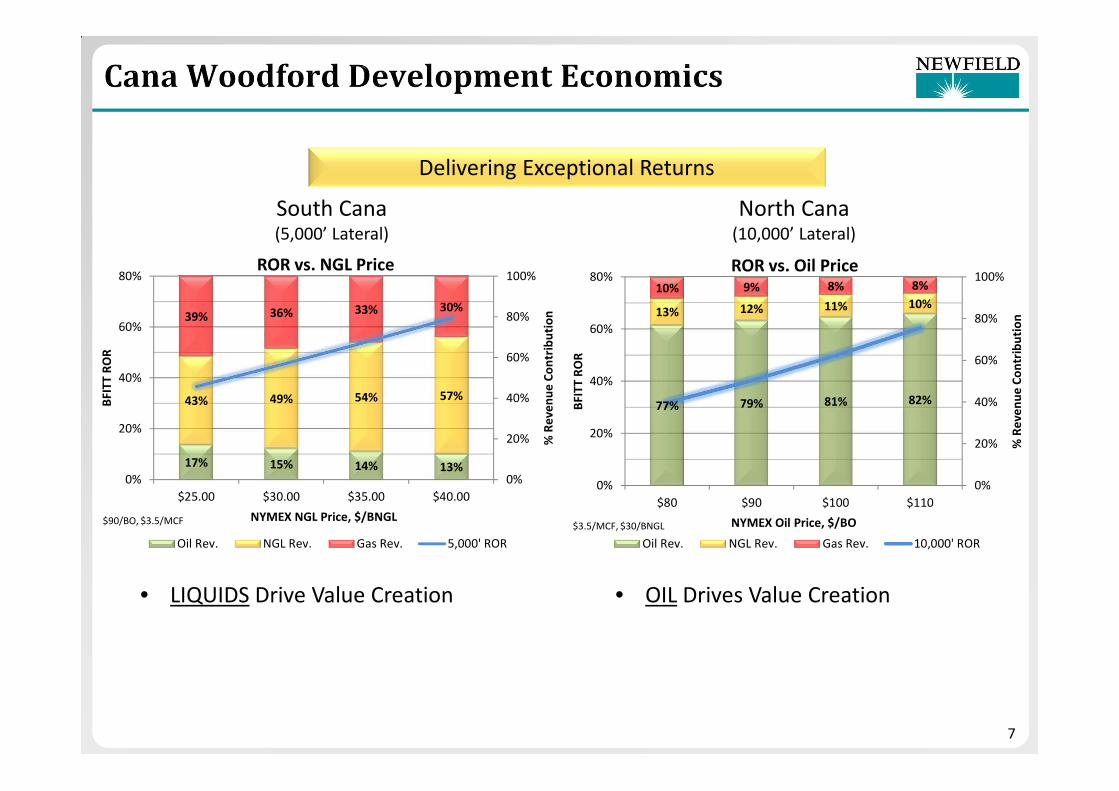
17% 15% 14% 13%
43% 49% 54% 57%
39% 36% 33% 30%
0%
20%
40%
60%
80%
100%
0%
20%
40%
60%
80%
$25.00 $30.00 $35.00 $40.00
% R
ev
en
ue
Co
ntr
ibu
tio
n
BFI
TT
RO
R
NYMEX NGL Price, $/BNGL
ROR vs. NGL Price
Oil Rev. NGL Rev. Gas Rev. 5,000' ROR
$90/BO, $3.5/MCF
7
• LIQUIDS Drive Value Creation
South Cana(5,000’ Lateral)
North Cana(10,000’ Lateral)
77% 79% 81% 82%
13% 12% 11% 10%
10% 9% 8% 8%
0%
20%
40%
60%
80%
100%
0%
20%
40%
60%
80%
$80 $90 $100 $110
% R
ev
en
ue
Co
ntr
ibu
tio
n
BFI
TT
RO
R
NYMEX Oil Price, $/BO
ROR vs. Oil Price
Oil Rev. NGL Rev. Gas Rev. 10,000' ROR
$3.5/MCF, $30/BNGL
Delivering Exceptional Returns
• OIL Drives Value Creation
8
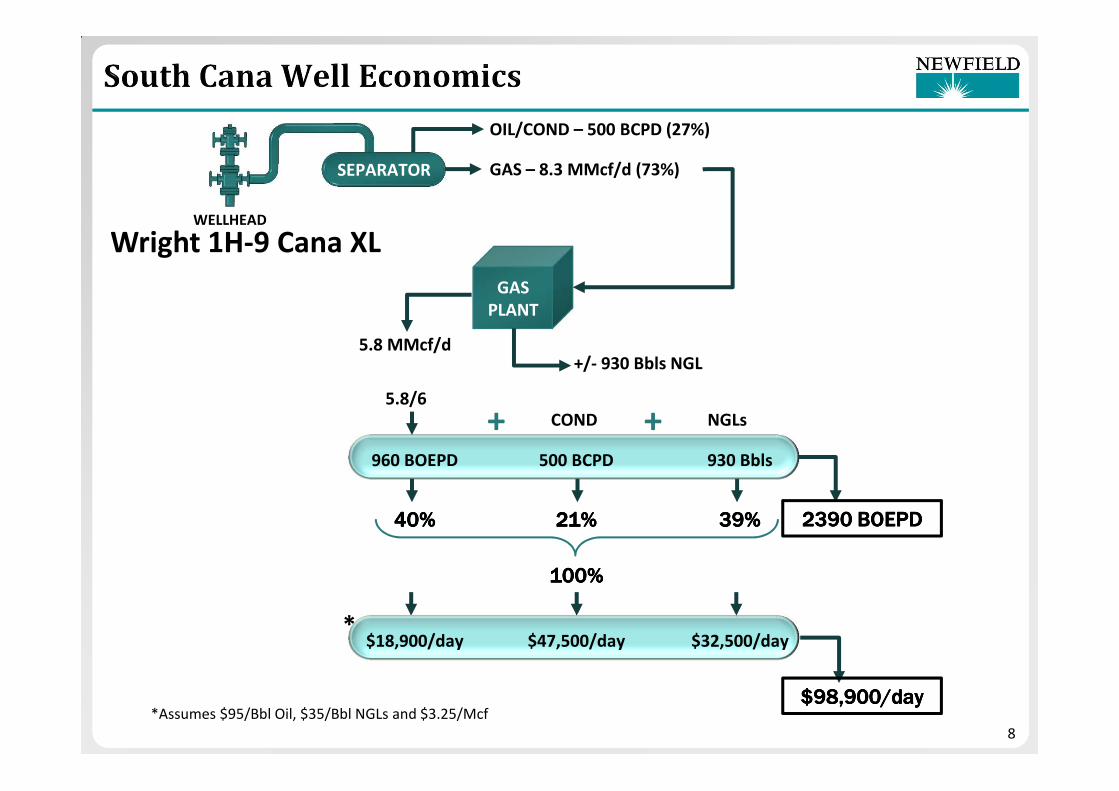
WELLHEAD
OIL/COND – 500 BCPD (27%)
SEPARATOR GAS – 8.3 MMcf/d (73%)
GAS
PLANT
5.8 MMcf/d+/- 930 Bbls NGL
5.8/6
960 BOEPD 500 BCPD 930 Bbls
+ +COND NGLs
40%40%40%40% 21%21%21%21% 39%39%39%39% 2390 BOEPD2390 BOEPD2390 BOEPD2390 BOEPD
100%100%100%100%
Wright 1H-9 Cana XL
$98,900/day$98,900/day$98,900/day$98,900/day
$18,900/day $47,500/day $32,500/day
*Assumes $95/Bbl Oil, $35/Bbl NGLs and $3.25/Mcf
*

9
• > 50% Improvement in Drill Time
and Cost/Lateral foot YTD’12
• New Technology― Rotary Steerable Systems
― New PDC Bits
― Innovative Casing Designs
• Identifying High “Rate of
Penetration” Zones
• Increasing Lateral Lengths to 7,500 -
10,000’
0
2,000
4,000
6,000
8,000
10,000
12,000
14,000
16,000
18,000
20,000
22,0000 10 20 30 40 50 60 70 80 90 100 110
Days
South CanaDays vs. Depth
Q12012
Q22012
Q32012
Best in Class: 40 Days
Faith 4H-12 Well (5,000’ Lateral)
Depth(ft.)

10
OZARK UPLIFT
BRAVODOME
SIERRAGRANDE
Arkoma Basin
Cherokee PlatformWoodford Shale
Woodford - SH
• Significant Potential along the Woodford Fairway― 15+ Productive Intervals with Oil, Wet Gas, & Gas
― Stacked Unconventional Resource Fairways
― Traditional Vertical Potential
• Existing Technical Knowledge & Expertise― One of the most Prolific Onshore US Basins
― Rich Stratigraphic Column with Numerous O&G Pays
― Multiple Petroleum Systems
Woodford
Fairway
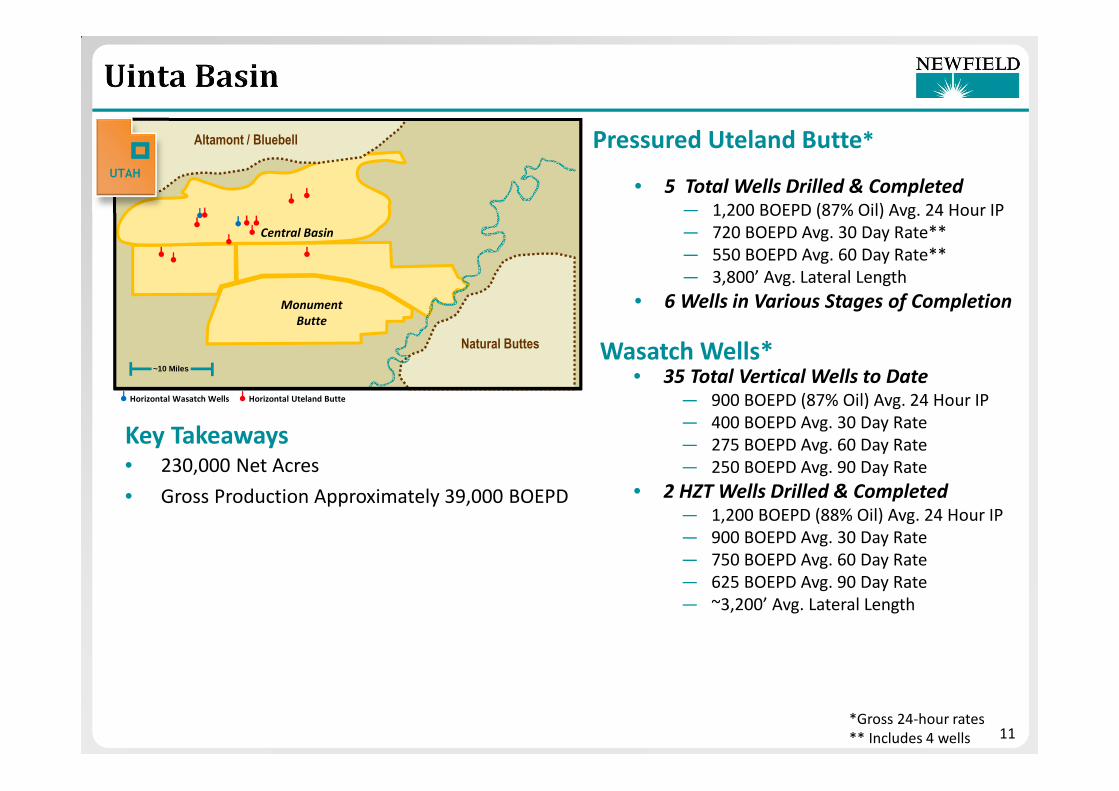
Altamont / Bluebell
Natural Buttes
Greater Monument Butte Unit
UTAH
~10 Miles
Horizontal Wasatch Wells Horizontal Uteland Butte
• 5 Total Wells Drilled & Completed
― 1,200 BOEPD (87% Oil) Avg. 24 Hour IP
― 720 BOEPD Avg. 30 Day Rate**
― 550 BOEPD Avg. 60 Day Rate**
― 3,800’ Avg. Lateral Length
• 6 Wells in Various Stages of Completion
Pressured Uteland Butte*
• 35 Total Vertical Wells to Date
― 900 BOEPD (87% Oil) Avg. 24 Hour IP
― 400 BOEPD Avg. 30 Day Rate
― 275 BOEPD Avg. 60 Day Rate
― 250 BOEPD Avg. 90 Day Rate
• 2 HZT Wells Drilled & Completed
― 1,200 BOEPD (88% Oil) Avg. 24 Hour IP
― 900 BOEPD Avg. 30 Day Rate
― 750 BOEPD Avg. 60 Day Rate
― 625 BOEPD Avg. 90 Day Rate
― ~3,200’ Avg. Lateral Length
Wasatch Wells*
Key Takeaways• 230,000 Net Acres
• Gross Production Approximately 39,000 BOEPD
Monument
Butte
Central Basin
*Gross 24-hour rates
** Includes 4 wells 11

12
PeriodVolume Hedged
MMCF/D
Weighted-Average
Fixed Price
Value @
$2 / MMBtu
Value @
$3 / MMBtu
Value @
$4 / MMBtu
4Q ‘12 287 $3.65 $44MM $18MM ($11MM)
2013 271 $4.29 $235MM $136MM $29MM
2014 240 $3.86 $163MM $75MM ($7MM)
2015 60 $4.03 $44MM $23MM $3MM
Period
Volume Hedged
BOPD
Weighted-Average
Fixed Price
Value @
$80 / Bbl
Value @
$90 / Bbl
Value @
$100 / Bbl
Value @
$110 / Bbl
4Q ‘12 35,000 $82.96 $8MM $6MM ($2MM) ($22MM)
2013 35,700 $94.55 $190MM $59MM ($10MM) ($32MM)
2014 21,000 $92.87 $99MM $22MM ($29MM) ($55MM)
* See @NFX on Newfield Website for Detailed Hedging Position
13
This presentation contains forward-looking statements within the meaning of Section 27A of the Securities Act of 1933,as amended, and Section 21E of the
Securities Exchange Act of 1934, as amended. The words “will”, “believe”, “intend”, “plan”, “expect” or other similar e xpressions are intended to identify
forward-looking statements. Other than historical facts included in this presentation, all information and statements, such as information regarding
estimated reserves, production targets, drilling and development plans and the timing of production and other activities, planned capital expenditures, the
availability of capital resources to fund capital expenditures and other plans and objectives for future operations, are forward-looking statements. Although
as of the date of this presentation Newfield believes that these expectations are reasonable, this information is basedupon assumptions and anticipated results
that are subject to numerous uncertainties and risks. Actual results may vary significantly from those anticipated dueto many factors, including drilling
results, oil and gas prices, industry conditions, the prices of goods and services, the availability of drilling rigs and other support services, the availability of
refining capacity for the crude oil Newfield produces in the Uinta Basin in Utah, the availability of capital resources, labor conditions, severe weather
conditions, governmental regulations and other operatingrisks. Please see Newfield’s 2011 Annual Report on Form 10-Kand subsequent Quarterly Reports
on Form 10-Q filed with the U.S. Securities and Exchange Commission (SEC) for a discussion of other factors that may causeactual results to vary.
Unpredictable or unknown factors not discussed herein or inNewfield’s SEC filings could also have material adverse effects on forward-looking statements.
Readers are cautioned not to place undo reliance on forward-looking statements, which speak only as of the date of this presentation. Unless legally required,
Newfield undertakes no obligation to publicly update or revise any forward-looking statements.
Cautionary Note to Investors – Effective January 1, 2010, the SEC permits oil and gas companies, in their filings with theSEC, to disclose only proved,
probable and possible reserves that meet the SEC’s definitions for such terms. Newfield may use terms in this presentation, such as “resources”, “net
resources”, “net discovered resources”, “net risked resources”, “net lower-risked captured resources”, “net risked captured resources”, “gross resources”,
“gross resource potential”, “gross unrisked resource potential”, “gross unrisked resources”, and similar terms that the SEC’s guidelines strictly prohibit in
SEC filings. Investors are urged to consider closely the oiland gas disclosures in Newfield’s 2011 Annual Report on Form10-K, available at
www.newfield.com, www.sec.govor by writing Newfield at 4 Waterway Square Place, Suite 100, The Woodlands, Texas 77380 Attn: Investor Relations.