Jefferies 2014 Global Energy Conference - Williams...
22
Jefferies 2014 Global Energy Conference Don Chappel, Chief Financial Officer November 12, 2014
Transcript of Jefferies 2014 Global Energy Conference - Williams...

Jefferies 2014 Global Energy Conference
Don Chappel, Chief Financial Officer
November 12, 2014

2 © 2014 The Williams Companies, Inc. All rights reserved.Jefferies Global Energy Conference | 11/12/14
Diverse, Large-Scale Strategic Positions DeliveringValue Today, Ongoing Growth
Marcellus-Utica Zoom-in View

3 © 2014 The Williams Companies, Inc. All rights reserved.Jefferies Global Energy Conference | 11/12/14
Williams’ Value Chain Adds Significant Growth Foothold with ACMP Acquisition
Figures represent 100% capacity for operated assets, including those in which Williams, WPZ and ACMP have a share of ownership;
NGL and derivatives storage includes capacity owned and under long-term lease; olefins-plant volumes are inclusive of Geismar, La.,
facility at full operation and expansion.
Market HubEnd UserOlefins PlantTransmission Pipelines
Storage
Multiple
ProductsFractionation Facilities
Natural Gas Liquids
Mixed
Gas Processing Plants
Gathering
NaturalGas
Transmission Pipelines and Storage
End User
Market Hub
Ethylene
Propylene
231 Mbbl/d7 Bcf/d
inlet22 MMbbl (lbs/year)
1,900 MMethylene
815 MM propylene
395MM lbs ethylene storage
24 storage customers
7 exchange partners
>20% U.S. Dry-Gas Volumes Touch Our Systems
386Mbbl/d
418 Mbbl/d
ACMP
adds
depthin key
growthfoothold in
value chain
475 Mbbl/dcrude oil
Gas Gathering
WPZ 11.0 Bcf/d
ACMP 7.8 Bcf/d
Wellhead(onshore and
offshore)
Opportunities to extend services

4 © 2014 The Williams Companies, Inc. All rights reserved.Jefferies Global Energy Conference | 11/12/14
0
20
40
60
80
100
120
2000 2005 2010 2015 2020 2025 2030
Northeast
Rockies
San Juan
Gulf of Mexico
Fort Worth
Mid-Continent
Gulf Coast
Permian
West Coast
Alaska
Source: Wood Mackenzie North America Gas Service. Note: Excludes Canadian import volumes of approximately 4.5 Bcf/d (at 2014 levels).
We Are Well Positioned to Benefit from Supply Growth
NATURAL GAS – U.S. SUPPLY GROWTH (Bcf/d)
Direct Ownership
’14-’30
+58%
+39.8 Bcf/d
CAGR
3%
’09-’13
+17%
+9.5 Bcf/d
CAGR
3%

5 © 2014 The Williams Companies, Inc. All rights reserved.Jefferies Global Energy Conference | 11/12/14
0
20
40
60
80
100
120
2000 2003 2006 2009 2012 2015 2018 2021 2024 2027 2030
Demand Shows Up in Response to Supply, Price;105 Bcf/d on Conservative 2% CAGR
Source: Wood Mackenzie North America Gas Service
Residential
Commercial
Industrial
Power
LNG Exports
TransportOther
U.S. GAS DEMAND (Bcf/d)
CAGR
2%
’14-’30
+47%
+33.5 Bcf/d
’09-’13
+14%
+8.5Bcf/d
CAGR
2.5%

6 © 2014 The Williams Companies, Inc. All rights reserved.Jefferies Global Energy Conference | 11/12/14
Competitive Advantages Delivering Large-Scale Projects, Long-Term Value Creation
> Increased fee-based revenuesto >80% of gross margins
> Extensive network of large-scale assets, well-positioned for NG supply growth
> Emerging demand growth in Pacific Northwest markets
> Prior large-scale investments still generating high returns in lowNGL-margin environment
WEST> Transco: Nation’s largest and fastest-growing pipeline
system with >50% capacity growth in the next 4 years; connecting best
supplies to best markets
> Deepwater: Unique competitive advantages driving strong revenue
growth; executing on large-scale projects
ATLANTIC-GULF
> Connecting upstream supplies to new, growing downstream customers
> Bringing expanded Geismar plant online
> Growing unique Canadian business; Horizon, Syncrude,
plus propane and proplyene
NGL & PETCHEM SERVICES
> Leadership positions in nine unconventional U.S. basins
> Complementary position in world’s largest shale play
> Attractive return,low-risk, fee-based business
ACMP
> Expecting ~5 Bcf/d of capacity by 2015
> Ideally situated in world’s largest shale play
> Strong, growing free cash flows on the horizon
NE GATHERING & PROCESSING
7 © 2014 The Williams Companies, Inc. All rights reserved.Jefferies Global Energy Conference | 11/12/14
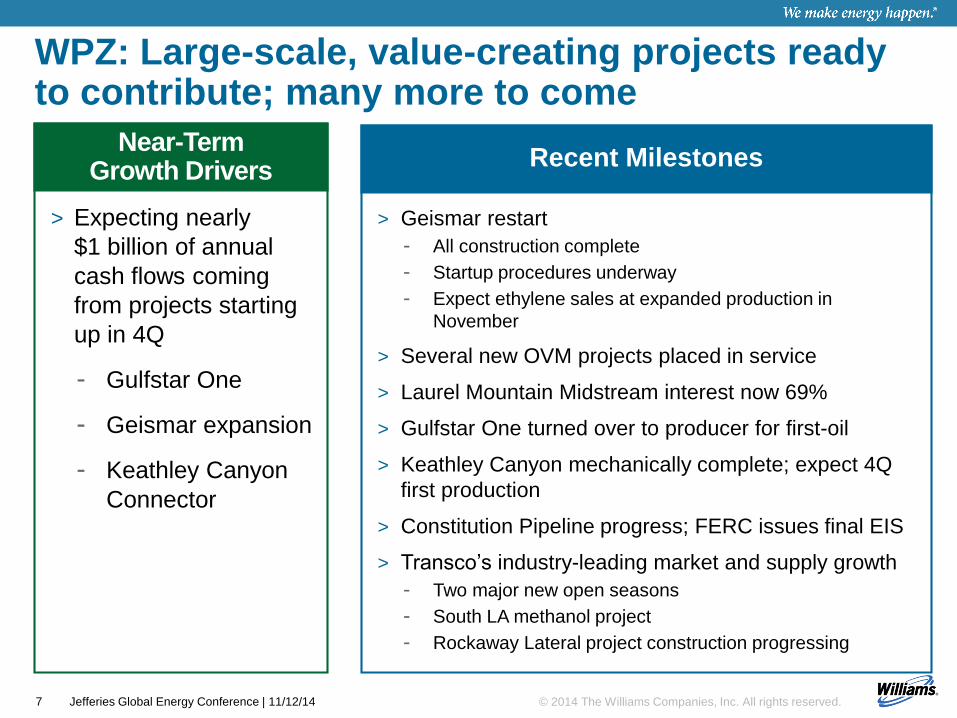
WPZ: Large-scale, value-creating projects ready to contribute; many more to come
> Geismar restart
- All construction complete
- Startup procedures underway
- Expect ethylene sales at expanded production in
November
> Several new OVM projects placed in service
> Laurel Mountain Midstream interest now 69%
> Gulfstar One turned over to producer for first-oil
> Keathley Canyon mechanically complete; expect 4Q
first production
> Constitution Pipeline progress; FERC issues final EIS
> Transco’s industry-leading market and supply growth
- Two major new open seasons
- South LA methanol project
- Rockaway Lateral project construction progressing
Recent Milestones
> Expecting nearly
$1 billion of annual
cash flows coming
from projects starting
up in 4Q
- Gulfstar One
- Geismar expansion
- Keathley Canyon
Connector
Near-Term Growth Drivers

8 © 2014 The Williams Companies, Inc. All rights reserved.Jefferies Global Energy Conference | 11/12/14
Delivering Large-Scale Infrastructure to the Marcellus & Utica
* Represents estimated in-service dates and estimated capacity at respective year end.
Note: LMM, Blue Racer and Access Midstream Partners Utica are partially owned systems; amounts shown reflect 100%.
Susquehanna Supply Hub (SSH) – 2015*3 Bcf/d takeaway capacity
Laurel Mountain Midstream(LMM) – 2015*~700 MMcf/d gathering capacity
Ohio Valley Midstream (OVM) – 2015*0.9 Bcf/d processing capacity ~80 Mbpd fractionation/de-ethanization
Access Midstream Partners – 2015*3 Bcf/d estimated exit rate
Three Rivers Midstream (TRM)248,000 dedicated acres
NW PA and NE Ohio 285,000 dedicated acres
MARCELLUS & UTICA SHALE OVERVIEW
Marcellus(wholly owned or operated)
Blue Racer Midstream – 2015*1.5 Bcf/d gathering capacity0.6 Bcf/d processing capacity~126 Mbpd fractionation capacity
Access Midstream Partners – 2015*1 Bcf/d (operated) gathering exit rate1.1 Bcf/d processing capacity~135 Mbpd fractionation capacity
Utica(partially owned, non-operated)

9 © 2014 The Williams Companies, Inc. All rights reserved.Jefferies Global Energy Conference | 11/12/14
Transco: Nation’s Largest, Fastest GrowingInterstate Pipeline System
LeidySoutheast
VirginiaSouthside
Mobile BaySouth III
Rock Springs Expansion
NE Connector/Rockaway Lateral
NE Connector/Rockaway Lateral
CPVWoodbridge
LeidySoutheast
VirginiaSouthside
Mobile BaySouth III
CPVWoodbridge
ConstitutionConstitution
Rock Springs Expansion
NE Connector/Rockaway Lateral
LeidySoutheast
VirginiaSouthside
Mobile BaySouth III
CPVWoodbridge
Constitution
Rock Springs Expansion
$0.3
$1.3$1.6
CAPITAL INVESTED PLACED INTO SERVICE ($B)
$4.8
2014
2015
2016
2017
$0.3
$1.3
$1.6 Dalton LateralHillabeePhase 1
AtlanticSunrise
Gulf Trace
Garden State Expansion
South Louisiana Market
10 © 2014 The Williams Companies, Inc. All rights reserved.Jefferies Global Energy Conference | 11/12/14
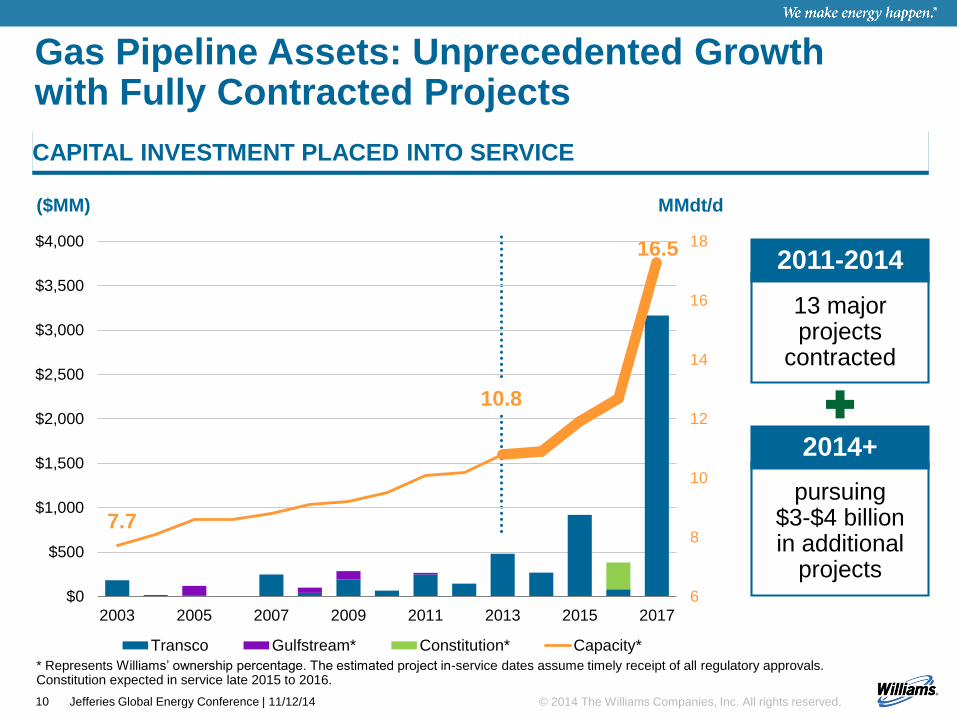
Gas Pipeline Assets: Unprecedented Growthwith Fully Contracted Projects
* Represents Williams’ ownership percentage. The estimated project in-service dates assume timely receipt of all regulatory approvals. Constitution expected in service late 2015 to 2016.
CAPITAL INVESTMENT PLACED INTO SERVICE
7.7
($MM)
16.5
10.8
MMdt/d
6
8
10
12
14
16
18
$0
$500
$1,000
$1,500
$2,000
$2,500
$3,000
$3,500
$4,000
2003 2005 2007 2009 2011 2013 2015 2017
Transco Gulfstream* Constitution* Capacity*
2011-2014
13 major projects
contracted
2014+
pursuing $3-$4 billion in additional
projects

11 © 2014 The Williams Companies, Inc. All rights reserved.Jefferies Global Energy Conference | 11/12/14
Transco’s proposed Appalachian Connector project creates direct access to major Transco system markets
Fort BeelerClarington
65
85100
125
140
155
165
Oak Grove
River RoadNatrium
Transco’s Proposed
Appalachian Connector
Project> Strong response to open season; negotiating precedent agreements
> Capacity: ~2 Bcf/d
> Target in-service:Late 2018
12 © 2014 The Williams Companies, Inc. All rights reserved.Jefferies Global Energy Conference | 11/12/14
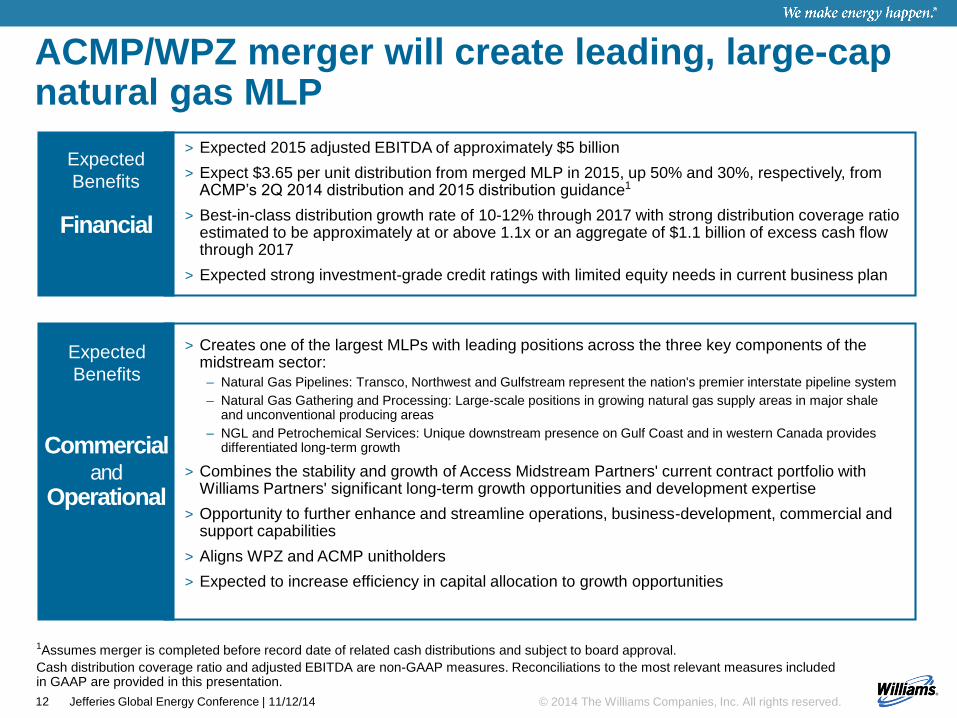
1Assumes merger is completed before record date of related cash distributions and subject to board approval.
Cash distribution coverage ratio and adjusted EBITDA are non-GAAP measures. Reconciliations to the most relevant measures included in GAAP are provided in this presentation.
ACMP/WPZ merger will create leading, large-cap natural gas MLP
> Expected 2015 adjusted EBITDA of approximately $5 billion
> Expect $3.65 per unit distribution from merged MLP in 2015, up 50% and 30%, respectively, from ACMP’s 2Q 2014 distribution and 2015 distribution guidance1
> Best-in-class distribution growth rate of 10-12% through 2017 with strong distribution coverage ratio estimated to be approximately at or above 1.1x or an aggregate of $1.1 billion of excess cash flow through 2017
> Expected strong investment-grade credit ratings with limited equity needs in current business plan
Financial
Commercialand
Operational
> Creates one of the largest MLPs with leading positions across the three key components of the midstream sector:
– Natural Gas Pipelines: Transco, Northwest and Gulfstream represent the nation's premier interstate pipeline system
– Natural Gas Gathering and Processing: Large-scale positions in growing natural gas supply areas in major shale and unconventional producing areas
– NGL and Petrochemical Services: Unique downstream presence on Gulf Coast and in western Canada provides differentiated long-term growth
> Combines the stability and growth of Access Midstream Partners' current contract portfolio with Williams Partners' significant long-term growth opportunities and development expertise
> Opportunity to further enhance and streamline operations, business-development, commercial and support capabilities
> Aligns WPZ and ACMP unitholders
> Expected to increase efficiency in capital allocation to growth opportunities
Expected
Benefits
Expected
Benefits

13 © 2014 The Williams Companies, Inc. All rights reserved.Jefferies Global Energy Conference | 11/12/14
EEP
EPD
ETPOKS
PAA
SEP
WPZ
0.0%
2.0%
4.0%
6.0%
8.0%
10.0%
0.0% 5.0% 10.0% 15.0%
Significant valuation re-rating opportunity still ahead
Source: Company filings and FactSet as of 10/27/2014
Notes: 1. Based on Wall Street research consensus as of 10/20/2014; 2. ACMP is not included in the regression line; 3. Peer group includes large cap diversified midstream MLPs
Current Yield
Pro Forma ACMP / WPZ
ACMP2
Median large-cap, diversified coverage ratio is 1.1x
Merged MLP expected to be at or above 1.1x through 2017
'14 – '16 Distribution
CAGR
2014-2016 DISTRIBUTION CAGR
Implied ACMP/WPZ at 3.6%
yield ~$94(based on 85 cent distribution for 1Q’15)

14 © 2014 The Williams Companies, Inc. All rights reserved.Jefferies Global Energy Conference | 11/12/14
TARGET IN-SERVICE DATES FOR VISIBLE GROWTH PROJECTS
2014 2015 2016 2017 2017+
NE: Frac II
NE: ethane line & de-ethanizer
NE: Other facilities
Gulfstar One
NE: Oak Grove TXP I
> Keathley Canyon Connector
> Geismar Expansion
> Rockaway Lateral
> Constitution Pipeline1
> Leidy SE
> Virginia Southside
> Kodiak
> Northeast G&P
> Mobile Bay South III
> CNRL OffgasProcessing*
> Gulf Coast PetchemServices*
> Gunflint
> Northeast G&P
> Parachute Plant Expansion
> Atlantic Sunrise
> Dalton Lateral
> Hillabee Phase 1
> Northeast G&P
> Gulf Trace
> Garden State
> Northeast G&P
> Sabal Trail ownership option
> Transco – numerous other expansions
> Gulfstar FPS and pipelines –U.S., PEMEX
> Gulf of Mexico – other oil-driven services
> Pacific Connector and other NWP projects
> Canadian PDH 1&2*
> Syncrude Offgas Processing*
> Geismar 2*
Plus $4 billion2 ACMP Growth Capex
Nearly $30 Billion in WPZ/ACMP committed plus potential capital projects 2014-19
1. Constitution Pipeline expected in-service date range is late 2015 to 2016. 2. ACMP growth capex range is $3.675 billion to $4.075 billion.
In progress
Potential/under negotiation
*WMB projects expected to be
dropped down to WPZ in late 2014
to early 2015

15 © 2014 The Williams Companies, Inc. All rights reserved.Jefferies Global Energy Conference | 11/12/14
> WMB now one of the largest publicly traded GP holding companies with control of both WPZ and ACMP
> ACMP/WPZ merger will create leading natural gas MLP
> Right long-term strategy at the right time
> Ideally positioned assets, sustainable competitive positions
> Hard-wired focus on safe, reliable operations and project execution
> Nearly $30 billion of potential growth – disciplined capital allocation
> Strong leadership in place to capture the value opportunity
Williams well positioned to participate in once-in-a-generation industry supercycle
All the right ingredients to deliver sustained value growth

Forward Looking Statements and Non-GAAP Reconciliations

17 © 2014 The Williams Companies, Inc. All rights reserved.Jefferies Global Energy Conference | 11/12/14
In connection with the proposed merger of ACMP and WPZ, ACMP will file with the SEC a Registration Statement on Form S-4 that will include a consent statement of WPZ that will also constitute a prospectus of ACMP. WPZ will mail the consent statement/prospectus to the holders of WPZ units. Investors are urged to read the consent statement/prospectus and other relevant documents filed with the SEC regarding the proposed transaction when they become available, because they will contain important information. The consent statement/prospectus and other documents that will be filed by ACMP and WPZ with the SEC will be available free of charge at the SEC’s website, www.sec.gov, or by directing a request when such a filing is made either to Access Midstream Partners L.P., 525 Central Park Drive, Oklahoma City, Oklahoma 73105, Attention: Investor Relations, or to Williams Partners L.P., One Williams Center, Tulsa, Oklahoma 74172, Attention: Investor Relations.
ACMP, WPZ and certain of their directors and executive officers may be deemed to be “participants” (as defined in Schedule 14A under the Exchange Act) in respect of the proposed transaction. Information about ACMP’s directors and executive officers is available in ACMP’s annual report on Form 10-K for the fiscal year ended December 31, 2013, as amended, initially filed with the SEC on February 21, 2014. Information about WPZ’s directors and executive officers is available in WPZ’s annual report on Form 10-K for the fiscal year ended December 31, 2013 filed with the SEC on February 26, 2014. Other information regarding the participants and a description of their direct and indirect interests, by security holdings or otherwise, will be contained in the consent statement/prospectus and other relevant materials to be filed with the SEC regarding the transaction. Investors should read the consent statement/prospectus carefully when it becomes available before making any voting or investment decisions. You may obtain free copies of these documents from WPZ or ACMP using the sources indicated above.
This document shall not constitute an offer to sell or the solicitation of an offer to buy any securities, nor shall there be any sale of securities in any jurisdiction in which such offer, solicitation or sale would be unlawful prior to registration or qualification under the securities laws of any such jurisdiction. No offering of securities shall be made except by means of a prospectus meeting the requirements of Section 10 of the U.S. Securities Act of 1933, as amended.
Important information

18 © 2014 The Williams Companies, Inc. All rights reserved.Jefferies Global Energy Conference | 11/12/14
> The reports, filings, and other public announcements of The Williams Companies, Inc. (Williams) and Williams Partners L.P. (WPZ)may contain or incorporate by reference statements that do not directly or exclusively relate to historical facts. Such statements are "forward-looking statements" within the meaning of Section 27A of the Securities Act of 1933, as amended, and Section 21E of theSecurities Exchange Act of 1934, as amended. We make these forward-looking statements in reliance on the safe harbor protections provided under the Private Securities Litigation Reform Act of 1995. You typically can identify forward-looking statements by various forms of words such as “anticipates,” “believes,” “seeks,” “could,” “may,” “should,” “continues,” “estimates,” “expects,” “forecasts,” “intends,” “might,” ”proposed,” “goals,” “objectives,” “targets,” “planned,” “potential,” “projects,” “scheduled,” “will,” “assumes,” “guidance,” “outlook,” “in service date” or other similar expressions. These forward-looking statements are based on management's beliefs and assumptions and on information currently available to management and include, among others, statements regarding:
– The levels of dividends to Williams stockholders;
– Expected levels of cash distributions by Access Midstream Partners, L.P. (“ACMP”) and WPZ with respect to general partner interests, incentive distribution rights, and limited partner interests;
– The closing, expected timing and benefits of the proposed merger of ACMP and WPZ;
– The expected timing of the drop-down of Williams’ remaining NGL & Petchem Services assets and projects;
– Amounts and nature of future capital expenditures;
– Expansion and growth of our business and operations;
– Financial condition and liquidity;
– Business strategy;
– Cash flow from operations or results of operations;
– Seasonality of certain business components;
– Natural gas, natural gas liquids, and olefins prices, supply, and demand;
– Demand for our service.
> Forward-looking statements are based on numerous assumptions, uncertainties and risks that could cause future events or results to be materially different from those stated or implied in this presentation. Many of the factors that will determine these results are beyond our ability to control or predict. Specific factors that could cause actual results to differ from results contemplated by the forward-looking statements include, among others, the following:
– Whether WPZ, ACMP, or the merged partnership will produce sufficient cash flows to provide the level of cash distributions we expect;
– Whether Williams is able to pay current and expected levels of dividends;
– Availability of supplies, market demand, and volatility of commodity prices;
Forward Looking Statements

19 © 2014 The Williams Companies, Inc. All rights reserved.Jefferies Global Energy Conference | 11/12/14
– Inflation, interest rates, and fluctuation in foreign exchange rates and general economic conditions (including future disruptions and volatility in the global credit markets and the impact of these events on customers and suppliers);
– The strength and financial resources of our competitors and the effects of competition;
– Whether we are able to successfully identify, evaluate and execute investment opportunities;
– Our ability to acquire new businesses and assets and successfully integrate those operations and assets, including ACMP’s bus iness, into our existing businesses as well as successfully expand our facilities;
– Development of alternative energy sources;
– The impact of operational and developmental hazards and unforeseen interruptions;
– The ability to restart the Geismar plant and recover expected insurance proceeds;
– Costs of, changes in, or the results of laws, government regulations (including safety and environmental regulations), environmental liabilities, litigation, and rate proceedings;
– Williams’ costs and funding obligations for defined benefit pension plans and other postretirement benefit plans sponsored by its affiliates;
– WPZ’s allocated costs for defined benefit pension plans and other postretirement benefit plans sponsored by its affiliates;
– Changes in maintenance and construction costs;
– Changes in the current geopolitical situation;
– Exposure to the credit risk of our customers and counterparties;
– ACMP’s dependence on a limited number of customers and vendors;
– Risks related to financing, including restrictions stemming from debt agreements, future changes in Williams credit ratings as well as the credit ratings of ACMP, WPZ or the merged partnership as determined by nationally-recognized credit rating agencies and the availability and cost of capital;
– The amount of cash distributions from and capital requirements of our investments and joint ventures in which we participate;
– Risks associated with weather and natural phenomena, including climate conditions;
– Acts of terrorism, including cybersecurity threats and related disruptions; and
– Additional risks described in our filings with the Securities and Exchange Commission (SEC).
> Given the uncertainties and risk factors that could cause our actual results to differ materially from those contained in any forward-looking statement, we caution investors not to unduly rely on our forward-looking statements. We disclaim any obligations to and do not intend to update the above list or announce publicly the result of any revisions to any of the forward-looking statements to reflect future events or developments.
> In addition to causing our actual results to differ, the factors listed above may cause our intentions to change from those statements of intention set forth in this announcement. Such changes in our intentions may also cause our results to differ. We may change our intentions, at any time and without notice, based upon changes in such factors, our assumptions, or otherwise.
> Investors are urged to closely consider the disclosures and risk factors in Williams’ and WPZ’s annual reports on Form 10-K filed with the SEC on Feb. 26, 2014, and each of our quarterly reports on Form 10-Q available from our offices or from our websites at www.williams.com and www.williamslp.com.
Forward Looking Statements (cont’d)

Jefferies 2014 Global Energy Conference | 11/12/1420
Certain statements and information in this presentation may constitute forward-looking statements. The words “believe,” “expect,” “anticipate,” “plan,” “intend,” foresee,” “should,”
“would,” “could,” or similar expressions are intended to identify forward-looking statements, which are generally not historical in nature. These forward-looking statements are based
on current expectations and beliefs concerning future developments and their potential effect on us. While management believes that these forward-looking statements are
reasonable as and when made, there can be no assurance that future developments affecting us will be those that we anticipate. All comments concerning our expectations for
future revenues and operating results are based on our forecasts for our existing operations and do not include the potential impact of any future acquisitions. Our forward-looking
statements involve significant risks and uncertainties (some of which are beyond our control) and assumptions that could cause actual results to differ materially from our historical
experience and our present expectations or projections. Important factors that could cause actual results to differ materially from those in the forward-looking statements include, but
are not limited to, those summarized below:
• dependence on Chesapeake Energy Corporation, Total E&P USA, Inc., Mitsui & Co., Anadarko Petroleum Corporation and Statoil for a majority of our revenues;
• the impact on our growth strategy and ability to increase cash distributions if producers do not increase the volume of natural gas they provide to our gathering systems;
• oil and natural gas realized prices;
• the termination of our gas gathering agreements;
• the availability, terms and effects of acquisitions;
• our potential inability to maintain existing distribution amounts or pay the minimum quarterly distribution to our unitholders;
• the limitations that our level of indebtedness may have on our financial flexibility;
• our ability to obtain new sources of natural gas, which is dependent on factors largely beyond our control;
• the availability of capital resources to fund capital expenditures and other contractual obligations, and our ability to access those resources through the debt or equity
capital markets;
• competitive conditions;
• the unavailability of third-party pipelines interconnected to our gathering systems or the potential that the volumes we gather do not meet the quality requirement of such
pipelines;
• new asset construction may not result in revenue increases and will be subject to regulatory, environmental, political, legal and economic risks;
• our exposure to direct commodity price risk may increase in the future;
• our ability to maintain and/or obtain rights to operate our assets on land owned by third parties;
• hazards and operational risks that may not be fully covered by insurance;
• our dependence on Exterran Partners, L.P. for a significant portion of our compression capacity;
• our lack of industry diversification; and
• legislative or regulatory changes, including changes in environmental regulations, environmental risks, regulations by FERC and liability under federal and state
environmental laws and regulations.
Other factors that could cause our actual results to differ from our projected results are described in our 2013 Form 10-K and our other SEC filings. Individuals are cautioned not to
place undue reliance on forward-looking statements, which speak only as of the date hereof. We undertake no obligation to publicly update or revise any forward-looking statements
after the date they are made, whether as a result of new information, future events or otherwise.
FORWARD-LOOKING STATEMENTS
21 © 2014 The Williams Companies, Inc. All rights reserved.Jefferies Global Energy Conference | 11/12/14
This presentation includes combined adjusted EBITDA for Williams Partners and Access Midstream Partners for 2015 and cash distribution
coverage ratio, which are non-GAAP financial measures as defined under the rules of the SEC.
For Williams Partners L.P. we define adjusted EBITDA as net income (loss) attributable to partnership before income tax expense, net interest
expense, depreciation and amortization expense, equity earnings from investments and allowance for equity funds used during construction,
adjusted for equity investments cash distributions to partnership and certain other items management believes affect the comparability of
operating results.
Access Midstream Partners defines adjusted EBITDA as net income (loss) before income tax expense, interest expense, depreciation and
amortization expense and certain other items management believes affect the comparability of operating results.
For Williams Partners L.P. we also calculate the ratio of distributable cash flow to the total cash distributed (cash distribution coverage ratio).
This measure reflects the amount of distributable cash flow relative to our cash distribution. We define distributable cash flow as net income
plus depreciation and amortization and cash distributions from our equity investments less our earnings from our equity investments,
income attributable to noncontrolling interests and maintenance capital expenditures. We also adjust for payments and/or reimbursements
under omnibus agreements with Williams and certain other items.
This presentation is accompanied by a reconciliation of adjusted EBITDA to its nearest GAAP financial measure. Management uses this
financial measure because it is an accepted financial indicator used by investors to compare company performance. In addition, management
believes that this measure provides investors an enhanced perspective of the operating performance of the partnership's assets and the cash
that the business is generating. Adjusted EBITDA is not intended to represent cash flows for the period, nor is it presented as an alternative
to net income or cash flow from operations. It should not be considered in isolation or as substitutes for a measure of performance prepared
in accordance with United States generally accepted accounting principles
Non-GAAP Disclaimer

22 © 2014 The Williams Companies, Inc. All rights reserved.Jefferies Global Energy Conference | 11/12/14
Net Income After Tax Reconciliation to 2015
Adjusted EBITDA
Williams Access
Partners Midstream Combined*
Low High Low High Low High
Net income after tax attributable to partnership 1,755$ 2,105$ 470$ 645$
Net interest expense 645 665 225 175
Income tax expense 45 55 5 5
Equity earnings from investments (310) (340) - -
Equity investments cash distributions to partnership 360 400 - -
Depreciation & amortization (DD&A) 1,010 1,060 550 525
Equity allowance for funds used during construction (90) (100) - -
Adjusted EBITDA attributable to partnership 3,415$ 3,845$ 1,250$ 1,350$ 4,665$ 5,195$