JCDECAUX SA CONSOLIDATED FINANCIAL STATEMENTS AS...
47
JCDECAUX SA ________ CONSOLIDATED FINANCIAL STATEMENTS AS OF DECEMBER 31, 2004 Translated from French and in accordance with French generally accepted accounting principles
Transcript of JCDECAUX SA CONSOLIDATED FINANCIAL STATEMENTS AS...

JCDECAUX SA
________
CONSOLIDATED FINANCIAL STATEMENTS
AS OF DECEMBER 31, 2004
Translated from French and in accordance with French generally accepted accounting principles
JCDECAUX SA – CONSOLIDATED FINANCIAL STATEMENTS
TABLE OF CONTENTS
STATUTORY AUDITOR’S REPORT BALANCE SHEET 1 INCOME STATEMENT 3 CASH FLOW STATEMENT 4 NOTES TO THE CONSOLIDATED FINANCIAL STATEMENTS 5
1
FIDUCIAIRE REVISUNION
MAZARS 169, boulevard Malesherbes
75017 Paris S.A. au capital de € 128 400
Commissaire aux Comptes Membre de la compagnie
régionale de Paris
BARBIER FRINAULT & AUTRES ERNST & YOUNG
41, rue Ybry 92576 Neuilly-Sur-Seine Cedex
S.A.S. à capital de € 37 000
Commissaire aux Comptes Membre de la compagnie
régionale de Versailles (Free translation of a French language original)
To the Shareholders of JCDecaux S.A,
In compliance with the assignment entrusted to us by your shareholders’ meeting, we have audited the
accompanying consolidated financial statements of JCDecaux S.A. for the year ended December 31, 2004.
These consolidated financial statements have been approved by the Executive Board. Our responsibility is
to express an opinion on these financial statements based on our audit.
I. - Opinion on the financial statements
We conducted our audit in accordance with professional standards applied in France. Those standards
require that we plan and perform the audit to obtain reasonable assurance about whether the financial
statements are free from material misstatement. An audit includes examining, on a test basis, evidence
supporting the amounts and disclosures in these financial statements. An audit also includes assessing the
accounting principles used and significant estimates made by management, as well as evaluating the
overall presentation of the financial statements. We believe that our audit provides a reasonable basis for
our opinion.
In our opinion, the financial statements give a true and fair view of the assets, liabilities, financial position
and results of the consolidated group of companies in accordance with the accounting rules and principles
applicable in France.
II. - Justification of assessments
In accordance with the requirements of article L.225-235 of the French Company Law (Code de Commerce)
relating to the justification of our assessments, we bring to your attention the following matters:
2
As specified in Note 1.8 to the consolidated financial statements, JCDecaux’s Management carries out a
valuation of its tangible, intangible fixed assets and goodwill based on the prospects of future profitability.
In compliance with French professional standards applicable to accounting estimates, we analysed the data
and assumptions used to make these estimates, notably relating to the determination of the fair value of
these assets to be used as a comparison with their book value. Such fair value is assessed for each
business segment on the basis, in particular, of cash-flow forecasts prepared by the Group. We have
assessed that these estimates are reasonable.
The assessments were thus made in the context of the performance of our audit of the consolidated
financial statements taken as a whole and therefore contributed to the formation of the unqualified audit
opinion expressed in the first part of this report.
III. - Specific verification
In accordance with professional standards applicable in France, we have also verified the information given
in the group management report. We have no matters to report regarding its fair presentation and
conformity with the consolidated financial statements.
March 15th, 2005
The Statutory Auditors
FIDUCIAIRE REVISUNION MAZARS
BARBIER FRINAULT & AUTRES
ERNST &YOUNG
Claude Chezaud Michel Rosse Gilles Galippe

- 1 -
JCDecaux SA - Consolidated Financial Statements
BALANCE SHEET
Assets
(In million euros) 12/31/2004 12/31/2003 12/31/2002
Intangible assets (net) 34.4 31.9 33.1
Goodwill (net) 1,113.7 1,178.6 1,080.0
Tangible assets (net) 668.9 675.3 722.3
Investments (net) 80.8 75.9 79.8
FIXED ASSETS 1,897.8 1,961.7 1,915.2
Inventories (net) 75.8 95.4 92.6
Trade receivables (net) 404.6 386.7 403.1
Others receivables (net) 128.1 141.7 126.7
Marketable securities (net) 2.7 85.9 82.4
Cash 50.0 71.8 80.0
Deferred tax assets (net) 13.3 15.0 29.7
CURRENT ASSETS 674.5 796.5 814.5
TOTAL ASSETS 2,572.3 2,758.2 2,729.7

- 2 -
JCDecaux SA - Consolidated Financial Statements
BALANCE SHEET
Liabilities and Equity
(In million euros) 12/31/2004 12/31/2003 12/31/2002
SHAREHOLDERS ' EQUITY
Capital 3.4 3.4 3.4 Share premium 929.3 923.2 923.2 Legal reserve 0.3 0.3 0.3 Consolidated reserves / Group share 405.3 366.0 360.5 Current year net income / Group share 78.1 40.9 26.0
SHAREHOLDERS ' EQUITY (Group share) 1,416.4 1,333.8 1,313.4
Minority interests 29.6 31.4 64.2
SHAREHOLDERS ' EQUITY (total) 1,446.0 1,365,2 1,377.6
Provisions for risks and contingencies 124.3 114.6 82.6
Deferred tax liabilities 27.3 16.5 20.7
LIABILITIES
Bonds 367.8 375.0 Bank borrowings 117.5 394.6 737.7 Miscellaneous loans and financial debts 10.3 11.2 8.3 Trade payables 150.9 147.2 159.1 Other liabilities 313.6 321.2 314.0 Bank overdrafts 14.6 12.7 29.7
LIABILITIES 974.7 1,261.9 1,248.8
TOTAL LIABILITIES & SHAREHOLDERS' EQUITY 2,572.3 2,758.2 2,729.7
- 3 -
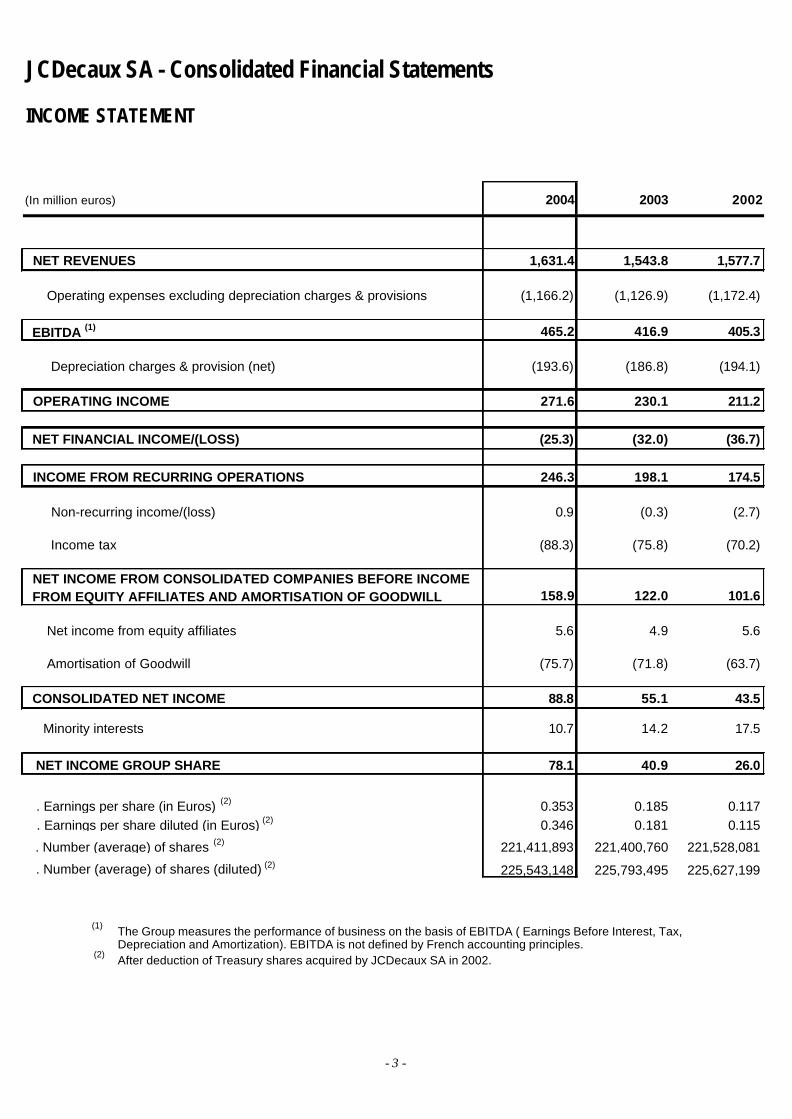
(1) The Group measures the performance of business on the basis of EBITDA ( Earnings Before Interest, Tax,
Depreciation and Amortization). EBITDA is not defined by French accounting principles. (2) After deduction of Treasury shares acquired by JCDecaux SA in 2002.
JCDecaux SA - Consolidated Financial Statements
INCOME STATEMENT
(In million euros) 2004 2003 2002
NET REVENUES 1,631.4 1,543.8 1,577.7
Operating expenses excluding depreciation charges & provisions (1,166.2) (1,126.9) (1,172.4)
EBITDA (1) 465.2 416.9 405.3
Depreciation charges & provision (net) (193.6) (186.8) (194.1)
OPERATING INCOME 271.6 230.1 211.2
NET FINANCIAL INCOME/(LOSS) (25.3) (32.0) (36.7)
INCOME FROM RECURRING OPERATIONS 246.3 198.1 174.5
Non-recurring income/(loss) 0.9 (0.3) (2.7)
Income tax (88.3) (75.8) (70.2)
NET INCOME FROM CONSOLIDATED COMPANIES BEFORE INCOME FROM EQUITY AFFILIATES AND AMORTISATION OF GOODWILL 158.9 122.0 101.6
Net income from equity affiliates 5.6 4.9 5.6
Amortisation of Goodwill (75.7) (71.8) (63.7)
CONSOLIDATED NET INCOME 88.8 55.1 43.5
Minority interests 10.7 14.2 17.5
NET INCOME GROUP SHARE 78.1 40.9 26.0
. Earnings per share (in Euros) (2) 0.353 0.185 0.117 . Earnings per share diluted (in Euros) (2) 0.346 0.181 0.115
. Number (average) of shares (2) 221,411,893 221,400,760 221,528,081
. Number (average) of shares (diluted) (2) 225,543,148 225,793,495 225,627,199

- 4 -
(In million euros) 2004 2003 2002
Net income (Group share) 78.1 40.9 26.0Minority interests 10.7 14.2 17.5
Income from equity affiliates (5.6) (4.9) (5.5)Dividends received from equity affiliates 4.6 4.0 4.3Change in deferred tax 13.3 2.4 (10.3)
Net amortisation & provision allowance and Effect of exchange rate 267.5 272.6 261.8Capital (Gain/Loss) (0.5) (1.9) 6.5
FUNDS FROM OPERATIONS 368.1 327.3 300.3
Change in working capital (8.0) 3.2 24.2
NET CASH PROVIDED BY OPERATING ACTIVITIES 360.1 330.5 324.5
Acquisitions of intangible assets (8.8) (8.1) (10.2)
Acquisitions of tangible assets (166.8) (142.7) (156.5)
Acquisitions of financial assets (long term investments) (14.8) (204.6) (49.9)Acquisitions of financial assets (others) (5.6) (7.4) (1.8)
Change in payables on assets (1.0) (3.8)Total Investments (196.0) (363.8) (222.2)
Disposals of intangible assets 0.2Disposals of tangible assets 9.7 9.5 10.1Disposals of financial assets (long term investments) 0.7 0.2 1.2Disposals of financial assets (others) 1.4 1.7 18.4Change in receivables on assets 0.4 3.9Total Disposals of assets 12.2 11.6 33.6
NET CASH (USED FOR) PROVIDED BY INVESTING ACTIVITIES (183.8) (352.2) (188.6)
Dividends paid (12.5) (8.4) (12.3)
Reduction of capitalRepayment of debt (349.2) (346.9) (202.1)Cash inflow from financing activities (361.7) (355.3) (214.4)
Increase in shareholders' equity 6.9Increase in debt 72.5 388.3 38.6Cash outflow from financing activities 79.4 388.3 38.6
NET CASH (USED IN) PROVIDED BY FINANCING ACTIVITIES (282.3) 33.0 (175.8)
Effect of exchange rates fluctuations (0.9) 1.0 (2.7)
CHANGE IN CASH POSITION (106.9) 12.3 (42.6)
Cash position beginning of period 145.0 132.7 175.3
Cash position end of period 38.1 145.0 132.7
CASH FLOW STATEMENT
- 5 -
JCDECAUX SA – CONSOLIDATED FINANCIAL STATEMENTS
NOTES TO THE CONSOLIDATED FINANCIAL STATEMENTS
MAJOR EVENTS OF THE YEAR
In 2004, JCDecaux pursued its strategy of development through organic growth, winning public tenders for advertising contracts in the Street Furniture and airport businesses. Financing Following the implementation in December 2003, of a committed revolving credit line, JCDecaux SA repaid in advance in January 2004 the remaining amount of the non revolving Tranche A of its syndicated facility set-up in 2000 and during first half 2004, cancelled in full the revolving Tranche B of this facility. Changes in the portfolio of contracts In France, JCDecaux has been chosen by the Tender Commission of Greater Lyon for its Street Furniture contract. This 13-year contract includes the supply, installation and maintenance of between 1,800 and 2,600 bus shelters, 600 MUPI’s (Street Furniture for Information) and 2,000, 3,000 or 4,000 bicycles. In France as well, JCDecaux has won the Street Furniture tender for the city of Saint-Etienne for a period of 12 years and the bus shelter contract for the city of Grenoble and its suburban area for a period of 15 years. Lastly the Group did not renew the Bordeaux’ bus shelter contract but is still able to offer the Bordeaux area in its Street Furniture commercial offer, especially through its positions in the city of Bordeaux and its MUPI® and Seniors offer. In Spain, JCDecaux has renewed, for a period of 6 years, its advertising contract for eighteen airports across the Iberian peninsula (including Barcelona, Alicante, Malaga, Valencia and Seville) and has also won the six years contract for the four airports of the Balearic Islands (including Palma de Mallorca). These twenty-two airports represent an annual passenger traffic of 79 million, i.e. 52% of the Spanish market. In Italy, JCDecaux, in partnership with AVIP, Turin’s leading outdoor advertising firm, has won the contract for the city of Turin. The 20-years contract covers the design, installation and maintenance of 1,200 street furniture units.
In Japan, in partnership with the Mitsubishi Corporation, JCDecaux has won the first exclusive bus shelter advertising contract in Yokohama, after an invitation to tender for the 20-year contract, which covers 500 bus shelters. Partnerships and Acquisitions
In March 2004, JCDecaux increased its stake from 50% to 75% in Univier Communications BV, a Netherlands-based company, holding several leader outdoor companies in the Baltic States. The remaining 25% are owned by Univier Communications NV. In Germany, JCDecaux, via the JCDecaux GmbH (formerly Klett Decaux GmbH) company acquired 100% of the WFA Wartehallen Finanz AG company. In May 2004, the company JCDecaux New-York Llc purchased the remaining 30% in JCDecaux New York Inc., for a price of 2.2 million dollars (about €1.8 million). This operation increased the percentage of ownership in JCDecaux New York Inc. to 100%.

- 6 -
1. ACCOUNTING METHODS AND PRINCIPLES
1.1 General principles The Group's consolidated financial statements have been prepared in accordance with the legal and regulatory provisions applicable in France as set out by Regulation No. 99-02 of the French Accounting Regulations Committee on consolidated financial statements. The Group has not opted for the early application of Regulation No. 2002-10 of the Committee on Accounting Regulations on the depreciation and amortization of assets.
1.2 Scope and methods of consolidation
The companies of the Group that are of significant size are consolidated. Generally, subsidiaries meeting one of the following three criteria are consolidated: Amount (absolute value) In million euros greater than • Revenues 0.8 • Equity (Group Share) 1.5 • Net Income (Group Share) 0.6 Are also consolidated companies which are below those criteria but which have synergies with other companies of the Group. The aggregation of the non-consolidated companies is not significant. The financial statements of companies under exclusive control are fully consolidated. Companies that are jointly controlled by the Group in association with other shareholders are consolidated following the proportional method, where such companies’ financial statements are consolidated to the extent of the Group’s proportionate interest. The financial statements of companies over which the Group exercises, either directly or indirectly, a significant influence on the management and financial policy are accounted for under the equity method. Table 6.2 presents the list of consolidated subsidiaries and the consolidation method used for each of these companies. All significant transactions between Group fully consolidated companies are eliminated upon consolidation. Transactions with companies consolidated under the proportional method are eliminated up to the percentage of integration. Results within consolidated companies are also eliminated.
1.3 End of the fiscal year The consolidated financial statements are prepared on the basis of annual financial statements for all companies as of December 31.
1.4 Translation of financial statements prepared in foreign currency Foreign subsidiaries’ financial statements are translated on the following basis : - year-end exchange rates for balance sheet items, - average annual rates for income statement items.

- 7 -
Foreign exchange differences relating to a monetary component which is in substance an integral part of the Group’s net investment in foreign consolidated companies are recorded within consolidated shareholders’ equity until disposal or liquidation of the net investment, at which date they are to be recorded as income or charges in the income statement as are the other exchange translation differences. This accounting treatment has been applied to the companies JCDecaux Uruguay and JCDecaux Salvador (Brazil).
1.5 Intangible assets Pre-operational costs as well as research and development costs are included in operating expenses in the income statement, as incurred. Concessions and patents are amortized over their legal useful life. Only significant, individualized and clearly identified software (such as ERP) are capitalized and amortized over a period of 5 years maximum. Other software are included in operating expenses. Going concern values and goodwill (not resulting from consolidation) are completely amortized within the year they are recorded in the financial statements.
1.6 Goodwill The difference between the acquisition cost of shares of consolidated companies and the proportion acquired in the equity adjusted in compliance with Group principles and methods is, after analysis, divided up between: - positive or negative valuation differences relating to certain identifiable balance-sheet items, - goodwill for the remaining unallocated balance. The acquisition cost of shares includes related purchase costs (fees, etc….). Goodwill is amortized using the straight -line method over a period not exceeding 20 years. In case of particular circumstances (major structural modifications of technical, regulatory or market conditions, in the case of a planned sale or of insufficient profitability, etc… ), impairment of goodwill is established, beyond the scheduled amortization allowances, by means of a provision in line with the methodology described in note 1.8.
1.7 Tangible assets
Tangible assets appear on the balance sheet at historical acquisition cost. Depreciation allowances are calculated on a straight -line basis over the following normal useful lives:
DEPRECIATION PERIOD Tangible assets: - Buildings and constructions 10 to 50 years - Technical installations, tools and equipment 5 to 10 years
(excluding street furniture and billboards) - Street furniture and billboards 2 to 10 years

- 8 -
Other tangible assets: - Fixtures and fittings 5 to 10 years - Transport equipment 3 to 10 years - Computer equipment 3 to 5 years - Furniture 5 to 10 years Street Furniture: Street Furniture (Bus shelters, MUPIs–City Light Billboards, Seniors, Electronic Information Boards, Automatic Public Toilets, Morris Columns, etc.) is depreciated following the straight-line method over a period of 7 to 10 years. Billboards: Billboards are depreciated according to the method of depreciation prevailing in the countries concerned in accordance with local regulations and economic conditions. The main method of depreciation is the straight -line method over a period of 2 to 10 years. In France, standard billboards are depreciated according to the accelerated method over 4 years. Structural street furniture maintenance costs are capitalized where such costs result in the extension of the furniture useful life compared to the furniture economic life initially planned, and are depreciated over a period equal to half of the useful economic life of the street furniture.
1.8 Valuation of tangible and intangible fixed assets and of goodwill The valuation of assets (intangible, tangible assets and goodwill) is assessed at the end of the accounting year based on future profitability prospects resulting from the comparison between the net booked value of such assets and their fair value so as to determine, if necessary, whether an impairment loss should be recognized. This fair value is measured at the level of each segment of business (Billboard, Street Furniture and Transport), notably on the basis of discounted future cash flows derived from the use of the assets, of their residual value and of the synergies expected by the Group. The methodology used is the following :
• Targeting of affiliates for which there is an indication that their assets may be impaired. This analysis is based, for the Street Furniture and Transport activities, on a projection of the 2004 Ebitda over the residual duration of the contracts. For the Billboard activity, a 15 year duration is used and the residual value of assets is taken into account.
• Review of the affiliates which were targeted further to the process described in the previous
paragraph. An analysis of the fair value of the assets of these affiliates is carried out based on the discounted future cash flows derived from the use of these assets. The following assumptions are used:
- Yearly Cash flow projections are based on group financial budgets / forecasts, - Residual duration of Street Furniture and Transport contracts is more accurately
approached using a probability of renewal at contract expiration. In the Transport activity, for the main airports, the probability used is a one time renewal of the contract at contract expiration,
- The duration used for the Billboard activity (i.e. 15 years) is left unchanged and the residual value of assets is taken into account,
- The discount rate used amounts to 8.5%, it is calculated from the Weighted Average Cost of Capital.

- 9 -
• Comparison within each segment of activity (Billboard, Street Furniture and Transport) between the fair values and the carrying amounts of assets.
The fair value, for a segment of activity corresponds to the sum of the fair values of the affiliates belonging to this segment. As of December 31, 2004, the review of the value of assets, following the above-described methodology, did not lead to the recognition of an impairment loss. In other respects, under some exceptional circumstances (loss of a specific contract with low synergies within its segment of activity), the Group may recognize an impairment loss at the affiliate level rather than at the activity’s segment level. As such, a depreciation of €3.0 million was recorded in 2004.
1.9 Investments in non-consolidated subsidiaries
This item consists of equity interests in companies which did not show any activity during the 2004 fiscal year, or on which the Group has no significant influence or lastly which would not significantly contribute to the consolidated financial statements, as a result, in particular, of the predominance of intra-Group transactions recorded in their accounts.
Depreciation allowances are booked for impairment of investments in non-consolidated affiliates and long-term investment securities when their realizable or going concern values assessed investment by investment become lower than their historical cost. The realizable and going concern values take into account the share in equity and the profitability prospects.
1.10 Inventories Inventories mainly consist of: - Street furniture or billboards in kit form or partially assembled, - Parts necessary for the maintenance of installed street furniture. Inventories are valued on the basis of the weighted average cost, which may include internal assembly costs. Depreciation allowances are booked as needed, when as a result of business prospects, their realizable value is less than their book value. When the inventories are sold inside or outside the Group, direct or indirect production costs are included in the valuation of the inventories.
1.11 Provisions for bad debt A provision for bad debt is recorded when the collection value of receivables is less than the book value.
1.12 Marketable securities Marketable securities are stated at the lower of cost or market values. If the value of marketable securities at year-end shows an overall capital loss by class of securities, a depreciation allowance is recorded for the same amount.
1.13 Provision for retirement benefits and other benefits
The Group’s obligations resulting from defined benefit plans, as well as their cost, are determined under the projected credit unit method.
- 10 -
This method consists in measuring the obligation in accordance with the projected wage at the end of the working life and the rights acquired at the valuation date, determined in accordance with the collective agreements, branch agreements or legal rights in force.
The actuarial assumptions used to determine the obligations are based on the economic conditions prevailing in the country of the plans and the demographic assumptions adapted to each company.
These benefit plans are either funded, their assets being managed by an entity legally separate from the Group, or partially funded or unfunded, the Group’s obligations being then covered by a provision in the balance sheet.
For post-employment defined benefits, actuarial gains or losses exceeding the greater of 10% of the present value of the defined benefit obligation or of the fair value of the related plan assets are recognised as an expense or a profit over the remaining average working lives within the Group of the Group’s employees. Past service costs are recognised as an expense, on a straight-line basis, over the average period until the benefits become vested.
For long term benefits, actuarial gains or losses and past service costs are recognised as an expense or a profit immediately when they occur.
1.14 Turnover Group turnover mainly consists in sales of advertising spaces on street furniture equipment, billboards and advertising in transport systems. Advertising space turnover, rentals and services provided are recorded as turnover for the period in which the service is performed. Turnover resulting from the sale of advertising spaces is recorded on a net basis after deduction of commercial rebates. For the billboard line of business and in some countries, commissions are paid by the Group to advertising agencies and buying groups when they are intermediaries between the Group and advertisers. These commissions are in this case deducted from the turnover. In agreements where the Group pays variable royalties or pays back a part of its advertising revenues to franchisers, the Group classifies gross advertising revenues as turnover and books royalties and the sales part repaid as operating charges, as the Group is not dealing as an agent but bears the risks and rewards incidental to the activity.
1.15 Non-recurring income / loss Non-recurring gains and losses consist of significant items which, in light of their type, their unusual nature and their non-recurrence cannot be considered as inherent to the recurring operating activity of the Group, such as capital gains and losses on sales and related charges or miscellaneous penalties.
1.16 Current and deferred income tax The Group records deferred tax resulting from temporary differences in the carrying amounts of assets and liabilities for financial reporting purposes and the amounts used for tax purposes. Using the liability method, deferred tax is calculated by applying the most recent applicable tax rate. Deferred tax assets are subject to a valuation allowance when they are unlikely to be used within a reasonable time frame. The income tax charge in the consolidated income statement corresponds to the current tax due by each consolidated taxable entity, adjusted for deferred tax. The amount of deferred tax recorded, results mainly from consolidation adjustments (standardization of Group accounting principles and amortization/depreciation periods for

- 11 -
tangible and intangible assets), from temporary differences between accounting and taxable income. Deferred tax assets on tax losses carried forward are systematically computed, and are subject to a depreciation allowance when their recoverability over a reasonable period is not quite certain.
1.17 Financial instruments Interest rate swaps, caps and floors contracted in order to limit the interest rate exposure are included in the financial result. Premiums related to caps and floors are recorded as deferred charges and are recognized over the lifespan of the contract. The fair market value of such instruments is subject to a specific disclosure within the Notes related to off-balance sheet commitments. Profits and losses induced by future exchange transactions, set up to cover the foreign exchange rate risk, are taken into account in the financial result of the Group. They compensate for the latent losses or profits on the underlying elements.
1.18 Finance and operating leases The Group does not apply the preferential method (according to Regulation No. 99-02 of the French Accounting Regulations Committee on consolidated financial statements) which consists to restate finance lease contracts in the consolidated accounts. For the first time adoption of the International Financial Reporting Standards, the Group launched a survey to identify such operations that are individually material.
Finance and operating lease commitments as well as rent, minimum franchise payment commitments are disclosed in note 4.3 regarding off-balance sheet commitments.
1.19 Earnings per share Earnings per share are computed based on the weighted average number of shares excluding stock options. The calculation of this indicator after dilution takes into account the weighted average number of shares as well as the weighted average number of stock options granted or cancelled during the fiscal year. The weighted average number of treasury shares repurchased by the Group is deducted from the weighted average number of shares taken into account for the calculation of the ratio.
- 12 -
2. COMMENTS ON THE BALANCE SHEET
2.1 Scope of consolidation The main changes that took place during 2004 are as follows: - Entries into the scope of consolidation The recently created Gewista Service GmbH company in Austria, held by Gewista at 100%, has been consolidated, under the full integration method, for the first time in 2004.
The company JCDecaux-Publimedia in Spain, recently created to run the advertising contract for the Barcelona metro, in partnership with Publimedia, has been consolidated following the full integration method, for the first time in 2004. It is 70% held by JCDecaux Espana Sl. WFA Wartehallen Finanz AG company, which was acquired for €4.5 million has been consolidated under the full integration method for the first time in 2004. - Mergers
The company RCI, 100% held by JCDecaux SA, was merged into JCDecaux SA, with retrospective effect as at January 1st, 2004.
At January 1st, 2004, the company IGP Decaux Affichage (Italy), consolidated following the proportional method at 32.35% and 100% held by IGP Decaux (consolidated under the proportional method at 32.35%), was merged into its parent company.
The company Europlakat Usti nad Labem (Czeck Republic), 100% held by Europlakat Spol Sro, was merged, at January 1st, 2004, into Europlakat Spol Sro (consolidated under the full integration method). - Change in percentage of ownership
In March 2004, the company Europoster BV acquired an additional 25% interest in the company Univier Communications BV, at a price of €7.5 million. As a consequence, the Unicom Group which is composed of Univier Communications BV in the Netherlands, and its 100% owned subsidiaries, JCDecaux Unicom Baltic SIA in Latvia, JCDecaux Unicom Eesti OU in Estonia and JCDecaux Unicom UAB in Lithuania, is 75% held by JCDecaux. These companies remain consolidated following the proportional method considering the joint management exercised by the JCDecaux Group since July 1st, 2003. In May 2004, the company JCDecaux New-York Llc purchased the remaining 30% in JCDecaux New York Inc. (company without activity), at price of 2.2 million dollars (about €1.8 million). This operation brought the percentage of ownership in the JCDecaux New York Inc. company to 100%. The following changes took place in Central Europe in the Europlakat International Werbe GmbH company : In May 2004, the company Europlakat International Werbe GmbH (consolidated under the proportional method at 50%) purchased the remaining 20% in Europlakat Yu Doo (Serbia) at a price of €320 000. As a consequence, Europlakat Yu Doo is 100% held by Europlakat International Werbe GmbH. Besides, in June 2004, the company Europlakat International Werbe GmbH sold 12.5% of the shares of AQMI, a holding company owning 100% of Alma Quattro’s shares (Serbia &

- 13 -
Montenegro). This operation changed JCDecaux’ percentage of interest in both companies from 33.5% to 29.3%. Lastly, in June 2004, the company Proreklam Europlakat Doo (subsidiary of Europlakat International GmbH in Slovenia) purchased, for a price equivalent to €45 000, an additional 3% interest in Plakatiranje Doo (Slovenia). This operation changed the direct percentage of ownership in this company to 54%.
- Exit from the scope of consolidation The company Pearl & Dean Publishing (Australia), which ceased its operations and was previously consolidated under the full integration method, has been excluded from the scope of consolidation as at January 1st, 2004 (exit of the scope without a sale). The company Aguesseau whose impact is considered immaterial has been excluded from the consolidation scope as at January 1st, 2004.
The impact on the turnover due to the changes in the consolidation scope during the accounting period is €5.7 million, including an increase of €4.4 million for the Street Furniture sector and an increase of €1.3 million for the Transport sector.
2.2 Goodwill As at December 31, 2004, goodwill represented €1,484.6 million in gross value and its cumulated amortization amounted to €370.9 million. The net book value of goodwill recorded in the consolidated financial statements as at December 31, 2004, 2003 and 2002 breaks down as follows :
(1) including from 2003 onwards the additional goodwill subsequent to the end of the joint agreement
between the JCDecaux SA Group and B&C Holding in Austria and in Central Europe. Following this operation which took place in August 2003, JCDecaux SA holds directly 30% of Affichage Holding and through its 100% owned subsidiary JCDecaux central Eastern Europe Holding GmbH, 67% of Gewista. It also includes the goodwill on Alma Quattro (Serbia & Montenegro)
In million Euros 12/31/2004 12/31/2003 12/31/2002
Media Communication Outdoor Advertising (Avenir division) 552.5 590.4 623.0
Goodwill arising from shares contributed by JCD Holding andminority shareholders in 2000 110.3 117.3 124.3
Austria, Switzerland and Central Europe partnerships (1) 245.1 259.5 155.7
IGP partnership (Italy) 37.4 39.7 42.0
Planigrama purchasing (Spain) 10.2 13.3 17.0
Univier Communications BV - The Netherlands (Unicom BalticsStates partnership) 13.5 7.7 7.5
Wall shares (35% in Wall AG and 50% in Wall USA) 49.6 52.1
Others 95.1 98.6 110.5
TOTAL 1,113.7 1,178.6 1,080.0

- 14 -
The variation of goodwill in 2004 breaks down as follows:
2.3 Tangible assets Breakdown by type of asset
As of December 31, 2004, gross tangible assets amounted to €761.4 million in France and €1,241.9 million in foreign countries compared to €736.6 million and €1,176.2 million respectively as of December 31, 2003. As of December 31, 2004, net tangible assets amounted to €668.9 million compared to €675.3 million as of December 31, 2003. As of December 31, 2004, in the Street Furniture segment, net tangible assets amounted to €492.6 million compared to €505.8 million as of December 31, 2003. As of December 31, 2004, in the Billboard segment, net tangible assets amounted to €151.4 million compared to €140.8 million as of December 31, 2003.
In million eurosGross value 12/31/2004
Depreciation or provisions 12/31/2004
Net value 12/31/2004
Net value 12/31/2003
Net value 12/31/2002
Land 32.0 1.2 30.8 29.6 30.9
Buildings 63.1 34.0 29.1 33.3 37.9
Technical installations, toolsand equipment 1,684.2 1,140.3 543.9 549.8 580.8
Other 203.8 158.5 45.3 51.1 62.0Fixed assets underconstruction 19.4 0.4 19.0 11.1 10.2
Advances and deposits 0.8 0.8 0.4 0.5
Total 2,003.3 1,334.4 668.9 675.3 722.3
In million euros Net Value
As of January 1st, 2004 1,178.6
New goodwill arising during 2004 10.6
Univier Communications BV (IP) 6.6
WFA Wartehallen Finanz AG 3.1
Others 0.9
Amortization and impairment of goodwill -75.7
Exchange gains / losses 0.2
As of December 31, 2004 1,113.7

- 15 -
As of December 31, 2004, in the Transport segment, net tangible assets amounted to €24.9 million compared to €28.7 million as of December 31, 2003.
(1) The net impact of the reclassifications is not zero, as some reclassifications have an impact on other
accounts in the balance sheet.
Changes in gross values (in M€)
In million euros Land Building
Technical installation,
tools & equipment
Others Total
As of January 1, 2002 34.8 75.9 1,452.5 236.2 1,799.4
Changes in the consolidation scope 0.0 0.0 7.3 1.2 8.5Capitalized maintenance (2002 fiscal year) 22.2 22.2Acquisitions 0.0 2.4 111.0 20.8 134.2Sales (0.4) (2.5) (50.1) (11.3) (64.3)Translation adjustments (1.8) (0.4) (42.9) (4.5) (49.6)Reclassifications (1)
0.1 2.9 5.0 (7.4) 0.6
As of December 31, 2002 32.7 78.3 1,505.0 235.0 1,851.0
Changes in the consolidation scope (0.3) 0.1 (0.2)Capitalized maintenance (2003 fiscal year) 21.4 21.4Acquisitions 1.5 0.7 97.3 21.8 121.3Sales (0.8) (0.8) (31.6) (9.8) (43.0)Translation adjustments (2.2) (0.5) (30.1) (4.2) (37.0)Reclassifications (1) 10.3 (11.0) (0.7)
As of December 31, 2003 31.2 77.7 1,572.0 231.9 1,912.8
Changes in the consolidation scope 3.6 0.3 3.9Capitalized maintenance (2004 fiscal year) 27.7 27.7Acquisitions 2.2 0.7 96.7 39.4 139.0Sales (0.4) (14.7) (30.0) (29.7) (74.8)Translation adjustments 0.0 (7.1) (0.3) (7.4)Reclassifications (1) (1.0) (0.6) 21.3 (17.6) 2.1
As of December 31, 2004 32.0 63.1 1, 684.2 224.0 2,003.3

- 16 -
2.4 Financial Investments These consist of shares in equity affiliates, investments in non-consolidated subsidiaries, loans to non-fully consolidated companies and other investments. Breakdown (net book value)
(1) The decrease of €15.7 million in investments between 2002 and 2003 is mainly related to the
consolidation of Wall AG as an equity affiliate. Shares in equity affiliates
(1) This company was acquired in 2002. It is consolidated under the proportional method from July 1st,
2003 onwards.
In million euros 12/31/2004 12/31/2003 12/31/2002
Shares in equity affiliates 56.3 55.0 49.2
Shares in non-consolidated subsidiaries (1) 7.0 5.8 21.5
Loans 11.6 9.4 4.0
Related receivables 0.1 0.6 0.4
Other investments 5.8 5.1 4.7
TOTAL 80.8 75.9 79.8
In million euros % of interest as of 2004 12/31/2004 12/31/2003 12/31/2002
SwitzerlandAffichage Holding 30.00% 43.3 42.6 45.7
The NetherlandsUnivier Communications BV (1) 75.00% 1.6
GermanyStadtreklame Nürnberg GmbH 35.00% 2.4 2.0 1.8Ilg Aussenwerbung Zacharias 10.00% 0.1 0.1 0.1Wall AG 35.00% 11.0 10.6
United States of AmericaWall Holdings / Wall USA Inc. 50.00% (0.5) (0.3)
TOTAL 56.3 55.0 49.2

- 17 -
Changes in shares in equity affiliates are as follows:
In million euros12/31/2003 Income Dividends Scope Translation 12/31/2004
Affichage Holding 42.6 3.9 (3.6) 0.4 43.3
Stadtreklame Nürnberg GmbH 2.0 0.7 (0.3) 2.4
Ilg Aussenwerbung Zacharias 0.1 0.1
Wall AG 10.6 1.6 (0.6) (0.6) 11.0
Wall Holdings / Wall USA Inc . (0.3) (0.6) 0.4 (0.5)
Total 55.0 5.6 (4.5) (0.2) 0.4 56.3

- 18 -
Shares in non-consolidated subsidiaries
(1) Equity excluding 2004 net income. (2) 2003 Data for the income and the equity
In million euros % Capital Income 2004
Equity 12/31/04
(1)
Gross value of shares as of
12/31/04
Net value of shares as of
12/31/04
FranceGommage & Aspiration 79.93% (0.1) (0.5) 0.2 0.0Affimétrie 33.00% 0.0 0.4 0.2 0.2
AustriaARGE Autobahnwerbung (2) 50.00% 0.4 0.8 0.1 0.1Objekt Werbung Gmbh (2) 25.00% 0.2 (0.5) 0.9 0.6
ItalySer Com 51.00% 0.2 0.5 0.1 0.1SIPA 49.00% 0.4 0.5 0.3 0.3ASPE (2) 49.00% 0.2 0.3 0.2 0.2Pubblisuccesso Lombardia (2) 100.00% 0.0 0.3 0.1 0.1
PortugalJCD Neonlight Portugal 67.04% 0.1 0.1 0.0 0.0
SwedenOutdoor Impact AB 48.5% 0.0 0.0 0.5 0.5
Czeck RepublicISPA Brno Spol Sr O 100.00% 0.0 0.0 0.3 0.3
SloveniaN.B.S.H. Proreklam-Europlakat Prishtina 60.00% 0.0 (0.1) 0.0 0.0Madison 30.00% 0.1 0.5 0.4 0.4
AmericasUDC - JCDecaux Airport 50.00% 0.1 0.0 0.6 0.0UTE JCDecaux Argentina 50.00% 0.1 0.5 0.3 0.2
Asia / PacificJCDecaux Macau 80.00% 0.0 0.1 0.1 0.1Fidji 100.00% 0.0 3.4 3.5 3.5JCD Neonlight 100.00% 0.1 0.0 0.8 0.0
Others 0.6 0.4
TOTAL 9.2 7.0

- 19 -
2.5 Inventories
The gross value of inventories as of December 31, 2004 decreased by € 3.0 million for the French companies, mainly JCDecaux SA by €3.0 million, and decreased by €7.1 million for foreign companies, mainly Gewista for €5.4 million. These decreases are due to significant installations of street furniture in 2004. Among the increase in provision of €9.5 million, €9.1 million were recorded by JCDecaux SA.
2.6 Trade receivables and provision for depreciation of receivables
As at December 31, 2004, the gross value of receivables decreased by €1.7 million for the French companies and increased by €20.0 million for foreign companies.
In million euros 12/31/2004 12/31/2003 12/31/2002
Receivables (Gross value) 435.3 417.0 436.4
Provision for depreciation (30.7) (30.3) (33.3)
Receivables (Net value) 404.6 386.7 403.1
In million euros 12/31/2004 12/31/2003 12/31/2002
Gross value of inventories 99.7 109.8 104.8
Depreciation allowances (23.9) (14.4) (12.2)
Net value of inventories 75.8 95.4 92.6
- 20 -
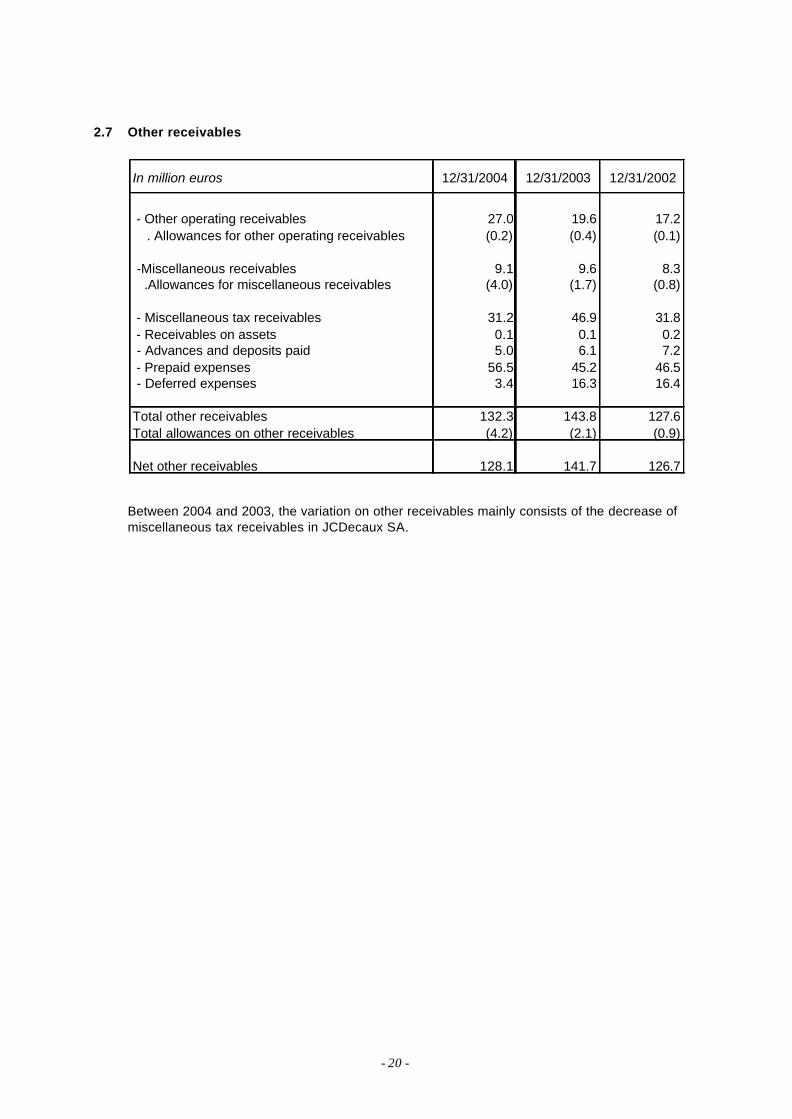
2.7 Other receivables
Between 2004 and 2003, the variation on other receivables mainly consists of the decrease of miscellaneous tax receivables in JCDecaux SA.
In million euros 12/31/2004 12/31/2003 12/31/2002
- Other operating receivables 27.0 19.6 17.2 . Allowances for other operating receivables (0.2) (0.4) (0.1)
-Miscellaneous receivables 9.1 9.6 8.3 .Allowances for miscellaneous receivables (4.0) (1.7) (0.8)
- Miscellaneous tax receivables 31.2 46.9 31.8 - Receivables on assets 0.1 0.1 0.2 - Advances and deposits paid 5.0 6.1 7.2 - Prepaid expenses 56.5 45.2 46.5 - Deferred expenses 3.4 16.3 16.4
Total other receivables 132.3 143.8 127.6Total allowances on other receivables (4.2) (2.1) (0.9)
Net other receivables 128.1 141.7 126.7

- 21 -
2.8 Marketable securities
In million euros 12/31/2004 12/31/2003 12/31/2002
France 0.5 85.3 73.0Spain 1.6 8.7Finland 0.5 0.5 0.5Portugal 0.1 0.1 0.2Total 2.7 85.9 82.4
The difference between the book value and the market value of marketable securities is not material. Marketable security decrease is due to the set up by JCDecaux SA of a revolving credit line which enabled to repay in advance the remaining amount of the non revolving Tranche A of its syndicated facility.
2.9 Net deferred tax 2.9.1 Deferred tax recorded
As of December 31, 2004, the decrease of €12.5 million in the net deferred tax mainly comes from France for € 9.6 million, Sweden for €1.1 million, Australia for €1.1 million, the United Kingdom for €0.9 million, Denmark and Iceland for €0.8 million whereas the increase comes from Spain for €1.3 million.
2.9.2 Unrecognized deferred tax assets on tax losses carried forward
Deferred tax on losses carry-forward which has been fully depreciated amounts to €25.4 million as at December 31, 2004. It includes €9.7 million from North America, €9.6 million from Europe, €3.5 million from South America and €2.6 million from Asia.
In million euros 12/31/2004 12/31/2003 12/31/2002
Deferred tax assets (net of provision for depreciation)
13.3 15.0 29.7
Deferred tax liabilities (27.3) (16.5) (20.7)
TOTAL (14.0) (1.5) 9.0

- 22 -
2.10 Changes in Stockholders’ Equity
(1) No dividends have been paid out (2) In 2002, JCDecaux SA bought 200,000 of its own shares (treasury shares) in August and October
2002 for a total price of €2.1 million. (3) Post employment and long term benefits (4) In 2004, the increase in the JCDecaux SA’s share capital and share premium is related to the exercise of stock options. As of December 31, 2004, the share capital is composed of 221,993,669 shares.
In million euros Capital Premium Consolidated reserves
Total
Equity as of December 31, 2001 3.4 923.2 395.3 1,321.9
Net income for the period 26.0 26.0
Dividends paid (1)
Purchase of treasury shares (2) (2.1) (2.1)
Change in translation adjustments (32.4) (32.4)
Equity as of December 31, 2002 3.4 923.2 386.8 1,313.4
Net income for the period 40.9 40.9
Dividends paid (1)
Changes in accounting methods (3) (4.5) (4.5)
Change in translation adjustments (16.0) (16.0)
Equity as of December 31, 2003 3.4 923.2 407.2 1,333.8
Net income for the period 78.1 78.1
Dividends paid (1)
Changes in Shareholder's equity (4) 6.1 6.1
Change in translation adjustments (1.6) (1.6)
Equity as of December 31, 2004 3.4 929.3 483.7 1,416.4

- 23 -
2.11 Change in minority interests
2.12 Loss and contingency provisions Loss and contingency provisions break down as follows:
Changes in loss and contingency provisions :
(1) Loss and contingency provisions consist mainly of provisions for dismantling costs in respect of street
furniture. They are calculated at the end of each accounting period and are based on the size of the
In million euros 2004 2003 2002
Equity (minority interests) as of January 1 31.4 64.2 68.8
Net income for the period 10.7 14.2 17.5
Dividends paid (12.5) (7.9) (12.2)
Change in translation adjustments 0.1 (0.7) 0.2
Changes in consolidation scope (0.1) (38.3) (10.1)
Changes in accounting methods (0.1)
Equity (minority interests) as of December 31 29.6 31.4 64.2
In million euros 12/31/2003 Allowances Reversals Reclassifi-cations
Exchange gains/losses
12/31/2004
Provisions for risks 23.5 6.8 (4.2) (0.2) (0.1) 25.8
Provisions for dismantling (1) 61.5 6.7 (0.3) 67.9Provisions for retirement and other benefits 28.2 2.5 (6.0) 0.2 24.9
Provisions for restructuring 0.2 0.1 (0.3) 0.0
Provisions for charges 1.2 0.5 (1.4) 5.5 (0.1) 5.7
TOTAL Provisions 114.6 16.6 (5.9) (0.7) (0.3) 124.3
In million euros 12/31/2004 12/31/2003 12/31/2002
Loss and contingency provisions 99.4 86.4 72.0
Provisions for retirement and other benefits 24.9 28.2 10.6
TOTAL 124.3 114.6 82.6

- 24 -
pool of street furniture currently in use and their unitary dismantling cost (labor, cost of destruction and restoration of ground surfaces).
There is no material reversal in 2004 not related to actual charges. The provisions for dismantling costs are spread over the duration of each agreement. They are not discounted. Upon termination of a contract, 100% of the dismantling costs is set aside as a provision. Dismantling provisions being reestimated at year-end, a net depreciation is recorded in the financial year. Provisions related to litigation represent an amount of €8.9 million as at December 31, 2004. All litigation in the Group has been reviewed by the Group’s Legal Department. Risks related to litigation have been evaluated on a case by case basis depending on accusers‘ claims, on lawyers’ opinions and on first instance verdicts from the court. Other provisions consist in particular of provisions on social contingencies for an amount of €3.1 million. Provision for retirement benefits and other benefits The Group’s defined employee benefit obligations mainly consist in retirement benefits (legal termination benefits, pensions and other retirement benefits for MDs of some Group’s companies) and other long term benefits paid during the working life such as long service awards. The Group’s retirements benefits are mainly related to France, the United-Kingdom, the Netherlands and Austria. In France, the termination benefits paid at the retirement date are calculated in accordance with the “Convention Nationale de la Publicité” (Collective Bargaining Agreement for Advertising). A part of the obligation is covered by contributions made to an external funds by the French companies of the JCDecaux Group. In the United-Kingdom, retirement obligations mainly consist in a pension plan previously open to some employees of the company JCD United Ltd. In December 2002, the related vested benefits have been frozen. In Austria, employee benefits are mainly termination benefits. In The Netherlands, retirement obligations mainly relate to a pension plan partially covered by the contributions paid to an external entity. Lastly, there are two multi-employer defined benefit plans in Sweden (ITP) and in Finland (TEL). These plans have not been valuated in so far as, first, they are national plans for which the necessary information is not available at this date, secondly, the TEL plan is ranked as a social security plan.

- 25 -
Provisions are calculated according to the following assumptions: As at Decembre 31 2004 2003
Discount rate 4.5% - 7% 4.9% - 7%Estimated annual rate of increase in future salaries 1.75% - 4% 2% - 4%Estimated annual rate of increase in post-employment benefits 3% 2% - 3%Expected return of related plan assets 5 % - 8 % 5% - 8%Expected average remaining working lives of employees 14 - 20 years 14 - 15 years

- 26 -
Retirement benefits and other long term benefits (before tax) are analyzed as follows:
Other Total
unfunded funded benefits
Change in benefit obligation
Opening balance 9.2 46.1 2.6 57.9Service cost 0.6 1.4 0.2 2.2
Interest cost 0.5 2.5 0.1 3.1
Amendments in plansActuarial gains / losses 0.7 3.7 (0.0) 4.4
Benefits paid (0.7) (1.1) (0.2) (2.0)
Other (exchange gains / losses) (0.2) (0.2)Benefit obligation at the end of the period 10.3 52.4 2.7 65.4
including France 6.7 13.2 1.3 21.2
including other countries 3.6 39.2 1.4 44.2
Change in plan assets
Opening balance 27.4 27.4Actual return on plan assets 1.7 1.7
Employer contributions 2.0 2.0
Benefits paid (1.0) (1.0)Other (exchange gains / losses) 0.5 0.5
Fair value of assets at the end of the period 30.6 30.6
including France 4.1 4.1including other countries 26.5 26.5
Provision
Funded status 10.3 21.8 2.7 34.8
Unrecognised actuarial gains / losses (0.7) (1.7) (2.4)
Unrecognised past service cost (1.4) (3.0) (4.4)Provision at the end of the period
(1)8.2 17.1 2.7 28.0
including France 4.7 5.9 1.3 11.9
including other countries 3.5 11.2 1.4 16.1
Net periodic pension cost
Service cost 0.6 1.4 0.3 2.3Interest cost 0.5 2.5 0.1 3.1
Expected return on plan assets (1.7) (1.7)Net actuarial gains / losses recognised in the year (0.1) (0.1)
Net past service cost recognised in the year 0.2 0.2 0.4Charge of the year 1.3 2.4 0.3 4.0
including France 0.7 1.4 0.1 2.2
including other countries 0.6 1.0 0.2 1.8
Retirement benefitsIn million euros
(1) The amount of €28.0 million includes €24.9 million of provisions accrued as a liability in the balance sheet,
€(1.0) million of reimbursement rights relating to the Austrian retirement benefit plan and €4.1 million included in “other liabilities” and corresponding to a part of the employee benefit obligation in the United Kingdom.
Unrecognised actuarial losses as at December 31, 2004 amount to €2.4 million and are essentially related to the UK funds and French companies.
Unrecognised past service cost as at December 31, 2004 amounts to €4.4 million and corresponds to the surplus resulting from the application of the new French law “loi Fillon” that is recognised over the average period until the benefits become vested.
- 27 -
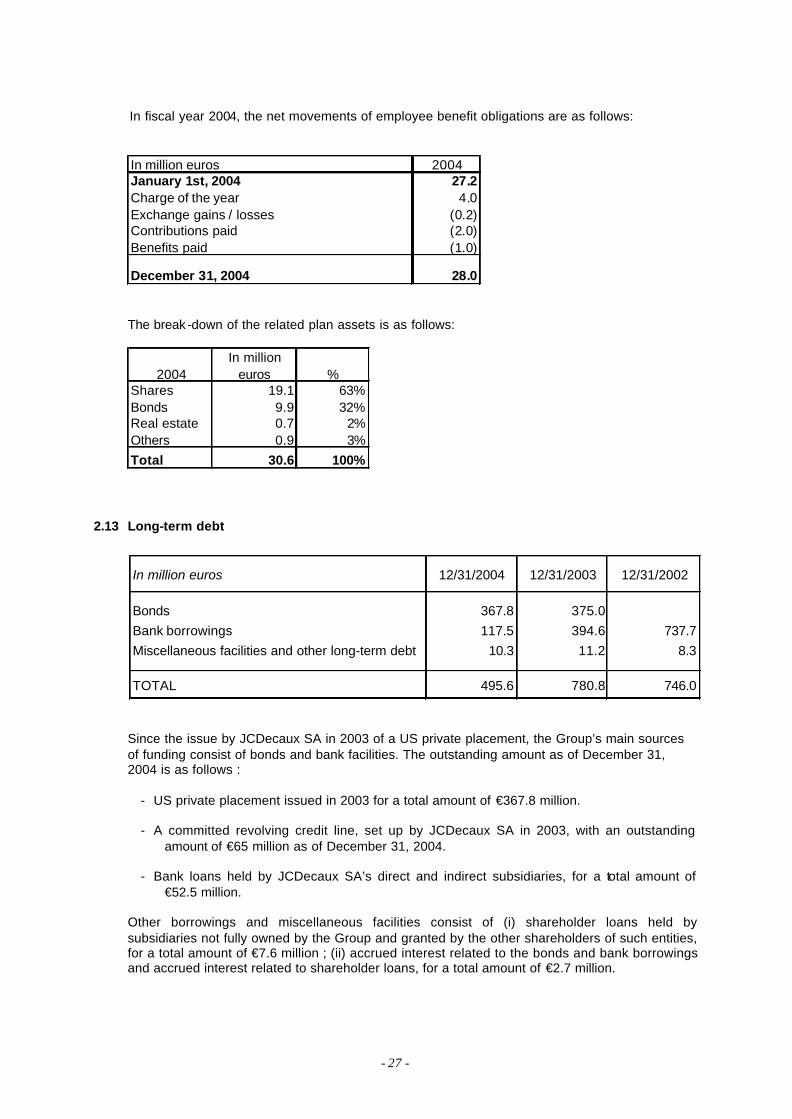
In fiscal year 2004, the net movements of employee benefit obligations are as follows: In million euros 2004January 1st, 2004 27.2Charge of the year 4.0Exchange gains / losses (0.2)Contributions paid (2.0)Benefits paid (1.0)
December 31, 2004 28.0
The break -down of the related plan assets is as follows:
2004In million
euros %Shares 19.1 63%Bonds 9.9 32%Real estate 0.7 2%Others 0.9 3%Total 30.6 100%
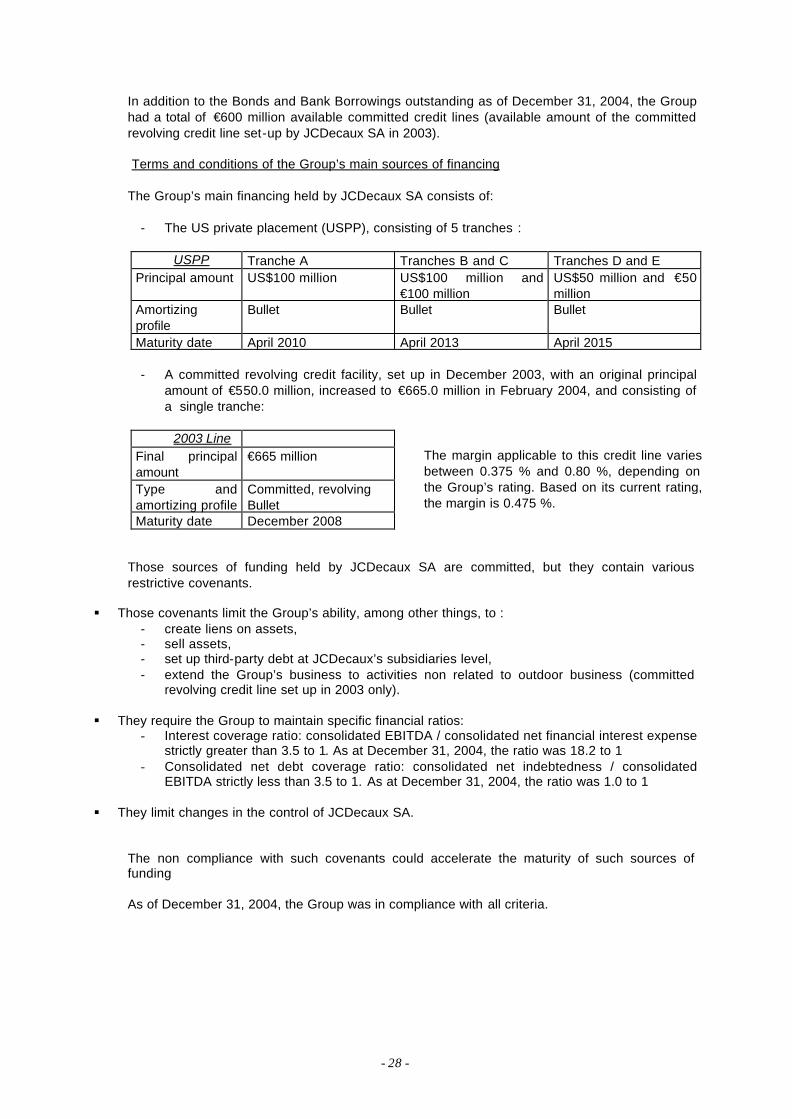
2.13 Long-term debt
Since the issue by JCDecaux SA in 2003 of a US private placement, the Group’s main sources of funding consist of bonds and bank facilities. The outstanding amount as of December 31, 2004 is as follows :
- US private placement issued in 2003 for a total amount of €367.8 million. - A committed revolving credit line, set up by JCDecaux SA in 2003, with an outstanding
amount of €65 million as of December 31, 2004.
- Bank loans held by JCDecaux SA’s direct and indirect subsidiaries, for a total amount of €52.5 million.
Other borrowings and miscellaneous facilities consist of (i) shareholder loans held by subsidiaries not fully owned by the Group and granted by the other shareholders of such entities, for a total amount of €7.6 million ; (ii) accrued interest related to the bonds and bank borrowings and accrued interest related to shareholder loans, for a total amount of €2.7 million.
In million euros 12/31/2004 12/31/2003 12/31/2002
Bonds 367.8 375.0Bank borrowings 117.5 394.6 737.7Miscellaneous facilities and other long-term debt 10.3 11.2 8.3
TOTAL 495.6 780.8 746.0
- 28 -
In addition to the Bonds and Bank Borrowings outstanding as of December 31, 2004, the Group had a total of €600 million available committed credit lines (available amount of the committed revolving credit line set-up by JCDecaux SA in 2003). Terms and conditions of the Group’s main sources of financing
The Group’s main financing held by JCDecaux SA consists of:
- The US private placement (USPP), consisting of 5 tranches :
USPP Tranche A Tranches B and C Tranches D and E Principal amount US$100 million US$100 million and
€100 million US$50 million and €50 million
Amortizing profile
Bullet Bullet Bullet
Maturity date April 2010 April 2013 April 2015 - A committed revolving credit facility, set up in December 2003, with an original principal
amount of €550.0 million, increased to €665.0 million in February 2004, and consisting of a single tranche:
2003 Line
Final principal amount
€665 million
Type and amortizing profile
Committed, revolving Bullet
Maturity date December 2008
The margin applicable to this credit line varies between 0.375 % and 0.80 %, depending on the Group’s rating. Based on its current rating, the margin is 0.475 %.
Those sources of funding held by JCDecaux SA are committed, but they contain various restrictive covenants.
§ Those covenants limit the Group’s ability, among other things, to : - create liens on assets, - sell assets, - set up third-party debt at JCDecaux’s subsidiaries level, - extend the Group’s business to activities non related to outdoor business (committed
revolving credit line set up in 2003 only).
§ They require the Group to maintain specific financial ratios: - Interest coverage ratio: consolidated EBITDA / consolidated net financial interest expense
strictly greater than 3.5 to 1. As at December 31, 2004, the ratio was 18.2 to 1 - Consolidated net debt coverage ratio: consolidated net indebtedness / consolidated
EBITDA strictly less than 3.5 to 1. As at December 31, 2004, the ratio was 1.0 to 1
§ They limit changes in the control of JCDecaux SA.
The non compliance with such covenants could accelerate the maturity of such sources of funding As of December 31, 2004, the Group was in compliance with all criteria.
- 29 -
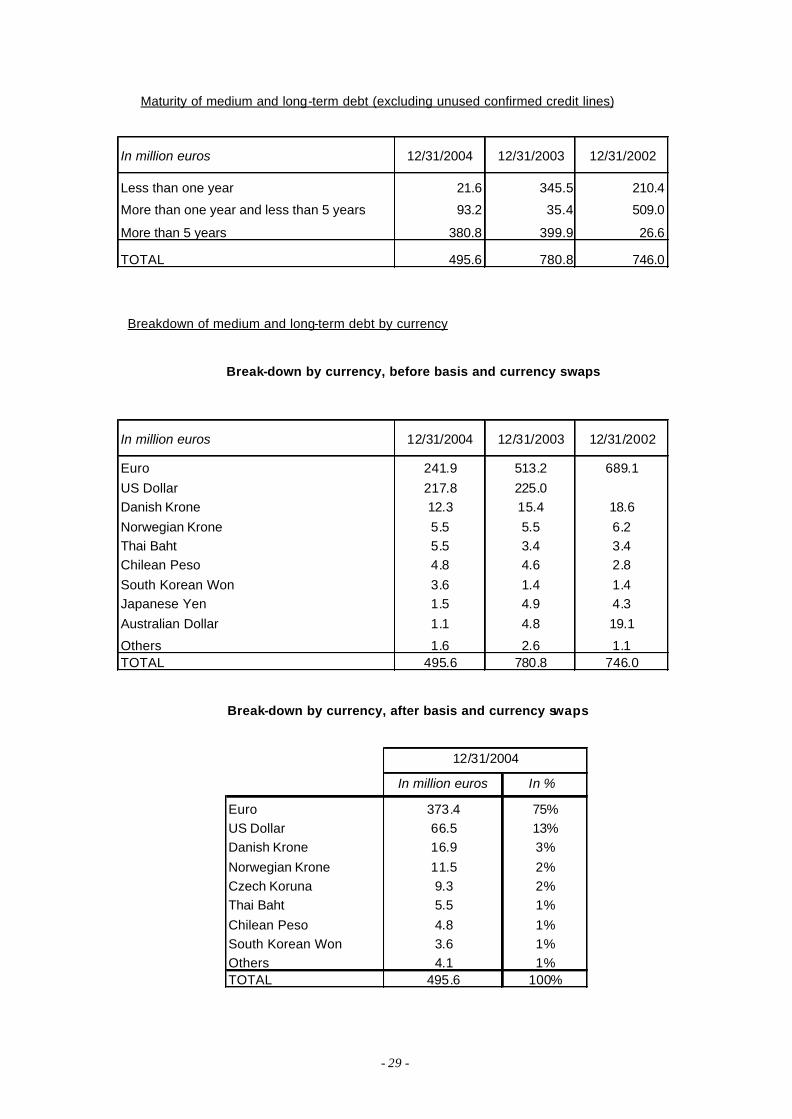
Maturity of medium and long-term debt (excluding unused confirmed credit lines)
Breakdown of medium and long-term debt by currency
Break-down by currency, before basis and currency swaps
Break-down by currency, after basis and currency swaps
In million euros 12/31/2004 12/31/2003 12/31/2002
Less than one year 21.6 345.5 210.4
More than one year and less than 5 years 93.2 35.4 509.0
More than 5 years 380.8 399.9 26.6
TOTAL 495.6 780.8 746.0
In million euros 12/31/2004 12/31/2003 12/31/2002
Euro 241.9 513.2 689.1US Dollar 217.8 225.0Danish Krone 12.3 15.4 18.6Norwegian Krone 5.5 5.5 6.2Thai Baht 5.5 3.4 3.4Chilean Peso 4.8 4.6 2.8South Korean Won 3.6 1.4 1.4Japanese Yen 1.5 4.9 4.3Australian Dollar 1.1 4.8 19.1
Others 1.6 2.6 1.1TOTAL 495.6 780.8 746.0
In million euros In %
Euro 373.4 75%US Dollar 66.5 13%Danish Krone 16.9 3%Norwegian Krone 11.5 2%Czech Koruna 9.3 2%Thai Baht 5.5 1%Chilean Peso 4.8 1%South Korean Won 3.6 1%Others 4.1 1%TOTAL 495.6 100%
12/31/2004
- 30 -
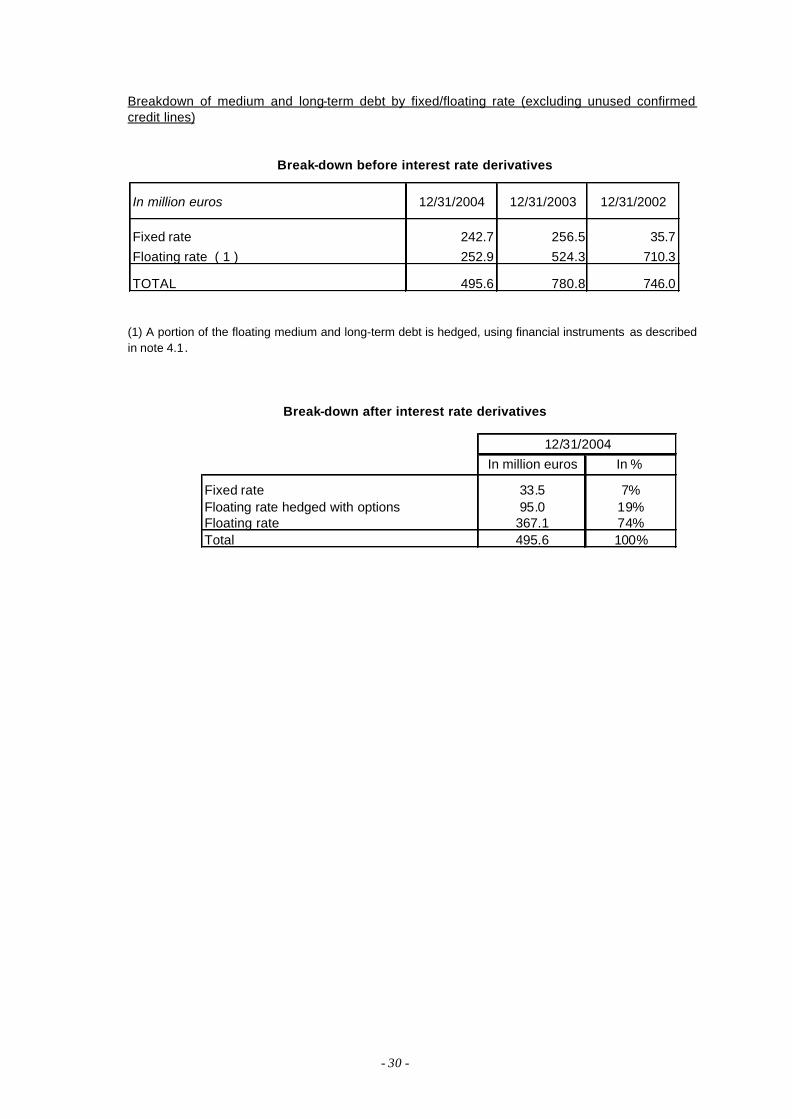
Breakdown of medium and long-term debt by fixed/floating rate (excluding unused confirmed credit lines)
Break-down before interest rate derivatives
(1) A portion of the floating medium and long-term debt is hedged, using financial instruments as described in note 4.1.
Break-down after interest rate derivatives
In million euros 12/31/2004 12/31/2003 12/31/2002
Fixed rate 242.7 256.5 35.7Floating rate ( 1 ) 252.9 524.3 710.3
TOTAL 495.6 780.8 746.0
In million euros In %
Fixed rate 33.5 7%Floating rate hedged with options 95.0 19%Floating rate 367.1 74%Total 495.6 100%
12/31/2004

- 31 -
3. NOTES TO THE INCOME STATEMENT
3.1 Net operating expenses
Research and development costs amounted to €7.7 million in 2004 against €8.3 million in 2003 and €9.8 million in 2002 and are included in “Purchases of materials, external charges and other net operating expenses”.
3.2 Net financial income / loss
The financial result for 2004 amounted to €(25.3) million, i.e. an improvement of €6.7 million, compared to 2003. The improvement is mainly due to a decrease in net interest expense related to the Group’s net indebtedness, this decrease being itself due to (i) a lower average net debt in 2004 as compared to 2003 and (ii) lower EURIBOR rates compensating largely higher US LIBOR rates.
In million euros 2004 2003 2002
Purchases of materials, external charges and other net operating expenses (821.2) (787.6) (820.3)
Taxes and duties (18.1) (17.4) (18.4)
Payroll (326.9) (321.9) (333.7)
Depreciation provisions net of releases (22.0) (16.4) (15.7)
Depreciation allowances net of releases (171.6) (170.4) (178.4)
TOTAL (1,359.8) (1,313.7) (1,366.5)
In million euros 2004 2003 2002
Interest on debt net of cash (24.7) (28.3) (36.1)
Net foreign exchange gains and losses 0.1 (2.0) (0.2)
Others (0.7) (1.7) (0.4)
TOTAL (25.3) (32.0) (36.7)

- 32 -
3.3 Non-recurring income / (loss)
Net income from capital transactions amounted to €1.0 million, including mainly a net profit €2.1 million in the United Kingdom arising from the sale of land carrying billboards, 0.4 million losses on loans recorded in France, a net loss of €0.5 million on sales of billboards and street furniture, and a net loss of €0.2 million on sale of intangible assets.
3.4 Income Tax Breakdown between deferred and current taxes
The effective tax rate before amortization of goodwill and before net income from equity affiliates, was 38.3% in 2003 and is 35.7% in 2004. The €14.0 million of deferred taxes in 2004 include €13.3 million of net deferred tax expense and a €0.7 million allowance for depreciation of deferred tax assets. Breakdown of income taxes
Tax on non recurring income includes non deductible expense for €0.7 million, i.e. a total tax impact of €0.2 million.
In million euros 2004 2003 2002
Net income from operations (0.3) (0.4) (12.6)
Net income from capital transactions 1.0 2.6 (5.2)
Net releases and other net income 0.2 (2.5) 15.1
TOTAL 0.9 (0.3) (2.7)
In million euros 2004 2003 2002
Current taxes (74.3) (63.6) (64.2)
Deferred taxes (14.0) (12.2) (6.0)
TOTAL (88.3) (75.8) (70.2)
In million euros Income before tax
Taxes Income after tax
Income from recurring operations 246.3 (87.8) 158.5Non-recurring income 0.9 (0.5) 0.4Income from consolidated companies before income from equity affiliates and amortization of goodwill
247.2 (88.3) 158.9

- 33 -
Details of tax calculation
3.5 Net income from equity affiliates
In million euros 2004 2003 2002
Consolidated net income 88.8 55.1 43.5
Income Tax charge (88.3) (75.8) (70.2)
Consolidated income before taxes 177.1 130.9 113.7
Amortization of goodwill 75.7 71.8 63.7Long-term capital losses Share of net income from equity affiliates (5.6) (4.9) (5.6)Parent/subsidiary regime tax treatment 3.6 6.1 2.3Miscellaneous 7.4 6.1 1.2
Net income before tax subject to the standard tax rate 258.2 210.0 175.3
Weighted Group tax rate 32.86% 34.23% 34.65%
Theoretical tax charge (84.8) (71.9) (60.7)
Deferred tax on unrecognized tax losses (4.3) (9.0) (16.3)Additional local taxes (2.3) (0.3) 0.8Use of unrecognized prior tax losses carried forward 0.7 2.4 1.1Correction of deferred tax/previous years 2.5 2.0 3.9Miscellaneous (0.1) 1.0 1.0
Total tax charge calculated (88.3) (75.8) (70.2)
Tax charge recorded (88.3) (75.8) (70.2)
ln million euros 2004 2003 2002Affichage Holding 3.9 3.7 4.7Stadtreklame Nürnberg GmbH 0.7 0.6 0.6Univier Communications BV 0.5 0.3Wall AG 1.6 0.3Wall Holding / Wall USA Inc. (0.6) (0.2)Total 5.6 4.9 5.6
- 34 -
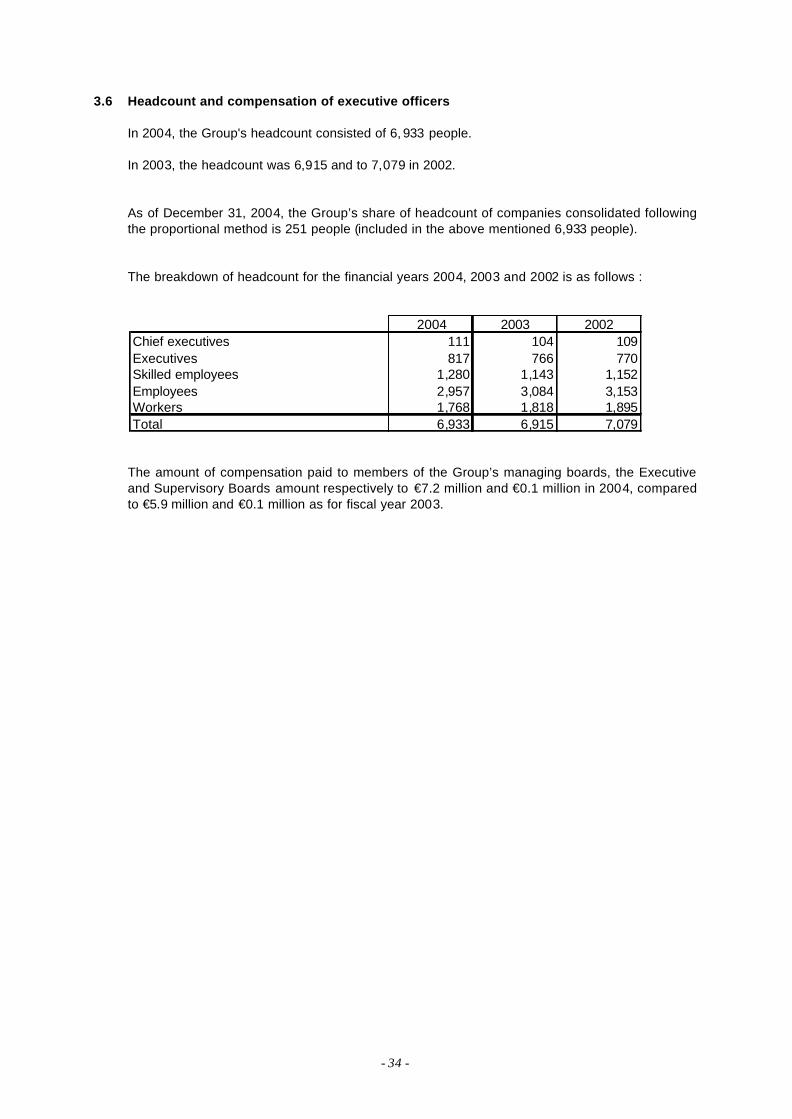
3.6 Headcount and compensation of executive officers In 2004, the Group's headcount consisted of 6, 933 people. In 2003, the headcount was 6,915 and to 7,079 in 2002. As of December 31, 2004, the Group’s share of headcount of companies consolidated following the proportional method is 251 people (included in the above mentioned 6,933 people). The breakdown of headcount for the financial years 2004, 2003 and 2002 is as follows :
The amount of compensation paid to members of the Group’s managing boards, the Executive and Supervisory Boards amount respectively to €7.2 million and €0.1 million in 2004, compared to €5.9 million and €0.1 million as for fiscal year 2003.
2004 2003 2002Chief executives 111 104 109Executives 817 766 770Skilled employees 1,280 1,143 1,152Employees 2,957 3,084 3,153Workers 1,768 1,818 1,895Total 6,933 6,915 7,079

- 35 -
4. OFF-BALANCE SHEET COMMITMENTS
4.1 Financial instruments The Group uses derivative instruments only for interest rate and foreign exchange rate hedging purposes. Financial instruments related to bond issues In connection with the issuance of its US private placement in 2003, JCDecaux SA raised funds, a significant portion of these funds, ($250 million) being denominated in US dollars and bearing a fixed coupon. As the Group did not generate such US dollar funding needs and in compliance with its policy to have its medium and long term debt indexed on short term rates, JCDecaux SA entered into swap transactions combined with the issuance of its private placement: - Interest rate swap: JCDecaux SA receives a fixed rate and pays a floating rate (LIBOR), on a
nominal amount of $100 million, and with a maturity date in April 2010, - Currency interest rate swap: JCDecaux SA receives a fixed rate denominated in US dollar and
pays a floating rate EURIBOR, on a nominal amount of (i) $150 million before swaps and (ii) €142 million after swaps, and with maturity dates between 2013 and 2015,
The market value of JCDecaux’ portfolio of financial instruments related to bond issues (theoretical cost of cancellation) was € (31.9) million as of December 31, 2004. Interest rate risk (excluding financial instruments related to bond issues) A significant portion of the Group’s medium and long term debt is denominated in Euro and indexed on floating rates. In order to limit the impact on its cost of funding of an increase in EURIBOR rates, the Group hedged part of its debt with caps, caps spreads and tunnels. As of December 31, 2004, the positions held by the Group in Euro are the following:
- Hedging against an increase in short term euro interest rates, of JCDecaux SA’s debt indexed on floating rate (€433 million outstanding as of December 31, 2004):
• Caps purchased for €95 million, including €60 million of ratchet caps ; such caps maturing between August 2005 and April 2006 ; none was in the money on December 31, 2004
• Caps sold for €35 million maturing in April 2006 ; none was in the money on December 31,
2004
• Floors sold for €95 million maturing between August 2005 and April 2006 ; €60 million were in the money, based on a EURIBOR 3 month index of 2.155 % (as of December 31, 2004)
The impact in 2005 of such transactions on JCDecaux SA’s cost of funding’s exposure to a change in EURIBOR rates will be:
Variation in % in Euribor rates vs rate as of December 31 2004
- 1% + 1% + 2% + 3%
Impact in % on JCDecaux SA’s cost of funding
- 0.85 % + 0.87% +1.74% +2.65%
- Hedging of subsidiary debt:
To hedge a bank loan, denominated in Danish Krones and indexed on floating rates, the Group has also implemented fixed rate swaps, with an amortizing profile and final maturity at January 2009. The outstanding amount as of December 31, 2004 is 48 million Danish Krones.

- 36 -
The market value of the Group’s portfolio of interest rate instruments (theoretical cost of cancellation) was € (1.3) million as of December 31, 2004. Foreign exchange rate risk (excluding financial instruments related to bond issues) The foreign exchange risk exposure of the Group is related to its business in foreign countries. It is mainly related to financial activities (refinancing and cash deposits with foreign subsidiaries). As of December 31, 2004, the hedging transactions implemented by the Group are the following (net positions):
In million euros 12/31/2004
On financial operations
Forward purchases against euro (1) American dollar 9.0Singapore dollar 3.5Hong-Kong dollar 2.2
Forward sales against euro (2) Czeck Koruna 9.3Norwegian krone 5.9Danish krone 4.6
(1) Forward purchases of US dollars hedge the unused portion of JCDecaux SA’s debt denominated in
such currency (Tranche A of the US private placement issued in 2003), Forward purchases of the other currencies hedge (i) loans granted to JCDecaux SA by its subsidiaries, pursuant to the Group’s policy of cash centralisation ; (ii) remaining cash in bank denominated in currencies at JCDecaux SA’s level, swapped into euros.
(2) Forward sales hedge loans granted by JCDecaux SA or other French entities to their subsidiaries. The market value of those foreign exchange instruments (theoretical cost of cancellation) was €(3.1) million as of December 31, 2004.
4.2 Off-balance sheet commitments, other than financial instruments
In million euros 12/31/04 12/31/03COMMITMENTS GIVEN (1)Business guarantees 59.5 64.0Other guarantees 7.5 11.2Pledges and mortgages 1.9 1.0Commitments on shares 148.5 154.6TOTAL 217.4 230.8COMMITMENTS RECEIVEDGuarantees 2.7 1.5Commitments on shares 120.9 128.2Credit facilities 600.0 1,051.6TOTAL 723.6 1,181.3 (1) excluding commitments related to leases, rents and minimum franchise payments, given in the ordinary course of business
Business guarantees consist in performance bonds granted mainly by JCDecaux SA. As such, JCDecaux SA guarantees the execution of contracts entered into by subsidiaries with Cities and

- 37 -
Airports, either directly to third parties or as counterpart guarantees granted by banks or insurance companies.
The line “other guarantees” includes guarantees granted mainly by JCDecaux SA: (i) for payments related to building lease agreements, car rentals of its subsidiaries; (ii) as counterpart for bank guarantees given by such banks to subsidiaries; (iii) for payments related to financial debt of non consolidated subsidiaries or subsidiaries consolidated following the equity method (iv) for payments related to financial debts of companies consolidated following the proportional method when the guarantee amount exceeds the Groups’ percentage of ownership.
Guarantees received are mainly representations and guarantees on liabilities.
Commitments given and received on shares are namely granted and received in the context of external growth operations.
As at December 31, 2004, commitments given on shares consist, to the benefit of our different partners, of the following put options :
- put, with an exercise period from January 1st, 2009 to December 31, 2009, for an amount of €74.0 million.
- put, with an exercise period from March 1st, 2005 to March 15, 2005, for an amount of €8.9 million for 25% of the shares.
- put, with an exercise period from June 17, 2004 to June 16, 2006. The exercise price will be determined in accordance with a contractual calculation formula and will be at least of an amount of €2.0 million. As at December 31, 2004, the put option was not exercised.
- call, with the two following exercise periods: from January 1st , 2006 to December 31, 2006 or from January 1st, 2008 to December 31, 2008. This option concerns 35% of the shares and its exercise price will be determined in accordance with a contractual calculation formula and will be at least of an amount of €57.5 million.
- other commitments : €2.8 million.
Furthermore, the Group is committed to purchase, in 2006, 1.77% of the shares of a company for an amount estimated to €2.0 million and to sell, in 2009, 12.5% of the shares of another company, for an amount of €1.3 million.
The commitments received on shares consist, to the Group’s benefit, of:
- call, with an exercise period from March 16, 2005 to March 30, 2005, for an amount of €8.9 million for 25% of the shares.
- put, with an exercise period from January 1st, 2008 to December 31, 2008. It concerns 35% of the shares and the exercise price will be determined in accordance with a contractual calculation formula and will be at least of an amount of €38.0 million for the part representing 23.88% of the shares.
Furthermore, they include a commitment for €74.0 million given by a strategic partner consisting in keeping its current shareholding in one of the Group’s subsidiary until, at least, January 1st, 2009.
Lastly, according to the partnership agreements signed, the Group benefits from preemptive rights which are not considered as commitments given nor received by the Group.

- 38 -
Credit facilities consist in the committed revolving credit line, set -up in December 2003 for an amount of €550 million, which amount was increased to €665 million in February 2004. The amount available as of December 31, 2004 is €600 million.
4.3 Commitments related to lease, rents and minimum franchise payments given in the ordinary course of business :
JCDecaux has concluded in the extent of its ordinary business the following commitments:
- contracts entered into with cities, airports or transport companies, which entitle the Group to operate its advertising business and collect the related revenue, where the Group may grant the cities, airports or transport companies with the payment of fees, a part of those fees being fixed or guaranteed (minimum guarantees) as a counterpart for securing a portion of revenues;
- rents for billboard locations on private ground;
- lease agreements for buildings, vehicles and other equipment (computers, etc….)
Such commitments given in the ordinary course of business break down as follows (amounts are not discounted):
(1) until 2030.
In million euros < 1 year > 1 et < 5 years > 5 years (1) Total
Minimum franchise payments associatedwith Street Furniture or Transport contracts
219.7 561.4 601.6 1,382.7
Rents related to Billboard locations 84.1 122.9 34.6 241.6Operating leases 19.6 50.9 21.6 92.1Finance leases 3.0 7.4 3.6 14.0Total commitments 326.4 742.6 661.4 1,730.4

- 39 -
5. SEGMENT REPORTING
5.1 By line of business
Definition of business segments Street Furniture The street furniture line of business covers, in general, the advertising agreements relating to public property entered into with cities and local authorities. It also includes advertising in shopping malls, as well as the renting of street furniture, the sale and rental of equipment, and other various services such as public works and maintenance. Billboard The billboard line of business covers advertising on private property, including both standard billboards and back-light billboards. It also includes neon-type billboards. Transport The transport line of business covers advertising in public transport systems, including airports, metros, buses, tramways and trains.
(1) EBITDA (Earnings Before Interest, Taxes, Depreciation and Amortization)
In million euros Net Revenues EBITDA (1) Operating Income
Net tangible assets
Street Furniture2004 885.0 384.8 230.0 492.62003 837.0 348.5 203.3 505.82002 840.3 340.3 189.2 539.9
Billboard2004 433.6 59.9 28.0 151.42003 427.6 54.4 20.4 140.82002 442.6 55.4 22.9 150.1
Transport2004 312.8 20.5 13.6 24.92003 279.2 14.0 6.4 28.72002 294.8 9.6 (1.0) 32.3
Total2004 1,631.4 465.2 271.6 668.92003 1,543.8 416.9 230.1 675.32002 1,577.7 405.3 211.1 722.3

- 40 -
5.2 By geographic area
(1) EBITDA: Earnings Before Interests, Taxes, Depreciation and Amortization.
6. SCOPE OF CONSOLIDATION
6.1 Identity of the parent company As of December 31, 2004, 69.85 % of the share capital of JCDecaux SA was owned by JCDecaux Holding.
6.2 List of consolidated companies See following pages.
In million euros Net Revenues EBITDA (1) Operating Income Net tangible assets
France2004 559.9 190.4 109.4 195.62003 555.8 188.4 115.2 196.62002 570.9 185.2 106.2 219.7
UK2004 245.0 44.5 24.9 92.82003 220.3 39.2 19.7 95.92002 231.6 38.0 16.2 107.6
Europe (excl. France & UK)2004 616.3 203.9 132.3 283.42003 574.9 183.5 108.2 285.32002 568.9 192.9 120.6 296.3
Americas2004 107.2 14.4 (0.7) 69.32003 106.2 2.4 (10.8) 70.12002 104.2 (8.0) (23.2) 70.9
Asia / Pacific2004 103.0 12.0 5.7 27.82003 86.6 3.4 (2.2) 27.42002 102.1 (2.8) (8.7) 27.8
Total2004 1,631.4 465.2 271.6 668.92003 1,543.8 416.9 230.1 675.32002 1,577.7 405.3 211.1 722.3

- 41 -
COMPANIES COUNTRY % INTEREST
CONSOLIDATION METHOD
% CONTROL
STREET FURNITUREJCDECAUX SA France 100.00 F 100.00JCDECAUX MOBILIER URBAIN France 100.00 F 100.00
SOPACT France 50.00 F 50.00
SEMUP France 100.00 F 100.00DPE France 100.00 F 100.00SOMUPI France 66.00 F 66.00ACM GmbH Germany 100.00 F 100.00JCDECAUX STADTMOBLIERUNG GmbH Germany 100.00 F 100.00JCDECAUX DEUTSCHLAND GmbH Germany 100.00 F 100.00
GEORG ZACHARIAS GmbH Germany 50.00 F 50.00
RGS Germany 25.00 F 50.00DSM DECAUX GmbH Germany 50.00 F 50.00JCDECAUX GmbH (formerly KLETT DECAUX GmbH) Germany 100.00 F 100.00STADTREKLAME NÜRNBERG GmbH Germany 35.00 EM 35.00ILG AUSSENWERBUNG ZACHARIAS GmbH Germany 10.00 EM 20.00ILG AUSSENWERBUNG GmbH Germany 50.00 F 50.00
WALL AG Germany 35.00 EM 35.00WFA WARTEHALLEN FINANZ AG (1) Germany 100.00 F 100.00JCDECAUX UK Ltd (2) United Kingdom 100.00 F 100.00JCDECAUX ARGENTINA S.A. Argentina 99.93 F 99.93JCDECAUX STREET FURNITURE Pty Ltd Australia 100.00 F 100.00JCDECAUX AUSTRALIA Pty Ltd Australia 100.00 F 100.00
AQMI GmbH (3) Austria 29.31 IP 50.00
JCDECAUX BELGIUM PUBLICITE SA Belgium 100.00 F 100.00ACM SA Belgium 100.00 F 100.00JCDECAUX DO BRASIL Ltda Brasil 100.00 F 100.00JCDECAUX SALVADOR S.A. Brazil 100.00 F 100.00VIACOM OUTDOOR JCDECAUX STREET FURNITURE CANADA Ltd Canada 50.00 IP 50.00IPDECAUX, Inc. Korea 50.00 IP 50.00
AFA JCDECAUX A/S Denmark 50.00 F 50.00
EL MOBILIARIO URBANO S.A. Spain 100.00 F 100.00JCDECAUX ATLANTIS S.A. Spain 85.00 F 85.00JCDECAUX & SIGN S.A. Spain 100.00 F 100.00PLANIGRAMA EXCLUSIVAS PUBLICITARIAS S.A. Spain 100.00 F 100.00JCDECAUX UNICOM EESTI OU (9) Estonia 75.00 IP 75.00JCDECAUX NEW YORK Inc United States 100.00 F 100.00
JCDECAUX SAN FRANCISCO Llc United States 100.00 F 100.00JCDECAUX MALLSCAPE Llc United States 100.00 F 100.00JCDECAUX CHICAGO Llc United States 100.00 F 100.00JCDECAUX NEW YORK Llc United States 100.00 F 100.00VIACOM DECAUX STREET FURNITURE Llc United States 50.00 IP 50.00JCDECAUX NORTH AMERICA Inc. United States 100.00 F 100.00
WALL HOLDINGS Inc. (4) United States 50.00 EM 50.00
WALL USA Inc. (4) United States 50.00 EM 50.00JCDECAUX FINLAND Oy Finland 100.00 F 100.00AFA JCD ICELAND ehf Iceland 50.00 F 100.00MCDECAUX Inc. (5) Japan 60.00 IP 60.00JCDECAUX UNICOM BALTIC SIA (9) Latvia 75.00 IP 75.00JCDECAUX UNICOM UAB (9) Lithuania 75.00 IP 75.00
JCDECAUX LUXEMBOURG SA Luxembourg 100.00 F 100.00
JCDECAUX GROUP SERVICES Luxembourg 100.00 F 100.00JCDECAUX NEDERLAND BV The Netherlands 50.00 F 50.00V.K.M. BV The Netherlands 50.00 F 50.00UNIVIER COMMUNICATIONS BV (9) The Netherlands 75.00 IP 75.00JCDECAUX PORTUGAL Lda Portugal 100.00 F 100.00PURBE Lda Portugal 100.00 F 100.00
JCDECAUX MESTSKY MOBILIAR Spol Sro Czeck Rep. 100.00 F 100.00ALMA QUATTRO (3) Serbia 29.31 IP 50.00JCDECAUX SINGAPORE PTE Ltd Singapore 100.00 F 100.00JCDECAUX PEARL & DEAN Pte Ltd Singapore 100.00 F 100.00JCDECAUX SLOVAKIA Sro Slovakia 100.00 F 100.00JCDECAUX SVERIGE AB (2) Sweden 98.23 F 98.23
JCDECAUX THAÏLAND Co. , Ltd Thaïland 95.15 F 95.15
JCDECAUX URUGUAY (6) Uruguay 100.00 F 100.00
BILLBOARD
AVENIR France 100.00 F 100.00JCDECAUX PUBLICITE LUMINEUSE France 100.00 F 100.00MILLS AND ALLEN HOLDINGS Ltd United Kingdom 100.00 F 100.00MILLS AND ALLEN GROUP Ltd United Kingdom 100.00 F 100.00JCDECAUX MEDIA SERVICES Ltd United Kingdom 100.00 F 100.00MARGINHELP Ltd United Kingdom 100.00 F 100.00
JCDECAUX Ltd United Kingdom 100.00 F 100.00JCDECAUX UNITED Ltd United Kingdom 100.00 F 100.00PEARL & DEAN GROUP Pty Ltd Australia 100.00 F 100.00

- 42 -
( 1 ) Swiss registered company operating in Germany ( 2 ) Companies operating several businesses ( Street Furniture, Billboard and Transport ) have their data split for the purpose of information by segment activity, but are disclosed depending on their main activity in this table ( 3 ) Held by Europlakat Int . Werbe GmbH, company 50 % owned by JCDecaux Group and 50 % by Affichage Holding ( consoli dated under the equity method ) ( 4 ) 50 % held by the JCDecaux Group and 50 % by WALL AG ( consolidated under the equity method ) ( 5 ) The MCDecaux company ( Japan ) is consolidated under the proportional method according to the joint management with the partner of the Group . ( 6 ) This company is a representative office of JCDecaux Mobilier Urbain ( 7 ) UK registered company operating in Northern Ireland ( 8 ) Company registered in Austria and operating in the Czeck Republic ( 9 ) Unicom companies consolidated under the proportional method considering to the joint management with the partner of the Group . ( 10 ) Company registered in the Czeck Republic and operating in Slovakia
COMPANIES COUNTRY % INTEREST
CONSOLIDATION METHOD
% CONTROL
GEWISTA WERBEGES.mbH (2) Austria 67.00 F 67.00EUROPLAKAT INTERNATIONAL WERBE GmbH Austria 33.50 IP 50.00
PROGRESS AUSSENWERBUNG GmbH Austria 67.00 F 100.00
PROGRESS WERBELAND Werbe. GmbH Austria 34.17 F 51.00ISPA WERBEGES.mbH Austria 67.00 F 100.00USP WERBEGES.mbH Austria 50.25 F 75.00JCDECAUX INVEST HOLDING GmbH Austria 100.00 F 100.00JCDECAUX SUB INVEST HOLDING GmbH Austria 100.00 F 100.00JCDECAUX CENTRAL EASTERN EUROPE GmbH Austria 100.00 F 100.00GEWISTA SERVICE GmbH Austria 67.00 F 100.00BELGOPOSTER Belgium 100.00 F 100.00
AFFICHAGE NOUVEL ESSOR NV Belgium 61.15 F 61.15
JCDECAUX PUBLICITE LUMINEUSE Lichtreklame NV Belgium 100.00 F 100.00EUROPLAKAT Doo (BANJA LUKA) (3) Bosnia 23.45 IP 50.00EUROPLAKAT Doo (SARAJEVO) (3) Bosnia 23.45 IP 50.00EUROPLAKAT-PROREKLAM Doo (3) Croatia 17.09 IP 50.00JCDECAUX ESPANA SL (2) Spain 100.00 F 100.00JCDECAUX PUBLICIDAD LUMINOSA SL Spain 100.00 F 100.00AVENIR BUDAPEST Kft Hungary 18.43 IP 50.00JCDECAUX NEONLIGHT BUDAPEST Kft (3) Hungary 27.47 IP 50.00
EUROPLAKAT Kft (3) Hungary 22.78 IP 50.00
PERON REKLAM Kft (3) Hungary 5.70 EM 25.00DAVID ALLEN HOLDINGS Ltd (7) Ireland 100.00 F 100.00DAVID ALLEN POSTER SITES Ltd Ireland 100.00 F 100.00SOLAR HOLDINGS Ltd Ireland 100.00 F 100.00JCDECAUX IRELAND Ltd Ireland 100.00 F 100.00EUROPOSTER BV The Netherlands 100.00 F 100.00JCDECAUX NEONLIGHT Sp zoo Poland 60.00 F 60.00
RED PORTUGUESA S.A. Portugal 92.77 F 92.77
PLACA Lda Portugal 100.00 F 100.00CENTECO Lda Portugal 70.00 F 70.00AUTEDOR Lda Portugal 51.00 F 51.00GREEN Lda Portugal 53.63 F 55.00RED LITORAL Lda Portugal 69.57 F 75.00AVENIR PRAHA Czeck Rep. 90.00 F 90.00AUSSENW.TSCHECH.-SLOW.BETEILIGUNGS GmbH (8) Czeck Rep. 67.00 F 100.00EUROPLAKAT Spol Sro Czeck Rep. 67.00 F 100.00
EUROPLAKAT YU Doo (3) Serbia 33.50 IP 50.00
ISPA BRATISLAVA Spol Sro Slovakia 67.00 F 100.00EUROPLAKAT INTERWEB Spol Sro (10) Slovakia 67.00 F 100.00INREKLAM PROGRESS Doo (3) Slovenia 16.41 IP 50.00PROREKLAM-EUROPLAKAT Doo (3) Slovenia 16.41 IP 50.00PLAKATIRANJE Doo (3) Slovenia 8.86 IP 50.00AFFICHAGE HOLDING Switzerland 30.00 EM 30.00
TRANSPORTJCDECAUX AIRPORT FRANCE France 100.00 F 100.00MEDIA FRANKFURT GmbH Germany 39.00 IP 39.00JCDECAUX AIRPORT MEDIA GmbH Germany 100.00 F 100.00
JCDECAUX AIRPORT UK Ltd United Kingdom 100.00 F 100.00
INFOSCREEN AUSTRIA GmbH Austria 67.00 F 100.00JCDECAUX AIRPORT S.A. Chile 100.00 F 100.00JCDECAUX AIRPORT ESPAÑA S.A. Spain 100.00 F 100.00JCDECAUX-PUBLIMEDIA UTE Spain 70.00 F 70.00JCDECAUX AIRPORT Inc. United States 100.00 F 100.00JCDECAUX TRANSPORT INTERNATIONAL Llc United States 100.00 F 100.00JCDECAUX PEARL & DEAN Ltd Hong Kong 100.00 F 100.00
IGP DECAUX Spa (2) Italy 32.35 IP 32.35
AEROPORTI DI ROMA ADVERTISING Spa Italy 24.10 IP 32.35JCDECAUX PEARL & DEAN Sdn Bhd Malaysia 100.00 F 100.00JCDECAUX NORGE AS (2) Norway 97.34 F 100.00JCDECAUX AIRPORT POLSKA Sp zoo Poland 100.00 F 100.00JCDECAUX AIRPORT PORTUGAL S.A. Portugal 85.00 F 85.00RENCAR PRAHA AS Czeck Rep. 48.24 F 72.00RENCAR MEDIA Sro Czeck Rep. 48.24 F 100.00JCDECAUX ASIA SINGAPORE Pte Ltd Singapore 100.00 F 100.00
XPOMERA AB Sweden 77.60 F 79.00
Note : F = Full integration PI = Proportional Integration EM = Equity Method

- 43 -
7. SUBSEQUENT EVENTS
At the end of January 2005, JCDecaux Peal & Dean (Hong Kong) created a joint-venture in partnership with Shanghai Airports (SIA / SAA) and with a media company Momentum. The new company, named JCDecaux Momentum Shanghai Airport advertising co Ltd, will handle the Shanghai contract won in 2004.
* * * * * *