JANUARY˜SEPTEMBER 2021 RESULTS
65
Transcript of JANUARY˜SEPTEMBER 2021 RESULTS


JANUARY-SEPTEMBER 2021 RESULTS
NII + Fee Income (YTD)
+6.1% vs. Sep 20 (€ constant)
E�ciency Ratio (YTD)
44.7%
Cost of Risk (YTD)
NOTE: Excludes the US business sold to PNC.
Positive core revenue evolution Leaders in e�ciency
Continuous improvementof the Cost of Risk Strong capital position
CET1 fully-loaded
Pro-forma after share buyback*
SEP-21
13.18%
Sep 20 Dec 20 Jun 21 Sep 21
0.92%
1.68%1.55%
1.00% 11.52%
14.48%
Sep-20 Sep-21
TRANSFORMATION
(YTD, thousands and % of total)New Customers Digital Acquisition1
SUSTAINABILITY
Sustainable Finance
202320212018 2020 2022
Sep 21
2024 20252019
€75 BnChanneled until Sep 21
Digital acquisition
Sep 20 vs. Sep 21
+48%
NOTE: Excludes the US business sold to PNC.1 Gross customer acquisition through own channels for retail segment.
Community Commitment 2025
550 Mn€ / 100 Mn peopleto fund social initiatives aimed
at fostering inclusive growth
€200 BnCOMMITMENT
32%
37%
1,684
Sep 20
2,493
Sep 21
The Forrester Digital Experience Review™: European Mobile Banking Apps, Q3 2021
DIGITAL EXPERIENCE LEADER5 YEARS IN A ROW
BBVA, an overall digital experience leader �ve years in a row, according to Forrester Research
(YTD)
* CET1 Pro-forma includes the deduction of the maximum amount of €3.5 billion of the share buyback program. Such deduction has been implemented in October as per ECB Authorization. ECB authorization for a maximum amount of €3.5 billion, up to 10% of shares. This amount has been calculated as 10% outstanding number of shares (666,788,658) multiplied by share price as of July, 22 (€5.251), reference date for the ECB request.

BBVA Group main data BBVA GROUP MAIN DATA (CONSOLIDATED FIGURES)
30-09-21 ∆ % 30-09-20 31-12-20Balance sheet (millions of euros)
Total assets 651,834 (10.2) 725,895 736,176
Loans and advances to customers (gross) (1) 327,968 1.8 322,059 323,252
Deposits from customers (1) 340,828 4.4 326,447 342,661
Total customer funds (1) 452,443 6.1 426,487 445,608
Total equity 50,567 4.2 48,522 50,020
Income statement (millions of euros)
Net interest income 10,708 (3.7) 11,115 14,592
Gross income 15,589 (0.2) 15,620 20,166
Operating income 8,613 (2.1) 8,796 11,079
Net attributable profit/(loss) 3,311 n.s. (15) 1,305
Net attributable profit or (loss) excluding non-recurring impacts (2) 3,727 84.9 2,016 2,729
The BBVA share and share performance ratios
Number of shares (million) 6,668 — 6,668 6,668
Share price (euros) 5.72 141.0 2.37 4.04
Earning per share (euros) (3) 0.46 n.s. (0.05) 0.14
Earning per share excluding non-recurring impacts (euros) (2)(3) 0.52 99.4 0.26 0.35
Book value per share (euros) 6.76 4.0 6.50 6.70
Tangible book value per share (euros) 6.41 9.9 5.84 6.05
Market capitalization (millions of euros) 38,120 141.0 15,816 26,905
Yield (dividend/price; %) (4) 1.0 11.0 4.0
Significant ratios (%)
Adjusted ROE (net attributable profit or (loss)/average shareholders' funds +/- average accumulated other comprehensive income) (2) 11.1 6.0 6.1
Adjusted ROTE (net attributable profit or (loss)/average shareholders' funds excluding average intangible assets +/- average accumulated other comprehensive income) (2) 11.7 6.3 6.5
Adjusted ROA (Profit or (loss) for the year/average total assets) (2) 0.94 0.55 0.54
Adjusted RORWA (Profit or (loss) for the year/average risk-weighted assets - RWA) (2) 1.99 1.17 1.16
Efficiency ratio 44.7 43.7 45.1
Cost of risk (5) 0.92 1.68 1.55
NPL Ratio (5) 4.0 4.1 4.2
NPL coverage ratio (5) 80 85 82
Capital adequacy ratios (%)
CET1 fully-loaded 14.48 11.52 11.73
CET1 phased-in (6) 14.71 11.99 12.15
Total ratio phased-in (6) 19.17 16.66 16.46
Other information
Number of clients (million) (7) 80.1 3.3 77.6 78.4
Number of shareholders 836,979 (6.8) 898,240 879,226
Number of employees 113,117 (8.9) 124,110 123,174
Number of branches 6,344 (16.1) 7,565 7,432
Number of ATMs 28,920 (6.8) 31,037 31,000
General note: the results generated by BBVA USA and the rest of Group's companies in the United States sold to PNC on June 1, 2021, are presented in a single line as "Profit/(loss) after tax from discontinued operations".
(1) Excluding the assets and liabilities figures from BBVA USA and the rest of Group's companies in the United States sold to PNC on June 1, 2021, classified as non-current assets and liabilities held for sale (NCA&L) as of 31-12-20. The figures related to "Loans and advances to customers (gross)", "Deposits from customers" and "Total customer funds", including BBVA USA, would stand at €379,018m, €395,132m and €495,171m, respectively, as of 30-09-20.
(2) Non-recurring impacts include: (I) profit/(loss) after tax from discontinued operations as of 30-09-21, 31-12-20 and 30-09-20; (II) the net costs related to the restructuring process as of 30-09-21; and (III) the net capital gain from the bancassurance operation with Allianz as of 31-12-20.
(3) Adjusted by additional Tier 1 instrument remuneration.
(4) Calculated by dividing shareholder remuneration over the last twelve months by the closing price of the period.
(5) Excluding BBVA USA and the rest of Group's companies in the United States sold to PNC on June 1, 2021.
(6) Phased-in ratios include the temporary treatment on the impact of IFRS 9, calculated in accordance with Article 473 bis amendments of the Capital Requirements Regulation (CRR), introduced by the Regulation (EU) 2020/873.
(7) Excluding BBVA USA and the rest of Group's companies in the United States sold to PNC on June 1, 2021 and BBVA Paraguay.

Contents
Highlights 4
Results and business activity 4
Solvency 5
Strategy developments 5
Other highlights 8
Macro trends 9
Group 10
Results 10
Balance sheet and business activity 16
Solvency 18
Risk management 20
Business areas 26
Spain 29
Mexico 32
Turkey 36
South America 40
Rest of Business 45
Corporate Center 48
Other information: Corporate & Investment Banking 50
Alternative Performance Measures (APMs) 53

HighlightsResults and business activity
The BBVA Group generated a net attributable profit, excluding non-recurring impacts, of €3,727m between January and September 2021, representing a year-on-year increase of +84.9%.
Including the non-recurring impacts —namely the €+280m corresponding to the profit generated by BBVA USA and the rest of Group's companies included in the sale agreement to PNC until the closing date of the operation on June 1, 2021 and the €-696m of net costs related to the restructuring process— the Group's net attributable profit amounts to €3,311m, which compares very positively with the €-15m in the same period of the previous year, which was severely affected by the effects of the COVID-19 pandemic.
In year-on-year terms and at constant exchange rates, it is worth highlighting the good performance of the gross income and especially of the recurring income, i.e. the sum of net interest income and fees, which grew by 6.1%, and the positive evolution (+13.7%) of net trading income (hereinafter NTI) mainly due to the good performance of the Global Markets unit in Spain and the revaluations of the Group stakes in Funds & Investment Vehicles in tech companies and the industrial and financial portfolio.
Operating expenses increased (+6.5% year-on-year) in all areas except Spain and Rest of Business. This growth is framed within an environment of activity recovery and high inflation, particularly in Mexico and Turkey.
Lastly, the lower provisions for impairment on financial assets stand out (-46.2% in year-on-year terms and at constant exchange rates), mainly due to the strong impact of provisions for COVID-19 in 2020.
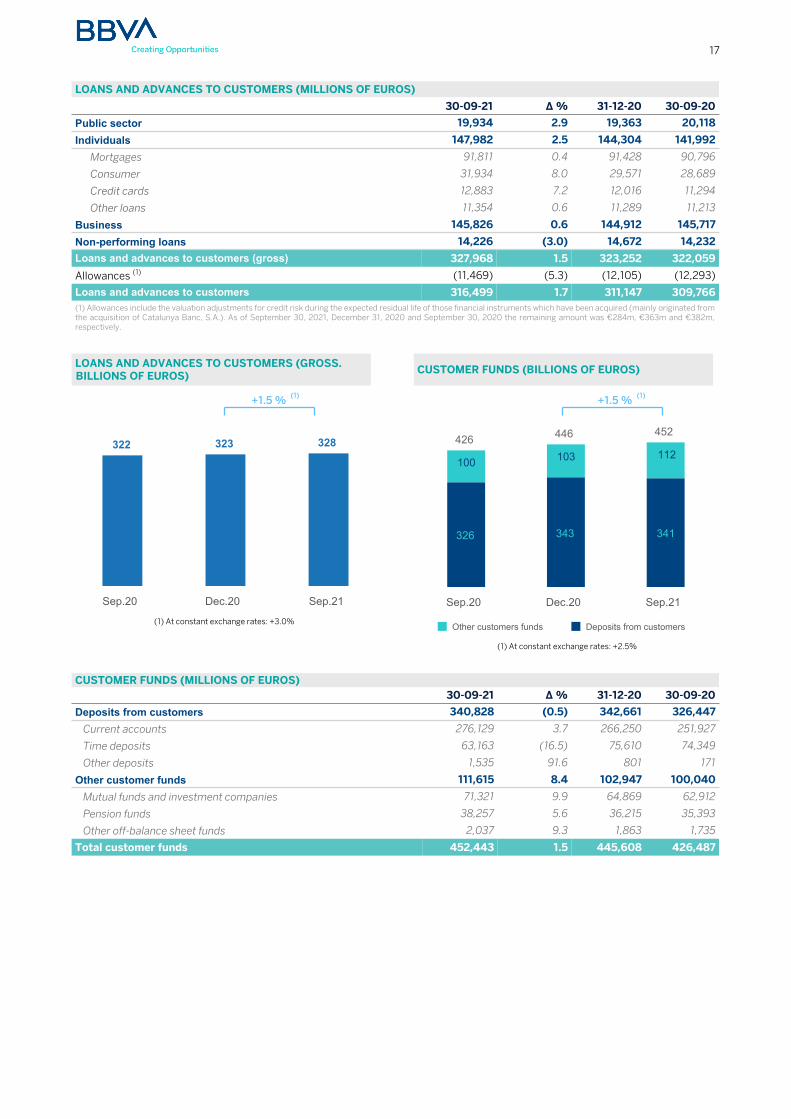
Loans and advances to customers (gross) recorded an increase of 1.5% compared to the end of December 2020, strongly supported by the performance of individuals (+2.5%), with growth in almost all geographical areas, except Rest of Business, highlighting the increase of consumer loans and credit cards in Turkey, Spain and Mexico. Loans to business also increased slightly (+0.6% in the year), thanks to the positive evolution in Mexico and Spain.
Customer funds showed an increase of 1.5% compared to the end of December 2020, due to the favorable performance of demand deposits and off-balance sheet funds in all geographical areas (highlighting mutual funds in Spain and Mexico), which manage to offset the decline in time deposits (-16.5%) thanks to the lower balances recorded in Spain and, to a lesser extent, in Rest of Business.
LOANS AND ADVANCES TO CUSTOMERS (GROSS) AND TOTAL CUSTOMER FUNDS (YEAR-TO-DATE CHANGE)
+1.5% +1.5%
Loans and advances tocustomers (gross)
Customer funds
Business areas
As for the business areas, in all of them, the provisions for impairment on financial assets decreased compared to 2020 due to the outbreak of the pandemic. In addition, in each of them it is worth mentioning:
• Spain: BBVA in Spain achieved a net attributable profit of €1,223m between January and September 2021, +160.9% of the profit achieved in the same period of the previous year, mainly due to the increase in incurring income (thanks to the favorable evolution of fees) and in NTI and the reduction of operating expenses in 2021.
• Mexico: BBVA in Mexico generated a net attributable profit of €1,811m between January and September 2021, representing an increase of 47.4% compared to the same period of the previous year, at constant exchange rate. This evolution is driven by a 5.9% growth (at constant exchange rate) in recurring income and by the strength of the net margin (+1.4%).
• Turkey: The net attributable profit generated by Turkey between January and September 2021 stood at €583m, 48.4% (at constant exchange rate) above the figure achieved in the same period of the previous year, mainly due to the growth of net fees and commissions and NTI.
• South America: South America generated a cumulative net attributable profit of €339m between January and September 2021, which at constant exchange rates and excluding BBVA Paraguay in 2020, represents a year-on-year variation of +35.6%, mainly due to a better evolution of recurring income and NTI between January and September 2021 (+18.8%), partially offset by a higher inflation adjustment in Argentina in 2021.
4

• Rest of Business: At the end of September 2021, the net attributable profit for the area stood at €205m (+32.1% year-on-year, at constant exchange rates). It is worth mentioning that this area mainly incorporates the wholesale business developed in Europe (excluding Spain) and in the United States, as well as the banking business developed through the 5 BBVA branches in Asia.
Corporate Center: The net attributable loss of the Corporate Center, including the aforementioned non-recurring impacts, at the close of September 2021 was €-849m, well below (-68.2%) the net attributable loss for the same period of the previous year, €-2,675m. In 2021, this result includes several non-recurring impacts: 1) the net attributable profit amounting to €280m generated by the Group's businesses in the United States included in the sale agreement and 2) the net cost related to the restructuring process amounting to €-696m. Excluding these non-recurring impacts, the net attributable loss stood at €-433m (compared to the cumulative loss of €-644m at the end of September 2020).
Lastly and to allow a broader understanding of the Group's activity and results, supplementary information is provided in the following for the wholesale business carried out by BBVA, Corporate & Investment Banking (CIB), in the countries where it operates. The wholesale business area generated a net attributable profit of €955m between January and September 2021, which represents a 42.1% increase in year-on-year terms, thanks to the growth in the recurring income and the NTI and lower provisions for impairment on financial assets, which increased significantly in 2020 due to the outbreak of the COVID-19 pandemic.
NET ATTRIBUTABLE PROFIT (MILLIONS OF EUROS)
+99.3 % (1)
2,016
3,727
Jan.-Sep.20 Jan.-Sep.21
General note: (I) Excludes: BBVA USA and the rest of the Group's companies in the United States sold to PNC on June 1, 2021, as of Jan.-Sep.20 and Jan.-Sep.21 and (II) the net cost related to the restructuring process as of Jan.-Sep.21.(1) At constant exchange rates.
NET ATTRIBUTABLE PROFIT BREAKDOWN(1) (PERCENTAGE. JAN.-SEP. 2021)
29.4
43.5
14.0
8.14.9
Spain
Mexico
Turkey
South America
Rest of Business
(1) Excludes the Corporate Center.
Solvency
The CET1 Fully-loaded ratio stood at 14.48% as of September 30, 2021, which means a strong capital generation in the quarter (31 basis points) and a large capital buffer, widely covering the capital requirements of the BBVA Group even after the share buyback. For more information on the Group' share buyback program, please see "Other highlights" at the end of the current "Highlights" section.
5

Strategy developments
BBVA's strategy has been reinforced in 2021 as a result of the acceleration of some of the trends, such as digitization or the commitment to more sustainable and inclusive development. The anticipation of these trends in the Group strategy has allowed BBVA to progress in the execution of its six strategic priorities.
Between January and September 2021, BBVA has continued to help its clients improve their financial health by focusing on the development of new tools and functionalities.
In this regard, BBVA’s mobile banking app continues to lead the digital experience in Europe for the fifth consecutive year, according to the recent report “The Forrester Digital Experience ReviewTM: European Mobile Banking Apps, Q3 2021". BBVA has stood out especially for the experience it offers in financial health, which helps clients improve their financial well-being through tailored suggestions. This functionality also offers useful content that guides clients in managing their day-to-day finances with a clear and intuitive design.
Advice that is appreciated by BBVA clients, which is reflected in a better Net Promoter Score among users of the financial health tools in Spain in the last quarter, which is 39% higher than that of other customers. Likewise, these financial advisory tools have been a key element for the contracting of products. Thus, in Spain, in the first nine months of the year they have contributed 17% of all investment fund contracts, and 25% of mortgage contracts.
Furthermore, the Group has reaffirmed its commitment to sustainability in 2021 with a focus on combating climate change and inclusive growth. BBVA wants to help its clients in the transition towards a sustainable future not only with financing but also with advice and innovative sustainable solutions.
In terms of financing, BBVA has originated a total of €75,355m in sustainable financing between 2018 and September 2021. This type of financing has grown by 69% in the first nine months of 2021 compared to the same period of the previous year. A good example of
6

the operations included in this type of financing is the €833m stake in a recent issuance of green debt from the Kingdom of Spain. The funds will be used to finance projects that promote ecological transition and adaptation to and mitigation of the impact of climate change.
BBVA aims to provide a comprehensive support service to its customers, individuals and companies, including also advisory so that they can take advantage of investment opportunities in sustainability and future technologies, and be more efficient and competitive. Thus, the Group continues being a pioneer in the development of innovative sustainable solutions. A good example is the recent launch in Spain of a tool for calculating the carbon footprint for retail customers, already developed for companies in 2020. This tools measures CO2 emissions into the atmosphere, based on data collected from invoices and card payments in selected shops, and offers a series of tailored tips on how to reduce them. The global nature of this new development allows it to be implemented in other geographical areas.
But beyond the origination of sustainable financing, in terms of managing the impact of the activity and integrating the risk of sustainability into the Bank’s processes, in the first nine months of 2021, BBVA has announced very relevant milestones such as the commitment to channel €200 billion to sustainable financing between 2018 and 2025, twice the amount established in the initial target; the decision to stop financing companies with coal-related activities; or the Net Zero 2050 commitment, which implies zero net CO2 emissions in that year, taking into account both the direct emissions of the Bank (where it has been neutral since 2020) and indirect emissions, i.e. those of the customers it finances. In this regard, BBVA is advancing in setting 2030 decarbonization goals in CO2 intensive selected industries, which will be announced in the context of the COP26.
In addition, a new global Sustainability area has been created, which aims to position BBVA as the benchmark bank for customers in sustainability solutions. The new global area will design the strategic sustainability agenda, define and promote the lines of work in this area of the different global and transformation units (Risk, Finance, Talent and Culture, Data, Engineering, among others) and develop new sustainable products. In addition, this area will be in charge of developing specialized knowledge for differential clients advice.
Regarding the focus on inclusive growth, BBVA and its foundations have recently announced their Community Commitment 2025, a plan through which they will allocate €550m to social initiatives, supporting inclusive growth in the countries where they operate. This commitment aims to address the most important social challenges in each region and complements the previously announced commitment to channel sustainable financing in the period 2018-2025 amounting to €200 billion.
This commitment has three lines of action: reducing inequality and promoting entrepreneurship, providing opportunities for all through education and supporting research and culture.
Through various initiatives, BBVA will support 5 million entrepreneurs, help more than 3 million people have a quality education and train 1 million people in financial education. In addition, the BBVA Microfinance Foundation will provide more than €7 billion in microcredits. In total, these programs will reach 100 million people during the mentioned period.
For all the reasons mentioned above, BBVA is the most sustainable European bank, according to the Dow Jones Sustainability Index, and the second in the world. An acknowledgement shared by Euromoney, which has named BBVA the best bank in corporate social responsibility in Western Europe in 2021, recognizing BBVA's commitment to improve social, economic and environmental conditions in the region.
On the other hand, BBVA seeks to accelerate its growth, positioning itself where its customers are, which requires a greater presence in digital channels, both own and third parties. BBVA considers that it is a great time to grow profitably and invest in value segments as well as other growth paths such as the entry into new markets, agreements with third parties or the digital acquisition of new customers. In this sense, the Group has recently announced the launch of a purely digital retail offer in Italy, with differential proposed value and customer experience. Besides, BBVA continues focusing on the acquisition of retail customers through its own digital channels, which, based on data as of the end of September 2021, has increased by 48% in the last twelve months, reaching
7

37% of new customers in the period. This has also been reflected in digital sales which, in cumulative terms and at the end of September, already represented 55% of the Group's total sales in PRV1.
BBVA continues to make progress towards operational excellence. The Group aims to offer an excellent customer experience at an efficient cost through a relationship model leveraging digitalization. In this sense, 68% of the bank's active customers already use digital channels and 64% use mobile channels. Thanks to this, BBVA stands out ¡n terms of efficiency with a ratio of 44.7% compared to the average of its European peers.
The Group places the best and most committed team at the center of its strategic priorities. For this reason, BBVA is one of the 30 companies worldwide awarded with the recognition “Exceptional Workplace 2021” by the American consulting firm Gallup. This award distinguishes organizations committed to developing the human potential of their staff.
Likewise, the Group's commitment to inclusion and diversity and the initiatives developed in this regard has led BBVA to be included for the fourth consecutive year in the Bloomberg Gender-Equality Index, a ranking that includes the 100 global companies with the best practices in gender diversity. BBVA is also a signee of the Charter of Diversity at the European level and the Women's Empowerment Principles of the United Nations.
For all this, the Group considers data and technology as the main catalysts for innovation. Data has become a key differential factor and data management creates strong competitive advantages. An example of BBVA's firm commitment to becoming a data-driven organization is the progress in the development of an integrated big data platform, in which more than 1,600 data scientists, developers and specialists are involved. BBVA is also committed to the increasing use of new technologies such as the cloud, blockchain or artificial intelligence.
Other highlights
• On January 29, 2021, BBVA announced its intention to return in 2021 to its shareholder remuneration policy consisting in the distribution of an annual payout of between 35% and 40% of the profits obtained in each financial year, fully paid in cash, in two different payments (expected to take place in October and April and subject to the applicable authorizations), provided that recommendation ECB/2020/62 is revoked and there are no further restrictions or limitations. On July 23, 2021, the European Central Bank made public the approval of recommendation ECB/2021/31 replacing recommendation ECB/2020/62 and to be in force as of September 30, 2021, removing the restrictions on dividends and buyback programs contained in that recommendation. Accordingly, on September 30, 2021 BBVA announced that BBVA’s Board of Directors approved the payment in cash of €0.08 per BBVA share, as a gross interim dividend against 2021 results, which was paid on October 12, 2021.
• On 26 October 2021, BBVA received the required authorization from the ECB for the buyback of up to 10% of its share capital for a maximum sum of €3,500m, in one or several tranches and over a maximum period of 12 months as from the communication by BBVA that the buyback of shares has effectively commenced (the “Authorization”).
Once the Authorization has been obtained the Board of Directors of BBVA, in its meeting held on 28 October 2021, agreed to carry out a program scheme for the buyback of own shares which will be executed in several tranches, for a maximum amount up to €3,500m, aimed at reducing BBVA’s share capital (the “Program Scheme”), notwithstanding the possibility to suspend or terminate the Program Scheme upon the occurrence of circumstances that makes it advisable.
Likewise, the Board of Directors agreed to carry out a first share buyback program which will have a maximum amount of €1,500m, a maximum number of shares to be acquired equal to 637,770,016 own shares, representing, approximately, 9.6% of the BBVA’s share capital, and a maximum term of 5 months as from its effective start, that will take place after 18 November 2021.
• In June 2021, BBVA and the majority of the labor union representatives reached an agreement on the restructuring plan of BBVA S.A. in Spain, which includes redundancies of 2,935 employees in total (divided into 2,725 layoffs and 210 leaves of absence, about 10% of the Group's total workforce in Spain) and an outplacement program for all interested employees. The agreement also includes the closing of 480 branches. The process has been characterized by an attitude of dialogue between the parties and it has been carried out with a clear interest in voluntary acceptance. As of September 30, 2021, a total of 1,674 employees have already signed the exit of BBVA S.A. (some of them did not effectively leave the Bank until October 1, 2021) and 260 branches have been closed. Additional employee departures from the branches are expected to occur during October and November, the volume of which will depend on the branches closures during both months, although the departure of some workers could be extended until March 31, 2022 for organizational reasons.
For management information purposes, as it is considered a strategic decision, the impacts of the process have been assigned to the Corporate Center. This process will generate estimated savings of approximately €250m per year, before taxes, from 2022 onwards, of which approximately €220m would correspond to personnel expenses. In 2021 the estimated savings will be approximately €65m before taxes, most of which will materialize in the last quarter of 2021, with the departure of employees starting July 18, 2021.
8
1 Product Relative Value is a proxy used for the economic representation of the sale of units.
Macro trendsIn the third quarter of 2021, the global economy has continued to recover from the crisis caused by the COVID-19 pandemic, mainly thanks to progress in vaccine rollout against COVID-19 and the significant economic stimuli adopted by public authorities. Activity indicators show, however, that the economic recovery process has lost momentum in recent months, especially in countries such as the United States and China.
Furthermore, upward pressure on prices has recently increased more than expected. Consumer inflation remains at unusually high levels, well above average levels in 2010 and 2019. In September, annual inflation stood at 5.4% in the United States and 3.4% in the Eurozone.
Both the recent slowdown in growth and inflation rise in recent months are partly due to a series of problems in global supply chains, caused, among other factors, by the relative strength of demand versus supply, after the rapid reopening of the economy which was possible thanks to the drop of COVID-19 infections. Meanwhile, commodity prices have risen sharply in recent months, especially energy prices, reinforcing upward pressures on prices and downward pressures on economic activity.
In this context, the United States Federal Reserve is preparing to start the process of withdrawing monetary stimuli. Specifically, the rollback in its bond-buying program is probably to begin in the last quarter of 2021 and, in terms of monetary policy, it is likely that interest rates will be gradually adjusted upward starting the end of 2022. In any case, the approach of economic policy in the major regions is expected to settle in the coming quarters.
According to BBVA Research estimates, the recovery process of the global economy is expected to continue in the coming months, although at a slightly slower pace than expected three months ago and global GDP will expand around 6.1% in 2021. Also according to BBVA Research forecasts, growth will reach 5.9% in 2021 in the United States, 8% in China and 5.2% in the Eurozone. Furthermore, inflationary pressures are expected to remain relatively high, though they will most likely moderate next year as problems in global supply chains remedied.
9

GroupQuarterly evolution of resultsThe BBVA Group’s results in the third quarter of 2021 stood at €1,400m, with a favorable performance compared to the previous quarter (+94.9% at constant exchange rate), highlighting the following trends:
• Increase in recurring revenues in Turkey, Mexico and South America.
• Decrease in NTI (-23.6% at constant exchange rate), due to lower results of the Global Markets unit and also affected by seasonality in certain geographical areas.
• Favorable evolution of the other operating income and expenses line, due to the contribution made to the SRF by Spain in the second quarter of 2021. In addition, the comparison is affected by the lower dividend income recorded at the Corporate Center, as the previous quarters included, among others, the dividend of Telefónica and those from the Group’s investments in Funds & Investment Vehicles in tech companies.
• Increase in operating expenses in Mexico and South America, in an environment of inflation and recovery of activity.
CONSOLIDATED INCOME STATEMENT: QUARTERLY EVOLUTION (MILLIONS OF EUROS)2021 2020
3Q 2Q 1Q 4Q 3Q 2Q 1QNet interest income 3,753 3,504 3,451 3,477 3,553 3,537 4,024Net fees and commissions 1,203 1,182 1,133 1,042 1,023 934 1,124
Net trading income 387 503 581 175 357 470 544
Other operating income and expenses (13) (85) (11) (147) 46 (80) 86
Gross income 5,330 5,104 5,155 4,547 4,980 4,862 5,778Operating expenses (2,378) (2,294) (2,304) (2,264) (2,163) (2,182) (2,477)
Personnel expenses (1,276) (1,187) (1,184) (1,186) (1,124) (1,113) (1,272)Other administrative expenses (788) (800) (812) (766) (725) (754) (860)Depreciation (314) (307) (309) (312) (315) (316) (345)
Operating income 2,953 2,810 2,850 2,282 2,817 2,679 3,300Impairment on financial assets not measured at fair value through profit or loss
(622) (656) (923) (901) (706) (1,408) (2,164)
Provisions or reversal of provisions (50) (23) (151) (139) (88) (219) (300)
Other gains (losses) 19 (7) (17) (82) (127) (103) (29)Profit/(loss) before tax 2,299 2,124 1,759 1,160 1,895 950 807
Income tax (640) (591) (489) (337) (515) (273) (204)
Profit/(loss) for the period 1,659 1,533 1,270 823 1,380 678 603
Non-controlling interests (259) (239) (237) (110) (312) (162) (172)Net attributable profit excluding non-recurring impacts
1,400 1,294 1,033 713 1,068 516 431
Profit/(loss) after tax from discontinued operations (1) — 103 177 302 73 120 (2,224)
Corporate operations (2) — — — 304 — — —Net cost related to the restructuring process — (696) — — — — —
Net attributable profit/(loss) 1,400 701 1,210 1,320 1,141 636 (1,792)Earning per share excluding non-recurring impacts (3) 0.20 0.18 0.14 0.09 0.15 0.06 0.05
Earning per share (euros) (3) 0.20 0.09 0.17 0.18 0.16 0.08 (0.29)General note: the results generated by BBVA USA and the rest of Group's companies in the United States sold to PNC on June 1, 2021, are presented in a single line as "Profit/(loss) after tax from discontinued operations".
(1) Profit/(loss) after tax from discontinued operations includes the goodwill impairment in the United States registered in the first quarter of 2020 for an amount of €2,084m.
(2) Net capital gains from the sale to Allianz of the half plus one share of the company created to jointly develop the non-life insurance business in Spain, excluding the health insurance line.
(3) Adjusted by additional Tier 1 instrument remuneration.
10

Year-on-year evolution of resultsThe BBVA Group generated a net attributable profit, excluding non-recurring impacts, of €3,727m between January and September 2021, representing a year-on-year increase of +84.9%. Including these impacts —namely €+280m from the results of discontinued operations and €-696m from the net costs related to the restructuring process— the Group's net attributable profit amounts to €3,311m, which compares very positively with the €-15m in the same period of the previous year, which was severely affected by the effects of the COVID-19 pandemic. With regard to the recording of these restructuring costs, it should be noted that, solely for management purposes and for the purpose of the comments provided in this report, these are included in the income statement line "Net cost related to the restructuring process". The financial information is presented to the Group's Senior Management using this approach. This report includes a reconciliation between the management approach and the BBVA Group's Condensed Interim Consolidated Financial Statements.
Despite the complex environment and at constant exchange rates, good performance in recurring income, i.e. net interest income (which accelerated its year-on-year growth rate) and fees, the positive evolution of net trading income (NTI) and lower provisions for impairment on financial assets.
CONSOLIDATED INCOME STATEMENT (MILLIONS OF EUROS)∆ % at constant
Jan.-Sep.21 ∆ % exchange rates Jan.-Sep.20Net interest income 10,708 (3.7) 2.5 11,115Net fees and commissions 3,518 14.2 19.2 3,081
Net trading income 1,472 7.3 13.7 1,372
Other operating income and expenses (108) n.s. n.s. 53
Gross income 15,589 (0.2) 5.6 15,620
Operating expenses (6,976) 2.2 6.5 (6,823)
Personnel expenses (3,647) 4.0 8.7 (3,509)
Other administrative expenses (2,400) 2.6 6.7 (2,338)
Depreciation (929) (4.9) (1.5) (976)
Operating income 8,613 (2.1) 4.9 8,796Impairment on financial assets not measured at fair value through profit or loss
(2,202) (48.5) (46.2) (4,278)
Provisions or reversal of provisions (224) (63.0) (61.6) (607)
Other gains (losses) (5) (98.0) (98.0) (259)
Profit/(loss) before tax 6,182 69.3 89.0 3,652Income tax (1,720) 73.5 91.6 (991)
Profit/(loss) for the period 4,462 67.7 88.1 2,661
Non-controlling interests (735) 13.8 46.1 (646)
Net attributable profit excluding non-recurring impacts 3,727 84.9 99.3 2,016
Profit/(loss) after tax from discontinued operations (1) 280 n.s. n.s. (2,031)
Net cost related to the restructuring process (696) n.s. n.s. —
Net attributable profit/(loss) 3,311 n.s. n.s. (15)
Earning per share excluding non-recurring impacts (2) 0.52 0.26
Earning per share (euros) (2) 0.46 (0.05)General note: the results generated by BBVA USA and the rest of Group's companies in the United States sold to PNC on June 1, 2021, are presented in a single line as "Profit/(loss) after tax from discontinued operations".
(1) Profit/(loss) after tax from discontinued operations includes the goodwill impairment in the United States registered in the first quarter of 2020 for an amount of €2,084m.
(2) Adjusted by additional Tier 1 instrument remuneration.
Unless expressly indicated otherwise, to better understand the changes under the main headings of the Group's income statement, the year-on-year rates of change provided below refer to constant exchange rates. When comparing two dates or periods in this report, the impact of exchange rate variations against the euro for the currencies of the countries in which BBVA operates is sometimes excluded, assuming that the exchange rates remain constant. In doing so, with regard to income statement amounts, average exchange rates of the most recent period are used for each currency in the geographic areas where the Group operates for both periods.
11

Net interest income as of September 30, 2021 was higher than in the same period of the previous year (+2.5%), due to the good performance in South America and Mexico, which offset the poor evolution in Turkey, Spain and Rest of Business.
All areas, with the exception of Rest of Business, showed a positive performance in the net fees and commissions line compared to the accumulated balance between January and September 2020 (+19.2% in the Group), which is partly explained by lower activity and the removal of certain fees as a measure to support customers during the worst moments of the pandemic in 2020, as well as higher fees from payment systems, deposits and asset management in 2021.
NET INTEREST INCOME/ATAS(1) (PERCENTAGE)
2.172.13
2.19 2.21
2.30
3Q20 4Q20 1Q21 2Q21 3Q21(1) Excluding BBVA USA and the rest of the Group's companies in the United States sold to PNC on June 1, 2021.
NET INTEREST INCOME PLUS NET FEES AND COMMISSIONS (MILLIONS OF EUROS AT CONSTANT EXCHANGE RATES)
+6.1 % (1)
13,403 14,226
4,506 4,314 4,582 4,613 4,530 4,733 4,963
5,1484,472 4,576 4,519 4,584 4,686 4,956
At current exchange rates
1Q20 2Q20 3Q20 4Q20 1Q21 2Q21 3Q21
(1) At current exchange rates: +0.2%
NTI showed a year-on-year increase of +13.7% as of September 30, 2021, mainly due to the good performance of the Global Markets unit in Spain and the revaluations of the Group stakes in Funds & Investment Vehicles in tech companies and the industrial and financial portfolio.
The other operating income and expenses line accumulated a negative result of €-108m as of September 30, 2021, compared to €+53m in the same period last year, due to BBVA's greater annual contribution in Spain to the Single Resolution Fund (hereinafter SRF), the higher negative adjustment for inflation in Argentina and the lower contribution of the insurance business.
GROSS INCOME (MILLIONS OF EUROS AT CONSTANT EXCHANGE RATES)
+5.6 % (1)
14,756 15,589
5,0854,692 4,979 4,648
5,091 5,159 5,3405,778
4,862 4,9804,547
5,155 5,104 5,330
At current exchange rates
1Q20 2Q20 3Q20 4Q20 1Q21 2Q21 3Q21
(1) At current exchange rates: -0.2%
Operating expenses increased (+6.5% year-on-year) in all areas except Spain and Rest of Business. This growth is framed within an environment of activity recovery and high inflation, particularly in Mexico and Turkey.
The efficiency ratio stood at 44.7% as of September 30, 2021, in line with the ratio achieved in the same period of the previous year (44.4%), with an improvement of 83 basis points over the ratio at the end of December 2020.
12

OPERATING EXPENSES (MILLIONS OF EUROS AT CONSTANT EXCHANGE RATES)
+6.5 % (1)
6,548 6,976
2,246 2,128 2,174 2,295 2,283 2,313 2,380
2,4772,182 2,163 2,264 2,304 2,294 2,378
At current exchange rates
1Q20 2Q20 3Q20 4Q20 1Q21 2Q21 3Q21
(1) At current exchange rates: +2.2%
EFFICIENCY RATIO (PERCENTAGE)
-83Basis points
43.745.1 44.744.4
45.6 44.7
At current exchange rates At constant exchange rates
Jan.-Sep.20 2020 Jan.-Sep.21
Impairment on financial assets not measured at fair value through profit or loss (impairment on financial assets) closed September, 2021 with a negative balance of €2,202m, significantly lower than the previous year (-46.2%) and with a decrease in all geographical areas mainly due to the negative impact of provisions for COVID-19 in 2020.
OPERATING INCOME (MILLIONS OF EUROS AT CONSTANT EXCHANGE RATES)
+4.9 % (1)
8,208 8,613
2,8392,563
2,8052,353
2,808 2,846 2,9603,300
2,679 2,817
2,282
2,850 2,810 2,953
At current exchange rates
1Q20 2Q20 3Q20 4Q20 1Q21 2Q21 3Q21
(1) At current exchange rates: -2.1%
IMPAIRMENT ON FINANCIAL ASSETS (MILLIONS OF EUROS AT CONSTANT EXCHANGE RATES)
-46.2 % (1)
4,096 2,202
1,918
1,391
786 904 916663 623
2,164
1,408
706901 923
656 622
At current exchange rates
1Q20 2Q20 3Q20 4Q20 1Q21 2Q21 3Q21
(1) At current exchange rates: -48.5%
The provisions or reversal of provisions line (hereinafter "provisions") closed with a negative balance of €-224m as of September 30, 2021, -61.6% below the figure accumulated in the same period last year, mainly due to provisions to meet potential claims in Spain and to increased provisions for special funds and contingent risk and commitments in Turkey, in both cases registered in 2020.
With regard to other gains (losses) line, it closed September 2021 with a negative balance of €5m, an improvement on the figure reached the previous year (€-259m), mainly due to the impairment of investments in subsidiaries, joint ventures and associates in 2020 registered at the Corporate Center.
As a result of the above, the BBVA Group generated a net attributable profit, excluding non-recurring impacts, of €3,727m between January and September 2021, representing a year-on-year increase of +99.3%. These non-recurring impacts include:
• The results generated by BBVA USA and other companies included in the sale agreement to PNC and classified as discontinued operations, generated €280m in 2021 until the closing of the operation, contrasting very positively with the negative result of €-2,031m accumulated between January and September 2020, which included the impact of the goodwill impairment in the United States. These results are recorded in the "Profit/(loss) after tax from discontinued operations" line of the Corporate Center's income statement.
• The net cost related to the restructuring process of BBVA S.A. in Spain which amounted to €-696m, of which, before tax, €-754m correspond to the collective layoff and €-240m to branches closures.
13

Taking into account both impacts, the Group's net attributable profit between January and September 2021 amounts to €3,311m, which compares very positively with the €-15m in the same period of the previous year, which was severely affected by the effects of the COVID-19 pandemic.
The cumulative net attributable profits, in millions of euros, at the close of September 2021 for the various business areas that comprise the Group were as follows: €1,223m in Spain, €1,811m in Mexico, €583m in Turkey, €339m in South America and €205m in Rest of Business.
NET ATTRIBUTABLE PROFIT (MILLIONS OF EUROS AT CONSTANT EXCHANGE RATES)
-164 3,311
-1,880
602
1,1141,347 1,200
716
1,396
-1,792
6361,141 1,320 1,210
701
1,400
At current exchange rates
1Q20 2Q20 3Q20 4Q20 1Q21 2Q21 3Q21
NET ATTRIBUTABLE PROFIT EXCLUDING NON-RECURRING IMPACTS (MILLIONS OF EUROS AT CONSTANT EXCHANGE RATES)
+99.3% (1)
1,870 3,727
333491
1,045
754
1,021
1,308 1,398
431 516
1,068
713
1,0331,294
1,400
At current exchange rates
1Q20 2Q20 3Q20 4Q20 1Q21 2Q21 3Q21
General note: non-recurring impacts include: (I) BBVA USA and the rest of the Group´s companies in the United States sold to PNC on June 1, 2021 in all periods; (II) the net cost related to the restructuring process as of 2Q21; and (III) the net capital gain from the bancassurance operation with Allianz as of 4Q20.
(1) At current exchange rates: +84.9%
TANGIBLE BOOK VALUE PER SHARE AND DIVIDENDS(1) (EUROS)
+12.3%
5.846.05 6.15
6.406.55
5.84 6.05 6.15 6.34 6.41
0.060.14
Dividends Tangible book value
Sep.20 Dec.20 Mar.21 Jun.21 Sep.21
(1) Replenishing dividends paid in the period.
EARNING PER SHARE(1) AND ADJUSTED EARNING PER SHARE(1) (EUROS)
+99.4 %
0.26 0.52
-0.29
0.080.16 0.18 0.17
0.09
0.20
0.05 0.060.15 0.09 0.14 0.18 0.20
EPS Adjusted EPS
1Q20 2Q20 3Q20 4Q20 1Q21 2Q21 3Q21
General note: adjusted earning per share excludes: (I) BBVA USA and the rest of the Group's companies in the United States sold to PNC on June 1, 2021, in all periods; (II) the net cost related to the restructuring process as of 2Q21; and (III) the net capital gain from the bancassurance operation with Allianz as of 4Q20. (1) Adjusted by additional Tier 1 instrument remuneration.
14

The Group’s profitability indicators improved, both on a year-to-year basis and compared to the end of December 2020, in line with the favorable performance of the results.
ROE AND ROTE(1) (PERCENTAGE)
6.3 6.5
11.7
6.0 6.1
11.1
ROTE ROE
Jan.-Sep.20 2020 Jan.-Sep.21
(1) Excludes: (I) BBVA USA and the rest of the Group's companies in the United States sold to PNC on June 1, 2021 in all periods; (II) the net cost related to the restructuring process as of Jan.-Sep.21; and (III) the net capital gain from the bancassurance operation with Allianz as of 2020.
ROA AND RORWA(1) (PERCENTAGE)
1.17 1.161.99
0.55 0.540.94
RORWA ROA
Jan.-Sep.20 2020 Jan.-Sep.21
(1) Excludes: (I) BBVA USA and the rest of the Group's companies in the United States sold to PNC on June 1, 2021 in all periods; (II) the net cost related to the restructuring process as of Jan.-Sep.21; and (III) the net capital gain from the bancassurance operation with Allianz as of 2020.
15

Balance sheet and business activityThe most relevant aspects related to the evolution of the Group's balance sheet and business activity as of September 30, 2021 are summarized below:
• Loans and advances to customers (gross) recorded an increase of 1.5% compared to the end of December 2020, strongly supported by the performance of individuals (+2.5%), with growth in almost all geographical areas, except Rest of Business, highlighting the increase of consumer loans and credit cards in Turkey, Spain and Mexico. Loans to business also increased slightly (+0.6% in the year), thanks to the positive evolution in Mexico and Spain.
• Customer funds showed an increase of 1.5% compared to the end of December 2020, due to the favorable performance of demand deposits and off-balance sheet funds in all geographical areas (highlighting mutual funds in Spain and Mexico), which manage to offset the decline in time deposits (-16.5%) thanks to the lower balances recorded in Spain and, to a lesser extent, in Rest of Business.
CONSOLIDATED BALANCE SHEET (MILLIONS OF EUROS)
30-09-21 ∆ % 31-12-20 30-09-20Cash, cash balances at central banks and other demand deposits 63,232 (3.5) 65,520 59,769
Financial assets held for trading 109,078 0.8 108,257 105,395
Non-trading financial assets mandatorily at fair value through profit or loss 5,874 13.0 5,198 5,123
Financial assets designated at fair value through profit or loss 1,137 1.8 1,117 1,117
Financial assets at fair value through accumulated other comprehensive income 69,963 0.8 69,440 66,877
Financial assets at amortized cost 370,217 0.7 367,668 363,708
Loans and advances to central banks and credit institutions 18,237 (12.3) 20,784 18,759
Loans and advances to customers 316,499 1.7 311,147 309,766
Debt securities 35,481 (0.7) 35,737 35,183
Investments in subsidiaries, joint ventures and associates 880 (38.7) 1,437 1,241
Tangible assets 7,291 (6.8) 7,823 7,844
Intangible assets 2,271 (3.1) 2,345 2,326
Other assets 21,891 (79.6) 107,373 112,494
Total assets 651,834 (11.5) 736,176 725,895
Financial liabilities held for trading 83,359 (3.6) 86,488 93,790
Other financial liabilities designated at fair value through profit or loss 9,726 (3.2) 10,050 9,382
Financial liabilities at amortized cost 481,662 (1.8) 490,606 470,764
Deposits from central banks and credit institutions 71,507 (1.8) 72,806 67,834
Deposits from customers 340,828 (0.5) 342,661 326,447
Debt certificates 55,397 (10.3) 61,780 64,092
Other financial liabilities 13,930 4.3 13,358 12,390
Liabilities under insurance and reinsurance contracts 10,564 6.2 9,951 9,505
Other liabilities 15,957 (82.1) 89,061 93,933
Total liabilities 601,268 (12.4) 686,156 677,373Non-controlling interests 5,628 2.9 5,471 5,404
Accumulated other comprehensive income (15,684) 9.3 (14,356) (14,552)
Shareholders’ funds 60,622 2.9 58,904 57,669
Total equity 50,567 1.1 50,020 48,522Total liabilities and equity 651,834 (11.5) 736,176 725,895
Memorandum item:Guarantees given 43,740 1.0 43,294 42,805General note: the assets and liabilities of BBVA USA and the rest of the companies which the Group owned in the United States, they have been transferred to PNC after the sale materialized on June 1, 2021, and are therefore not included in the consolidated BBVA Group balance sheet as of 30-09-2021. As the applicable accounting regulation indicates, they are classified, respectively, as non-current assets and liabilities held for sale, inside the other assets/other liabilities line of the consolidated BBVA Group Balance sheet as of 31-12-2020. For management purposes only in order to make the information comparable, the assets and liabilities of BBVA USA and the rest of the Group´s companies in the United States included in the sale agreement singed with PNC are classified, respectively, in the other assets/other liabilities line of BBVA Group consolidated Balance sheet as of 30-09-2020.
16
LOANS AND ADVANCES TO CUSTOMERS (MILLIONS OF EUROS) 30-09-21 ∆ % 31-12-20 30-09-20
Public sector 19,934 2.9 19,363 20,118
Individuals 147,982 2.5 144,304 141,992
Mortgages 91,811 0.4 91,428 90,796
Consumer 31,934 8.0 29,571 28,689
Credit cards 12,883 7.2 12,016 11,294
Other loans 11,354 0.6 11,289 11,213
Business 145,826 0.6 144,912 145,717
Non-performing loans 14,226 (3.0) 14,672 14,232Loans and advances to customers (gross) 327,968 1.5 323,252 322,059
Allowances (1) (11,469) (5.3) (12,105) (12,293)
Loans and advances to customers 316,499 1.7 311,147 309,766(1) Allowances include the valuation adjustments for credit risk during the expected residual life of those financial instruments which have been acquired (mainly originated from the acquisition of Catalunya Banc, S.A.). As of September 30, 2021, December 31, 2020 and September 30, 2020 the remaining amount was €284m, €363m and €382m, respectively.
LOANS AND ADVANCES TO CUSTOMERS (GROSS. BILLIONS OF EUROS)
+1.5 % (1)
322 323 328
Sep.20 Dec.20 Sep.21
(1) At constant exchange rates: +3.0%
CUSTOMER FUNDS (BILLIONS OF EUROS)
+1.5 % (1)
426 446 452
326 343 341
100 103 112
Other customers funds Deposits from customers
Sep.20 Dec.20 Sep.21
(1) At constant exchange rates: +2.5%
CUSTOMER FUNDS (MILLIONS OF EUROS) 30-09-21 ∆ % 31-12-20 30-09-20
Deposits from customers 340,828 (0.5) 342,661 326,447
Current accounts 276,129 3.7 266,250 251,927
Time deposits 63,163 (16.5) 75,610 74,349
Other deposits 1,535 91.6 801 171
Other customer funds 111,615 8.4 102,947 100,040
Mutual funds and investment companies 71,321 9.9 64,869 62,912
Pension funds 38,257 5.6 36,215 35,393
Other off-balance sheet funds 2,037 9.3 1,863 1,735
Total customer funds 452,443 1.5 445,608 426,487
17

SolvencyCapital base
BBVA Group's fully-loaded CET1 ratio stood at 14.48% at September 30, 2021, which is an increase of +31 basis points above the previous quarter and amply covering the capital requirements of the BBVA Group (+588 basis points).
During the third quarter of 2021, the evolution of the consolidated fully-loaded CET1 ratio continued to be supported by recurrent organic capital generation, which net of dividends and remunerations of AT1 instruments, contribute up to +24 basis points. Apart from these items, the capital consumption due to organic activity evolution drained -3 basis points, while the evolution of the remaining components of the CET1 contributed +9 basis points. Among the latter, it is worth mentioning the positive contribution due to the parameters´update within the portfolios subject to the IRB credit risk method which has been partially offset by, among others, a negative evolution of market variables, in particular, the exchange rate.
The consolidated fully-loaded additional Tier 1 capital (AT1) stood at 1.91% as of September 30, 2021, which results in an increase of +4 basis points compared to the previous quarter.
The consolidated fully-loaded Tier 2 ratio as of September 30, 2021 stood at 2.47%, an increase of +3 basis points in the quarter. The total fully-loaded capital adequacy ratio stands at 18.86%.
The phased-in CET1 ratio, on consolidated terms, stood at 14.71% as of September 30, 2021, considering the transitory effect of the IFRS 9 standard. AT1 reached 1.90% and Tier 2 reached 2.56%, resulting in a total capital adequacy ratio of 19.17%.
Regarding shareholder remuneration, after the lifting of the recommendations by the European Central Bank, on September 30, 2021, BBVA informed that the BBVA’s Board of Directors approved the payment in cash of €0.08 per BBVA share, as gross interim dividend against 2021 results. The dividend was paid on October 12, 2021. This dividend is already considered within the capital ratios of the Group.
SHAREHOLDER STRUCTURE (30-09-2021)
Shareholders SharesNumber of shares Number % Number %Up to 500 345,689 41.3 64,765,704 1.0
501 to 5,000 386,593 46.2 678,331,454 10.2
5,001 to 10,000 56,209 6.7 395,267,622 5.9
10,001 to 50,000 43,639 5.2 835,142,199 12.5
50,001 to 100,000 3,148 0.4 214,561,513 3.2
100,001 to 500,000 1,402 0.2 252,447,748 3.8
More than 500,001 299 0.0 4,227,370,340 63.4
Total 836,979 100.0 6,667,886,580 100.0
FULLY-LOADED CAPITAL RATIOS (PERCENTAGE)
16.03 15.91
18.86
11.52 11.7314.48
2.00 1.89
1.912.51 2.30
2.47
Tier 2
Additional Tier 1
CET1
09.30.20 12.31.20 09.30.21
18

CAPITAL BASE (MILLIONS OF EUROS)CRD IV phased-in CRD IV fully-loaded
30-09-21 (1) (2) 31-12-20 30-09-20 30-09-21 (1) (2) 31-12-20 30-09-20
Common Equity Tier 1 (CET 1) 44,567 42,931 41,231 43,802 41,345 39,651
Tier 1 50,338 49,597 48,248 49,573 48,012 46,550
Tier 2 7,763 8,547 9,056 7,484 8,101 8,628
Total Capital (Tier 1 + Tier 2) 58,101 58,145 57,305 57,057 56,112 55,178
Risk-weighted assets 303,007 353,273 343,923 302,548 352,622 344,215
CET1 (%) 14.71 12.15 11.99 14.48 11.73 11.52
Tier 1 (%) 16.61 14.04 14.03 16.39 13.62 13.52
Tier 2 (%) 2.56 2.42 2.63 2.47 2.30 2.51
Total capital ratio (%) 19.17 16.46 16.66 18.86 15.91 16.03(1) As of September 30, 2021, the difference between the phased-in and fully-loaded ratios arises from the temporary treatment of certain capital items, mainly of the impact of IFRS 9, to which the BBVA Group has adhered voluntarily (in accordance with article 473bis of the CRR and the subsequent amendments introduced by the Regulation (EU) 2020/873).
(2) Preliminary data.
With regard to MREL (Minimum Requirement for own funds and Eligible Liabilities) requirements, on May 31, 2021, BBVA made public that it had received a new communication from the Bank of Spain on its minimum requirement for own funds and admissible liabilities (MREL) established by the Single Resolution Board (hereinafter SRB), calculated taking into account the financial and supervisory information as of December 31, 2019.
This communication on MREL replaces the one previously received and according to it, BBVA must reach, by January 1, 2022, an amount of own funds and eligible liabilities equal to 24.78%2 of the total Risk Weighted Assets (hereinafter, RWAs) of its resolution group, at a sub-consolidated3 level (hereinafter, the "MREL in RWAs"). Also, of this MREL in RWAs, 13.50% of the total RWAs must be met with subordinated instruments (the "subordination requirement in RWAs"). This MREL in RWAs is equivalent to 10.25% in terms of the total exposure considered for the purposes of calculating the leverage ratio (the “MREL in LR”), while the subordination requirement in RWAs is equivalent to 5.84% in terms of the total exposure considered for calculating the leverage ratio (the "subordination requirement in LR"). In the case of BBVA, the requirement that is currently the most restrictive is that expressed by the MREL in RWAs. Given the structure of own funds and admissible liabilities of the resolution group, as of September 30, 2021, the MREL ratio in RWAs stands at 29.92%4,5, complying with the aforementioned MREL requirement.
With the aim of reinforcing compliance with these requirements, in March 2021, BBVA carried out an issue of senior preferred debt for an amount of €1,000m. Afterwards, in September 2021, BBVA carried out an issue of €1,000m under a floating rate senior preferred social bond, maturing in two years. Both issuances have mitigated the loss of eligibility of three issuances, two senior preferred issues and one senior non-preferred issue issued during 2017 and reaching their maturity in 2021.
Lastly, the Group's leverage ratio stood at 7.5% fully-loaded (7.6% phased-in) as of September 30, 2021. These figures include the effect of the temporary exclusion of certain positions with the central banks of the different geographical areas where the Group operates, foreseen in the “CRR-Quick fix”.
RatingsDuring the first nine months of 2021, BBVA’s rating has continued to demonstrate stability and all the rating agencies have confirmed its rating, maintaining it in the A category. Last June, in a joint review of several European banks, S&P changed the outlook of BBVA’s rating to stable from negative (confirming its A- rating), acknowledging both the benefits of the Group’s geographical diversification and the substantial capital reinforcement experienced after the BBVA USA sale.
The following table shows the credit ratings and outlook given by the agencies:
RATINGSRating agency Long term (1) Short term OutlookDBRS A (high) R-1 (middle) Stable
Fitch A- F-2 Stable
Moody's A3 P-2 Stable
Standard & Poor's A- A-2 Stable(1) Ratings assigned to long term senior preferred debt. Additionally, Moody’s and Fitch assign A2 and A- rating respectively, to BBVA’s long term deposits.
19
2 Pursuant to the new applicable regulation, the MREL in RWAs and the subordination requirement in RWAs do not include the combined requirement of capital buffers. For these purposes, the applicable combined capital buffer requirement would be 2.5%, without prejudice to any other buffer that may be applicable at any given time.3 In accordance with the resolution strategy MPE (“Multiple Point of Entry”) of the BBVA Group, established by the SRB, the resolution group is made up of Banco Bilbao Vizcaya Argentaria, S.A. and subsidiaries that belong to the same European resolution group. As of December 31, 2019, the total RWAs of the resolution group amounted to €204,218m and the total exposure considered for the purpose of calculating the leverage ratio amounted to €422,376m.4 Own resources and eligible liabilities to meet, both, MREL and the combined capital buffer requirement, which would be 2.5%, without prejudice to any other buffer that may be applicable at any given time.5 As of September 30, 2021, both the MREL ratio in RWAs and the next ratios shown hereafter are provisional: the MREL ratio in LR stands at 12.43% and the subordination ratios in terms of RWAs and in terms of exposure of the leverage ratio, stand at 26.60% and 11.05%, respectively.

Risk managementCredit risk
The local authorities of the countries in which the Group operates initiated economic support measures in 2020, after the outbreak of the pandemic, including the granting of relief measures in terms of temporary payment deferrals for customers affected by the pandemic, as well as the granting of loans covered by public guarantees, especially to companies and SMEs.
These measures are supported by the rules issued by the authorities of the geographical areas where the Group operates as well by certain industry agreements and should help to ease the temporary liquidity needs of the customers. The classification of the customers’ credit quality and the calculation of the expected credit loss, once the credit quality of those customers have been reviewed under the new circumstances, will depend on the effectiveness of these relief measures. In any case, the incorporation of public guarantees is considered to be a mitigating factor in the estimation of the expected credit losses. The possibility of benefiting from this type of temporary deferral measures has expired in the main geographical areas where the Group is currently present.
Regarding the public guarantee programs, in Spain, following the publication of the RDL 5/2021 and the Code of Good Practices, to which BBVA has voluntarily adhered, term extensions could be requested until October 15, 2021, whereas in Peru, due to a new extension of the Plan Reactiva, it is allowed until December 31, 2021, as additional three months have been extended by the Royal Urgency Decree Nº 091-2021 of September 29.
For the purposes of classifying exposures based on their credit risk, the Group has maintained a rigorous application of IFRS 9 at the time of granting the moratoriums and has reinforced the procedures to monitor credit risk both during their validity and upon their maturity. In this respect, additional indicators have been introduced to identify the significant increase in risk that may have occurred in some operations or a set of them and, where appropriate, proceed to classify it in the corresponding risk stage.
Likewise, the indications provided by the European Banking Authority (EBA) have been taken into account, to not consider as refinancing the moratoriums that meet a series of requirements, without prejudice to keep the exposure classified in the corresponding risk stage or its consideration as refinancing if it was previously so classified.
In relation to the temporary payment deferrals for customers affected by the pandemic, since the beginning BBVA worked on an anticipation plan with the goal of mitigating as much as possible the impact of these measures in the Group, due to the high concentration of its maturities over time. As of September 30, 2021, the payment deferrals granted by the Group following EBA criteria amounted to €1,036m.
Calculation of expected losses due to credit risk
To respond to the circumstances generated by the COVID-19 pandemic in the macroeconomic environment, characterized by a high level of uncertainty regarding its intensity, duration and speed of recovery, forward-looking information has been updated in the IFRS 9 models to incorporate the best information available at the date of the publication of this report. The estimation of the expected losses has been calculated for the different geographical areas in which the Group operates, with the best information available for each of them, considering both the macroeconomic perspectives and the effects on specific portfolios, sectors or specific debtors. The scenarios used consider the various economic measures that have been announced by governments as well as monetary, supervisory and macroprudential authorities around the world. However, the final magnitude of the impact of this pandemic on the Group's business, financial situation and results, which could be material, will depend on future and uncertain events, including the intensity and persistence over time of the consequences derived from the pandemic in the different geographical areas in which the Group operates.
The expected losses calculated according to the methodology provided by the Group, including macroeconomic projections, have been supplemented with quantitative management adjustments in order to include issues that might imply a potential impairment which, due to its nature, is not included in the model, which will be assigned to specific operations in case this impairment materializes (e.g, sectors and collectives more affected by the crisis).
The classification of vulnerable activities to COVID-19 was established at the outbreak of the pandemic, in order to identify activities susceptible to further deterioration in the Group’s portfolio. Based on this classification, management measures were taken, with preventive rating adjustments and restrictive definition of risk appetite. Given the progress made during the course of the pandemic, which has led to the almost complete elimination of restrictions on mobility and the subsequent recovery from these restrictions, consideration is now being given to the specific characteristics of each client over and above their belonging to a particular sector. Therefore, maintaining this vulnerability classification is not considered necessary due to its low level of discrimination.
As of September 30, 2021, in order to incorporate those aspects not included in the impairment models, there are management adjustments to the expected losses amounting to €304m for the entire Group, €272m in Spain and €32m in Peru. As of June 30, 2021 this concept amounted to €348m in total, of which €315m were allocated to Spain and €32m to Peru. The variation in the quarter is therefore due to the use in Spain of €43m while the amount assigned to Peru remains unused.
20

BBVA Group's credit risk indicators
BBVA Group's main risk indicators have behaved as follows between January and September 2021, as a result, among other reasons, of the situation generated by the pandemic:
• Credit risk has increased by 0.4% (+0.4% at constant exchange rates). There was a slight increase at Group level in the quarter at constant rates, with Turkey leading growth along with Rest of Business. Spain recorded a slight decline while Mexico and South America remained practically flat, the latter with increases in almost all countries in the region. Compared to December, credit risk increased by 1.3% (+2.0% at constant exchange rates) with generalized growth except for Chile and Peru.
• The balance of non-performing loans decreased in the third quarter of the year (-5.2% both in current and constant terms) in the main geographical areas. Compared to the end of 2020, the balance decreased by 3.8% (-2.8% at constant exchange rates) overall due to the good performance of underlying flows, with controlled inflows and positive recoveries, in a more favorable economic environment than in previous quarters.
NON-PERFORMING LOANS(1) AND PROVISIONS(1) (MILLIONS OF EUROS)
Non-performing loans Provisions-3.8 % -5.6 %
15,006 15,451 14,864
Sep.20 Dec.20 Sep.21
12,731 12,595 11,895
Sep.20 Dec.20 Sep.21(1) Excludes BBVA USA and the rest of Group's companies in the United States sold to PNC on June 1, 2021.
• The NPL ratio stood at 4.0% as of September 2021 (4.2% in June, 2021), 21 basis points below the figure recorded in December 2020.
• Loan-loss provisions decreased by 5.6% compared to December 2020 (-1.1% in the quarter) due to the positive evolution of the non-performing loans and an increase in write-offs during the year.
• The NPL coverage ratio amounted to 80%, -149 basis points compared to the end of 2020. Compared to the previous quarter, the NPL ratio improved by 327 basis points as a result of the aforementioned good performance of the non-performing loans in the period.
• The cumulative cost of risk as of September 30, 2021 stood at 0.92% (-64 basis points below the end of 2020 and -9 basis points compared to June 2021). The loan-loss provisions carried out in the quarter were practically in line with those observed in the previous quarter, and were reflected in September in addition to the recurring flows of the month and the positive impact of the updated macroeconomic scenarios, partially mitigated by the effect of the annual recalibration on the Group’s provisioning models.
NPL(1) AND NPL COVERAGE(1) RATIOS AND COST OF RISK(1) (PERCENTAGE)
85% 82% 81% 77% 80%
4.1% 4.2% 4.3% 4.2% 4.0%
1.68% 1.55% 1.17% 1.00% 0.92%
NPL coverage
NPL
Cost of risk
Sep.20 Dec.20 Mar.21 Jun.21 Sep.21
(1) Excluding BBVA USA and the rest of the Group's companies in the United States sold to PNC on June 1, 2021.
21

CREDIT RISK(1) (MILLIONS OF EUROS)
30-09-21 30-06-21 31-03-21 31-12-20 30-09-20Credit risk 371,708 370,348 365,292 366,883 365,127
Non-performing loans 14,864 15,676 15,613 15,451 15,006
Provisions 11,895 12,033 12,612 12,595 12,731
NPL ratio (%) 4.0 4.2 4.3 4.2 4.1
NPL coverage ratio (%) (2) 80 77 81 82 85General note: figures excluding BBVA USA and the rest of Group's companies in the United States sold to PNC on June 1, 2021, for the periods of 2021 and 2020, and the classification of BBVA Paraguay as non-current assets and liabilities held for sale for the periods of 2020.
(1) Includes gross loans and advances to customers plus guarantees given.
(2) The NPL coverage ratio includes the valuation adjustments for credit risk during the expected residual life of those financial instruments which have been acquired (mainly originated from the acquisition of Catalunya Banc, S.A.). Excluding these allowances, the NPL coverage ratio would stand at 78% as of September 30, 2021, 79% as of December 31, 2020 and 82% as of September 30, 2020.
NON-PERFORMING LOANS EVOLUTION (MILLIONS OF EUROS)
3Q21 (1) 2Q21 1Q21 4Q20 3Q20
Beginning balance 15,676 15,613 15,451 15,006 15,594
Entries 1,445 2,321 1,915 2,579 1,540
Recoveries (1,330) (1,065) (921) (1,016) (1,028)
Net variation 115 1,256 994 1,563 512
Write-offs (848) (1,138) (796) (1,149) (510)
Exchange rate differences and other (80) (55) (36) 31 (590)
Period-end balance 14,864 15,676 15,613 15,451 15,006
Memorandum item:Non-performing loans 14,226 15,013 14,933 14,709 14,269
Non performing guarantees given 637 663 681 743 737General note: figures excluding BBVA USA and the rest of Group's companies in the United States sold to PNC on June 1, 2021, for the periods of 2021 and 2020, and the classification of BBVA Paraguay as non-current assets and liabilities held for sale for the periods of 2020.
(1) Preliminary data.
Structural risks
Liquidity and funding
Liquidity and funding management at BBVA aims to finance the recurring growth of the banking business at suitable maturities and costs, using a wide range of instruments that provide access to a large number of alternative sources of financing. In this context, it is important to notice that, given the nature of BBVA's business, the funding of lending activity is fundamentally carried out through the use of stable customer funds.
Due to its subsidiary-based management model, BBVA is one of the few major European banks that follows the Multiple Point of Entry (MPE) resolution strategy: the parent company sets the liquidity policies, but the subsidiaries are self-sufficient and responsible for managing their own liquidity and funding (taking deposits or accessing the market with their own rating), without fund transfers or financing occurring between either the parent company and the subsidiaries or between the different subsidiaries. This strategy limits the spread of a liquidity crisis among the Group's different areas, and ensures that the cost of liquidity and financing is correctly reflected in the price formation process.
In view of the initial uncertainty caused by the outbreak of COVID-19 in March 2020, the different central banks provided a joint response through specific measures and programs, whose extensions, in some cases, has been extended during 2021 to facilitate the financing of the real economy and the provision of liquidity in the financial markets, increasing liquidity buffers in almost all geographical areas.
The BBVA Group maintains a solid liquidity position in every geographical area in which it operates, with liquidity ratios well above the minimum required:
• The BBVA Group's liquidity coverage ratio (LCR) remained comfortably above 100% throughout the first nine months of 2021, and stood at 170% as of September 30, 2021. For the calculation of this ratio, it is assumed that there is no transfer of liquidity among subsidiaries; i.e. no type of excess liquidity levels in foreign subsidiaries are considered in the calculation of the consolidated ratio. When considering these excess liquidity levels, the BBVA Group's LCR would stand at 209%.
• The net stable funding ratio (NSFR), defined as the ratio between the amount of stable funding available and the amount of stable funding required, demands banks to maintain a stable funding profile in relation to the composition of their assets and off-balance sheet activities. This ratio should be at least 100% at all times. The BBVA Group's NSFR ratio, calculated based on the criteria established in the Regulation (UE) 2019/876 of the European Parliament and the European Council, as of May 20, 2019; whose date of entry into force is June 2021, stood at 135% as of September 30, 2021.
22

The breakdown of these ratios in the main geographical areas in which the Group operates is shown below:
LCR AND NSFR RATIOS (PERCENTAGE. 30-09-21)Eurozone (1) Mexico Turkey South America
LCR 197 219 169 All countries >100
NSFR 126 143 158 All countries >100(1) Perimeter: Spain + the rest of the Eurozone where BBVA has presence.
One of the key elements in BBVA's Group liquidity and funding management is the maintenance of large high quality liquidity buffers in all business areas where the group operates. In this respect, the Group has maintained for the last 12 months an average volume of high quality liquid assets (HQLA) accounting to €143.5 billion, among which, 94% correspond to maximum quality assets (LCR Tier 1).
The most relevant aspects related to the main geographical areas are the following:
• In the Eurozone, BBVA has continued to maintain a sound position with a large high-quality liquidity buffer. During the first nine months of 2021, commercial activity has drawdown liquidity amounting to approximately €7 billion mainly explained by outflows during the first quarter of wholesale deposits that held very high balances at the end of December 2020. It should be noted that in the second quarter of 2021, the payment of the BBVA USA sale transaction was collected. In March 2021, BBVA S.A. took part in the TLTRO III liquidity window program to take advantage of the improved conditions announced by the European Central Bank (ECB) in December 2020, with an amount drawn of €3.5 billion, which when added together with the €34.9 billion available at the end of December 2020 it totaled €38.4 billion. In this regard, the ECB continues to support liquidity in the system through the measures it has implemented since the start of the pandemic, but it should be noted that it announced a slight slowdown in the pace of asset purchases under its PEPP program (Pandemic Emergency Purchase Programme) during the fourth quarter of 2021.
• In BBVA Mexico, commercial activity has provided liquidity between January and September 2021 in the amount of approximately 25 billion Mexican pesos, derived from a higher growth in customer funds compared with the increase in lending activity. This increased liquidity is expected to be reduced due to the recovery in lending activity, favored by the better growth trend in the country. This solid liquidity position is enabling an efficiency policy in the funding costs, in an environment of higher interest rates. Looking at wholesale issuances, a senior issue amounting to 3,500 million Mexican pesos was absorbed in September without needing to be refinanced, as it also happened with the subordinated issue amounting to USD 750m which was absorbed in March, 2021 and a senior issue amounting to 1,000 million Mexican pesos which was absorbed in April.
• The Central Bank of the Republic of Turkey (CBRT) lowered 100 basis points in September, leaving the benchmark rate at 18%, based on a reduction in core inflation. During the first nine months of 2021, the Bank's lending gap has widened in local currency, with a higher increase in loans than in deposits. Regarding foreign currency, both loans and deposits have decreased by a similar amount. Garanti BBVA continues to maintain a comfortable liquidity position.
• In South America, the liquidity situation remains adequate throughout the region, helped by the support of various central banks and governments which, in order to mitigate the impact of the COVID-19 crisis, have acted by implementing measures to stimulate economic activity and provide greater liquidity in financial systems. In Argentina, liquidity in the system continues to increase due to higher growth in deposits than in loans in local currency. A comfortable liquidity position has been maintained in Colombia following the adjustment for excess liquidity made in the last quarters. Despite a more stable political environment, Fitch downgraded the country's rating at the beginning of the quarter. BBVA Peru maintains solid levels of liquidity, despite the current uncertain environment, which has been reflected in a downgrading of Moody's rating. During the last quarter there has been an improvement in credit gap, especially in local currency.
The main transactions carried out in wholesale financing markets by the companies that form part of the BBVA Group during the first nine months of 2021 were:
• On September 1, 2021, BBVA S.A. issued a social preferred senior debt totaling €1 billion with a floating rate and a 2-year expiration date. This is the second issue made in 2021, following the issuance of senior preferred debt carried out in March, and is also the fifth issuance carried out by BBVA, meeting environmental, social and governance criteria (ESG). For more information on the transactions see the "Solvency" chapter in this report.
• In Turkey, there have been no issuances between January and September 2021. On June 2, BBVA Garanti renewed the 100% of a syndicated loan indexed to sustainability criteria, formed by two separate sections, amounting to USD 279m and €294m with a 1-year expiration date. Another €560m syndicated loan expires in November and is expected to be renewed.
• In South America, BBVA Uruguay issued the first sustainable bond on the Uruguayan financial market in February for USD 15m at an initial interest rate of 3.854%.
23

Foreign exchange
Foreign exchange risk management of BBVA's long-term investments, principally stemming from its overseas franchises, aims to preserve the Group's capital adequacy ratio and ensure the stability of its income statement.
The U.S. dollar accumulated a 6.0% appreciation against the euro in the first nine months of 2021, thus reversing a large part of the depreciation which occurred last year. Among the emerging currencies, it is worth highlighting the good performance of the Mexican peso, which registered an appreciation of 2.8% against the euro since the end of 2020. The Turkish lira, which remained stable in the third quarter, accumulated a -11.5% depreciation against the euro in the first nine months of 2021. Political uncertainties have weighed down some South American currencies: Peruvian sol (-7.0%), Chilean peso (-6.2%) and Colombian peso (-5.1%). For its part, Argentine peso (-9.7%) continues with a moderate depreciation compared to previous years.
EXCHANGE RATES (EXPRESSED IN CURRENCY/EURO)
Year-end exchange rates Average exchange rates∆ % on ∆ % on ∆ % on
30-09-21 30-09-20 31-12-20 Jan.-Sep.21 Jan.-Sep.20U.S. dollar 1.1579 1.1 6.0 1.1961 (6.0)
Mexican peso 23.7439 10.3 2.8 24.0762 1.9
Turkish lira 10.2981 (11.6) (11.5) 9.7098 (21.8)
Peruvian sol 4.7824 (11.9) (7.0) 4.5826 (15.1)
Argentine peso (1) 114.29 (22.0) (9.7) — —
Chilean peso 930.48 (1.3) (6.2) 881.98 2.2
Colombian peso 4,440.18 2.3 (5.1) 4,424.44 (5.8)(1) According to IAS 29 "Financial information in hyperinflationary economies", the year-end exchange rate is used for the conversion of the Argentina income statement.
BBVA has maintained its policy of actively hedging its main investments in emerging markets, covering on average between 30% and 50% of annual earnings and around 70% of the CET1 capital ratio surplus. The closing of the sale of BBVA USA in June 2021 has modified the Group's CET1 fully-loaded ratio sensitivity to changes in the currencies. The most affected sensitivity by this change has been the U.S. dollar, which stands at around +18 basis points in the face of a 10% depreciation in the currency. The sensitivity of the Mexican peso is estimated at -5 basis points at the end of September 2021 and practically nil in the case of the Turkish lira, both currencies estimated against a depreciation of 10%. With regard to coverage levels of the expected results for 2021, these have remained stable this last quarter: 75% in Mexico and Turkey, and close to 100% in Peru and Colombia.
Interest rate
Interest rate risk management seeks to limit the impact that BBVA may suffer, both in terms of net interest income (short-term) and economic value (long-term), from adverse movements in the interest rate curves in the various currencies in which the Group operates. BBVA carries out this work through an internal procedure, pursuant to the guidelines established by the European Banking Authority (EBA), in order to analyze the potential impact that could derive from a range of scenarios on the Group's different balance sheets.
The model is based on assumptions intended to realistically mimic the behavior of the balance sheet. Of particular relevance are assumptions regarding the behavior of accounts with no explicit maturity and prepayment estimates. These assumptions are reviewed and adapted at least once a year to take into account any changes in behavior.
At the aggregate level, BBVA continues to maintain a moderate risk profile, in accordance with the established objective, showing positive sensitivity toward interest rate increases in the net interest income. The effective management of structural balance sheet risk has allowed it to mitigate the negative impact of the downward trend in interest rates and the volatility experienced as a result of the effects of COVID-19, and is reflected in the soundness and recurrence of net interest income.
At the market level, during the third quarter of 2021, there have been limited movements in the United States and European bond yield curves, generating a "U" movement, with rises starting in August due to the messages of the beginning of a gradual decrease in the extraordinary measures of expansionary monetary policy by both central banks. With regard to the emerging world, more virulent moves in bond yield curves due to the contagion effect of the latest rises in the U.S. yield curves, inflationary pressures and the continuation of the rate hike cycle (with the exception of Turkey, which dropped 100 basis points at September meeting). All of the above has had a limited impact on the generation of net interest income for the different units.
By area, the main features are:
• Spain has a balance sheet characterized by a high proportion of variable-rate loans (basically mortgages and corporate lending) and liabilities composed mainly of customer deposits. The ALCO portfolio acts as a management lever and hedging for the bank's balance sheet, mitigating its sensitivity to interest rate fluctuations. The balance sheet´s profile has remained stable during the year, showing an interest net income sensitivity to 100 basis points increases by the interest rates around 20%.
On the other hand, the ECB held the marginal deposit facility rate unchanged at -0.50% and maintained the extraordinary support programs created after the outbreak of the COVID-19 crisis. This has created stability in European benchmark interest rates (Euribor) throughout the first nine months of 2021. In this matter, customer spread keeps pressured by the low interest rates environment.
24

• Mexico continues to show a balance between fixed and variable interest rates balances. In terms of assets that are most sensitive to interest rate fluctuations, the commercial portfolio stands out, while consumer loans and mortgages are mostly at a fixed rate. The ALCO portfolio is used to neutralize the longer duration of customer deposits. Net interest income sensitivity continues to be limited, registering a positive impact against 100 basis points increases in the Mexican peso which is around 2%. The monetary policy rate stands at 4.75%, higher that at the end of 2020 (4.25%), after a 25 basis points reduction during the first quarter of 2021 and a 25 basis points increase in June, August and September meetings. Regarding the consumer spread, a slight increase compared to first nine months of 2021 is appreciated, a trend which should continue due to the high interest rates environment.
• In Turkey, the sensitivity of loans, which are mostly fixed-rate but with relatively short maturities, and the ALCO portfolio balance the sensitivity of deposits on the liability side. The interest rate risk is thus limited, both in Turkish lira and in foreign currencies. With regard to base rates, there was an increase of 200 basis points in the first quarter compared to the level seen in December 2020; during the second quarter the base rates remained unchanged and in the third quarter there was a reduction of 100 basis points. The customer spread in Turkish lira improved from June onwards, benefiting from the refinancing of loans at higher rates. It is expected that it will continue to improve in an environment of lower interest rates.
• In South America, the risk profile for interest rates remains low as most countries in the area have a fixed/variable composition and maturities that are very similar for assets and liabilities, with a low net interest income sensitivity. In addition, in balance sheets with several currencies, interest-rate risk is managed for each of the currencies, showing a very low level of risk. Regarding the base rates of the central banks in Peru and Colombia, a rising trend in rates has begun, with increases in the last quarter of 75 and 25 basis points, respectively. In the first nine moths of 2021 there has been little change in customer spreads, which are expected to improve in an environment of higher interest rates.
INTEREST RATES (PERCENTAGE)
30-09-21 30-06-21 31-03-21 31-12-20 30-09-20 30-06-20 31-03-20Official ECB rate 0.00 0.00 0.00 0.00 0.00 0.00 0.00
Euribor 3 months (1) (0.55) (0.54) (0.54) (0.54) (0.49) (0.38) (0.42)
Euribor 1 year (1) (0.49) (0.48) (0.49) (0.50) (0.41) (0.15) (0.27)
USA Federal rates 0.25 0.25 0.25 0.25 0.25 0.25 0.25
TIIE (Mexico) 4.75 4.25 4.00 4.25 4.25 5.00 6.50
CBRT (Turkey) 18.00 19.00 19.00 17.00 10.25 8.25 9.75(1) Calculated as the month average.
25

Business areasThis section presents and analyzes the most relevant aspects of the Group's different business areas. Specifically, for each one of them, it shows a summary of the income statement and balance sheet, the business activity figures and the most significant ratios.
The structure of the business areas reported by the BBVA Group as of September 30, 2021, differs from the one presented at the end of 2020, mainly as a consequence of the removal of the United States as a business area, derived from the sale agreement reached with PNC and closed on June 1, 2021, once the pertinent mandatory authorizations were obtained. BBVA continues to have a presence in the United States, mainly through the wholesale business which the Group develops in the New York branch and its broker dealer BBVA Securities Inc.
The composition of BBVA Group business areas is summarized below:
• Spain mainly includes the banking and insurance businesses that the Group carries out in this country, including the share of the results of the new company created from the bancassurance agreement reached with Allianz at the end of 2020.
• Mexico includes banking and insurance businesses in this country, as well as the activity that BBVA Mexico carries out through its branch in Houston.
• Turkey reports the activity of the group Garanti BBVA that is mainly carried out in this country and, to a lesser extent, in Romania and the Netherlands.
• South America mainly includes banking and insurance activity conducted in the region. The information for this business area includes BBVA Paraguay data for the results, activity, balances and relevant business indicators for 2020 and is not included in 2021 as the sale agreement was reached in January 2021.
• Rest of Business mainly incorporates the wholesale activity carried out in Europe (excluding Spain) and in the United States, as well as the banking business developed through BBVA’s 5 branches in Asia.
The Corporate Center contains the centralized functions of the Group, including: the costs of the head offices with a corporate function; structural exchange rate positions management, portfolios whose management is not linked to customer relations, such as financial and industrial holdings, stakes in Funds & Investment Vehicles in tech companies including the venture capital fund Propel Venture Partners; certain tax assets and liabilities; funds due to commitments to employees; goodwill and other intangible assets as well as such portfolios and assets´ funding. Additionally, the results obtained by BBVA USA and the rest of the companies included in the sale agreement to PNC until the closing of the transaction on June 1, 2021, are presented in a single line of the income statements called “Profit (loss) after taxes from discontinued operations”. Finally, the costs related to the BBVA S.A. restructuring process in Spain, being considered such process an strategic decision, are included in this aggregate and are recognized in the line "Net cost related to the restructuring process".
In addition to these geographical breakdowns, supplementary information is provided for the wholesale business carried out by BBVA, Corporate & Investment Banking (CIB), in the countries where it operates. This business is relevant to have a broader understanding of the Group's activity and results due to the important features of the type of customers served, products offered and risks assumed.
The information by business area is based on units at the lowest level and/or companies that comprise the Group, which are assigned to the different areas according to the main region or company group in which they carry out their activity. The figures corresponding to 2020 have been elaborated following the same criteria and the same structure of the areas previously explained, in a way that year-on-year comparisons are homogeneous.
Regarding the shareholders' funds allocation, a capital allocation system based on the consumed regulatory capital is used.
Finally it should be noted that, as usual, in the case of the different business areas in America, Turkey, Rest of Business and CIB, apart from including the year-on-year variations applying current exchange rates, the ones at constant exchange rates are also given.
26

MAIN INCOME STATEMENT LINE ITEMS BY BUSINESS AREA (MILLIONS OF EUROS)
Business areas
BBVA Group Spain Mexico Turkey South
AmericaRest of
Business∑ Business
areasCorporate
Center
Jan.-Sep.21Net interest income 10,708 2,635 4,280 1,651 2,061 209 10,836 (128)Gross income 15,589 4,550 5,558 2,414 2,294 568 15,384 206Operating income 8,613 2,305 3,609 1,680 1,220 243 9,057 (444)Profit/(loss) before tax 6,182 1,662 2,551 1,504 665 259 6,641 (459)Net attributable profit or (loss) excluding non-recurring impacts (1) 3,727 1,223 1,811 583 339 205 4,161 (433)
Jan.-Sep.20Net interest income 11,115 2,686 4,036 2,218 2,069 220 11,230 (115)Gross income 15,620 4,393 5,237 2,866 2,441 650 15,587 33Operating income 8,796 2,110 3,491 2,075 1,397 309 9,382 (586)Profit/(loss) before tax 3,652 605 1,694 1,325 647 198 4,470 (817)Net attributable profit or (loss) excluding non-recurring impacts (1) 2,016 469 1,206 503 326 157 2,660 (644)
(1) Non-recurring impacts include: (I) profit/(loss) after tax from discontinued operations until its sale on June 1, 2021 for the period Jan.-Sep.21 and those generated during the first nine months of 2020 for the period Jan.-Sep.20 ; and (II) the net costs related to the restructuring process for the period Jan.-Sep.21.
GROSS INCOME (1), OPERATING INCOME (1) AND NET ATTRIBUTABLE PROFIT (1) BREAKDOWN (PERCENTAGE. JAN.-SEP. 21)
Gross income Operating income Net attributable profit
29.6
36.1
15.7
14.93.7
Spain
Mexico
Turkey
South America
Rest of Business
25.5
39.8
18.5
13.52.7
29.4
43.5
14.0
8.14.9
(1) Excludes the Corporate Center.
MAIN BALANCE-SHEET ITEMS AND RISK-WEIGHTED ASSETS BY BUSINESS AREA (MILLIONS OF EUROS)Business areas
BBVA Group Spain Mexico Turkey South
AmericaRest of
businesses∑ Business
areasCorporate
Center Deletions NCA&L (1)
30-09-21
Loans and advances to customers
316,499 168,408 53,014 38,933 32,422 24,995 317,771 170 (1,442) —
Deposits from customers 340,828 200,222 58,440 41,282 35,458 7,341 342,743 180 (2,095) —
Off-balance sheet funds 111,615 67,119 24,947 4,565 14,418 567 111,615 0 — —
Total assets/liabilities and equity
651,834 400,849 113,955 61,549 54,139 35,933 666,425 31,119 (45,710) —
RWAs 303,007 108,921 61,162 55,233 40,849 27,193 293,358 9,649 — —
31-12-20
Loans and advances to customers
311,147 167,998 50,002 37,295 33,615 24,015 312,926 505 (1,299) (985)
Deposits from customers 342,661 206,428 54,052 39,353 36,874 9,333 346,040 363 (2,449) (1,293)
Off-balance sheet funds 102,947 62,707 22,524 3,425 13,722 569 102,947 — — —
Total assets/liabilities and equity
736,176 410,409 110,236 59,585 55,436 35,172 670,839 105,416 (40,080) —
RWAs 353,273 104,388 60,825 53,021 39,804 24,331 282,370 70,903 — —
(1) Non-current assets and liabilities held for sale (NCA&L) from BBVA Paraguay as of 31-12-20.
27

BBVA Group, as of September 30, 2021, had 113,117 employees, 6,344 branches and 28,920 ATMs, a decrease of 8.2%, 14.6% and 6.7%, respectively, compared to the end of December 2020. The decrease was mainly due to the withdrawal of BBVA USA and the rest of the Group's companies in the United States following its sale on June 1, 2021, as well as the beginning of the employee departures and branch closures as a result of the restructuring plan of BBVA S.A. in Spain.
With regard to the number of employees in Mexico, there has been an increase, explained by the internalization of employees whose tasks are directly linked to the Bank's activity, in the context of the recent labor reform in the country.
NUMBER OF EMPLOYEES
124,110 123,174113,117
1,134 1,129 1,28923,453 23,059 22,607
21,964 21,908 21,651
37,217 36,853 40,183
10,867 10,895
29,475 29,33027,387
Spain
The United States
Mexico
Turkey
South America
Rest
Sep.20 Dec.20 Sep.21
NUMBER OF ATMS
31,037 31,00028,920
23 23 235,536 5,403 5,179
5,440 5,533 5,535
12,923 12,950 13,139
1,369 1,383
5,746 5,7085,044Spain
The United States
Mexico
Turkey
South America
Rest
Sep.20 Dec.20 Sep.21
NUMBER OF BRANCHES
7,565 7,432
6,344
30 30 321,533 1,514 1,453
1,028 1,021 1,007
1,814 1,746 1,746
639 639
2,521 2,482
2,106
Spain
The United States
Mexico
Turkey
South America
Rest
Sep.20 Dec.20 Sep.21
28

Spain
Highlights
• Slight growth in lending activity throughout the year
• Improvement in the efficiency ratio
• Favorable year-on-year growth of recurring revenue due to the evolution of fees
• Decrease in impairment on financial assets, compared to a 2020 that was strongly affected by the pandemic, resulting in an improvement in the cost of risk
BUSINESS ACTIVITY(1) (YEAR-TO-DATE CHANGE)
+0.2%
-0.7%
Performing loans andadvances to customers
under management
Customer funds undermanagement
(1) Excluding repos.
NET INTEREST INCOME/ATAS (PERCENTAGE)
0.85 0.860.89
0.910.87
3Q20 4Q20 1Q21 2Q21 3Q21
.
OPERATING INCOME (MILLIONS OF EUROS)
+9.2 %
2,110 2,305
731645
734
418
893
665748
1Q20 2Q20 3Q20 4Q20 1Q21 2Q21 3Q21
NET ATTRIBUTABLE PROFIT (MILLIONS OF EUROS)
+160.9 %
469 1,223
-130
238
361
183
381 364
478
1Q20 2Q20 3Q20 4Q20 1Q21 2Q21 3Q21
29

FINANCIAL STATEMENTS AND RELEVANT BUSINESS INDICATORS (MILLIONS OF EUROS AND PERCENTAGE)
Income statement Jan.-Sep.21 ∆ % Jan.-Sep.20Net interest income 2,635 (1.9) 2,686Net fees and commissions 1,592 18.0 1,349Net trading income 305 40.7 217Other operating income and expenses 19 (86.9) 141
Of which: Insurance activities (1) 268 (26.1) 362Gross income 4,550 3.6 4,393Operating expenses (2,245) (1.7) (2,283)
Personnel expenses (1,280) (0.8) (1,291)
Other administrative expenses (638) (1.2) (646)
Depreciation (326) (5.7) (346)Operating income 2,305 9.2 2,110Impairment on financial assets not measured at fair value through profit or loss (402) (62.6) (1,075)
Provisions or reversal of provisions and other results (242) (43.7) (430)Profit/(loss) before tax 1,662 174.5 605Income tax (437) 226.1 (134)Profit/(loss) for the period 1,225 159.9 471Non-controlling interests (2) (23.0) (2)
Net attributable profit/(loss) 1,223 160.9 469(1) Includes premiums received net of estimated technical insurance reserves.
Balance sheets 30-09-21 ∆ % 31-12-20Cash, cash balances at central banks and other demand deposits 23,138 (39.7) 38,356
Financial assets designated at fair value 141,522 2.6 137,969Of which: Loans and advances 37,440 22.0 30,680
Financial assets at amortized cost 197,527 (0.3) 198,173 Of which: Loans and advances to customers 168,408 0.2 167,998Inter-area positions 30,098 13.7 26,475
Tangible assets 2,458 (15.3) 2,902
Other assets 6,105 (6.6) 6,535
Total assets/liabilities and equity 400,849 (2.3) 410,409Financial liabilities held for trading and designated at fair value through profit or loss 72,655 (1.7) 73,921
Deposits from central banks and credit institutions 58,351 (0.7) 58,783
Deposits from customers 200,222 (3.0) 206,428
Debt certificates 37,605 (8.3) 41,016
Inter-area positions — — —
Other liabilities 18,496 9.1 16,955
Regulatory capital allocated 13,520 1.6 13,306
Relevant business indicators 30-09-21 ∆ % 31-12-20Performing loans and advances to customers under management (1) 165,889 0.2 165,511
Non-performing loans 8,022 (3.8) 8,340
Customer deposits under management (1) 199,600 (3.0) 205,809
Off-balance sheet funds (2) 67,119 7.0 62,707
Risk-weighted assets 108,921 4.3 104,388
Efficiency ratio (%) 49.3 54.6
NPL ratio (%) 4.1 4.3
NPL coverage ratio (%) 65 67
Cost of risk (%) 0.32 0.67(1) Excluding repos.(2) Includes mutual funds and pension funds.
30

Macro and industry trends
The economy continues to recover against a backdrop in which the vaccine rollout has resulted in fewer infections and an easing of restrictions on mobility. Growth in the second quarter (1.1% quarterly) was lower than initially forecasted by BBVA Research, thus contributing to a downward revision of its growth forecast for 2021 from 6.5% to 5.2%. Europe is also experiencing a recovery, meaning that the ECB will reduce asset purchases under the PEPP program. Inflation continues to accelerate, as in other neighboring countries (in August, it stood at 3.3%, higher than forecasted by BBVA Research), driven mainly by energy.
With regard to the banking system, with data as of the end of July 2021, the volume of lending to the private sector recorded a slight decline of 0.3% since December 2020, following growth of 2.6% in 2020. The NPL ratio continued to decline to 4.39%, also at the end of July 2021 (4.51% at 2020 year-end). Therefore, the system maintained comfortable levels of capital adequacy and liquidity.
Activity
The most relevant aspects related to the area's activity during the first nine months of 2021 were:
• Lending activity (performing loans under management) was slightly higher than at the end of 2020 (+0.2%) mainly due to growth in loans to SMEs (+6.2%) and consumer loans (+6.3% including credit cards),
• With regard to asset quality, the non-performing loan ratio decreased by 8 basis points in the quarter to stand at 4.1%, mainly due to the positive evolution of the underlying flows, and specially to the recovery of certain wholesale customers, contributing to an increase in the average coverage up to 65% as of September 30, 2021.
• Total customer funds remained stable (-0.7%) compared to 2020 year-end, thanks to the good performance of off-balance sheet funds (+7.0%), which partially offset the decrease in customer deposits under management (-3.0%) due to the lower balance of time deposits held by retail clients in a low interest rate environment.
The most relevant aspects related to the area's activity in the third quarter of 2021 were:
• Lending activity (performing loans under management) was slightly down from the previous quarter (-0.8%), mainly due to the decrease in lending to the public sector (-11.9%), which was partially offset by growth in the SME segments (+1.8%) and in consumer finance and credit cards (+1.6 %).
• Total customer funds remained stable throughout the quarter (+0.3%), thanks to growth of demand deposits (+1.6%) and off-balance sheet funds (+1.1%), which offset the decrease in time deposits (-11.7%).
Results
Spain generated a net attributable profit of €1,223m during the first nine months of 2021, up +160.9% from the result posted in the same period of the previous year, mainly due to the increased provisions for impairment on financial assets as a result of the COVID-19 outbreak and provisions made in both cases in 2020, as well as the increased contribution from commission fees and NTI in 2021.
The most notable aspects of the year-on-year changes in the area's income statement at the end of September 2021 were:
• Net interest income continues to decrease compared to the same period last year, although at a slower rate (-1.9% compared to -2.2% year-on-year at the end of June 2021), affected by the context of falling interest rates and partially offset by lower financing costs.
• Net fees and commissions continued to show positive performance (+18.0% year-on-year), mainly favored by a greater contribution from revenues associated with asset management activities and the contribution of banking and insurance services, in the latter case, by the bancassurance operation with Allianz.
• NTI at the end of September 2021 continued to show significant year-on-year growth of 40.7%, mainly due to the results of the Global Markets unit.
• The other operating income and expenses line performed poorly compared to the first nine months of the previous year (€19m accumulated at the end of September 2021 compared to €141m accumulated at the end of September 2020), mainly due to the greater contribution to the Single Resolution Fund (SRF) and the lower contribution from the insurance business in this line due to the bancassurance operation with Allianz.
• Operating expenses were down (-1.7% in year-on-year terms) as a result of the reduction in both the depreciation line, personnel expenses and general expenses.
• As a result of the growth in gross income and the aforementioned reduction in expenditure, the efficiency ratio stood at 49.3%, compared to 52.0% recorded at the end of September 2020.
• Impairment on financial assets totaled €-402m, a significant reduction from the amount recorded in the first nine months of 2020, mainly due to the negative impact of the worsening macroeconomic scenario caused by the pandemic following the outbreak of COVID-19 in March 2020, as well as the improvement of said scenario in 2021. For its part, the accumulated cost of risk remained on a downward trend and stood at 0.32% as of September 30, 2021.
• The provisions and other results line closed at €-242m, which was well below the €-430m recorded in the same period last year, which included provisions for potential claims.
In the third quarter of 2021, Spain generated a net attributable profit of €478m (+31.2% compared to the previous quarter). Performance has mainly been favored by the contribution to the SRF made in the second quarter of 2021 and the lower loan allowance for impairment on financial assets, which have largely offset the decrease in recurring income, affected by summer season, and the lower NTI, due to the lower results of the Global Markets unit between July and September.
31

Mexico
Highlights
• Growth in lending activity in the first nine months of the year driven by the acceleration in the retail portfolio
• Good performance of customer funds continues, as a result of growing demand deposits, which allows for an improvement in the funding mix of BBVA Mexico
• Increase in recurring income and strength of operating income
• Decrease in impairment on financial assets, compared to the first nine months of 2020, which were strongly affected by the pandemic
BUSINESS ACTIVITY(1) (YEAR-TO-DATE CHANGE AT CONSTANT EXCHANGE RATES)
+3.1%
+5.6%
Performing loans andadvances to customers
under management
Customer funds undermanagement
(1) Excluding repos.
NET INTEREST INCOME/ATAS (PERCENTAGE. CONSTANT EXCHANGE RATE)
5.01
4.68
4.99 4.985.18
3Q20 4Q20 1Q21 2Q21 3Q21
.
OPERATING INCOME (MILLIONS OF EUROS AT CONSTANT EXCHANGE RATE)
+1.4 % (1)
3,558 3,609
1,2211,110
1,227 1,210 1,160 1,201 1,248
1Q20 2Q20 3Q20 4Q20 1Q21 2Q21 3Q21
(1) At current exchange rate: +3.4%
NET ATTRIBUTABLE PROFIT (MILLIONS OF EUROS AT CONSTANT EXCHANGE RATE)
+47.4 % (1)
1,229 1,811
342 308
579 565502
636673
1Q20 2Q20 3Q20 4Q20 1Q21 2Q21 3Q21
(1) At current exchange rate: +50.2%
32

FINANCIAL STATEMENTS AND RELEVANT BUSINESS INDICATORS (MILLIONS OF EUROS AND PERCENTAGE)
Income statement Jan.-Sep.21 ∆ % ∆ % (1) Jan.-Sep.20Net interest income 4,280 6.0 4.1 4,036Net fees and commissions 898 17.7 15.5 763Net trading income 253 (23.4) (24.8) 330Other operating income and expenses 127 17.9 15.6 107
Gross income 5,558 6.1 4.1 5,237Operating expenses (1,948) 11.6 9.5 (1,745)
Personnel expenses (853) 18.1 15.9 (722)
Other administrative expenses (853) 8.0 6.0 (790)
Depreciation (242) 3.8 1.8 (233)
Operating income 3,609 3.4 1.4 3,491Impairment on financial assets not measured at fair value through profit or loss (1,075) (38.5) (39.7) (1,749)
Provisions or reversal of provisions and other results 18 n.s. n.s. (48)Profit/(loss) before tax 2,551 50.6 47.7 1,694Income tax (740) 51.6 48.7 (488)Profit/(loss) for the period 1,812 50.2 47.4 1,206Non-controlling interests (0) 40.6 38.0 (0)
Net attributable profit/(loss) 1,811 50.2 47.4 1,206
Balance sheets 30-09-21 ∆ % ∆ %(1) 31-12-20
Cash, cash balances at central banks and other demand deposits 13,777 50.4 46.2 9,161
Financial assets designated at fair value 33,472 (7.9) (10.5) 36,360
Of which: Loans and advances 1,361 (47.4) (48.9) 2,589
Financial assets at amortized cost 62,196 4.0 1.1 59,819
Of which: Loans and advances to customers 53,014 6.0 3.1 50,002Tangible assets 1,644 (0.2) (3.0) 1,647
Other assets 2,866 (11.8) (14.2) 3,249
Total assets/liabilities and equity 113,955 3.4 0.5 110,236Financial liabilities held for trading and designated at fair value through profit or loss 21,232 (10.8) (13.2) 23,801
Deposits from central banks and credit institutions 5,509 7.5 4.5 5,125
Deposits from customers 58,440 8.1 5.1 54,052
Debt certificates 7,811 2.2 (0.6) 7,640
Other liabilities 13,624 5.5 2.6 12,911
Regulatory capital allocated 7,339 9.4 6.4 6,707
Relevant business indicators 30-09-21 ∆ % ∆ % (1) 31-12-20Performing loans and advances to customers under management (2) 53,465 6.0 3.1 50,446
Non-performing loans 1,459 (19.7) (22.0) 1,818
Customer deposits under management (2) 57,893 7.7 4.7 53,775
Off-balance sheet funds (3) 24,947 10.8 7.7 22,524
Risk-weighted assets 61,162 0.6 (2.2) 60,825
Efficiency ratio (%) 35.1 33.4
NPL ratio (%) 2.5 3.3
NPL coverage ratio (%) 131 122
Cost of risk (%) 2.70 4.02(1) At constant exchange rate.(2) Excluding repos.(3) Includes mutual funds and other off-balance sheet funds.
33

Macro and industry trends
Economic growth shows signs of moderation following the strong expansion recorded in the first half of 2021. BBVA Research estimates that GDP will expand by 6.0% in 2021, two tenths below its previous forecast. In an environment of relatively weak domestic demand, the price of commodities and certain production inputs has increased inflationary pressures, which have led Banxico to raise monetary policy interest rates to 4.75% in September, from 4.0% in May.
With regard to the banking system, based on data at the end of August 2021, the system's lending volume increased slightly since December 2020 (+0,9%), showing strong growth in the mortgage portfolio (+5,8% since the end of 2020), while deposits increased slightly (+1.6 since December 2020). The NPL ratio in the system recorded slight improvement, reaching an NPL ratio of 2.32% at the end of August (+2.56% in December last year) and capital indicators, by their part, remained comfortable.
Unless expressly stated otherwise, all the comments below on rates of change, for both activity and results, will be given at constant exchange rate. These rates, together with changes at current exchange rates, can be found in the attached tables of financial statements and relevant business indicators.
Activity
The most relevant aspects related to the area's activity during the first nine months of 2021 were:
• Lending activity (performing loans under management) grew 3.1% compared to December 2020 thanks to the performance of the retail segment (+6.3%), which continued to show the dynamism that began in the second quarter of 2021. Within the retail segment, the mortgage portfolio was once again notable (+6.5% compared to December 2020). Consumer finance and credit cards accelerated its growth rate (+4.5% in the first nine months of 2021), and so did SME financing which was up 13.7% compared to the end of December 2020. The promotion of the business model for the SME segment has allowed the product offering to be expanded and the commercial effort to be increased with more qualified personnel to meet needs and thus increase the number of customers. Meanwhile, the wholesale portfolio posted slight growth compared to the end of December 2020 (+0.6%). As a result of the above, BBVA Mexico's mix shows an increase toward the most profitable portfolio, with the retail portfolio representing 51% and the wholesale portfolio 49%.
• With regard to asset quality indicators, the NPL ratio recorded a decrease of 51 basis points in the third quarter of 2021 to stand at 2.5%, as a result of practically flat activity (excluding the exchange rate effect), a slight decrease in non-performing loans due to higher write-offs and contained wholesale entries. Meanwhile, the NPL coverage ratio improved due to the positive dynamics of NPL flows in the quarter, standing at 131%.
• Customer deposits under management showed an increase of 4.7% during the first nine months of 2021. This performance is explained by growth of 6.8% in demand deposits, due to customers' preference for having liquid balances in an uncertain environment, compared to the decline observed in time deposits (-4.3%). The above has allowed BBVA Mexico to improve its deposits mix, with 82% of total deposits in lower-cost funds. Mutual funds grew 7.8% between January and September 2021, favored by an improved offering which recently includes funds linked to environmental, social and governance (ESG) factors.
The most relevant aspects related to the area's activity during the third quarter of 2021 were:
• Lending activity (performing loans under management) grew 1.2% in the quarter thanks to the good performance of practically all portfolios in the retail segment (+2.9%), while the wholesale portfolio remained stable (-0.3%), due to maturities and repayments of commercial and corporate loans that have materialized between July and September, offset in part by the good performance of loans to the government (+2.0%), by actively participating in bidding processes.
• Total funds under management increased in the quarter (1.5%) with growth in both demand deposits and time deposits, which recorded growth of 1.9%, the latter favored by Banxico's recent increases in interest rates by 75 basis points. Mutual funds closed September with growth of 1.7%.
Results
BBVA Mexico posted a net attributable profit of €1,811m accumulated at the end of September 2021, representing a 47.4% increase compared to the same period in 2020, which was significantly affected by the COVID-19 pandemic.
The most relevant aspects of the year-on-year changes in the income statement at the end of September 2021 are summarized below:
• Net interest income closed up higher than the figure posted between January and September 2020 (+4.1%), due to lower financing costs, the negative impact on this line of customer support measures against a backdrop of the pandemic in the second quarter of 2020 and, to a lesser extent, the improvement in the portfolio mix in 2021. Also notable is the upward trend toward recovery in the new retail loan origination, which is already reflected in this line.
• Net fees and commissions increased 15.5% thanks to increased number of transactions, especially on credit cards, and thanks to fees and commissions arising from investment banking operations and mutual fund management.
• NTI decreased by 24.8% year-on-year, mainly due to lower results from the Global Markets unit in 2021, as well as lower results from ALCO portfolios.
• The other operating income and expenses line increased by 15.6% year-on-year as a result of the extraordinary revenue generated by the effects of initiatives aimed at transforming the production model, which have allowed the level of fraud to be reduced and operational efficiencies to have increased. All this enabled growth in this line of the income statement, despite lower results from the insurance unit, which was mainly affected by increased claims.
34

• Operating expenses increased (+9.5%) in an environment of high inflation, mainly due to higher personnel expenses against a backdrop of increased activity. Also contributing to the year-on-year growth is the fact that certain expenses were not incurred in 2020 as a result of the pandemic, and thus increased general expenses in 2021, like technology expenses, among others.
• The impairment on financial assets line item decreased significantly compared to the same period last year (-39.7%), mainly due to additional provisions for COVID-19 recorded in 2020 and to better-than-expected portfolio performance. With regard to the cumulative cost of risk as of September 2021, this continued on its downward trend and stood at 2.70%.
• The provisions and other results line showed a favorable comparison, driven by higher sales of foreclosed assets in 2021 and lower provisions related to contingent risks compared to those recorded during the first nine months of 2020.
This quarter, BBVA Mexico generated a net attributable profit of €673m, with growth of +5.8% compared to the previous quarter, influenced by the good performance of recurring revenue items (+4.9%), the increase in operating expenses against a backdrop of recovering activity (+3.4%), increased provisions for impairment on financial assets (+15.7%, below the recurring historical level prior to the outbreak of the pandemic), and a downward adjustment in the effective tax rate.
35

Turkey
Highlights
• Activity growth driven by Turkish lira loans and deposits
• Outstanding performance of NTI and net fees
• Downward trend in the cost of risk continues
• Net attributable profit growth driven by lower impairment losses on financial assets, compared to 2020 which was strongly affected by the effects of the pandemic
BUSINESS ACTIVITY(1) (YEAR-TO-DATE CHANGE AT CONSTANT EXCHANGE RATE)
+17.7%
+21.1%
Performing loans and advancesto customers under
management
Customer funds undermanagement
(1) Excluding repos.
NET INTEREST INCOME/ATAS (PERCENTAGE. CONSTANT EXCHANGE RATE)
4.86
4.34
3.77 3.784.23
3Q20 4Q20 1Q21 2Q21 3Q21
.
OPERATING INCOME (MILLIONS OF EUROS AT CONSTANT EXCHANGE RATE)
+3.5 % (1)
1,623 1,680
530497
596
486523 530
628
1Q20 2Q20 3Q20 4Q20 1Q21 2Q21 3Q21
(1) At current exchange rate: -19.0%
NET ATTRIBUTABLE PROFIT (MILLIONS OF EUROS AT CONSTANT EXCHANGE RATE)
+48.4 % (1)
393 583
89107
197
74
175201 207
1Q20 2Q20 3Q20 4Q20 1Q21 2Q21 3Q21
(1) At current exchange rate: +16.1%
36

FINANCIAL STATEMENTS AND RELEVANT BUSINESS INDICATORS (MILLIONS OF EUROS AND PERCENTAGE)
Income statement Jan.-Sep.21 ∆ % ∆ %(1) Jan.-Sep.20Net interest income 1,651 (25.6) (4.9) 2,218Net fees and commissions 443 13.2 44.6 391Net trading income 239 15.9 48.1 206Other operating income and expenses 81 59.9 104.3 51
Gross income 2,414 (15.8) 7.6 2,866Operating expenses (734) (7.3) 18.5 (792)
Personnel expenses (421) (3.7) 23.1 (437)
Other administrative expenses (218) (7.4) 18.3 (236)
Depreciation (95) (20.3) 1.9 (119)
Operating income 1,680 (19.0) 3.5 2,075Impairment on financial assets not measured at fair value through profit or loss (235) (65.4) (55.8) (680)
Provisions or reversal of provisions and other results 59 n.s. n.s. (70)Profit/(loss) before tax 1,504 13.5 45.1 1,325Income tax (323) 5.0 34.2 (308)Profit/(loss) for the period 1,181 16.1 48.4 1,017Non-controlling interests (598) 16.1 48.4 (515)
Net attributable profit/(loss) 583 16.1 48.4 503
Balance sheets 30-09-21 ∆ % ∆ %(1) 31-12-20Cash, cash balances at central banks and other demand deposits 6,258 14.2 29.1 5,477
Financial assets designated at fair value 5,417 1.6 14.8 5,332
Of which: Loans and advances 413 (0.5) 12.5 415Financial assets at amortized cost 47,893 2.5 15.9 46,705
Of which: Loans and advances to customers 38,933 4.4 18.0 37,295Tangible assets 851 (5.5) 6.8 901
Other assets 1,130 (3.5) 9.1 1,170
Total assets/liabilities and equity 61,549 3.3 16.7 59,585Financial liabilities held for trading and designated at fair value through profit or loss
1,999 (14.4) (3.3) 2,336
Deposits from central banks and credit institutions 3,880 14.8 29.7 3,381
Deposits from customers 41,282 4.9 18.5 39,353
Debt certificates 3,971 (1.6) 11.2 4,037
Other liabilities 3,735 (13.3) (2.0) 4,308
Regulatory capital allocated 6,682 8.3 22.4 6,170
Relevant business indicators 30-09-21 ∆ % ∆ %(1) 31-12-20Performing loans and advances to customers under management (2) 38,173 4.2 17.7 36,638
Non-performing loans 3,330 4.6 18.2 3,183
Customer deposits under management (2) 41,280 4.9 18.6 39,346
Off-balance sheet funds (3) 4,565 33.3 50.6 3,425
Risk-weighted assets 55,233 4.2 17.7 53,021
Efficiency ratio (%) 30.4 28.8
NPL ratio (%) 6.5 6.6
NPL coverage ratio (%) 78 80
Cost of risk (%) 0.88 2.13(1) At constant exchange rate.(2) Excluding repos.(3) Includes mutual funds and pension funds.
37
Macro and industry trends
Economic activity indicators continue to show strength, suggesting that GDP could grow by 9.5% in 2021, according to BBVA Research’s estimate. Economic dynamism, as well as the recent depreciation of the Turkish lira and the prices of certain commodities, have contributed to annual inflation rising to 19.6% at the end of September 2021. Despite inflationary pressures, the Central Bank of the Republic of Turkey has cut benchmark interest rates by 100 basis points to 18.0% in September 2021.
With regard to the banking system, based on data as of August 2021, the total volume of lending in the system increased by 9.3% since December 2020 (+8.1% in Turkish lira and +11.8% in foreign currency), while deposits grew by 13.2%, these growth rates include the effect of inflation. The NPL ratio stood at 3.67% at the end of August 2021 (4.08% at the end of 2020).
Unless expressly stated otherwise, all comments below on rates of changes for both activity and income, will be presented at constant exchange rates. These rates, together with changes at current exchange rates, can be observed in the attached tables of the financial statements and relevant business indicators.
Activity
The most relevant aspects related to the area’s activity during the first nine months of 2021 were:
• Lending activity (performing loans under management) increased by 17.7% between January and September 2021, driven by the growth in Turkish lira loans (+22.3%) which was supported mainly by consumer loans, thanks to the strong origination in General Purpose Loans, and also by credit cards, mortgage and commercial loans. Foreign-currency loans (in U.S. dollar) contracted during the first nine months of 2021 (-8.2%).
• In terms of asset quality, the NPL ratio decreased 81 basis points to 6.5% compared to June 2021, due to contained non-performing loans together with strong recoveries in the wholesale portfolio and an increase in activity focused on the retail portfolio. The NPL coverage ratio stood at 78% as of September 30, 2021, with an increase of 863 basis points in the quarter, mainly due to the good performance of non-performing loans.
• Customer deposits under management (67% of total liabilities in the area as of September 30, 2021) remained as the main source of funding for the balance sheet and increased by 18.6%. It is worth highlighting the positive performance of Turkish lira demand deposits (+29.9%), which represent 27% of total customer deposits in local currency, as well as time deposits (+16.2%). By its part, the evolution of off-balance sheet funds (+50.6%) also stood out. In line with the sector trend, foreign currency deposits decreased by 2.0%.
The most relevant developments in the area’s activity in the third quarter of 2021 were:
• Lending activity (performing loans under management) was above the previous quarter (+6.3%) as a result of the evolution in Turkish lira loans, with a particular focus on consumer loans (+9.8%) and credit cards (+13.0%), with flat performance in the commercial portfolio between July and September.
• Total funds under management showed a positive quarterly evolution (+4.5%), highlighting the growth of demand deposits, both in local and foreign currencies, as well as the increase in off-balance sheet funds.
Results
Turkey generated a net attributable profit of €583m in the first nine months of 2021, 48.4% higher than in the same period of the previous year, which was impacted by a strong increase in the impairment losses on financial assets due to the COVID-19 pandemic. Taking into account the effect of the depreciation of the Turkish lira over the period, the results generated by Turkey increased by 16.1%.
The most significant aspects of the year-on-year evolution in the area's income statement at the end of September 2021 are the following:
• Net interest income declined by 4.9% mainly due to contraction in the customer spread and increasing funding costs, despite higher loan volume and higher contribution from inflation-linked bonds.
• Net fees and commissions grew significantly (+44.6% year-on-year) mainly driven by the positive performance in brokerage fees and payment systems.
• NTI performed significantly well (+48.1%), mainly due to the positive impact of trading transactions in foreign currencies, the profit from the Global Markets unit and securities transactions.
• Other operating income and expenses increased by 104.3% between January and September, compared to the same period in 2020, mainly due to the positive contribution of the subsidiaries of Garanti BBVA, with the renting activity standing out..
• Operating expenses increased by 18.5%, impacted by the higher average annual inflation rate, the depreciation of the Turkish Lira and increased activity. On the other hand, there was a reduction in some discretionary expenses in 2020 due to COVID-19, affecting the year-on-year evolution. Nevertheless, the efficiency ratio remained low (30.4%).
• Impairment losses on financial assets decreased by 55.8% compared to those registered between January and September 2020, mainly due to the negative impact of the deterioration in the macroeconomic scenario as a result of the outbreak of the COVID-19 pandemic in March 2020, as well as the improvement of said scenario in 2021. At the end of September 2021, recoveries and repayments from one-off clients were registered. As a result of the aforementioned, the cumulative cost of risk decreased to 0.88% at the end of September 2021.
38

• The provisions and other results line closed September with a profit of €59m, compared to the loss of €-70m recorded in the same period of the previous year, mainly thanks to capital gains from the sale of real estate assets and lower provisions for special funds and contingent liabilities and commitments.
Turkey generated a net attributable profit of €207m in the quarter, which represents an increase of 2.6% compared to the previous quarter, mainly due to the positive evolution of the net interest income, which increased by +19.7%, promoted by loans in Turkish lira, improvement in customer spreads and the higher contribution of inflation-linked bonds. The latter was in part offset by an increase in the impairment of financial assets in the quarter (+35.9%) and the upward adjustment of the effective tax rate, resulting from the tax reform implemented in April 2021.
39

South America
Highlights
• Growth in lending activity between January and September, with greater dynamism from April onwards
• Reduction in higher-cost customer funds
• Year-on-year increase in recurring income and NTI, and higher adjustment for inflation in Argentina
• Year-on-year comparison influenced at the net attributable profit level as a result of the increase in the impairment on financial assets line in 2020 due to the outbreak of the pandemic
BUSINESS ACTIVITY(1) (YEAR-TO-DATE CHANGE AT CONSTANT EXCHANGE RATES)
+5.8%+5.0%
Performing loans andadvances to customers
under management
Customer funds undermanagement
(1) Excluding repos.It excludes the balances of BBVA Paraguay as of 31-12-2020.
NET INTEREST INCOME/ATAS (PERCENTAGE. CONSTANT EXCHANGE RATES)
4.93
5.345.16
5.315.55
3Q20 4Q20 1Q21 2Q21 3Q21
General note: Excluding BBVA Paraguay.
.
OPERATING INCOME (MILLIONS OF EUROS AT CONSTANT EXCHANGE RATES)
+2.1 % (1)
1,195 1,220
359401
435482
359
426 435
1Q20 2Q20 3Q20 4Q20 1Q21 2Q21 3Q21
(1) At current exchange rates:-12.7%At constant exchange rates, excluding BBVA Paraguay: +4.8%
NET ATTRIBUTABLE PROFIT (MILLIONS OF EUROS AT CONSTANT EXCHANGE RATES)
+26.2 % (1)
268 339
45
70
154
134
98117 124
1Q20 2Q20 3Q20 4Q20 1Q21 2Q21 3Q21
(1) At current exchange rates: +3.9%At constant exchange rates, excluding BBVA Paraguay: +35.6%
40

FINANCIAL STATEMENTS AND RELEVANT BUSINESS INDICATORS (MILLIONS OF EUROS AND PERCENTAGE)
Income statement Jan.-Sep.21 ∆ % ∆ % (1) ∆ % (2) Jan.-Sep.20Net interest income 2,061 (0.4) 13.8 16.5 2,069Net fees and commissions 426 15.9 34.9 38.0 368Net trading income 250 (7.2) 7.3 10.4 270Other operating income and expenses (443) 66.5 76.3 78.9 (266)
Gross income 2,294 (6.0) 8.8 11.5 2,441Operating expenses (1,074) 2.9 17.6 20.2 (1,044)
Personnel expenses (519) 0.7 15.8 18.7 (515)
Other administrative expenses (449) 9.4 24.9 27.2 (410)
Depreciation (107) (10.1) 0.4 2.7 (119)
Operating income 1,220 (12.7) 2.1 4.8 1,397Impairment on financial assets not measured at fair value through profit or loss (508) (24.8) (16.2) (14.9) (675)
Provisions or reversal of provisions and other results
(47) (36.9) (27.2) (26.7) (75)
Profit/(loss) before tax 665 2.8 27.1 32.4 647Income tax (207) 7.2 31.3 33.1 (193)Profit/(loss) for the period 458 0.9 25.3 32.0 454Non-controlling interests (119) (6.8) 22.8 22.8 (128)
Net attributable profit/(loss) 339 3.9 26.2 35.6 326
Balance sheets 30-09-21 ∆ % ∆ % (1) ∆ % (2) 31-12-20
Cash, cash balances at central banks and other demand deposits
7,853 10.2 15.9 24.3 7,127
Financial assets designated at fair value 7,357 0.4 6.4 6.5 7,329
Of which: Loans and advances 172 59.3 67.9 67.9 108Financial assets at amortized cost 36,365 (5.7) 0.1 3.2 38,549
Of which: Loans and advances to customers 32,422 (3.6) 2.2 5.7 33,615Tangible assets 814 0.7 5.0 6.1 808
Other assets 1,751 7.8 14.2 16.3 1,624
Total assets/liabilities and equity 54,139 (2.3) 3.4 6.7 55,436Financial liabilities held for trading and designated at fair value through profit or loss
1,588 19.8 26.7 26.7 1,326
Deposits from central banks and credit institutions 5,240 (2.6) 4.3 4.6 5,378
Deposits from customers 35,458 (3.8) 1.6 5.8 36,874
Debt certificates 3,159 (3.4) 3.2 4.1 3,269
Other liabilities 4,076 6.9 12.9 14.6 3,813
Regulatory capital allocated 4,617 (3.3) 2.6 6.2 4,776
Relevant business indicators 30-09-21 ∆ % ∆ % (1) ∆ % (2) 31-12-20Performing loans and advances to customers under management (3) 32,542 (3.5) 2.3 5.8 33,719
Non-performing loans 1,731 (2.8) 3.2 5.6 1,780
Customer deposits under management (4) 35,453 (3.9) 1.6 5.7 36,886
Off-balance sheet funds (5) 14,418 5.1 3.4 3.4 13,722
Risk-weighted assets 40,849 2.6 8.8 12.5 39,804
Efficiency ratio (%) 46.8 42.6
NPL ratio (%) 4.5 4.4
NPL coverage ratio (%) 108 110
Cost of risk (%) 1.87 2.36(1) At constant exchange rates.
(2) At constant exchange rates excluding BBVA Paraguay.
(3) Excluding repos.
(4) Excluding repos and including specific marketable debt securities.
(5) Includes mutual funds and pension funds.
41

SOUTH AMERICA. DATA PER COUNTRY (MILLIONS OF EUROS)Operating income Net attributable profit/(loss)
Country Jan.-Sep.21 ∆ % ∆ % (1) Jan.-
Sep.20 Jan.-Sep.21 ∆ % ∆ % (1) Jan.-
Sep.20Argentina 181 (28.7) n.s. 255 42 (49.7) n.s. 84
Colombia 423 (5.2) 0.6 446 159 55.4 65.0 103
Peru 509 (6.6) 10.0 545 79 3.4 21.7 76
Other countries (2) 107 (29.2) (26.5) 151 58 (7.6) (2.2) 63
Total 1,220 (12.7) 2.1 1,397 339 3.9 26.2 326(1) Figures at constant exchange rates.(2) Bolivia, Chile (Forum), Paraguay in 2020, Uruguay and Venezuela. Additionally, it includes eliminations and other charges.
SOUTH AMERICA. RELEVANT BUSINESS INDICATORS PER COUNTRY (MILLIONS OF EUROS)
Argentina Colombia Peru30-09-21 31-12-20 30-09-21 31-12-20 30-09-21 31-12-20
Performing loans and advances to customers under management (1)(2) 2,969 2,540 11,790 11,082 14,617 14,047
Non-performing loans and guarantees given (1) 80 47 695 642 878 840
Customer deposits under management (1)(3) 5,515 4,176 12,170 11,506 14,239 14,738
Off-balance sheet funds (1)(4) 1,674 876 1,049 1,486 1,552 1,995
Risk-weighted assets 6,180 5,685 13,387 13,096 17,305 15,845
Efficiency ratio (%) 67.8 53.6 36.1 35.2 37.2 37.7
NPL ratio (%) 2.6 1.8 5.3 5.2 4.7 4.5
NPL coverage ratio (%) 177 241 107 113 101 101
Cost of risk (%) 2.79 3.24 2.05 2.64 1.85 2.13(1) Figures at constant exchange rates.
(2) Excluding repos.
(3) Excluding repos and including specific marketable debt securities.
(4) Includes mutual funds.
Unless expressly stated otherwise, all the comments below on rates of change, for both activity and results, will be given at constant exchange rates. These rates, together with the changes at current exchange rates, can be found in the attached tables of the financial statements and relevant business indicators. The information for this business area includes BBVA Paraguay with regard to data on the results, activity, balance sheet and relevant business indicators for 2020, but does not include Paraguay for 2021, as the sale agreement materialized in January of that year. To facilitate an homogeneous comparison, the attached tables include a column at constant exchange rates that does not take BBVA Paraguay into account. All comments for this area also exclude BBVA Paraguay.
Activity and results
The most relevant aspects related to the area's activity during the first nine months of 2021 were:
• Lending activity (performing loans under management) registered an increase of +5.8% compared to December 2020. By portfolio, the wholesale portfolio recorded an increase of +4.8% and the retail portfolio grew +6.8%.
• With regard to asset quality, the NPL ratio stood at 4.5%, a decrease of 13 basis points compared to the end of the first half of 2021, with a generalized decrease in the main countries in the area, due to lower inflows and a higher level of write-offs and recoveries.
• Customer funds under management increased by (+5.0%) compared to December 2020 closing balances. Deposits from customers under management increased by +5.7%, despite efforts in some countries to reduce higher-cost resources in an environment whereby the Group's liquidity situation throughout the region is adequate. Off-balance sheet funds increased +3.4% in the area as a whole between January and September 2021.
The most relevant aspects of the area's activity in the quarter were:
• Lending activity (performing loans under management) was higher than in the previous quarter (+1.0%), mainly thanks to the good performance of consumer loans and credit cards (+3.1% and +6.5%, respectively).
• Total customer funds increased in the quarter, boosted by growth in both demand deposits (+1.6%) and off-balance sheet funds (+1.9%).
With regard to the interannual evolution of South America, the area generated a cumulative net attributable profit of €339m between January and September 2021, representing a year-on-year variation of +35.6%, mainly due to the improved performance of recurring income and NTI in 2021 (+18.8%), despite COVID-19 outbreaks and restrictions on mobility which have been in force during part of 2021 in some countries of the region. This comparison is also affected by the significant provision for impairment on financial assets made in 2020, also caused by COVID-19. The accumulated impact at the end of September 2021 derived from inflation in Argentina on the attributable profit of the area was a loss of €-125m, compared to a cumulative loss of €-82m at the close of September 2020.
42

In the quarter, South America generated a net attributable profit of €124m, supported mainly by the good performance of recurring revenues (+10.1% compared to the previous quarter), which, together with a lower level of provisions for impairment on financial assets (-8.5%), offset the lower NTI results and the increase in operating expenses in the context of higher activity.
More detailed information on the most representative countries of the business area is provided below:
Argentina
Macro and industry trends
Within the framework of reduction in the number of infections and the acceleration of vaccination in recent months, economic activity continues to gradually recover from the sharp drop in GDP recorded in 2020. Thus, BBVA Research estimates that GDP growth will reach 7.5% in 2021. Inflation remains high and the exchange rate continues to gradually depreciate.
The banking system continues to be influenced by the high inflation scenario. At the end of July 2021, lending grew by 14.2% with regard to December 2020, while deposits grew by 25.6%. In addition, the NPL ratio increased during the second quarter of 2021 to 4.8% (+1 percentage point compared to the first quarter of 2021).
Activity and results
• Lending activity increased 16.9% compared to the close of December 2020, a figure that is below inflation, with growth in the retail segment (+22.6%), focused on credit cards (+20.5%) and corporate (+8.3%). The NPL ratio slightly decreased in the quarter to 2.6% driven by the increase in activity and a better performance of recoveries.
• Balance sheet funds continued to grow (+32.1% between January and September 2021) both from individuals and wholesale, while off-balance sheet funds increased 91.1% compared to December 2020.
• In the third quarter of 2021, Argentina recorded a good performance in recurring revenues, offset by higher operating expenses. The cumulative attributable profit at the end of September 2021 stood at €42m, as a consequence of the good performance of the recurring revenues from commission fees and a higher contribution from NTI from foreign currency derivatives transactions, offset by higher expenses and higher provisions compared to 2020.
Colombia
Macro and industry trends
The improvement of the epidemiological situation has supported the economic recovery process. Recent indicators show that GDP could grow 9.2% this year according to BBVA Research. In line with global trends, inflation has risen more than expected and reached 4.4% at the end of August. In this context, the Central Bank has started the interest rate hike cycle earlier than expected.
Total lending in the banking system is recovering (+3.4% at the end of July 2021, in a year-to-date comparison) after some months of weak growth, driven by credit to households, both the consumer portfolio (+3.3%) and companies (+4.2%), which offset the fall in mortgages (-1.1%). Furthermore, total deposits slowed down after growing by 2.8% at the end of July 2021, in a year-to-date comparison. The system's NPL ratio at the end of July 2021 remained stable at 4.61%.
Activity and results
• Lending activity grew by 6.4% compared to 2020 year-end thanks to the performance of wholesale portfolios (+9.1%) and retail portfolios (+4.9%). In terms of asset quality, there was a slight quarterly reduction in the NPL ratio to 5.3% as a result of contained NPL entries, higher recoveries (mainly in wholesale portfolios) and higher activity at the close of September 2021.
• Deposits from customers under management increased by 5.8%, compared to 2020 year-end, with a significant reduction in the cost of such deposits. Off-balance sheet funds closed with a negative variation of 29.4% in the nine-month period due to the volatility of investments made by institutional customers.
• In the third quarter of 2021, BBVA Colombia recorded a slight reduction in gross margin since the good evolution of the net interest income was offset by lower commission fees and NTI, along with an increase in personnel expenses in a context of higher activity. The attributable profit for the first nine months of 2021 stood at €159m, well above (+65.0% year-on-year) the €103m reached between January and September 2020, thanks to the performance of net interest income and commissions, as well as lower provisions for impairment on financial assets compared to the same period of the previous year, when they increased notably due to the outbreak of the pandemic.
43

Peru
Macro and industry trends
The economic recovery continues, reinforcing BBVA Research's outlook that GDP growth could be around 12.2% in 2021. Rising inflation has led the Central Bank to raise interest rates earlier than expected.
The banking system continues to be influenced by the effects of supportive policies in the context of the COVID-19 pandemic, although expanding at a more moderate rate during June 2021, with growth in loans and deposits of 4.2% and 0.8%, respectively in a year-to-date comparison. In addition, the NPL of the system is still contained at 3.11%.
Activity and results
• Lending activity closed September with a favorable growth of 4.1% compared to 2020 year-end, mainly due to the performance of mortgages, consumer finance (+6.2% and +16.6%, respectively) and growth in corporate lending (+3.8% compared to 2020 year-end), which captured liquidity in order to weather political uncertainty caused by the electoral process. The NPL ratio improved in the third quarter of 2021 to 4.7% due to write-offs. The NPL coverage ratio remained stable at 101%.
• Deposits from customers under management fell 3.4% in the first nine months of 2021, with a decrease in time deposits to reduce its cost. Off-balance sheet funds also declined compared to the close of December 2020 (-22.2%).
• In the third quarter, BBVA Peru has shown a good evolution of recurring income, but a reduction in NTI driven by the negative impact in derivatives positions as a consequence of the increase in rates carried out by the Central Bank. In the year-on-year evolution of the income statement, recurring income grew by 9.5%, thanks to the favorable evolution of the interest margin and commissions (which grew by 5.0% and 26.9%, respectively). Year-on-year reduction in provisions for impairment on financial assets (-6.1%), as a result of higher provision charges in 2020 following the pandemic outbreak. As a result, net attributable profit stood at €79m, 21.7% higher than the figure posted between January and September 2020.
44

Rest of Business
Highlights
• Increase in lending due to quarterly performance and the decrease in customer funds between January and September, with growth in the third quarter
• Favorable performance of risk indicators in the quarter
• Continued good performance of net interest income from the branches in Asia and the NTI from the area as a whole
• Reversal in the impairment on financial assets line, which compares to a 2020 strongly affected by the outbreak of the pandemic
BUSINESS ACTIVITY(1) (YEAR-TO-DATE CHANGE AT CONSTANT EXCHANGE RATES)
+2.6%
-22.4%
Performing loans andadvances to customers
under management
Customer funds undermanagement
(1) Excluding repos.
NET INTEREST INCOME/ATAS (PERCENTAGE. CONSTANT EXCHANGE RATES)
0.84 0.84 0.840.81 0.81
3Q20 4Q20 1Q21 2Q21 3Q21
.
OPERATING INCOME (MILLIONS OF EUROS AT CONSTANT EXCHANGE RATES)
-21.0 % (1)
307 243
84
132
91
69
104
71 68
1Q20 2Q20 3Q20 4Q20 1Q21 2Q21 3Q21
(1) At current exchange rates: -21.4%
NET ATTRIBUTABLE PROFIT (MILLIONS OF EUROS AT CONSTANT EXCHANGE RATES)
+32.1 % (1)
155 205
67
4048
6876
71
58
1Q20 2Q20 3Q20 4Q20 1Q21 2Q21 3Q21
(1) At current exchange rates: +30.6%
45

FINANCIAL STATEMENTS AND RELEVANT BUSINESS INDICATORS (MILLIONS OF EUROS AND PERCENTAGE)
Income statement Jan.-Sep.21 ∆ % ∆ % (1) Jan.-Sep.20Net interest income 209 (4.9) (5.1) 220Net fees and commissions 189 (28.3) (26.4) 263Net trading income 156 17.6 17.6 133Other operating income and expenses 14 (59.2) (57.9) 34Gross income 568 (12.6) (11.6) 650Operating expenses (325) (4.7) (3.0) (341)
Personnel expenses (165) (11.1) (8.9) (185)
Other administrative expenses (145) 3.4 4.3 (140)
Depreciation (16) 0.1 0.7 (15)Operating income 243 (21.4) (21.0) 309Impairment on financial assets not measured at fair value through profit or loss 20 n.s. n.s. (100)
Provisions or reversal of provisions and other results (4) (66.5) (66.6) (11)Profit/(loss) before tax 259 30.6 32.1 198Income tax (54) 30.8 32.1 (41)Profit/(loss) for the period 205 30.6 32.1 157Non-controlling interests — — — —Net attributable profit/(loss) 205 30.6 32.1 157
Balance sheets 30-09-21 ∆ % ∆ % (1) 31-12-20Cash, cash balances at central banks and other demand deposits 4,454 (27.2) (31.2) 6,121
Financial assets designated at fair value 2,544 73.1 66.5 1,470
Of which: Loans and advances 1,456 n.s. n.s. 153Financial assets at amortized cost 28,507 4.8 3.5 27,213
Of which: Loans and advances to customers 24,995 4.1 2.8 24,015Inter-area positions — — — —
Tangible assets 65 (13.5) (14.1) 75
Other assets 363 24.0 21.7 293
Total assets/liabilities and equity 35,933 2.2 0.1 35,172Financial liabilities held for trading and designated at fair value through profit or loss 1,905 124.4 112.4 849
Deposits from central banks and credit institutions 1,798 5.8 2.7 1,700
Deposits from customers 7,341 (21.3) (23.6) 9,333
Debt certificates 1,249 (17.4) (18.3) 1,511
Inter-area positions 19,535 7.7 6.1 18,132
Other liabilities 799 31.4 29.0 608
Regulatory capital allocated 3,307 8.8 7.0 3,039
Relevant business indicators 30-09-21 ∆ % ∆ % (1) 31-12-20Performing loans and advances to customers under management (2) 24,979 3.9 2.6 24,038
Non-performing loans 317 (2.3) (2.8) 324
Customer deposits under management (2) 7,341 (21.3) (23.6) 9,333
Off-balance sheet funds (3) 567 (0.5) (0.5) 569
Risk-weighted assets 27,193 11.8 10.1 24,331
Efficiency ratio (%) 57.2 55.6
NPL ratio (%) 0.9 1.0
NPL coverage ratio (%) 98 109
Cost of risk (%) (0.11) 0.30(1) At constant exchange rates.(2) Excluding repos.(3) Includes pension funds.
46

Unless expressly stated otherwise, all the comments below on rates of change, for both activity and results, will be given at constant exchange rates. These rates, together with the changes at current exchange rates, can be found in the attached tables of the financial statements and relevant business indicators. Comments that refer to Europe exclude Spain.
Activity
The most relevant aspects of the activity of Rest of Business of BBVA Group during the first nine months of 2021 were:
• Lending activity (performing loans under management) increased during the first nine months of the year (+2.6%), thanks to the business growth of the BBVA's branches located in Asia.
• Regarding credit risk indicators, the NPL ratio stood at 0.9%, 8 basis points below the end of June 2021 due to an improvement in the behavior of non-performing loans in Europe, improving the coverage rate to 98%.
• Customer deposits under management decreased by 22.4% mainly due to a decrease in deposits from wholesale customers in the New York branch.
The most relevant developments in the area’s activity in the third quarter of 2021 were:
• Lending activity (performing loans under management) increased by 2.6% compared to the previous quarter due to the favorable performance of lending to the public sector, mainly in Asia.
• Total customer deposits under management increased in the quarter (+5.5%) thanks to the growth of demand deposits (+9.6%) in Europe, excluding Spain.
Results
The most significant aspects of the year-on-year evolution in the area's income statement at the end of September 2021 are the following:
• The net interest income decreased -5.1% compared to the same period of the previous year, mainly due to the evolution of the New York branch.
• Net commissions fell by 26.4% compared to the end of September 2020, due to lower issuance and advisory fees in Europe and, in particular, due to lower contribution from BBVA Securities, the Group's broker-dealer in the United States.
• The NTI line increased (+17.6% year-on-year) driven by a better performance of BBVA Securities, the business in Europe and branches in Asia.
• Year-on-year decrease in operating expenses (-3.0% year-on-year) due to lower expenses recorded by BBVA Securities.
• The impairment on financial assets line closed September with a reversal of €20m, which positively compares against the €-100m recorded twelve months earlier, mainly explained by the positive evolution of impaired clients of the New York branch and the retail portfolio in Europe.
• As a result, the area's cumulative net attributable profit between January and September 2021 was €205m (+32.1% year-on-year).
In the third quarter of 2021, the Group’s Rest of Business as a whole generated a net attributable profit of €58 million (-17.2% compared to the previous quarter) as a result of lower fees and commissions (-16.1%), a negative result in the other operating income and operating expenses line that contrasts with the positive result of the previous quarter, as well as lower reversals in the impairment on financial assets and provisions line. This was partly offset by a reduction in operating expenses (-13.9%) and a lower effective tax rate.
47

Corporate CenterFINANCIAL STATEMENTS (MILLIONS OF EUROS AND PERCENTAGE)
Income statement Jan.-Sep.21 ∆ % Jan.-Sep.20Net interest income (128) 11.2 (115)
Net fees and commissions (29) (45.0) (53)
Net trading income 268 24.2 216
Other operating income and expenses 95 n.s. (15)
Gross income 206 n.s. 33Operating expenses (649) 5.0 (618)
Personnel expenses (409) 14.5 (357)
Other administrative expenses (96) (17.4) (117)
Depreciation (144) (0.3) (144)
Operating income (444) (24.2) (586)Impairment on financial assets not measured at fair value through profit or loss
(2) n.s. 0
Provisions or reversal of provisions and other results (14) (94.2) (232)
Profit/(loss) before tax (459) (43.9) (817)Income tax 41 (76.3) 173
Profit/(loss) for the period (418) (35.1) (644)Non-controlling interests (15) n.s. —
Net attributable profit excluding non-recurring impacts (433) (32.7) (644)Profit/(loss) after tax from discontinued operations (1) 280 n.s. (2,031)
Net cost related to the restructuring process (696) n.s. —
Net attributable profit/(loss) (849) (68.2) (2,675)(1) Including the results generated by BBVA USA and the rest of the Group's companies in the United States until the sale operation closing on June 1, 2021.
Balance sheets 30-09-21 ∆ % 31-12-20Cash, cash balances at central banks and other demand deposits 10,189 n.s. 874
Financial assets designated at fair value 2,058 40.5 1,464
Of which: Loans and advances — — —
Financial assets at amortized cost 1,577 (8.2) 1,718
Of which: Loans and advances to customers 170 (66.2) 505
Inter-area positions — — —
Tangible assets 1,988 (3.6) 2,063
Other assets 15,308 (84.6) 99,298
Total assets/liabilities and equity 31,119 (70.5) 105,416Financial liabilities held for trading and designated at fair value through profit or loss
8 (88.5) 72
Deposits from central banks and credit institutions 847 0.2 845
Deposits from customers 180 (50.4) 363
Debt certificates 1,603 (63.1) 4,344
Inter-area positions 7,280 n.s. 64
Other liabilities 6,102 (92.7) 83,707
Regulatory capital allocated (35,466) 4.3 (33,998)
Total equity 50,567 1.1 50,020
48

Results
The Corporate Center recorded a net attributable loss of €433m between January and September 2021, excluding certain non-recurring impacts, among them:
• The profit/(loss) after tax from discontinued operations which includes the results generated by the Group's businesses in the United States prior to its sale to PNC on June 1, 2021, which amounted to a positive result of €280m, while at the end of September 2020 it stood at €-2,031m, including the goodwill impairment in the United States which amounted to €-2,084m.
• The net cost related to the restructuring process of BBVA S.A. in Spain which amounted to €-696m, of which, before tax, €-754m correspond to the collective layoff and €-240m to branches closures.
Including both non-recurring impacts, the Corporate Center recorded a cumulative net attributable loss of €-849m at the end of September 2021, showing a significant improvement over the previous year.
In addition to the aforementioned, the most relevant aspects of the year-on-year evolution are summarized below:
• Net fees and commissions also evolved positively, since those from the previous year recorded expenses associated with the issuance of the first green convertible bond (CoCo) for an amount of €1,000m in July 2020.
• NTI increased by 24.2% as a result, mainly, of the valuation of the Group’s stakes in Funds & Investment Vehicles in tech companies.
• The other operating income and expenses line registered a positive result at the end of September 2021, mainly due to higher dividend income obtained from the Group's stake in Funds & Investment Vehicles in tech companies.
• Finally, losses recorded under the provisions or reversal of provisions and other results line were significantly lower than those recorded in the same period of the previous year, mainly due to the deterioration of investments in subsidiaries or joint venture businesses in 2020.
49

Other information: Corporate & Investment Banking
Highlights
• Lending activity balances above pre-pandemic levels and reduced customer funds
• Growth of recurring income and good performance of NTI
• Efficiency ratio remains at low levels
• Significant reduction in the impairment on financial assets line, compared to 2020 which was strongly affected by the effects of the pandemic
BUSINESS ACTIVITY(1) (YEAR-TO-DATE CHANGE AT CONSTANT EXCHANGE RATES)
+0.9%
-13.4%
Performing loans andadvances to customers
under management
Customer funds undermanagement
(1) Excluding repos.
GROSS INCOME/ATAS (PERCENTAGE. CONSTANT EXCHANGE RATES)
1.44 1.35
1.73 1.681.45
3Q20 4Q20 1Q21 2Q21 3Q21
.
OPERATING INCOME (MILLIONS OF EUROS AT CONSTANT EXCHANGE RATES)
+12.9 % (1)
1,457 1,644
376
562518
436
591 559495
1Q20 2Q20 3Q20 4Q20 1Q21 2Q21 3Q21
(1) At current exchange rates: +3.7%
NET ATTRIBUTABLE PROFIT (MILLIONS OF EUROS AT CONSTANT EXCHANGE RATES)
+42.1 % (1)
672 955
152
260 260
191
319 320 316
1Q20 2Q20 3Q20 4Q20 1Q21 2Q21 3Q21
(1) At current exchange rates: +35.3%
50

FINANCIAL STATEMENTS AND RELEVANT BUSINESS INDICATORS (MILLIONS OF EUROS AND PERCENTAGE)
Income statement Jan.-Sep.21 ∆ % ∆ % (1) Jan.-Sep.20Net interest income 1,156 4.0 11.2 1,111Net fees and commissions 583 0.6 6.8 579Net trading income 636 6.9 15.1 594Other operating income and expenses (28) (1.8) 0.7 (29)
Gross income 2,346 4.0 11.2 2,256Operating expenses (702) 4.6 7.6 (671)
Personnel expenses (324) 14.0 16.5 (284)
Other administrative expenses (296) (0.9) 3.3 (299)
Depreciation (81) (7.1) (6.9) (88)
Operating income 1,644 3.7 12.9 1,585Impairment on financial assets not measured at fair value through profit or loss (13) (96.2) (95.7) (343)
Provisions or reversal of provisions and other results — n.s. n.s. (44)Profit/(loss) before tax 1,631 36.1 46.6 1,199Income tax (457) 41.8 52.0 (322)Profit/(loss) for the period 1,174 34.0 44.6 877Non-controlling interests (220) 28.6 56.1 (171)
Net attributable profit/(loss) 955 35.3 42.1 706(1) At constant exchange rates.
Balance sheets 30-09-21 ∆ % ∆ % (1) 31-12-20
Cash, cash balances at central banks and other demand deposits 5,118 (31.7) (33.9) 7,491
Financial assets designated at fair value 114,505 3.9 3.7 110,217
Of which: Loans and advances 39,290 26.0 26.2 31,183Financial assets at amortized cost 68,979 (2.9) (2.0) 71,031
Of which: Loans and advances to customers 58,401 (1.4) (0.3) 59,225Inter-area positions — — — —
Tangible assets 39 (20.8) (20.9) 50
Other assets 1,726 104.7 132.6 843
Total assets/liabilities and equity 190,368 0.4 0.6 189,632Financial liabilities held for trading and designated at fair value through profit or loss 85,661 (2.1) (2.5) 87,508
Deposits from central banks and credit institutions 15,308 (4.1) (4.3) 15,958
Deposits from customers 36,686 (14.6) (14.0) 42,966
Debt certificates 3,132 49.5 51.5 2,096
Inter-area positions 37,137 22.9 24.2 30,218
Other liabilities 2,907 37.9 30.6 2,108
Regulatory capital allocated 9,536 8.6 10.6 8,778(1) At constant exchange rates.
Relevant business indicators 30-09-21 ∆ % ∆ % (1) 31-12-20
Performing loans and advances to customers under management (2) 57,576 (0.2) 0.9 57,704
Non-performing loans 1,647 29.2 42.1 1,275
Customer deposits under management (2) 36,037 (14.8) (14.2) 42,313
Off-balance sheet funds (3) 1,165 13.2 19.5 1,030
Efficiency ratio (%) 29.9 31.4(1) At constant exchange rates.(2) Excluding repos.(3) Includes mutual funds and other off-balance sheet funds.
51

Unless expressly stated otherwise, all the comments below on rates of change, for both activity and results, will be given at constant exchange rates. These rates, together with changes at current exchange rates, can be found in the attached tables of financial statements and relevant business indicators.
Activity
The most relevant aspects related to the area's activity between January and September 2021 were:
• Lending activity (performing loans under management) remains above the level prior to the outbreak of the pandemic in March 2020, with a slight increase (+0.9%) compared to the end of the same year. By geographical areas, Asia, Turkey and, to a lesser extent, South America showed positive evolution during the period.
• Customer funds fell by 13.4% in the first nine months of 2021, due to some transactions originated in the last months of 2020 that had not been renewed in 2021, being this trend widespread in all business areas, except for Mexico, which recorded a growth of 3.8% between January and September 2021.
The most significant aspects of the evolution in the area's activity in the third quarter of 2021 were:
• Lending activity (performing loans under management) remained stable in the quarter (+0.9%), mainly due to the good performance in Asia and Turkey.
• Customer funds decreased slightly in the quarter (-0.8%) due to lower customer deposits balances (-1.0%) in Turkey and South America.
Results
CIB generated a net attributable profit of €955m between January and September 2021, which represents and increase of 42.1% on a yea-to-year basis, thanks to the growth in recurring income and NTI as well as lower provisions for impairment on financial assets, which increased significantly in 2020 due to the COVID-19 pandemic.
The most relevant aspects of the year-on-year evolution in the income statement of Corporate & Investment Banking are summarized below:
• Net interest income sustained double-digit growth (+11.2%), supported by the evolution in Spain, Mexico and Turkey. In addition to the performance of lending activity, where a lower volume is observed, it is worth noting the commercial effort to adjust the price of certain transactions, one of the strategic focuses of the area in 2021, which has led to an improvement in profitability per transaction.
• Growth was also observed in net fees and commissions (+6.8%), mainly due to the performance of investment and transactional banking, the latter benefiting from the reactivation of business in 2021. On the contrary, Global Markets' operations have slowed down due to the access to the primary market by some customers. By geographical areas, positive performance of Mexico, South America and Turkey stood out.
• NTI continued showing a good performance, due to the proper management of market positions, with a very strong first and second quarter, while the third quarter of 2021 was affected by the seasonality in Spain and lower results in Mexico and Peru.
• The operating expenses increased by 7.6% between January and September, in a year-on-year comparison affected by the supportive schemes implemented by the area in 2020 which have not occur in 2021 after the return to normality, although the area continues to focus its efforts on vacancy management and discretionary expenses.
• Provisions for impairment on financial assets decreased significantly compared with the same period last year, with the third quarter of 2021 highly benefiting from improved outlook, compared to 2020 which was severely affected by provisions related to COVID-19.
In the third quarter of 2021 and excluding the exchange rate effect, the Group’s wholesale businesses as a whole generated a net attributable profit of €316m (-1.1% compared to the previous quarter). This development is mainly explained by a decrease in NTI in the quarter, as previously mentioned, affected by seasonality in Spain and lower results in Mexico and Peru, offset in part by better performance in net interest income, mainly thanks to the results of Global Markets in Mexico, sustained expenses and, in particular, the reversals in the impairment on financial assets, mainly originated in Turkey.
52

Alternative Performance Measures (APMs)BBVA presents its results in accordance with the International Financial Reporting Standards (EU-IFRS). However, it also considers that some Alternative Performance Measures (hereinafter APMs) provide useful additional financial information that should be taken into account when evaluating performance. These APMs are also used when making financial, operational and planning decisions within the Entity. The Group firmly believes that they give a true and fair view of its financial information. These APMs are generally used in the financial sector as indicators for monitoring the assets, liabilities and economic and financial situation of entities.
BBVA Group's APMs are given below. They are presented in accordance with the European Securities and Markets Authority (ESMA) guidelines, published on October 5, 2015 (ESMA/2015/1415en) as well as the statement published by the ESMA on May 20, 2020 (ESMA 32-63-972), about implications of the COVID-19 outbreak on the half-yearly financial reports. The guidelines mentioned before are aimed at promoting the usefulness and transparency of APMs included in prospectuses or regulated information in order to protect investors in the European Union. In accordance with the indications given in the guidelines, BBVA Group's APMs:
• Include clear and readable definitions of the APMs.
• Disclose the reconciliations to the most directly reconcilable line item, subtotal or total presented in the financial statements of the corresponding period, separately identifying and explaining the material reconciling items.
• Are standard measures generally used in the financial industry, so their use provides comparability in the analysis of performance between issuers.
• Do not have greater preponderance than measures directly stemming from financial statements.
• Are accompanied by comparatives for previous periods.
• Are consistent over time.
Constant exchange ratesWhen comparing two dates or periods in this management report, the impact of changes in the exchange rates against the euro of the currencies of the countries in which BBVA operates is sometimes excluded, assuming that exchange rates remain constant. This is done for the amounts in the income statement by using the average exchange rate against the euro in the most recent period for each currency of the geographical areas in which the Group operates, and applying it to both periods; for amounts in the balance sheet and activity, the closing exchange rates in the most recent period are used.
Reconciliation of the Financial Statements of the BBVA GroupBelow is the reconciliation between the consolidated Income Statements of the Condensed Interim Consolidated Financial Statements (hereinafter, the Consolidated Financial Statements) and the consolidated management Income Statements, shown throughout this report, for the first half of 2021 and 2020.
The main difference between the two is the treatment of the cost related to the restructuring process in the first half of 2021 which, for management purposes, are included in a single line, net of taxes, of the income statement called "Net cost related to the restructuring process", compared to the treatment in the income statement of the Consolidated Financial Statements, which record the gross impacts and their tax effect in the corresponding headings that are applicable to them in accordance with accounting regulations.
Additionally, there is a difference in the positioning of the results generated by BBVA USA and the rest of the companies included in the sale agreement to PNC until its closing, once the mandatory authorizations have been obtained, on June 1, 2021. In the Consolidated financial statements, these results are included in the line "Profit (loss) after tax from discontinued operations" and are taken into account both for the calculation of the "Profit/(loss)" and for the profit/(loss) "Attributable to the owners of the parent" whereas, for management purposes, they are not included in the" Profit/(loss) for the period", as they are included in a line below it, as can be seen in the following table.
53

CONCILIATION OF THE BBVA GROUP'S INCOME STATEMENTS. SEPTEMBER 2021 (MILLIONS OF EUROS)
CONSOLIDATED INCOME STATEMENT ADJUSTMENTS MANAGEMENT INCOME STATEMENT
Jan.-Sep.21 Jan.-Sep.21
NET INTEREST INCOME 10,708 — 10,708 Net interest income
Dividend income 129 (*)
Share of profit or loss of entities accounted for using the equity method (2) (*)
Fee and commission income 5,088 5,088 Fees and commissions income
Fee and commission expense (1,571) (1,571) Fees and commissions expenses
3,518 — 3,518 Net fees and commissions
Gains (losses) on derecognition of financial assets and liabilities not measured at fair value through profit or loss, net
127
Gains (losses) on financial assets and liabilities held for trading, net 609
Gains (losses) on non-trading financial assets mandatorily at fair value through profit or loss, net
374
Gains (losses) on financial assets and liabilities designated at fair value through profit or loss, net
155
Gains (losses) from hedge accounting, net (91)
Exchange differences, net 297
1,472 — 1,472 Net trading income
Other operating income 482
Other operating expense (1,381)
Income from insurance and reinsurance contracts 1,948
Expense from insurance and reinsurance contracts (1,285)
(108) — (108) Other operating income and expenses
GROSS INCOME 15,589 — 15,589 Gross income
Administration costs (6,047) (6,976) Operating expenses (**)
Personnel expense (3,647) — (3,647) Personnel expenses
Other administrative expense (2,400) — (2,400) Other administrative expenses
Depreciation and amortization (929) — (929) Depreciation
8,613 — 8,613 Operating income
Provisions or reversal of provisions (978) 754 (224) Provisions or reversal of provisions
Impairment or reversal of impairment on financial assets not measured at fair value through profit or loss or net gains by modification
(2,202) — (2,202)Impairment on financial assets not measured at fair value through profit or loss
NET OPERATING INCOME 5,433 754 6,187
Impairment or reversal of impairment of investments in joint ventures and associates
—
Impairment or reversal of impairment on non-financial assets (196)
Gains (losses) on derecognition of non - financial assets and subsidiaries, net
13
Gains (losses) from non-current assets and disposal groups classified as held for sale not qualifying as discontinued operations
(62)
(245) 240 (5) Other gains (losses)
PROFIT (LOSS) BEFORE TAX FROM CONTINUING OPERATIONS 5,188 994 6,182 Profit/(loss) before tax
Tax expense or income related to profit or loss from continuing operations (1,422) (298) (1,720) Income tax
PROFIT (LOSS) AFTER TAX FROM CONTINUING OPERATIONS 3,766 696 4,462 Profit/(loss) for the period
Profit (loss) after tax from discontinued operations 280 (280)
PROFIT FOR THE YEAR 4,046 416 4,462 Profit/(loss) for the period
ATTRIBUTABLE TO MINORITY INTEREST (NON-CONTROLLING INTERESTS)
(735) — (735) Non-controlling interests
ATTRIBUTABLE TO OWNERS OF THE PARENT 3,311 416 3,727Net attributable profit excluding non-recurring impacts
280 280Profit/(loss) after tax from discontinued operations
(696) (696) Net cost related to the restructuring process
ATTRIBUTABLE TO OWNERS OF THE PARENT 3,311 — 3,311 Net attributable profit/(loss)
(*) Included within the Other operating income and expenses of the Management Income Statements
(**) Depreciations included.
54

Profit / (loss) for the periodExplanation of the formula: The profit/(loss) for the period is the profit/(loss) for the period from the Group’s consolidated income statement, which comprises the profit/(loss) after tax from continued operations and the profit/(loss) after tax from discontinued operations of BBVA USA and the rest of Group’s companies in the United States sold to PNC on June 1, 2021. If the described metric is presented on a date prior to the end of the year, it will be presented on an annualized basis.
Relevance of its use: This measure is commonly used, not only in the banking sectors, for homogeneous comparison purposes.
Profit/(loss) for the periodJan.-Sep.2021 Jan.-Dec.2020 Jan.-Sep.2020
(Millions of euros) +Annualized profit/(loss) after tax from continued operations (1) 5,270 3,789 3,555
(Millions of euros) +Annualized profit/(loss) after tax from discontinued operations (2) 280 (1,729) (2,013)
= Profit/(loss) for the period 5,550 2,060 1,542(1) The cost related to the restructuring process not annualized.
(2) January-September 2021 only includes the results generated by BBVA USA and the rest of Group's companies in the United States included in the agreement until its sale to PNC as of June 1, 2021.
Adjusted profit/(loss) for the periodExplanation of the formula: The adjusted profit/(loss) for the period is the profit/(loss) from continued operations for the period from the Group’s consolidated income statement, excluding those extraordinary items that, for management purposes, are defined at any given moment. If the described metric is presented on a date prior to the end of the year, it will be presented on an annualized basis.
Relevance of its use: This measure is commonly used, not only in the banking sector, for homogeneous comparison purposes.
Adjusted profit/(loss) for the periodJan.-Sep.2021 Jan.-Dec.2020 Jan.-Sep.2020
(Millions of euros) +Annualized profit/(loss) after tax from continued operations
5,270 3,789 3,555
(Millions of euros) - Net capital gains from the bancassurance transaction — 304 —
(Millions of euros) - Net cost related to the restructuring process (696) — —
= Adjusted profit/(loss) for the period 5,966 3,485 3,555
Net attributable profit/(loss)Explanation of the formula: The net attributable profit/(loss) is the net attributable profit/(loss) of the Group’s consolidated income statement from continued operations and the profit/(loss) after tax from discontinued operations of BBVA USA and the rest of Group’s companies in the United States sold to PNC on June 1, 2021. If the described metric is presented on a date prior to the end of the year, it will be presented on an annualized basis.
Relevance of its use: This measure is commonly used, not only in the banking sector, for homogeneous comparison purposes.
Net attributable profit/(loss)Jan.-Sep.2021 Jan.-Dec.2020 Jan.-Sep.2020
(Millions of euros) +Annualized net attributable profit/(loss) from continued operations (1) 4,288 3,033 2,692
(Millions of euros) +Annualized net attributable profit/(loss) from discontinued operations (2) 280 (1,729) (2,013)
= Net attributable profit/(loss) 4,567 1,305 680(1) The cost related to the restructuring process not annualized.
(2) January-September 2021 only includes the results generated by BBVA USA and the rest of Group's companies in the United States included in the agreement until its sale to PNC as of June 1, 2021.
Adjusted net attributable profit/(loss)Explanation of the formula: The adjusted net attributable profit/(loss) is the net attributable profit/(loss) of the Group’s consolidated income statement from continued operations excluding those extraordinary items that, for management purposes are defined at any given moment. If the described metric is presented on a date prior to the end of the year, it will be presented on an annualized basis.
55

Relevance of its use: This measure is commonly used, not only in the banking sector, for comparison purposes.
Adjusted net attributable profit/(loss)Jan.-Sep.2021 Jan.-Dec.2020 Jan.-Sep.2020
(Millions of euros) +Annualized net attributable profit/(loss) from continued operations
4,288 3,033 2,692
(Millions of euros) - Net capital gains from the bancassurance transaction — 304 —
(Millions of euros) - Net cost related to the restructuring process (696) — —
= Adjusted net attributable profit/(loss) 4,983 2,729 2,692
ROEThe ROE (return on equity) ratio measures the return obtained on an entity's shareholders' funds plus accumulated other comprehensive income. It is calculated as follows:
Net attributable profit/(loss)Average shareholders' funds+Average accumulated other comprehensive income
Explanation of the formula: The numerator is the net attributable profit/(loss) previously defined in these alternative performance measures, If the metric is presented on a date before the close of the fiscal year, the numerator will be annualized.
Average shareholders' funds are the weighted moving average of the shareholders' funds at the end of each month of the period analyzed, adjusted to take into account the execution of the "dividend-option" at the closing dates on which it was agreed to deliver this type of dividend prior to the publication of the Group´s results.
Average accumulated other comprehensive income is the moving weighted average of "Accumulated other comprehensive income", which is part of the equity on the Entity's balance sheet and is calculated in the same way as average shareholders’ funds (above).
Relevance of its use: This ratio is very commonly used not only in the banking sector but also in other sectors to measure the return obtained on shareholders' funds.
ROEJan.-Sep.2021 Jan.-Dec.2020 Jan.-Sep.2020
Numerator (Millions of euros) =
Annualized net attributable profit/(loss) 4,567 1,305 680
Denominator (Millions of euros)
+ Average shareholder's funds 60,021 57,626 57,450
+ Average accumulated other comprehensive income (15,064) (12,858) (12,391)
= ROE 10.2 % 2.9 % 1.5 %
Adjusted ROE The adjusted ROE (return on equity) ratio measures the return obtained on an entity's shareholders' funds plus accumulated other comprehensive income. It is calculated as follows:
Adjusted net attributable profit/(loss)Average shareholders' funds+Average accumulated other comprehensive income
Explanation of the formula: The numerator is the adjusted net attributable profit/(loss) previously defined in these alternative performance measures. If the metric is presented on a date before the close of the fiscal year, the numerator will be annualized.
Average shareholders' funds are the weighted moving average of the shareholders' funds at the end of each month of the period analyzed, adjusted to take into account the execution of the "dividend-option" at the closing dates on which it was agreed to deliver this type of dividend prior to the publication of the Group´s results.
Average accumulated other comprehensive income is the moving weighted average of "Accumulated other comprehensive income", which is part of the equity on the entity's balance sheet and is calculated in the same way as average shareholders’ funds (above).
Relevance of its use: This ratio is very commonly used not only in the banking sector but also in other sectors to measure the return obtained on shareholders' funds.
56

Adjusted ROEJan.-Sep.2021 Jan.-Dec.2020 Jan.-Sep.2020
Numerator (Millions of euros)
= Adjusted net attributable profit/(loss) 4,983 2,729 2,692
Denominator (Millions of euros)
+ Average shareholder's funds 60,021 57,626 57,450
+ Average accumulated other comprehensive income (15,064) (12,858) (12,391)
= Adjusted ROE 11.1 % 6.1 % 6.0 %
ROTEThe ROTE (return on tangible equity) ratio measures the return on an entity's shareholders' funds, plus accumulated other comprehensive income, and excluding intangible assets. It is calculated as follows:
Net attributable profit/(loss)Average shareholders' funds+Average accumulated other comprehensive income- Average intangible assets
Explanation of the formula: The numerator "Net attributable profit/(loss)" and the items in the denominator "Average intangible assets" and "Average accumulated other comprehensive income" are the same items and are calculated in the same way as explained for ROE.
Average intangible assets are the intangible assets on the balance sheet, including goodwill and other intangible assets. The average balance is calculated in the same way as explained for shareholders funds in ROE.
Relevance of its use: This metric is generally used not only in the banking sector but also in other sectors to measure the return obtained on shareholders' funds, not including intangible assets.
ROTEJan.-Sep.2021 Jan.-Dec.2020 Jan.-Sep.2020
Numerator (Millions of euros)
Annualized net attributable profit/(loss) 4,567 1,305 680
Denominator (Millions of euros)
+ Average shareholder's funds 60,021 57,626 57,450
+ Average accumulated other comprehensive income (15,064) (12,858) (12,391)
- Average intangible assets 2,286 2,480 2,532
-Average intangible assets from BBVA USA and BBVA Paraguay (1) 1,199 2,528 2,699
= ROTE 11.0 % 3.3 % 1.7 %(1) BBVA Paraguay includes 4 millions of euros as of January-December 2020 and January-September 2020.
Adjusted ROTEThe adjusted ROTE (return on tangible equity) ratio measures the return on an entity's shareholders' funds, plus accumulated other comprehensive income, and excluding intangible assets. It is calculated as follows:
Adjusted net attributable profit/(loss)Average shareholders' funds+ Average accumulated other comprehensive income-Average intangible assets
Explanation of the formula: The numerator is the adjusted net attributable profit/(loss) previously defined in these alternative performance measures. If the metric is presented on a date before the close of the fiscal year, the numerator will be annualized.
Average intangible assets are the intangible assets on the balance sheet, excluding the assets from BBVA USA and the rest of Group’s companies in the United States included in the sale agreement signed with PNC, whose sale took place on June 1, 2021. The average balance is calculated in the same way as explained for shareholders' funds in ROE.
Relevance of its use: This metric is generally used not only in the banking sector but also in other sectors to measure the return obtained on shareholders' funds, not including intangible assets.
57

Adjusted ROTEJan.-Sep.2021 Jan.-Dec.2020 Jan.-Sep.2020
Numerator (Millions of euros)
= Adjusted net attributable profit/(loss) 4,983 2,729 2,692
Denominator (Millions of euros)
+ Average shareholder's funds 60,021 57,626 57,450
+ Average accumulated other comprehensive income (15,064) (12,858) (12,391)
- Average intangible assets 2,286 2,480 2,532
- Average intangible assets from BBVA Paraguay — 4 4
= Adjusted ROTE 11.7 % 6.5 % 6.3 %
ROAThe ROA (return on assets) ratio measures the return obtained on an entity's assets. It is calculated as follows:
Profit/(loss) for the periodAverage total assets
Explanation of the formula: The numerator is the profit/(loss) for the period, previously defined in these alternative performance measures. If the metric is presented on a date before the close of the fiscal year, the numerator must be annualized.
Average total assets are taken from the Group’s consolidated balance sheet. The average balance is calculated as explained for average shareholders' funds in the ROE.
Relevance of its use: This ratio is generally used not only in the banking sector but also in other sectors to measure the return obtained on assets.
ROAJan.-Sep.2021 Jan.-Dec.2020 Jan.-Sep.2020
Numerator (Millions of euros)
Annualized profit/(loss) for the period 5,550 2,060 1,542
Denominator (Millions of euros)
Average total assets 689,188 729,833 729,756
ROA 0.81 % 0.28 % 0.21 %
Adjusted ROAThe adjusted ROA (return on assets) ratio measures the return obtained on an entity's assets. It is calculated as follows:
Adjusted profit/(loss) for the periodAverage total assets
Explanation of the formula: The numerator is the adjusted profit/(loss) for the period previously defined in these alternative performance measures. If the metric is presented on a date before the close of the fiscal year, the numerator will be annualized.
Average total assets are taken from the Group's consolidated balance sheets, excluding the assets from BBVA and the rest of Group’s companies in the United States included in the sale agreement signed with PNC, whose sale took place on June 1, 2021. The average balance is calculated in the same way as explained for average equity in ROE.
Relevance of its use: This ratio is generally used not only in the banking sector but also in other sectors to measure the return obtained on assets.
Adjusted ROAJan.-Sep.2021 Jan.-Dec.2020 Jan.-Sep.2020
Numerator (Millions of euros)
Adjusted profit/(loss) for the period 5,966 3,485 3,555
Denominator (Millions of euros)
Average total assets 637,820 642,762 642,438
Adjusted ROA 0.94 % 0.54 % 0.55 %
RORWAThe RORWA (return on risk-weighted assets) ratio measures the accounting return obtained on average risk-weighted assets. It is calculated as follows:
58
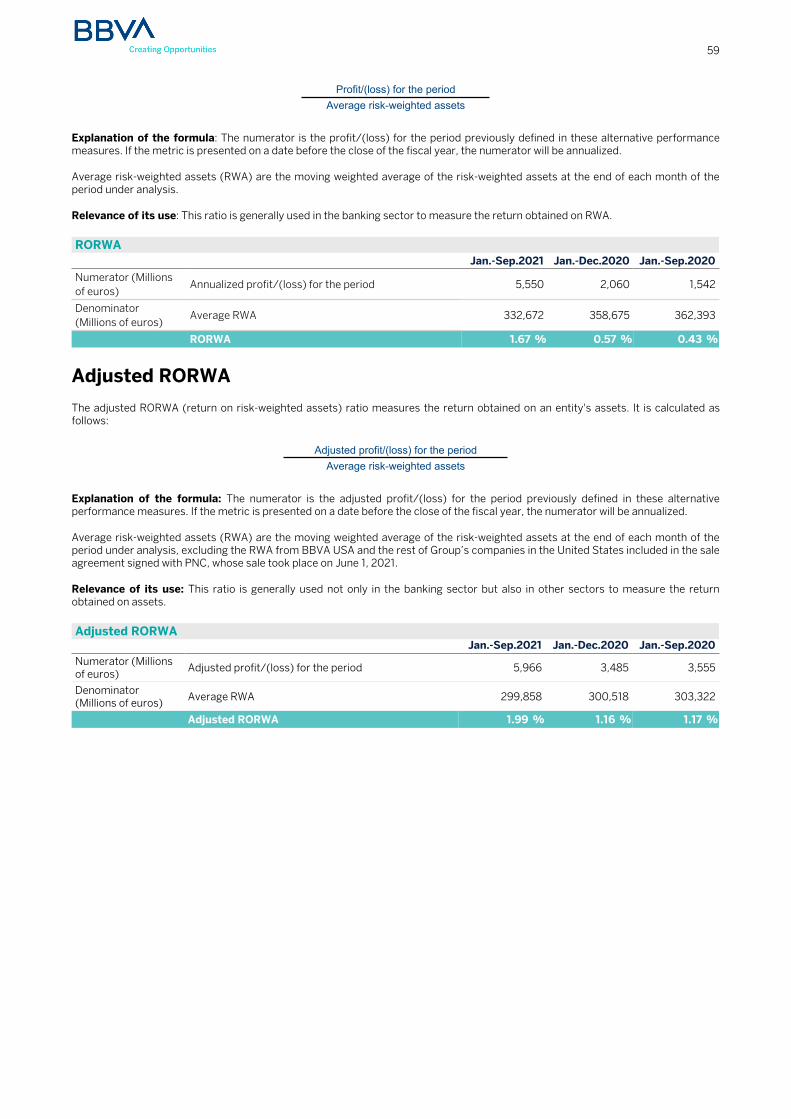
Profit/(loss) for the periodAverage risk-weighted assets
Explanation of the formula: The numerator is the profit/(loss) for the period previously defined in these alternative performance measures. If the metric is presented on a date before the close of the fiscal year, the numerator will be annualized.
Average risk-weighted assets (RWA) are the moving weighted average of the risk-weighted assets at the end of each month of the period under analysis.
Relevance of its use: This ratio is generally used in the banking sector to measure the return obtained on RWA.
RORWAJan.-Sep.2021 Jan.-Dec.2020 Jan.-Sep.2020
Numerator (Millions of euros)
Annualized profit/(loss) for the period 5,550 2,060 1,542
Denominator (Millions of euros)
Average RWA 332,672 358,675 362,393
RORWA 1.67 % 0.57 % 0.43 %
Adjusted RORWA The adjusted RORWA (return on risk-weighted assets) ratio measures the return obtained on an entity's assets. It is calculated as follows:
Adjusted profit/(loss) for the periodAverage risk-weighted assets
Explanation of the formula: The numerator is the adjusted profit/(loss) for the period previously defined in these alternative performance measures. If the metric is presented on a date before the close of the fiscal year, the numerator will be annualized.
Average risk-weighted assets (RWA) are the moving weighted average of the risk-weighted assets at the end of each month of the period under analysis, excluding the RWA from BBVA USA and the rest of Group’s companies in the United States included in the sale agreement signed with PNC, whose sale took place on June 1, 2021.
Relevance of its use: This ratio is generally used not only in the banking sector but also in other sectors to measure the return obtained on assets.
Adjusted RORWAJan.-Sep.2021 Jan.-Dec.2020 Jan.-Sep.2020
Numerator (Millions of euros)
Adjusted profit/(loss) for the period 5,966 3,485 3,555
Denominator (Millions of euros)
Average RWA 299,858 300,518 303,322
Adjusted RORWA 1.99 % 1.16 % 1.17 %
59

Earning per shareThe earning per share is calculated in accordance to the criteria established in the IAS 33 “Earnings per share”.
Earnings/(losses) per shareJan.-Sep.2021 Jan.-Dec.2020 Jan.-Sep.2020
(Millions of euros) + Net attributable profit/(loss) 3,311 1,305 (15)
(Millions of euros)+
Remuneration related to the Additional Tier 1 securities
279 387 287
Numerator (millions of euros)
=Net attributable profit/(loss) ex.CoCos remuneration
3,032 917 (302)
Denominator (millions)
+ Average number of shares 6,668 6,668 6,668
- Average treasury shares of the period 11 13 11
= Earnings/(losses) per share (euros) 0.46 0.14 (0.05)
Additionally, for management purposes, earnings per share are presented excluding: (I) the profit after tax from discontinued operations, that is, the results generated by BBVA USA and the rest of the Group companies in the United States until their sale to PNC on June 1, 2021, for the three broken down periods; (II) the capital gain net of taxes from the bancassurance operation with Allianz registered in the fourth quarter of fiscal year 2020; and (III) the net cost related to the restructuring process recorded in the second quarter of fiscal year 2021.
Earnings/(losses) per share excluding non-recurring impactsJan.-Sep.2021 Jan.-Dec.2020 Jan.-Sep.2020
(Millions of euros) + Net attributable profit/(loss) ex. CoCos remuneration 3,032 917 (302)
(Millions of euros) - Discontinued operations 280 (1,729) (2,031)
(Millions of euros) - Corporate operations — 304 —
(Millions of euros) - Net cost related to the restructuring process (696) — —
Numerator (millions of euros)
=Net Attributable profit ex.CoCos and non-recurring impacts
3,448 2,342 1,729
Denominator (millions)
+ Average number of shares 6,668 6,668 6,668
- Average treasury shares of the period 11 13 11
= Earnings/(losses) per share excluding non-recurring impacts (euros) 0.52 0.35 0.26
Efficiency ratioThis measures the percentage of gross income consumed by an entity's operating expenses. It is calculated as follows:
Operating expensesGross income
Explanation of the formula: Both "Operating expenses" and "Gross income" are taken from the Group’s consolidated income statement. Operating expenses are the sum of the administration costs (personnel expenses plus other administrative expenses) plus depreciation. Gross income is the sum of net interest income, net fees and commissions, net trading income dividend income, share of profit or loss of entities accounted for using the equity method, and other operating income and expenses. For a more detailed calculation of this ratio, the graphs on "Results" section of this report should be consulted, one of them with calculations with figures at current exchange rates and another with the data at constant exchange rates.
Relevance of its use: This ratio is generally used in the banking sector. In addition, it is an indicator from one of the six Strategic Priorities of the Group.
Efficiency ratioJan.-Sep.2021 Jan.-Dec.2020 Jan.-Sep.2020
Numerator (Millions of euros)
Operating expenses 6,976 9,088 6,823
Denominator (Millions of euros)
Gross income 15,589 20,166 15,620
Efficiency ratio 44.7 % 45.1 % 43.7 %
60

Dividend yieldThis is the remuneration given to the shareholders in the last twelve calendar months, divided by the closing price for the period. It is calculated as follows:
∑ Dividend per share over the last twelve monthsClosing price
Explanation of the formula: The remuneration per share takes into account the gross amounts per share paid out over the last twelve months, both in cash and through the flexible remuneration system called "dividend option".
Relevance of its use: This ratio is generally used by analysts, shareholders and investors for companies that are traded on the stock market. It compares the dividend paid out by a company every year with its market price at a specific date.
Dividend yield30-09-21 31-12-20 30-09-20
Numerator (Euros) ∑ Dividends 0.06 0.16 0.26
Denominator (Euros) Closing price 5.72 4.04 2.37
= Dividend yield 1.0 % 4.0 % 11.0 %
Book value per shareThe book value per share determines the value of a company on its books for each share held. It is calculated as follows:
Shareholders' funds + Accumulated other comprehensive incomeNumber of shares outstanding - Treasury shares
Explanation of the formula: The figures for both "Shareholders' funds" and "Accumulated other comprehensive income" are taken from the balance sheet. Shareholders' funds are adjusted to take into account the execution of the "dividend-option" at the closing dates on which it was agreed to deliver this type of dividend prior to the publication of the Group´s results. The denominator includes the final number of outstanding shares excluding own shares (treasury shares). The denominator is also adjusted to include the capital increase resulting from the execution of the dividend options explained above. Both the numerator and the denominator take into account period-end balances.
Relevance of its use: It shows the company's book value for each share issued. It is a generally used ratio, not only in the banking sector but also in others.
Book value per share 30-09-21 31-12-20 30-09-20
Numerator (Millions of euros)
+ Shareholders' funds 60,622 58,904 57,669
+ Dividend-option adjustment — — —
+ Accumulated other comprehensive income (15,684) (14,356) (14,552)
Denominator (Millions of shares)
+ Number of shares outstanding 6,668 6,668 6,668
+ Dividend-option — — —
- Treasury shares 16 14 30
= Book value per share (euros / share) 6.76 6.70 6.50
61

Tangible book value per shareThe tangible book value per share determines the value of the company on its books for each share held by shareholders in the event of liquidation. It is calculated as follows:
Shareholders' funds + Accumulated other comprehensive income - Intangible assetsNumber of shares outstanding - Treasury shares
Explanation of the formula: The figures for "Shareholders' funds", "Accumulated other comprehensive income" and "Intangible assets" are all taken from the balance sheet. Shareholders' funds are adjusted to take into account the execution of the "Dividend-option" at the closing dates on which it was agreed to deliver this type of dividend prior to the publication of the Group´s results. The denominator includes the final number of shares outstanding excluding own shares (treasury shares). The denominator is also adjusted to include the result of the capital increase resulting from the execution of the dividend options explained above. Both the numerator and the denominator take into account period-end balances.
Relevance of its use: It shows the company's book value for each share issued, after deducting intangible assets. It is a generally used ratio, not only in the banking sector but also in others.
Tangible book value per share30-09-21 31-12-20 30-09-20
Numerator (Millions of euros)
+ Shareholders' funds 60,622 58,904 57,669
+ Dividend-option adjustment — — —
+ Accumulated other comprehensive income (15,684) (14,356) (14,552)
- Intangible assets 2,271 2,345 2,326
-Intangible assets from BBVA USA and BBVA Paraguay (1) — 1,952 2,047
Denominator (Millions of shares)
+ Number of shares outstanding 6,668 6,668 6,668
+ Dividend-option — — —
- Treasury shares 16 14 30
= Tangible book value per share (euros / share) 6.41 6.05 5.84
(1) BBVA Paraguay includes 3 millions of euros as of 31-12-20 and 30-09-20.
Non-performing loan (NPL) ratioIt is the ratio between the risks classified for accounting purposes as non-performing loans and the total credit risk balance, both excluding the balances from BBVA USA and the rest of the Group´s companies in the United States included in the sale agreement signed with PNC, which was completed on June 1, 2021. It is calculated as follows:
Non-performing loansTotal credit risk
Explanation of the formula: non-performing loans and the credit risk balance are gross, meaning they are not adjusted by associated accounting provisions.
Non-performing loans are calculated as the sum of “loans and advances at amortized cost” and the “contingent risk” in stage 36 and the following counterparties:
• other financial entities
• public sector
• non-financial institutions
• households
The credit risk balance is calculated as the sum of "Loans and advances at amortized cost" and "Contingent risk" in stage 1 + stage 2 + stage 3 of the previous counterparts.
This indicator is shown, as others, at a business area level.
Relevance of its use: This is one of the main indicators used in the banking sector to monitor the current situation and changes in credit risk quality, and specifically the relationship between risks classified in the accounts as non-performing loans and the total balance of credit risk, with respect to customers and contingent liabilities.
62
6 IFRS 9 classifies financial instruments into three stages, which depend on the evolution of their credit risk from the moment of initial recognition. The stage 1 includes operations when they are initially recognized , stage 2 comprises operations for which a significant increase in credit risk has been identified since their initial recognition and,stage 3, impaired operations.

Non-Performing Loans (NPLs) ratio30-09-21 31-12-20 30-09-20
Numerator (Millions of euros) NPLs 14,864 15,451 15,006
Denominator (Millions of euros) Credit Risk 371,708 366,883 365,127
= Non-Performing Loans (NPLs) ratio 4.0 % 4.2 % 4.1 %
NPL coverage ratioThis ratio reflects the degree to which the impairment of non-performing loans has been covered in the accounts via allowances, excluding assets from BBVA USA and the rest of the Group´s companies in the United States included in the sale agreement signed with PNC, which was completed on June 1, 2021. It is calculated as follows:
ProvisionsNon-performing loans
Explanation of the formula: It is calculated as "Provisions" from stage 1 + stage 2 + stage 3, divided by non-performing loans, formed by “credit risk” from stage 3.
This indicator is shown, as others, at a business area level.
Relevance of its use: This is one of the main indicators used in the banking sector to monitor the situation and changes in the quality of credit risk, reflecting the degree to which the impairment of non-performing loans has been covered in the accounts via value adjustments.
NPL coverage ratio30-09-21 31-12-20 30-09-20
Numerator (Millions of euros) Provisions 11,895 12,595 12,731
Denominator (Millions of euros) NPLs 14,864 15,451 15,006
= NPL coverage ratio 80 % 82 % 85 %
Cost of riskThis ratio indicates the current situation and changes in credit-risk quality through the annual cost in terms of impairment losses (accounting loan-loss provisions) of each unit of loans and advances to customers (gross). It excludes the risk attributable to BBVA USA and the rest of the Group´s companies in the United States included in the sale agreement signed with PNC, which was completed on June 1, 2021. It is calculated as follows:
Annualized loan-loss provisionsAverage loans and advances to customers (gross)
Explanation of the formula: "Loans to customers (gross)" refers to the "Loans and advances at amortized cost" portfolios with the following counterparts:
• other financial entities
• public sector
• non-financial institutions
• households, excluding central banks and other credit institutions.
Average loans to customers (gross) is calculated by using the average of the period-end balances of each month of the period analyzed plus the previous month. "Annualized loan-loss provisions" are calculated by accumulating and annualizing the loan-loss provisions of each month of the period under analysis.
Loan-loss provisions refer to the aforementioned loans and advances at amortized cost portfolios.
This indicator is shown, as others, at a business area level.
Relevance of its use: This is one of the main indicators used in the banking sector to monitor the situation and changes in the quality of credit risk through the cost over the year.
Cost of riskJan.-Sep.2021 Jan.-Dec.2020 Jan.-Sep.2020
Numerator (Millions of euros) Annualized loan-loss provisions 2,969 5,160 5,601
Denominator (Millions of euros) Average loans to customers (gross) 324,022 332,096 334,298
= Cost of risk 0.92 % 1.55 % 1.68 %
63

DisclaimerThis document is only provided for information purposes and does not constitute, nor should it be interpreted as, an offer to sell, exchange or acquire, or an invitation for offers to acquire securities issued by any of the aforementioned companies, or to contract any financial product. Any decision to purchase or invest in securities or contract any financial product must be made solely and exclusively on the basis of the information made available to such effects by the company in relation to each specific matter.
This document includes or may include forward looking statements with respect to the intentions, expectations or projections of BBVA or its management on the date thereof, that refer to or incorporate various assumptions and projections, including projections regarding future earnings of the business. The statements contained herein are based on our current projections, although the actual results may be substantially modified in the future due to certain risks and uncertainties and other factors that may cause the final results or decisions to differ from said intentions, projections or estimates. These factors include, but are not limited to, (1) the market situation, macroeconomic factors, regulatory, political or government guidelines, (2) domestic and international stock markets movements, exchange rates and interest rates, (3) competitive pressure, (4) technological changes, (5) variations in the financial situation, creditworthiness or solvency of our clients, debtors or counterparts. These factors could cause or result in actual events differing from the information and intentions set forth, projected, or forecast in this document or in other past or future documents. BBVA does not undertake to publicly update or communicate the update of the content of this or any other document, either if the events are not as described herein, or if there are changes in the information contained in this document.
64