James Bullard's Seven Faces of
24
Seven Faces of The Peril James Bullard Preprint Federal Reserve Bank of St. Louis Review September-October Issue Abstract In this paper I discuss the possibility that the U.S. economy may become enmeshed in a Japanese-style, deationary outcome within the next several years. To frame the discussion, I rely on an analysis that emphasizes two possible long-run outcomes (steady states) for the economy, one which is consistent with monetary policy as it has typically been implemented in the U.S. in recent years, and one which is consistent with the low nominal interest rate, deationary regime observed in Japan during the same period. The data I consider seem to be quite consistent with the two steady state possibilities. I describe and critique seven stories that are told in monetary policy circles re- garding this analysis. I emphasize two main conclusions: (1) The FOMCs extended period language may be increasing the probabil- ity of a Japanese-style outcome for the U.S., and (2) on balance, the U.S. quantitative easing program o/ers the best tool to avoid such an outcome. JEL codes : E4, E5. Keywords : Zero bound on nominal interest rates, active Taylor rule, global analysis, multiple steady states, Fisher relation, stability. President and CEO, Federal Reserve Bank of St. Louis. This version: 29 July 2010. Any views expressed are my own and do not necessarily reect the views of other Federal Open Market Committee members. Marcela M. Williams provided outstanding research assistance. I have benetted from review and comments by Richard Ander- son, David Andolfatto, Costas Azariadis, Jess Benhabib, Cletus Coughlin, George Evans, William Gavin, Seppo Honkapohja, Narayana Kocherlakota, Michael McCracken, Christo- pher Neely, Michael Owyang, Adrian Peralta-Alva, Robert Rasche, Daniel Thornton, and David Wheelock.
Transcript of James Bullard's Seven Faces of
Seven Faces of �The Peril�
James Bullard�
PreprintFederal Reserve Bank of St. Louis Review
September-October Issue
AbstractIn this paper I discuss the possibility that the U.S. economy may
become enmeshed in a Japanese-style, de�ationary outcome withinthe next several years. To frame the discussion, I rely on an analysisthat emphasizes two possible long-run outcomes (steady states) forthe economy, one which is consistent with monetary policy as it hastypically been implemented in the U.S. in recent years, and one whichis consistent with the low nominal interest rate, de�ationary regimeobserved in Japan during the same period. The data I consider seemto be quite consistent with the two steady state possibilities. I describeand critique seven stories that are told in monetary policy circles re-garding this analysis. I emphasize two main conclusions: (1) TheFOMC�s extended period language may be increasing the probabil-ity of a Japanese-style outcome for the U.S., and (2) on balance, theU.S. quantitative easing program o¤ers the best tool to avoid such anoutcome. JEL codes: E4, E5.Keywords: Zero bound on nominal interest rates, active Taylor
rule, global analysis, multiple steady states, Fisher relation, stability.
�President and CEO, Federal Reserve Bank of St. Louis. This version: 29 July2010. Any views expressed are my own and do not necessarily re�ect the views of otherFederal Open Market Committee members. Marcela M. Williams provided outstandingresearch assistance. I have bene�tted from review and comments by Richard Ander-son, David Andolfatto, Costas Azariadis, Jess Benhabib, Cletus Coughlin, George Evans,William Gavin, Seppo Honkapohja, Narayana Kocherlakota, Michael McCracken, Christo-pher Neely, Michael Owyang, Adrian Peralta-Alva, Robert Rasche, Daniel Thornton, andDavid Wheelock.
1 The �peril�
In 2001, three academic economists published a paper entitled �The Perilsof Taylor Rules.�1 The paper has vexed policymakers and academics alikesince that time, as it identi�ed an important and very practical problem� aperil� facing monetary policymakers, but provided little in the way of simpleresolution. The analysis appears to apply equally well to a wide variety ofmacroeconomic frameworks, not just to those which are in one particularcamp or another, so that the peril result has great generality. And, mostworrisomely, current monetary policies in the U.S. (and possibly Europe aswell) appear to be poised to head straight toward the problematic outcomedescribed in the paper.The authors of the 2001 paper are Jess Benhabib of New York Univer-
sity, along with Stephanie Schmitt-Grohé and Martín Uribe, both now atColumbia University. They studied abstract economies in which the mone-tary policymaker follows an active Taylor-type monetary policy rule, that is,the policymaker changes nominal interest rates more than one-for-one whenin�ation deviates from a given target. Active Taylor-type rules are so com-monplace in present day monetary policy discussions that they have ceasedto be controversial. Benhabib, et al., also emphasized the zero bound onnominal interest rates. They suggested that the combination of an activeTaylor-type rule and a zero bound on nominal interest rates necessarily cre-ates a new long-run outcome for the economy. This new long-run outcomecan involve de�ation and a very low level of nominal interest rates. Worse,there is presently an important economy that appears to be stuck in exactlythis situation: Japan.To see what Benhabib, et al., were up to, consider Figure 1. This is
a plot of nominal interest rates and in�ation for both the U.S. and Japanduring the period from January 2002 through May 2010. The frequency ismonthly. The Japanese data are the circles in the Figure, and the U.S. data
1Jess Benhabib, Stephanie Schmitt-Grohé, and Martín Uribe, 2001, �The Perils ofTaylor Rules,�Journal of Economic Theory 96(1-2): 40-69.
1
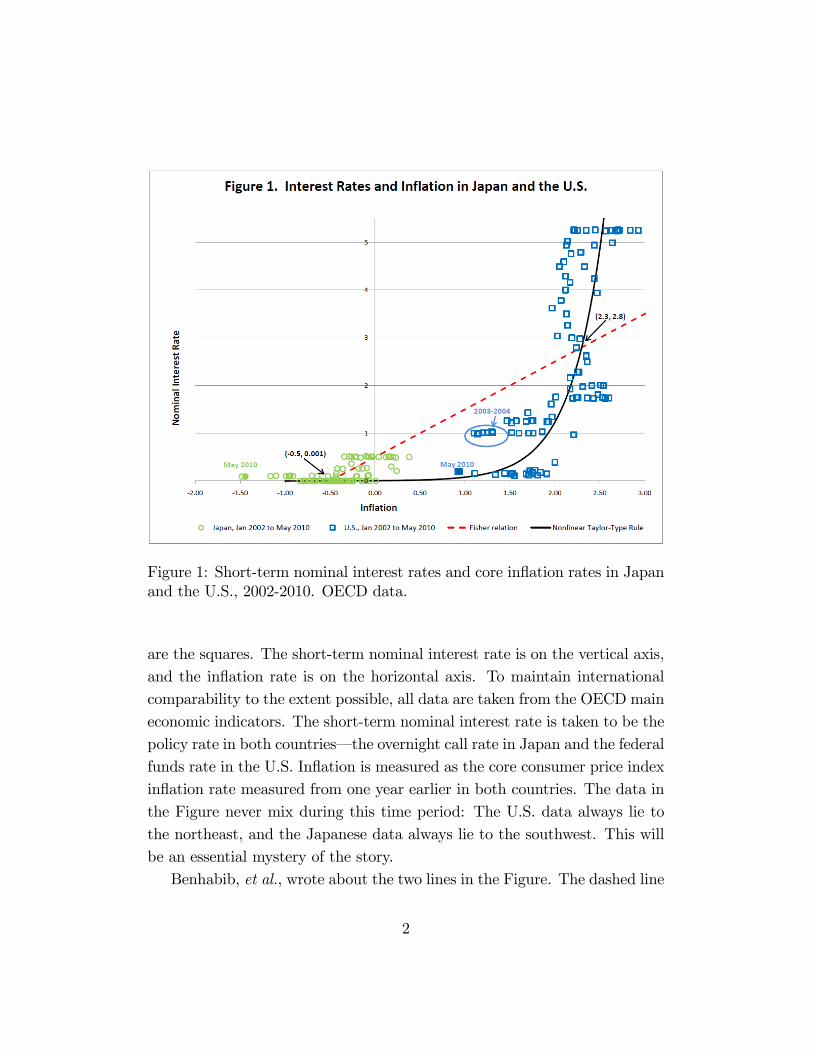
Figure 1: Short-term nominal interest rates and core in�ation rates in Japanand the U.S., 2002-2010. OECD data.
are the squares. The short-term nominal interest rate is on the vertical axis,and the in�ation rate is on the horizontal axis. To maintain internationalcomparability to the extent possible, all data are taken from the OECD maineconomic indicators. The short-term nominal interest rate is taken to be thepolicy rate in both countries� the overnight call rate in Japan and the federalfunds rate in the U.S. In�ation is measured as the core consumer price indexin�ation rate measured from one year earlier in both countries. The data inthe Figure never mix during this time period: The U.S. data always lie tothe northeast, and the Japanese data always lie to the southwest. This willbe an essential mystery of the story.Benhabib, et al., wrote about the two lines in the Figure. The dashed line
2
represents the famous Fisher relation for safe assets, the proposition that anominal interest rate has a real component plus an expected in�ation com-ponent. I have taken the real component (also the rate of time preference inthe original Benhabib et al. analysis) to be �xed and equal to 50 basis pointsin the Figure.2 Practically speaking, any macroeconomic model of monetaryphenomena is going to have a Fisher relation as a part of the analysis, andso this line is hardly controversial. The solid line in the Figure representsa Taylor-type policy rule: It describes how the short-term nominal interestrate is adjusted by policymakers in response to current in�ation. In the righthalf of the Figure, when in�ation is above target, the policy rate is increased,but more than one-for-one with the deviation of in�ation from target. Andwhen in�ation is below target, the policy rate is lowered, again more thanone-for-one. When the line describing the Taylor-type policy rule crossesthe Fisher relation, we say there is a steady state at which the policymakerno longer wishes to raise or lower the policy rate, and, simultaneously, theprivate sector expects the current rate of in�ation to prevail in the future.It is an equilibrium in the sense that, if there are no further shocks to theeconomy, nothing will change with respect to in�ation or the nominal inter-est rate. In the Figure as it is drawn, this occurs at an in�ation rate of 2.3percent and a nominal interest rate of 2.8 percent. This is sometimes calledthe �targeted�steady state.3
The �active�policy rule� the fact that nominal interest rates move morethan one-for-one with in�ation deviations in the right half of the Figure�is supposed to keep in�ation near the target. It also means that the linedescribing the Taylor-type policy rule is steeper than the line describing theFisher relation in the neighborhood of the targeted in�ation rate. It cuts theFisher relation from below. Taken at face value, the Taylor-type policy rule
2This is just for purposes of discussion� much of the formal analysis to which I referlater in the paper has stochastic features which would allow the real rate to �uctuate overtime. Generally speaking, short-term, real rates of return on safe assets in the U.S. havebeen very low during the postwar era.
3Steady states are considered focal points for the economy in macroeconomic theories�the economy �orbits�about the steady state in response to shocks.
3
has been fairly successful for the U.S.: In�ation (by this measure) has notbeen above three percent nor, until very recently, below one percent, duringthe January 2002 to May 2010 period.None of this so far is really the Benhabib, et al., story. In the right-hand
side of the Figure, short-term nominal interest rates are adjusted up anddown in order to keep in�ation low and stable. It�s all very conventional.The point of the Benhabib, et al., analysis is to think more carefully aboutwhat these seemingly innocuous assumptions� the Fisher relation, the activeTaylor-type rule, the zero bound on nominal interest rates� really imply aswe move to the left in the Figure, far away from the targeted steady stateequilibrium. And, what these building blocks imply is only one thing: Thetwo lines cross again, creating a second steady state. In the Figure as drawn,this second steady state occurs at an in�ation rate of �50 basis points, andan extremely low short-term nominal interest rate of about 1=10th of a basispoint.4 The Japanese in�ation data are all within about 100 basis pointsof this steady state, between �150 basis points and 50 basis points. That�sabout the same distance from low to high as the U.S. in�ation data. But forthe nominal interest rate, most of the Japanese observations are clusteredbetween 0 and 50 basis points. The policy rate cannot be lowered belowzero, and there is no reason to increase the policy rate since� well, in�ationis already �too low.�This logic seems to have kept Japan locked into the lownominal interest rate steady state. Benhabib, et al., sometimes call this the�unintended�steady state.5
At the unintended steady state, policy is no longer active: It has insteadswitched to being passive. The policy line crosses the Fisher relation fromabove. When in�ation decreases, the policy rate is not lowered more than
4This example is meant as an illustration only. The formula I used to plot the nonlinearTaylor-type policy rule is R = AeB� where R is the nominal interest rate, � is the in�ationrate, and A and B are parameters. I set A = 0:005015 and B = 2:75: Taylor-type policyrules also have an output gap component, and in the literature that issue is discussedextensively. For the possibility of a second steady state, it is the in�ation component thatis of paramount importance.
5I will discuss the social desirability of each of the two steady states brie�y in Section2.5 below.
4
one-for-one because of the zero lower bound. And when in�ation increases,the policy rate is not increased more than one-for-one because in this regionof the diagram, in�ation is well below target. Fluctuations in in�ation are infact not met with much of a policy response at all in the neighborhood of theunintended steady state. At this steady state, the private sector has come toexpect the rate of de�ation consistent with the Fisher relation accompaniedby very little policy response, and so nothing changes with respect to nominalinterest rates or in�ation. Where does policy transition from being active tobeing passive? That occurs when the slope of the nonlinear Taylor-type ruleis exactly one, which is at an in�ation rate of about 1:56 percent in Figure1.Again, the data in this Figure do not mix at all� it�s boxes on the right
and circles on the left. But the most recent observation for the U.S., the solidbox labelled �May 2010,� is about as close as the U.S. has been in recenttimes to the low nominal interest rate steady state. It is below the rateat which policy turns passive in the diagram. In addition, the FOMC haspledged to keep the policy rate low for an �extended period.�This pledge ismeant to push in�ation back toward target� certainly higher than where itis today� thus moving to the right in the Figure. Still, as the Figure makesclear, pledging to keep the policy rate near zero for such a long time wouldalso be consistent with the low nominal interest rate steady state in whichin�ation does not return to target but instead both actual and expectedin�ation turn negative and remain there. Furthermore, we have an exampleof an important economy which appears to be in just this situation.A key problem in the Figure is that the monetary policymaker only uses
nominal interest rate adjustment to implement policy. This is the meaningof the nonlinear Taylor-type policy rule continuing far to the left in the dia-gram. The policymaker is completely committed to interest rate adjustmentas the main tool of monetary policy, even long after it ceases to make sense(long after policy becomes passive), creating a second steady state for theeconomy. Many of the responses to this situation described below attemptto remedy this situation by recommending a switch to some other policy in
5
cases when in�ation is far below target. The regime switch required has to besharp and credible� policymakers have to commit to the new policy and theprivate sector has to believe the policymaker. Unfortunately, in actual policydiscussions nothing of this sort seems to be happening. Both policymakersand private sector players continue to communicate in terms of interest rateadjustment as the main tool for the implementation of monetary policy. Thisis increasing the risk of a Japanese-style outcome for the U.S.My view is that the Benhabib, et al., analysis is an important one for
current policy, that it has garnered insu¢ cient attention in the policy debate,and that it is indeed closely related to the current �extended period�pledge ofthe FOMC. Below I relate and critique seven stories concerning this analysisthat I have encountered, both formal ones and informal ones. The fact thatthere are seven faces shows how fragmented the economics profession is onthis critical issue. These stories range from reasons not to worry about theimplications of Figure 1, through ways to adjust nominal interest rates toavoid the implications of Figure 1, and on to the uses of unconventionalpolicies as a tool to avoid �the peril.�I conclude that promises to keep the policy rate near zero may be increas-
ing the risk of falling into the unintended steady state of Figure 1, and thatan appropriate quantitative easing policy o¤ers the best hope for avoidingsuch an outcome.
2 Seven faces
2.1 Denial
I think it is fair to say that for many that have been involved in centralbanking over the past two or three decades, it is di¢ cult to think of Japanand the U.S. in the same game, as Figure 1 suggests. For many, the situationin Japan since the 1990s has been a curiosum, an odd outcome that might bechalked up to particularly Byzantine Japanese politics, the lack of an in�ationtarget for the Bank of Japan (BOJ), a certain lack of political independencefor the BOJ, or to some other factor speci�c to the land of the rising sun.
6
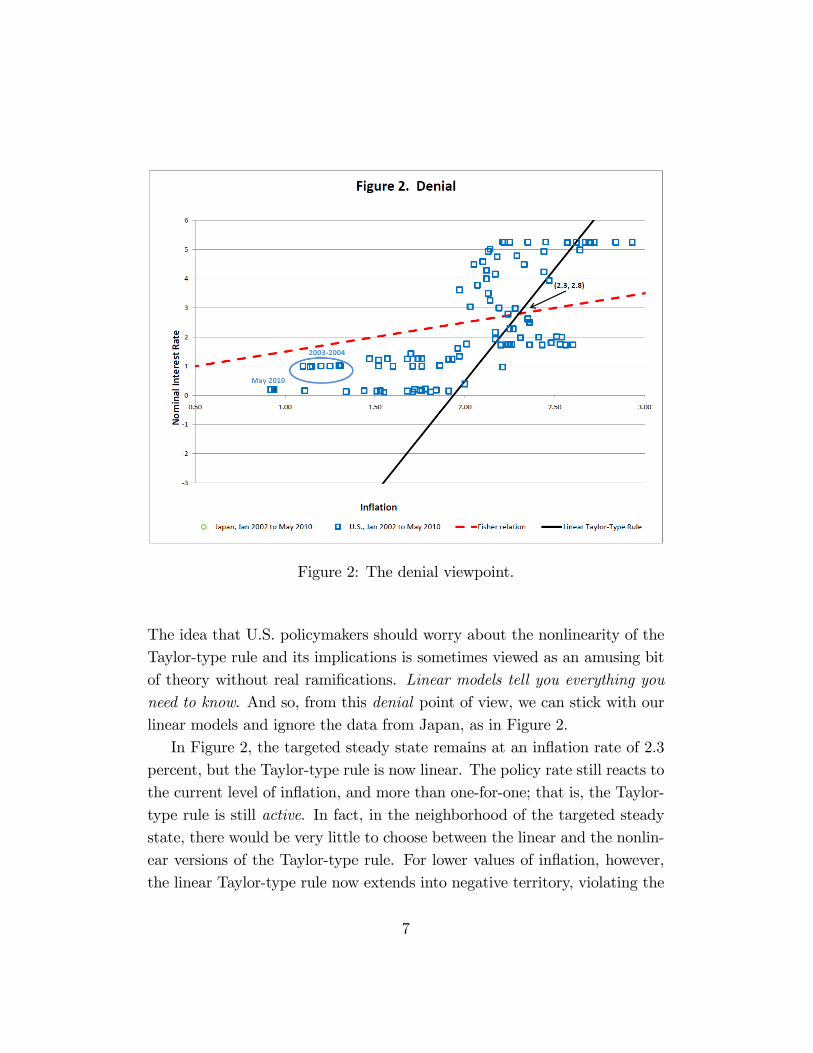
Figure 2: The denial viewpoint.
The idea that U.S. policymakers should worry about the nonlinearity of theTaylor-type rule and its implications is sometimes viewed as an amusing bitof theory without real rami�cations. Linear models tell you everything youneed to know. And so, from this denial point of view, we can stick with ourlinear models and ignore the data from Japan, as in Figure 2.In Figure 2, the targeted steady state remains at an in�ation rate of 2.3
percent, but the Taylor-type rule is now linear. The policy rate still reacts tothe current level of in�ation, and more than one-for-one; that is, the Taylor-type rule is still active. In fact, in the neighborhood of the targeted steadystate, there would be very little to choose between the linear and the nonlin-ear versions of the Taylor-type rule. For lower values of in�ation, however,the linear Taylor-type rule now extends into negative territory, violating the
7
zero bound on nominal interest rates. Some contemporary discussion of mon-etary policy pines for a negative policy rate exactly as pictured here. Oneoften hears that, given the state of today�s economy, the desired policy ratewould be, say, �6:0 percent, as suggested by the chart. This is nonsensical,since under current operating procedures such a policy rate is infeasible andtherefore we cannot know how the economy would behave with such a policyrate.6
The most disturbing part of Figure 2, however, is that the Japanese dataare not part of the picture. This tempts one to argue that, since currentlycore in�ation is below target, there is little harm in keeping the policy ratenear zero, and indeed in promising to keep the policy rate near zero in thefuture. There is no danger to such a policy according to Figure 2. There isa sort of faith that the economy will naturally return to the targeted steadystate, since that is the only long run equilibrium outcome for the economythat is part of the analysis.
2.2 Stability
There is another version of the denial view that is somewhat less extreme,but that is nevertheless another form of denial in the end. It is a view thatI have been associated with in my own research. In this view, one acceptsthe zero bound on nominal interest rates, and also the other details of theBenhabib, et al., analysis. One accepts that there are two steady states.However, the steady states have stability properties associated with them ina fully dynamic analysis, and the argument is that the targeted steady stateis the stable one, while the unintended, low nominal interest rate steadystate is unstable. Therefore, according to this argument, one should expect
6Over the years, some discussion in monetary theory has contemplated currency taxesas a means of obtaining negative nominal rates, but that is a radical proposal not oftenpart of the �negative rates�discussion. See N. Gregory Mankiw, �It May Be Time for theFed to Go Negative,�The New York Times, April 18, 2009. Interestingly, even negativerates would not avoid the multiple equilibria problem� see for instance Stephanie Schmitt-Grohé and Martín Uribe, 2009, �Liquidity Traps with Global Taylor Rules,�InternationalJournal of Economic Theory 5: 85-106.
8
to observe the economy in the neighborhood of the targeted steady state,and need not worry about the unintended, low nominal interest rate steadystate.The original Benhabib, et al., analysis was much more than what I have
described in Figure 1. The Figure just outlines the big picture. Benhabib,et al., in fact wrote down complete DSGE economies7 and analyzed thedynamics of those systems in a series of papers. In the original analysis, the2001 paper, they endowed both the central bank and the private sector inthe model with rational expectations. They then showed that it was possiblefor the economy to begin in the neighborhood of the targeted steady stateand follow an equilibrium path to the unintended, low nominal interest ratesteady state. These dynamics in fact spiralled out from the targeted steadystate.I did not �nd this story very compelling, both because the dynamics
described seem unrealistic� they imply a volatile sequence of interest ratesand in�ation rates followed by sudden arrival at the low nominal interest ratesteady state� and also because they place heavy reliance on the foresight ofthe players in the economy concerning this volatile sequence.A paper published in 2007 by Stefano Eusepi, now at the Federal Reserve
Bank of New York, addressed some of these concerns.8 Eusepi accepted thenonlinear nature of Figure 1 with its two steady states. He also backed o¤the rational expectations assumption that characterized the Benhabib, et al.,analysis. Instead he assumed that the actors in the model might learn overtime in a speci�c way by considering the data produced by the economyitself.9
One key result in the Eusepi paper was the following. If the monetaryauthority, with its nonlinear Taylor-type policy rule, reacts to in�ation oneperiod in the past (as perhaps one might expect of many central banks), then
7That is, dynamic, stochastic, general equilibrium economies.8Stefano Eusepi, 2007, �Learnability and Monetary Policy: A Global Perspective,�
Journal of Monetary Economics 54(4): 1115-1131.9See George Evans and Seppo Honkapohja, 2001, Learning and Expectations in Macro-
economics, Princeton University Press.
9

the only possible long-run outcome for the economy is the targeted steadystate. I found this comforting. It suggests that one need not worry about theunintended steady state, and that exclusive focus on the targeted steady stateis warranted. To be sure, a careful reading of the Eusepi paper reveals thatmany other dynamic paths are also possible, including some that converge tothe unintended steady state. Still, one might hope that the targeted steadystate is somehow the stable one, and that for this reason one can sleep betterat night.I said this is a form of denial. First, as fascinating as they are, the results
are not that clean, as many dynamics are possible depending on details of themodel. It is hard to know how these details truly map into actual economies.But more importantly, Figure 1 suggests that at least one large economy hasin fact converged to the unintended steady state. The stability argumentcannot cope with this datum, unless one is willing to say that conditions aresubtly di¤erent in Japan as compared to the U.S., producing convergence tothe unintended steady state in Japan but convergence to the targeted steadystate in the U.S. I have not seen a compelling version of this argument. Iconclude that the stability argument is actually a form of denial in the end.10
2.3 FOMC, 2003
In Figure 1, there is a set of data points which are circled. These data arelabelled �2003-2004�and are associated with a policy rate at 1:0 percent andthe in�ation rate between 1:0 and 1:5 percent. This episode was the last timethe FOMC worried about a possible bout of de�ation. While core in�ationdid move to a low level during this period� not quite as low as the currentlevel� in�ation moved higher later and interest rates were increased. Thisepisode surely provides comfort for those who that think the Japanese-styleoutcome is unlikely. It suggests that the economy will ultimately return to
10For an argument that under learning, the targeted steady state is locally but notglobally stable, see George Evans, Eran Guse, and Seppo Honkapohja, 2008, �LiquidityTraps, Learning, and Stagnation,�European Economic Review 52(8): 1438-1463. In theirpaper, the downside risk is much more severe, as under learning the economy can fall intoa de�ationary spiral in which output contracts sharply.
10
the neighborhood of the targeted steady state, perhaps even indicating thatthe stability story is the right one after all. The 2003 experience did notinvolve a near-zero policy rate, however.One description of this period is due to Daniel Thornton, here at the Fed-
eral Reserve Bank of St. Louis.11 The Thornton analysis emphasizes how theFOMC communicated during this period, and how the market expectationsof the longer-term in�ation rate responded to the communications. At thetime, some measures of in�ation were hovering close to one percent, simi-lar to the most recent readings for core in�ation in 2010. At its May 2003meeting, the Committee included the following press release language: �...the probability of an unwelcome substantial fall in in�ation, though minor,exceeds that of a pickup in in�ation from its already low level.�At severalsubsequent 2003 meetings the FOMC stated that �... the risk of in�ationbecoming undesirably low is likely to be the predominant concern for theforeseeable future.�By the beginning of 2004, in�ation had picked up andFOMC references to undesirably low in�ation ceased. Thornton shows thatthe longer-run expected in�ation rate, as measured from the 10-year Trea-sury in�ation-indexed security spread, was 1:74 percent during the periodfrom January 2001 through April 2003, before any of these statements weremade. After the statements, from January 2004 to May 2006, the longer-runin�ation expectation averaged 2:5 percent. Thornton interprets the FOMClanguage as putting a lower bound on the Committee�s implicit in�ation tar-get range. This had the e¤ect of increasing the longer-run expected rate ofin�ation.Figure 3 shows how this type of a change in longer-run in�ation expecta-
tions might play out. Accepting the other premises of the Benhabib, et al.,analysis, the private sector now views the central bank as only taking actionto contain in�ation once in�ation has attained a somewhat higher level. Theprivate sector thought they understood policy as the solid black line, but
11Daniel Thornton, 2006, �The Fed�s In�ation Objective,�Federal Reserve Bank of St.Louis Monetary Trends, July. See also Daniel Thornton, 2007, �The Lower and UpperBounds of the Federal Open Market Committee�s Long-Run In�ation Objective,�FederalReserve Bank of St. Louis Review 89(3): 183-193.
11

Figure 3: The 2003-2004 episode. Thornton (2006, 2007) argues that FOMCcommunications increased the perceived in�ation target of the Committee.
after the FOMC communication, they understood policy as the dashed blackline. This alters the targeted steady state in�ation rate of the economy from1:75 percent to 2:5 percent.It is not immediately obvious from Figure 3 why this should have a desir-
able impact on the question of whether the economy ultimately returns to theneighborhood of the targeted steady state or converges to the unintended,low nominal interest rate steady state. Credibly raising the in�ation targetis actually moving the target steady state equilibrium to the right in thediagram, further away from the circled data from 2003 and 2004. One mightthink that creating more distance from the current position to the desiredoutcome would not be helpful.
12
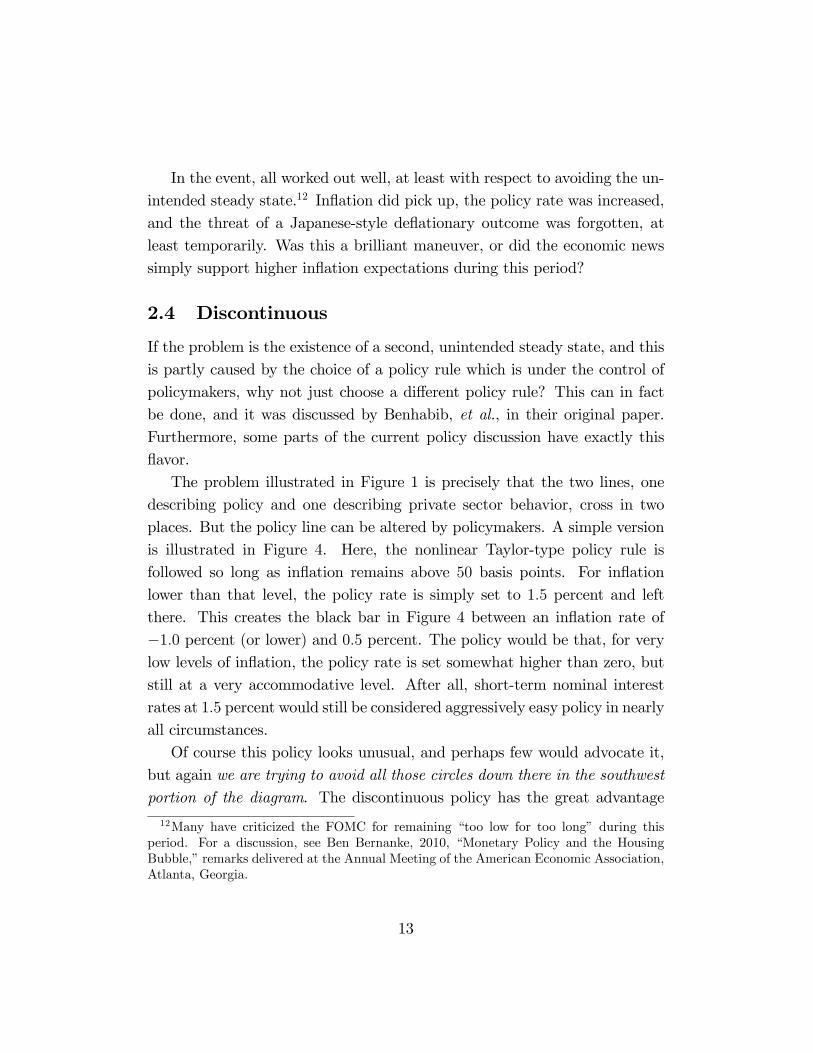
In the event, all worked out well, at least with respect to avoiding the un-intended steady state.12 In�ation did pick up, the policy rate was increased,and the threat of a Japanese-style de�ationary outcome was forgotten, atleast temporarily. Was this a brilliant maneuver, or did the economic newssimply support higher in�ation expectations during this period?
2.4 Discontinuous
If the problem is the existence of a second, unintended steady state, and thisis partly caused by the choice of a policy rule which is under the control ofpolicymakers, why not just choose a di¤erent policy rule? This can in factbe done, and it was discussed by Benhabib, et al., in their original paper.Furthermore, some parts of the current policy discussion have exactly this�avor.The problem illustrated in Figure 1 is precisely that the two lines, one
describing policy and one describing private sector behavior, cross in twoplaces. But the policy line can be altered by policymakers. A simple versionis illustrated in Figure 4. Here, the nonlinear Taylor-type policy rule isfollowed so long as in�ation remains above 50 basis points. For in�ationlower than that level, the policy rate is simply set to 1:5 percent and leftthere. This creates the black bar in Figure 4 between an in�ation rate of�1:0 percent (or lower) and 0:5 percent. The policy would be that, for verylow levels of in�ation, the policy rate is set somewhat higher than zero, butstill at a very accommodative level. After all, short-term nominal interestrates at 1:5 percent would still be considered aggressively easy policy in nearlyall circumstances.Of course this policy looks unusual, and perhaps few would advocate it,
but again we are trying to avoid all those circles down there in the southwestportion of the diagram. The discontinuous policy has the great advantage
12Many have criticized the FOMC for remaining �too low for too long� during thisperiod. For a discussion, see Ben Bernanke, 2010, �Monetary Policy and the HousingBubble,�remarks delivered at the Annual Meeting of the American Economic Association,Atlanta, Georgia.
13
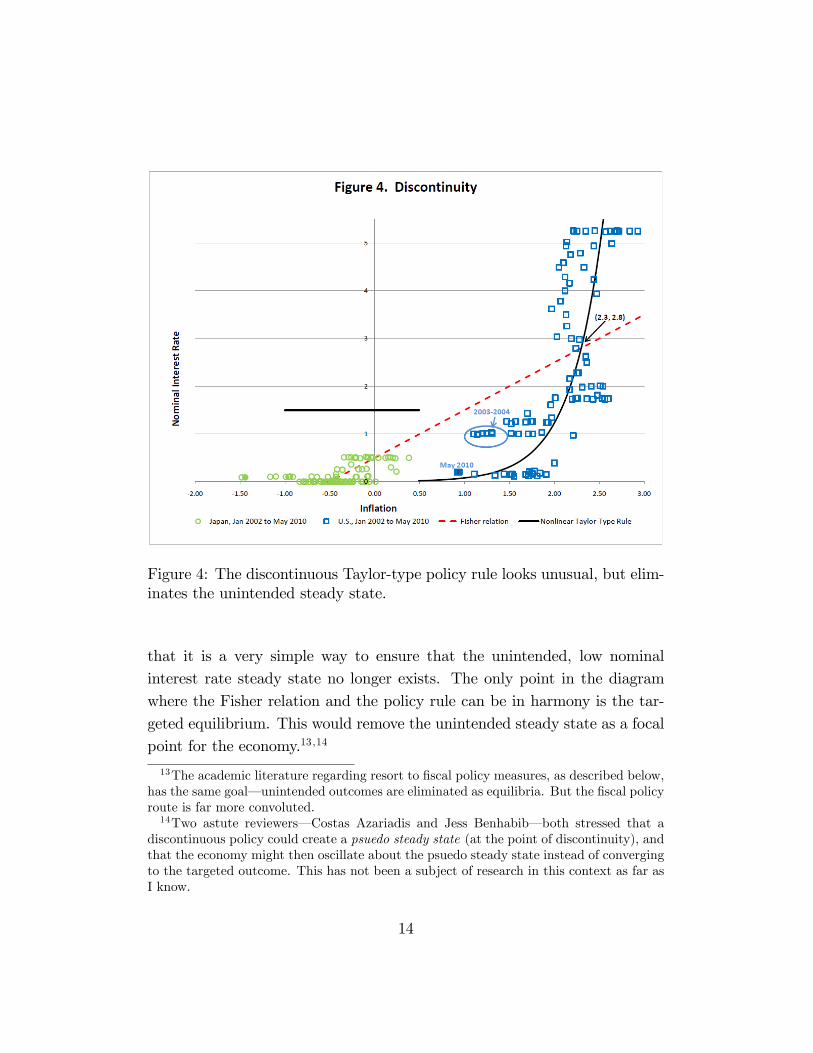
Figure 4: The discontinuous Taylor-type policy rule looks unusual, but elim-inates the unintended steady state.
that it is a very simple way to ensure that the unintended, low nominalinterest rate steady state no longer exists. The only point in the diagramwhere the Fisher relation and the policy rule can be in harmony is the tar-geted equilibrium. This would remove the unintended steady state as a focalpoint for the economy.13 ;14
13The academic literature regarding resort to �scal policy measures, as described below,has the same goal� unintended outcomes are eliminated as equilibria. But the �scal policyroute is far more convoluted.14Two astute reviewers� Costas Azariadis and Jess Benhabib� both stressed that a
discontinuous policy could create a psuedo steady state (at the point of discontinuity), andthat the economy might then oscillate about the psuedo steady state instead of convergingto the targeted outcome. This has not been a subject of research in this context as far asI know.
14
Some of the current policy discussion has mulled an approach of this type,although not exactly in this context. The FOMC�s near-zero interest ratepolicy and the associated �extended period� language has caused many toworry that the Committee is fostering the creation of new, bubble-like phe-nomena in the economy which will eventually prove to be counterproductive.One antidote to this worry may be to increase the policy rate somewhat,while still keeping the rate at a historically low level, and then to pause atthat level.15 That policy would have a similar �avor to the one suggested inFigure 4, although for a di¤erent purpose.
2.5 Traditional
According to the Bank of England,16 for 314 years the policy rate was neverallowed to fall below 2:0 percent. During more than three centuries theeconomy was subject to large shocks, wars, �nancial crises and a greatdepression� yet 2:0 percent was the policy rate �oor until very recently. Aversion of this policy is displayed in Figure 5. This policy rule does not elim-inate the unintended steady state, it simply moves it to be associated with ahigher level of in�ation. In the Figure, this point occurs at an interest rateof 2:0 percent and an in�ation rate of 1:5 percent. This policy seems veryreasonable in some ways. To the extent that one of the main purposes of theinterest rate policy is to keep in�ation low and stable, this policy creates twosteady states, but the policymaker may be more or less indi¤erent betweenthe two outcomes. Then one has to worry much less about the possibility ofbecoming permanently trapped in an unintended, de�ationary steady state.This policy prevents the onset of interest rates which are �too low.�The idea that policymakers might be more or less indi¤erent between
the two steady states brings up an important question about the Benhabib,et al., analysis. Why should one steady state equilibrium be preferred over
15My colleague Thomas Hoenig, President of the Federal Reserve Bank of Kansas City,has advocated such a policy. See his speech, �The High Cost of Exceptionally Low Rates,�Bartlesville Federal Reserve Forum, Bartlesville, Oklahoma, June 3, 2010.16See: http://www.bankofengland.co.uk/statistics/rates/baserate.xls for historical data
since 1694 on the o¢ cial Bank of England policy rate.
15
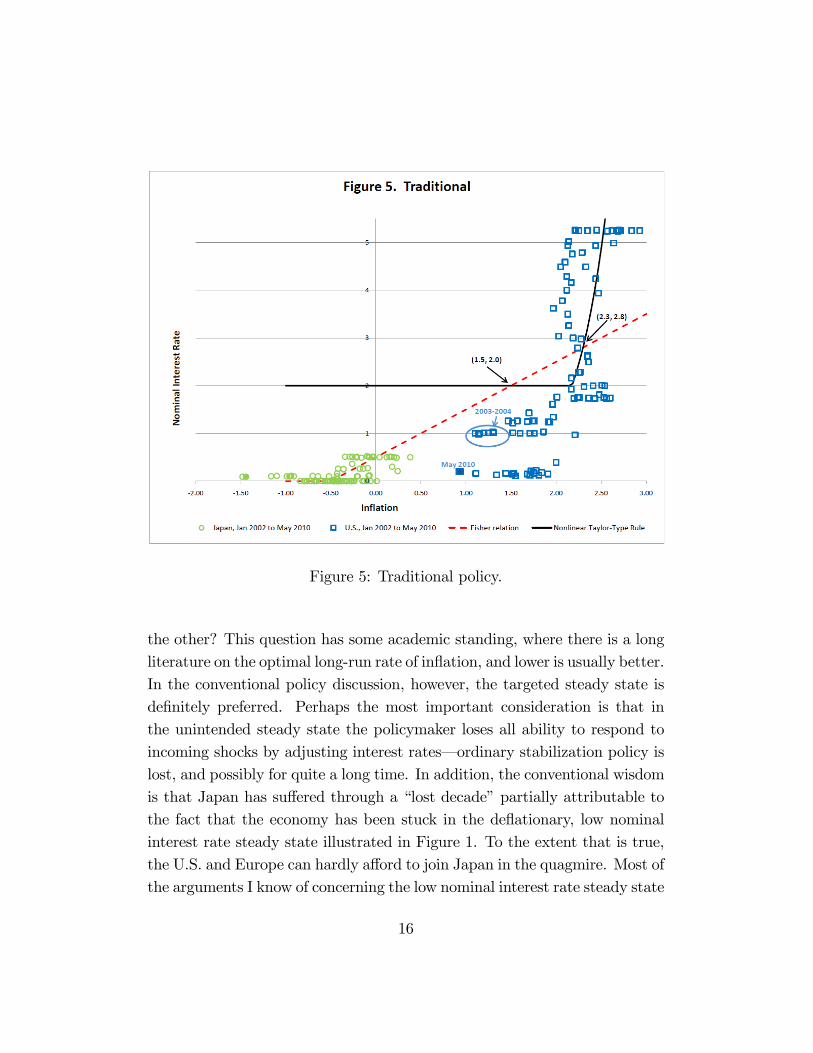
Figure 5: Traditional policy.
the other? This question has some academic standing, where there is a longliterature on the optimal long-run rate of in�ation, and lower is usually better.In the conventional policy discussion, however, the targeted steady state isde�nitely preferred. Perhaps the most important consideration is that inthe unintended steady state the policymaker loses all ability to respond toincoming shocks by adjusting interest rates� ordinary stabilization policy islost, and possibly for quite a long time. In addition, the conventional wisdomis that Japan has su¤ered through a �lost decade�partially attributable tothe fact that the economy has been stuck in the de�ationary, low nominalinterest rate steady state illustrated in Figure 1. To the extent that is true,the U.S. and Europe can hardly a¤ord to join Japan in the quagmire. Most ofthe arguments I know of concerning the low nominal interest rate steady state
16
center around the idea that de�ation, even mild de�ation, is undesirable. Itis widely perceived that problems in the U.S. �nancial system are at the coreof the current crisis. Given that many �nancial contracts (and in particularmortgages) are stated in nominal terms, and given that these contracts wherewritten in the past (under the expectation of a stable in�ation around 2:0percent), it is conceivable to think that de�ation could hurt the �nancialsystem and hamper US growth.17
If we suppose that de�ation is the main problem, then this could likely beavoided by simply not adopting a rule that calls for very low� near-zero�interest rates. Instead, the rule could call for rates to bottom out at a levelsomewhat higher than zero, as the traditional policy rule does. Of course, apolicy rule like the one depicted in Figure 5 does not allow as much policyaccommodation in the face of shocks to the economy at the margin. But isit worth risking a �lost decade�to get the extra bit of accommodation?
2.6 Fiscal intervention given the situation in Europe
In the academic literature following the 2001 publication of the perils pa-per, some attempt was made to provide policy advice on how to avoid theunintended steady state of Figure 1.18 This advice was given in the contextof trying to preserve the desirable qualities of the Taylor-type interest raterule in the neighborhood of the targeted steady state. That is, even thoughinterest rate rules are the problem here, the advice is given in the context of
17Some have argued that ongoing de�ation in Japan is not an important contributoryfactor for the nation�s relatively slow growth. See, for instance, Fumio Hayashi and EdwardC. Prescott, 2002, �The 1990s in Japan: A Lost Decade,�Review of Economic Dynamics5(1): 206-235. In addition, the U.S. grew rapidly in the late 19th century despite anongoing de�ation. So, the relationship between de�ation and longer-run growth is notas obvious as some make it seem. Still, the conventional wisdom is that a turn towardde�ation would hamper U.S. growth.18See, in particular, Jess Benhabib, Stephanie Schmitt-Grohé, and Martín Uribe, 2002,
�Avoiding Liquidity Traps,�Journal of Political Economy 110: 535-563; Michael Wood-ford, 2001, �Fiscal Requirements for Price Stability,�Journal of Money, Credit and Bank-ing 33: 669-728; Michael Woodford, 2003, Interest and Prices, Princeton University Press;and Gauti Eggertsson and Michael Woodford, 2003, �The Zero Bound on Interest Ratesand Optimal Monetary Policy,�Brookings Papers on Economic Activity 1: 139-211.
17
not simply abandoning interest rate rules altogether.The advice has a certain structure. It involves not changes to the way
monetary policy is implemented, but changes in the �scal stance of the gov-ernment. By itself, this makes the practicality of the solution much morequestionable. But it gets worse. The proposal is for the government to em-bark on an aggressive �scal expansion in the event that the economy becomesenmeshed in a low nominal interest rate equilibrium. The �scal expansionhas the property that total government liabilities, money plus governmentdebt, grow at a su¢ ciently fast rate. Inside the model, such a �scal expan-sion eliminates the unintended steady state as an equilibrium outcome. Bythis roundabout method, then, the only remaining longer-run outcome forthe economy is to remain in the neighborhood of the targeted steady state.The described solution has the following �avor: The government threat-
ens to behave unreasonably if the private sector holds expectations (such asexpectations of very low in�ation) that the government does not desire. Thisthreat, if it is credible, eliminates the undesirable equilibrium. Some authorshave criticized this type of solution to problems with multiple equilibria as�unsophisticated implementation.�19
Today, especially considering the ongoing European sovereign debt crisis,these proposed solutions strike me as wildly at odds with the realities ofthe global economy. The proposal might work in a model setting, but thepracticalities of getting a government to essentially threaten insolvency� andbe believed� seem to rely far too heavily on the rational expectations of theprivate sector.20 Furthermore, governments that attempt such a policy inreality are surely playing with �re. The history of economic performance fornations actually teetering on the brink of insolvency is terrible. This doesnot seem like a good tool to use to combat the possibility of a low nominalinterest rate steady state.Beyond these considerations, it is questionable at this point whether such
19See Andrew Atkeson, V.V. Chari, and Patrick Kehoe, 2010, �Sophisticated MonetaryPolicies,�Quarterly Journal of Economics 125(1): 47-89.20For a version that backs o¤ the rational expectations assumption, but still eliminates
the undesirable equilibrium, see George Evans, Eran Guse, and Seppo Honkapohja (2008).
18
a policy actually works. Japan, our leading example in this story, has in factembarked on an aggressive �scal expansion, and the debt-to-GDP ratio thereis now approaching 200 percent. Still, there does not appear to be any signthat the economy is about to leave the low nominal interest rate steady state,and now policymakers are worried enough about the international reactionto their situation that �scal retrenchment is being seriously debated.
2.7 Quantitative easing
The quantitative easing policy undertaken by the FOMC in 2009 has gener-ally been regarded as successful in the sense that longer-term interest ratesfell following the announcement and implementation of the program.21 Sim-ilar assessments apply to the Bank of England�s quantitative easing policy.For the U.K. in particular, both expected in�ation and actual in�ation haveremained higher to date, and for that reason the U.K. seems less threatenedby a de�ationary trap. The U.K. quantitative easing program has a morestate-contingent character than the U.S. program. The U.S. approach was tosimply announce a large amount of purchases, but not to adjust the amountsor pace of purchases according to changing assessments of macroeconomicprospects.The quantitative easing program, to the extent it involves buying longer-
dated government debt, has often been described as �monetizing the debt.�This is widely considered to be in�ationary, and so in�ation expectationsare sensitive to such purchases. In the U.K., all the purchases were of gilts(Treasury debt). In the U.S., most of the purchases were of agency� FannieMae and Freddie Mac� mortgage-backed securities, newly-issued in 2009. Ithas been harder to judge the in�ationary e¤ects of these purchases, and soperhaps the e¤ects on in�ation expectations and hence actual in�ation havebeen somewhat less reliable in the U.S. than in the U.K.The experience in the U.K. seems to suggest that appropriately state-
21See, for instance, Christopher Neely, 2010, �The Large Scale Asset Purchases HadLarge International E¤ects,�Federal Reserve Bank of St. Louis Working Paper #2010-018.
19
contingent purchases of Treasury securities are a good tool to use when in-�ation and in�ation expectations are �too low.�Not that one would want tooverdo it, mind you, as such measures should only be undertaken in an e¤ortto move in�ation closer to target. One very important consideration is theextent to which such purchases are seen by the private sector to be temporaryor permanent. We can double the monetary base one day, and return to theprevious level the next day, and we should not expect such movements tohave important implications for the price level in the economy. Base moneycan be removed from the banking system as easily as it can be added, soprivate sector expectations may remain unmoved by even large additions ofbase money to the banking system.22 In the Japanese quantitative easingprogram, beginning in 2001, the BOJ was unable to gain credibility for theidea that they were prepared to leave the balance sheet expansion in placeuntil policy objectives were met. And in the end, the BOJ in fact did with-draw the program without having successfully pushed in�ation and in�ationexpectations higher, validating the private sector expectation. The U.S. andthe U.K. have enjoyed more success, perhaps because private sector actorsare more enamored with the idea that the FOMC and the U.K.�s MonetaryPolicy Committee will do �whatever it takes�to avoid particularly unpleas-ant outcomes for the economy.
3 Conclusion
The global economy continues to recover from the very sharp recession of 2008and 2009. During the recovery, the U.S. economy is susceptible to negativeshocks which may dampen in�ation expectations. This could possibly pushthe economy into an unintended, low nominal interest rate steady state.Escape from such an outcome is problematic. Of course, we can hope that
22For discussions of how forms of quantitative easing can help achieve the intendedsteady state, in combination with appropriate �scal policy, see Gauti Eggertsson andMichael Woodford (2003, pp. 194-198), as well as George Evans and Seppo Honkapohja,2005, �Policy Interaction, Expectations and the Liquidity Trap,� Review of EconomicDynamics 8: 303-323.
20
we do not encounter such shocks, and that further recovery turns out to berobust� but hope is not a strategy. The U.S. is closer to a Japanese-styleoutcome today than at any time in recent history.In part, this uncomfortably close circumstance is due to the interest rate
policy being pursued by the FOMC. That policy is to keep the current pol-icy rate close to zero, but in addition to promise to maintain the near-zerointerest rate policy for an �extended period.�But it is even more than that,because the reaction to a negative shock in the current environment is toextend the extended period even further� delay the day of normalizationof the policy rate farther into the future. This certainly seems to be theimplication from recent events. When the European sovereign debt crisisrattled global �nancial markets during the spring of 2010, it was a negativeshock to the global economy, and the private sector perception was certainlythat this would delay the date of U.S. policy rate normalization. One mightthink that is a more in�ationary policy, but TIPS-based measures of in�ationexpectations over �ve and ten years fell about 50 basis points.Promising to remain at zero for a long time is a double-edged sword. The
policy is consistent with the idea that in�ation and in�ation expectationsshould rise in response to the promise, and that this will eventually lead theeconomy back toward the targeted equilibrium of Figure 1. But the policyis also consistent with the idea that in�ation and in�ation expectations willinstead fall, and that the economy will settle in the neighborhood of theunintended steady state, as Japan has in recent years.23
To avoid this outcome for the U.S., policymakers can react di¤erently tonegative shocks going forward. Under current policy in the U.S., the reactionto a negative shock is perceived to be a promise to stay low for longer,which may be counterproductive because it may encourage a permanent,low nominal interest rate outcome. A better policy response to a negative
23George Evans and Seppo Honkapohja have made a version of this argument moreformally. See their forthcoming paper, �Expectations, De�ation Traps and MacroeconomicPolicy,�in David Cobham, ?yvind Eitrheim, Stefan Gerlach, and Jan F. Qvigstad, editors,Twenty Years of In�ation Targeting: Lessons Learned and Future Prospects, CambridgeUniversity Press, Chapter 11, pp. 232-260.
21
shock is to expand the quantitative easing program through the purchase ofTreasury securities.
References
[1] Atkeson, A., V.V. Chari, and P. Kehoe. 2010. �Sophisticated MonetaryPolicies.�Quarterly Journal of Economics 125(1): 47-89.
[2] Benhabib, J., S. Schmitt-Grohé, and M. Uribe. 2001. �The Perils ofTaylor Rules.�Journal of Economic Theory 96(1-2): 40-69.
[3] Benhabib, J., S. Schmitt-Grohé, and M. Uribe. 2002. �Avoiding Liquid-ity Traps.�Journal of Political Economy 110: 535-563.
[4] Bernanke, B. 2010. �Monetary Policy and the Housing Bubble.� Re-marks delivered at the Annual Meeting of the American Economic As-sociation, Atlanta, Georgia, January 3rd.
[5] Eggertsson, G., and M. Woodford. 2003. �The Zero Bound on InterestRates and Optimal Monetary Policy.�Brookings Papers on EconomicActivity 1: 139-211.
[6] Eusepi, S. 2007. �Learnability and Monetary Policy: A Global Perspec-tive.�Journal of Monetary Economics 54(4): 1115-1131.
[7] Evans, G., E. Guse, and S. Honkapohja. 2008. �Liquidity Traps, Learn-ing, and Stagnation.�European Economic Review 52(8): 1438-1463.
[8] Evans, G., and S. Honkapohja. Forthcoming. �Expectations, De�ationTraps and Macroeconomic Policy,�in David Cobham, ?yvind Eitrheim,Stefan Gerlach, and Jan F. Qvigstad, editors, Twenty Years of In�ationTargeting: Lessons Learned and Future Prospects, Cambridge UniversityPress, Chapter 11, pp. 232-260.
[9] Evans, G., and S. Honkapohja. 2005. �Policy Interaction, Expectationsand the Liquidity Trap.�Review of Economic Dynamics 8: 303-323.
22
[10] Evans, G., and S. Honkapohja. 2001. Learning and Expectations inMacroeconomics. Princeton University Press.
[11] Hayashi, F., and E.C. Prescott. 2002. �The 1990s in Japan: A LostDecade.�Review of Economic Dynamics 5(1): 206-235.
[12] Hoenig, T. 2010. �The High Cost of Exceptionally Low Rates.�Remarksdelivered at the Bartlesville Federal Reserve Forum, Bartlesville, Okla-homa, June 3rd.
[13] Mankiw, N.G., 2009. �It May Be Time for the Fed to Go Negative,�TheNew York Times, April 18th.
[14] Neely, C. 2010. �The Large Scale Asset Purchase Purchases Had LargeInternational E¤ects.�Federal Reserve Bank of St. Louis Working Paper#2010-18.
[15] Schmitt-Grohé, S., and M. Uribe. 2009. �Liquidity Traps with GlobalTaylor Rules.�International Journal of Economic Theory 5: 85-106.
[16] Thornton, D. 2006. �The Fed�s In�ation Objective.�Monetary Trends,July, Federal Reserve Bank of St. Louis.
[17] Thornton, D. 2007. �The Lower and Upper Bounds of the Federal OpenMarket Committee�s Long-Run In�ation Objective.� Federal ReserveBank of St. Louis Review 89(3): 183-193.
[18] Woodford, M. 2001. �Fiscal Requirements for Price Stability.�Journalof Money, Credit and Banking 33: 669-728.
[19] Woodford, M. 2003. Interest and Prices. Princeton University Press.
23