[email protected] Managing Director Endesa Tradingendesa.es Managing Director Endesa Trading March...
37
Investment in gas-fired generation Juan J Alba [email protected] Managing Director Endesa Trading March 25th, 2003 IEA/NEA Workshop on Power generation investment in liberalised electricity markets
Transcript of [email protected] Managing Director Endesa Tradingendesa.es Managing Director Endesa Trading March...

Investment in gas-fired generation
Juan J [email protected] DirectorEndesa Trading
March 25th, 2003IEA/NEA Workshop on Power generation investment in liberalised electricity markets

2
Contents
• The CCGT: the response for generation capacity needs
• Electricity: market, risks, regulation
• Gas: the market environment
• Are markets signals adequate for investment?
• Some final thoughts
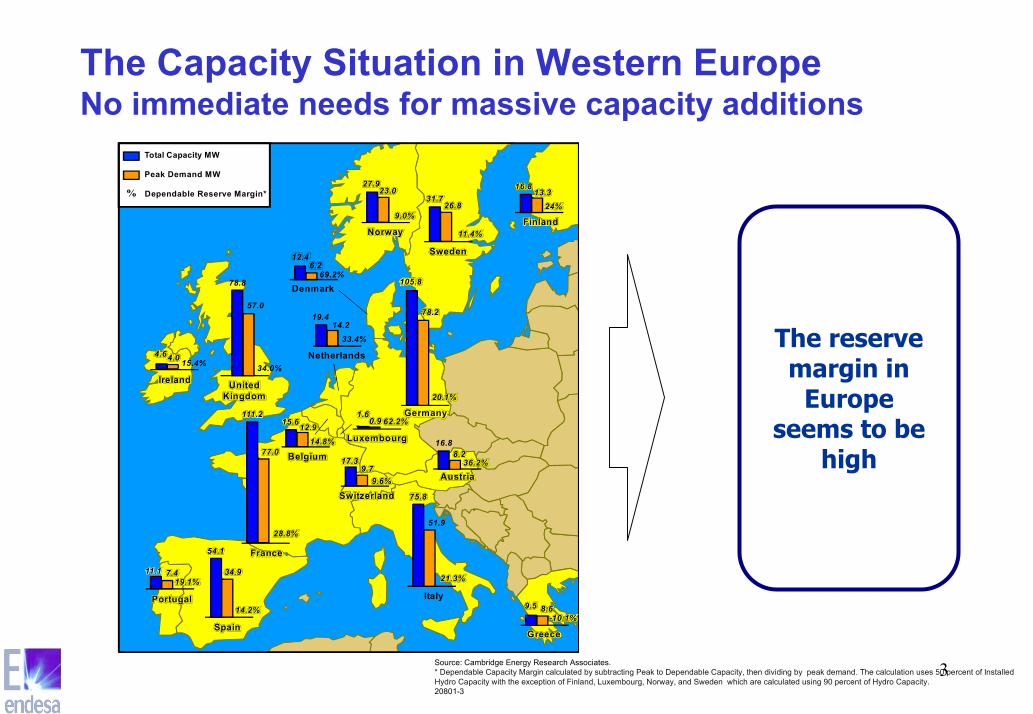
3Source: Cambridge Energy Research Associates.* Dependable Capacity Margin calculated by subtracting Peak to Dependable Capacity, then dividing by peak demand. The calculation uses 50 percent of InstalledHydro Capacity with the exception of Finland, Luxembourg, Norway, and Sweden which are calculated using 90 percent of Hydro Capacity.20801-3
Total Capacity MW
Peak Demand MW
Dependable Reserve Margin*%
France
111.2
77.0
28.8%
Belgium14.8%
12.915.6Germany
105.8
78.2
20.1%
Netherlands
33.4%14.2
19.4
Luxembourg
1.60.9 62.2%
Portugal
19.1%7.411.1
Spain
54.1
Italy
21.3%
51.9
75.8
Greece
-10.1%8.69.5
Austria
8.236.2%
Switzerland9.6%
9.717.3
14.2%
34.9
16.8
Sweden
31.726.8
11.4%Finland
24%13.3
16.8
Norway
9.0%
23.027.9
Denmark
12.46.269.2%
UnitedKingdom
34.0%
57.0
78.8
Ireland
4.64.0 15.4%
The reservemargin in
Europeseems to be
high
The Capacity Situation in Western EuropeNo immediate needs for massive capacity additions

4
Reserve Margin140%
134%
126%
120%
114%
101%
105%
106%
1996 1997 1998 1999 2000 2001 2002 2003
Peak Dem and 37.350 MW (14/01/03); 18:57 h)
Capacity Insta lled Dependable
Nuclear 7.888 7.092
Coa l 11.565 9.851
Fue l-Gas 7.594 5.024
CCGT 3.032 1.518 * *
Hydro (Conv) 13.918 8.100 *
Hydro (Pum p) 2.788 1.940
Eolic 4.830 175
Others (cogen & renew ) 6.874 4.130
T ota l 58.489 37.830
Reserve Margin 1,3%
(* ) Last 5 years average
(* * ) Capacity reduced due to natura l gas
constra ints
Reserve M arg in in stress scenario
The situation is not uniformReserve margin evolution in Spain

5
Hydro
Classic
Nuclear
0
20
40
60
80
100
120
140
Hydro
Classic
Nuclear
Hydro
Classic
Nuclear
0
20
40
60
80
100
120
140
Hydro
Classic
Nuclear
Hydro
Classic
Nuclear
0
20
40
60
80
100
120
140
Hydro
Classic
Nuclear
Hydro
Classic
Nuclear
0
20
40
60
80
100
120
140
Hydro
Classic
Nuclear
Installed capacity (GW)
Expected French demand (2010)
GW
BASE (Nuclear, 7200 G
WBASE (Nuclear, 7200
GW
BASE (Nuclear, 7200
20
40
60
80
100
GW
BASE (Nuclear, 7200 G
WBASE (Nuclear, 7200
GW
GW
20
40
60
80
100
GW
GW
GW
GW
20
40
60
80
100
GW
GW
SEMI BASE (Coal, 4000)
BASE (Nuclear, 7200
PEAK (Hydro, 2000 hours)Potential NEEDS
GW
BASE (Nuclear, 7200 G
WBASE (Nuclear, 7200
GW
BASE (Nuclear, 7200
20
40
60
80
100
GW
BASE (Nuclear, 7200 G
WBASE (Nuclear, 7200
GW
GW
20
40
60
80
100
GW
GW
GW
GW
20
40
60
80
100
GW
1000
2000
3000
4000
5000
6000
7000
8000
GW
SEMI BASE (Coal, 4000)
BASE (Nuclear, 7200
PEAK (Hydro, 2000 hours)Potential NEEDS
hours
But even France could need some capacity
6
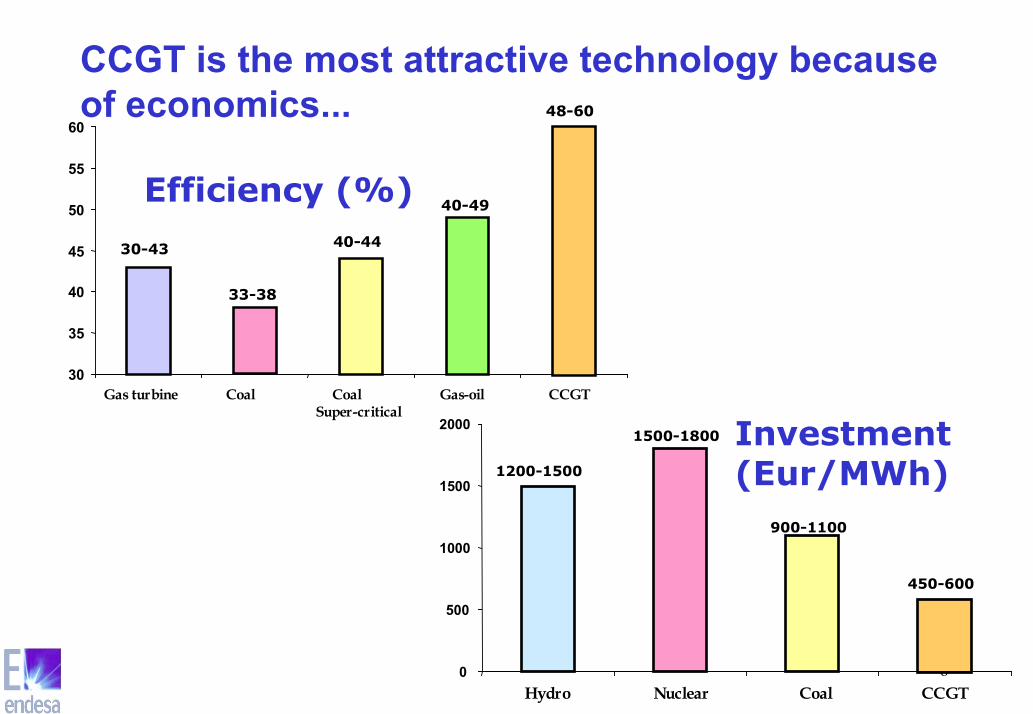
Efficiency (%)
30
35
40
45
50
55
60
Gas turbine Coal CoalSuper-critical
Gas-oil CCGT
33-38
30-43 40-44
40-49
48-60
0
500
1000
1500
2000
Hydro Nuclear Coal CCGT
1500-1800
1200-1500
900-1100
450-600
CCGT is the most attractive technology becauseof economics...
Investment(Eur/MWh)

7
00,20,4
Kgr
/tep
Carb
ón
Petr
oleo
Gas
Natu
ral
Particles
0
40
80
Kgr
/tep
Car
bón
Petr
oleo
Gas
Nat
ural
SO2
05
10
Kgr
/tep
Carb
ón
Petr
oleo
Gas
Natu
ral
NOx
025005000
Kgr
/tep
Carb
ón
Petr
oleo
Gas
Natu
ral
CO2
... and environmental impact

8
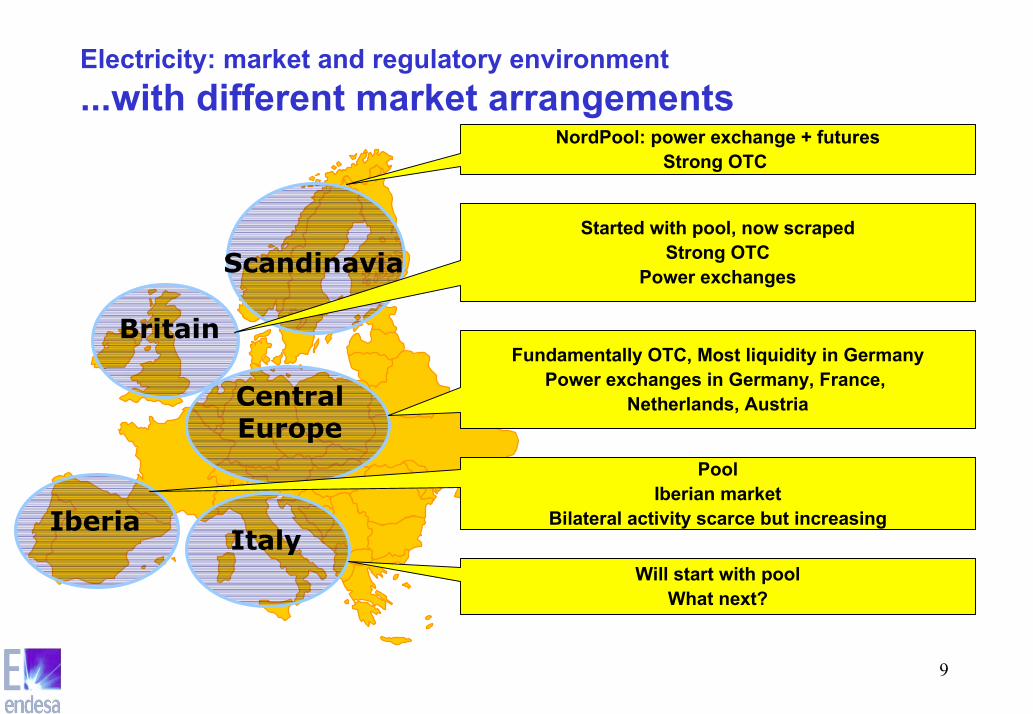
Scandinavia
CentralEurope
Britain
IberiaItaly
Electricity: market and regulatory environmentEurope has already moved from national toregional markets...
• Two very mature and integratedmarkets in Britain andScandinavia
• The largest market is in CentralEurope➔ Germany, France, Benelux,
Switzerland, Austria ...➔ Size, location
• Iberia and Italy are relativelyisolated➔ But this will change
9
Scandinavia
CentralEurope
Britain
IberiaItaly
Electricity: market and regulatory environment...with different market arrangements
NordPool: power exchange + futuresStrong OTC
Started with pool, now scrapedStrong OTC
Power exchanges
Fundamentally OTC, Most liquidity in GermanyPower exchanges in Germany, France,
Netherlands, Austria
PoolIberian market
Bilateral activity scarce but increasing
Will start with poolWhat next?

10
Electricity: market and regulatory environmentGermany and France are the core of thecontinental power markets
Baseload Cal 02
20.00
20.50
21.00
21.50
22.00
22.50
23.00
23.50
24.00
24.50
17/05/2001
24/05/2001
31/05/2001
07/06/2001
14/06/2001
21/06/2001
28/06/2001
05/07/2001
12/07/2001
19/07/2001
26/07/2001
02/08/2001
09/08/2001
16/08/2001
23/08/2001
30/08/2001
06/09/2001
13/09/2001
20/09/2001
27/09/2001
04/10/2001
11/10/2001
18/10/2001
25/10/2001
01/11/2001
08/11/2001
15/11/2001
22/11/2001
29/11/2001
06/12/2001
Eur/M
Wh
FranceGermany
• Germany was the first bilateral wholesale market in continental Europe➔ Started in 1998, currently around 1500 TWh/year➔ Volumes stabilised or reduced since Enron’s collapse➔ Much speculative trading, but greatly reduced after the fall of American traders
• The French bilateral market is growing rapidly➔ Started in 2001, now around 200 TWh/year➔ Has kept growing, a less speculative market, closer to the physical delivery

11
European Power Exchanges are growing fastNow, as spot markets, tomorrow as futures
• LPX (Germany)➔ Accounts for 5% of
German Demand➔ Averaged Hourly depth
is 2500 MWh• EEX (Germany)
➔ 0,5% of GermanDemand; Depth of 260MWh
• APX (Netherlands)➔ 12-15% of Dutch
consumption.➔ Hourly depth of 1500
MWh• PowerNext (France)
➔ Depth of 280 MWh➔ Accounts for less than
0,5% of FrenchDemand
0
50
100
150
200
250
300
350
400
450
500
week 2
5wee
k 30
week 3
5wee
k 40
week 4
5wee
k 50
week 2
week 7
week 1
2wee
k 17
week 2
2wee
k 27
week 3
2wee
k 37
week 4
2wee
k 47
week 5
2wee
k 5wee
k 10
week 1
5wee
k 20
Agg
rega
ted
Wee
kly
Vol
ume,
GW
h
LPX EEX APX PowerNext
2002

12
7 €
2 €
European Power Exchanges are growing fastThe supply and demand curve in Powernext• Currently the profile of the offer curve of the peak hours is very steep.
An small variation in the demand leads to high variations in price• The off-peak hours offer curve show a flatter profile

13
7,00
27,00
47,00
67,00
87,00
107,00
ene-
98
may
-98
sep-
98
ene-
99
may
-99
sep-
99
ene-
00
may
-00
sep-
00
ene-
01
may
-01
sep-
01
ene-
02
may
-02
sep-
02
ene-
03
euro
/ M
Wh
0
1.000
2.000
3.000
4.000
5.000
6.000
7.000
8.000
9.000
GW
h
Daily Weighted Average Price (E/MWh)
Hydro Energy (GWh)
There is also a strongcorrelation between
hydro conditions, priceand volatility
After all, hydroconditions are a short
term distorsion ofreserve margin, withan underlying long
term hydro availablecapacity
Hydro conditions are a major driver of electricityprices, and therefore a risk factorSpanish pool price Price spikes
normal in the short term(electricity cannot be stored)

14
PRODUCCION HIDRAULICA DEL SISTEMA2000-2001-2002
500
1.500
2.500
3.500
4.500
5.500
6.500
ENER
O
FEBR
ERO
MARZO
ABRI
L
MAYO
JUNIO
JULIO
AGOST
O
SEPT
IEMBR
E
OCTUB
RE
NOVIEM
BRE
DICIE
MBRE
Ener
gía(
GW
h/m
es)
Año 2001: 36.503 GWh
Año 2000: 24.883 GWh
Año 2002: 18.572 GWh
Hydro conditions are a major driver of electricityprices, and therefore a risk factorSpanish hydro production

15
Fuel- gas/hydro production & Spanish pool price
0.000
1.000
2.000
3.000
4.000
5.000
6.000
7.000
0.0% 2.0% 4.0% 6.0% 8.0% 10.0% 12.0% 14.0%
Participación del fuel en MD
Prec
io (c
€/kW
h)
0.000
1.000
2.000
3.000
4.000
5.000
6.000
7.000
0.0% 5.0% 10.0% 15.0% 20.0% 25.0% 30.0% 35.0% 40.0%
Participación del agua en la cobertura
Prec
ios
(c€/
kWh)
There is a non-linear relation betweenthe share of fuel-oil production and
pool price. The “discontinueties” arerelated with points at which fuel-oilstarts to be essential for demand
coverage
With high hydro productions,marginal price is set by stable coalprice. With decreasing hydro levels,
the volatility of fuel price is perceived

16
Possible environmental impact in pool prices
Investment
Fixed costs
Fuel Costs
Other variable costs
Emissions costs
(Euros/tCO2)
(Euros/MWh)
(MWh/h)
Ci
(Euros/MWh)
(MWh/h)
Ci
Cf
Depending in the type of
fuel and the efficiency of
the plant, emission costs
will have an impact as an
additional variable cost
and therefore on
wholesale prices (?)
+

17
1998 1999 2000 2001 2002
Reserve MarginPool Price (98 base)Customer Price (98 base)
But, does the wholesale price really matter?The example of Spain
Pool price has adequatelyreflected the balance of supplyand demand forces:
•Decreasing reserve margin•Changing hydro conditions•Fuel prices•Increasing LTMC
However, this evolution of poolprice has had no effectwhatsoever on prices to finalcustomers

18
61,1 58,9 60,3 62,967,5
39,838,240,241,0 39,8
1998 1999 2000 2001 2002
Régimen Ordinario Régimen Especial
10,5%
-3,0%
The effect of regulationRevenues of generation in Spain (eur/MWh)

19
7,8 7,5
5,6
4,6 4,5
1998 1999 2000 2001 2002
-42,3%
The effect of regulationThe capacity payment in Spain (eur/MWh)

20REE (83)
CHAOS
Elkraft (00)
GRTN (00)
Elia (01)
RTE (00)
REN (94)
National Grid (90)
EirGrid (99) Fingrid (96)Statnett (92)
SVK (92)
TenneT (98)
Verbund (88)
Electricity: market and regulatory environmentA variety of system operators...

21Spanish Pool (OMEL) (98)
EEX (00)
APX (99)
Italy: no yet
Belgium: no yet
Greece: no wayPortugal: no yet
England & Wales Pool (90)now! NETA (01)
Nordpool (93)
Austria: EXAAPowerNext (01)
Ireland: no yet
Electricity: market and regulatory environment...power exchanges...

22CNE (94)
Germany: ??
Dte (99)
OFGEM (86)
E-CONTROL (01)
CRE (00)
CREG (00)
ERSE (97)
AEEG (96)
CER (99)
Electricity: market and regulatory environment...and regulatory entities

23
25 - 35 €/MWh
23 - 28 €/MWh
28 - 35 €/MWh25 - 33 €/MWh
23 - 28 €/MWh
20 - 25 €/MWh
20 - 25 €/MWh
35 - 40 €/MWh
23 - 28 €/MWh
15 - 35 €/MWhNuclear
GasFuel-Oil
CoalHydro
Electricity: market and regulatory environmentForward prices in Europe are too different
24
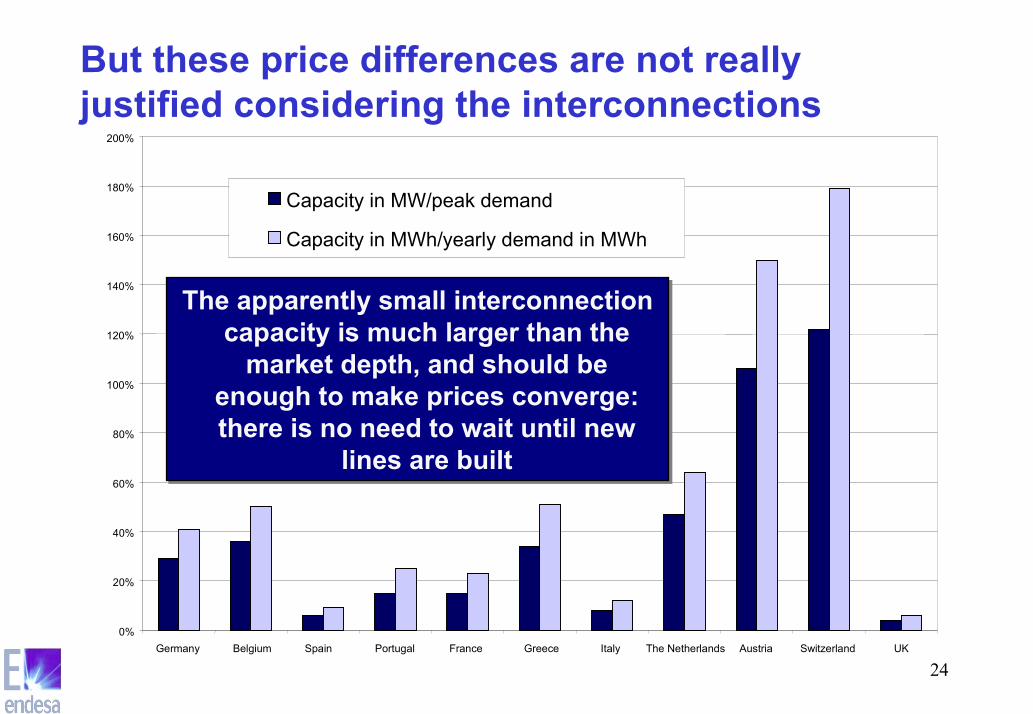
But these price differences are not reallyjustified considering the interconnections
0%
20%
40%
60%
80%
100%
120%
140%
160%
180%
200%
Germany Belgium Spain Portugal France Greece Italy The Netherlands Austria Switzerland UK
Capacity in MW/peak demand
Capacity in MWh/yearly demand in MWh
The apparently small interconnectioncapacity is much larger than the
market depth, and should beenough to make prices converge:there is no need to wait until new
lines are built
The apparently small interconnectioncapacity is much larger than the
market depth, and should beenough to make prices converge:there is no need to wait until new
lines are built
25
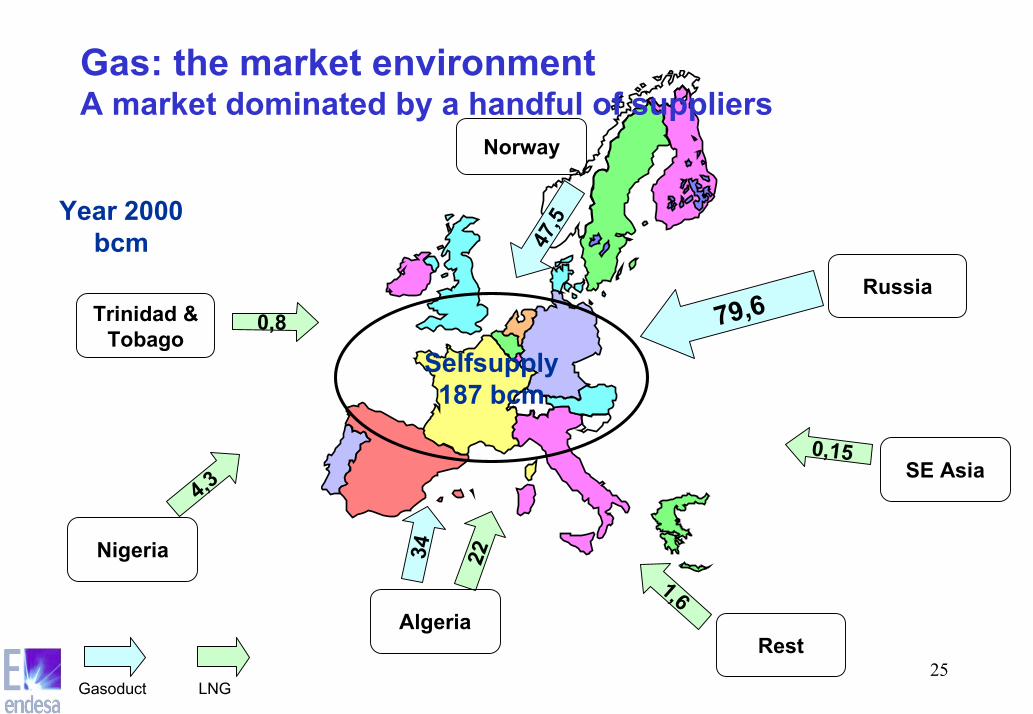
79,6Russia
47,5
Norway
Gasoduct LNG
34 22
Algeria1,6
Rest
4,3
Nigeria
0,8Trinidad &Tobago
Year 2000bcm
0,15SE Asia
Selfsupply187 bcm
Gas: the market environmentA market dominated by a handful of suppliers
26
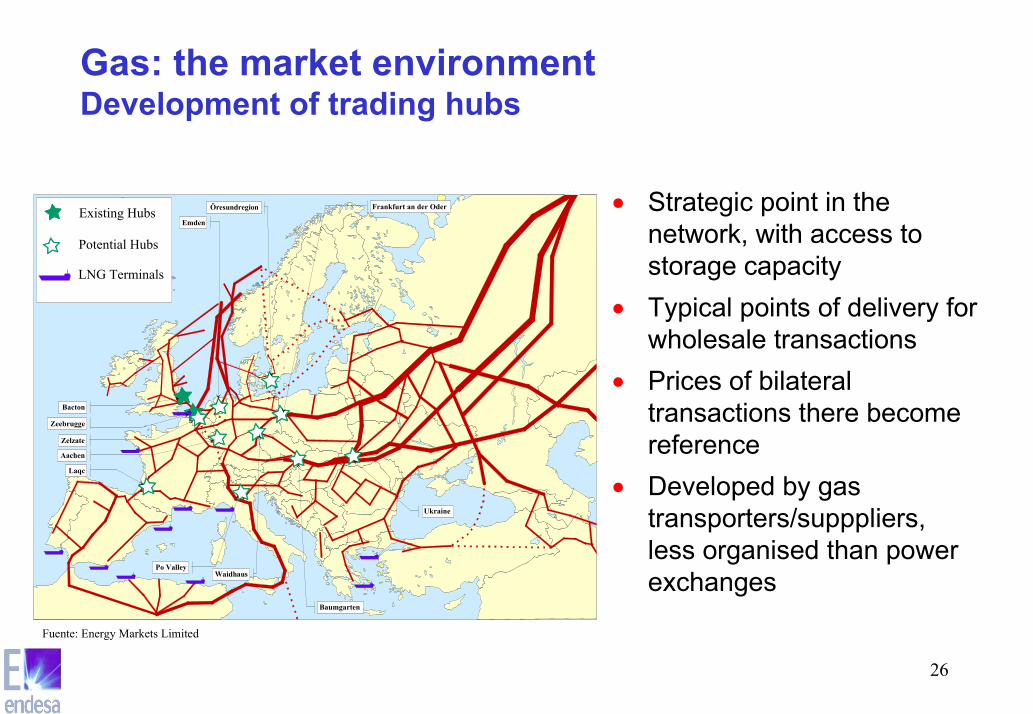
• Strategic point in thenetwork, with access tostorage capacity
• Typical points of delivery forwholesale transactions
• Prices of bilateraltransactions there becomereference
• Developed by gastransporters/supppliers,less organised than powerexchanges
Zelzate
Potential Hubs
Existing Hubs
LNG Terminals
Zeebrugge
Bacton
Aachen
Laqc
Emden
Frankfurt an der OderÖresundregion
WaidhausPo Valley
Ukraine
Baumgarten
Fuente: Energy Markets Limited
Gas: the market environmentDevelopment of trading hubs

27
Gas... and comparison with electricity• Oligopoly
➔ A handful of external suppliers➔ Typically one large distributor/supplier
per country
• Rigid➔ Long term contracts➔ Take or Pay➔ Small spot market➔ UK only significant traded market
• Regional markets➔ Transport bottlenecks➔ Regulatory problems: network tariffs
• More competition, suppliers in eachcountry
➔ More progress regarding independenceof transmission system operator
• More wholesale/trading activity➔ Bilateral and exchanges➔ Germany, France, Netherlands
• Regional markets➔ Transport bottlenecks➔ Regulatory problems: network tariffs

28
Gas: the market environmentDrivers of gas prices in Europe
• Liquidity of wholesale markets➔ NBP➔ Zeebrugge (UK-Bel)➔ Emden/Bunde (Ger-Neth)➔ Zelzate (Neth-Bel)
• LNG➔ Atlantic arbitrage➔ Ships➔ USD/EUR
• Supply flexibility➔ Storage➔ North sea➔ Netherlands
• Oil market➔ Indexations➔ Traders psichology➔ USD/EUR
€/MWh

29
0
25
50
75
100
125
Euro
/MW
h
1998 1999 2000 2001 2002
25,7 26,731,9 31,5
38,9
Are markets signals adequate for investment?Even in a market with high wholesale prices, like Spain, prices donot provide adequate signals (until the last moment)
30
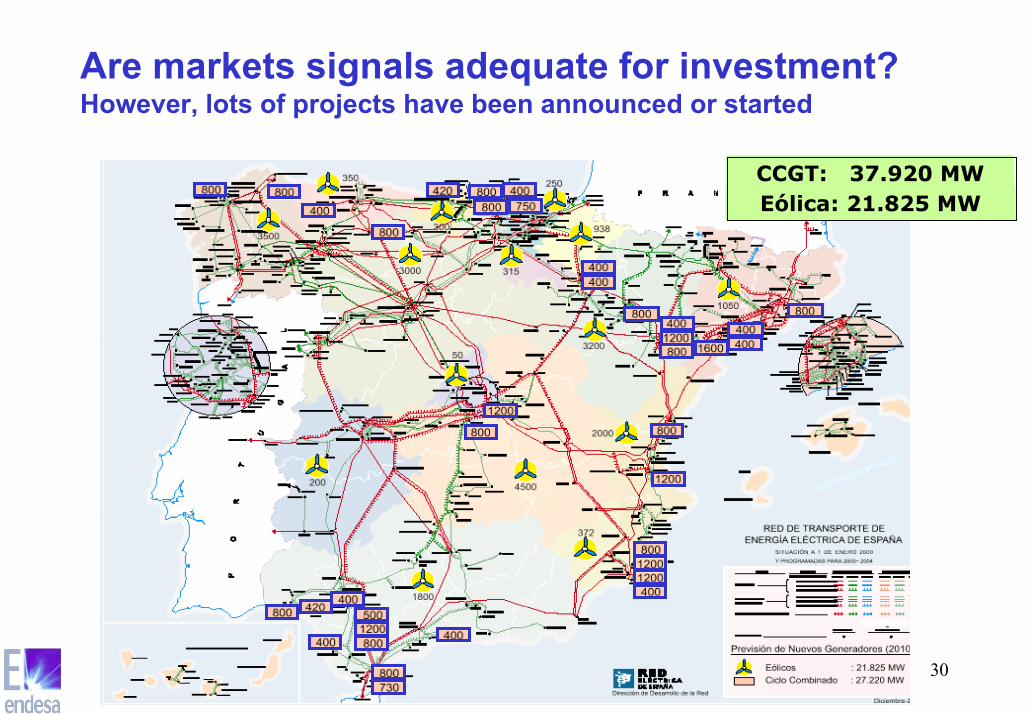
CCGT: 37.920 MWEólica: 21.825 MW
Are markets signals adequate for investment?However, lots of projects have been announced or started

31
Expected electricity prices
0
10
20
30
40
50
60
2002 2004 2006 2008 2010 2012 2014 2016 2018 2020
Base price (long term model results) Forward Base price (16/8/02)Peak price (long term model results) Forward Peak price (16/8/02)
Precios de electricidad esperados
0
10
20
30
40
50
60
2002 2004 2006 2008 2010 2012 2014 2016 2018 2020
Precio base modelo de largo plazo Precio forward base FranciaPrecio pico modelo de largo plazo Precio forward pico FranciaEscenario precio base considerado Escenario precio pico considerado
Wholesale prices in France-GermanySignificant gap between forward curve & economic reality
• Using a business dynamic long term model wecan conclude that:
➔ No clear trend in the expected Central Europeanelectricity prices
➔ Significant volatility can be expected due to theuncertainties of new capacity installed and thesensitivity of prices to small changes in capacity
• Big gap between forward curve and resultsobtained from the model.
➔ Prices obtained from the model are consistentwith expected costs
➔ What does this say about the forward curve?• It seems reasonable to assume a increase in
wholesale prices to adapt to the actual cost ofnew capacity

32
Wholesale prices in France-GermanySignificant gap between forward curve & economic reality
20
25
30
35
40
45
50
2002
2003
2004
2005
2006
2007
2008
2009
2010
2011
2012
2013
2014
2015
2016
2017
2018
2019
2020
eur/M
Wh
base peak forward curve
Long termequilibrium pricethat allowscompleterecovery ofCCGT costsThis price level iscompatible withcurrent retailprices (similar tothe embeddedprices in pricesto smallcustomers)
Forward curve(market prices,not estimates)
Current disparity between marketprices and prices “embedded” intariffs cannot continue muchbeyond the total liberalisation ofretail market

33
Are markets signals adequate for investment?Spikes are natural in the short term prices, but are they reasonablein the forward curve?
1919,5
2020,5
2121,5
2222,5
2323,5
2424,5
2525,5
2626,5
2727,5
2828,5
2929,5
30
17-a
br-0
0
17-m
ay-0
0
17-ju
n-00
17-ju
l-00
17-a
go-0
0
17-s
ep-0
0
17-o
ct-0
0
17-n
ov-0
0
17-d
ic-0
0
17-e
ne-0
1
17-fe
b-01
17-m
ar-0
1
17-a
br-0
1
17-m
ay-0
1
17-ju
n-01
17-ju
l-01
17-a
go-0
1
17-s
ep-0
1
17-o
ct-0
1
17-n
ov-0
1
17-d
ic-0
1
17-e
ne-0
2
17-fe
b-02
17-m
ar-0
2
17-a
br-0
2
17-m
ay-0
2
17-ju
n-02
17-ju
l-02
17-a
go-0
2
17-s
ep-0
2
17-o
ct-0
2
17-n
ov-0
2
17-d
ic-0
2
17-e
ne-0
3
17-fe
b-03
17-m
ar-0
3
CAL 2002 CAL 2003 CAL 2004

34
Final thoughtsAre markets signals adequate for investment?
• An illiquid/non competitive market is not credible➔ Cannot be the basis for supply and generation activities in competition...
• How can we increase liquidity/credibility of the market?➔ Divestitures (the English solution) would be a way of bringing competition
and increasing liquidity✔ Bot no continental government seems to be seriously considering this...
national champions are the preferred objective➔ New entrants will take years to make an impact
✔ And “real” new entrants are in very short supply these days...➔ Only the development of an integrated European electricity market would
offer the possibility of a liquid market, with a sufficient number ofsignificant players
✔ Only the neighbours are bringing some real competition to the currentconcentrated markets

35
Final thoughtsThe key: fair access to electricity networks
• The objective: an European market in electricity➔ Only this can bring sufficient competition and liquidity in a reasonable time
frame➔ The place where that market is supposed to exist is the network
• Fair access to the network is the key to the development of theEuropean market
• The current level of network infrastructure allows for asignificant degree of integration of the markets➔ The barrier is not infrastructure, but long term contracts and regulation
• Access to the network is not cross-border trading➔ No more multiple networks, but one single European network!

36
WHEN
will prices raiseagain?
• WHEN capacity reserve margins tightens up.➔ This tends to happen before everybody expects
(though it can also reverse rapidly)
• WHEN interconnections allow to “transmit” scarcityin certain areas to the rest of Europe➔ Spain, Norway, Italy, Portugal
• WHEN neighbouring countries (Eastern Europe)stop exporting.➔ This could happen much more rapidly than expected
• BUT MAINLY, WHEN prices to final customers andwholesale prices are representative of real marketforces and not only political/economic interests
Final thoughtsWholesale prices will increase
37
Final thoughtsDealing with risks• A critical need to manage risk: flexibility
➔ In electricity & gas: balancing and flexible access to the network• Investment needs long term economic signals
➔ Even the most liquid markets provide forward curves for a limited time horizon• Regulatory measures have been tried
➔ Capacity payments (England, Spain, South America)➔ Capacity contracts (US)➔ But no clear solution➔ ...and beware regulatory interference with price spikes
• The most important need is the development of a real market➔ liquid➔ competitive➔ ... a single European market
• This is a regulatory/political issue: infrastructure is not the main barrier