Endesa 1H 2018 Results - Seeking Alpha
29
Endesa 1H 2018 Results 24/07/2018
Transcript of Endesa 1H 2018 Results - Seeking Alpha
Endesa 1H 2018 Results
24/07/2018

Sound performance of the liberalized business EBITDA (+42%) in a context of gradual normalization of market conditions
2
Overall EBITDA increased by 12% in the period
1H 2018 Results- Madrid, 24 July 2018
Flat fixed costs evolution absorbing inflation and growth
Highlights
Stable contribution of regulated businesses
Strong Net Income growth (+15%)

Financial results
3(1) Financial investments not included (€25 M in 1H2018 and €42 M in 1H2017) . Does not include business combinations made during the year.
(1)
1H 2018 Results- Madrid, 24 July 2018
€M
Revenues 9,934 10,004 -1%
Gross Margin 2,823 2,624 8%
EBITDA 1,804 1,605 12%
EBIT 1,053 901 17%
Net attributable income 752 653 15%
Net Capex 460 288 60%
Cash Flow from Operations 639 675 -5%
Net financial debt 5,956 4,985 19%
1H 2018 1H 2017 Change
30.06.2018 31.12.2017
(1)
126
4
235 163
217112
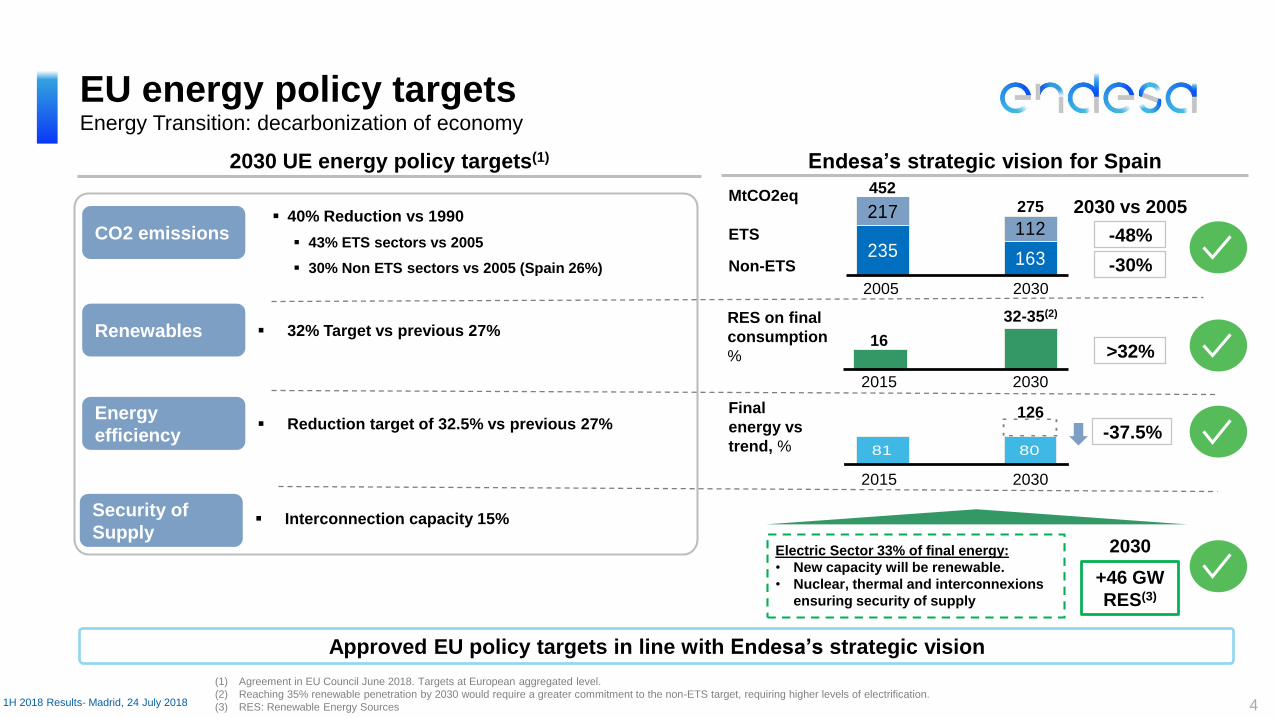
Approved EU policy targets in line with Endesa’s strategic vision
EU energy policy targetsEnergy Transition: decarbonization of economy
2030 UE energy policy targets(1) Endesa’s strategic vision for Spain
CO2 emissions
32% Target vs previous 27%
40% Reduction vs 1990
43% ETS sectors vs 2005
30% Non ETS sectors vs 2005 (Spain 26%)
Renewables
Reduction target of 32.5% vs previous 27%Energy
efficiency
Interconnection capacity 15%Security of
Supply
-48%
2030 vs 2005
Non-ETS
ETS
2030
275
452
2005
-30%
2030
32-35(2)
2015
16
RES on final
consumption
%
MtCO2eq
81 80
-37.5%
Final
energy vs
trend, %
+46 GW
RES(3)
(1) Agreement in EU Council June 2018. Targets at European aggregated level.
(2) Reaching 35% renewable penetration by 2030 would require a greater commitment to the non-ETS target, requiring higher levels of electrification.
(3) RES: Renewable Energy Sources
>32%
20302015
2030
1H 2018 Results- Madrid, 24 July 2018
Electric Sector 33% of final energy:
• New capacity will be renewable.
• Nuclear, thermal and interconnexions
ensuring security of supply
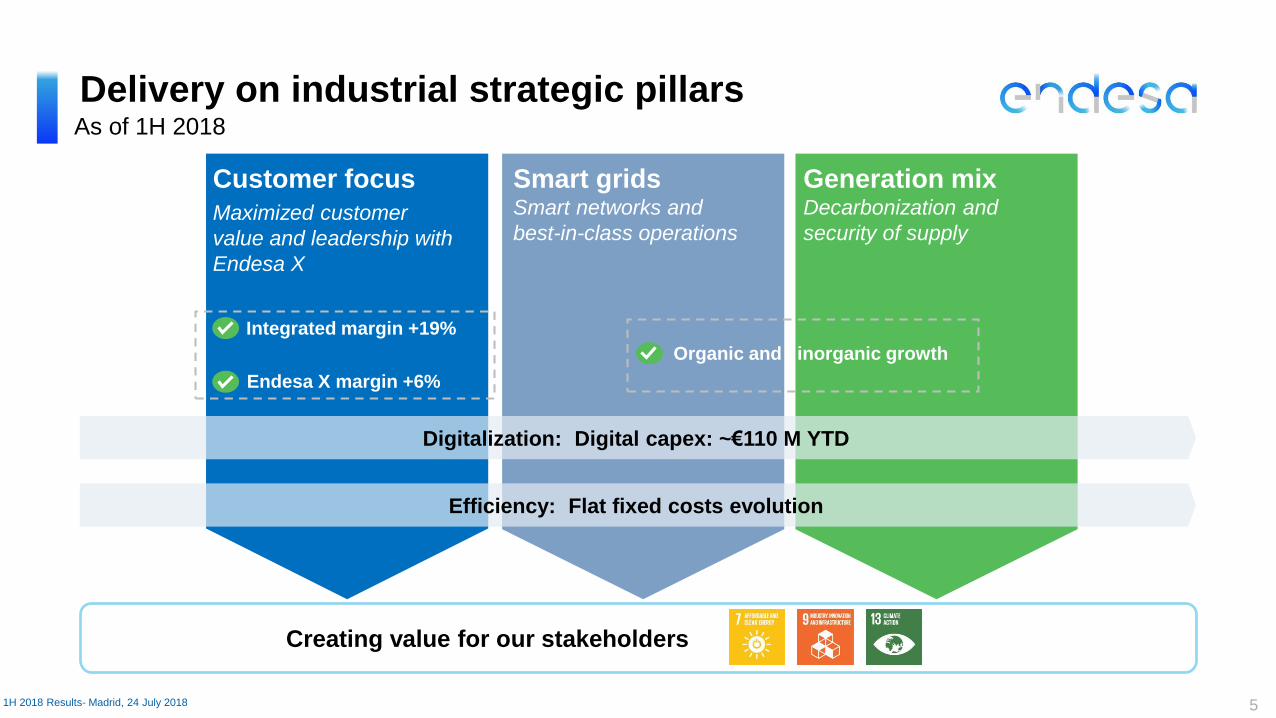
Delivery on industrial strategic pillars
51H 2018 Results- Madrid, 24 July 2018
Creating value for our stakeholders
Smart gridsSmart networks and
best-in-class operations
Generation mixDecarbonization and
security of supply
Customer focus
Maximized customer
value and leadership with
Endesa X
Integrated margin +19%
Endesa X margin +6%
Digitalization: Digital capex: ~€110 M YTD
Efficiency: Flat fixed costs evolution
Organic and inorganic growth
As of 1H 2018

Growth in Renewables and Networks
6
Organic
Progressing on delivering our growth commitment in Renewables and Networks
1H 2018 Results- Madrid, 24 July 2018
Renewables
Networks
Inorganic
2 wind farms:
74 MW
3 wind farms:
57.5 MW
Gestinver
132 MW Wind
Investment: ~ €170 M
Ebitda 2019e ~€20 M (~€4 M 1H2018)
Public offer for
E. A. E. Ceuta
Over 30,000 customers Sx and points of delivery
Acceptance: >94%
Investment: ~€83 M
Ebitda 2017: €8 M
540 MW Wind and 339 MW PV
Investment: €870 M
Equity IRR >11%
Spanish auctions 2017
Infrastructures
RAB Investment 2018 YTD: €180 M
97% Smart meters (11.6 M)
Energy Losses: 9.2% (3% improvement
YTD)
As of 1H 2018

7
Digital TransformationAs of 1H 2018 main outcome
4.1 M digital customers (+0.3M vs 2017)
2.4 M contracts with e-billing system (+0.3M vs 2017)
18% increase on digital sales vs 2017
79% e-care interactions (+10% vs 2017)
11.6 M smart meters installed (97% of the delivery points under 15 kW)
Grid automation:
+ 16,500 smart remotes installed in MV network
131 smart remotes upgraded in HV network
Large scale batteries: construction & connection phase of 20 MW pilot project in Litoral
completed
Tech-Bar launched: 490 employees and 88 workshops
E- Talent program development 263 employees (400 employees engaged)
Digital training program development 819 employees (1,200 employees engaged)
CLIENTS
ASSETS
PEOPLE
€ ~110 M invested in 2018 to boost digital transformation of our clients, assets and people
1H 2018 Results- Madrid, 24 July 2018

Efficiency
8
KPI’s evolution and degree of fulfilment
Efficiency plans on track to meet 2020 targets
2020 target
2016 2017 1H2018
4945 45
-8%Unitary cost (3)
(€/customer)Distribution
41
(1) 1H 2017 Fixed costs adjusted by: Provisions for workforce reduction plans and contract suspension agreements updates (€13 M), provision for redundancy plans, compensations and other tax and labour risks (-€ 4M) and infringement proceedings (-€12 M)
(2) 1H 2018 Fixed costs adjusted by : Provisions for workforce reduction plans and contract suspension agreements updates (€6 M), provision for redundancy plans, compensations and other tax and labour risks (-€ 24M) and infringement proceedings (€11 M)
(3) Includes corporate fees
2016 2017 1H2018
47 47 47
Unitary cost (3)
(k€/MW)Generation
48
-
2016 2017 1H2018
14 1413
Supply Cost to Serve(3)
(€/customer)13
2016 2017 1H2018
4744 44
EGPE Unitary cost(3)
(k€/MW)
37
-6%
1.0b€
1.0b€
-19 M€
3 M€
12 M€
1H2018
Efficiency
Growth
CPI
1H2017
-7%
(1)
(2)
Fixed costs evolution

-0.2%
0.3%1.2%1.1%
1H 2017 1Q 2018 2Q 2018 1H 2018
51.3 48.1 52.0 50.1
Demand (1)
Endesa distribution area(3)Spain(2)
Industry
Residential
Services
-3.4%
+1.0%
+1.5%
Adjusted for weather and working days Not adjusted
(Not adjusted)
Moderate demand increase Year on Year affected by milder
temperatures in June and lower industrial activity
Electricity wholesale prices
Average pool prices Spain (€/MWh)
Higher hydro output not fully reflected in lower pool prices due
to high commodities prices and nuclear stoppage
Recovery of hydro conditions: reservoir levels above 10 years
average and close to 2016 levels
74% increase in hydro system production(1) Mainland.
(2) Source: REE
(3) Source: Endesa’s own estimates
Market context in 1H 2018
91H 2018 Results- Madrid, 24 July 2018
-2%
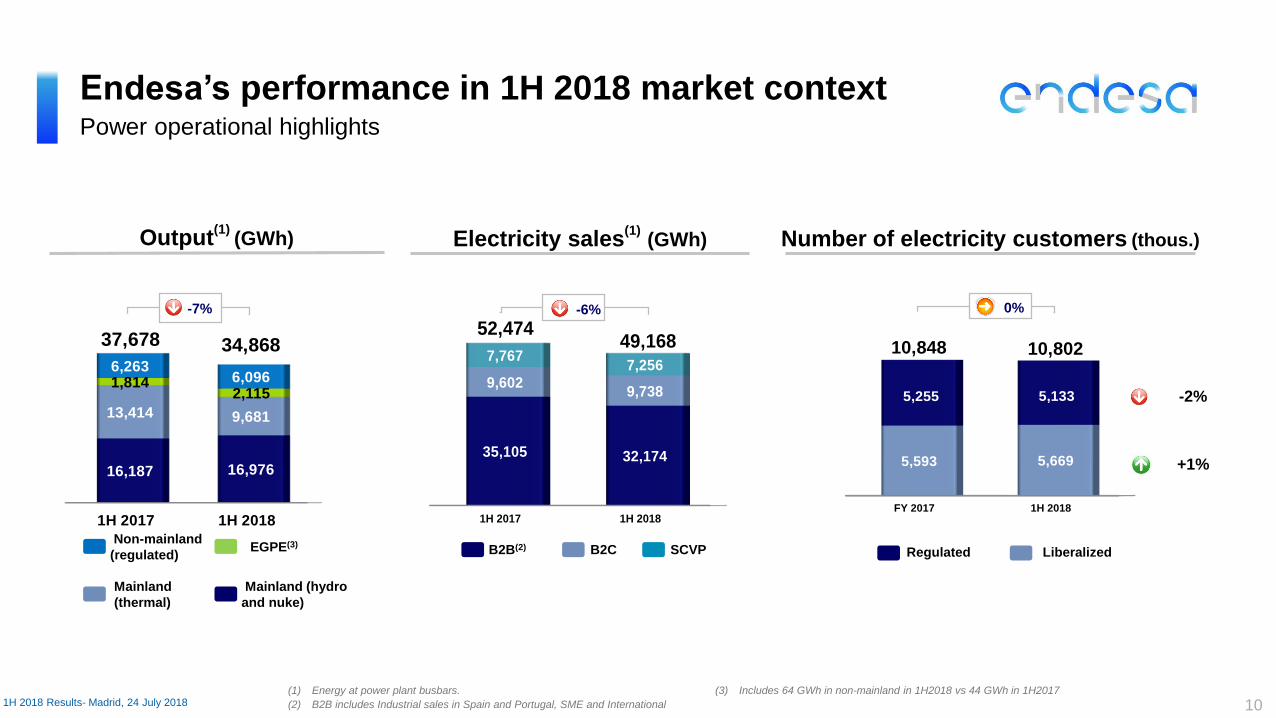
FY 2017 1H 2018
5,593 5,669
5,255 5,133
10,848 10,802
1H 2017 1H 2018
16,187 16,976
13,414 9,681
1,8142,115
6,2636,096
37,678 34,868
1H 2017 1H 2018
35,105 32,174
9,6029,738
7,7677,256
52,47449,168
Endesa’s performance in 1H 2018 market context
Output(1)
(GWh) Electricity sales(1)
(GWh)
Power operational highlights
(1) Energy at power plant busbars.
(2) B2B includes Industrial sales in Spain and Portugal, SME and International
(3) Includes 64 GWh in non-mainland in 1H2018 vs 44 GWh in 1H2017
SCVPB2B(2) B2C
10
-7%
1H 2018 Results- Madrid, 24 July 2018
Number of electricity customers (thous.)
Mainland (hydro
and nuke)
Mainland
(thermal)
Non-mainland
(regulated)EGPE(3)
0%
Regulated Liberalized
-6%
+1%
-2%

21.4 25.4
38.739.1
31.4 28.7
11.811.9
Sound fundamentals in Gx & Sx, with an increase of 19% of electricity unitary margin (€25.4/MWh)
43.2
(1) Total electricity sales (at power plant busbars) -SCVP - International Sales
(2) Production cost + energy purchase costs + ancillary services
Energy management
Liberalized business
Energy
purchases
Mainland
output
Energy (TWh)
40.6
Unitary values breakdown (€/MWh)
64.560.1
Unitary variable cost(2)
Unitary margin
Unitary revenue
1H 2017 1H 2018
+19%
111H 2018 Results- Madrid, 24 July 2018
-6%
-9%
+1%
Sales(1)
1H 2017 1H 2018

1H 2017 1H 2018
40,655 38,736
5,638 5,928
3,750 4,608
50,043 49,272
Endesa’s performance in 1H 2018 market context
Sales (GWh)
Gas operational highlights
Retail CCGT sales
121H 2018 Results- Madrid, 24 July 2018
Number of gas customers (thous.)
Regulated LiberalizedWholesale
business
-2%
FY 2017 1H 2018
1,314 1,325
246 237
1,560 1,562
0%
(1) Ordinary unitary margin does not include Wholesale business
Unitary margin (1):
€0.8/MWh €1.1/MWh
1H 2017 1H 2018
Recovery of gas market conditions
YTD Demand increase: 5.8%
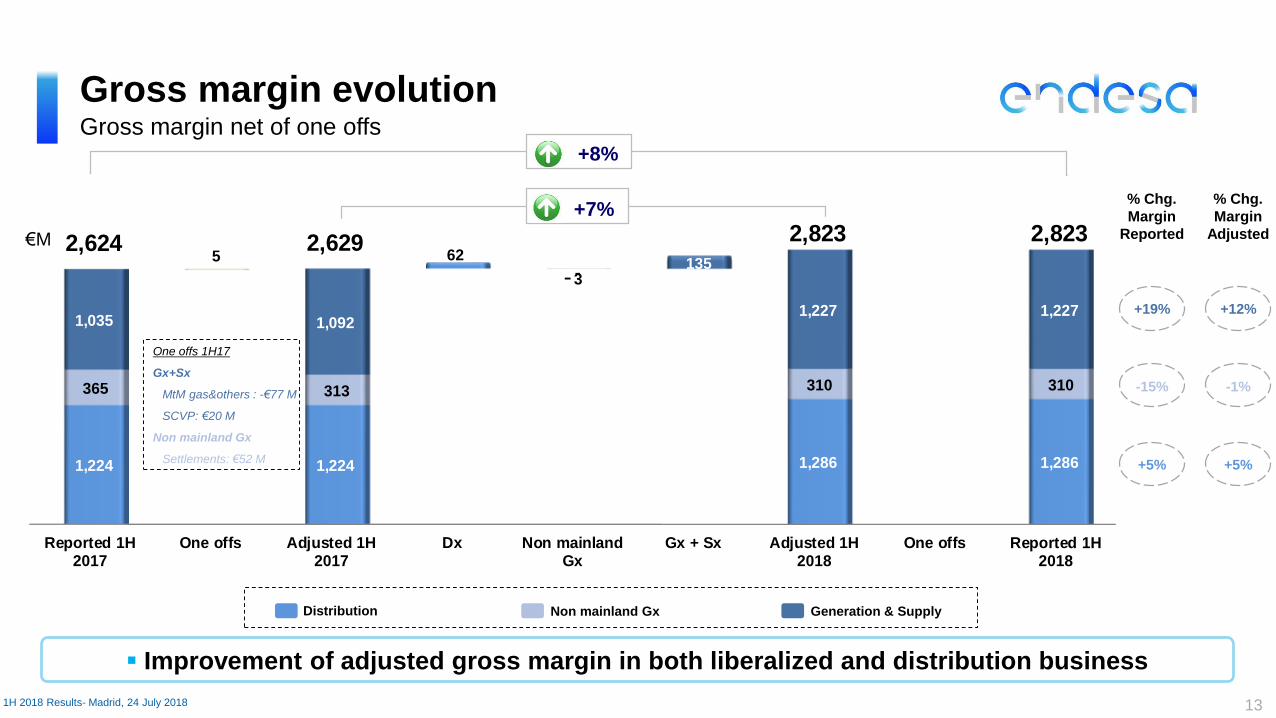
Reported 1H2017
One offs Adjusted 1H2017
Dx Non mainlandGx
Gx + Sx Adjusted 1H2018
One offs Reported 1H2018
1,224 1,224
62
1,286 1,286
365 313
3
310 310
1,035 1,092
135
1,227 1,227
2,624 2,629 2,823 2,8235
Gross margin evolution
€M
Improvement of adjusted gross margin in both liberalized and distribution business
131H 2018 Results- Madrid, 24 July 2018
Gross margin net of one offs
One offs 1H17
Gx+Sx
MtM gas&others : -€77 M
SCVP: €20 M
Non mainland Gx
Settlements: €52 M
+8%
+7%
+5%
-15%
+19%
% Chg.
Margin
Reported
-
Generation & SupplyNon mainland GxDistribution
% Chg.
Margin
Adjusted
+5%
-1%
+12%
-

Reported 1H2017
Adjusted 1H2017
Dx Non-mainlandGx
Adjusted 1H2018
Reported 1H2018
1,224 1,224
62
1,286 1,286
365 313
3 310 310
1,589 1,537 1,596 1,596
Regulated businessGross margin evolution
Regulated gross margin driven by Distribution regulated revenues
€M
Non-mainland Gx
Dx
(1) One offs 1H 2017: €52 M non mainland settlements 141H 2018 Results- Madrid, 24 July 2018
+4%
0%
(1)
-

Liberalized business(1)
Gross margin evolution
€M
12% increase driven by recovery in the power and gas businesses
(1) Liberalized business Gross Margin figure includes Generation and Supply business, Corporate Structure, Services and Adjustments and does not include Non-mainland generation
(2) One offs 1H 2017: -€77 M (MtM gas & Others -€63 M and Force Majeure in Argelia -€14 M) and €20 M from SCVP rebilling 151H 2018 Results- Madrid, 24 July 2018
+19%
+12%
Electricity and others Gas Endesa X
Reported 1H 2017 Adjusted 1H 2017 Electricity + Others Gas Endesa X Adjusted 1H 2018 Reported 1H 2018
1,023 1,003
102
1,105 1,105
-42
35
30
65 65 54 54
3 57 57 1,035 1,092
1,227 1,227(2)
EGPE: 132EGPE: 135

637 626
455
7
473
-80 -80
1,012 1,019
647 635
451
3
460
-79 -79
1,019 1,016
Fixed costs evolution
O&M costs
Personnel
costs
Capitalized costs
0%€M
Flat fixed costs evolution absorbing inflation and growth (1)(2)
16
1H 2017
Reported
1H 2017
Adjusted
1H 2018
Adjusted
1H 2018
Reported
0%(1)(2)
0%
1H 2018 Results- Madrid, 24 July 2018
-1%
(1)(2)
(1) 1H 2017 Fixed costs adjusted by: Provisions for workforce reduction plans and contract suspension agreements updates (€13 M), provision for redundancy plans, compensations and other
tax and labour risks (-€ 4M) and infringement proceedings (-€12 M)
(2) 1H 2018 Fixed costs adjusted by : Provisions for workforce reduction plans and contract suspension agreements updates (€6 M), provision for redundancy plans, compensations and other
tax and labour risks (-€ 24M) and infringement proceedings (€11 M)

Ebitdareported 1H
2017
One offs Ebitdaadjusted 1H
2017
Dx Non mainlandGx
Gx + Sx Ebitdaadjusted 1H
2018
One offs Ebitdareported 1H
2018
936 936
76
1,012 1,012
236 184
8
176 176
433 490
126
616 616
1,605 1,6101,804 1,804
5
EBITDA evolution
€M
Improvement of adjusted EBITDA driven both by liberalized and regulated business
171H 2018 Results- Madrid, 24 July 2018
EBITDA net of one offs+12%
+12%
+8%
-25%
+42%
% Chg.
Ebitda
Reported
Generation & SupplyNon mainland GxDistribution
+8%
-4%
+26%
% Chg.
Ebitda
Adj
One offs 1H17
Gx+Sx
MtM gas&others : -€77 M
SCVP: €20 M
Non mainland Gx
Settlements: €52 M
-EGPE: 93
(Gestinver ~€4 M)EGPE: 96

EBITDA Depreciation
and
amortization
EBIT Net Financial
Results
Associates
and Others
Profit before
taxes
Taxes Minorities Net
attributable
Income
1,804
1,053 984752
-751
-70 +1-228
-4
11%
From EBITDA to Net Income
€M
181H 2018 Results- Madrid, 24 July 2018
1H 2017 1,605 -704 901 -59 6 848 -190 -5 653
Change (%) +12% +7% +17% +19% -83% +16% +20% +20% +15%
(1) D&A includes additional €23 M as a consequence of the implementation of IFRS 15 (Revenue from contracts with customers).
(2) 2017 D&A included a provision reversal of €15 M.
(1)
(2)
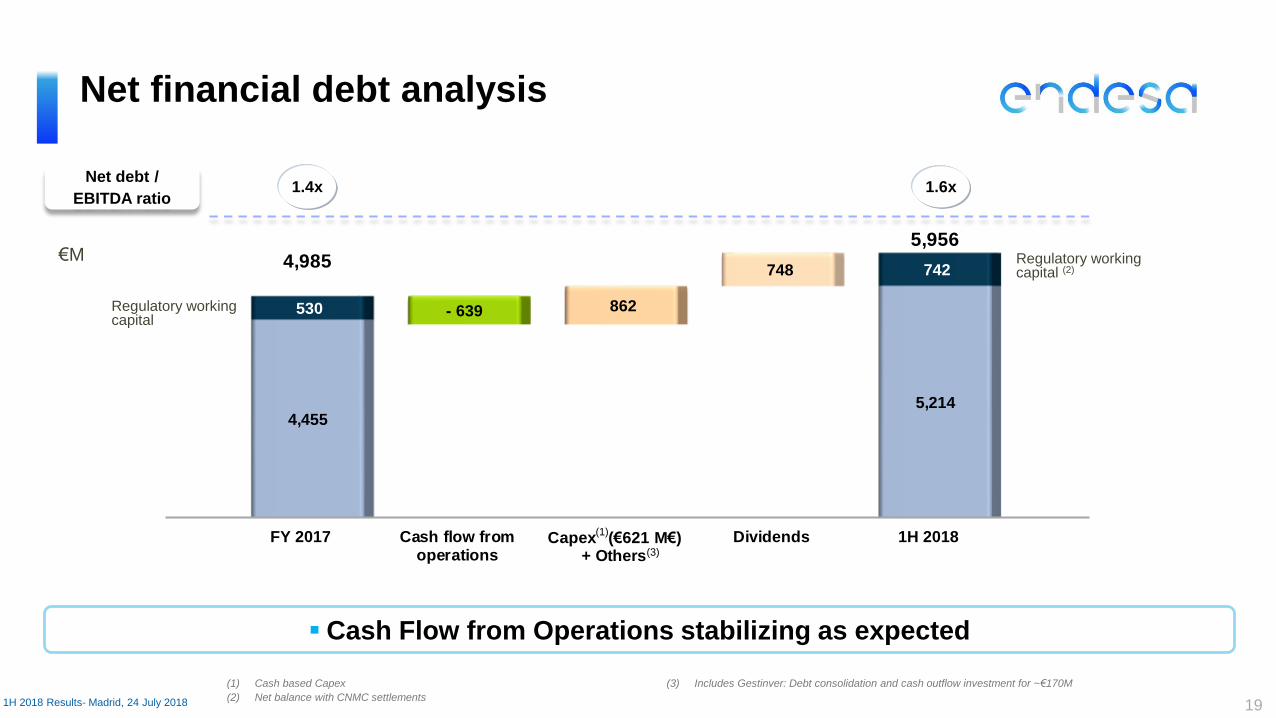
FY 2017 Cash flow fromoperations
Capex (€621 M€) + Others
Dividends 1H 2018
4,4555,214
530 - 639 862
748 742 4,985
5,956
(1) Cash based Capex
(2) Net balance with CNMC settlements
(3) Includes Gestinver: Debt consolidation and cash outflow investment for ~€170M
€M
Net financial debt analysis
1.4xNet debt /
EBITDA ratio1.6x
Cash Flow from Operations stabilizing as expected
191H 2018 Results- Madrid, 24 July 2018
(1)
Regulatory working capital (2)
Regulatory working capital
(3)

By interest rate By currency
Fixed 52%
Euro 100%
Floating 48%
Structure of Endesa's gross debt
6,843 6,843
Average cost of debt 2.0% (vs. 2.3% as of 1H17)
€M
as of 1H 2018
Gross financial debt structure
201H 2018 Results- Madrid, 24 July 2018
FY 2017 1H 2018
4,9855,956
407
887 5,392
6,843
Gross and net debt
Net debt Cash & Derivatives
recognized as financial assets
Healthy financial leverage and strong liquidity position
Continuous delivery on strategic plan and fully committed with the Energy Transition initiatives
21
Strong EBITDA evolution supported by the very good performance of our liberalized business
Sound bottom line figure
1H 2018 Results- Madrid, 24 July 2018
Constant effort on fixed cost contention
Final Remarks
Well on track to meet 2018 guidance

AppendixEndesa 1H 2018 Results
22

2018 2019 2020 2021 2022+
1,20016
19
8
55
58 119
1,120
41
43
73333
3,391
1,249
114
791
152
4,530
(1) Including €7 M relating to financial derivatives.
(2) Notes issued are backed by long-term credit lines and are renewed on a regular basis.
Bank DebtBonds and other marketable securities (2) Other debts
Liquidity €3,869 M
Average life of debt: 5.4 years
€880 M in cash
€2,989 M available in credit lines
Endesa's
liquidity covers
32 months of
debt maturities
Gross balance of maturities outstanding at 30 June 2018: €6,843 M(1)
Endesa: financial debt maturity calendar
231H 2018 Results- Madrid, 24 July 2018

1H 2017 1H 2018
3,091 5,207
13,09611,769
1,814 2,1153,789 1,690
6,5736,238
3,0521,753
6,2636,096
(1) Output at power plant bus bars (Gross output minus self-consumption)
(2) Net Capacity
Installed capacity and output
Total output(1) (GWh)
28% thermal output decrease in mainland
Hydro, nuclear and renewables represented 55% of total output (vs.
48% in 1H 2017)
Hydro
Nuclear Domestic coal
Imported coal
Total output (GWh)
Total installed capacity (GW)
24
CCGT
37,678 34,868
48% 55%
EGPE
GWh 1H 2018
(and chg. vs. 1H 2017)
Total 34,868 -7%
Hydro 5,207 68%
Nuclear 11,769 -10%
Coal 9,080 -22%
Natural gas 3,466 -26%
Oil-gas 3,231 -4%
Renewables 2,115 17%
Total Output (1)
GW at 1H 2018
(and chg. vs. 31 Dec. 2017)
Total 22.8 0%
Hydro 4.7 0%
Nuclear 3.3 0%
Coal 5.2 0%
Natural gas 5.4 0%
Oil-gas 2.4 -2%
Renewables 1.8 8%
Total Installed capacity (2)
SENP
-7%
1H 2018 Results- Madrid, 24 July 2018

Endesa: 1H 2018 P&L
251H 2018 Results- Madrid, 24 July 2018
Income 8,649 1,387 275 -377 9,934
Procurements and services -7,058 -101 -41 89 -7,111
1,591 1,286 234 -288 2,823
Self-constructed assets 17 57 6 0 80
Personnel expenses -269 -125 -83 4 -473
Other fixed operating expenses -544 -206 -159 283 -626
795 1,012 -2 -1 1,804
D&A -424 -305 -22 0 -751
371 707 -24 -1 1,053
Net financial results -83 -36 49 0 -70
Net results from equity method 14 3 3 0 20
Results from other investments 0 0 324 -324 0
Results on disposal of assets -19 2 -2 0 -19
283 676 350 -325 984
Income Tax Expense -60 -162 -7 1 -228
Minorities -4 0 0 0 -4
219 514 343 -324 752
Gross margin
EBITDA
PROFIT BEFORE TAX
NET ATTRIBUTABLE INCOME
Gx+Sx Dx
EBIT
Structure Adjustments TOTAL

Endesa: 1H 2017 P&L
261H 2018 Results- Madrid, 24 July 2018
Income 8,818 1,290 261 -365 10,004
Procurements and services -7,363 -66 -38 87 -7,380
1,455 1,224 223 -278 2,624
Self-constructed assets 11 60 8 0 79
Personnel expenses -236 -133 -90 8 -451
Other fixed operating expenses -532 -215 -168 268 -647
698 936 -27 -2 1,605
D&A -407 -269 -28 0 -704
291 667 -55 -2 901
Net financial results -50 -46 34 3 -59
Net results from equity method 7 3 0 0 10
Results from other investments 1 0 349 -349 1
Results on disposal of assets -14 5 4 0 -5
235 629 332 -348 848
Income Tax Expense -43 -153 4 2 -190
Minorities -5 0 0 0 -5
187 476 336 -346 653
Gross margin
EBITDA
PROFIT BEFORE TAX
NET ATTRIBUTABLE INCOME
Gx+Sx Dx
EBIT
Structure Adjustments TOTAL

27
Glossary of terms (I/II)
1H 2018 Results- Madrid, 24 July 2018 Note: Refer to the Consolidated Management Report for those Alternative Measures of Performance not contained herein
Item CalculationReference note (#) of Consolidated
Management Report
Average cost of debt (%)(Cost of gross financial debt) / gross average financial debt: €64 M x (365/180) / €6,335 M =
2.0%1.3.3
Average life of debt (number of years)(Principal x number of days of term) / (Principal in force at the end of the period x number of days
of the period): 37,077 / 6,836 = 5.4 yearsn/a
Cash flow from operations (€M) Net cash provided by operating activities (€639 M) 4.2
Debt maturities coverage (months)Maturity period (months) for vegetative debt that could be covered with the liquidity available: 32
months4.1
EBITDA (€M)
Revenues (€9,934 M) – Purchases and Services (€7,111 M) + Work performed by the entity and
capitalized (€80 M) – Personnel expenses (€473 M) – Other fixed operating expenses (€626 M) =
€1,804 M
1.3
EBIT (€M) EBITDA (€1,804 M) - Depreciation and amortization (€751 M) = €1,053 M 1.3
Fixed costs (Opex) (€M)Personnel expenses (€473 M) + Other fixed operating expenses (€626 M) - Work performed by
the entity and capitalized (€80 M) = €1,019 M1.3.2
Gross margin (€M) Revenues (€9,934 M) – Purchases and Services (€7,111 M) = €2,823 M 1.4.1
Leverage (times)Net financial debt (€5,956 M) / EBITDA (€1,937 M from 3Q & 4Q 17 + €1,804 M from 1H 2018) =
1.6xn/a
Net Capex (€M)Gross tangible (€458 M) and intangible (€71 M) Capex - assets from clients’ contributions and
subsidies (€69 M) = €460 M4.3

Item CalculationReference note (#) of Consolidated
Management Report
Net financial debt (€M)Long and short term financial debt (€5,556 M + €1,287 M) - Cash and cash equivalents (€880 M)
– Derivatives recognized as financial assets (€7 M) = €5,956 M4.1
Net financial results (€M) Financial Revenues (€18 M) - Financial Expenses (€87 M) - Foreign Exchanges (€1 M) = -€70 M 1.3.3
Revenues (€M) Sales (€9,560 M) + Other operating revenues (€374 M) = €9,934 M 1.3.1
Electric Integrated Margin (€M)Contribution margin Gx+Sx (€1,591 M) - Margin SENP (€310 M) - Margin SCVP (€49 M) - Margin
gas (€65 M) - Margin Endesa X (€57 M) - Others (€78 M) = €1,033 Mn/a
Unitary electric integrated margin (€/MWh)Electric Integrated Margin / Electric sales in the liberalized market in Spain and Portugal: €1,033
M / 40.6 TWh = €25.4/MWhn/a
Gas ordinary unitary margin (€/MWh)Gas Ordinary Margin / Gas sales excluding Wholesales business: €47.7 M / 44.7 TWh =
€1.1/MWhn/a
Endesa X Gross Margin (€M)Gross margin generated by the added value products and services commercialized by the
Endesa X unit = €57 Mn/a
28
Glossary of terms (II/II)
1H 2018 Results- Madrid, 24 July 2018 Note: Refer to the Consolidated Management Report for those Alternative Measures of Performance not contained herein
This document contains certain "forward-looking" statements regarding anticipated financial and operating results and statistics and other future events. These statements are not
guarantees of future performance and they are subject to material risks, uncertainties, changes and other factors that may be beyond ENDESA’s control or may be difficult to predict.
Forward-looking statements include, but are not limited to, information regarding: estimated future earnings; anticipated changes in generation and market share; expected changes in
demand for gas and gas sourcing; management strategy and goals; estimated cost reductions; tariffs and pricing structure; estimated capital expenditures; estimated asset disposals;
estimated changes in capacity and capacity mix; repowering of capacity and macroeconomic conditions. The main assumptions on which these expectations and targets are related to
the regulatory framework, exchange rates, commodities, counterparties, divestments, increases in production and installed capacity in markets where ENDESA operates, increases in
demand in these markets, allocation of production amongst different technologies, increases in costs associated with higher activity that do not exceed certain limits, electricity prices not
below certain levels, the cost of CCGT plants, and the availability and cost of the gas, coal, fuel oil and emission rights necessary to run our business at the desired levels.
In these statements, ENDESA avails itself of the protection provided by the Private Securities Litigation Reform Act of 1995 of the United States of America with respect to forward-
looking statements.
The following important factors, in addition to those discussed elsewhere in this document, could cause financial and operating results and statistics to differ materially from those
expressed in our forward-looking statements:
Economic and industry conditions; factors related to liquidity and financing; operating factors; strategic and regulatory, legal, fiscal, environmental, political and governmental factors;
reputational factors and transaction and commercial factors.
Further details on the factors that may cause actual results and other developments to differ significantly from the expectations implied or explicitly contained in this document are given in
the Risk Factors section of the current ENDESA regulated information filed with the Comisión Nacional del Mercado de Valores (the Spanish securities regulator or the “CNMV” for its
initials in Spanish).
No assurance can be given that the forward-looking statements in this document will be realised. Except as may be required by applicable law, neither Endesa nor any of its affiliates
intends to update these forward-looking statements.
Disclaimer
29