Jajanan Kariogenik
39
FREQUENCIES VARIABLES=Q11_A Q11_B Q11_C Q11_D Q11_E Q11_F Q11_G Q11_H Q11_I Usia JK Permanen Sulung /ORDER=ANALYSIS. Frequencies Notes Output Created 02-APR-2015 19:25:05 Comments Input Active Dataset DataSet3 Filter <none> Weight <none> Split File <none> N of Rows in Working Data File 450 Missing Value Handling Definition of Missing User-defined missing values are treated as missing. Cases Used Statistics are based on all cases with valid data. Syntax FREQUENCIES VARIABLES=Q11_A Q11_B Q11_C Q11_D Q11_E Q11_F Q11_G Q11_H Q11_I Usia JK Permanen Sulung /ORDER=ANALYSIS. Resources Processor Time 00:00:00.05 Elapsed Time 00:00:00.09 Statistics Q11_A Q11_B Q11_C Q11_D Q11_E Q11_F Q11_G Q11_H Q11_I Usia JK Permanen Sulung N Valid 419 419 419 419 419 419 419 419 419 450 450 450 450 Missing 31 31 31 31 31 31 31 31 31 0 0 0 0
description
Jajanan kariogenik
Transcript of Jajanan Kariogenik

FREQUENCIES VARIABLES=Q11_A Q11_B Q11_C Q11_D Q11_E Q11_F Q11_G Q11_H Q11_I Usia JK Permanen Sulung /ORDER=ANALYSIS.
Frequencies
Notes
Output Created 02-APR-2015 19:25:05
Comments
Input Active Dataset DataSet3
Filter <none>
Weight <none>
Split File <none>
N of Rows in Working Data File 450
Missing Value Handling Definition of Missing User-defined missing values are treated as
missing.
Cases Used Statistics are based on all cases with valid
data.
Syntax FREQUENCIES VARIABLES=Q11_A Q11_B
Q11_C Q11_D Q11_E Q11_F Q11_G Q11_H
Q11_I Usia JK Permanen Sulung
/ORDER=ANALYSIS.
Resources Processor Time 00:00:00.05
Elapsed Time 00:00:00.09
Statistics
Q11_A Q11_B Q11_C Q11_D Q11_E Q11_F Q11_G Q11_H Q11_I Usia JK Permanen Sulung
N Valid 419 419 419 419 419 419 419 419 419 450 450 450 450
Missing 31 31 31 31 31 31 31 31 31 0 0 0 0

Frequency Table
Q11_A
Frequency Percent Valid Percent
Cumulative
Percent
Valid .00 2 .4 .5 .5
1.00 24 5.3 5.7 6.2
2.00 77 17.1 18.4 24.6
3.00 162 36.0 38.7 63.2
4.00 47 10.4 11.2 74.5
5.00 60 13.3 14.3 88.8
6.00 47 10.4 11.2 100.0
Total 419 93.1 100.0
Missing System 31 6.9
Total 450 100.0
Q11_B
Frequency Percent Valid Percent
Cumulative
Percent
Valid 1.00 11 2.4 2.6 2.6
2.00 26 5.8 6.2 8.8
3.00 59 13.1 14.1 22.9
4.00 61 13.6 14.6 37.5
5.00 197 43.8 47.0 84.5
6.00 65 14.4 15.5 100.0
Total 419 93.1 100.0
Missing System 31 6.9
Total 450 100.0
Q11_C
Frequency Percent Valid Percent
Cumulative
Percent

Valid 1.00 110 24.4 26.3 26.3
2.00 102 22.7 24.3 50.6
3.00 28 6.2 6.7 57.3
4.00 23 5.1 5.5 62.8
5.00 120 26.7 28.6 91.4
6.00 36 8.0 8.6 100.0
Total 419 93.1 100.0
Missing System 31 6.9
Total 450 100.0
Q11_D
Frequency Percent Valid Percent
Cumulative
Percent
Valid .00 2 .4 .5 .5
1.00 155 34.4 37.0 37.5
2.00 117 26.0 27.9 65.4
3.00 103 22.9 24.6 90.0
4.00 14 3.1 3.3 93.3
5.00 10 2.2 2.4 95.7
6.00 18 4.0 4.3 100.0
Total 419 93.1 100.0
Missing System 31 6.9
Total 450 100.0
Q11_E
Frequency Percent Valid Percent
Cumulative
Percent
Valid 1.00 70 15.6 16.7 16.7
2.00 88 19.6 21.0 37.7
3.00 63 14.0 15.0 52.7
4.00 94 20.9 22.4 75.2
5.00 79 17.6 18.9 94.0
6.00 25 5.6 6.0 100.0
Total 419 93.1 100.0

Missing System 31 6.9
Total 450 100.0
Q11_F
Frequency Percent Valid Percent
Cumulative
Percent
Valid 1.00 11 2.4 2.6 2.6
2.00 21 4.7 5.0 7.6
3.00 82 18.2 19.6 27.2
4.00 121 26.9 28.9 56.1
5.00 145 32.2 34.6 90.7
6.00 39 8.7 9.3 100.0
Total 419 93.1 100.0
Missing System 31 6.9
Total 450 100.0
Q11_G
Frequency Percent Valid Percent
Cumulative
Percent
Valid 1.00 34 7.6 8.1 8.1
2.00 43 9.6 10.3 18.4
3.00 74 16.4 17.7 36.0
4.00 35 7.8 8.4 44.4
5.00 169 37.6 40.3 84.7
6.00 55 12.2 13.1 97.9
9.00 9 2.0 2.1 100.0
Total 419 93.1 100.0
Missing System 31 6.9
Total 450 100.0
Q11_H
Frequency Percent Valid Percent
Cumulative
Percent

Valid 1.00 72 16.0 17.2 17.2
2.00 32 7.1 7.6 24.8
3.00 156 34.7 37.2 62.1
4.00 60 13.3 14.3 76.4
5.00 82 18.2 19.6 95.9
6.00 17 3.8 4.1 100.0
Total 419 93.1 100.0
Missing System 31 6.9
Total 450 100.0
Q11_I
Frequency Percent Valid Percent
Cumulative
Percent
Valid .00 5 1.1 1.2 1.2
1.00 338 75.1 80.7 81.9
2.00 53 11.8 12.6 94.5
3.00 5 1.1 1.2 95.7
5.00 7 1.6 1.7 97.4
9.00 11 2.4 2.6 100.0
Total 419 93.1 100.0
Missing System 31 6.9
Total 450 100.0
Usia
Frequency Percent Valid Percent
Cumulative
Percent
Valid 6.00 150 33.3 33.3 33.3
9.00 150 33.3 33.3 66.7
12.00 150 33.3 33.3 100.0
Total 450 100.0 100.0
JK

Frequency Percent Valid Percent
Cumulative
Percent
Valid Laki-laki 225 50.0 50.0 50.0
Perempuan 225 50.0 50.0 100.0
Total 450 100.0 100.0
Permanen
Frequency Percent Valid Percent
Cumulative
Percent
Valid Sangat rendah 314 69.8 69.8 69.8
Rendah 71 15.8 15.8 85.6
Sedang 55 12.2 12.2 97.8
Tinggi 8 1.8 1.8 99.6
Sangat tinggi 2 .4 .4 100.0
Total 450 100.0 100.0
Sulung
Frequency Percent Valid Percent
Cumulative
Percent
Valid Sangat rendah 220 48.9 48.9 48.9
Rendah 63 14.0 14.0 62.9
Sedang 81 18.0 18.0 80.9
Tinggi 31 6.9 6.9 87.8
Sangat tinggi 55 12.2 12.2 100.0
Total 450 100.0 100.0
CROSSTABS /TABLES=Usia JK BY Q11_A Q11_B Q11_C Q11_D Q11_E Q11_F Q11_G Q11_H Q11_I Permanen Sulung /FORMAT=AVALUE TABLES /CELLS=COUNT ROW /COUNT ROUND CELL.

Crosstabs
Notes
Output Created 02-APR-2015 19:25:54
Comments
Input Active Dataset DataSet3
Filter <none>
Weight <none>
Split File <none>
N of Rows in Working Data File 450
Missing Value Handling Definition of Missing User-defined missing values are treated as
missing.
Cases Used Statistics for each table are based on all the
cases with valid data in the specified range(s)
for all variables in each table.
Syntax CROSSTABS
/TABLES=Usia JK BY Q11_A Q11_B
Q11_C Q11_D Q11_E Q11_F Q11_G Q11_H
Q11_I Permanen Sulung
/FORMAT=AVALUE TABLES
/CELLS=COUNT ROW
/COUNT ROUND CELL.
Resources Processor Time 00:00:00.19
Elapsed Time 00:00:00.25
Dimensions Requested 2
Cells Available 174734
Case Processing Summary
Cases
Valid Missing Total
N Percent N Percent N Percent
Usia * Q11_A 419 93.1% 31 6.9% 450 100.0%
Usia * Q11_B 419 93.1% 31 6.9% 450 100.0%
Usia * Q11_C 419 93.1% 31 6.9% 450 100.0%
Usia * Q11_D 419 93.1% 31 6.9% 450 100.0%

Usia * Q11_E 419 93.1% 31 6.9% 450 100.0%
Usia * Q11_F 419 93.1% 31 6.9% 450 100.0%
Usia * Q11_G 419 93.1% 31 6.9% 450 100.0%
Usia * Q11_H 419 93.1% 31 6.9% 450 100.0%
Usia * Q11_I 419 93.1% 31 6.9% 450 100.0%
Usia * Permanen 450 100.0% 0 0.0% 450 100.0%
Usia * Sulung 450 100.0% 0 0.0% 450 100.0%
JK * Q11_A 419 93.1% 31 6.9% 450 100.0%
JK * Q11_B 419 93.1% 31 6.9% 450 100.0%
JK * Q11_C 419 93.1% 31 6.9% 450 100.0%
JK * Q11_D 419 93.1% 31 6.9% 450 100.0%
JK * Q11_E 419 93.1% 31 6.9% 450 100.0%
JK * Q11_F 419 93.1% 31 6.9% 450 100.0%
JK * Q11_G 419 93.1% 31 6.9% 450 100.0%
JK * Q11_H 419 93.1% 31 6.9% 450 100.0%
JK * Q11_I 419 93.1% 31 6.9% 450 100.0%
JK * Permanen 450 100.0% 0 0.0% 450 100.0%
JK * Sulung 450 100.0% 0 0.0% 450 100.0%
Usia * Q11_A Crosstabulation
Q11_A
Total.00 1.00 2.00 3.00 4.00 5.00 6.00
Usia 6.00 Count 1 11 26 51 12 18 15 134
% within Usia 0.7% 8.2% 19.4% 38.1% 9.0% 13.4% 11.2% 100.0%
9.00 Count 0 6 22 50 23 14 20 135
% within Usia 0.0% 4.4% 16.3% 37.0% 17.0% 10.4% 14.8% 100.0%
12.00 Count 1 7 29 61 12 28 12 150
% within Usia 0.7% 4.7% 19.3% 40.7% 8.0% 18.7% 8.0% 100.0%
Total Count 2 24 77 162 47 60 47 419
% within Usia 0.5% 5.7% 18.4% 38.7% 11.2% 14.3% 11.2% 100.0%
Usia * Q11_B Crosstabulation
Q11_B
Total1.00 2.00 3.00 4.00 5.00 6.00
Usia 6.00 Count 6 13 16 20 58 21 134

% within Usia 4.5% 9.7% 11.9% 14.9% 43.3% 15.7% 100.0%
9.00 Count 3 7 18 17 65 25 135
% within Usia 2.2% 5.2% 13.3% 12.6% 48.1% 18.5% 100.0%
12.00 Count 2 6 25 24 74 19 150
% within Usia 1.3% 4.0% 16.7% 16.0% 49.3% 12.7% 100.0%
Total Count 11 26 59 61 197 65 419
% within Usia 2.6% 6.2% 14.1% 14.6% 47.0% 15.5% 100.0%
Usia * Q11_C Crosstabulation
Q11_C
Total1.00 2.00 3.00 4.00 5.00 6.00
Usia 6.00 Count 31 44 11 4 37 7 134
% within Usia 23.1% 32.8% 8.2% 3.0% 27.6% 5.2% 100.0%
9.00 Count 39 20 10 10 39 17 135
% within Usia 28.9% 14.8% 7.4% 7.4% 28.9% 12.6% 100.0%
12.00 Count 40 38 7 9 44 12 150
% within Usia 26.7% 25.3% 4.7% 6.0% 29.3% 8.0% 100.0%
Total Count 110 102 28 23 120 36 419
% within Usia 26.3% 24.3% 6.7% 5.5% 28.6% 8.6% 100.0%
Usia * Q11_D Crosstabulation
Q11_D
Total.00 1.00 2.00 3.00 4.00 5.00 6.00
Usia 6.00 Count 0 53 45 28 2 3 3 134
% within Usia 0.0% 39.6% 33.6% 20.9% 1.5% 2.2% 2.2% 100.0%
9.00 Count 1 46 32 37 5 4 10 135
% within Usia 0.7% 34.1% 23.7% 27.4% 3.7% 3.0% 7.4% 100.0%
12.00 Count 1 56 40 38 7 3 5 150
% within Usia 0.7% 37.3% 26.7% 25.3% 4.7% 2.0% 3.3% 100.0%
Total Count 2 155 117 103 14 10 18 419
% within Usia 0.5% 37.0% 27.9% 24.6% 3.3% 2.4% 4.3% 100.0%

Usia * Q11_E Crosstabulation
Q11_E
Total1.00 2.00 3.00 4.00 5.00 6.00
Usia 6.00 Count 29 32 17 27 22 7 134
% within Usia 21.6% 23.9% 12.7% 20.1% 16.4% 5.2% 100.0%
9.00 Count 17 23 26 30 28 11 135
% within Usia 12.6% 17.0% 19.3% 22.2% 20.7% 8.1% 100.0%
12.00 Count 24 33 20 37 29 7 150
% within Usia 16.0% 22.0% 13.3% 24.7% 19.3% 4.7% 100.0%
Total Count 70 88 63 94 79 25 419
% within Usia 16.7% 21.0% 15.0% 22.4% 18.9% 6.0% 100.0%
Usia * Q11_F Crosstabulation
Q11_F
Total1.00 2.00 3.00 4.00 5.00 6.00
Usia 6.00 Count 9 7 26 34 49 9 134
% within Usia 6.7% 5.2% 19.4% 25.4% 36.6% 6.7% 100.0%
9.00 Count 1 6 26 39 47 16 135
% within Usia 0.7% 4.4% 19.3% 28.9% 34.8% 11.9% 100.0%
12.00 Count 1 8 30 48 49 14 150
% within Usia 0.7% 5.3% 20.0% 32.0% 32.7% 9.3% 100.0%
Total Count 11 21 82 121 145 39 419
% within Usia 2.6% 5.0% 19.6% 28.9% 34.6% 9.3% 100.0%
Usia * Q11_G Crosstabulation
Q11_G
Total1.00 2.00 3.00 4.00 5.00 6.00 9.00
Usia 6.00 Count 10 11 23 14 55 13 8 134
% within Usia 7.5% 8.2% 17.2% 10.4% 41.0% 9.7% 6.0% 100.0%
9.00 Count 12 10 21 15 58 18 1 135
% within Usia 8.9% 7.4% 15.6% 11.1% 43.0% 13.3% 0.7% 100.0%
12.00 Count 12 22 30 6 56 24 0 150
% within Usia 8.0% 14.7% 20.0% 4.0% 37.3% 16.0% 0.0% 100.0%

Total Count 34 43 74 35 169 55 9 419
% within Usia 8.1% 10.3% 17.7% 8.4% 40.3% 13.1% 2.1% 100.0%
Usia * Q11_H Crosstabulation
Q11_H
Total1.00 2.00 3.00 4.00 5.00 6.00
Usia 6.00 Count 29 13 52 13 15 12 134
% within Usia 21.6% 9.7% 38.8% 9.7% 11.2% 9.0% 100.0%
9.00 Count 25 7 43 25 32 3 135
% within Usia 18.5% 5.2% 31.9% 18.5% 23.7% 2.2% 100.0%
12.00 Count 18 12 61 22 35 2 150
% within Usia 12.0% 8.0% 40.7% 14.7% 23.3% 1.3% 100.0%
Total Count 72 32 156 60 82 17 419
% within Usia 17.2% 7.6% 37.2% 14.3% 19.6% 4.1% 100.0%
Usia * Q11_I Crosstabulation
Q11_I
Total.00 1.00 2.00 3.00 5.00 9.00
Usia 6.00 Count 5 103 24 1 0 1 134
% within Usia 3.7% 76.9% 17.9% 0.7% 0.0% 0.7% 100.0%
9.00 Count 0 107 14 4 3 7 135
% within Usia 0.0% 79.3% 10.4% 3.0% 2.2% 5.2% 100.0%
12.00 Count 0 128 15 0 4 3 150
% within Usia 0.0% 85.3% 10.0% 0.0% 2.7% 2.0% 100.0%
Total Count 5 338 53 5 7 11 419
% within Usia 1.2% 80.7% 12.6% 1.2% 1.7% 2.6% 100.0%
Usia * Permanen Crosstabulation
Permanen
TotalSangat rendah Rendah Sedang Tinggi Sangat tinggi
Usia 6.00 Count 133 5 11 1 0 150
% within Usia 88.7% 3.3% 7.3% 0.7% 0.0% 100.0%

9.00 Count 108 28 11 3 0 150
% within Usia 72.0% 18.7% 7.3% 2.0% 0.0% 100.0%
12.00 Count 73 38 33 4 2 150
% within Usia 48.7% 25.3% 22.0% 2.7% 1.3% 100.0%
Total Count 314 71 55 8 2 450
% within Usia 69.8% 15.8% 12.2% 1.8% 0.4% 100.0%
Usia * Sulung Crosstabulation
Sulung
TotalSangat rendah Rendah Sedang Tinggi Sangat tinggi
Usia 6.00 Count 41 19 32 14 44 150
% within Usia 27.3% 12.7% 21.3% 9.3% 29.3% 100.0%
9.00 Count 55 27 40 17 11 150
% within Usia 36.7% 18.0% 26.7% 11.3% 7.3% 100.0%
12.00 Count 124 17 9 0 0 150
% within Usia 82.7% 11.3% 6.0% 0.0% 0.0% 100.0%
Total Count 220 63 81 31 55 450
% within Usia 48.9% 14.0% 18.0% 6.9% 12.2% 100.0%
JK * Q11_A Crosstabulation
Q11_A
Total.00 1.00 2.00 3.00 4.00 5.00 6.00
JK Laki-laki Count 2 16 40 78 19 28 27 210
% within JK 1.0% 7.6% 19.0% 37.1% 9.0% 13.3% 12.9% 100.0%
Perempuan Count 0 8 37 84 28 32 20 209
% within JK 0.0% 3.8% 17.7% 40.2% 13.4% 15.3% 9.6% 100.0%
Total Count 2 24 77 162 47 60 47 419
% within JK 0.5% 5.7% 18.4% 38.7% 11.2% 14.3% 11.2% 100.0%
JK * Q11_B Crosstabulation
Q11_B
Total1.00 2.00 3.00 4.00 5.00 6.00

JK Laki-laki Count 5 12 32 30 92 39 210
% within JK 2.4% 5.7% 15.2% 14.3% 43.8% 18.6% 100.0%
Perempuan Count 6 14 27 31 105 26 209
% within JK 2.9% 6.7% 12.9% 14.8% 50.2% 12.4% 100.0%
Total Count 11 26 59 61 197 65 419
% within JK 2.6% 6.2% 14.1% 14.6% 47.0% 15.5% 100.0%
JK * Q11_C Crosstabulation
Q11_C
Total1.00 2.00 3.00 4.00 5.00 6.00
JK Laki-laki Count 54 53 12 8 62 21 210
% within JK 25.7% 25.2% 5.7% 3.8% 29.5% 10.0% 100.0%
Perempuan Count 56 49 16 15 58 15 209
% within JK 26.8% 23.4% 7.7% 7.2% 27.8% 7.2% 100.0%
Total Count 110 102 28 23 120 36 419
% within JK 26.3% 24.3% 6.7% 5.5% 28.6% 8.6% 100.0%
JK * Q11_D Crosstabulation
Q11_D
Total.00 1.00 2.00 3.00 4.00 5.00 6.00
JK Laki-laki Count 2 70 60 53 6 7 12 210
% within JK 1.0% 33.3% 28.6% 25.2% 2.9% 3.3% 5.7% 100.0%
Perempuan Count 0 85 57 50 8 3 6 209
% within JK 0.0% 40.7% 27.3% 23.9% 3.8% 1.4% 2.9% 100.0%
Total Count 2 155 117 103 14 10 18 419
% within JK 0.5% 37.0% 27.9% 24.6% 3.3% 2.4% 4.3% 100.0%
JK * Q11_E Crosstabulation
Q11_E
Total1.00 2.00 3.00 4.00 5.00 6.00
JK Laki-laki Count 28 45 35 42 45 15 210
% within JK 13.3% 21.4% 16.7% 20.0% 21.4% 7.1% 100.0%

Perempuan Count 42 43 28 52 34 10 209
% within JK 20.1% 20.6% 13.4% 24.9% 16.3% 4.8% 100.0%
Total Count 70 88 63 94 79 25 419
% within JK 16.7% 21.0% 15.0% 22.4% 18.9% 6.0% 100.0%
JK * Q11_F Crosstabulation
Q11_F
Total1.00 2.00 3.00 4.00 5.00 6.00
JK Laki-laki Count 5 10 41 61 74 19 210
% within JK 2.4% 4.8% 19.5% 29.0% 35.2% 9.0% 100.0%
Perempuan Count 6 11 41 60 71 20 209
% within JK 2.9% 5.3% 19.6% 28.7% 34.0% 9.6% 100.0%
Total Count 11 21 82 121 145 39 419
% within JK 2.6% 5.0% 19.6% 28.9% 34.6% 9.3% 100.0%
JK * Q11_G Crosstabulation
Q11_G
Total1.00 2.00 3.00 4.00 5.00 6.00 9.00
JK Laki-laki Count 16 19 36 15 95 24 5 210
% within JK 7.6% 9.0% 17.1% 7.1% 45.2% 11.4% 2.4% 100.0%
Perempuan Count 18 24 38 20 74 31 4 209
% within JK 8.6% 11.5% 18.2% 9.6% 35.4% 14.8% 1.9% 100.0%
Total Count 34 43 74 35 169 55 9 419
% within JK 8.1% 10.3% 17.7% 8.4% 40.3% 13.1% 2.1% 100.0%
JK * Q11_H Crosstabulation
Q11_H
Total1.00 2.00 3.00 4.00 5.00 6.00
JK Laki-laki Count 37 15 76 29 41 12 210
% within JK 17.6% 7.1% 36.2% 13.8% 19.5% 5.7% 100.0%
Perempuan Count 35 17 80 31 41 5 209
% within JK 16.7% 8.1% 38.3% 14.8% 19.6% 2.4% 100.0%

Total Count 72 32 156 60 82 17 419
% within JK 17.2% 7.6% 37.2% 14.3% 19.6% 4.1% 100.0%
JK * Q11_I Crosstabulation
Q11_I
Total.00 1.00 2.00 3.00 5.00 9.00
JK Laki-laki Count 3 175 19 4 2 7 210
% within JK 1.4% 83.3% 9.0% 1.9% 1.0% 3.3% 100.0%
Perempuan Count 2 163 34 1 5 4 209
% within JK 1.0% 78.0% 16.3% 0.5% 2.4% 1.9% 100.0%
Total Count 5 338 53 5 7 11 419
% within JK 1.2% 80.7% 12.6% 1.2% 1.7% 2.6% 100.0%
JK * Permanen Crosstabulation
Permanen
TotalSangat rendah Rendah Sedang Tinggi Sangat tinggi
JK Laki-laki Count 158 33 30 3 1 225
% within JK 70.2% 14.7% 13.3% 1.3% 0.4% 100.0%
Perempuan Count 156 38 25 5 1 225
% within JK 69.3% 16.9% 11.1% 2.2% 0.4% 100.0%
Total Count 314 71 55 8 2 450
% within JK 69.8% 15.8% 12.2% 1.8% 0.4% 100.0%
JK * Sulung Crosstabulation
Sulung
TotalSangat rendah Rendah Sedang Tinggi Sangat tinggi
JK Laki-laki Count 108 33 44 13 27 225
% within JK 48.0% 14.7% 19.6% 5.8% 12.0% 100.0%
Perempuan Count 112 30 37 18 28 225
% within JK 49.8% 13.3% 16.4% 8.0% 12.4% 100.0%
Total Count 220 63 81 31 55 450
% within JK 48.9% 14.0% 18.0% 6.9% 12.2% 100.0%

MEANS TABLES=Q11_A Q11_B Q11_C Q11_D Q11_E Q11_F Q11_G Q11_H Q11_I D M F d_1 e f_1 DMFT deft BY Usia JK /CELLS=MEAN COUNT STDDEV.
Means
Notes
Output Created 02-APR-2015 19:26:08
Comments
Input Active Dataset DataSet3
Filter <none>
Weight <none>
Split File <none>
N of Rows in Working Data File 450
Missing Value Handling Definition of Missing For each dependent variable in a table, user-
defined missing values for the dependent and
all grouping variables are treated as missing.
Cases Used Cases used for each table have no missing
values in any independent variable, and not
all dependent variables have missing values.
Syntax MEANS TABLES=Q11_A Q11_B Q11_C
Q11_D Q11_E Q11_F Q11_G Q11_H Q11_I
D M F d_1 e f_1 DMFT deft BY Usia JK
/CELLS=MEAN COUNT STDDEV.
Resources Processor Time 00:00:00.11
Elapsed Time 00:00:00.17
Case Processing Summary
Cases
Included Excluded Total
N Percent N Percent N Percent
Q11_A * Usia 419 93.1% 31 6.9% 450 100.0%
Q11_B * Usia 419 93.1% 31 6.9% 450 100.0%
Q11_C * Usia 419 93.1% 31 6.9% 450 100.0%
Q11_D * Usia 419 93.1% 31 6.9% 450 100.0%
Q11_E * Usia 419 93.1% 31 6.9% 450 100.0%
Q11_F * Usia 419 93.1% 31 6.9% 450 100.0%
Q11_G * Usia 419 93.1% 31 6.9% 450 100.0%
Q11_H * Usia 419 93.1% 31 6.9% 450 100.0%
Q11_I * Usia 419 93.1% 31 6.9% 450 100.0%
D * Usia 450 100.0% 0 0.0% 450 100.0%
M * Usia 450 100.0% 0 0.0% 450 100.0%
F * Usia 450 100.0% 0 0.0% 450 100.0%
d_1 * Usia 450 100.0% 0 0.0% 450 100.0%
e * Usia 450 100.0% 0 0.0% 450 100.0%
f_1 * Usia 450 100.0% 0 0.0% 450 100.0%
DMFT * Usia 450 100.0% 0 0.0% 450 100.0%
deft * Usia 450 100.0% 0 0.0% 450 100.0%
Q11_A * JK 419 93.1% 31 6.9% 450 100.0%
Q11_B * JK 419 93.1% 31 6.9% 450 100.0%
Q11_C * JK 419 93.1% 31 6.9% 450 100.0%
Q11_D * JK 419 93.1% 31 6.9% 450 100.0%
Q11_E * JK 419 93.1% 31 6.9% 450 100.0%
Q11_F * JK 419 93.1% 31 6.9% 450 100.0%
Q11_G * JK 419 93.1% 31 6.9% 450 100.0%
Q11_H * JK 419 93.1% 31 6.9% 450 100.0%
Q11_I * JK 419 93.1% 31 6.9% 450 100.0%
D * JK 450 100.0% 0 0.0% 450 100.0%
M * JK 450 100.0% 0 0.0% 450 100.0%
F * JK 450 100.0% 0 0.0% 450 100.0%
d_1 * JK 450 100.0% 0 0.0% 450 100.0%
e * JK 450 100.0% 0 0.0% 450 100.0%
f_1 * JK 450 100.0% 0 0.0% 450 100.0%
DMFT * JK 450 100.0% 0 0.0% 450 100.0%
deft * JK 450 100.0% 0 0.0% 450 100.0%
Q11_A Q11_B Q11_C Q11_D Q11_E Q11_F Q11_G Q11_H Q11_I D M F d_1 e f_1 DMFT deft * Usia
Usia Q11_A Q11_B Q11_C Q11_D Q11_E Q11_F Q11_G Q11_H Q11_I D M F d_1 e f_1 DMFT deft
6.00 Mean 3.3134 4.2985 2.9478 2.0000 3.0149 4.0000 4.3433 3.0597 1.2164 .3667 .0067 .0067 4.1267 .2933 .0000 .3800 4.4200

N 134 134 134 134 134 134 134 134 134 150 150 150 150 150 150 150 150
Std. Deviation 1.46343 1.37666 1.69616 1.11044 1.56554 1.28613 1.83575 1.52553 .82591 1.00613 .08165 .08165 3.94305 1.00031 .00000 1.02105 4.09004
9.00 Mean 3.5704 4.5481 3.3037 2.3778 3.4593 4.2815 4.1630 3.3037 1.6667 .9267 .0000 .0000 2.1733 .5067 .0000 .9267 2.6800
N 135 135 135 135 135 135 135 135 135 150 150 150 150 150 150 150 150
Std. Deviation 1.39584 1.21384 1.89766 1.45513 1.50503 1.09034 1.54634 1.43139 1.86484 1.30614 .00000 .00000 2.35946 1.07907 .00000 1.30614 2.49380
12.00 Mean 3.3867 4.4600 3.1000 2.1533 3.2333 4.1867 3.9600 3.3333 1.3667 1.7067 .0600 .0133 .3067 .2333 .0000 1.7800 .5400
N 150 150 150 150 150 150 150 150 150 150 150 150 150 150 150 150 150
Std. Deviation 1.35996 1.11506 1.81252 1.24100 1.50354 1.07057 1.59226 1.28839 1.29748 1.43095 .28918 .11508 .64451 .62837 .00000 1.51445 .91688
Total Mean 3.4224 4.4368 3.1169 2.1766 3.2363 4.1575 4.1480 3.2363 1.4153 1.0000 .0222 .0067 2.2022 .3444 .0000 1.0289 2.5467
N 419 419 419 419 419 419 419 419 419 450 450 450 450 450 450 450 450
Std. Deviation 1.40592 1.23648 1.80594 1.28194 1.53087 1.15291 1.66359 1.41557 1.40210 1.37266 .17517 .08147 3.09558 .92913 .00000 1.41628 3.22764
Q11_A Q11_B Q11_C Q11_D Q11_E Q11_F Q11_G Q11_H Q11_I D M F d_1 e f_1 DMFT deft * JK
JK Q11_A Q11_B Q11_C Q11_D Q11_E Q11_F Q11_G Q11_H Q11_I D M F d_1 e f_1 DMFT deft
Laki-laki Mean 3.3714 4.4714 3.1619 2.2857 3.3619 4.1714 4.2190 3.2762 1.4190 1.0356 .0133 .0089 2.2178 .3244 .0000 1.0578 2.5422
N 210 210 210 210 210 210 210 210 210 225 225 225 225 225 225 225 225
Std. Deviation 1.49485 1.24955 1.84118 1.37102 1.52569 1.13624 1.63970 1.46405 1.51724 1.33583 .11495 .09407 3.02248 .82190 .00000 1.34670 3.16217
Perempuan Mean 3.4737 4.4019 3.0718 2.0670 3.1100 4.1435 4.0766 3.1962 1.4115 .9644 .0311 .0044 2.1867 .3644 .0000 1.0000 2.5511
N 209 209 209 209 209 209 209 209 209 225 225 225 225 225 225 225 225
Std. Deviation 1.31212 1.22521 1.77309 1.17886 1.52931 1.17198 1.68816 1.36747 1.27967 1.41060 .21940 .06667 3.17366 1.02669 .00000 1.48504 3.29885
Total Mean 3.4224 4.4368 3.1169 2.1766 3.2363 4.1575 4.1480 3.2363 1.4153 1.0000 .0222 .0067 2.2022 .3444 .0000 1.0289 2.5467
N 419 419 419 419 419 419 419 419 419 450 450 450 450 450 450 450 450
Std. Deviation 1.40592 1.23648 1.80594 1.28194 1.53087 1.15291 1.66359 1.41557 1.40210 1.37266 .17517 .08147 3.09558 .92913 .00000 1.41628 3.22764
CROSSTABS /TABLES=Q11_A Q11_B Q11_C Q11_D Q11_E Q11_F Q11_G Q11_H Q11_I BY Permanen Sulung /FORMAT=AVALUE TABLES /STATISTICS=CHISQ /CELLS=COUNT ROW /COUNT ROUND CELL.
Crosstabs

Notes
Output Created 02-APR-2015 19:26:36
Comments
Input Active Dataset DataSet3
Filter <none>
Weight <none>
Split File <none>
N of Rows in Working Data File 450
Missing Value Handling Definition of Missing User-defined missing values are treated as
missing.
Cases Used Statistics for each table are based on all the
cases with valid data in the specified range(s)
for all variables in each table.
Syntax CROSSTABS
/TABLES=Q11_A Q11_B Q11_C Q11_D
Q11_E Q11_F Q11_G Q11_H Q11_I BY
Permanen Sulung
/FORMAT=AVALUE TABLES
/STATISTICS=CHISQ
/CELLS=COUNT ROW
/COUNT ROUND CELL.
Resources Processor Time 00:00:00.23
Elapsed Time 00:00:00.44
Dimensions Requested 2
Cells Available 174734
Case Processing Summary
Cases
Valid Missing Total
N Percent N Percent N Percent
Q11_A * Permanen 419 93.1% 31 6.9% 450 100.0%
Q11_A * Sulung 419 93.1% 31 6.9% 450 100.0%
Q11_B * Permanen 419 93.1% 31 6.9% 450 100.0%
Q11_B * Sulung 419 93.1% 31 6.9% 450 100.0%
Q11_C * Permanen 419 93.1% 31 6.9% 450 100.0%
Q11_C * Sulung 419 93.1% 31 6.9% 450 100.0%

Q11_D * Permanen 419 93.1% 31 6.9% 450 100.0%
Q11_D * Sulung 419 93.1% 31 6.9% 450 100.0%
Q11_E * Permanen 419 93.1% 31 6.9% 450 100.0%
Q11_E * Sulung 419 93.1% 31 6.9% 450 100.0%
Q11_F * Permanen 419 93.1% 31 6.9% 450 100.0%
Q11_F * Sulung 419 93.1% 31 6.9% 450 100.0%
Q11_G * Permanen 419 93.1% 31 6.9% 450 100.0%
Q11_G * Sulung 419 93.1% 31 6.9% 450 100.0%
Q11_H * Permanen 419 93.1% 31 6.9% 450 100.0%
Q11_H * Sulung 419 93.1% 31 6.9% 450 100.0%
Q11_I * Permanen 419 93.1% 31 6.9% 450 100.0%
Q11_I * Sulung 419 93.1% 31 6.9% 450 100.0%
Q11_A * Permanen
Crosstab
Permanen
TotalSangat rendah Rendah Sedang Tinggi Sangat tinggi
Q11_A .00 Count 2 0 0 0 0 2
% within Q11_A 100.0% 0.0% 0.0% 0.0% 0.0% 100.0%
1.00 Count 21 1 2 0 0 24
% within Q11_A 87.5% 4.2% 8.3% 0.0% 0.0% 100.0%
2.00 Count 48 11 12 5 1 77
% within Q11_A 62.3% 14.3% 15.6% 6.5% 1.3% 100.0%
3.00 Count 107 28 25 1 1 162
% within Q11_A 66.0% 17.3% 15.4% 0.6% 0.6% 100.0%
4.00 Count 28 13 5 1 0 47
% within Q11_A 59.6% 27.7% 10.6% 2.1% 0.0% 100.0%
5.00 Count 40 13 7 0 0 60
% within Q11_A 66.7% 21.7% 11.7% 0.0% 0.0% 100.0%
6.00 Count 40 3 3 1 0 47
% within Q11_A 85.1% 6.4% 6.4% 2.1% 0.0% 100.0%
Total Count 286 69 54 8 2 419

% within Q11_A 68.3% 16.5% 12.9% 1.9% 0.5% 100.0%
Chi-Square Tests
Value df
Asymp. Sig. (2-
sided)
Pearson Chi-Square 32.150a 24 .123
Likelihood Ratio 33.343 24 .097
Linear-by-Linear Association 2.340 1 .126
N of Valid Cases 419
a. 19 cells (54.3%) have expected count less than 5. The minimum expected count
is .01.
Q11_A * Sulung
Crosstab
Sulung
TotalSangat rendah Rendah Sedang Tinggi Sangat tinggi
Q11_A .00 Count 1 0 0 1 0 2
% within Q11_A 50.0% 0.0% 0.0% 50.0% 0.0% 100.0%
1.00 Count 15 1 4 0 4 24
% within Q11_A 62.5% 4.2% 16.7% 0.0% 16.7% 100.0%
2.00 Count 38 7 13 6 13 77
% within Q11_A 49.4% 9.1% 16.9% 7.8% 16.9% 100.0%
3.00 Count 74 31 33 12 12 162
% within Q11_A 45.7% 19.1% 20.4% 7.4% 7.4% 100.0%
4.00 Count 18 4 7 6 12 47
% within Q11_A 38.3% 8.5% 14.9% 12.8% 25.5% 100.0%
5.00 Count 28 10 10 3 9 60
% within Q11_A 46.7% 16.7% 16.7% 5.0% 15.0% 100.0%
6.00 Count 27 7 10 0 3 47
% within Q11_A 57.4% 14.9% 21.3% 0.0% 6.4% 100.0%

Total Count 201 60 77 28 53 419
% within Q11_A 48.0% 14.3% 18.4% 6.7% 12.6% 100.0%
Chi-Square Tests
Value df
Asymp. Sig. (2-
sided)
Pearson Chi-Square 38.555a 24 .030
Likelihood Ratio 40.479 24 .019
Linear-by-Linear Association .417 1 .518
N of Valid Cases 419
a. 12 cells (34.3%) have expected count less than 5. The minimum expected count
is .13.
Q11_B * Permanen
Crosstab
Permanen
TotalSangat rendah Rendah Sedang Tinggi Sangat tinggi
Q11_B 1.00 Count 9 0 2 0 0 11
% within Q11_B 81.8% 0.0% 18.2% 0.0% 0.0% 100.0%
2.00 Count 16 3 6 1 0 26
% within Q11_B 61.5% 11.5% 23.1% 3.8% 0.0% 100.0%
3.00 Count 37 11 8 1 2 59
% within Q11_B 62.7% 18.6% 13.6% 1.7% 3.4% 100.0%
4.00 Count 38 11 8 4 0 61
% within Q11_B 62.3% 18.0% 13.1% 6.6% 0.0% 100.0%
5.00 Count 138 36 21 2 0 197
% within Q11_B 70.1% 18.3% 10.7% 1.0% 0.0% 100.0%
6.00 Count 48 8 9 0 0 65
% within Q11_B 73.8% 12.3% 13.8% 0.0% 0.0% 100.0%
Total Count 286 69 54 8 2 419

% within Q11_B 68.3% 16.5% 12.9% 1.9% 0.5% 100.0%
Chi-Square Tests
Value df
Asymp. Sig. (2-
sided)
Pearson Chi-Square 30.039a 20 .069
Likelihood Ratio 25.994 20 .166
Linear-by-Linear Association 3.914 1 .048
N of Valid Cases 419
a. 16 cells (53.3%) have expected count less than 5. The minimum expected count
is .05.
Q11_B * Sulung
Crosstab
Sulung
TotalSangat rendah Rendah Sedang Tinggi Sangat tinggi
Q11_B 1.00 Count 5 2 2 0 2 11
% within Q11_B 45.5% 18.2% 18.2% 0.0% 18.2% 100.0%
2.00 Count 5 2 9 2 8 26
% within Q11_B 19.2% 7.7% 34.6% 7.7% 30.8% 100.0%
3.00 Count 29 5 7 4 14 59
% within Q11_B 49.2% 8.5% 11.9% 6.8% 23.7% 100.0%
4.00 Count 32 5 6 7 11 61
% within Q11_B 52.5% 8.2% 9.8% 11.5% 18.0% 100.0%
5.00 Count 94 34 39 13 17 197
% within Q11_B 47.7% 17.3% 19.8% 6.6% 8.6% 100.0%
6.00 Count 36 12 14 2 1 65
% within Q11_B 55.4% 18.5% 21.5% 3.1% 1.5% 100.0%
Total Count 201 60 77 28 53 419
% within Q11_B 48.0% 14.3% 18.4% 6.7% 12.6% 100.0%

Chi-Square Tests
Value df
Asymp. Sig. (2-
sided)
Pearson Chi-Square 46.617a 20 .001
Likelihood Ratio 49.903 20 .000
Linear-by-Linear Association 17.081 1 .000
N of Valid Cases 419
a. 11 cells (36.7%) have expected count less than 5. The minimum expected count
is .74.
Q11_C * Permanen
Crosstab
Permanen
TotalSangat rendah Rendah Sedang Tinggi Sangat tinggi
Q11_C 1.00 Count 82 14 11 3 0 110
% within Q11_C 74.5% 12.7% 10.0% 2.7% 0.0% 100.0%
2.00 Count 70 15 12 3 2 102
% within Q11_C 68.6% 14.7% 11.8% 2.9% 2.0% 100.0%
3.00 Count 19 6 2 1 0 28
% within Q11_C 67.9% 21.4% 7.1% 3.6% 0.0% 100.0%
4.00 Count 15 4 4 0 0 23
% within Q11_C 65.2% 17.4% 17.4% 0.0% 0.0% 100.0%
5.00 Count 72 26 21 1 0 120
% within Q11_C 60.0% 21.7% 17.5% 0.8% 0.0% 100.0%
6.00 Count 28 4 4 0 0 36
% within Q11_C 77.8% 11.1% 11.1% 0.0% 0.0% 100.0%
Total Count 286 69 54 8 2 419
% within Q11_C 68.3% 16.5% 12.9% 1.9% 0.5% 100.0%

Chi-Square Tests
Value df
Asymp. Sig. (2-
sided)
Pearson Chi-Square 19.891a 20 .465
Likelihood Ratio 20.374 20 .435
Linear-by-Linear Association .412 1 .521
N of Valid Cases 419
a. 17 cells (56.7%) have expected count less than 5. The minimum expected count
is .11.
Q11_C * Sulung
Crosstab
Sulung
TotalSangat rendah Rendah Sedang Tinggi Sangat tinggi
Q11_C 1.00 Count 60 13 19 4 14 110
% within Q11_C 54.5% 11.8% 17.3% 3.6% 12.7% 100.0%
2.00 Count 43 11 15 6 27 102
% within Q11_C 42.2% 10.8% 14.7% 5.9% 26.5% 100.0%
3.00 Count 11 2 3 5 7 28
% within Q11_C 39.3% 7.1% 10.7% 17.9% 25.0% 100.0%
4.00 Count 10 5 4 3 1 23
% within Q11_C 43.5% 21.7% 17.4% 13.0% 4.3% 100.0%
5.00 Count 55 24 27 10 4 120
% within Q11_C 45.8% 20.0% 22.5% 8.3% 3.3% 100.0%
6.00 Count 22 5 9 0 0 36
% within Q11_C 61.1% 13.9% 25.0% 0.0% 0.0% 100.0%
Total Count 201 60 77 28 53 419
% within Q11_C 48.0% 14.3% 18.4% 6.7% 12.6% 100.0%

Chi-Square Tests
Value df
Asymp. Sig. (2-
sided)
Pearson Chi-Square 57.291a 20 .000
Likelihood Ratio 61.859 20 .000
Linear-by-Linear Association 5.355 1 .021
N of Valid Cases 419
a. 9 cells (30.0%) have expected count less than 5. The minimum expected count is
1.54.
Q11_D * Permanen
Crosstab
Permanen
TotalSangat rendah Rendah Sedang Tinggi Sangat tinggi
Q11_D .00 Count 1 1 0 0 0 2
% within Q11_D 50.0% 50.0% 0.0% 0.0% 0.0% 100.0%
1.00 Count 107 17 26 4 1 155
% within Q11_D 69.0% 11.0% 16.8% 2.6% 0.6% 100.0%
2.00 Count 79 19 14 4 1 117
% within Q11_D 67.5% 16.2% 12.0% 3.4% 0.9% 100.0%
3.00 Count 69 24 10 0 0 103
% within Q11_D 67.0% 23.3% 9.7% 0.0% 0.0% 100.0%
4.00 Count 8 5 1 0 0 14
% within Q11_D 57.1% 35.7% 7.1% 0.0% 0.0% 100.0%
5.00 Count 9 1 0 0 0 10
% within Q11_D 90.0% 10.0% 0.0% 0.0% 0.0% 100.0%
6.00 Count 13 2 3 0 0 18
% within Q11_D 72.2% 11.1% 16.7% 0.0% 0.0% 100.0%
Total Count 286 69 54 8 2 419
% within Q11_D 68.3% 16.5% 12.9% 1.9% 0.5% 100.0%

Chi-Square Tests
Value df
Asymp. Sig. (2-
sided)
Pearson Chi-Square 22.503a 24 .549
Likelihood Ratio 25.957 24 .355
Linear-by-Linear Association 2.042 1 .153
N of Valid Cases 419
a. 23 cells (65.7%) have expected count less than 5. The minimum expected count
is .01.
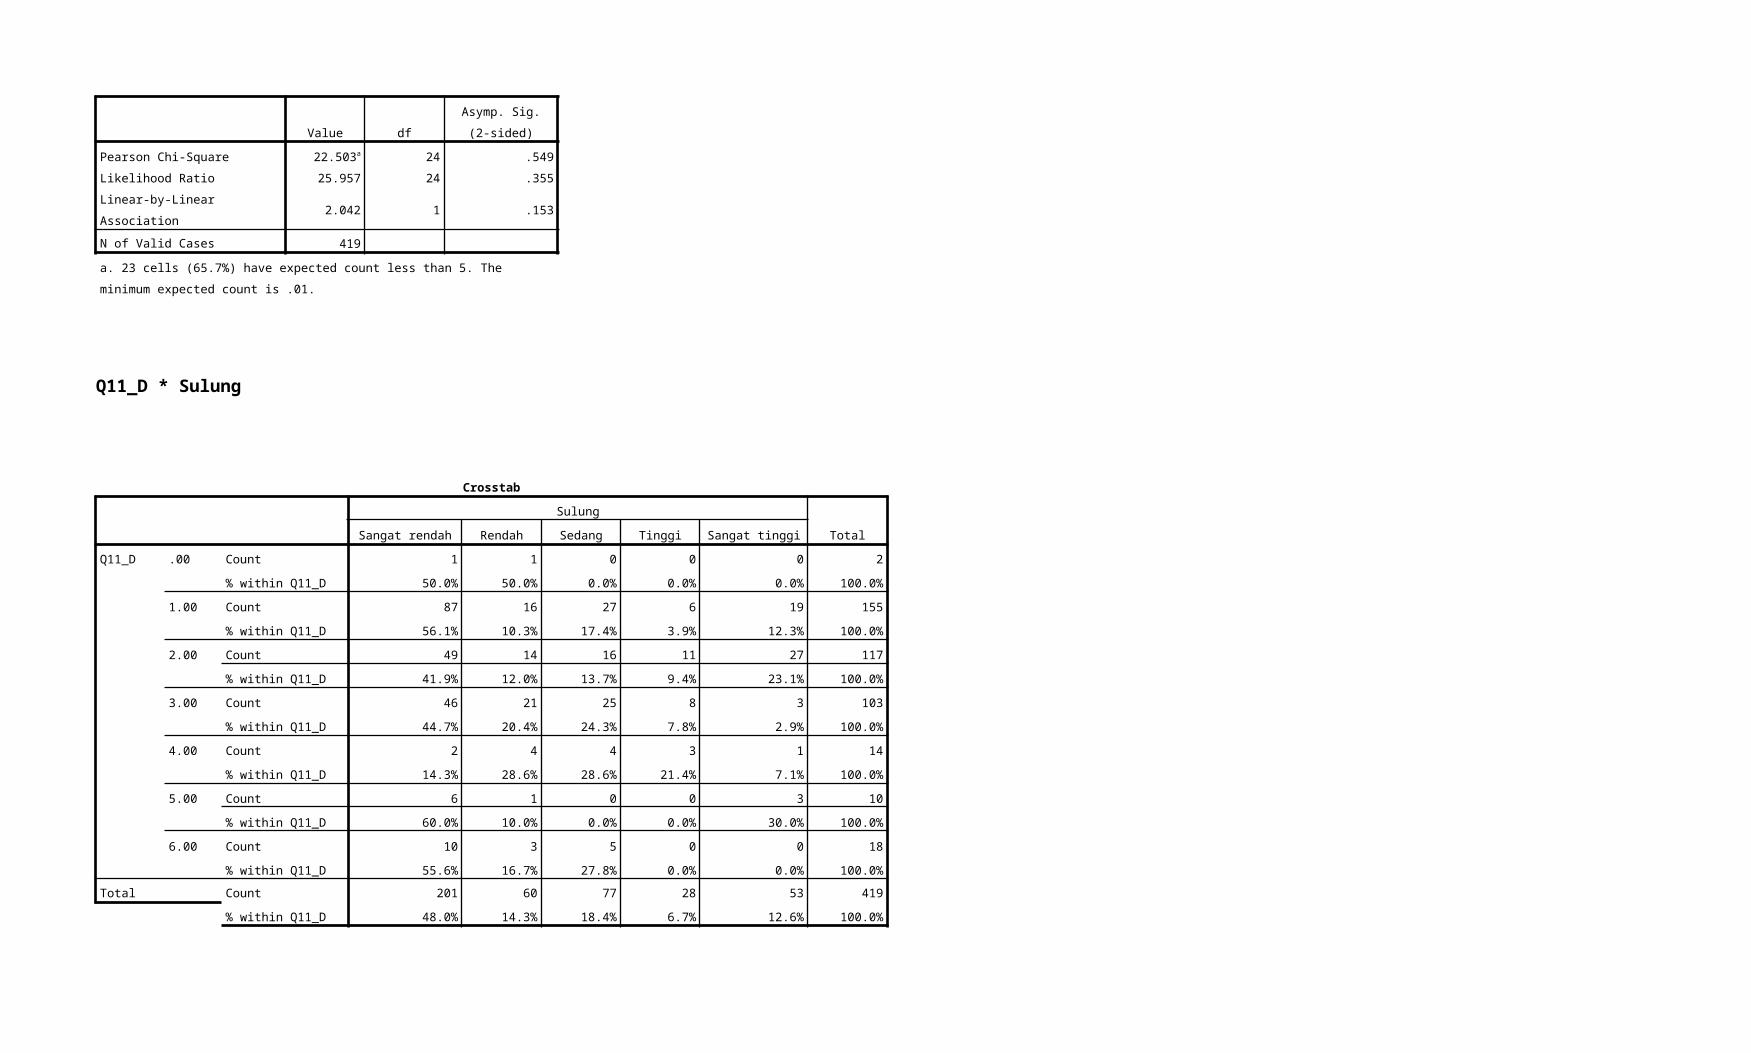
Q11_D * Sulung
Crosstab
Sulung
TotalSangat rendah Rendah Sedang Tinggi Sangat tinggi
Q11_D .00 Count 1 1 0 0 0 2
% within Q11_D 50.0% 50.0% 0.0% 0.0% 0.0% 100.0%
1.00 Count 87 16 27 6 19 155
% within Q11_D 56.1% 10.3% 17.4% 3.9% 12.3% 100.0%
2.00 Count 49 14 16 11 27 117
% within Q11_D 41.9% 12.0% 13.7% 9.4% 23.1% 100.0%
3.00 Count 46 21 25 8 3 103
% within Q11_D 44.7% 20.4% 24.3% 7.8% 2.9% 100.0%
4.00 Count 2 4 4 3 1 14
% within Q11_D 14.3% 28.6% 28.6% 21.4% 7.1% 100.0%
5.00 Count 6 1 0 0 3 10
% within Q11_D 60.0% 10.0% 0.0% 0.0% 30.0% 100.0%
6.00 Count 10 3 5 0 0 18
% within Q11_D 55.6% 16.7% 27.8% 0.0% 0.0% 100.0%
Total Count 201 60 77 28 53 419
% within Q11_D 48.0% 14.3% 18.4% 6.7% 12.6% 100.0%
Chi-Square Tests
Value df
Asymp. Sig. (2-
sided)
Pearson Chi-Square 56.122a 24 .000
Likelihood Ratio 61.936 24 .000
Linear-by-Linear Association .047 1 .829
N of Valid Cases 419
a. 18 cells (51.4%) have expected count less than 5. The minimum expected count
is .13.
Q11_E * Permanen
Crosstab
Permanen
TotalSangat rendah Rendah Sedang Tinggi Sangat tinggi
Q11_E 1.00 Count 59 6 4 1 0 70
% within Q11_E 84.3% 8.6% 5.7% 1.4% 0.0% 100.0%
2.00 Count 59 18 8 2 1 88
% within Q11_E 67.0% 20.5% 9.1% 2.3% 1.1% 100.0%
3.00 Count 45 10 5 2 1 63
% within Q11_E 71.4% 15.9% 7.9% 3.2% 1.6% 100.0%
4.00 Count 62 19 13 0 0 94
% within Q11_E 66.0% 20.2% 13.8% 0.0% 0.0% 100.0%
5.00 Count 45 13 18 3 0 79
% within Q11_E 57.0% 16.5% 22.8% 3.8% 0.0% 100.0%
6.00 Count 16 3 6 0 0 25
% within Q11_E 64.0% 12.0% 24.0% 0.0% 0.0% 100.0%
Total Count 286 69 54 8 2 419
% within Q11_E 68.3% 16.5% 12.9% 1.9% 0.5% 100.0%

Chi-Square Tests
Value df
Asymp. Sig. (2-
sided)
Pearson Chi-Square 30.548a 20 .061
Likelihood Ratio 32.653 20 .037
Linear-by-Linear Association 9.262 1 .002
N of Valid Cases 419
a. 14 cells (46.7%) have expected count less than 5. The minimum expected count
is .12.
Q11_E * Sulung
Crosstab
Sulung
TotalSangat rendah Rendah Sedang Tinggi Sangat tinggi
Q11_E 1.00 Count 36 9 10 2 13 70
% within Q11_E 51.4% 12.9% 14.3% 2.9% 18.6% 100.0%
2.00 Count 38 10 12 9 19 88
% within Q11_E 43.2% 11.4% 13.6% 10.2% 21.6% 100.0%
3.00 Count 27 10 10 7 9 63
% within Q11_E 42.9% 15.9% 15.9% 11.1% 14.3% 100.0%
4.00 Count 45 14 21 7 7 94
% within Q11_E 47.9% 14.9% 22.3% 7.4% 7.4% 100.0%
5.00 Count 40 13 20 3 3 79
% within Q11_E 50.6% 16.5% 25.3% 3.8% 3.8% 100.0%
6.00 Count 15 4 4 0 2 25
% within Q11_E 60.0% 16.0% 16.0% 0.0% 8.0% 100.0%
Total Count 201 60 77 28 53 419
% within Q11_E 48.0% 14.3% 18.4% 6.7% 12.6% 100.0%

Chi-Square Tests
Value df
Asymp. Sig. (2-
sided)
Pearson Chi-Square 30.501a 20 .062
Likelihood Ratio 33.182 20 .032
Linear-by-Linear Association 7.072 1 .008
N of Valid Cases 419
a. 6 cells (20.0%) have expected count less than 5. The minimum expected count is
1.67.
Q11_F * Permanen
Crosstab
Permanen
TotalSangat rendah Rendah Sedang Tinggi Sangat tinggi
Q11_F 1.00 Count 10 0 0 1 0 11
% within Q11_F 90.9% 0.0% 0.0% 9.1% 0.0% 100.0%
2.00 Count 15 5 0 1 0 21
% within Q11_F 71.4% 23.8% 0.0% 4.8% 0.0% 100.0%
3.00 Count 54 17 9 1 1 82
% within Q11_F 65.9% 20.7% 11.0% 1.2% 1.2% 100.0%
4.00 Count 81 22 16 2 0 121
% within Q11_F 66.9% 18.2% 13.2% 1.7% 0.0% 100.0%
5.00 Count 102 22 18 2 1 145
% within Q11_F 70.3% 15.2% 12.4% 1.4% 0.7% 100.0%
6.00 Count 24 3 11 1 0 39
% within Q11_F 61.5% 7.7% 28.2% 2.6% 0.0% 100.0%
Total Count 286 69 54 8 2 419
% within Q11_F 68.3% 16.5% 12.9% 1.9% 0.5% 100.0%
Chi-Square Tests

Value df
Asymp. Sig. (2-
sided)
Pearson Chi-Square 24.805a 20 .209
Likelihood Ratio 28.128 20 .106
Linear-by-Linear Association 1.532 1 .216
N of Valid Cases 419
a. 16 cells (53.3%) have expected count less than 5. The minimum expected count
is .05.
Q11_F * Sulung
Crosstab
Sulung
TotalSangat rendah Rendah Sedang Tinggi Sangat tinggi
Q11_F 1.00 Count 2 1 5 2 1 11
% within Q11_F 18.2% 9.1% 45.5% 18.2% 9.1% 100.0%
2.00 Count 7 2 5 0 7 21
% within Q11_F 33.3% 9.5% 23.8% 0.0% 33.3% 100.0%
3.00 Count 34 14 15 7 12 82
% within Q11_F 41.5% 17.1% 18.3% 8.5% 14.6% 100.0%
4.00 Count 56 19 25 11 10 121
% within Q11_F 46.3% 15.7% 20.7% 9.1% 8.3% 100.0%
5.00 Count 76 19 21 8 21 145
% within Q11_F 52.4% 13.1% 14.5% 5.5% 14.5% 100.0%
6.00 Count 26 5 6 0 2 39
% within Q11_F 66.7% 12.8% 15.4% 0.0% 5.1% 100.0%
Total Count 201 60 77 28 53 419
% within Q11_F 48.0% 14.3% 18.4% 6.7% 12.6% 100.0%
Chi-Square Tests

Value df
Asymp. Sig. (2-
sided)
Pearson Chi-Square 34.407a 20 .023
Likelihood Ratio 35.406 20 .018
Linear-by-Linear Association 12.225 1 .000
N of Valid Cases 419
a. 10 cells (33.3%) have expected count less than 5. The minimum expected count
is .74.
Q11_G * Permanen
Crosstab
Permanen
TotalSangat rendah Rendah Sedang Tinggi Sangat tinggi
Q11_G 1.00 Count 22 6 6 0 0 34
% within Q11_G 64.7% 17.6% 17.6% 0.0% 0.0% 100.0%
2.00 Count 31 6 4 1 1 43
% within Q11_G 72.1% 14.0% 9.3% 2.3% 2.3% 100.0%
3.00 Count 49 13 9 2 1 74
% within Q11_G 66.2% 17.6% 12.2% 2.7% 1.4% 100.0%
4.00 Count 28 4 2 1 0 35
% within Q11_G 80.0% 11.4% 5.7% 2.9% 0.0% 100.0%
5.00 Count 115 28 22 4 0 169
% within Q11_G 68.0% 16.6% 13.0% 2.4% 0.0% 100.0%
6.00 Count 32 12 11 0 0 55
% within Q11_G 58.2% 21.8% 20.0% 0.0% 0.0% 100.0%
9.00 Count 9 0 0 0 0 9
% within Q11_G 100.0% 0.0% 0.0% 0.0% 0.0% 100.0%
Total Count 286 69 54 8 2 419
% within Q11_G 68.3% 16.5% 12.9% 1.9% 0.5% 100.0%

Chi-Square Tests
Value df
Asymp. Sig. (2-
sided)
Pearson Chi-Square 20.265a 24 .682
Likelihood Ratio 24.119 24 .455
Linear-by-Linear Association .322 1 .570
N of Valid Cases 419
a. 18 cells (51.4%) have expected count less than 5. The minimum expected count
is .04.
Q11_G * Sulung
Crosstab
Sulung
TotalSangat rendah Rendah Sedang Tinggi Sangat tinggi
Q11_G 1.00 Count 14 3 9 3 5 34
% within Q11_G 41.2% 8.8% 26.5% 8.8% 14.7% 100.0%
2.00 Count 20 5 6 1 11 43
% within Q11_G 46.5% 11.6% 14.0% 2.3% 25.6% 100.0%
3.00 Count 35 8 9 10 12 74
% within Q11_G 47.3% 10.8% 12.2% 13.5% 16.2% 100.0%
4.00 Count 13 4 6 3 9 35
% within Q11_G 37.1% 11.4% 17.1% 8.6% 25.7% 100.0%
5.00 Count 86 29 34 8 12 169
% within Q11_G 50.9% 17.2% 20.1% 4.7% 7.1% 100.0%
6.00 Count 33 10 8 1 3 55
% within Q11_G 60.0% 18.2% 14.5% 1.8% 5.5% 100.0%
9.00 Count 0 1 5 2 1 9
% within Q11_G 0.0% 11.1% 55.6% 22.2% 11.1% 100.0%
Total Count 201 60 77 28 53 419
% within Q11_G 48.0% 14.3% 18.4% 6.7% 12.6% 100.0%

Chi-Square Tests
Value df
Asymp. Sig. (2-
sided)
Pearson Chi-Square 52.208a 24 .001
Likelihood Ratio 52.101 24 .001
Linear-by-Linear Association 4.391 1 .036
N of Valid Cases 419
a. 13 cells (37.1%) have expected count less than 5. The minimum expected count
is .60.
Q11_H * Permanen
Crosstab
Permanen
TotalSangat rendah Rendah Sedang Tinggi Sangat tinggi
Q11_H 1.00 Count 44 11 16 1 0 72
% within Q11_H 61.1% 15.3% 22.2% 1.4% 0.0% 100.0%
2.00 Count 24 8 0 0 0 32
% within Q11_H 75.0% 25.0% 0.0% 0.0% 0.0% 100.0%
3.00 Count 95 29 26 5 1 156
% within Q11_H 60.9% 18.6% 16.7% 3.2% 0.6% 100.0%
4.00 Count 44 13 3 0 0 60
% within Q11_H 73.3% 21.7% 5.0% 0.0% 0.0% 100.0%
5.00 Count 63 7 9 2 1 82
% within Q11_H 76.8% 8.5% 11.0% 2.4% 1.2% 100.0%
6.00 Count 16 1 0 0 0 17
% within Q11_H 94.1% 5.9% 0.0% 0.0% 0.0% 100.0%
Total Count 286 69 54 8 2 419
% within Q11_H 68.3% 16.5% 12.9% 1.9% 0.5% 100.0%

Chi-Square Tests
Value df
Asymp. Sig. (2-
sided)
Pearson Chi-Square 33.555a 20 .029
Likelihood Ratio 42.764 20 .002
Linear-by-Linear Association 5.771 1 .016
N of Valid Cases 419
a. 15 cells (50.0%) have expected count less than 5. The minimum expected count
is .08.
Q11_H * Sulung
Crosstab
Sulung
TotalSangat rendah Rendah Sedang Tinggi Sangat tinggi
Q11_H 1.00 Count 42 11 17 0 2 72
% within Q11_H 58.3% 15.3% 23.6% 0.0% 2.8% 100.0%
2.00 Count 15 4 5 1 7 32
% within Q11_H 46.9% 12.5% 15.6% 3.1% 21.9% 100.0%
3.00 Count 69 23 27 14 23 156
% within Q11_H 44.2% 14.7% 17.3% 9.0% 14.7% 100.0%
4.00 Count 24 9 13 5 9 60
% within Q11_H 40.0% 15.0% 21.7% 8.3% 15.0% 100.0%
5.00 Count 45 11 11 6 9 82
% within Q11_H 54.9% 13.4% 13.4% 7.3% 11.0% 100.0%
6.00 Count 6 2 4 2 3 17
% within Q11_H 35.3% 11.8% 23.5% 11.8% 17.6% 100.0%
Total Count 201 60 77 28 53 419
% within Q11_H 48.0% 14.3% 18.4% 6.7% 12.6% 100.0%
Chi-Square Tests

Value df
Asymp. Sig. (2-
sided)
Pearson Chi-Square 24.153a 20 .236
Likelihood Ratio 30.977 20 .055
Linear-by-Linear Association 3.096 1 .078
N of Valid Cases 419
a. 9 cells (30.0%) have expected count less than 5. The minimum expected count is
1.14.
Q11_I * Permanen
Crosstab
Permanen
TotalSangat rendah Rendah Sedang Tinggi Sangat tinggi
Q11_I .00 Count 5 0 0 0 0 5
% within Q11_I 100.0% 0.0% 0.0% 0.0% 0.0% 100.0%
1.00 Count 229 57 46 5 1 338
% within Q11_I 67.8% 16.9% 13.6% 1.5% 0.3% 100.0%
2.00 Count 36 7 6 3 1 53
% within Q11_I 67.9% 13.2% 11.3% 5.7% 1.9% 100.0%
3.00 Count 3 2 0 0 0 5
% within Q11_I 60.0% 40.0% 0.0% 0.0% 0.0% 100.0%
5.00 Count 3 2 2 0 0 7
% within Q11_I 42.9% 28.6% 28.6% 0.0% 0.0% 100.0%
9.00 Count 10 1 0 0 0 11
% within Q11_I 90.9% 9.1% 0.0% 0.0% 0.0% 100.0%
Total Count 286 69 54 8 2 419
% within Q11_I 68.3% 16.5% 12.9% 1.9% 0.5% 100.0%
Chi-Square Tests

Value df
Asymp. Sig. (2-
sided)
Pearson Chi-Square 17.776a 20 .602
Likelihood Ratio 18.811 20 .534
Linear-by-Linear Association .631 1 .427
N of Valid Cases 419
a. 22 cells (73.3%) have expected count less than 5. The minimum expected count
is .02.
Q11_I * Sulung
Crosstab
Sulung
TotalSangat rendah Rendah Sedang Tinggi Sangat tinggi
Q11_I .00 Count 2 0 1 0 2 5
% within Q11_I 40.0% 0.0% 20.0% 0.0% 40.0% 100.0%
1.00 Count 169 54 60 18 37 338
% within Q11_I 50.0% 16.0% 17.8% 5.3% 10.9% 100.0%
2.00 Count 18 3 11 7 14 53
% within Q11_I 34.0% 5.7% 20.8% 13.2% 26.4% 100.0%
3.00 Count 0 1 2 2 0 5
% within Q11_I 0.0% 20.0% 40.0% 40.0% 0.0% 100.0%
5.00 Count 5 0 1 1 0 7
% within Q11_I 71.4% 0.0% 14.3% 14.3% 0.0% 100.0%
9.00 Count 7 2 2 0 0 11
% within Q11_I 63.6% 18.2% 18.2% 0.0% 0.0% 100.0%
Total Count 201 60 77 28 53 419
% within Q11_I 48.0% 14.3% 18.4% 6.7% 12.6% 100.0%
Chi-Square Tests

Value df
Asymp. Sig. (2-
sided)
Pearson Chi-Square 42.105a 20 .003
Likelihood Ratio 42.477 20 .002
Linear-by-Linear Association .533 1 .465
N of Valid Cases 419
a. 20 cells (66.7%) have expected count less than 5. The minimum expected count
is .33.

![[IWIC2015 - PROPOSAL] JAJANAN - Authentic Local Food guide (Indonesia) for tourist](https://static.fdocuments.in/doc/165x107/58aaa8551a28abfa0e8b5a75/iwic2015-proposal-jajanan-authentic-local-food-guide-indonesia-for.jpg)