JACKSONVILLE HARBOR NAVIGATION STUDY - APA … · JACKSONVILLE HARBOR NAVIGATION STUDY ... coastal...
15
JACKSONVILLE HARBOR NAVIGATION STUDY 2014 APA Florida Conference Eric Bush, USACE September 6, 2014
Transcript of JACKSONVILLE HARBOR NAVIGATION STUDY - APA … · JACKSONVILLE HARBOR NAVIGATION STUDY ... coastal...

JACKSONVILLE HARBOR
NAVIGATION STUDY2014 APA Florida Conference
Eric Bush, USACESeptember 6, 2014

Deepening Areas: ► Deepen from the Entrance Channel to approximately River Mile 13
from the existing 40-foot depth to 47 feet
Widening Areas:► Area 1: Mile Point: increase to the north by 200 feet
Training Wall Reach: increase to the south 100 feet transitioning to 250 feet
► Area 2: St. Johns Bluff Reach/White Shells Cut: up to 300 feet
Turning Basin Areas:► Blount Island: ~ 2700' long by 1500' wide
RECOMMENDED PLAN 2
► Brills Cut: ~2500' long by 1500' wide
BUILDING STRONG®

RECOMMENDED PLAN continued
3
Estimated Project Cost: ~$684 million► Federal Share ~ $312.7 million
► Non-federal Share (JAXPORT) ~$371.5 million
► Benefit-to-Cost Ratio (BCR): 2.70
► Mitigation $2.9M
► Monitoring: Construction + 1 yr: $7.5M
► Monitoring/Corrective Action Plan:
Year 2-10: $23.3M (non-federal)
Estimated Construction Duration:
4 - 6 years
18 million cubic yards of material
expected to be dredged
Dredged material placed in an ocean site
(unless suitable for beach or other areas)

Principles and Guidelines:
“Contribute to national economic development
consistent with protecting the Nation’s environment”
“Each alternative plan is to be formulated in
consideration of: completeness, effectiveness,
efficiency, and acceptability. Appropriate mitigation
of adverse effects is to be an integral part of each alternative plan.”
THE FEDERAL OBJECTIVE
BUILDING STRONG®
4

Transforming Civil Works:
SMART Planning► 3 x 3 x 3 Planning Studies
SMART Planning = ► S: Specific
M: Measurable
A: Attainable
R: Risk Informed
T: Timely
President Obama’s
“We Can’t Wait” Initiative► Accelerated completion of
study approximately 14 months
STUDY DRIVERS
BUILDING STRONG®
5
2inventory
& forecast
conditions
1identify
problems
&opportunities
formulate
alternatives3evaluate
alternatives4
6 select
plan
compare
alternatives5

WIDENING AND SHIP SIMULATION
Ship simulation: Defined Widening
footprint
Incremental Analysis: Widening
increments evaluated independently
and with deepening
Turning basins: Included with
widening measures due to their interdependencies
Image: Plot from the Blount Island Turning Area Ship Simulations
6
6
BUILDING STRONG®
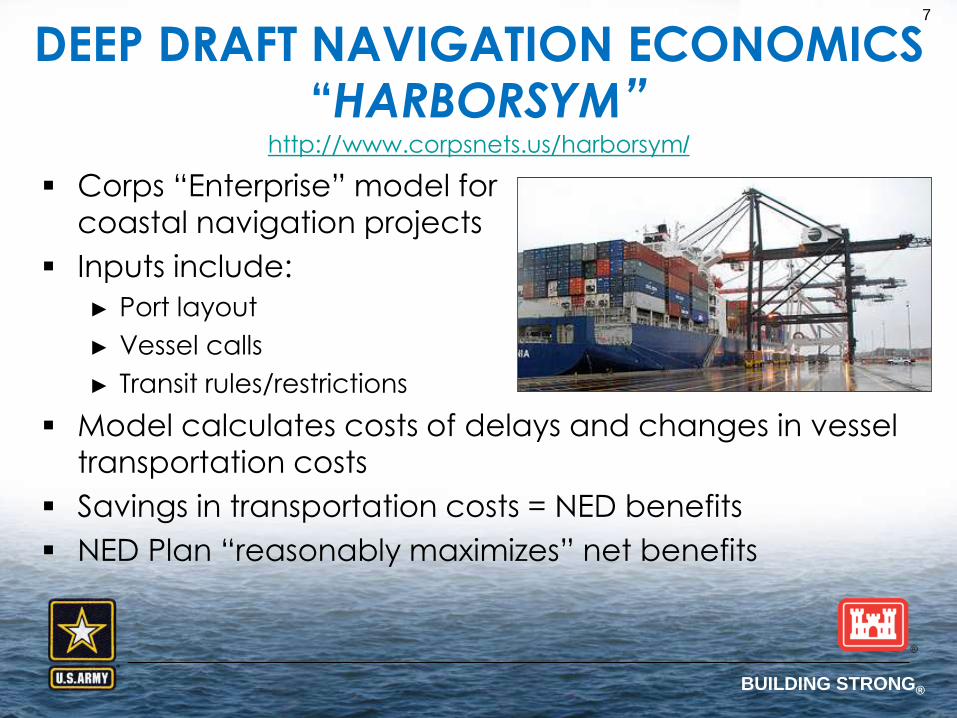
DEEP DRAFT NAVIGATION ECONOMICS“HARBORSYM”
Corps “Enterprise” model for
coastal navigation projects
Inputs include:
► Port layout
► Vessel calls
► Transit rules/restrictions
Model calculates costs of delays and changes in vessel
transportation costs
Savings in transportation costs = NED benefits
NED Plan “reasonably maximizes” net benefits
http://www.corpsnets.us/harborsym/
7

BUILDING STRONG®
ECONOMIC ANALYSIS
Depth
$Million Average Annual Equivalent
BCRCosts* Benefits Net Benefits
44 feet $23.3 $66.7 $43.4 2.9
45 feet (NED) $25.5 $84.2 $58.7 3.3
46 feet $31.8 $88.0 $56.2 2.8
47 feet (LPP) $33.7 $89.7 $56.0 2.7
*Costs include Interest During Construction (IDC) and O&M
(FY14 Discount Rate 3.5% and October 2013 Price Level)
8
8

BUILDING STRONG®
ENVIRONMENTAL ISSUES/CONCERNS Changes to Salinity
(main stem + tributaries)
Impacts on:► Freshwater wetlands
► SAV
► Fish
► Shrimp
► Groundwater
Monitoring
Mitigation
Blasting Effects
Erosion/Sedimentation
9

10
WHERE I CAUGHT THE BIG FISH

PROJECT AND SEA-LEVEL CHANGE
Used current guidance (EC 1165-2-212)
Results of analysis for the 50-year
period, 2018-2068:
Low: 0.39 feet
Intermediate: 0.87 feet
High: 2.4 feet
Conclusion for navigation:
Based on these sea-level rise
projections and elevations of
current and planned port facilities,
no impacts on navigation and
minor impacts on port facilities
Conclusion for salinity impacts:
Majority of salinity changes will
occur due to sea-level change;
only minor impacts attributable
to the project
2.00
SLC
3.00
AVERAGE SALINITY (PPT) AT BUCKMAN BRIDGE
2.90
2.05WITH PROJECTEXISTING
SLC WITH PROJECT
1.00
SLC:
Sea-Level ChangeENVIRONMENTAL
STUDY AREA
~13 miles
FULLER WARREN
& ACOSTABRIDGES
BUCKMANBRIDGE
SHANDS BRIDGE
PROJECT AREA
11

ENVIRONMENTAL IMPACTS & MITIGATIONMINOR INCREASES IN SALINITY:
Wetlands:395 acres affected by minor increase in salinity stress
Fish Distribution:<5% change (minor impact to
species distribution)
Submerged Aquatic Vegetation (SAV): 180 acres affected by minor increase in salinity stress
Buckman Bridge
PROJECT AREA
Shands Bridge
ENVIRONMENTAL STUDY AREA
~13 miles
MITIGATION 638 acres of Conservation Lands Monitoring (construction + 1 year)
CORRECTIVE ACTION PLAN Monitoring, Modeling, Assessment (post-construction)
12

PUBLIC/AGENCY INVOLVEMENTStudy Initiation/Scoping Scoping letters & Notice of Intent (NOI)
to prepare a Draft EIS 2007
Public Meetings 6 Public Meetings or Workshops Bi-Monthly Teleconferences
throughout study (continuing)
Agency Coordination Interagency Planning Meeting
(preliminary alternatives) February 2008 Cooperating Agency Letters: 2011 Meetings on Ecological Modeling:
March & October 2012 Monthly Teleconferences CZMA (FDEP, State agencies) Aug 2013 Endangered Species Act (ESA) coordination
with USFWS (November 2013) and NMFS (February 2014)
Magnuson-Stevens Act (EFH) coordination with NMFS January 2014
13

BUILDING STRONG®
FINAL FEASIBILITY REPORT/EIS DOCUMENTSFinal Feasibility Report/EIS:
http://www.saj.usace.army.mil/About/DivisionsOffices/Planning/
EnvironmentalBranch/EnvironmentalDocuments.aspx#Duval►Ecological Modeling (App D)
►Mitigation & Corrective Action Plan (App E)
Chief’s Report: http://www.saj.usace.army.mil/Portals/44/docs/Navigation/Jax_Harbor_Signed_Chiefs_report.pdf
Authorization (Sect. 7002[1]8., WRRDA 2014)
14

Jacksonville Harbor
Navigation Study
Thank You!
15
BUILDING STRONG®