Iwan Holleman and Hans Beekhuis Internal Report, KNMI IR ...
44
Evaluation of three Radar Product Processors Iwan Holleman and Hans Beekhuis Internal Report, KNMI IR-2005-03, 2005
Transcript of Iwan Holleman and Hans Beekhuis Internal Report, KNMI IR ...

Evaluation of three Radar Product Processors
Iwan Holleman and Hans Beekhuis
Internal Report, KNMI IR-2005-03, 2005

2

Contents
1 Introduction 5
2 Set-up of evaluation 9
3 General evaluation 113.1 Muran 3 13
3.1.1 Configuration 133.1.2 Operational stability 133.1.3 Geographical projection 143.1.4 Products 153.1.5 File format 163.1.6 Documentation 16
3.2 Iris 8 173.2.1 Configuration 173.2.2 Operational stability 183.2.3 Geographical projection 193.2.4 Products 193.2.5 File format 203.2.6 Documentation 21
3.3 Rainbow 5 223.3.1 Configuration 223.3.2 Operational stability 233.3.3 Geographical projection 233.3.4 Products 243.3.5 File format 253.3.6 Documentation 26
4 Evaluation of products 274.1 PseudoCAPPI product 274.2 Weather Radar Wind Profiles (VVP) 31

4 CONTENTS
5 Summary and conclusions 39
References 41
A Geographical projection of KNMI radar images 43

Chapter 1
Introduction
Currently KNMI is preparing a technical upgrade of the weather radar systems toextend their operational lifetime with another 10 years. Apart from a mechanicaloverhaul the upgrade will consist of a renewal of the radar (scan) controller, thesignal processor, and the product processor. The radar controller and the signalprocessor are 10-year-old computer systems which have become outdated anddifficult to maintain. This technical upgrade is also the reason for a recent reviewof the current operational clutter removal scheme (Holleman and Beekhuis, 2005).The planned renewal of the product processor is the incentive for this evaluationof three radar product processor packages.
It is our experience that considerable effort is required to check the configu-ration and to verify the quality of the radar product processor. Therefore, strongemphasis is put on these two aspects in the evaluation. During a tender proceduretime is usually lacking to evaluate the offered packages in detail, e.g. by feedingthe packages with real-time data and analyzing the output. As a result it is hardto ensure that the radar product processors fulfill the requirements. To get a aheadof this it was decided to evaluate the most likely candidates. In this evaluation thefollowing radar product processor packages have been considered:
Muran 3 Gamic GmbH is a German company residing in Aachen that pro-vides solutions for radar signal processing and product generation. Theradar product processor package of Gamic is called Muran (Gamic, 2005).The Deutscher Wetterdienst (DWD) is currently migrating their operationalradar product processors to Muran for its complete radar network consistingof 16 operational radars and 1 research radar. The version we have evaluatedat KNMI is Muran 3.
Iris 8 The Iris radar product processor package (Sigmet, 2002) is provided bySigmet Inc. Sigmet is based in Boston, MA, and is well-known for its RVPsignal processor and product generation software. Sigmet has developed

6 Introduction
the Iris package for controlling the RVP signal processor and for generationof products from the data. The Iris product processor package has beendeveloped some time ago and is well established and widely used by now.The current version of the Iris package is 8.
Rainbow 5 Gematronik GmbH is a German radar manufacturer located in Neussthat provides complete weather radar systems, consisting of both radar hard-ware and software. The radar product processor of Gematronik is calledRainbow (Gematronik, 2005). The Rainbow package is on the market nowfor more than 10 years. The latest release of Rainbow, Rainbow 5, is acomplete remake of the package from scratch.
The outline of this report on the evaluation of the three radar product proces-sors is as follows:
• The setup of the evaluation of the radar product processor packages is de-scribed in chapter 2. The used hardware, operating systems, file formatconverters, and clutter removal procedure are discussed in some detail.
• In chapter 3 of this report a concise general evaluation of the packages ispresented. Topics covered include ease of installation, operational stability,maintainability and the ability to generate the products KNMI needs. Inaddition, the quality of the documentation and properties of the file formatare discussed. These topics are stated as “user impressions” meaning thatwe did not attempt to make quantitative statements.
• As the evaluation of generated products is the main goal of this study, adetailed evaluation of two products is presented in chapter 4. The first prod-uct under evaluation is the pseudoCAPPI product because it is the mostimportant link in the radar production chain of KNMI. The pseudoCAPPIalgorithm is not complex at all because it is merely a range-dependentweighted average over a number of elevation scans. The other product un-der evaluation is the weather radar wind profile product calculated fromthe Doppler volume dataset. The weather radar wind profile is a relativelynew operational product based on a complex algorithm and it requires ex-tensive quality control. At KNMI the wind profiles are produced using thewell-established Volume Velocity Processing (VVP) algorithm (Waldteufeland Corbin, 1979; Holleman, 2003, 2005). The international exchange ofweather radar wind profiles is strongly increasing due requirements fromthe Numerical Weather Prediction community.
• Finally, in chapter 5 the summary and conclusions of this evaluation are pre-sented. It is concluded that the Rainbow 5 package of Gematronik GmbH

Introduction 7
fits the requirements of KNMI best and that a transition from Rainbow 3.4to Rainbow 5 would be relatively smooth.

8 Introduction

Chapter 2
Set-up of evaluation
KNMI operates two C-band Doppler weather radars from Gematronik (MeteorAC360). The radars have an antenna with a 4.2 m diameter and a beam width ofabout 1 degree. The peak power and width of the transmitted pulses are 250 kWand 0.8µs, respectively. The received signals are sampled and processed by aRVP6 signal processor from Sigmet Inc (Sigmet, 1998). Three different vol-umes are scanned operationally: a low-elevation reflectivity scan consisting offour elevations (0.3, 1.1, 2.0, and 3.0 degrees) which is repeated very 5 minutes,a full volume reflectivity scan with 14 elevations between 0.3 and 12 degrees, anda dedicated Doppler scan consisting of 5 elevations between 2 and 25 degrees.Rainbow 3.4 from Gematronik (Gematronik, 2003) is used for the operationalgeneration of all single-site radar products.
In this evaluation only data from the radar in De Bilt (5.18E, 52.10N and 44 mabove msl) are used. All volume datasets that are recorded by the operationalradar in De Bilt are transfered in real time to the Linux workstations on whichthe radar product processor packages are running. In this way the different radarproduct processors receive a real-time dataflow which is identical to the oper-ational dataflow. To avoid unwanted interference each radar product processorpackage was installed on a separate Linux PC. The employed hardware is a “stan-dard PC” meaning a 2 GHz processor, 512 Mb of RAM, and 80 Gb hard disk. AllPCs were running Linux and the Linux flavor was chosen by the manufacturer ofthe packages. The Iris 3 package was running on Red Hat Enterprise (RHEL3),the Rainbow 5 package was running on SUSE 9.1, and Muran was running onKubuntu.
Usually the radar product processors are in control of the radar hardware, butin our evaluation the packages only have to process the received volumes. TheRainbow and Muran packages were modified by their manufacturers to be ableto detect and process the received volume datasets. By default the Iris packageis equipped with a so-called “passive” mode for processing of (Rainbow 3) vol-

10 Set-up of evaluation
ume datasets, and only some fine tuning was needed to get things running. Natu-rally the Rainbow 5 package is capable of handling Rainbow 3 volume datasets.For the Muran package, a software module for the conversion of Rainbow 3 vol-ume datasets into Muran volumes has been developed in close collaboration withGamic GmbH.
A special point of attention is posed by the KNMI clutter removal schemewhich is based on distinguishing between the inherently fluctuating Rayleigh-scattered precipitation signals and the relatively stable ground clutter signals(Wessels and Beekhuis, 1992, 1994). In the planned technical upgrade ofthe weather radars this stepwise procedure for the rejection of (anomalouspropagation) clutter will be transformed from a procedure operating on two-dimensional Cartesian radar products to a procedure removing clutter from thethree-dimensional volume datasets (Holleman and Beekhuis, 2005). The clutterremoval scheme thus gains rationality and is available for all products that are de-rived from the volume datasets. For this evaluation an application was developedwhich reads the reflectivity and clutter volume datasets and outputs the clutter-processed reflectivity volume dataset. These clutter-processed volume datasetsare subsequently transfered to the radar product processors under evaluation. Inthis way the new clutter removal scheme was available for all product processors.
After the configuration was completed and the processing was running sta-ble, the different radar product processors have been acquiring data for about twomonths. In this way an archive has been collected starting 1 May 2005 and end-ing 30 June 2005 (excluding 14 till 17 May due to network malfunctioning) thatcontains the processed data as well as the original volume datasets. The outputfrom the radar product processors is stored in the native formats of the packages.Software modules have been developed to convert the output of the different radarproduct processors (Muran, Iris, and Rainbow) to the KNMI HDF5 format forimage data (Roozekrans and Holleman, 2003). In this way all data are availablein the same format and the comparison is facilitated.
It should be noted that the setup of this evaluation allows for an evaluation ofthe product generation only. All of three radar product processor packages havefunctions to configure, control and monitor multiple radar front-ends. As controlof the operational radar De Bilt was neither possible nor allowed, these functionsof the packages could not be evaluated.

Chapter 3
General evaluation
In this chapter the results of a general evaluation of the Radar Product Processor(RPP) packages is presented. It is stressed that this evaluation is focused on theneeds of KNMI and that the current operational output is the reference for thisevaluation. The radar product processor packages are evaluated on the followingaspects:
Configuration The product generation packages have to be configured to be ableto perform the required tasks and produce the desired products. The config-uration is usually a complex task. The production processor package shouldfacilitate this task by providing an intuitive graphical user interface and byperforming consistency checks on the configuration. The “look and feel”of the graphical user interface will be evaluated, and in addition the formatand content of the configuration files will be discussed.
Operational stability A high operational availability is required by KNMI forthe radar product processor, typically> 99%. During the on-line evaluationof the product processor packages which lasted almost 3 months, an impres-sion of the operational stability has been obtained. Apart from the stability,the recovery of the radar product processor after e.g. a computer crash or apower-failure is of crucial importance.
Geographical projection An accurate overlay of the radar echoes with topo-graphical data is crucial for further application of the radar data. The mod-ule for the geographical projection of the radar data must be able to handlethe geographical projection of the KNMI radar images in a correct manner.Details of the geographical projection of the KNMI radar images is given inappendix A.
Products The product processor package must be able to replace the current op-erational product processor and thus all operational KNMI radar products
12 General evaluation
must be available in the package with an comparable or better quality. Theoperational radar products at KNMI are:
• pseudoCAPPI of reflectivity,
• surface precipitation accumulated over 3 hours and 24 hours,
• echo top heights,
• hail detection based on 45 dBZ echo contours and freezing levelheights from a numerical weather prediction model,
• wind profiles based on Volume Velocity Processing (VVP).
In addition, it is planned to start using a warning product based on horizontalwind shear obtained from Doppler radial velocity data. The algorithms usedfor the product generation will be evaluated using the user documentation.The product generation package should allow for the inclusion of user-buildproduct modules.
File format The accessibility, portability, and information content of the internalfile format used by the product generation package is important for the con-version of this file format to the KNMI HDF5 data format for operational(image) data. (Roozekrans and Holleman, 2003). The internal file format isideally based on a non-propriety standard, and the data and metadata should(easily) be accessible using standard programming languages (C, C++, For-tran).
Documentation For operational maintenance, configuration, quality control ofoperational products, and Research & Development high quality documen-tation of the radar product generation package is required. The documen-tation should be complete, well-structured, detailed, and clear. Especiallydocumentation on the configuration and algorithms of the products relevantto KNMI has been evaluated.

3.1 Muran 3 13
Figure 3.1: Snapshot of the Muran 3 overview window with a few products.
3.1 Muran 3
Gamic GmbH is a German company based in Aachen that provides solutions forradar signal processing and product generation. The radar product processor pack-age of Gamic is called Muran (Gamic, 2005). The Deutscher Wetterdienst (DWD)is currently migrating their operational radar product processors to Muran for itscomplete radar network consisting of 16 operational radars and 1 research radar.The version we have evaluated at KNMI is Muran 3.
3.1.1 Configuration
A pre-installed version of Muran 3 on a workstation that was property of Gamicwas delivered to KNMI. Therefore we did not gain any experience on the installa-tion of the Muran radar product processor. The Muran package has a feature richgraphical user interface which is nice to see (see figure 3.1), but the drag and dropis somewhat deviant from normal practice. During the configuration of Muran itis sometimes difficult to find the entrance to the configuration items.
3.1.2 Operational stability
After the installation at KNMI and interfacing to the real-time dataflows, the Mu-ran 3 application has been running very stable. The log window is very clear

14 General evaluation
Figure 3.2: Snapshot of the Muran 3 monitoring window with log messages, warn-ings, and errors.
because of the colors that indicate the fault category: messages, warnings, or er-rors (see figure 3.2). The user interface for the selection of the fault categories,i.e., messages, warnings, or errors, is simple and effective.
3.1.3 Geographical projection
A snapshot of the Muran graphical user interface for entering the geographicalprojection of the topview radar products is shown in figure 3.3. The geographicalprojection of radar data is split into two steps in the Muran package. The first stepis part of the product definition (see left snapshot in the figure) where a projectionfunction with hard-coded parameters can be selected, e.g. polar stereographic pro-jection with a true-scale latitude of 60 N and an alignment meridian of 0 E. Thegeoreferenced product is automatically centered at the radar site and its extent ismatched to the radar coverage. In the second step this single-radar product is usedas input for a compositing module (Mosaic, see right snapshot in the figure) whereit is reprojected to obtain the desired geographical extent and position. This ap-proach differs from the (current) KNMI approach where the single-radar productshave the same geographical projection as the composite and can directly serve asbackup for the national composite.

3.1 Muran 3 15
Figure 3.3: Snapshot from the Muran 3 radar product processor of the windowswhere the geographical projection can be defined.
3.1.4 Products
The Constant Altitude Plan Position Indicator (CAPPI) product of Muran providesa horizontal cross section at a selected layer at heightH above the radar referencelevel. Data are obtained from a number of PPI type scans at different elevations.In regions where no radar data are available an extrapolation may optionally beperformed thus generating a so-called pseudoCAPPI.
The Precipitation Accumulation (PAC) product of Muran constantly sums theprecipitation fallen during a specified period of time using the surface rainfall in-tensity map product (SRI). Each time a new volume dataset is available an updatedPAC product is calculated. The Z-R relationship can be selected via the configura-tion of the intermediate SRI product. It is not clear whether a minimum/maximumdBZ can be supplied
The Echo Top (ETOP) product shows the maximum height relative to the radarreference height of a reflectivity value. The maximum height of an user-specifiedreflectivity value in a vertical column over ground is extracted and presented withearth curvature correction. The Muran package does offer a hail detection productbased on 45 dBZ echo tops and freezing level data from a Numerical WeatherPrediction model (Waldvogel et al., 1979; Holleman et al., 2000; Holleman, 2001).It is not clear whether the freezing level is fixed or can be read from a file. TheHAIL product of Muran generates a warning based on the Waldvogel criterion,and it is not possible to calculate a Probability-Of-Hail (POH).
At KNMI Weather Radar Wind Profiles (WRWP) are produced using the well-established Volume Velocity Processing algorithm (Waldteufel and Corbin, 1979;Holleman, 2003, 2005). The Muran VVP algorithm uses data from a multi-elevation volume scan to derive wind speed, wind direction and divergence. The

16 General evaluation
parameters that are calculated cannot be changed in the user interface. Only lim-ited quality control is performed on the raw volume data and the obtained windprofile data.
Muran offers several shear products like radial, azimuthal, and horizontal windshear products.
3.1.5 File format
The data and metadata of the Muran radar products are saved as portable networkgraphics (png) files complemented with (meta)data structures from the QT library(Trolltech, 1995). The Muran radar products can easily be viewed by a humanusing a standard image viewer. The metadata structures, however, can only beread using the QT library. The QT library is a frequently-used C++ library andthus the metadata can only be read using the C++ programming language. TheMuran files can be read on both little endian and big endian platforms. Importantmetadata on the geographical projection, e.g., product corners, is missing in thefiles.
3.1.6 Documentation
The documentation of the Muran package is still in a maturing phase, the manualdescribing the products and algorithms is very coarse. The configuration manualsconsist mostly of screen dumps showing what the user should see when everythinggoes well. Clearly, such a manual is of no use when you are in trouble. There iswork to be done by Gamic on this documentation if they want to reach the samelevel as the other packages in this evaluation.

3.2 Iris 8 17
Figure 3.4: Snapshot of the Iris 8 overview window with a few products.
3.2 Iris 8
The Iris radar product processor package (Sigmet, 2002) is provided by SigmetInc. Sigmet company is based in Boston, MA, and is well-known for its RVPsignal processor and product generation software. Sigmet has developed the Irispackage for controlling the RVP signal processor and for generation of productsfrom the data. The Iris product processor package has been developed some timeago and is well established and widely used by now. The current version of theIris package is 8.
3.2.1 Configuration
It is advised by Sigmet to run Iris on a Red Hat Enterprise distribution of Linux.Installation of Iris using the supplied installation scripts was straightforward. Thedocumentation of Iris concerning the installation is clear and to the point. Afterinstallation you end up with a very clean desktop that offers no frills whatsoever.The Iris window manager dubbed MWM, short for Minimal Window Manager, isexactly what its name suggests. The only functionality it offers is access to theIris menu and some graphical output windows.
The Iris package uses the famous X11 as the under laying graphical library.This library is nowadays rather old and offers a limited functionality. This makesthat Iris looks and feels rather old-fashioned (see figure 3.4). Further develop-
18 General evaluation
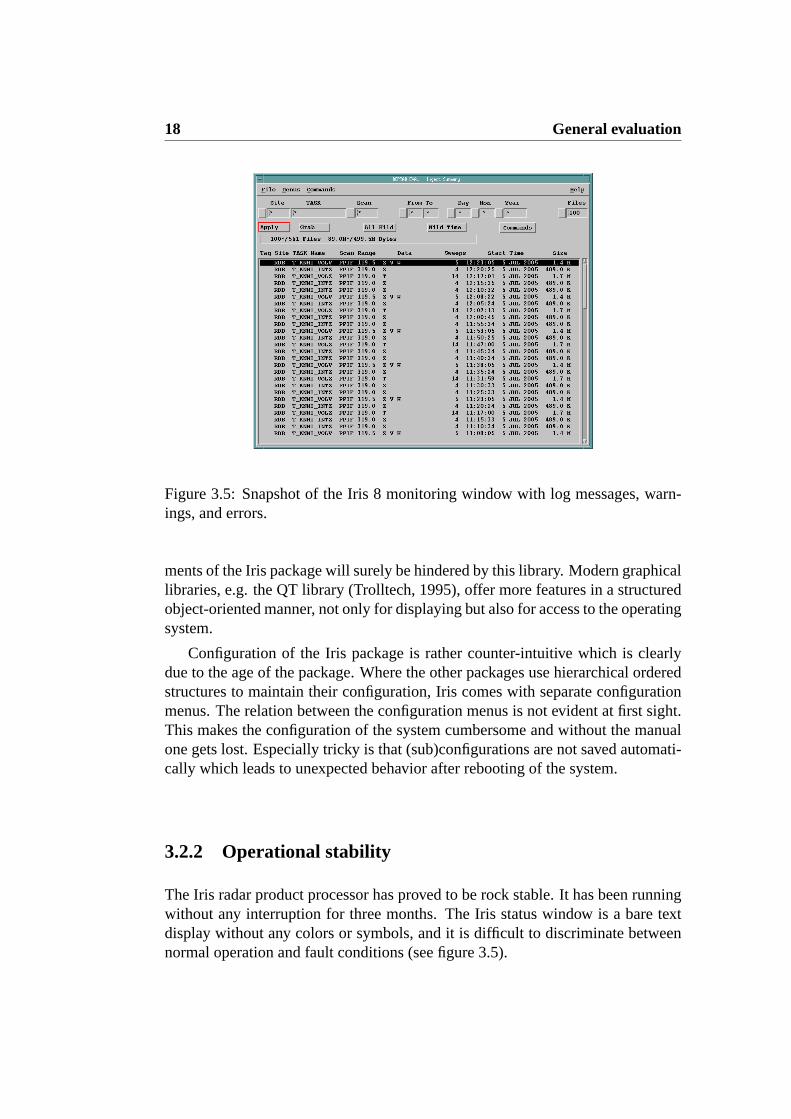
Figure 3.5: Snapshot of the Iris 8 monitoring window with log messages, warn-ings, and errors.
ments of the Iris package will surely be hindered by this library. Modern graphicallibraries, e.g. the QT library (Trolltech, 1995), offer more features in a structuredobject-oriented manner, not only for displaying but also for access to the operatingsystem.
Configuration of the Iris package is rather counter-intuitive which is clearlydue to the age of the package. Where the other packages use hierarchical orderedstructures to maintain their configuration, Iris comes with separate configurationmenus. The relation between the configuration menus is not evident at first sight.This makes the configuration of the system cumbersome and without the manualone gets lost. Especially tricky is that (sub)configurations are not saved automati-cally which leads to unexpected behavior after rebooting of the system.
3.2.2 Operational stability
The Iris radar product processor has proved to be rock stable. It has been runningwithout any interruption for three months. The Iris status window is a bare textdisplay without any colors or symbols, and it is difficult to discriminate betweennormal operation and fault conditions (see figure 3.5).

3.2 Iris 8 19
Figure 3.6: Snapshot from the Iris 8 radar product processor of the window wherethe geographical projection can be defined.
3.2.3 Geographical projection
A snapshot of the Iris graphical user interface for entering the geographical pro-jection of the topview radar products is shown in figure 3.6. Going through the listof geographical projections and parameters it is striking that the geographical pro-jection of the KNMI radar products (see Appendix A for details) cannot be con-figured, because a polar stereographical projection on a non-spherical earth is notavailable. The snapshot thus reveals the parameters that were used to approximatethe geographical projection of the KNMI radar products during the evaluation.For this approximation, the center point of the image domain was fixed at that ofthe KNMI image (4.521E,52.402N). The north-east and south-west corners werechosen to best match those of the KNMI image. By comparing the geographicalcoordinates of the north-east (9.745E,54.813N) and south-west (0.000E,49.775N)corners from Iris with those of the KNMI products (see Appendix A), the er-ror of not using the appropriate geographical projection can be estimated. Themaximum differences in longitude and latitude are 0.002 degrees (' 0.2 km) and0.005 degrees (' 0.6 km), respectively. This spatial error of 0.6 km is clearlyunacceptable for KNMI.
3.2.4 Products
The Constant Altitude Plan Position Indicator (CAPPI) product of Iris makes ahorizontal cut through the atmosphere from a PPI volume scan at multiple eleva-

20 General evaluation
tion angles. The algorithm constructs CAPPIs by interpolating in height and rangeto the selected height. It is possible to enter a range of heights for the constructionof a 3D-CAPPI. When the CAPPI Fill option is selected the highest elevation an-gle is used to fill the near ranges and the lowest elevation angle for the far ranges(pseudoCAPPI).
The Rain Accumulation product of Iris accumulates CAPPI or Surface Rain-fall Intensity (SRI) products in a two step procedure. First, the previous hour’sCAPPI or SRI data are used by the so-called “RAIN1” product to estimate therainfall that fell within that hour. A minimum reflectivity for accumulation canbe defined by the user. Then, the individual RAIN1 products can be summedany number of hours using the so-called “RAINN” product. The product outputcontinuously shows theN hours of accumulation.
The Echo Tops (TOPS) product displays the height of the highest occurrenceof a selectable threshold dBZ contour using a PPI volume scan. The TOPS al-gorithm makes a downward search at constant range in cylindrical coordinates todetermine when the threshold is crossed. It then interpolates in height to obtainthe height of the threshold contour. The Iris package does not offer a hail detec-tion product based on 45 dBZ echo tops and freezing level data from a NumericalWeather Prediction (NWP) model (Waldvogel et al., 1979; Holleman et al., 2000;Holleman, 2001).
At KNMI Weather Radar Wind Profiles (WRWP) are produced using the well-established Volume Velocity Processing algorithm (Waldteufel and Corbin, 1979;Holleman, 2003, 2005). The Iris VVP algorithm is based on the Doppler velocityunfolding algorithm developed by Siggia and Holmes (1991). Apart from the3D wind parameters, the Iris VVP product can optionally provide the reflectivity,vertical wind, divergence, and deformation profiles. A limited quality control isperformed where the inner and outer range of the analysis volume can be adjustedby the user.
Iris offers several shear products like radial, azimuthal, and horizontal windshear products. An extensive description on the algorithms and their use are avail-able in the Iris manuals.
3.2.5 File format
The data and metadata of the Iris 8 radar products are saved as binary blocks ofC-structures of strings, integers, and other (sub)structures. The Iris 8 files can,therefore, not be interpreted by a human using some kind of editor. Readingof the Iris 8 files using a C program is straightforward, but the recursive use of(sub)structures in (sub)structures can make the decoding complicated. The porta-bility of the Iris 8 files is limited because the file format is not resistant to littleendian/big endian changes.

3.2 Iris 8 21
3.2.6 Documentation
The documentation of the Iris package consists of three volumes: the Iris instal-lation & programmers & utilities manual, the radar manual, and the product &display manual. We have intensively used the installation manual to configure theIris package for the evaluation. The radar manual which describes the interactionwith the radar sensor was not used during our evaluation because Iris was runningin passive mode only. The product & display manual is truly written with the userin mind. It offers background information on how the radar products are gener-ated and even contains an introductory course on radar meteorology. As a wholethe documentation of Iris is outstanding and sets a standard for others.

22 General evaluation
Figure 3.7: Snapshot of the Rainbow 5 overview window with a few products.
3.3 Rainbow 5
Gematronik GmbH is a German radar manufacturer located in Neuss that pro-vides complete weather radar systems, consisting of both radar hardware and soft-ware. The radar product processor of Gematronik is called Rainbow (Gematronik,2005). The Rainbow package is on the market now for more than 10 years. Thelatest release of Rainbow, Rainbow 5, is a complete remake of the package fromscratch. Rainbow 5 is intended to control several radars using a single application.The Rainbow application relies on a package called Net Group Server (NGS) thathandles all file transfer and messages between the various (distributed) applica-tions of the main application. As Rainbow 5 is completely programmed usingplatform independent techniques, the package is available for Unix, Linux, andWindows 2000/XP.
3.3.1 Configuration
Given a Linux workstation (SUSE 9.1 in our case), installation of Rainbow 5 isstraightforward: all that has to be done is to activate the self installing NGS pack-ages and Rainbow 5. Once Rainbow 5 is activated you will find the Rainbowcontrol center window on your desktop. This control center allows direct accessto the Rainbow applications with a user interface: RainMan the radar manager toconfigure the settings of any radar in your network, RainLog that keeps track ofsystem loggings, and RainDart for visualization of the generated products. Con-figuration of the Rainbow 5 package is done in a hierarchical tree that shows the
3.3 Rainbow 5 23
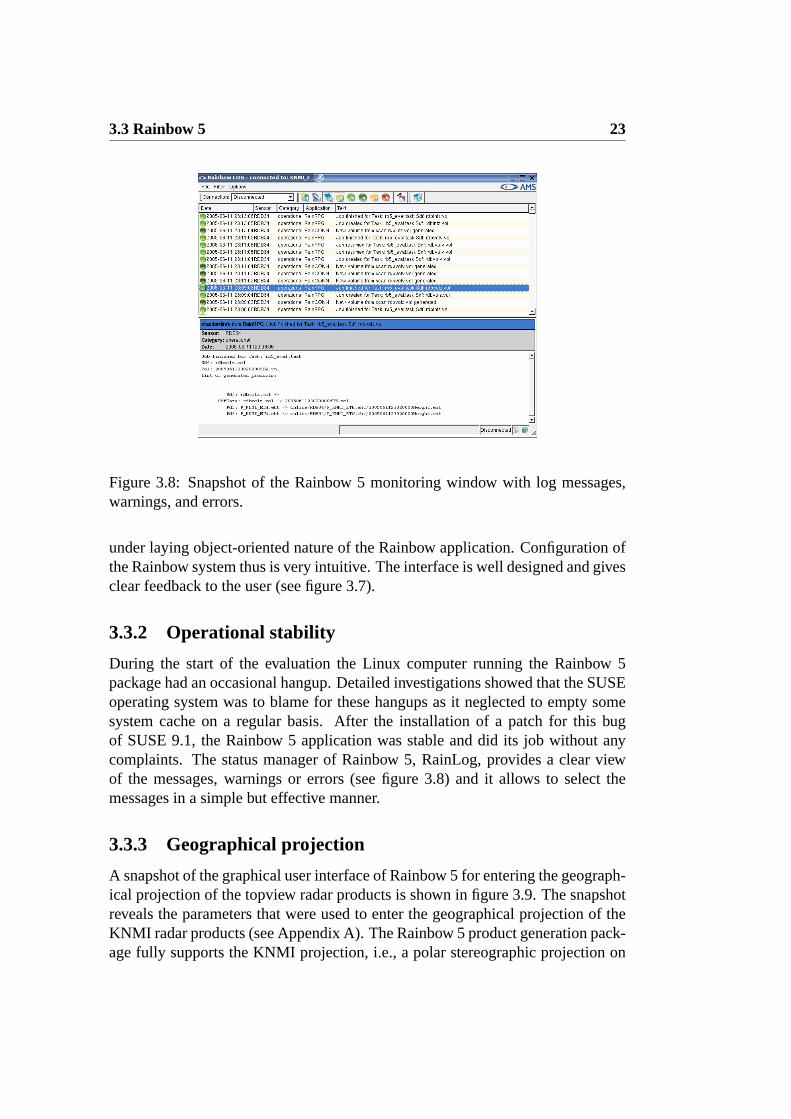
Figure 3.8: Snapshot of the Rainbow 5 monitoring window with log messages,warnings, and errors.
under laying object-oriented nature of the Rainbow application. Configuration ofthe Rainbow system thus is very intuitive. The interface is well designed and givesclear feedback to the user (see figure 3.7).
3.3.2 Operational stability
During the start of the evaluation the Linux computer running the Rainbow 5package had an occasional hangup. Detailed investigations showed that the SUSEoperating system was to blame for these hangups as it neglected to empty somesystem cache on a regular basis. After the installation of a patch for this bugof SUSE 9.1, the Rainbow 5 application was stable and did its job without anycomplaints. The status manager of Rainbow 5, RainLog, provides a clear viewof the messages, warnings or errors (see figure 3.8) and it allows to select themessages in a simple but effective manner.
3.3.3 Geographical projection
A snapshot of the graphical user interface of Rainbow 5 for entering the geograph-ical projection of the topview radar products is shown in figure 3.9. The snapshotreveals the parameters that were used to enter the geographical projection of theKNMI radar products (see Appendix A). The Rainbow 5 product generation pack-age fully supports the KNMI projection, i.e., a polar stereographic projection on
24 General evaluation
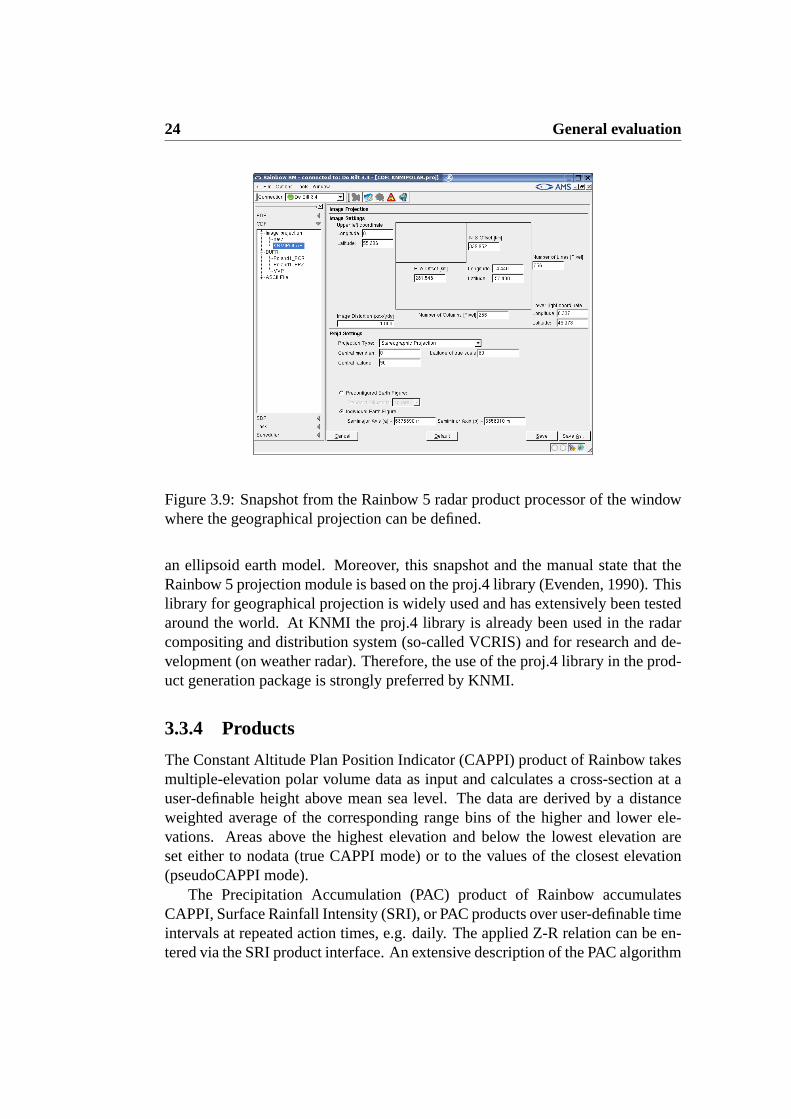
Figure 3.9: Snapshot from the Rainbow 5 radar product processor of the windowwhere the geographical projection can be defined.
an ellipsoid earth model. Moreover, this snapshot and the manual state that theRainbow 5 projection module is based on the proj.4 library (Evenden, 1990). Thislibrary for geographical projection is widely used and has extensively been testedaround the world. At KNMI the proj.4 library is already been used in the radarcompositing and distribution system (so-called VCRIS) and for research and de-velopment (on weather radar). Therefore, the use of the proj.4 library in the prod-uct generation package is strongly preferred by KNMI.
3.3.4 Products
The Constant Altitude Plan Position Indicator (CAPPI) product of Rainbow takesmultiple-elevation polar volume data as input and calculates a cross-section at auser-definable height above mean sea level. The data are derived by a distanceweighted average of the corresponding range bins of the higher and lower ele-vations. Areas above the highest elevation and below the lowest elevation areset either to nodata (true CAPPI mode) or to the values of the closest elevation(pseudoCAPPI mode).
The Precipitation Accumulation (PAC) product of Rainbow accumulatesCAPPI, Surface Rainfall Intensity (SRI), or PAC products over user-definable timeintervals at repeated action times, e.g. daily. The applied Z-R relation can be en-tered via the SRI product interface. An extensive description of the PAC algorithm

3.3 Rainbow 5 25
is given in the Rainbow Products & Algorithms manual, but it is unclear whethera minimum/maximum reflectivity for accumulation can be defined by the user.
The Echo Height (EHT) product analyzes vertical columns of polar volumereflectivity data to find out the echo top, echo base, height of maximum echo,and/or layer thickness. The echo top product presents the greatest height withinthe column where the user-defined reflectivity threshold is exceeded. Linear inter-polation is used to determine the echo top heights. At KNMI 45 dBZ echo tops areused together with freezing level data from the Hirlam Numerical Weather Predic-tion (NWP) model to generate a hail warning product based the method of Wald-vogel (Waldvogel et al., 1979; Holleman et al., 2000; Holleman, 2001). Rainbowoffers a hail detection (ZHAIL) product closely matching the operational KNMIproduct. The freezing level can be fixed or read from a file and the conversion ofthe observed height difference to Probability Of Hail (POH) can be configured bythe user.
At KNMI the Weather Radar Wind Profiles (WRWP) are produced using thewell-established Volume Velocity Processing algorithm (Waldteufel and Corbin,1979; Holleman, 2003, 2005). The implementation of the Rainbow VVP productis based on the currently operational product which provides high quality windprofile data. The user interface of the Rainbow VVP product allows for changeof the calculated wind field parameters, i.e., only 3D wind, also horizontal deriva-tives, or complete set. An extensive quality control is performed where the innerand outer range of the analysis volume, the minimum radial velocity (remove biasdue to clutter), and the minimum number of points in a 45-degree azimuthal sec-tor can be adjusted by the user. A second regression of the wind field modelcan be performed after rejection of outliers due to dealiasing errors (Hollemanand Beekhuis, 2003). A Vertical Profile of Reflectivity (VPR) product is not yetavailable in Rainbow 5.
Rainbow offers several shear products like radial, azimuthal, and horizontalwind shear products. The horizontal wind shear product of Rainbow 3.4 has beenevaluated at KNMI during the summer of 2004 (Holleman et al., 2005). It iscurrently not clear whether the recommendations from this study have been im-plemented in the Rainbow 5 shear products.
3.3.5 File format
The metadata of the Rainbow 5 radar products are saved in an XML file andthe data are saved as binary-large-objects (BLOBs) in the XML structure. Themetadata of the Rainbow 5 files can easily be browsed using a text editor or anXML viewer. The Rainbow 5 files contain abundant metadata on the radar, thescanning, and the product (generation). The BLOBs containing the actual (binary)data are, unfortunately, violating the XML format which only allows for printable

26 General evaluation
characters. As a consequence, a standard library for reading XML files (libxml)cannot handle the Rainbow files. In addition, the documentation on the BLOBs,which are written using the QT library, was not providing all information neededand some iterative programming was needed decode the BLOBs. The Rainbowfiles can be read on both little endian and big endian platforms using standardprogramming languages.
3.3.6 Documentation
Documentation of the Rainbow 5 package is on a high level and it is rather com-plete. The Rainbow user manual is very descriptive, but it is written from thedevelopers point of view. At some points, the user manual lacks the extra depththe user of the package will need when things go wrong. The product manualwith the descriptions of the applied algorithms and quality control is illustrativeand clear.
Chapter 4
Evaluation of products
In this chapter the results of the product evaluation from the three radar productprocessors are presented. Data from two different radar products have been an-alyzed: the pseudoCAPPI product and the weather radar wind profiles based onVolume Velocity Processing. The former is the backbone of the KNMI radar pro-duction chain and is also exchanged operationally within Europe. The latter is arelatively new operational product based on a complex algorithm and it requiresextensive quality control. The international exchange of weather radar wind pro-files is strongly increasing due requirements from the Numerical Weather Predic-tion community.
4.1 PseudoCAPPI product
The pseudoCAPPI product is used for the generation of the national and Europeanreflectivity composites, for precipitation accumulation, and for the internationalexchange. The evaluation of the pseudoCAPPI products is performed for one casewhere images from all radar product processors are compared with a referenceproduct. On 12 June 2005 at 1900 UTC a cold front was moving from west to eastover the Netherlands. A rainfall intensity of roughly 2 mm/h during 10 minutesand a temperature of 12◦C were observed in De Bilt around that time.
In figure 4.1 the pseudoCAPPI products obtained at 1900 UTC on 12 June2005 with the Muran 3, Iris 8, and Rainbow 5 radar product processors are pre-sented. In addition, the pseudoCAPPI product obtained using the off-line softwaredeveloped at KNMI for research purposes is shown in the upper-left image. Thecolor scale of the images in the figure displays a large reflectivity range from−29up to 59 dBZ in 4 dB intervals. The features with strong reflectivity in the fourimages resemble each other rather closely, but especially at longer ranges and forweaker reflectivities remarkable differences can be seen. The most striking dif-

28 Evaluation of products
Reference Muran 3
Iris 8 Rainbow 5
Figure 4.1: This figure shows the pseudoCAPPI products of radar reflectivity at1900 UTC on 12 June 2005. The top-left image is generated using off-line soft-ware developed at KNMI, the top-right image is generated using Muran 3, andthe bottom-right and bottom-left images are produced using Iris 8 and Rainbow 5,respectively.

4.1 PseudoCAPPI product 29
-24 -16 -8 0 8 16 24 32 40Reflectivity [dBZ]
0
250
500
750
1000
1250
1500N
umbe
r of p
ixel
sReference (linear)Reference (log)Muran 3Muran 3 (mod.)Rainbow 5Iris 8
Figure 4.2: Histograms of the radar reflectivity values obtained from the pseudo-CAPPI products in figure 4.1 are shown in this figure. Two histograms are shownfor the reference using either linear interpolation of the Z values (linear) or thedBZ values (log). For Muran 3 a histogram of a modified pseudoCAPPI product(see text) is also shown.
ference is the absence of “noise” pixels at ranges beyond approximately 150 kmin the Muran 3 pseudoCAPPI product (upper-right image). From a closer exam-ination of the Muran 3 product it seems that some kind of spatial smoothing isapplied to the data. Another distinct difference is the larger spatial extent of the“noise” pixels at long ranges in the Iris 8 product (lower-left image). This is mostlikely due to a spatial smoothing during the polar-to-Cartesian conversion. Finally,it appears that the density of the “noise” pixels in the Rainbow 5 pseudoCAPPIproduct is slightly higher than that in the reference product.
The different pseudoCAPPI products are evaluated quantitatively using his-tograms of the reflectivity values in the images. In figure 4.2 the calculated his-tograms for the pseudoCAPPI products shown in figure 4.1 are plotted. The ver-tical dashed line marks the reflectivity threshold for the operational weather radardisplays at KNMI. For the “reference” pseudoCAPPI two histograms are shown:one for a pseudoCAPPI obtained using interpolation of the linear reflectivityZ(linear) and one obtained using interpolation of the reflectivity in dBZ (log). Itwill be detailed below that for Muran 3 an additional histogram is shown for a

30 Evaluation of products
Reference Muran 3
Iris 8 Rainbow 5
Figure 4.3: This figure shows the pseudoCAPPI products of radar rainfall usingthe levels and colors of the operational KNMI display at 1900 UTC on 12 June2005. The top-left image is generated using off-line software from KNMI (refer-ence), the top-right image is generated using Muran 3, and the bottom-right andbottom-left images are produced using Iris 8 and Rainbow 5, respectively.

4.2 Weather Radar Wind Profiles (VVP) 31
modified pseudoCAPPI product.It is evident from the histograms in figure 4.2 that the different pseudoCAPPI
products are rather similar for reflectivities above the display threshold of 7 dBZ.Below the display threshold, however, large differences between the histogramsare found. Most pseudoCAPPI histograms exhibit a maximum around−1 dBZ,but in the Muran histogram this maximum is completely absent. The absence ofthe peak around−1 dBZ is due to the missing noise pixels at long ranges in thepseudoCAPPI product from Muran. The missing noise pixels are due to ratherstringent thresholding of the data during the calculation of the pseudoCAPPI inMuran. Figure 4.2 also shows a histogram from a modified pseudoCAPPI productusing milder criteria for the data thresholding, and this histogram closely resem-bles that of the reference product.
The low-reflectivity maximum of the Iris histogram is clearly much higherthan those of the other histograms. This indicates that the number of pixels with areflectivity value around−1 dBZ is much larger than in the other images. This isin line with the observed larger spatial extent of the “noise” areas at long rangesin the Iris pseudoCAPPI product. Finally, the low-reflectivity maximum of theRainbow 5 histogram is shifted to lower values by approximately 3 dB. The reasonfor this shift of the Rainbow 5 histogram is not yet clear and needs to be sortedout before Rainbow 5 could be used operationally.
From the analysis of the histograms it appears that the different pseudoCAPPIproducts resemble each other above the display threshold used in the operationalradar displays. In figure 4.3 the different pseudoCAPPI at 1900 UTC on 12 June2005 are shown with colors indicating the rain rate. The reflectivity values havebeen converted to rain rates using the standard Z-R relation (Z = 200R1.6) andthe colors correspond to those of the KNMI radar display. Two colors have beenadded, however, at the low end (−15 dBR equal to 0.03 mm/h) and high endof the color scale (20 dBR equal to 100 mm/h). It is evident that the differentpseudoCAPPI products are rather similar (when the pink pixels are discarded),but subtle differences can be seen. All in all, it is remarkable that even for abase product like a pseudoCAPPI the different radar product processors are soinconsistent.
4.2 Weather Radar Wind Profiles (VVP)
The wind weather radar wind profile is a relatively new operational product basedon a complex algorithm and it requires extensive quality control. At KNMI thewind profiles are produced using the well-established Volume Velocity Process-ing (VVP) algorithm (Waldteufel and Corbin, 1979; Holleman, 2003, 2005). Theinternational exchange of weather radar wind profiles is strongly increasing due

32 Evaluation of products
0 0.1 0.2 0.3 0.4Availability fraction
0
5
10R
MS
vect
or d
iffe
renc
es [m
/s]
ReferenceMuran 3Iris 8Rainbow 5
Figure 4.4: The rms vector differences between radar (Reference, Muran 3, Iris 8,Rainbow 5) and Hirlam wind vectors as a function of the availability fraction ofthe radar wind vectors are shown in the figure. The availability fraction is variedby changing the standard deviation threshold (if available). Wind vectors between0 and 6 km altitude collected between 1 May 2005 and 30 June 2005 are used tocompile this figure.
requirements from the Numerical Weather Prediction community, see for instanceRossa et al. (2005). The wind profiles from the different radar product proces-sors have been evaluated by comparing approximately two months (May and June2005) of radar data with the corresponding profiles from the Hirlam NumericalWeather Prediction model Unden et al. (2002).
In figure 4.4 the rms vector differences between the weather radar wind pro-files and the Hirlam profiles are plotted as a function of the availability fractionfor the three radar product processors (Muran 3, Iris 8, and Rainbow 5) and thereference (Rainbow 3). Currently, the weather radar wind profiles are producedoperationally at KNMI using the Rainbow 3 package (Gematronik, 2003). Theavailability fraction of the retrieved wind vectors is varied by changing the thresh-old on the radial velocity standard deviation. Increasing this threshold from 0.5 to5 m s−1, the availability fractions and rms vector differences of the reference dataincrease from 0 to 0.33 and from 2.2 to 3.6 m s−1, respectively.
Figure 4.4 shows two important aspects of the wind profile retrieval meth-

4.2 Weather Radar Wind Profiles (VVP) 33
0.0 0.2 0.4 0.6 0.8 1.0Availability
0
1
2
3
4
5
6H
eigh
t [km
]ReferenceMuran 3Iris 8Rainbow 5
Figure 4.5: The availability fraction of wind vector data is shown as a function ofheight for the different product generation packages. This figure has been com-piled using 2 months of data and a standard deviation threshold of 2.0 m s−1 (forRainbow data).
ods: quality and availability. Wind profiles that combine high quality (low rmsvector differences) with high availability are preferred. It is evident from the fig-ure that the performance curves of the Rainbow 5 profiles and the reference data(Rainbow 3) are rather similar. Moreover these performance curves are closelyresembling those in figure 4.4 of Holleman (2003) in which 20,000 vectors pairscorrespond to an availability fraction of 0.35. During the analysis of the Iris 8wind profiles it was found that the data contained a certain fraction of vectorswith an extremely high wind speed, i.e.,>100 m/s. It was not possible to re-move these outliers based on the Iris quality indicators, and therefore wind speedsthat are 10% higher than the unambiguous Doppler velocity (48 m/s in our case)have been removed from the Iris profile data prior to further analysis. For the(quality controlled) Iris 8 profiles a completely different performance curve is still

34 Evaluation of products
observed. The rms vector differences are much larger (>6 m/s) and they increasewhen the availability fraction is decreased. This suggests that the radial velocitystandard deviation provided by Iris is not a good quality indicator which is mostlikely due to insufficient quality control during the wind profile retrieval, e.g. nosecond regression after removal of outliers. For the Muran 3 profiles it is notpossible to change the availability fraction because the radial velocity standarddeviation is not saved and thus only a single point is plotted in figure 4.4. Fromthe figure it is evident that the Muran profiles combine a high availability with arather poor quality.
In figure 4.5 the availability fraction of the wind vectors is plotted as a functionof height for the different radar product processors. All available wind profiles (2months) and a standard deviation threshold of 2.0 m s−1 for Rainbow 5 and thereference have been used to calculate these fractions. Especially in the boundarylayer, the availability of the Rainbow 5 and reference profiles is (much) lower thanthat for the Iris and Muran profiles. Between 1 and 2 km altitude the availabil-ity fraction of the Muran profiles is approaching unity implying that hardly anyquality control is performed.
Figures 4.6 and 4.7 show the bias and standard deviation of the wind speed anddirection for the different radar product processors and the reference as a functionof height. These quality measures have been obtained from verification againstthe Hirlam profiles over May and June 2005. The results for Rainbow 5 and thereference (Rainbow 3) are shown in figure 4.6. For both product processors andall heights, the wind speed bias is slightly positive (≈ 1 m/s) and the standarddeviation of the wind speed is around 2 m/s. This positive bias for the Rainbowwind speeds is most likely due to the rejection of radial velocities below 2 m/s(Holleman, 2003, 2005). The wind direction bias for the reference and Rainbow 5profiles is small (<2 degrees) at all heights. The standard deviation of the Rain-bow wind directions is slowly decreasing from roughly 25 degrees at low altitudeto about 15 degrees at the highest altitude. The wind direction is determined fromthe ratio of the horizontal wind field components and this ratio has a larger errorfor lower wind speeds which are more common at low altitudes. These results arein good agreement with those presented in Holleman (2003, 2005).
The verification results for the Iris 8 and Muran 3 wind profiles are shownin figure 4.7. Note that the horizontal scales of this figure are quite differentfrom those in figure 4.6. For the Iris profiles a wind speed bias and standarddeviation are increasing from−1.9 m/s and 3.2 m/s to+2.3 m/s and 4.9 m/s,respectively, with increasing height. The wind direction bias of the Iris profiles ismostly negative and relatively small (< 5 degrees). The corresponding standarddeviation is 60 degrees at low altitudes and drops to about 25 degrees at a heightof 6 km. The quality of the Muran wind profiles is considerably worse. Theobserved biases are comparable to those for the Iris wind profiles, but the observed

4.2 Weather Radar Wind Profiles (VVP) 35
-1 0 1 2 3Speed [m/s]
0
1
2
3
4
5
6
Hei
ght [
km]
RB5
0 10 20 30 40Direction [deg]
RB5
-1 0 1 2 3Speed [m/s]
0
1
2
3
4
5
6
Hei
ght [
km]
RB3
0 10 20 30 40Direction [deg]
RB3
Figure 4.6: Profiles of the bias (•) and standard deviation (�) of the wind speedand direction from the verification of the reference (top frames) and Rainbow 5(bottom frames) wind data against Hirlam.

36 Evaluation of products
-5 0 5 10Speed [m/s]
0
1
2
3
4
5
6H
eigh
t [km
]
IR8
-20 0 20 40 60 80Direction [deg]
IR8
-5 0 5 10Speed [m/s]
0
1
2
3
4
5
6
Hei
ght [
km]
MR3
-20 0 20 40 60 80Direction [deg]
MR3
Figure 4.7: Profiles of the bias (•) and standard deviation (�) of the wind speedand direction from the verification of the Iris 8 (top frames) and Muran 3 (bottomframes) wind data against Hirlam.

4.2 Weather Radar Wind Profiles (VVP) 37
standard deviations are clearly much larger. The standard deviation of the Muranwind speeds varies between 3.7 and 11 m/s and that of the Muran wind directionsbetween 60 and 80 degrees. The observed quality of the Iris and Muran windprofiles is considerably lower than that of the Rainbow wind profiles. Taking intoaccount the results of figure 4.4, it is clear that a different balance between qualityand availability is chosen in the Iris product processor and that even basic qualitycontrol is lacking in the Muran wind profile product.

38 Evaluation of products

Chapter 5
Summary and conclusions
In light of the planned technical upgrade of the KNMI weather radars, an eval-uation of three different radar product processor packages has been performed.For this evaluation the Muran 3, Iris 8, and Rainbow 5 packages have been in-stalled on separate Linux workstations and connected to the real-time dataflow ofvolume datasets for the weather radar in De Bilt. A number of software mod-ules for conversion of the operational dataflow, i.e., Rainbow 3 volume datasetsto the native formats of the radar product processors and for the conversion of thenative output formats to the KNMI HDF5 image format, have been developed incollaboration with the manufacturers. The different radar product processors havebeen acquiring data for about two months, starting 1 May 2005 and ending 30June 2005, and an archive has been built containing the processed data as well asthe original volume datasets. First of all, a general evaluation of the radar productprocessors was performed in which the configuration, the operational stability, thegeographical projection module, the product algorithms, file formats, and docu-mentation were assessed. Subsequently the output of two distinct products, thepseudoCAPPI product and the weather radar wind profiles, has been analyzed indetail.
It turns out that the operational stability is very good for all radar product pro-cessors and that all processors are capable of generating the products that KNMIrequires. Unfortunately, the geographical projection module of Iris cannot han-dle the standard geographical projection of the KNMI radar products (see Ap-pendix A). The configuration of the Muran and Rainbow packages was straight-forward but the configuration of the Iris package was rather tedious. The docu-mentation provided with the Rainbow 5 and the Iris packages is at a high level,but that of Muran is rather incomplete. Finally, the analysis of the pseudoCAPPIoutput revealed minor problems with all three packages and the analysis of thewind profile output revealed huge differences in quality and availability. The re-sults from the general evaluation (6 items) and product evaluation (2 items) of the

40 Summary and conclusions
Table 5.1: Summary of the general evaluation and product evaluation of the prod-uct generation packages.
Item Muran 3 Iris 8 Rainbow 5
Configuration + − ++Operational stability + ++ +Geographical projection 0 −− ++Products 0 0 ++File format + 0 +Documentation − ++ +
PseudoCAPPI 0 + +Wind profiles −− 0 ++
three radar product processors have been summarized in table 5.1. All in all, it isevident that the Rainbow 5 package of Gematronik GmbH fits the requirementsof KNMI best and that a transition from the current Rainbow 3.4 package to thenew Rainbow 5 package would be relatively smooth
Acknowledgments
Martin Malkomes and Matthias Toussaint (Gamic GmbH) are gratefully acknowl-edged for supplying the Muran workstation and for swift help with the develop-ment of the Rainbow-to-Muran conversion module. The help of Richard Passarelliand Joseph Holmes (Sigmet Inc) with the configuration of Iris and the modifica-tions of the Rainbow 3 ingest pipe is highly appreciated. Andre Weipert and Se-bastian Str̈umpel (Gematronik GmbH) are gratefully acknowledged for providingthe Rainbow 5 package and for the modifications needed to perform the evalua-tion.

Bibliography
Evenden, G. I.: 1990, Cartographic Projection Procedures for the UNIX Environ-ment — A Users’s Manual. Technical report, United States Department of theInterior Geological Survey (USGS), www.remotesensing.org/proj/.
Gamic: 2005, GAMIC Product Algorithm Specification. Gamic GmbH., Roer-monderstr. 151, 52072 Aachen, Germany.
Gematronik: 2003, Rainbow 3.4 Operator’s Manual. Gematronik GmbH., Raiff-eneisenstr. 10, 41470 Neuss, Germany.
— 2005, Rainbow 5 Products & Algorithms. Gematronik GmbH., Raiffeneisenstr.10, 41470 Neuss, Germany.
Holleman, I.: 2001, Hail detection using single-polarization radar. Scientific re-port WR-2001-01, Royal Netherlands Meteorological Institute (KNMI).
— 2003, Doppler Radar Wind Profiles. Scientific report WR-2003-02, RoyalNetherlands Meteorological Institute (KNMI).
— 2005, Quality Control and Verification of Weather Radar Wind Profiles.J.Atmos. Ocean. Technol., 22, 1541–1550.
Holleman, I. and H. Beekhuis: 2003, Analysis and Correction of Dual-PRF Ve-locity Data.J. Atmos. Ocean. Technol., 20, 443–453.
— 2005, Review of the KNMI clutter removal scheme. Technical report TR-284,Royal Netherlands Meteorological Institute (KNMI).
Holleman, I., H. Mellink, T. de Boer, and H. Beekhuis: 2005, Evaluatie vanDoppler Windscheringsproduct (in Dutch). Internal report IR-2005-01, RoyalNetherlands Meteorological Institute (KNMI).
Holleman, I., H. R. A. Wessels, J. R. A. Onvlee, and S. J. M. Barlag: 2000,Development of a Hail-Detection-Product.Phys. Chem. Earth (B), 25, 1293–1297.

42 BIBLIOGRAPHY
Roozekrans, H. and I. Holleman: 2003, KNMI HDF5 Data Format Specification,v3.5. Internal report IR-2003-05, Royal Netherlands Meteorological Institute(KNMI).
Rossa, A., M. Bruen, B. Macpherson, I. Holleman, D. Michelson, andS. Michaelides, eds.: 2005,Use of Radar Observations in Hydrology and NWPModels. EU (Brussels, 292pp pp., EUR xxxxx.
Siggia, A. D. and J. M. Holmes: 1991, One Pass Velocity Unfolding for VVPAnalysis.25th International Conference on Radar Meteorology, AMS, 882–884.
Sigmet: 1998, RVP6 Doppler Signal Processor User’s Manual. Sigmet Inc., 2Park Drive, Westford, MA 01886 USA.
— 2002, IRIS Product and Display Manual. Sigmet Inc., 2 Park Drive, Westford,MA 01886 USA.
Trolltech: 1995, QT: A comprehensive C++ framework for application develop-ment. http://www.trolltech.com.
Unden et al., P.: 2002, Hirlam-5 Scientific Documentation. Technical report,Hirlam-5 Project, SMHI, also: http://hirlam.knmi.nl.
Waldteufel, P. and H. Corbin: 1979, On the analysis of single Doppler radar data.J. Appl. Meteor., 18, 532–542.
Waldvogel, A., B. Federer, and P. Grimm: 1979, Criteria for the Detection of HailCells.J. Appl. Meteor., 18, 1521–1525.
Wessels, H. R. A. and J. H. Beekhuis: 1992, Automatic suppression of anomalouspropagation clutter for noncoherent weather radars. Scientific report WR-92-06, Royal Netherlands Meteorological Institute (KNMI).
— 1994, Stepwise procedure for suppression of anomalous ground clutter.COST-75 Seminar on Advanced Radar Systems, EUR 16013 EN, 270–277.

Appendix A
Geographical projection of KNMIradar images
In this appendix the details of the geographical projection of the KNMI radarimages, both single site data and the national composite, are listed. The radar im-ages are projected according to a stereographic projection with the north pole inthe projection origin. A stereographic projection also uses a so-called alignmentmeridian (Greenwich) which is equal to the longitude of the projection origin anda latitude of true scale (60N). The stereographic projection is a conformal pro-jection which implies that the angles are conserved during the projection. Themeridians are projected into straight lines starting from the north pole and lati-tude circles are projected as circles centered at the north pole. It is important tostress that the KNMI radar images are projected using an ellipsoid earth model(Hayford). This makes the projection equations substantially more complex, butit enables a more accurate overlay of the radar echoes with the topographical data.The parameters of the geographical projection of the KNMI radar images are listedin the table below:
Parameter ValueProjection StereographicProjection origin (lon,lat) 0E, 90NTrue scale (lat) 60NEarth radius (equator,polar)6378.388 km, 6356.912 kmPixel size at true scale (x,y)2.500 km,−2.500 kmOffset of image corner (i,j) 0.0, 1490.9Number of rows 256Number of columns 256
The geographical projection of the radar data from the azimuthal equi-distanceprojection (“radar projection”) to the polar stereographic projection can be done

44 Geographical projection of KNMI radar images
using the “proj.4” library (Evenden, 1990). This library has been developed atthe USGS and is used world-wide in numerous applications. The geographicalprojection of the KNMI radar images is described by the following “proj.4 string”:
"+proj=stere +x_0=0 +y_0=0 +lat_0=90 +lon_0=0 +lat_ts=60 +a=6378.388 +b=6356.906"
After the geographical (re)projection the resulting image only has to be scaledand shifted linearly using the given pixel sizes and offsets of the image corner.The pixel size iny-direction is negative because the images lines are plotted fromnorth-to-south and they-axis is pointing in the opposite direction. The projec-tion parameters define the geographical corners of the KNMI radar images. Thecorners of the KNMI radar image are:
Corner Lon [deg] Lat [deg])
north-west 0.000E 55.296Nnorth-east 9.743E 54.818Nsouth-east 8.337E 49.373Nsouth-west 0.000E 49.769N