ITS Lyon Congress 2011 SS 23: EGNOS and Galileo for intelligent mobility GNSS for Innovative Road...
13
ITS Lyon Congress 2011 SS 23: EGNOS and Galileo for intelligent mobility GNSS for Innovative Road Applications Paolo Cerini (Bain & Company) Business Plan Analysis
-
Upload
leona-hunter -
Category
Documents
-
view
216 -
download
1
Transcript of ITS Lyon Congress 2011 SS 23: EGNOS and Galileo for intelligent mobility GNSS for Innovative Road...
ITS Lyon Congress 2011SS 23: EGNOS and Galileo for intelligent mobility
GNSS for Innovative Road Applications
Paolo Cerini (Bain & Company)
Business Plan Analysis
2
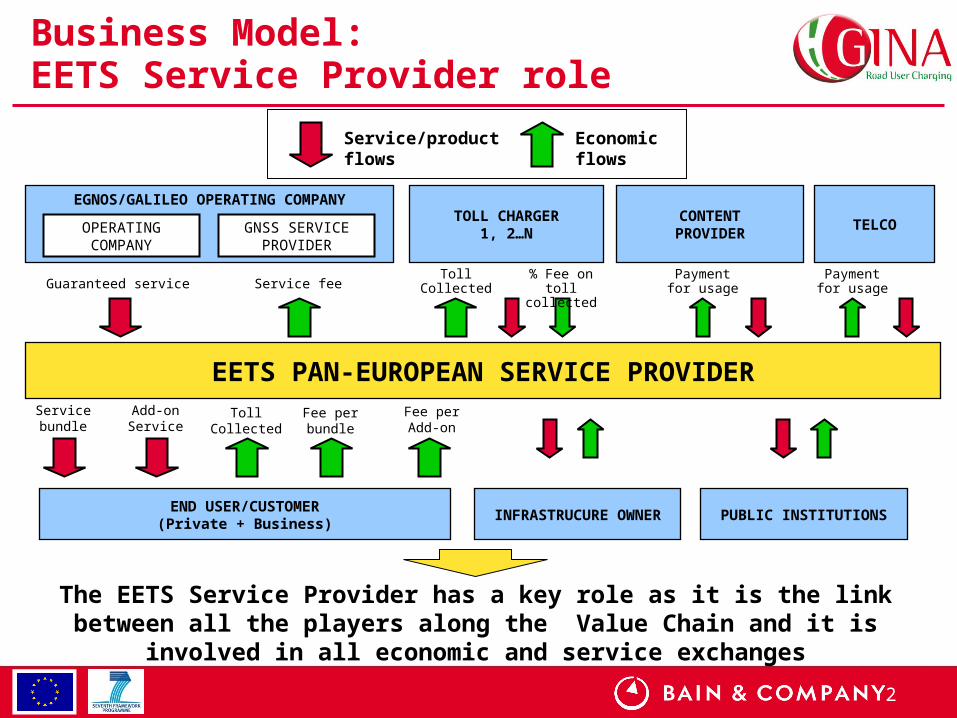
Business Model:EETS Service Provider role
EGNOS/GALILEO OPERATING COMPANY
EETS PAN-EUROPEAN SERVICE PROVIDER
OPERATING COMPANY
GNSS SERVICE PROVIDER
Guaranteed service
END USER/CUSTOMER(Private + Business)
Servicebundle
Service fee
Fee per bundle
TOLL CHARGER1, 2…N
CONTENTPROVIDER
TELCO
% Fee on toll collected
Toll Collected
Payment for usage
Payment for usage
INFRASTRUCURE OWNER
PUBLIC INSTITUTIONS
Service/product flows
Economic flows
Fee per Add-on
Add-onService
TollCollected
The EETS Service Provider has a key role as it is the link between all the players along the Value Chain and it is
involved in all economic and service exchanges

3
Offer Structure
PrivateBusiness
BasicPackage
Add-On
H WS
erv
ice
s• Smart OBU without GUI• Smart OBU without GUI
• Wireless GUI• Wireless GUI
• EFC• E-CALL
• EFC• E-CALL
• Fleet Management/Tracking and Tracing
• Theft management• Traffic info system• Navigation services/ active re-routing
H WS
erv
ices
• GINA Service Provider offer has been structured as a basic package with a set of add-on services (VAS) that can be purchased separately
• Two customer segments have been identified: Business (i.e. commercial vehicles) and Private (i.e. passenger cars)
• Theft management• Traffic info system• Navigation services/ active re-routing

4
Addressable end-user market
• Analysis perimeter: all the countries belonging to EU27.
• Business Case has analysed last available data relevant to the European market of cars, buses, light commercial vehicles, light, medium and heavy trucks, using CAGR of last 4 years to project data
0
100
200
300M
2010
244
2015
258
2020
270
2025
283
2030
299
0
10
20
30
40
50M
2010
36
2015
38
2020
41
2025
44
2030
48
Business Segment PotentialCirculating trucks in Europe
Private Segment PotentialCirculating cars in Europe

5
Market PenetrationCommercial Strategy
- Area 1- Central-Southern EU: Germany, France, Italy, Spain, Portugal and Austria
- Area 2 -Benelux & Great Britain:Netherlands, Belgium, Luxemburg, UK, Ireland
- Area 3 - Northern Europe:Denmark, Sweden, Finland, Latvia, Estonia and Lithuania
- Area 4 - Eastern Europe:Poland, Czech Rep., Slovakia, Slovenia, Hungary, Romania and Bulgaria
- Area 5 - Mediterranean Island:Greece, Malta, Cipro
• In order to define a progressive penetration plan, five geo-clusters have been defined using the following criteria:
- Geo-adjacency and Trans European Network (TEN-T) priority axis- Actual Road Charging scheme- Upcoming Road Charging projects
Area 2
Area 1
Area 3
Area 4
Area 5

6
Revenues Generation Potential Business + Private Segment
Business Segment Private Segment
5
10
€15
12,0
11,2
10,5
10,0
9,5
9,2
8,9
8,5
2015 2017 2019 2021 2023 2025 2027 2029
0
10
20
30
40
50M
0
10
20
30%
2015
38
2020
41
2025
44
2030
48
19% 36% 42%6%EETS Penetration
2,3 4,7 6,10,7# GINA Users ( Mln )
2,0
3,0
4,0
€5,0
4,0
3,7
3,5
3,3
3,2
3,1
3,0
2018 2020 2022 2024 2026 2028 2030
0
100
200
300M
0
2
4
6
8
10%
2015
258
2020
271
2025
284
2030
299
3,6% 6,3% 7,3%EETS Penetration
2,9 5,3 6,5# GINA Users ( Mln )
Player 3
15%
Player 2
20%
Other
players
35%
GINA 30%
Price
Market Penetration
Price
Market Penetration
MarketShare
Total PotentialMarket (Mln)
Total MarketPenetration (%)
7
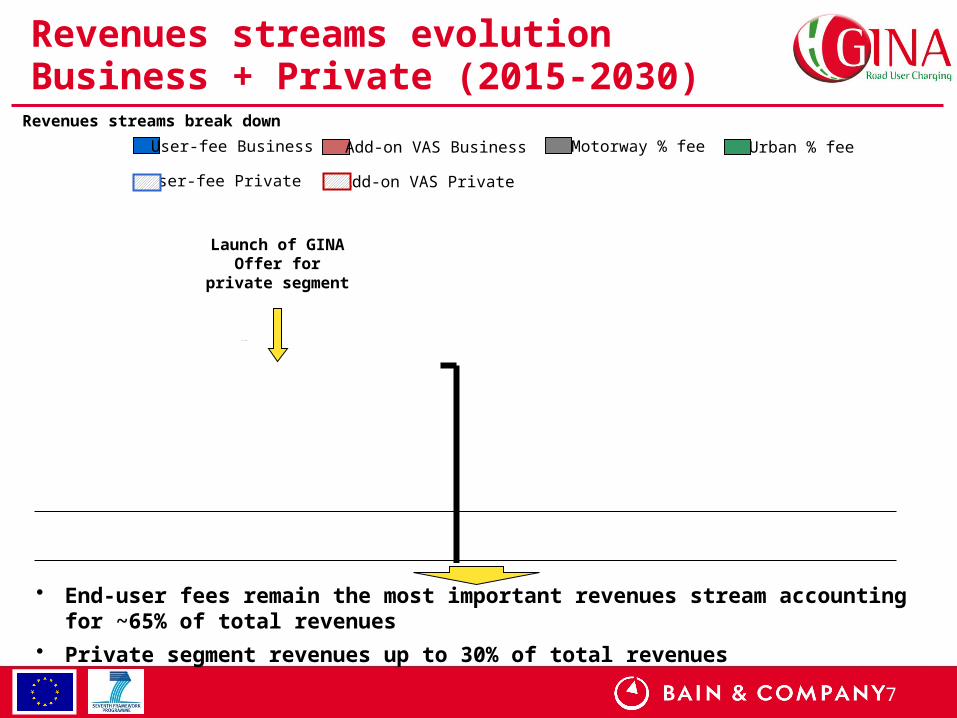
Revenues streams evolution Business + Private (2015-2030)
0
500
1.000
€1.500M
2015
58
94
2016
48
120
175
2017
72
174
256
2018
15
88
52
221
401
2019
17
98
98
247
491
2020
19
110
119
269
558
2021
22
53
152
148
336
713
2022
25
60
168
169
393
817
2023
27
69
187
184
427
895
2024
29
77
207
198
463
976
2025
82
228
205
502
1.051
2026
88
241
209
530
1.102
2027
94
254
213
550
1.148
2028
100
268
218
572
1.196
2029
107
281
224
593
1.244
2030
113
294
229
614
1.291
30% 29% 29% 29% 29% 29% 28%21% 28% 31% 30% 30% 30%
% Private segment
Revenues on Total
Revenues
Revenues streams break down
Launch of GINA Offer for private
segment
User-fee Business Add-on VAS Business Motorway % fee Urban % fee
User-fee Private Add-on VAS Private
• End-user fees remain the most important revenues stream accounting for ~65% of total revenues
• Private segment revenues up to 30% of total revenues

8
Cost Structure evolutionBusiness + Private (2015-2030)
0
250
500
750
1.000
€1.250M
2015
28
31
30
46
176
2016
40
45
43
206
2018
86
113
91
56
36
451
2020
99
144
116
51
50
46
545
2022
132
194
171
57
74
45
726
2024
149
42
231
208
57
88
43
840
2026
160
47
256
239
57
99
923
2028
172
51
277
265
57
108
45
1.002
2030
185
55
300
292
57
116
45
1.079
28%
27%
17%
5%
5%
11%
4%
%
• The cost structure remains approximately constant along the Business Plan horizon
• Cost structure at steady-state condition (2030) amounts to ~ 1080 M€
• Telecom costs are the largest cost items, for ~55% of total costs (including VAS)

9
EBIT at steady-state conditionBusiness + Private (2030)
0
500
1.000
€1.500M
Revenues
1.291
Telco
-300
VAS
Costs
-292
OBU
-185
Assistance
Costs
-55
-57
EGNOS
service
-19
Lost
Revenues
-10
SG&A
-116
EBITDA
257
D&A
-45
EBIT
212
100% 20% -3% 16%-23% -23% -14% -4% -4% -1% -1% -9%% su Revenues 100% 20% -3% 16%-23% -23% -14% -4% -4% -1% -1% -9%% su Revenues
OPEX
• Steady-State (2030) EBIT is around 16% of total revenues
• Telco costs are the largest cost item accounting for about 46% of total revenues, followed by OBU costs accounting for about 14% of total revenues
EBIT build-up in 2030
Variable Costs
Fixed costs
10
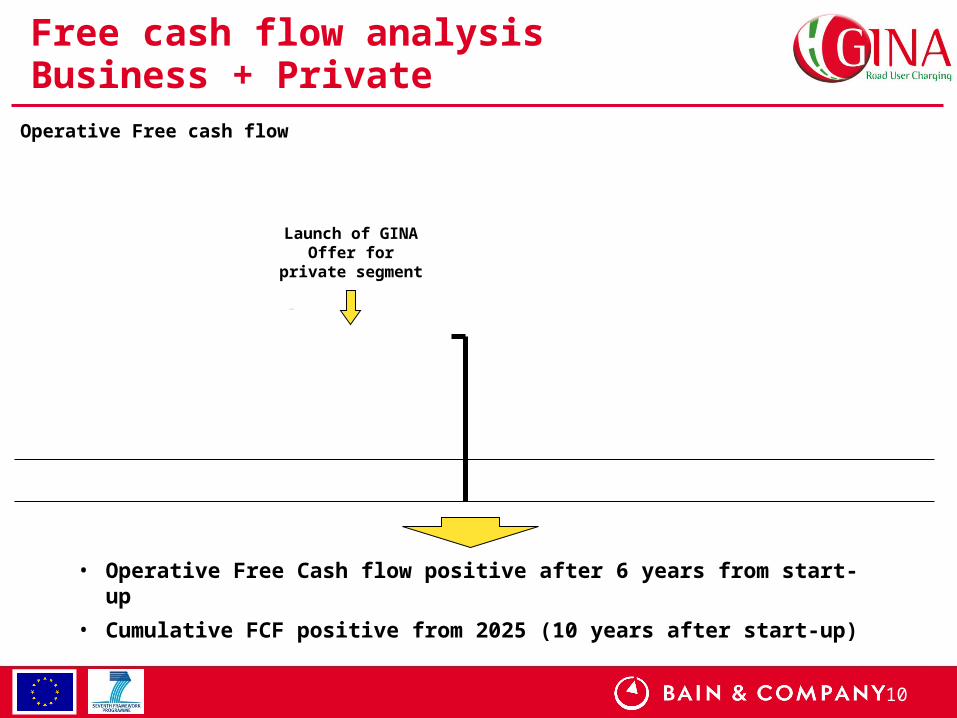
Free cash flow analysisBusiness + Private
-100
0
100
€200M
2013
-26
2014
-62
2015
-77
2016
-39
2017
-57
2018
-41
2019
-8
2020
-12
2021
24
2022
60
2023
73
2024
85
2025
97
2026
108
2027
113
2028
121
2029
127
2030
132
-115 -38 -298 -239 -165 -81 16 124 237 359 486 618-27 -76 -117 -129 -145 -161Cumulative
• Operative Free Cash flow positive after 6 years from start-up
• Cumulative FCF positive from 2025 (10 years after start-up)
Operative Free cash flow
Launch of GINA Offer for private
segment
11
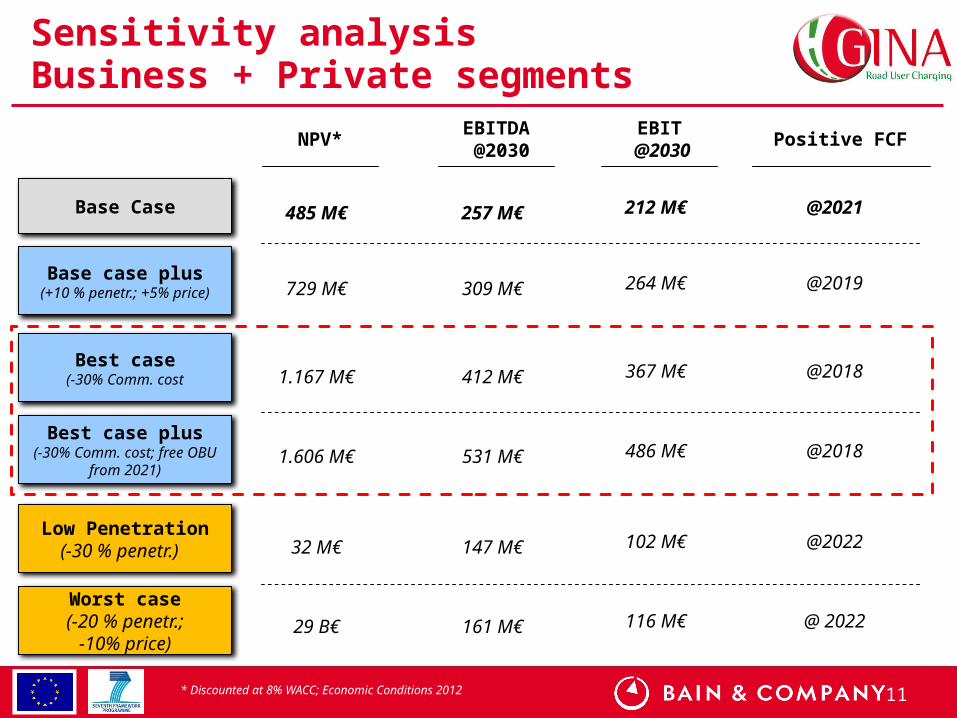
Sensitivity analysisBusiness + Private segments
485 M€ 212 M€ @2021
729 M€ 264 M€ @2019
32 M€ 102 M€ @2022
257 M€
309 M€
147 M€
Base Case
NPV*
Base case plus(+10 % penetr.; +5%
price)
Low Penetration(-30 % penetr.)
Worst case(-20 % penetr.;
-10% price)
EBIT @2030
EBITDA @2030
Best case(-30% Comm. cost
Best case plus(-30% Comm. cost; free
OBU from 2021)
* Discounted at 8% WACC; Economic Conditions 2012
1.167 M€ 367 M€ @2018412 M€
1.606 M€ 486 M€ @2018531 M€
Positive FCF
29 B€ 116 M€ @ 2022161 M€

12
Conclusions
• Significant business opportunity with a good profitability in the long term (EBITDA at regime condition about 20% of Revenues) with two major issues:
Long break-even period that requires a significant start-up financial stress (cumulative FCF positive after 10 years)
High Sensitivity to price change
• Monthly end-user fees are by far the most important source of revenues: toll chargers % fee have a very limited impact
• Largest cost items are Telco costs followed by OBU related costs:
Likely to decrease (best case scenarios very probable)
Alliance with Technology and Telco providers is key
• Value Added Services represent a good opportunity to enlarge the business beyond toll collection service
13
Next Speps
• Customization of the general Business Plan conducted so far for a specific potential service provider
• Detailed analysis with Service Providers of specific Value Added Services to be offered as a bundle or on demand