It’s All Bull Seminars UW Extension Livestock Focus Team March 23 rd, 2004-----Elk Mound March 25...
56
It’s All Bull Seminars UW Extension Livestock Focus Team March 23 rd , 2004-----Elk Mound March 25 th , 2004-----Almond March 26 th , 2004----- By: Keith Vander Velde, Marquette County Agriculture Agent
-
Upload
eliana-hinton -
Category
Documents
-
view
213 -
download
0
Transcript of It’s All Bull Seminars UW Extension Livestock Focus Team March 23 rd, 2004-----Elk Mound March 25...

It’s All Bull Seminars
UW Extension Livestock Focus Team
March 23rd, 2004-----Elk Mound
March 25th, 2004-----Almond
March 26th, 2004-----PlattevilleBy: Keith Vander Velde, Marquette County Agriculture Agent

It’s All Bull Seminars
What’s In the Toolbox Overview
– History of Selection Tools– Performance Data– Expected Progeny Differences– Selection Indexes– Gene Marker Assisted Selection
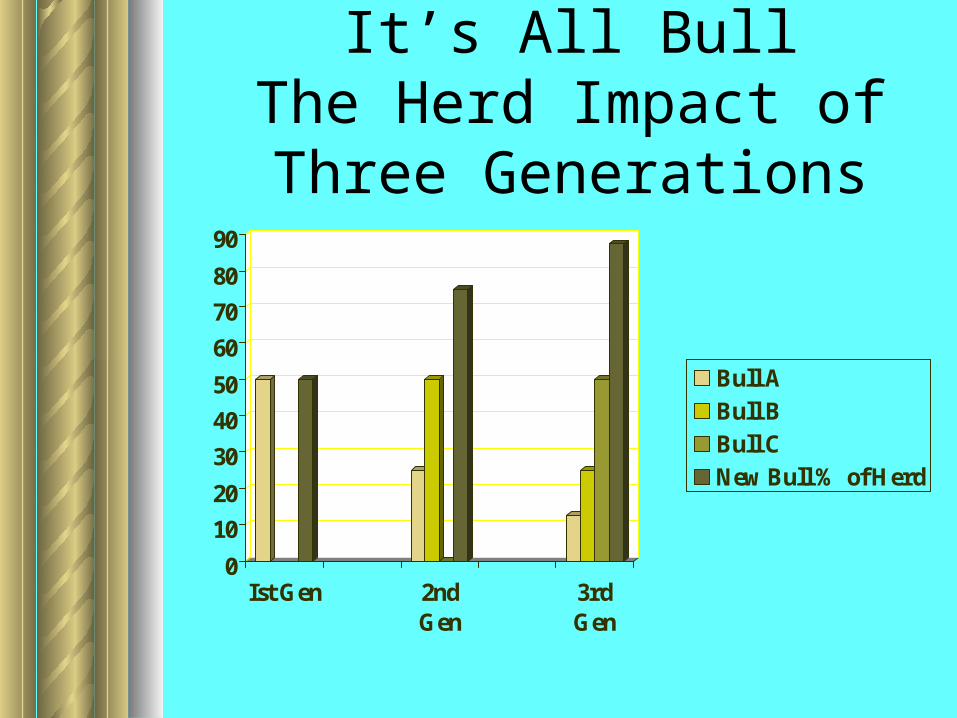
It’s All BullThe Herd Impact of Three
Generations
0
10
20
30
40
50
60
70
80
90
Ist Gen 2ndGen
3rdGen
Bull ABull BBull CNew Bull % of Herd
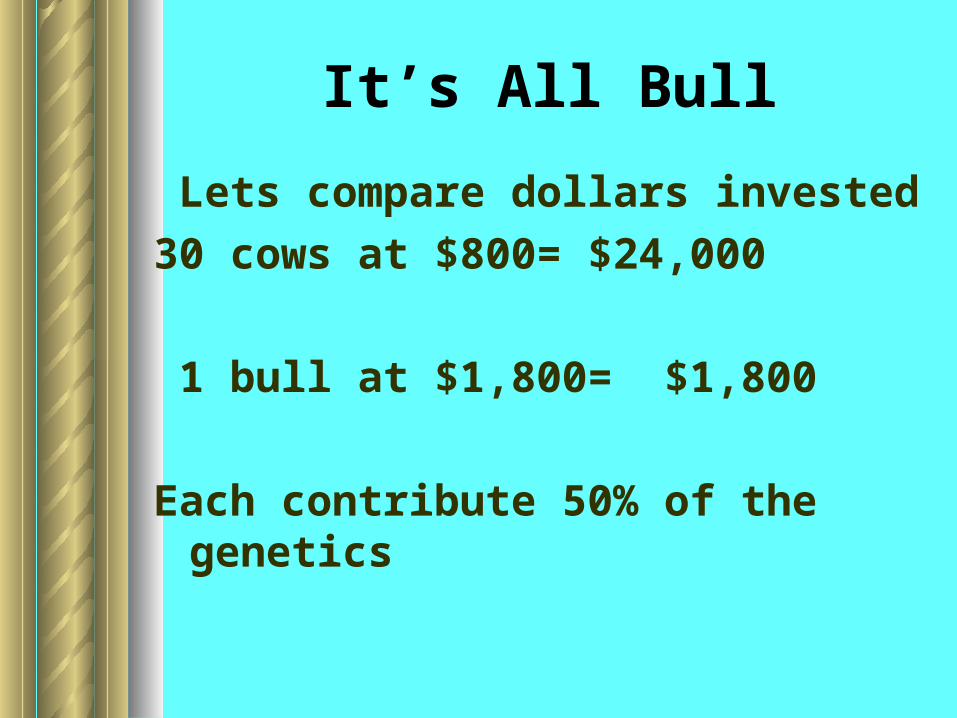
It’s All Bull
Lets compare dollars invested
30 cows at $800= $24,000
1 bull at $1,800= $1,800
Each contribute 50% of the genetics

Beef Producers’ Motivation
HobbyProperty tax reductionProfit

Genetic Merit of Breeds
WW
Breed Average Across-Breed EPD
AngusBeefmasterBrangusCharolaisGelbviehHerefordLimousinRed AngusSimmental
Van Vleck and Cundiff, 2003

Breed Differences
WW MILK
Breed Average Across-Breed EPD
AngusCharolaisGelbviehHerefordLimousinRed AngusSimmental
Van Vleck and Cundiff, 2003
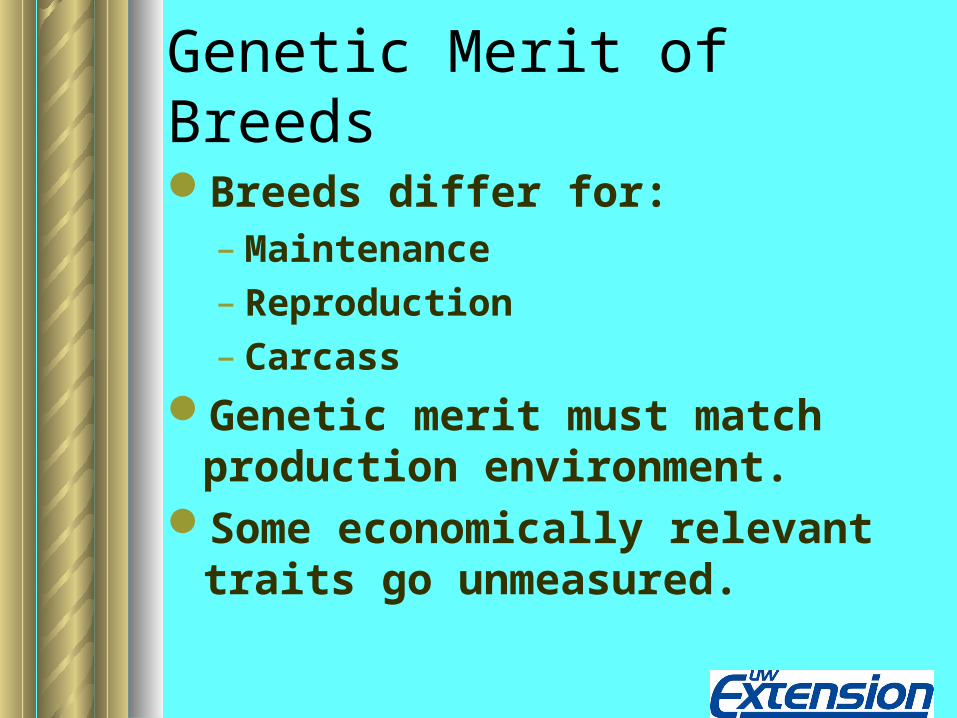
Genetic Merit of Breeds
Breeds differ for:– Maintenance– Reproduction– Carcass
Genetic merit must match production environment.
Some economically relevant traits go unmeasured.
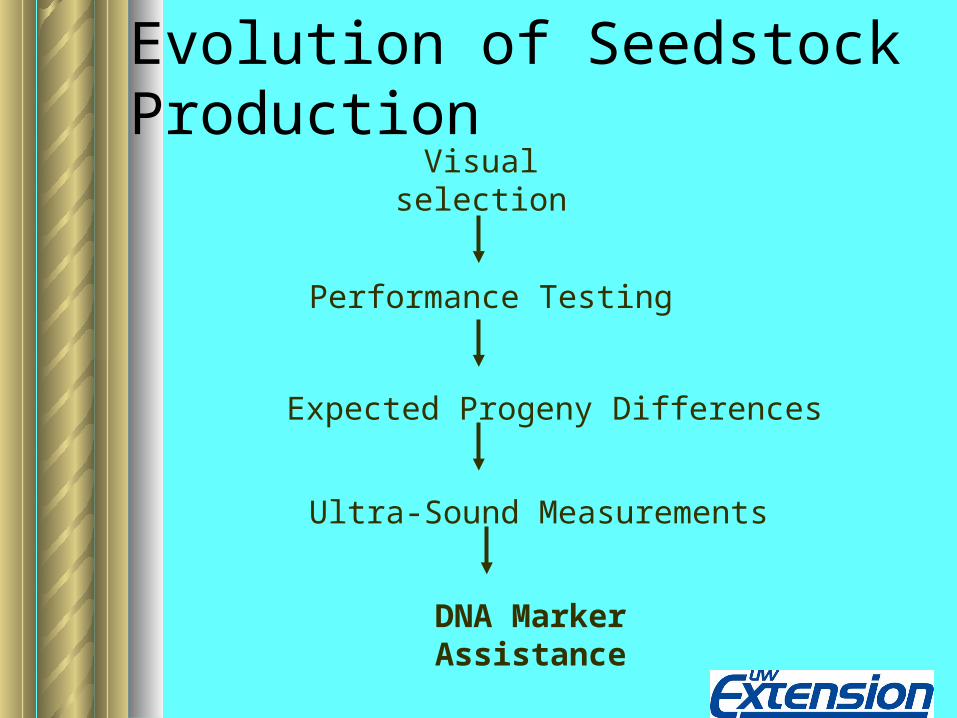
Evolution of Seedstock Production
Visual selection
Performance Testing
Expected Progeny Differences
Ultra-Sound Measurements
DNA Marker Assistance


It’s All Bull
From 1950-1968 PerformanceTesting
Calves were weighed at:
Birth
Weaning
Yearling
Calves were compared within herd
A ratio of 100 was herd average
50% of herd above average
50% below average

It’s All Bull
Sire Summaries Began in 1968– American Simmental Produced first
sire summary using herd performance data and reference sires
– All breeds followed this example– Allowed bulls and cows to be
compared to the entire population in the breed
– Expected Progeny Difference were born

Heritability Makes It All Possible
Portion of a trait’s variation attributable to genetics
In general, heritability is:– High for carcass traits and mature size– Moderate for growth rate and milk
production– Low for reproductive traits

Heritability
Highly heritable traits are the easiest to change with selection
Traits that are low in heritability can be changed with selection, but change is slower
Heritability of a trait is reflected in the range of EPD across a population

Heritability of Production Traits
about 30 to 35%
Birth , Wean, Year. Wts. Feed IntakeFeed ConversionMature Wt. ~ 50%

Weaning WeightGenetic Trend
0
5
10
15
20
25
30
35
80 85 90 95 00
Calf Year of Birth
EPD
(Pou
nds)
HerefordAngusSimmentalCharolais

Maternal MilkGenetic Trend
-2
0
24
6
8
10
1214
16
18
80 85 90 95 00
Calf Year of Birth
EPD
(Pou
nds)
HerefordAngusSimmentalCharolais

Heritability of Product Traits
about 40%FatREACutabiltyMarbling Shear ?

Heritability of Reproduction Traits
about 20%
Conception rateCalving rateCalving ease

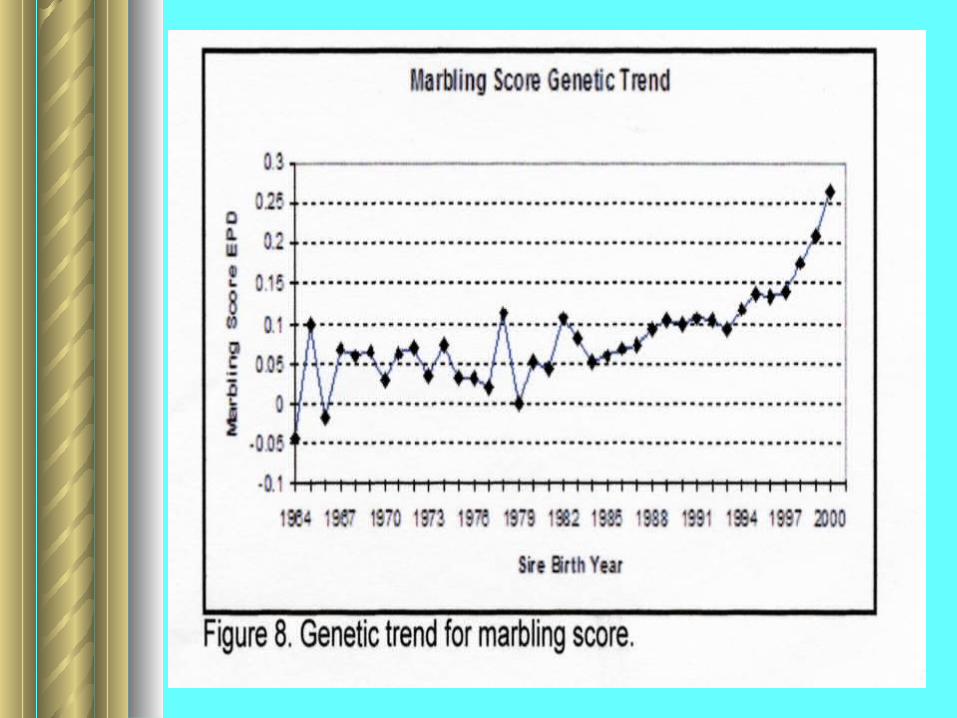
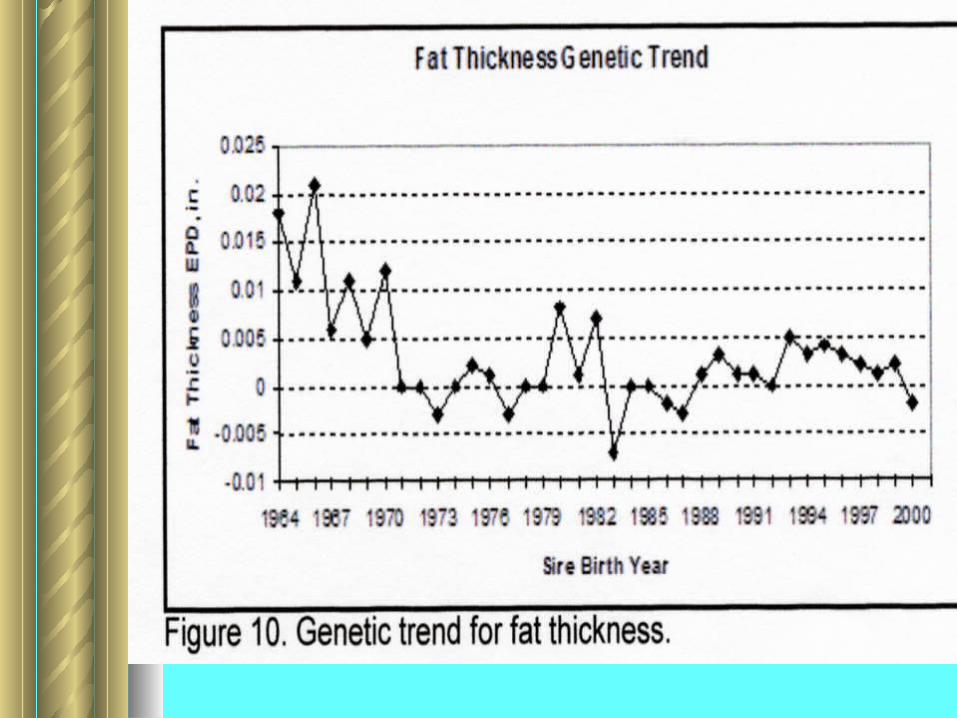
Carcass Traits can be changed Rapidly Using Genetics!!!!!!!!!
Angus genetic trends for slaughter and ultrasound data indicate breeders have changed carcass traits in a very short time interval


It’s All Bull
It is Important to Remember– Highly to moderately heritable traits are
usually best changed by direct selection
– Traits with low heritability can be changed faster by crossbreeding and taking advantage of heterosis

It’s All Bull-Bulls are Different
You Decide Which One Matches the Job
Do You Have Particular Job in Mind for Your Bull??

It’s All Bull-Job Description Bull
Needs vary with uses:– Yearling Heifers– Sell calves at weaning– Retain Replacements– Sell as yearlings– Sell as finished Cattle– Sell grade and yield– Sell on the Grid– Sell beef direct to customer

BW=+1.3
WW=+68
YR=+116
Milk=+27
It’s All Bull
EPD’s==A Look Inside
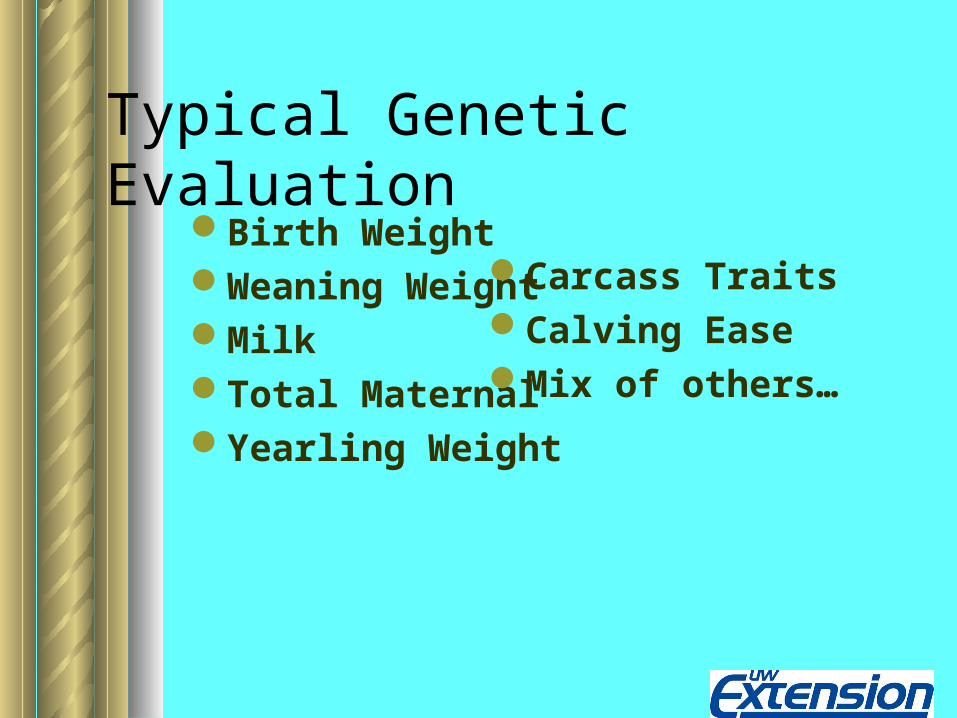
Typical Genetic EvaluationBirth WeightWeaning WeightMilkTotal MaternalYearling Weight
Carcass TraitsCalving EaseMix of others…


Sire Summary of the Future?Birth directBirth maternalWeaning directWeaning maternalTotal maternalYearling direct600 d directCalving directCalving maternalCarcass wtRib fatRump fatLMAMarb scoreQuality grade% Retail yieldLbs (kg) retail yieldYield gradeUs LMAUS rib fatUs % IMFFat percentageCondition score
Gestation lengthDays to calvingCalving intervalStayabilityHeifer pregnancy rateRebreeding rateCalf weaned/cow exposedScrotal circumferencePelvic areaFrame scoreMuscle scoreUdder scoreDocilityTick scoreParasite egg countMature weightMaintenance energyFeed efficiencyDrop weightType scoreUterine scoreTooth scorePrecocity score
Feedlot feed consumptionFeedlot surv.Pre-wean surv.Serving capacityServing proportionSemen volumeHip heightLeg scoreLength productive lifeDoing abilityGrand-maternal weaningTwinning rateDays to 11mm BFDays to 75% ChoiceDays to carc wt.Hair whorl scoreAverage daily gainWt. /day of ageLiver weightResting heart ratePulmonary arteriole pressureBrisket disease rateBraveryAggression
It’s All Bull
New CarcassIndex Traits in Angus in 2004

It’s All Bull
Feedlot Value ($F)– Uses Weaning and Yearling Weight EPD’s
along with trait interrelationships– Uses typical feedlot gain value,days on feed,
feed consumption and cost differences– Trait range -$43 to +$67
It’s All Bull
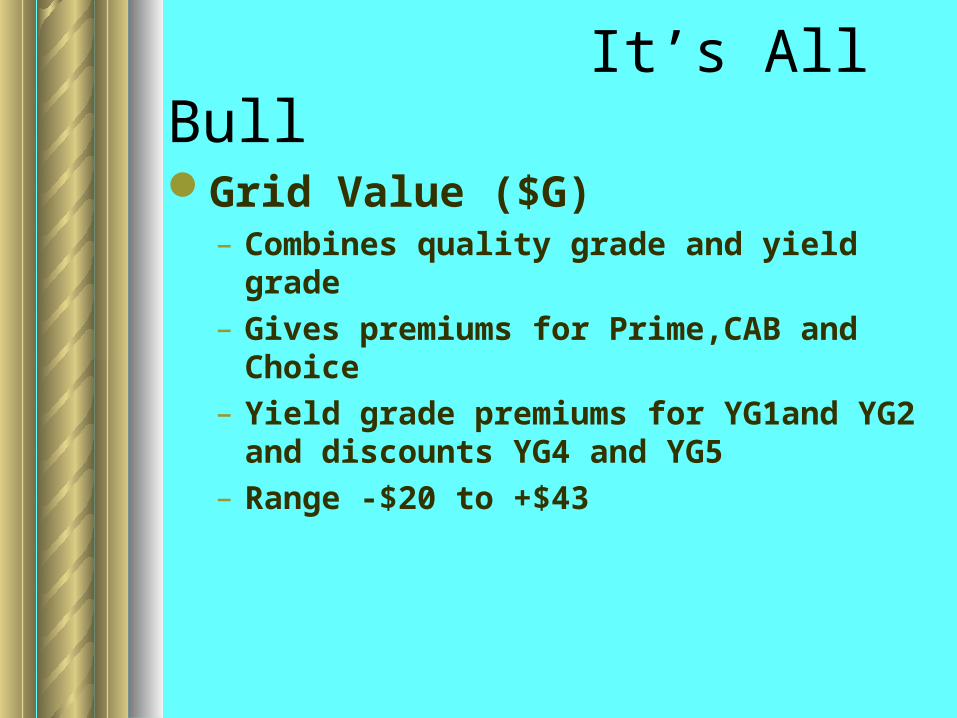
Grid Value ($G)– Combines quality grade and yield grade– Gives premiums for Prime,CAB and Choice– Yield grade premiums for YG1and YG2 and
discounts YG4 and YG5– Range -$20 to +$43
It’s All Bull
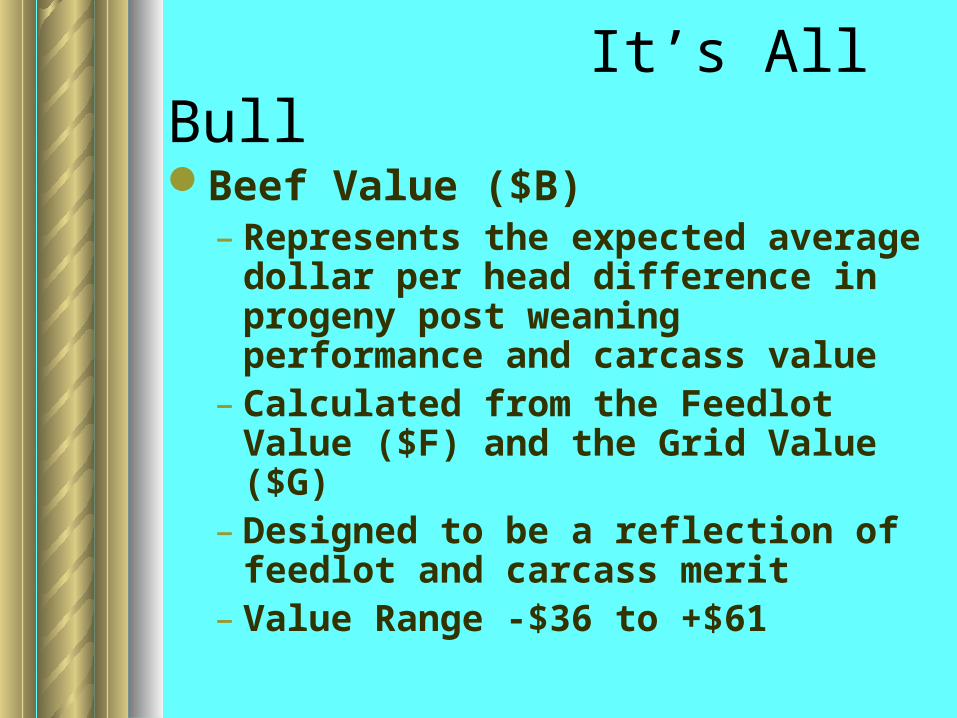
Beef Value ($B)– Represents the expected average
dollar per head difference in progeny post weaning performance and carcass value
– Calculated from the Feedlot Value ($F) and the Grid Value ($G)
– Designed to be a reflection of feedlot and carcass merit
– Value Range -$36 to +$61

It’s All Bull
Tenderness:Warner Bratzler Shear Force(WBSF)Calpain-enzyme increases tendernessCalpastatin-enzyme inhibits calpainTenderGENE- a DNA marker test for
Calpain genesGene Star Tenderness I-DNA test for less
Calpastatin


Typical Genetic EvaluationToday EPD’s are:
– Proven– Accepted– Well-used
In the Future will:– More EPD allow us to better characterize
the genetic potential of animals– They be designed for more profitable
selection decisions
What does the future hold

Combining EPD for financially sound selection decisionsSelection index (Hazel, 1943)
Has been successfully implemented in other livestock species

Methods ofMultiple-Trait SelectionIndependent Culling Levels-Sire Search
– Most commonly used– Set min/max levels for each trait (EPD)
Selection Index-– Most effective for overcoming
antagonisms– Weight traits (EPD) on economic
importance
Selection IndexSelection Index is fairly aggressiveMost producers will be able to
design a simple index using a spreadsheet such as Microsoft Excel
Many breed association and university personnel are working on an index
Bull test stations have used indexes for years to determine which bulls qualify for the sale.


It’ All BullWhat is the value difference in the
following two bulls:– Bull A WW EPD = +16– Bull B WW EPD = +32
– Difference = 16 pounds in EPD
Price is $1.05 per pound– 16 * 1.05 = $16.80
Assume we will keep replacements for a 400 cow herd


Our desire is that producers use EPDs to build indexes that are consistant with their business goal(s)
Profit = Income – Expense
It’s All Bull
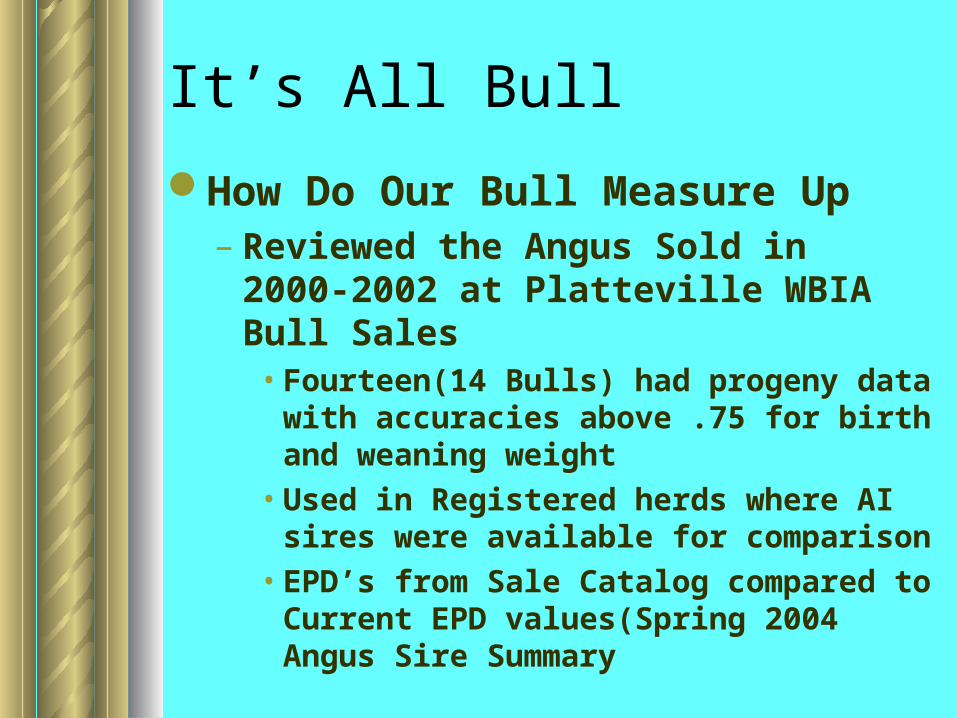
How Do Our Bull Measure Up– Reviewed the Angus Sold in 2000-2002
at Platteville WBIA Bull Sales• Fourteen(14 Bulls) had progeny data with
accuracies above .75 for birth and weaning weight
• Used in Registered herds where AI sires were available for comparison
• EPD’s from Sale Catalog compared to Current EPD values(Spring 2004 Angus Sire Summary

It’s All Bull-----Platteville
Catalog EPD values of 14 bullsSale catalog BW WW YR Milk
3.2 40 74 20
Current Value 3.0 40 74 19

It’s All Bull-----Platteville
No Difference in the group averageAs Individuals most changed two
lbs or less in growth traitsMore change in Milk EPD up to 14
lbs– Why—Bulls sires had no daughter
history when used and when proven the values reflect it
– These bulls have no daughter data in summary, they are their parent averages
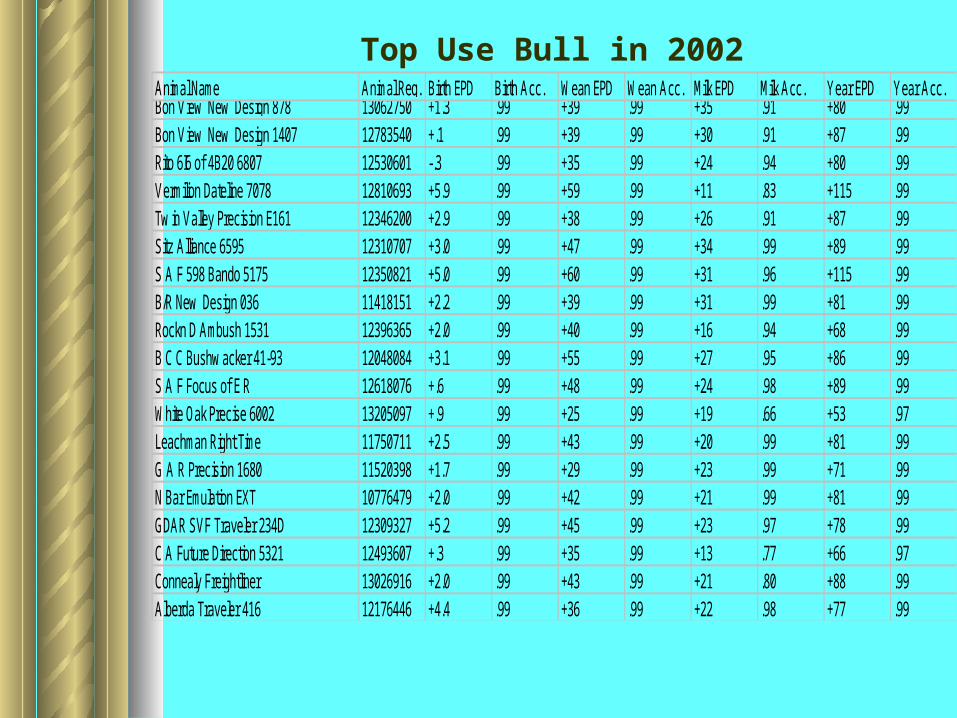
Animal Name Animal Reg. No.Birth EPD Birth Acc. Wean EPD Wean Acc. Milk EPD Milk Acc. Year EPD Year Acc.Bon View New Design 878 13062750 +1.3 .99 +39 .99 +35 .91 +80 .99Bon View New Design 1407 12783540 +.1 .99 +39 .99 +30 .91 +87 .99Rito 6I6 of 4B20 6807 12530601 -.3 .99 +35 .99 +24 .94 +80 .99Vermilion Dateline 7078 12810693 +5.9 .99 +59 .99 +11 .83 +115 .99Tw in Valley Precision E161 12346200 +2.9 .99 +38 .99 +26 .91 +87 .99Sitz Alliance 6595 12310707 +3.0 .99 +47 .99 +34 .99 +89 .99S A F 598 Bando 5175 12350821 +5.0 .99 +60 .99 +31 .96 +115 .99B/R New Design 036 11418151 +2.2 .99 +39 .99 +31 .99 +81 .99Rockn D Ambush 1531 12396365 +2.0 .99 +40 .99 +16 .94 +68 .99B C C Bushw acker 41-93 12048084 +3.1 .99 +55 .99 +27 .95 +86 .99S A F Focus of E R 12618076 +.6 .99 +48 .99 +24 .98 +89 .99White Oak Precise 6002 13205097 +.9 .99 +25 .99 +19 .66 +53 .97Leachman Right Time 11750711 +2.5 .99 +43 .99 +20 .99 +81 .99G A R Precision 1680 11520398 +1.7 .99 +29 .99 +23 .99 +71 .99N Bar Emulation EXT 10776479 +2.0 .99 +42 .99 +21 .99 +81 .99GDAR SVF Traveler 234D 12309327 +5.2 .99 +45 .99 +23 .97 +78 .99C A Future Direction 5321 12493607 +.3 .99 +35 .99 +13 .77 +66 .97Connealy Freightliner 13026916 +2.0 .99 +43 .99 +21 .80 +88 .99Alberda Traveler 416 12176446 +4.4 .99 +36 .99 +22 .98 +77 .99
Top Use Bull in 2002
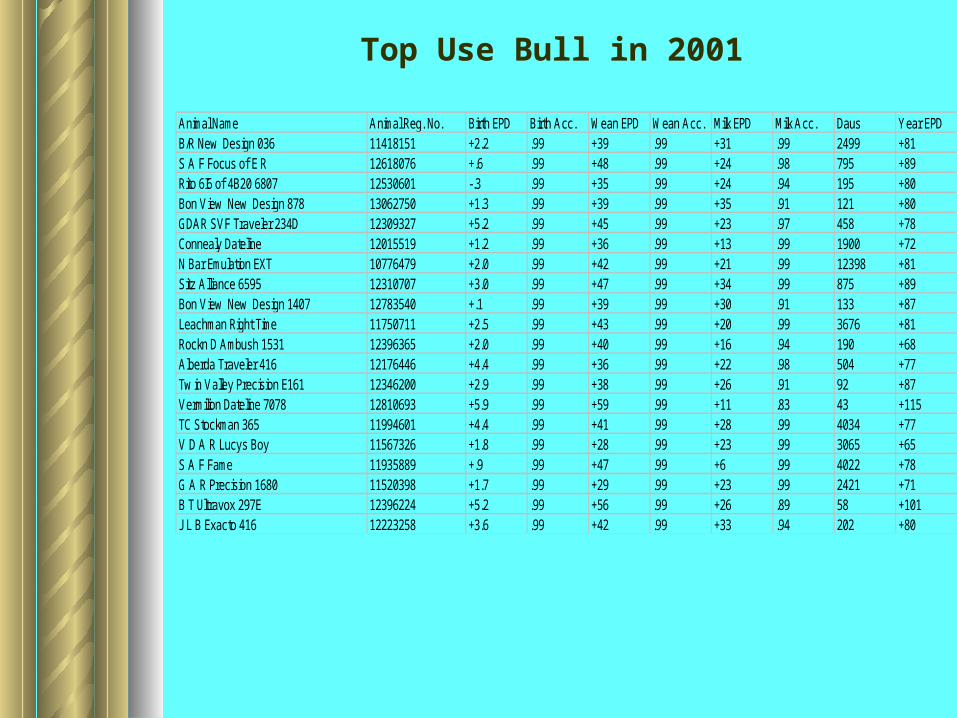
Top Use Bull in 2001
Animal Name Animal Reg. No. Birth EPD Birth Acc. Wean EPD Wean Acc. Milk EPD Milk Acc. Daus Year EPDB/R New Design 036 11418151 +2.2 .99 +39 .99 +31 .99 2499 +81S A F Focus of E R 12618076 +.6 .99 +48 .99 +24 .98 795 +89Rito 6I6 of 4B20 6807 12530601 -.3 .99 +35 .99 +24 .94 195 +80Bon View New Design 878 13062750 +1.3 .99 +39 .99 +35 .91 121 +80GDAR SVF Traveler 234D 12309327 +5.2 .99 +45 .99 +23 .97 458 +78Connealy Dateline 12015519 +1.2 .99 +36 .99 +13 .99 1900 +72N Bar Emulation EXT 10776479 +2.0 .99 +42 .99 +21 .99 12398 +81Sitz Alliance 6595 12310707 +3.0 .99 +47 .99 +34 .99 875 +89Bon View New Design 1407 12783540 +.1 .99 +39 .99 +30 .91 133 +87Leachman Right Time 11750711 +2.5 .99 +43 .99 +20 .99 3676 +81Rockn D Ambush 1531 12396365 +2.0 .99 +40 .99 +16 .94 190 +68Alberda Traveler 416 12176446 +4.4 .99 +36 .99 +22 .98 504 +77Tw in Valley Precision E161 12346200 +2.9 .99 +38 .99 +26 .91 92 +87Vermilion Dateline 7078 12810693 +5.9 .99 +59 .99 +11 .83 43 +115TC Stockman 365 11994601 +4.4 .99 +41 .99 +28 .99 4034 +77V D A R Lucys Boy 11567326 +1.8 .99 +28 .99 +23 .99 3065 +65S A F Fame 11935889 +.9 .99 +47 .99 +6 .99 4022 +78G A R Precision 1680 11520398 +1.7 .99 +29 .99 +23 .99 2421 +71B T Ultravox 297E 12396224 +5.2 .99 +56 .99 +26 .89 58 +101J L B Exacto 416 12223258 +3.6 .99 +42 .99 +33 .94 202 +80
It’s All Bull
Summary– Bulls play large role in herd genetics– Many tools are now available to decide
– Producers must decide what traits are important to them, visual & $$$
– Indexes will play a role in the future as we have more traits to evaluate and use to sort bulls

It’s All Bull
Thanks for your attendance
Have a safe trip home