ITIM Service Catalog External Presentation
35
IT Service Catalog: Opening New Customer Channels While Driving Service Improvements Presented by: Neil Weitz ITSM Forum
Transcript of ITIM Service Catalog External Presentation

IT Service Catalog: Opening New Customer Channels While Driving Service Improvements
Presented by:
Neil Weitz
ITSM Forum


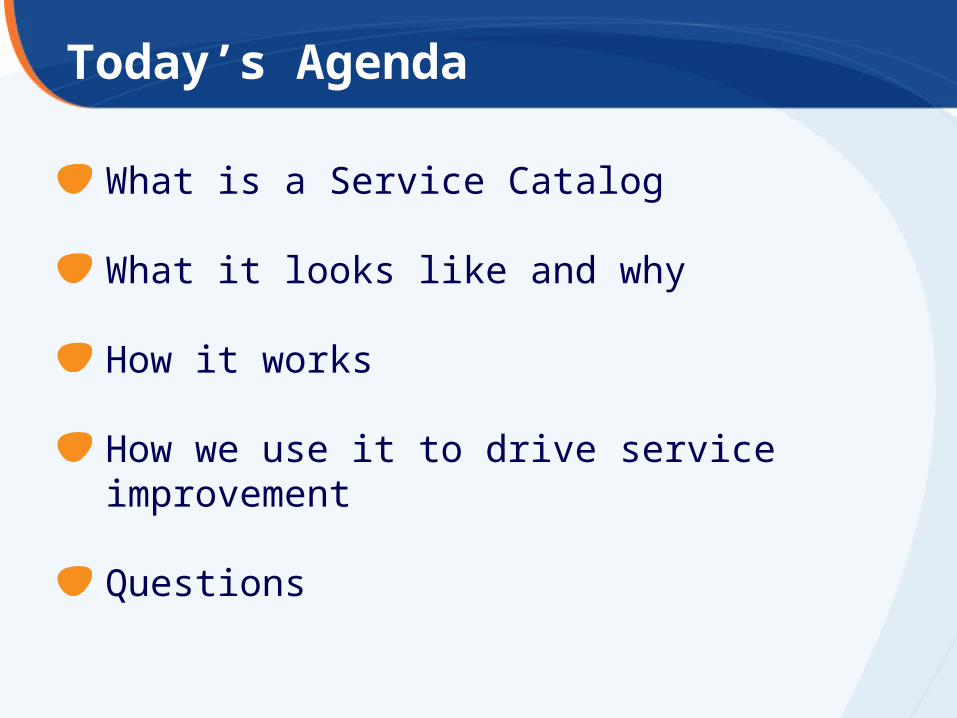
Today’s Agenda
What is a Service Catalog
What it looks like and why
How it works
How we use it to drive service improvement
Questions

What is a Service Catalog?
A simple way for our customers to find, understand and engage with IT services.
A tool for Service Owners to improve and optimize Services
A framework to build repeatability and predictability into service delivery
In the most simple form: – A paper or spreadsheet inventorying IT Services, listing Service
Levels and Service Owners
In the most sophisticated form:– An online brochure or menu of IT Services with an automated
(actionable) request to fulfillment workflow application, linked to a service analytics dashboard
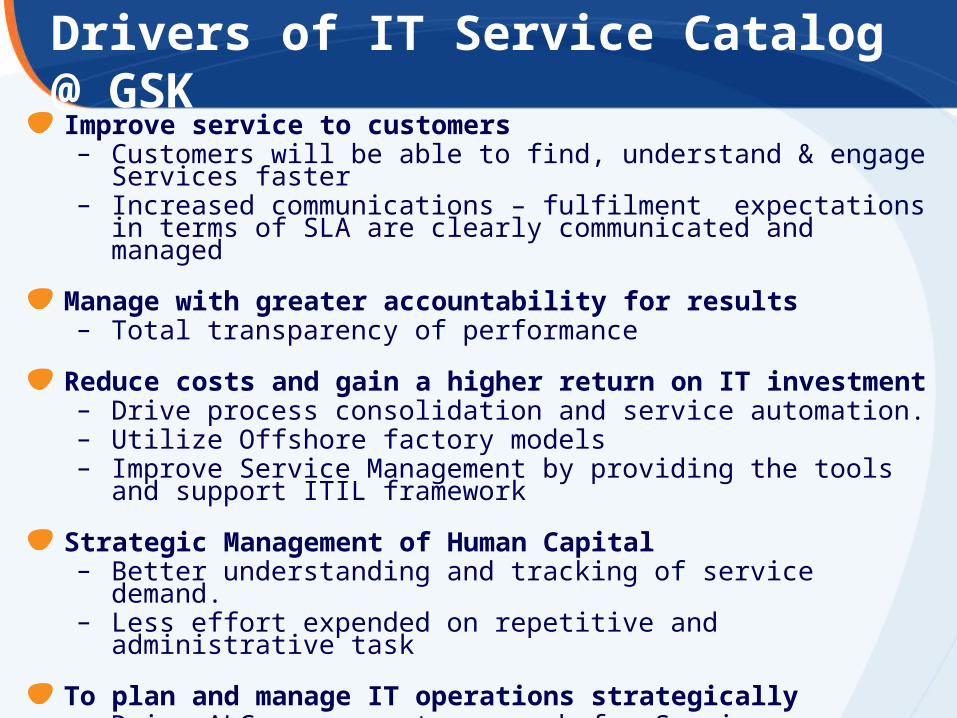
Drivers of IT Service Catalog @ GSK Improve service to customers– Customers will be able to find, understand & engage Services faster– Increased communications – fulfilment expectations in terms of SLA
are clearly communicated and managed
Manage with greater accountability for results – Total transparency of performance
Reduce costs and gain a higher return on IT investment – Drive process consolidation and service automation.– Utilize Offshore factory models– Improve Service Management by providing the tools and support ITIL
framework
Strategic Management of Human Capital– Better understanding and tracking of service demand. – Less effort expended on repetitive and administrative task
To plan and manage IT operations strategically – Drive ALC management approach for Services.– Provide consistent data on volume and cycle time, to measure
objectively and monitor in real time
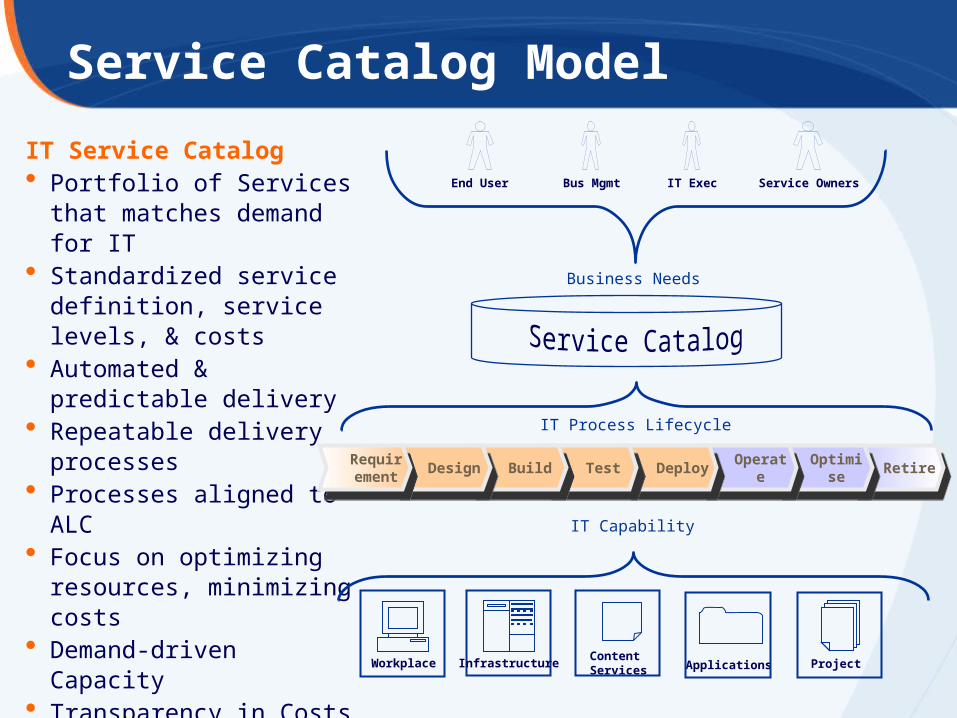
End User Bus Mgmt IT Exec Service Owners
IT Service Catalog• Portfolio of Services that
matches demand for IT• Standardized service
definition, service levels, & costs
• Automated & predictable delivery
• Repeatable delivery processes
• Processes aligned to ALC• Focus on optimizing
resources, minimizing costs• Demand-driven Capacity• Transparency in Costs and
Service Level performance
Service Catalog Model
WorkplaceContent Services Applications Project
RetireRetireOptimis
e
OptimiseOperate
OperateDeploy
DeployTest
TestBuild
BuildDesign
DesignRequirement
Requirement
IT Process Lifecycle
Infrastructure
Business Needs
IT Capability

What it looks like @ GSK
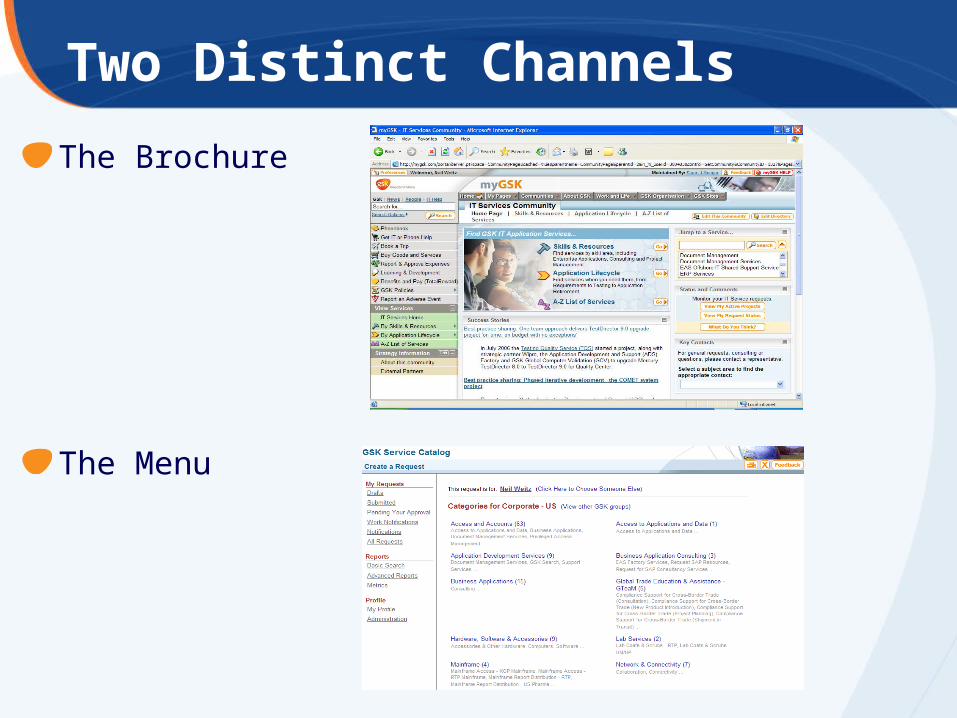
Two Distinct Channels
The Brochure
The Menu
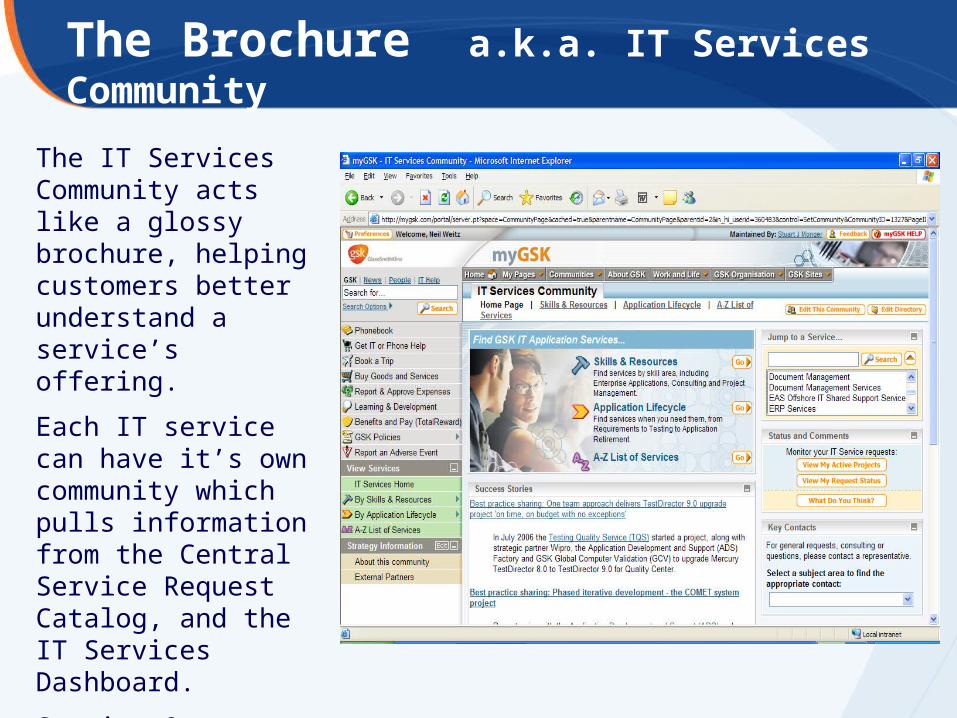
The Brochure a.k.a. IT Services Community
The IT Services Community acts like a glossy brochure, helping customers better understand a service’s offering.
Each IT service can have it’s own community which pulls information from the Central Service Request Catalog, and the IT Services Dashboard.
Service Owners maintain those linkages using an administration screen.
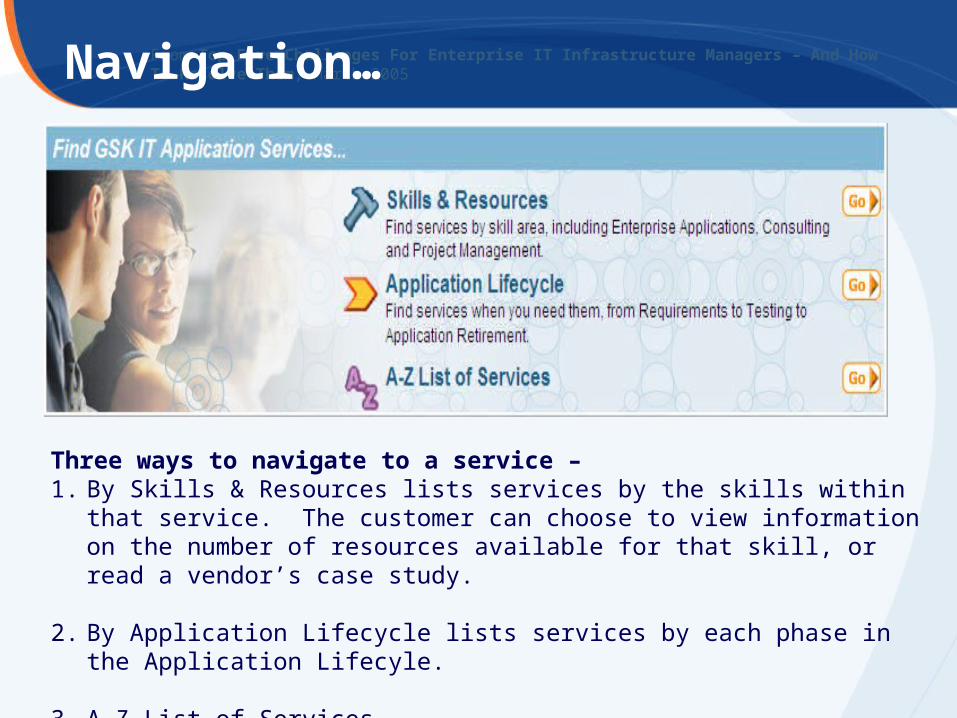
From Top Five Challenges For Enterprise IT Infrastructure Managers – And How To Resolve Them, March 2005Navigation…
Three ways to navigate to a service – 1. By Skills & Resources lists services by the skills within that service. The
customer can choose to view information on the number of resources available for that skill, or read a vendor’s case study.
2. By Application Lifecycle lists services by each phase in the Application Lifecyle.
3. A-Z List of Services
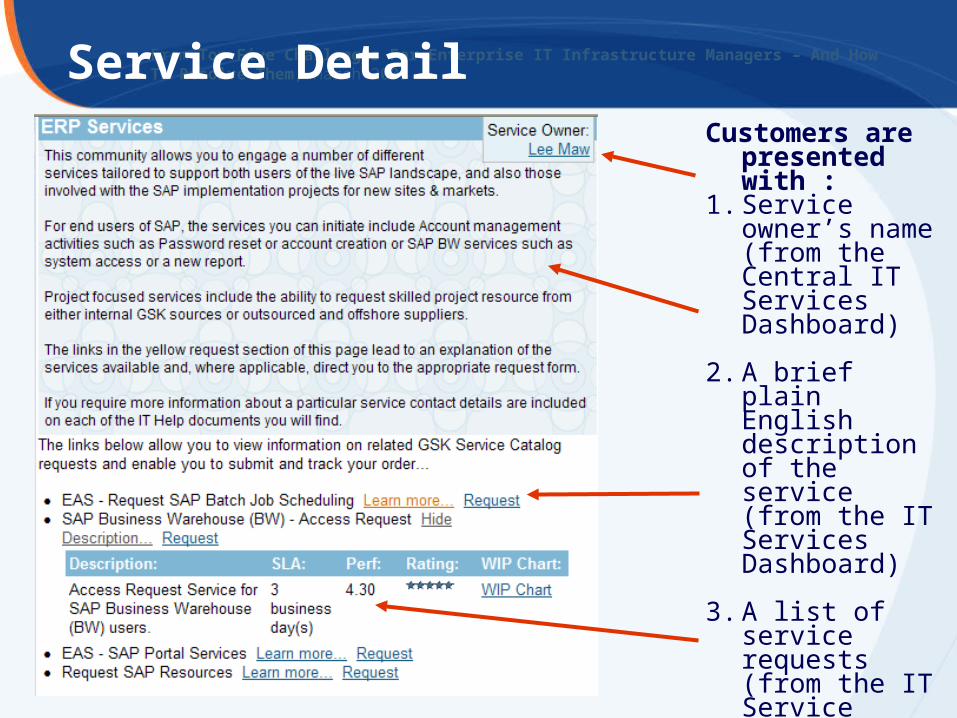
From Top Five Challenges For Enterprise IT Infrastructure Managers – And How To Resolve Them, March 2005Service Detail
Customers are presented with :
1. Service owner’s name (from the Central IT Services Dashboard)
2. A brief plain English description of the service (from the IT Services Dashboard)
3. A list of service requests (from the IT Service Request Catalog)
4. Current SLA and Performance Data
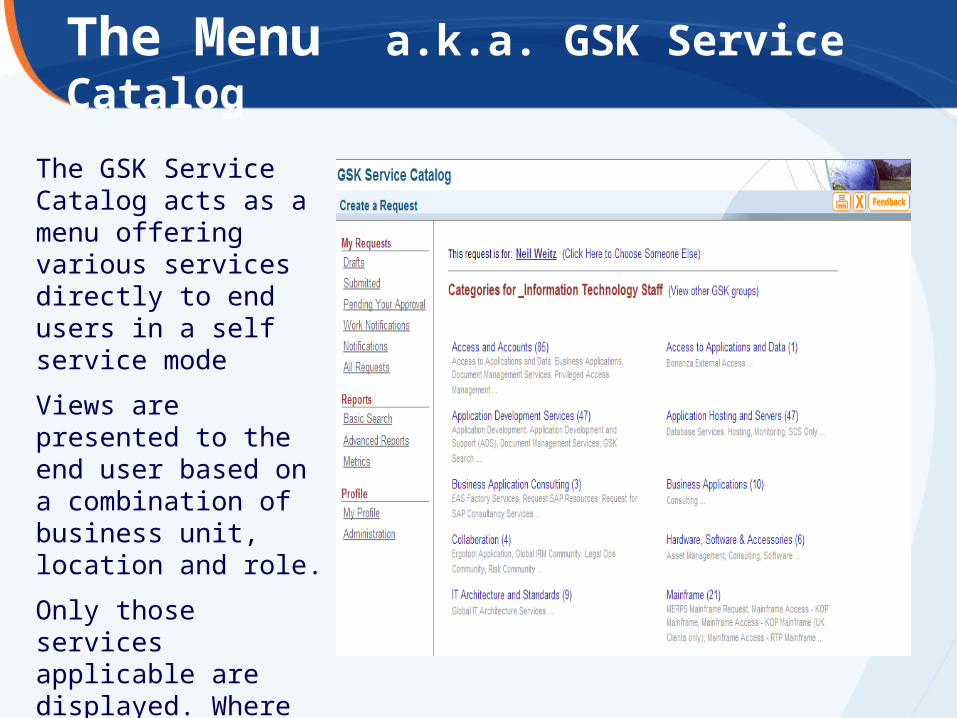
The Menu a.k.a. GSK Service Catalog
The GSK Service Catalog acts as a menu offering various services directly to end users in a self service mode
Views are presented to the end user based on a combination of business unit, location and role.
Only those services applicable are displayed. Where available, Service Request forms are presented in users preferred language.
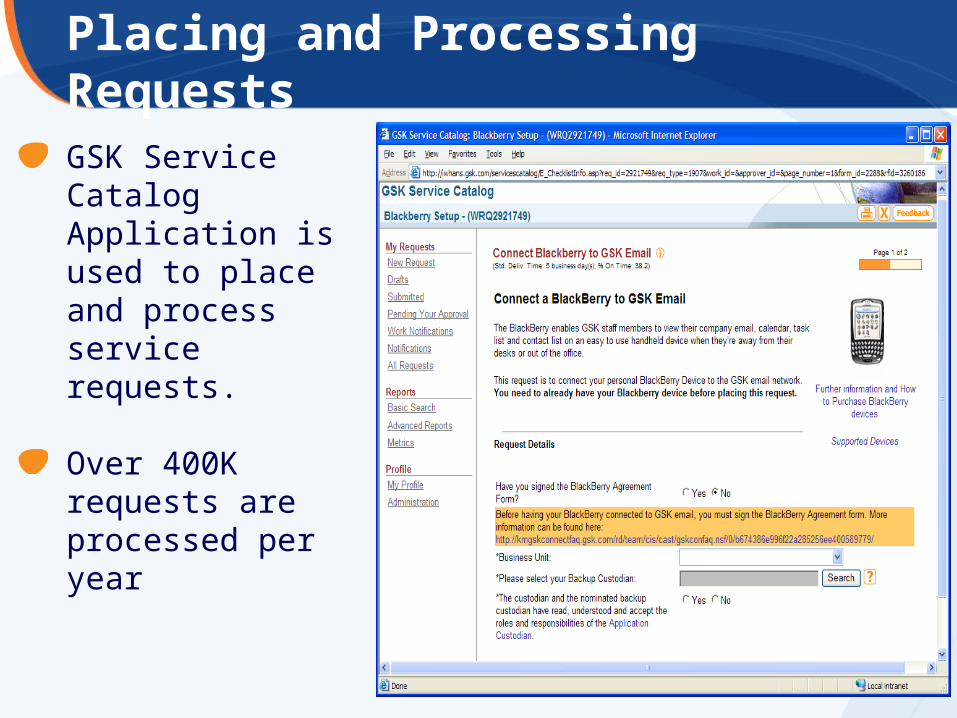
Placing and Processing Requests
GSK Service Catalog Application is used to place and process service requests.
Over 400K requests are processed per year

How It Works @ GSK
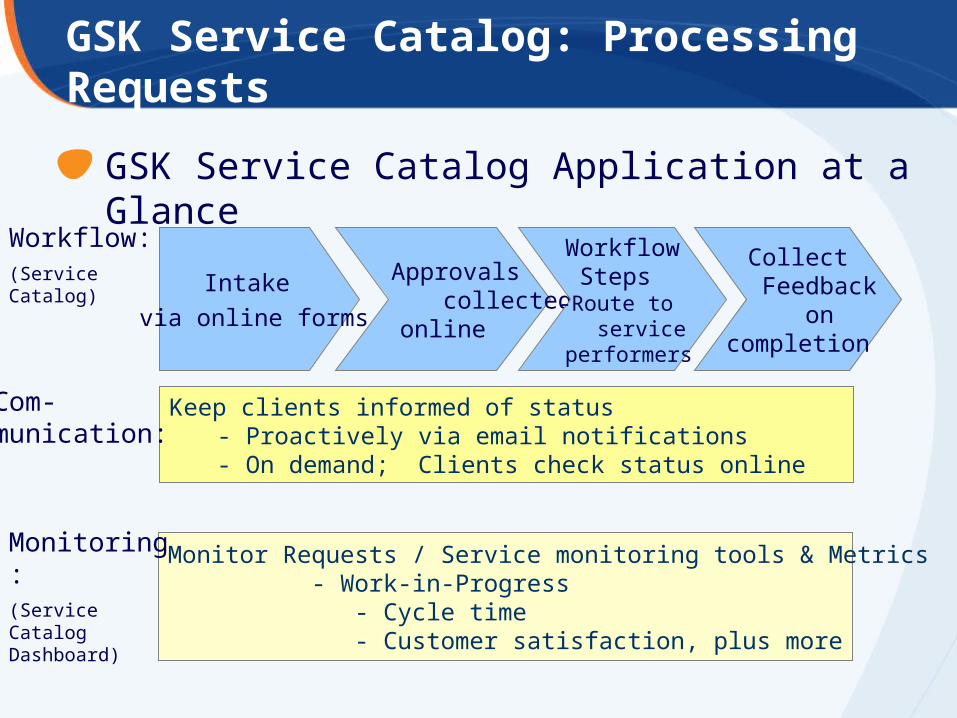
GSK Service Catalog: Processing Requests
GSK Service Catalog Application at a Glance
Intake
via online forms
Approvals collected
online
WorkflowSteps
-Route to service
performers
Collect Feedback
on completion
Keep clients informed of status - Proactively via email notifications- On demand; Clients check status online
Monitor Requests / Service monitoring tools & Metrics - Work-in-Progress - Cycle time - Customer satisfaction, plus more
Workflow:(Service Catalog)
Monitoring:(Service Catalog Dashboard)
Com-munication:
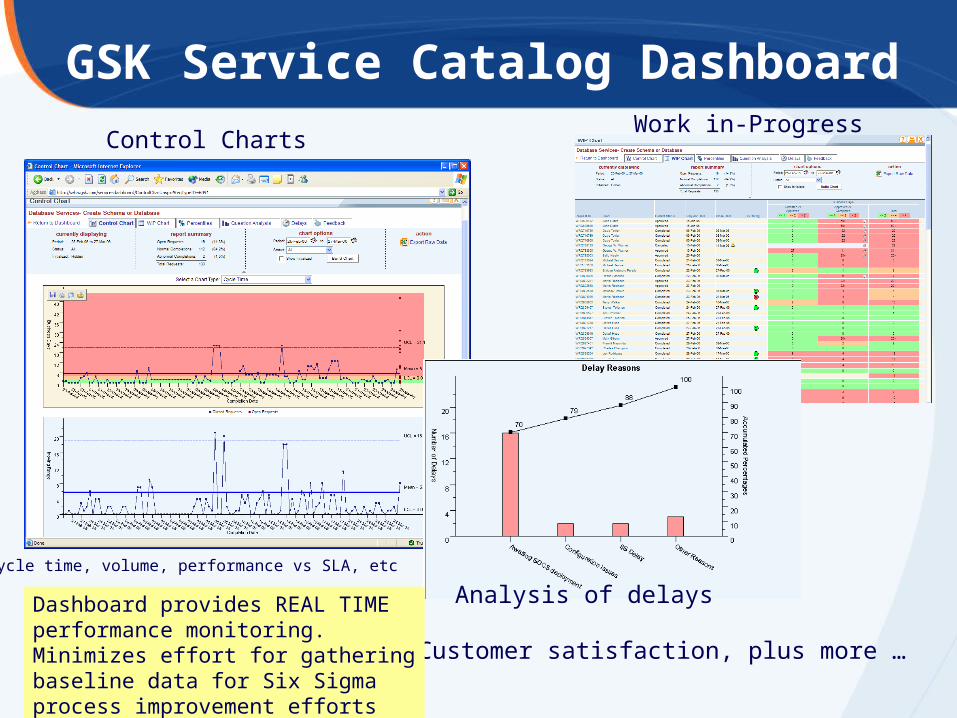
GSK Service Catalog Dashboard
Control Charts
Cycle time, volume, performance vs SLA, etc
Work in-Progress
Analysis of delays
Customer satisfaction, plus more …
Dashboard provides REAL TIME performance monitoring. Minimizes effort for gathering baseline data for Six Sigma process improvement efforts

What we mean by Service Improvement -- What we DID !
Ran an improvement program that resulted in 79% reduction in request to fulfillment time from 326 days to 68 days for top 9 IT service requests.
Across all IT Services, Improved Request to Fulfillment by 43% from 90% completed within 12.6 days to 90% completed within 9 days…. – Benefit: 370K days cycle time saved
Greater than 86% of all IT requests are fulfilled in 5 days or less
77% of end-user requests fulfilled in less than 1 day
How we drive Service Improvement
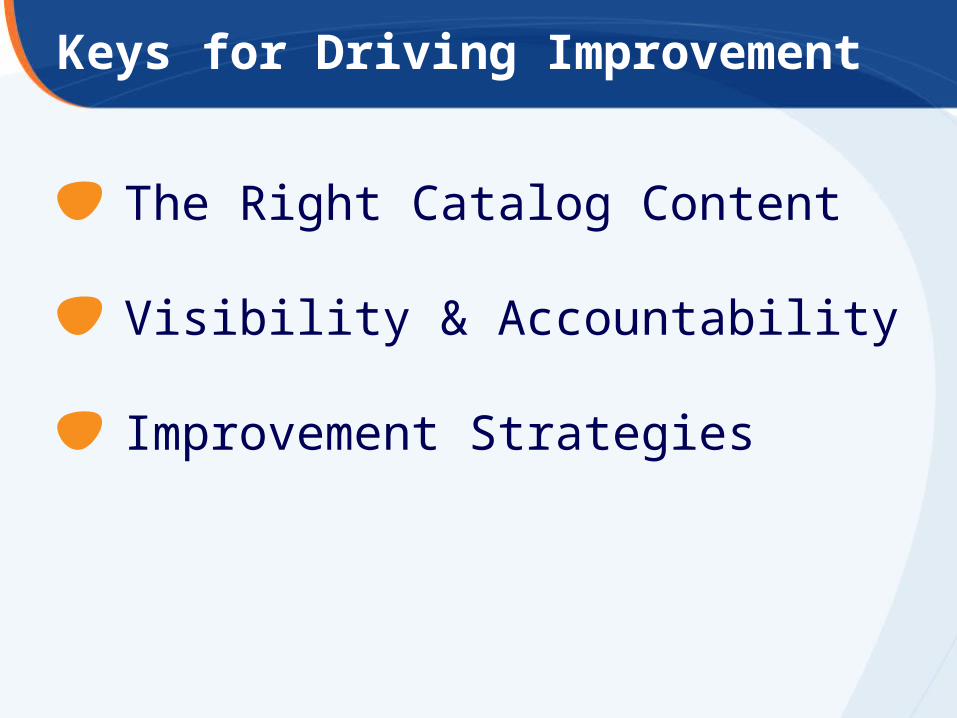
Keys for Driving Improvement
The Right Catalog Content
Visibility & Accountability
Improvement Strategies
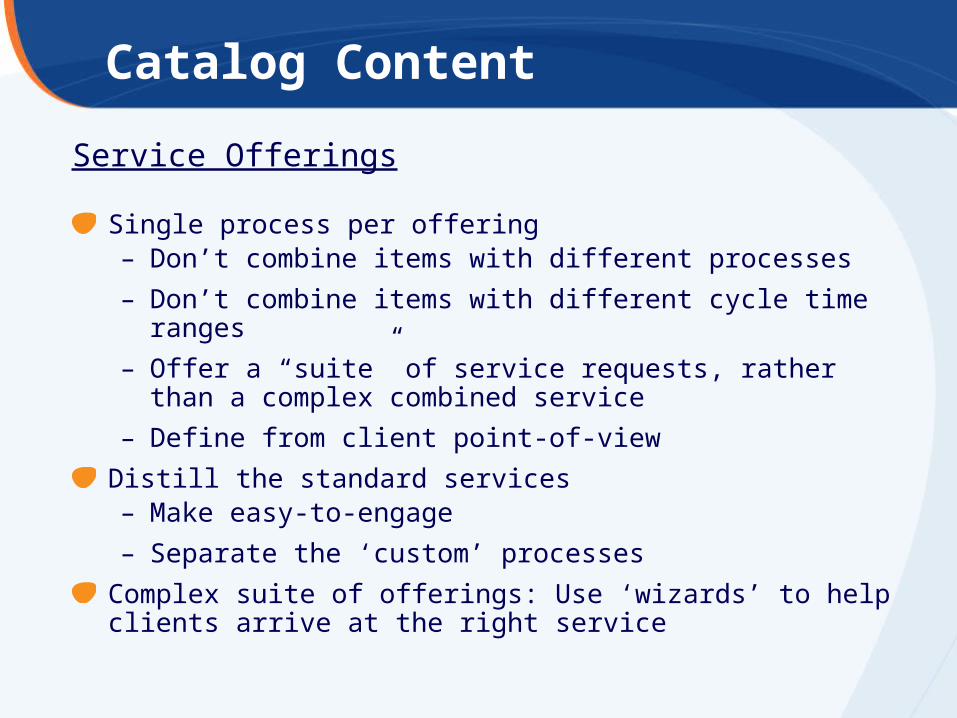
Catalog Content
Service Offerings
Single process per offering– Don’t combine items with different processes
– Don’t combine items with different cycle time ranges
– Offer a “suite” of service requests, rather than a complex combined service
– Define from client point-of-view
Distill the standard services– Make easy-to-engage
– Separate the ‘custom’ processes
Complex suite of offerings: Use ‘wizards’ to help clients arrive at the right service

Visibility is Key for Improving Service Management
Visibility of Performance
Visible services portfolio and service performance are now a way-of-working for IT service requests
Make Service owners aware that Service Request performance is highly visible now that services are in the GSK Service Catalog
– Now visible now more chance for accountability
– All services measured on common measures and scales
– Top (and bottom) performers reviewed monthly at Upper Management Team
– All services required to collect customer feedback (same rating scale and questions)

Accountability: Key Measures
Key areas for scrutiny by IT Management
1. Cycle time from request to fulfillment
2. Performance versus SLA
3. Appropriate SLA’s (either high or low is suspect)
4. Customer satisfaction
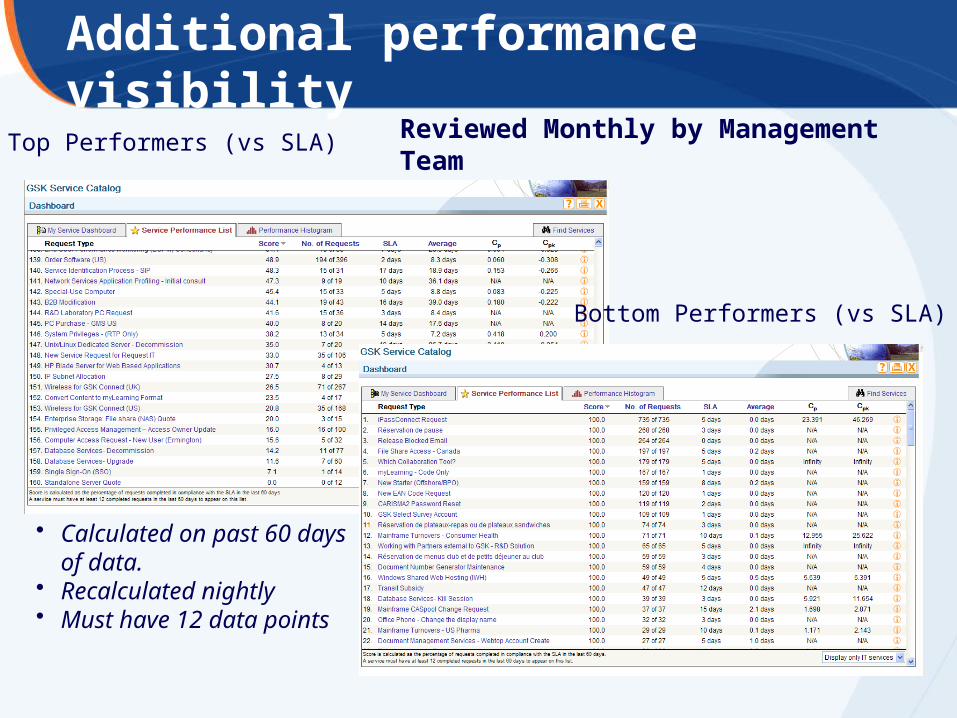
Additional performance visibility
Top Performers (vs SLA)
Bottom Performers (vs SLA)
• Calculated on past 60 days of data.
• Recalculated nightly• Must have 12 data points
Reviewed Monthly by Management Team
Request to Fulfillment: Goal and Strategy
Goal:
Improve request to fulfillment for service requests
– Improve cycle time so 90% are delivered in 5 days or less
Strategies to achieve:Improve cycle time for fulfillment by improving service management.
Setup common framework for measuring – GSK Service Catalog Dashboard
Give service owners and their management understanding of how to use the tools for monitoring service performance
Hold owners accountable – (now happening at all levels)
Drive process improvements – Zero-touch fulfillment, simplification
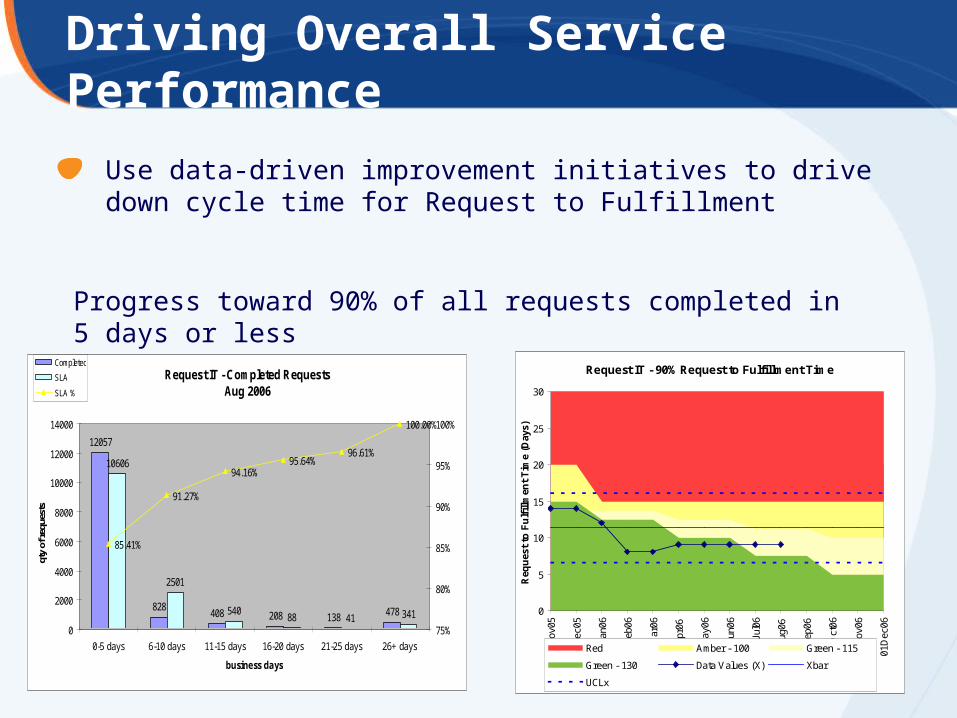
Driving Overall Service Performance
Use data-driven improvement initiatives to drive down cycle time for Request to Fulfillment
Request IT - Completed Requests Aug 2006
12057
828408 208 138 478
10606
2501
54088 41 341
85.41%
91.27%
94.16%95.64%
96.61%
100.00%
0
2000
4000
6000
8000
10000
12000
14000
0-5 days 6-10 days 11-15 days 16-20 days 21-25 days 26+ days
business days
qty
of re
ques
ts
75%
80%
85%
90%
95%
100%
Completed
SLA
SLA %
1764 HW requests removed - not tracked end to end
Request IT - 90% Request to Fulfillment Time
0
5
10
15
20
25
30
01N
ov05
01D
ec05
01Ja
n06
01F
eb06
01M
ar06
01A
pr06
01M
ay06
01Ju
n06
01Ju
l06
01A
ug06
01S
ep06
01O
ct06
01N
ov06
01D
ec06
Month
Req
ues
t to
Fu
lfill
men
t T
ime
(Day
s)
Red Amber - 100 Green - 115
Green - 130 Data Values (X) Xbar
UCLx
Progress toward 90% of all requests completed in 5 days or less

Improvement Strategies (Tactics?)
Zero Touch
Process improvement
– Approvals
– Flow
Drive toward “Standard” services vs “Custom” service offerings

Zero Touch
The ‘Holy Grail’ of processes
Client fills online form
Fully automated fulfillment
– No approval
– No persons involved in fulfillment
Instant results
Examples: • Account/access to applications/systems (db insert via web service) • Admin changes: Change name on phone system (XML transaction)
Process Improvements
Remove Approvals: Approvals stop the process and introduce unpredictable variation
– If few denials, convert to an ‘FYI’ notice instead
Give instruction on how to intervene & cancel for those rare cases where needed
– Pre-approve as many standard options as possible
Remove rework
– Collect all info up front
– Straight-through flow, No loop-back
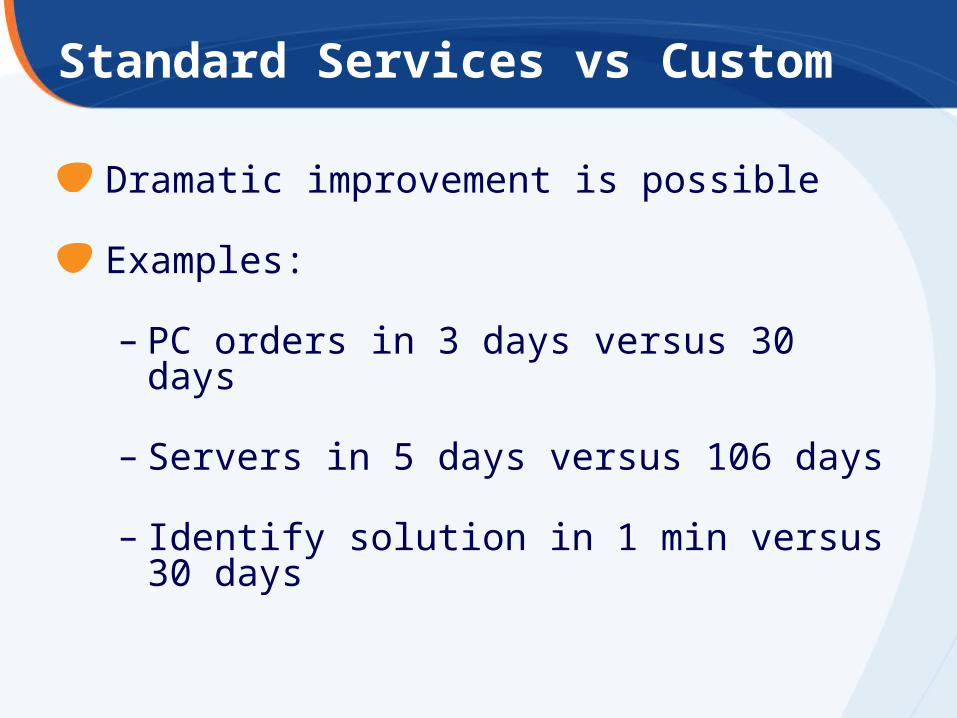
Standard Services vs Custom
Dramatic improvement is possible
Examples:
– PC orders in 3 days versus 30 days
– Servers in 5 days versus 106 days
– Identify solution in 1 min versus 30 days
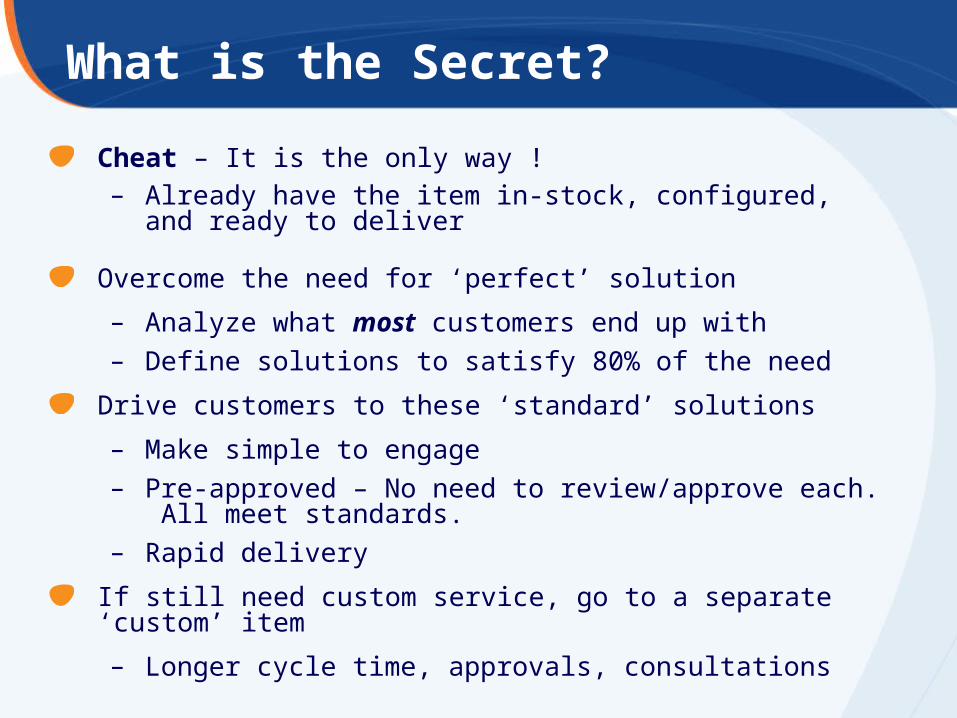
What is the Secret?
Cheat – It is the only way ! – Already have the item in-stock, configured, and ready to deliver
Overcome the need for ‘perfect’ solution
– Analyze what most customers end up with
– Define solutions to satisfy 80% of the need
Drive customers to these ‘standard’ solutions
– Make simple to engage
– Pre-approved – No need to review/approve each. All meet standards.
– Rapid delivery
If still need custom service, go to a separate ‘custom’ item
– Longer cycle time, approvals, consultations
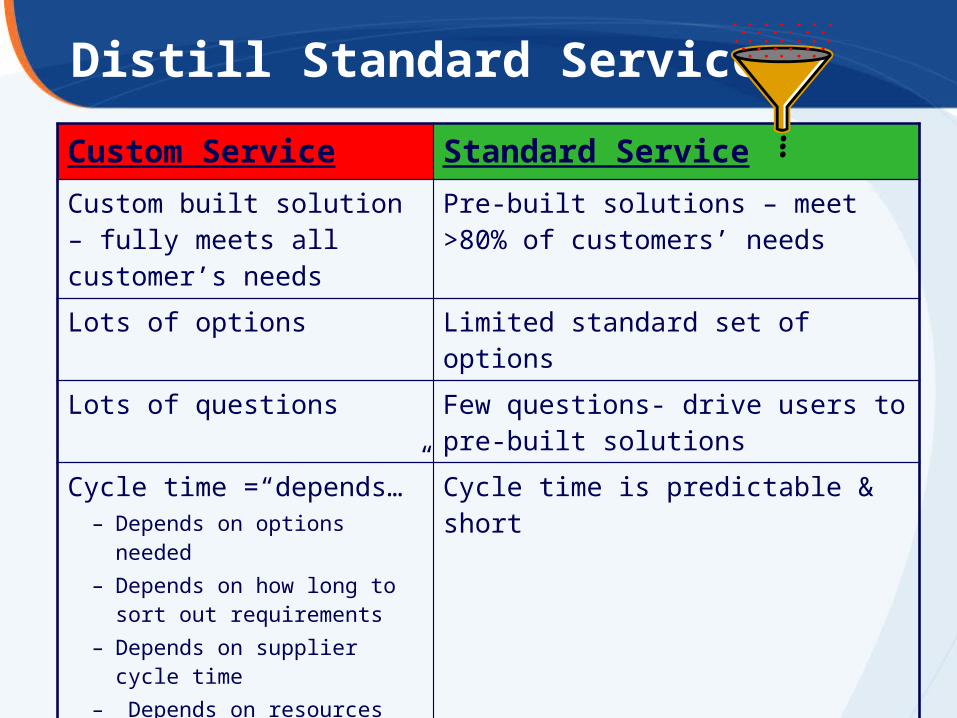
Distill Standard Services
Custom Service Standard Service
Custom built solution – fully meets all customer’s needs
Pre-built solutions – meet >80% of customers’ needs
Lots of options Limited standard set of options
Lots of questions Few questions- drive users to pre-built solutions
Cycle time =“depends…” – Depends on options needed– Depends on how long to sort out
requirements– Depends on supplier cycle time– Depends on resources needed
Cycle time is longer
Cycle time is predictable & short
Approval flow often required and rules may vary, depending on …
Pre-Approved – Standard Solutions approved by all stakeholders in advance

Summary of benefits derived from the Service Catalog
Simplified access to key IT Services
Identified Portfolio of IT Services
Consolidated or eliminated duplicate or unneeded services
Standardized metrics by across services, allowed apples to apples analysis of performance – reduced tampering
Enabled Service owners to take action to improve Service performance
Improved customer communications, better setting and management of expectations
Turned up the volume to the Voice of the Customer. Developed a standard process for collecting and measuring feedback
Over $200k hard benefit in service consolidation and system elimination Over 75% improvement in cycle time for IT Services

Questions

Thank you for attending this session.
Please fill out an evaluation form.