It’s a Good Time for Investing in Growth...In March 2014, Nitta Gelatin exhibited the Wellnex™...
60
ANNUAL REPORT 2014 For the year ended March 31, 2014 It’s a Good Time for Investing in Growth
Transcript of It’s a Good Time for Investing in Growth...In March 2014, Nitta Gelatin exhibited the Wellnex™...

AnnuAl RepoRt 2014 For the year ended March 31, 2014
It’s a Good Time for Investing in Growth

OUR COMPASS STRATEGY 1
PERFORMANCE HIGHLIGHTS 2
NITTA GELATIN WORKS 3
4 Feature
Message From a Newly Appointed Director 4
Message From a Newly Appointed
Executive Officer 6
Message From the General Manager of the
Sales & Marketing Division 8
Message From the President 10
Business Activities/Overview of Operation 14
Nitta Gelatin Group History 16
Board of Directors, Executive Officers and
Audit & Supervisory Board Members 18
Investor Information 20
Corporate Information 21
22 Financial SectionManagement’s Discussion and Analysis 22
Business Risks 25
Consolidated Balance Sheets 28
Consolidated Statements of Income 30
Consolidated Statements of Comprehensive Income 31
Consolidated Statements of Changes in Net Assets 32
Consolidated Statements of Cash Flows 34
Notes to Consolidated Financial Statements 36
The earnings forecasts in this Annual Report are forward-looking statementsThe earnings forecasts in this Annual Report are forward-looking
statements made on the basis of information available at the
time they were made and other certain assumptions deemed
reasonable. Therefore, actual earnings may differ from forecast
figures as a result of changes in business performance and
other factors.
Contents

0
15
30
45
3
6
9
0
28.7
1.5
32.8
0.9
36.5
1.8
41.0
4.2
16/315/314/313/3
9.6
19.0
13.1
19.6
15.8
20.7
18.4
22.5
0
15
30
45
28.7
32.836.5
41.0
16/315/314/313/3
10.0
18.6
10.3
22.4
10.5
26.0
11.9
29.0
0
15
30
45
28.7
32.836.5
41.0
16/315/314/313/3
1.11.5*
1.7
0.90.9*
1.4
0.91.8*
2.2
1.94.2*
3.7
0
2
4
6
16/315/314/313/3
Given the upcoming 100th anniversary of its founding in 2018, Nitta Gelatin decided to formulate a
new long-term management vision, 100th Year Vision, and a medium-term management plan based
on it covering the 3-year period from the year ending March 2014 to the year ending March 2016.
The slogan for Nitta Gelatin’s 100th Year Vision is to “Amaze the World!” Under this slogan, the
Company’s basic strategy is to “Win out!! in growing Asian market.” The Company will supply
products and services that are one step ahead of customer expectations, develop new products and
cultivate new markets in order to expand earnings. By doing so, we aim to increase our corporate
value and continue contributing to society for many more years to come. This medium-term manage-
ment plan sets ¥41 billion in net sales and ¥4.2 billion in operating income as consolidated targets
for the year ending March 2016, the plan’s final year.
ouR CompAss stRAtegy
Target
Target Target
Target
Net Sales and Operating Income Results and Targets(Billions of yen)
Domestic and Overseas Sales Results and Targets(Billions of yen)
■ ■ Net Sales (left axis) Operating Income (right axis)
■ ■ Overseas Sales■ ■ Domestic Sales
Sales by Segment Results and Targets(Billions of yen)
Segment Profit Results and Targets(Billions of yen)
■ ■ Formula Solution Business■ ■ Collagen Material Business
■ ■ Formula Solution Business■ ■ Collagen Material Business
* Consolidated operating income after adjustment for segment profit
1
Nitta GelatiNaNNual report 2014

Millions of yenThousands of U.S. dollars
73rd term From April 1,
2011 to March 31, 2012
74th term From April 1,
2012 to March 31, 2013
75th term From April 1,
2013 to March 31, 2014
75th term From April 1,
2013 to March 31, 2014
For the year:
Net sales ¥27,763 ¥28,772 ¥32,814 $318,954
Operating income 2,015 1,595 955 9,282
Net income 1,375 1,525 665 6,463
Comprehensive income 986 1,913 1,227 11,926
Research and development expenses 895 1,026 1,004 9,758
Capital expenditure 769 1,426 3,102 30,151
Depreciation and amortization 841 825 914 8,884
Net cash provided by operating activities 568 2,050 (692) (6,726)
Net cash used in investing activities (733) (1,557) (3,105) (30,180)
Net cash provided by (used in)
financing activities 713 (376) 3,875 37,665
Cash and cash equivalents
at end of period 2,078 2,258 2,406 23,386
At year-end:
Property, plant and equipment ¥ 5,387 ¥ 6,287 ¥ 8,804 $ 85,575
Net assets 8,108 9,724 13,781 133,952
Noncurrent liabilities 6,087 5,828 7,528 73,172
Total assets 23,371 25,190 31,389 305,103
Per share information (yen, U.S. dollar):
Net assets per share (BPS) ¥509.41 ¥607.31 ¥742.20 $ 7.21
Net income per share (EPS) 99.87 96.72 37.90 0.36
Other:
Equity ratio (%) 34.4 38.0 43.4
Return on equity [ROE] (%) 19.4 17.3 5.7
Return on assets [ROA] (%) 5.9 6.1 2.1
Payout ratio (%) 10.0 14.5 31.7
Note 1: The U.S. dollar amounts are translated from Japanese yen at the rate of ¥102.88 = U.S. $1, the prevailing exchange rate at March 31, 2014.
Note 2: Net income per share for the year ended March 31, 2012 was calculated based on net income after deducting the difference between the
redemption amount and the issued amount of preferred stock.
Note 3: Effective April 1, 2011, the Group has applied the “Accounting Standard for Earnings Per Share” (ASBJ Statement No. 2, issued on June 30,
2010), the “Guidance on Accounting Standard for Earnings Per Share” (ASBJ Guidance No. 4, issued on June 30, 2010) and the “Practical
Solution on Accounting for Earnings Per Share” (Practical Issue Task Force No. 9, issued on June 30, 2010).
Note 4: Certain overseas affiliate companies started applying IAS 19 Employee Benefits from the year ended March 31, 2014. This change in
accounting policy was also applied retroactively to restate results for the fiscal year ended March 31, 2013.
The cumulative impact on the fiscal year ended March 31, 2012 was reflected in adjustments made to the opening balance of net assets
for the fiscal year ended March 31, 2013.
peRfoRmAnCe HigHligHts
2
Nitta GelatiN aNNual report 2014

Amaze the World!
Acquisition of FSSC 22000In March 2014, Nitta Gelatin’s Osaka
Plant acquired the FSSC 22000 Food
Safety Management System certifica-
tion. With this certification, food safety
and reliability at the Osaka Plant will be
verified by a third-party institution.
Having also acquired this certification
at four plants in the U.S., Canada,
China and India, Nitta Gelatin has
enhanced its competitiveness in the
global market.
Collagenaid® Receives the Monde Selection’s Grand Gold Quality Award for the Third Straight YearIn April 2014, Collagenaid® received
the Monde Selection’s Grand Gold
Quality Award in the Diet & Health
Products category for the third
straight year.
Participation in 18th Food Ingredients China ExhibitionIn March 2014, Nitta Gelatin exhibited the Wellnex™ collagen peptide brand at the
18th Food Ingredients China Exhibition held in Shanghai, China. In conjunction with
this event, Nitta Gelatin also hosted a seminar on the functional properties of col-
lagen peptide by Kenji Sato, currently a professor at Kyoto University.
Participation in the 43rd INTERNEPCON JAPAN ExhibitionNitta Gelatin exhibited its G-zain™ sealant material at the 43rd INTERNEPCON
JAPAN exhibition held in January 2014. We displayed an ultraviolet curing gasket
system that can be used as a sealant in smartphones and tablet PCs for water-
proofing and dust-proofing purposes.
Healthy Long Life and Anti-Aging SeminarIn March 2014, Nitta Gelatin held a Healthy Long Life and Anti-Aging seminar at the
Tennoji Miyako Hotel in Osaka to inform general consumers about the health ben-
efits of collagen peptide. Professor Yoshikazu Yonei of the Doshisha University
Graduate School of Life and Medical Sciences gave a lecture on ways of leading
youthful lives well into old age. The TV personality Yoko Haruka also shared some
of her secrets on being yourself and leading an enjoyable, vibrant life.
Completion of New Collagen Peptide PlantIn May 2014, Nitta Gelatin completed a new collagen peptide plant at Nitta Gelatin
USA, Inc. With this move, Nitta Gelatin has put in place a production system con-
sisting of four bases in Japan, China, India and the U.S., paving the way for acceler-
ated global business expansion.
nittA gelAtin WoRks
3
Nitta GelatiNaNNual report 2014

Raymond MerzDirector and Executive OfficerGeneral Manager, Gelatin Division
1995 Joined Nitta Gelatin Canada, Inc.
2005 Executive Officer of the Company (to present)
2006 CEO of Nitta Gelatin Canada, Inc., CEO of Nitta Gelatin USA, Inc.
2014 General Manager, Gelatin Division of the Company (to present)
Director of the Company (to present)
It’s a Good Time—OUR MARKETWhen I joined Nitta Gelatin 19 years ago, the vast
majority of production and sales were in Japan.
Today, things are much different. In the fiscal year
ended March 31, 2014, our overall sales ratio out-
side of Japan was 40% and two-thirds of our prop-
erty, plant and equipment were based outside the
country. By the fiscal year ending March 2016, the
final year of our current medium-term management
plan, most of our production and sales will be over-
seas. Nitta Gelatin’s primary markets are indeed
outside of Japan.
The World Bank is projecting continuous growth in
Asia, with East Asia projected to grow by 7.1%, China
by 7.6% and the rest of Asia by 5.1%. Given the
strong correlation between GDP growth and the con-
sumption of meat, Asia is gathering a lot of attention
in the gelatin industry as the region continues to
undergo sustained economic growth. Nitta Gelatin
has a geographical advantage because it is based in
Japan, and in the heart of Asia. Since gelatin is
derived from many different sources such as pigs,
cattle, and fish, it allows us to serve many and
varied customer needs, while mitigating the risks in
our business. These factors will also work in our
favor as we develop new markets in Asia.
The global gelatin market is growing at an annual
rate of around 1–2%. The raw materials for gelatin
are bone and skin which are by-products of the meat
industry which means that gelatin manufacturers
cannot influence the quantity of raw materials they
messAge fRom A neWly Appointed diReCtoR
need. In developed countries, the production of
meat is stable or may even be declining, so develop-
ing new sources of raw materials is now a key chal-
lenge for us.
Pig Skin Gelatin: Growth Accompanied by Supply-Demand ImbalancesPig skin, a perishable raw material for gelatin, is
purchased and delivered refrigerated which neces-
sitates our plants being close to the source of pro-
curement. Pig skins are also used for snack foods in
North America and are also exported. This means
that we need to compete with not only other gelatin
manufacturers but also other industries in order to
procure pig skin. If viruses or natural disasters such
as droughts come into play, the number of hogs can
decrease sharply. In fact, a virus is currently respon-
sible for a significant decline in the number of pigs in
North America. Since demand for gelatin continues
to grow, the imbalance in supply and demand has led
directly to the recent surge in raw material prices.
The gelatin market is generally considered a
steadily growing market. In reality, however, as has
been mentioned earlier, market growth is accompa-
nied by imbalances in supply and demand. In North
America, negotiations for pig skin raw materials are
conducted every three months. The resulting changes
in raw material costs form the basis for our price
negotiations with our own North American customers.
In Japan, it is difficult to pass on any changes in raw
material prices to customers. However as with our
Nitta GelatiN aNNual report 2014
4

Asia-Pacific
1.57 billion 0.97 billion23%
62%
Muslims
Other regions
Other regions
World population
6.8 billion
Muslim population
1.57 billion
Source: Pew Research Religion & Public Life Project, Mapping the Global Muslim Population, 2009
Muslim Population Data
(Thousands of US dollars) (Gram per person)
Per Capita GDP and Gelatin Consumption in the Japanese Market
Source: IMF-World Economic Outlook Estimated based on reports prepared by the Gelatin Manufacturers
Association of Japan
overseas customers, we will work to encourage our
client companies in Japan to accept price revisions
that are linked to raw material contracts.
In Nitta Gelatin’s case, the pig skin gelatin busi-
ness in Japan relies mostly on imports from our
North American plants. With a weaker yen, high raw
material prices and delays in price increases, we are
seeing a lot of pressure on margins in the pig skin
gelatin business in Japan. In fact it has started to
become more profitable in some instances to sell pig
skin gelatin in the North American market than to
export it to Japan.
Nitta Gelatin’s investments outside of Japan are
concentrated in North America. At first glance, it
might seem as if these investments in North America
are unrelated to our drive to increase our market
share in Asian markets. However, one-third of the pig
skin gelatin produced in our North American plants is
exported to Japan, with exports to Asia to be added
in the future. Currently, North America is the only
place where Nitta Gelatin makes pig skin gelatin. And
therefore, investments there are crucial in ensuring
we retain a competitive edge in supporting our strat-
egy in Asia and also to ensure we continue to supply
high-quality products around the world.
The quality of porcine collagen peptide produced
in our new North Carolina plant is unequaled. Up
until now, we have used a third party to produce
collagen peptide. Producing this product in our own
facility allows for a more efficient process and a
significant increase in quality, both of which enhance
our competitiveness, which paves the way and allows
us to develop collagen peptide into a strategic prod-
uct for the Japanese and the Asian markets.
The Potential of Bovine Bone Gelatin in Asian MarketsIn addition to pig skin, bovine bones are also used
as raw materials for gelatin. We have and continue to
focus on Asia as a source for procuring bovine
bones. We entered the Indian market for bone many
years ago and continue to be active there—it now
has the world’s largest cattle population. As with pig
skin, manufacturers of bovine bone gelatin are not
the only players we must compete with for the raw
material. Our main competitors are businesses that
blend meat-and-bone meal into poultry and animal
feeds. Entering into business and equity-based alli-
ances with suppliers is an effective means to ensure
a stable procurement of bovine bones for our gelatin
operations. Nitta Gelatin India Ltd. was set up as
part of such an alliance. Looking ahead, bovine bone
gelatin is bound to become more popular in Asia as
an edible gelatin, as it already has done in Japan.
Indeed, people living in Islamic countries in Asia
have begun to embrace bovine bone gelatin as a
new Halal certified food ingredient.
Nitta Gelatin is well positioned to meet the
growing demands for high quality porcine and bovine
gelatins in the Asian market and we will strive to do
everything possible to ensure our customer expecta-
tions are fully met.
0
50
40
30
20
10
0
150
120
90
60
30
1970 1980 1990 2000 2010 (Year)
Per capita GDP (left scale) Per capita gelatin consumption (right scale)
Nitta GelatiNaNNual report 2014
5

Juergen GallertExecutive Officer
1991 Joined Nitta Gelatin NA Inc.
2006 CEO of Nitta Gelatin NA Inc. (to present)
2014 CEO of Nitta Gelatin Canada, Inc. (to present)
CEO of Nitta Gelatin USA, Inc. (to present)
Executive Officer of the Company (to present)
It’s a Good Time—OUR STRENGTHIn essence, Nitta Gelatin’s core strength lies in its
ability to convert challenges into opportunities. This
strength is borne out by the Company’s long history
of nearly 100 years. In recent years, the emergence
of the digital camera caused the market for bovine
bone gelatin for photographic use to contract sharply.
This type of gelatin was previously a major source of
the Company’s sales and earnings. To develop alter-
native markets, Nitta Gelatin focused on promoting
wider use of bovine bone gelatin in the food and
pharmaceutical sectors. However, BSE became a
major public health concern just as the Company was
pursuing these efforts. The BSE issue hurt the repu-
tation of bovine bone gelatin, leading to a major
crisis: operations at Nitta Gelatin’s Osaka Plant were
suspended for around 100 days in just one year. To
survive in the market, we fundamentally overhauled
our strategy for procuring raw materials. We diversi-
fied our raw materials to include pig skin, fish scales
and other sources, shifting away from gelatin manu-
facturing centered on bovine bones. In the process,
we made business investments in North America to
ensure an adequate supply of pig skin gelatin. These
investments served as a catalyst for significant
growth in our overseas business.
Nitta Gelatin’s mainstay bovine bone gelatin has
the property of being almost completely odorless. We
messAge fRom A neWly Appointed exeCutive offiCeR
determined that this virtually odorless gelatin would
be well suited to the Japanese palate, so we inten-
sively developed new food product applications for
bovine bone gelatin. We also worked to popularize
bovine bone gelatin in Islamic countries in Asia,
where products derived from bovine raw materials are
easier to be accepted. In practice, these options were
our only avenues of growth. Today, edible gelatin and
capsule-use gelatin have become Nitta Gelatin’s core
products. We have also established a solid position in
the market as a Halal-certified gelatin manufacturer.
In these and other ways, we have converted the
challenges we faced unexpectedly and in rapid suc-
cession into prime opportunities to reinvent and repo-
sition Nitta Gelatin for our next century in business.
Well Positioned for Leadership in AsiaThe world’s top three gelatin firms are from Europe,
where gelatin was invented. The three European
gelatin majors moved quickly to acquire local North
American gelatin companies to increase their produc-
tion output. They also entered the Chinese market at
an early stage. Nitta Gelatin’s strength lies in its
dominant share of the Japanese market for gelatin.
And by capturing a greater share of the Asian market,
Nitta Gelatin is well positioned to aim for leadership
in Asia.
Nitta GelatiN aNNual report 2014
6

Beijing Nitta Collagen Casing Co., Ltd.
Nitta Gelatin India Ltd.
Nitta Gelatin Vietnam Co., Ltd.
Nitta Gelatin Canada, Inc.
Nitta Gelatin NA Inc.
Nitta Gelatin Inc.Hikone Gelatin Inc.Alma CorporationNitta Biolab Inc.Bostik-Nitta Co., Ltd.
Guangdong Baiwei Bio Material Co., Ltd.
Shanghai Nitta Gelatin Co., Ltd.
Nitta Casings (Canada) Inc.
Nitta Casings Inc.
Nitta Gelatin USA, Inc.
Overseas Sites: 13Employees: 288 in Japan
(45%)
347 Overseas
(55%)
(As of March 31, 2014)
Nitta Gelatin’s Global Network
Nitta Gelatin entered the North American and
Indian markets more than 30 years ago, and has
production, sales and R&D bases in each market.
The Company has built strong relationships with
customers through sales channels leveraging its
local operating bases. Considering that Asia is home
to many different countries, we have taken our first
step to enter the region in Vietnam. Here, we estab-
lished Nitta Gelatin Vietnam Co., Ltd. as a foothold
for future business expansion in the region.
The Asian market has significant growth potential,
but it is also a very competitive market and there are
many companies who want to enter this market.
Therefore, we must be truly cost competitive to suc-
ceed. Nitta Gelatin is strong in terms of quality, but
capsule-use gelatin is still the only market where we
stand to generate a premium that would justify our
quality. The food market is fiercely competitive. In
this market too, Nitta Gelatin is confident of prevail-
ing against the competition, as we are starting to
see trends from Japan make inroads into Asian coun-
tries. The popularity of Japanese convenience stores
in Asia is a case in point. Going forward, we will also
strive to export trends from Japan to the North Amer-
ican market in order to expand our business.
Prospects for Sustainable Growth Make Nitta Gelatin AttractiveUnder the current medium-term management plan,
Nitta Gelatin aims to grow consolidated net sales by
around 1.5-fold and to roughly double operating
income, compared with the fiscal year ended March
2012. These figures alone may suggest that we are
a fast-growing company, but that would not be the
whole story. More precisely, Nitta Gelatin is a com-
pany that is well positioned to achieve steady, sus-
tainable growth by capturing demand from the rapidly
growing Asian market.
Nitta Gelatin has found a unique niche within the
gelatin industry. In addition to its mainstay gelatin
business, Nitta Gelatin conducts a collagen peptide
business and a collagen casing business, along with
an adhesives business and a food ingredient busi-
ness. Looking at the group as a whole, we have busi-
nesses that are complement each other, and this
business portfolio helps us to manage risks. As I
have discussed so far, Nitta Gelatin is a comprehen-
sive enterprise centered on gelatin that can convert
challenges into opportunities and seize on global
opportunities for growth.
Nitta GelatiNaNNual report 2014
7

Koichi OgataDirector and Executive OfficerGeneral Manager, Sales & Marketing Division
2005 Joined the Company
2010 Executive Officer of the Company (to present)
2012 Director of the Company (to present)
2013 General Manager, Sales & Marketing Division of the Company
It’s a Good Time—OUR STRATEGYIn the fiscal year ended March 31, 2014, the first
year of our current medium-term management plan,
we targeted consolidated net sales of ¥32.7 billion
and consolidated operating income of ¥1.7 billion.
Net sales were ¥32.8 billion, largely in line with
plan. This result reflected the growth from price
revisions and higher sales volume overseas along
with a boost from foreign exchange effects. On the
other hand, operating income was substantially
below the plan at ¥0.9 billion. This was due to sev-
eral negative factors, including a rise in purchasing
costs in Japan due to the yen’s depreciation, delays
in price increases and the quality issues of casings.
We thus got off to a bumpy start in our current
plan’s initial year.
On the strategy front, capital investments sup-
porting the global expansion of collagen peptide
business and reinforcement of global competitive-
ness and supply capacities in the gelatin business
generally progressed as initially planned. In May
2014, we built a new collagen peptide plant on the
premises of our pig skin gelatin production facility
in North America. With this, we aim to leverage
messAge fRom tHe geneRAl mAnAgeR of tHe sAles & mARketing division
global quality excellence to grow sales in Japanese
and Asian collagen peptide markets where demand
is robust.
Regarding casing, we upgraded the North Ameri-
can plant’s manufacturing equipment to raise its
production capacity. We had expected this to con-
tribute to the earnings in the fiscal year ended
March 31, 2014, but we encountered quality issues
in the early days of operations. Plans are now on
track with stable production and quality, and we
anticipate a contribution in the fiscal year ending
March 31, 2015.
In the summer of 2014, we started operations of
Nitta Gelatin Vietnam Co., Ltd. in order to manufac-
ture and sell gelling agents and other food agents in
Southeast Asia. We also implemented the introduc-
tion of adhesive manufacturing facilities and estab-
lishment of a sealants application center proceeded
on schedule.
In the fiscal year ended March 31, 2014, we
executed capital investments of ¥3.1 billion against
the planned capital investments of ¥3.4 billion.
Capital investments were up sharply from the previ-
ous fiscal year’s ¥1.5 billion.
Nitta GelatiN aNNual report 2014
8

China
VietnamU.S.
Japan Canada
Nitta Gelatin’s Global Business Expansion
India
Business Main Products
Gelatin Gelatin
Peptide Collagen peptide
Casing Collagen casing
Life Science Collagen, gelatin
Food MaterialEdible gelling agents, stabilizers and consumer products
AdhesiveSealant materials, hot-melt adhesives
Winning in Asia, a Growth MarketConsidering that Asia encompasses numerous coun-
tries, a “one size fits all” policy is not enough to take
on the market. This is where we have an edge over
the competition. Looking at Japanese products using
gelatin in Japan, for example, there are variety of
taste, color and texture of gummy candy in Japan,
and they are ever changing. Product lifecycles are
short and are continuously changing, so we must
keep developing new formulations and new products
for our customers. Our ability to meet individual
needs will work to our advantage in the Asia market.
There is a mix of cultures, politics, and religions in
Asia, so being in tune with those respective markets’
needs will be key. Thanks to our experience tailoring
products to the market in Japan, we can respond in a
proper way.
Also in Asia, openings continue for convenience
stores, which have become a fixture in Japan. We
can supply gelatin matching the local preferences
for development of ready-to-eat delicatessen items
and meals which are the key commodities of conve-
nience store.
messAge fRom tHe geneRAl mAnAgeR of tHe sAles & mARketing division
Strategic Fields: Food and CapsulesOur core markets are food and capsules. For cap-
sules, we have adopted a consistent operation
system for manufacturing sites no matter where they
are located in the world. This ensures consistent
quality and traceability.
Our main customers—companies in Europe, the
United States, and Japan—emphasize traceability.
Even in developing nations in Asia and China,
increasing market sophistication is generating
demand from people to know where their food came
from. Our strength is that we can trace back the
origin of all raw materials used in our gelatin. To
garner acceptance from the numerous people living
in Islamic countries in Asia, we manufacture Halal
certified gelatin in Japan and India. This is also
backed by the reliability of our traceability.
Our regional focus will be on Asia, with food and
capsules as our priority fields. We will also work to
develop gelatin and collagen for medical care, with an
eye to expanding business and enhancing added
value. With gelatin as our core competence, we aim to
be the leader in Asia and a globally unique enterprise.
Nitta GelatiNaNNual report 2014
9

To lead Asia and be globally unique, we will bolster
global management, develop global brands, and
create new business to enhance corporate value.
Norimichi SogaRepresentative Director and President
messAge fRom tHe pResident
Nitta GelatiN aNNual report 2014
1010

2,015
41,000
4,200
1,800
32,814
955
1,595
(Millions of yen) (Millions of yen)
Performance
Overseas Sales Ratio
Fiscal year ended March
2014
Actual
Fiscal year ending March
2016
Plan55%40% 45%
Key Performance Indicators for Overseas Growth Strategy
Japan
60%
Japan Overseas Overseas
“Amaze the World!”— Heading for Sustainable
Medium-Term Growth—We seek to strengthen global management, develop
global brands, and create new business in order to
enhance our corporate value. To that end, we formu-
lated a medium-term management plan ending March
31, 2016. Marking the plan’s start, the fiscal year
ended March 31, 2014 was an important year. We
achieved record-high consolidated net sales. Never-
theless, income declined as a result of higher import
purchase prices in Japan due to the yen’s sharp
depreciation, and lower profitability as globally soar-
ing raw material costs were not sufficiently passed on
to product prices. From the fiscal year ending March
31, 2015, we will return to a growth trajectory by
improving profitability in Japan and continuing to grow
business overseas, and advance to become the
leader in Asia and a globally unique enterprise.
Our Growth StoryThe gelatin industry is often said to be maturing, but
we beg to differ. We have lots of growth potential
left from an overseas perspective. In fact, our growth
over the past two decades has been driven by our
North American business. The region’s contribution
to sales and profit has been especially large over
the past five years. We have built an extremely
robust customer base through many years of busi-
ness development, and our operations are growing
as our client companies grow. The United States
market’s vast scale compared with Japan means
that a seemingly small percentage of growth is quite
large in terms of volumes and earnings. North Amer-
ican operations will remain a growth area for us.
The Asian market’s dynamism will also be added
to the mix moving ahead. Gelatin consumption has
shown correlation with GDP per capita in Japan, and
we believe the same phenomenon will arise through-
out Asia in the future. While the westernization of
diets has been instrumental to increased gelatin
consumption in Japan, a shift towards Japanese food
is boosting gelatin consumption in Asia. Japan’s
convenience stores have entered markets across
Asia. They offer many products that are essentially
the same as those in Japan, and Japanese food’s
great taste has made it very popular. Also, prepared
food sold at the convenience stores uses gelatin as
in Japan. While frozen food is the major player in
places like Europe and the United States, chilled
food (delicatessen items) is primary in Japan. This
backdrop translates to business opportunities for us
with our track record in Japan. If Japan’s conve-
nience stores increase in Asia, the need for gelatin
will be that much greater.
0
7,500
6,250
5,000
3,750
2,500
1,250
Net Sales (left scale) Operating Income (right scale)
12/3 13/3 14/3 15/3Plan
16/3Plan
0
22,500
15,000
7,500
30,000
37,500
45,000
27,763 28,772
36,500
Nitta GelatiNaNNual report 2014
11

Business Opportunities
in Asia
Growing Markets Nitta Gelatin Products
IndiaGlobal Pharmaceutical Manufacturing Sites
Capsules Gelatin
China
Westernization of DietsProcessed Food (Sausage)
Collagen Casing
Strong Consumer Interest in Health and Beauty
Health Food Collagen Peptide
VietnamPopularization of Refrigerators
Western Confectionery
Gelatin, Food Materials
Ability to Adapt to Business Climate ChangeWe have faced sales and income declines numer-
ous times due to damage from misinformation
including about BSE and changes in applications for
mainstay products. We have overcome many hur-
dles to adapt to such business climate change. We
believe this is a result of our devotion to providing
revolutionary products and services that are a step
ahead of customers’ expectations not only in Japan
but worldwide.
In addition to an advance in global demand for gelatin,
raw material prices are also climbing internationally,
with procurement competition from other applications
such as snacks for pig skin, and feed like meat-and-
bone meal for beef bones. Moreover, headway is not
being made passing on this rise in raw material
costs to product prices in Japan. In this tough busi-
ness environment, we are advancing global manage-
ment. Specifically, this means to produce locally at
an appropriate cost and sell products at prices that
allow for adequate profit. We believe we will need
experts on overseas markets to pursue global man-
agement. Against this backdrop, we are promoting
human resource diversity.
Raymond Merz and Juergen Gallert, introduced
on the previous page, have both been appointed as
Executive Officers at Nitta Gelatin. Mr. Merz has
engaged in gelatin manufacturing operations over-
seas during his 19 years at the Company. Mr. Gallert
has worked on gelatin sales overseas during his 23
years with the Company. We see our corporate cul-
ture embracing such diversity in human resources as
an achievement made possible by our adaptation to
changes in the business environment to date. We
look for both Mr. Merz and Mr. Gallert to leverage
their extensive gelatin business experience overseas
gained over many years at the Company and insight
into market trends to create innovative products and
grow sales of those products globally.
Transformation to a High Added-Value CompanyWe will drive forward with our current business strat-
egy and become a world-class, high value-added
enterprise upon the 100th anniversary of our estab-
lishment in 2018. This will include creating new
high-performance products and global brand devel-
opment to popularize such products not only in
Japan but also in markets abroad. We are currently
advancing the global brands Wellnex®, G-zain™, and
beMatrix®.
Nitta GelatiN aNNual report 2014
12

Wellnex® is a highly functional collagen peptide that
helps to regulate body processes—the so-called third
function of food. Our independent research on col-
lagen peptide’s functional properties has shown it
helps keep skin, bones, joints, and muscles healthy.
Collagen peptide’s beauty benefits are widely recog-
nized in Japan, but are not that well known overseas.
This is especially true in the United States where
nutritional supplements abound, but the collagen
peptide market has yet to come to the fore, with its
use nearly nonexistent in the beauty and health cat-
egory. We will communicate collagen peptide’s high-
performance benefits and effects based on scientific
evidence, looking to have consumers experience
those benefits first-hand.
G-zain™ is a sealant enabling full automation of
waterproof gasket assembly in devices such as
smartphones, digital cameras, and smart meters.
This UV curable sealant fundamentally changes cus-
tomers’ manufacturing process. It will therefore take
time to catch on with customers, but we are confi-
dent that G-zain™ will gradually gain ground and
eventually be used widely for smartphones.
beMatrix® is a line of gelatin and collagen for medical
care. Its high degree of safety enabling use in the
human body was realized with our patented technol-
ogy. The material is indispensable in regenerative
medicine, a field that is expected to grow, and in
developing practical applications for medical devices.
Further, research and development towards practical
applications for iPS cells and so on in regenerative
medicine is advancing worldwide. In addition to artifi-
cial bone and artificial skin materials that have
already been commercialized, we will work to com-
mercialize medical-use gelatin and collagen ensuring
the high level of safety required in medicine and to
step up global development.
In closingGlobal gelatin market growth continues at an annual
rate of 1–2%. The key to steadily producing gelatin
on an industrial scale is to procure large amounts of
raw materials of a consistent quality. That is why it is
imperative for us to ensure the stable procurement
of raw materials.
Under these conditions in the gelatin business, we
aim to employ our global orientation, active capital
investments and M&As, comprehensive abilities from
material supply to application development, and col-
lagen peptides from Japan with global potential to
generate consolidated net sales of ¥41 billion and
operating income of ¥4.2 billion in the fiscal year
ending March 31, 2016 and “Amaze the World!” We
ask shareholders for their continued support as we
forge ahead.
Norimichi SogaRepresentative Director and President
Nitta Gelatin Inc.
Nitta GelatiNaNNual report 2014
13

Collagen Material BusinessIn the Collagen Material business, we manufacture and sell high value-added gelatin, collagen peptide,
collagen casing, collagen and other products made from byproducts of the meat industry, such as animal
bones and skin. In the process, we aim to propose products and applications demanded by customers
and solve the issues they face.
■ Gelatin BusinessBesides its ability to solidify, gelatin has a variety of functions such as water retention, foaming, adhesive and emulsifying prop-erties. For this reason, gelatin has a range of applications, from food to pharmaceuticals and photography. In the gelatin business, we sell gelatin for applications in such industrial sectors.
Edible gelatin is marketed as a food material primarily to the bakery and confectionery and dairy product sectors, as well as to the beverage manufacturing industry. In other areas, edible gelatin is marketed to the delicatessen item and frozen food manufacturing industries to maintain the quality of convenience store delicatessen items and frozen foods and to improve food texture. The main applications for pharmaceutical gelatin are hard and soft capsules. Pharmaceutical gelatin is marketed not only to the pharmaceutical manufacturing sector, but also to the nutritional supplement, health food and other food product manufacturing industries. Photographic gelatin is marketed to the photosensitive material production industry, as a binding agent for photosensitive materials, such as photographic film and paper.
■ Peptide BusinessIn the peptide business, we manufacture and sell collagen pep-tide, a lower molecular form of gelatin that has been processed through the hydrolysis of gelatin using proteolytic enzymes. The defining property of collagen peptide is that it does not solidify into jelly. As a high-quality protein that can be readily ingested, collagen peptide is marketed to the dairy product sector, as well as the beverage manufacturing industry and the bakery and confectionery sector. Furthermore, collagen peptide has been found to have the ability to activate biological functions and regulate bodily functions. As such, collagen peptide is actively used in nutritional supplements, health supplements and other food products that provide health benefits related to the skin, bones and joints.
■ Collagen Casing BusinessIn the collagen casing business, we sell edible collagen cas-ings. Collagen casings are tubular materials that are filled with meat in the sausage production process. Collagen casings are marketed to the livestock food production sector as an alterna-tive to natural casings made from sheep and pig intestines.
■ Life Science BusinessCollagen is extracted and refined from animal skin and tendons using acid solutions and enzymes, while preserving its triple-spiral molecular structure. Collagen has a close affinity with biological tissue. In addition to applications as research reagents for cell cultures, collagen is used as a bio-material in synthetic tissue and bones, which promote self-regeneration and restoration of tissue. We have also developed a highly refined medical gelatin (beMatrix®) as a bio-material to promote the self-regeneration and restoration of human tissue in the field of regenerative tissue engineering. Collagen for all of these applications is manufactured by the Company and is marketed to medical equipment manufacturers, as well as universities and other research institutes.
■ Performance for the Fiscal Year Ended March 31, 2014 and Outlook for the Fiscal Year Ending March 31, 2015
In the gelatin field, sales of edible gelatin and gelatin for cap-sules increased in the Japanese market. Profit margins declined, however, as a result of increased import procurement costs due to the yen’s sharp depreciation, and insufficient progress in passing along higher costs driven by rising raw material prices worldwide. In the North American and Asian markets, sales increased owing to sales volume growth backed by buoyant demand for edible gelatin and gelatin for capsules and price revisions. Earnings also grew steadily in the North American and Asian markets. Collagen peptide sales posted strong growth in Japan and Asia overall, but profitability declined because of the rise in raw material prices. Collagen casing sales were lackluster and a loss was incurred due to quality issues that arose during the first six months of the fiscal year in connection with collagen casing manufactured and sold by a U.S. subsidiary. As a result, net sales in the Collagen Material business increased 20.1% year on year to ¥22,436 million. Segment profit (operating income) was down 20.8% to ¥1,420 million.
In the fiscal year ending March 31, 2015, the Collagen Material business is targeting net sales of ¥26,000 million and segment profit (operating income) of ¥2,270 million.
Gelatin■ For food■ For capsules■ For photographic films and
papers
Collagen Peptide■ For dietary food
supplements■ For protein drinks and
foods■ For cosmetics
Collagen Casing■ Sausage casings
Life Science■ Testing reagent for
laboratory research■ Biomaterial
Business ACtivities/oveRvieW of opeRAtions
Nitta GelatiN aNNual report 2014
14

Formula Solution BusinessIn the Formula Solution business, we manufacture and sell high value-added formulations through formula-
tion technologies for a variety of materials. Our goal is to provide product proposals and applications
demanded by customers as we help them to solve the issues they face.
■ Food Material BusinessIn the food material business, we sell edible formulations, such as gelling agents and stabilizers for meat products, to the food manufacturing industry. Leveraging properties such as their jelly forming ability, water retention, binding, thickening and emul-sion stability, these food agents are used mainly to add value to food and maintain food quality, by contributing to food shape retention and texture enhancement, and so forth. These edible formulations are also used to improve work efficiency and production yield during food processing. Our food agents are custom made according to their purpose of use. Edible gelling agents are marketed mainly to the bakery and confectionery, dairy product, beverage and frozen food manufacturing sectors. Stabilizers for meat products are marketed mainly to the meat product and livestock food manufacturing sectors. We also manufacture and sell consumer products such as collagen beverages and food, and cosmetics, as well as collagen for cosmetics use. These consumer products are planned and developed by the Company, manufactured by partner companies and sold by our subsidiary Nitta Biolab Inc. Collagen for cosmet-ics use is manufactured and sold by the Company.
■ Adhesive BusinessAs with the food material business, the adhesive business proposes adhesives applications that are optimized for client production lines, with the view to developing adhesive functions that fit customer needs and applications. Examples include hot-melt adhesives, which are formulated with multiple materi-als, and animal glue adhesives. Hot-melt adhesives are formu-lated with such materials as petroleum-based synthetic resins and natural resins such as rosin. They are heated and melted before application. Because they provide bonding after cooling and solidifying from a molten state, hot-melt type adhesives feature a fast bonding speed. Accordingly, hot-melt adhesives are used widely not only in packaging applications for sectors
like the food and beverage industry, but also in the sanitary material, bookbinding, construction and woodwork, electrical, housing and other sectors. Moreover, animal glue adhesives are marketed mainly to the paper processing sectors, such as the bookbinding industry, and the paper product and craft sectors, due to their superior adhesive properties with respect to paper. In recent years, we have been marketing a new sealant material based on our adhesives technology that cures with ultraviolet exposure, mainly to the electric machinery and tool manufactur-ing sector.
■ Performance for the Fiscal Year Ended March 31, 2014 and Outlook for the Fiscal Year Ending March 31, 2015
In food materials, performance was sluggish on the whole, with sales increasing only slightly. Profit declined despite efforts to curtail advertising expenses. In adhesives, overall sales increased only slightly due to delays in the adoption of new sealants by customers, despite strong sales of hot-melt adhe-sives due to increased demand pending the consumption tax rate increase. Profit declined as selling, general and administra-tive expenses increased due to stronger efforts to develop new customers. As a result, net sales in the Formula Solution busi-ness increased 2.8% year on year to ¥10,377 million. Segment profit (operating income) declined 20.1% to ¥920 million.
In the fiscal year ending March 31, 2015, the Formula Solution business is targeting net sales of ¥10,500 million and segment profit (operating income) of ¥990 million.
Food Material■ Gelling agents■ Stabilizers for meat
products
■ Stabilizers and quality enhancers for heat-and-serve meals
■ Consumer products for mail-order sales
Adhesive■ Hot-melt adhesives■ Sealant material
(High-performance gaskets)
Nitta GelatiNaNNual report 2014
15

1968Established Hikone Gelatin Inc.
1937Started production of photographic gelatinAfter having relied on imports, research yielded Japan’s first domestically made photographic gelatin1918
Started production of animal glue and industrial gelatin for the first time in Japan with industrial produc-tion methods introduced from the West
Started production of gelatin and animal glue
1982Established Bostik-Nitta Co., Ltd.
1971Started an adhesives businessCommenced an adhesives busi-ness by developing high-speed, hot-melt-type adhesives as a replacement for animal glue
1974Started a food material businessBegan marketing various food products containing natural poly-saccharides and other ingredients, in addition to gelatin
1975Established Nitta Gelatin India Ltd. (India)
1990Established Nitta Gelatin Canada, Inc. (Canada)
1935Completed the Osaka Plant
1918 1970 1980 1990
1930Succeeded in produc-ing thin leaf gelatinSucceeded in produc-ing edible thin leaf gelatin of a high qual-ity, and began market-ing it
1979Established Nitta Gelatin NA Inc. (U.S.)
Amaze the World! Be the Leader in Asia and a Globally Unique Enterprise
Nitta Gelatin Group HistoryNote: The Company name recorded is the current Company name.
16
Nitta GelatiN aNNual report 2014

1996Established Nitta Casings Inc. (U.S.)
2000Started a peptide businessFully entered the collagen peptide business in response to new applica-tions, including as a health food
1996Started a casing businessCommercialized a collagen casing business in North America, after many years of research
1999Began production of gelatin in IndiaStarted production of gelatin in India in response to the demand in Asia
2004Established Nitta Gelatin USA, Inc. (U.S.)
2010Established Guangdong Baiwei Bio Material Co., Ltd. (China)
2013Nitta Gelatin Vietnam Co., Ltd. (Vietnam)
2001Moved into the consumer products businessBegan marketing Collagenaid ®, a collagen food supplement, to general consumers
2011Established Shanghai Nitta Gelatin Co., Ltd. (China)
2012Beijing Nitta Collagen Casing Co., Ltd. (China)
2014Started production of collagen peptide in the U.S.
Established Nitta Casings (Canada) Inc. (Canada)
20142000 2010
17
Nitta GelatiNaNNual report 2014

Back row from left: Hisayuki Suekawa, Outside Director; Mayumi Ishihara, Outside Director; Hiroshi Nitta, Director; Yasuyuki Nakai, Standing Audit & Supervisory Board Member; Raymond Merz, Director and Executive Officer; Tamon Tsuda, Outside Audit & Supervisory Board Member
Front row from left: Toru Tamaoka, Director and Executive Officer; Tsuneo Sasaki, Director and Senior Managing Executive Officer; Norimichi Soga, Representative Director and President; Koichi Ogata, Director and Executive Officer; Shigeoki Tougou, Outside Audit & Supervisory Board Member
■ Board of Directors
Representative Director and PresidentNorimichi SogaApr. 1971 Joined Kobe Kiito Co., Ltd.July 1973 Joined the CompanyJuly 1991 General Manager, Overseas Sales and Marketing
Division of the CompanyJuly 1992 General Manager, Sales & Marketing Department,
Gelatin Division of the CompanyNov. 1996 Director of the CompanyJuly 1997 General Manager, Sales & Marketing Division and
General Manager, Tokyo Branch of the CompanyJune 1999 Managing Director of the CompanySept. 1999 General Manager, Operating Division of the CompanyJune 2003 Senior Managing Director of the CompanyJune 2004 Representative Director, Senior Managing Director of
the CompanyJan. 2005 Executive Officer of the CompanyJune 2006 Representative Director and President (to present)
Director and Senior Managing Executive OfficerTsuneo SasakiApr. 1974 Joined Mitsui Bank (currently Sumitomo Mitsui Banking
Corporation)Nov. 2002 Dispatched to the CompanyNov. 2003 Joined the CompanyMar. 2004 General Manager, Finance Department, General
Administration Division of the CompanySept. 2004 General Manager, Production Planning Department,
Operating Division of the CompanyMar. 2005 General Manager, Production Management
Department, Operating Division of the CompanyMar. 2006 General Manager, Finance Division, General
Administration Division of the CompanyJune 2006 Director of the Company (to present)June 2006 Executive Officer of the CompanySept. 2006 General Manager, Finance Division of the CompanyJune 2010 Managing Executive Officer of the CompanyJune 2011 General Manager, General Affairs Division of the
Company
June 2012 Senior Managing Executive Officer of the Company (to present)
Mar. 2013 General Manager, General Affairs Division of the Company (to present)
BoARd of diReCtoRs, exeCutive offiCeRs And Audit & supeRvisoRy BoARd memBeRs(As of June 26, 2014)
18
Nitta GelatiN aNNual report 2014

■ Board of Directors
Director and Executive OfficerKoichi OgataApr. 1981 Joined Kanebo Foods, Ltd. (currently Kracie Foods, Ltd.)Dec. 2005 Joined the CompanyMar. 2008 General Manager, R&D Department, Sales & Marketing
Division of the CompanyJune 2010 Executive Officer of the Company (to present)June 2012 Director of the Company (to present)Mar. 2013 General Manager, Sales & Marketing Division of the
Company (to present)
Director and Executive OfficerToru TamaokaApr. 1984 Joined the CompanyMar. 2008 General Manager, Planning and Management
Department, Gelatin Division of the CompanyJuly 2010 General Manager, Adhesives Division of the Company
(to present)June 2012 Executive Officer of the Company (to present)June 2014 Director of the Company (to present)
Director and Executive OfficerRaymond MerzSept. 1984 Joined Alcan Aluminium Limited (Canada)Jan. 1995 Joined Cangel Inc. (currently Nitta Gelatin Canada, Inc.)Jan. 1996 General Manager, Production Division of Nitta Gelatin
Canada, Inc.Jan. 2000 Director and Vice President of Nitta Gelatin Canada, Inc.May 2002 Chief Operating Officer (COO) of Nitta Gelatin Canada, Inc.June 2002 Director of the CompanyDec. 2004 Director and CEO of Nitta Gelatin USA, Inc.Jan. 2005 Executive Officer of the CompanyApr. 2006 Director and CEO of Nitta Gelatin Canada, Inc.June 2011 Senior Executive Officer of the CompanyJune 2013 Executive Officer of the Company (to present)Mar. 2014 General Manager, Gelatin Division of the Company
(to present)June 2014 Director of the Company (to present)
DirectorHiroshi NittaApr. 2003 Joined Nitta CorporationApr. 2003 Dispatched to Nitta Haas Inc.June 2009 Director of the Company (to present)Jan. 2011 Deputy General Manager, Gelatin Division of the CompanyMar. 2011 Deputy General Manager, Manufacturing Division of the
CompanyJune 2011 Executive Officer of the Company
Outside DirectorMayumi IshiharaApr. 1986 Worked at Kobe District CourtOct. 1994 Passed the bar examApr. 1997 Registered as an attorney at lawApr. 1997 Joined Oh-Ebashi LPC & Partners (to present)June 2010 Director of the Company (to present)
Outside DirectorHisayuki SuekawaApr. 1982 Joined Shiseido Company, LimitedFeb. 2007 General Manager of the Business Planning Department
of Shiseido Company, LimitedApr. 2008 Corporate Officer, General Manager of the Corporate
Planning Department of Shiseido Company, LimitedJune 2009 Director of Shiseido Company, LimitedApr. 2011 Representative Director [incumbent], President & CEO
of Shiseido Company, LimitedApr. 2013 Senior Adviser of Shiseido Company, Limited (to present)June 2014 Outside Director of the Company (to present)
■ Audit & Supervisory Board Members
■ Executive Officers
Hidenori TakemiyaYuji YamamotoHiroshi TakaseYoshitaka OdaYoshihisa SugimotoJuergen Gallert
■ Managing Executive Officer
Takeo Yamaki
Standing Audit & Supervisory Board MemberYasuyuki NakaiApr. 1978 Joined Mitsui Bank (currently Sumitomo Mitsui Banking
Corporation)Nov. 2007 Dispatched to the CompanyMar. 2008 General Manager, Corporate Planning Division of the
CompanyJune 2008 Joined the CompanyJune 2008 Executive Officer of the CompanyJuly 2009 General Manager, GRM Division of the CompanyJuly 2010 General Manager, Planning and Management
Department, Gelatin Division of the CompanyMar. 2011 General Manager, Planning and Management
Department, Manufacturing Division of the CompanyMar. 2013 General Manager, Planning and Management
Department, Gelatin Division of the CompanyJune 2013 Standing Audit & Supervisory Board Member of the
Company
Outside Audit & Supervisory Board MemberShigeoki TougouApr. 1966 Joined Bank of JapanJuly 1993 General Manager, Secretariat of the Policy Board of
Bank of JapanApr. 1995 General Manager, International DepartmentJune 1996 Managing Director of The Nippon Credit Bank, Ltd.
(currently Aozora Bank, Ltd.)Aug. 1997 President of Aozora Bank, Ltd.June 2000 President and Representative Director of Osaka
Shipbuilding Co., Ltd. (currently Daizo Corporation)June 2010 President of Nippon RAD Inc.June 2011 Chief Executive Officer of Nippon RAD Inc.June 2012 Audit & Supervisory Board Member of the Company
(to present)Oct. 2012 President of Higashi Nippon Gakuen University
(to present)
Outside Audit & Supervisory Board MemberTamon TsudaApr. 1975 Joined The Sumitomo Bank, Limited (currently
Sumitomo Mitsui Banking Corporation)Oct. 1981 Joined Arthur Andersen, LLPMar. 1985 Registered as a certified public accountantDec. 1994 Partner of Century Audit Corporation (currently Ernst &
Young ShinNihon LLC)Nov. 2000 Representative Partner of Century Ota Showa & Co.
(currently Ernst & Young ShinNihon LLC)July 2008 Senior Partner of Ernst & Young ShinNihon LLCJuly 2012 Head of Tsuda Certified Public Accountant Office
(to present)June 2014 Outside Audit & Supervisory Board Member of the
Company (to present)
19
Nitta GelatiNaNNual report 2014

Individual, other
34.7%
Financial instruments business operator
0.5%
Foreign investors
1.7%
Domestic companies
33.3%
Financial institutions
29.8%
Individual, other
97.0%
Foreign investors
0.8%
Financial instruments business operator
0.4%
Domestic companies
1.3%
Financial institutions
0.5%
investoR infoRmAtion
■ Stock Information (As of March 31, 2014)
Number of shares authorized: 50,000,000 shares
Number of shares issued: 18,373,974 shares (including treasury stock of 162 shares)
Number of shareholders: 5,781
Major Shareholders (Top 10)
Shareholder Name Number of Shares Shareholding Percentage
IBP Co., Ltd. 2,951,316 16.06%
The Master Trust Bank of Japan, Ltd. (trust account) 1,589,900 8.65
Nitta Corporation 840,014 4.57
Sumitomo Mitsui Banking Corporation 630,286 3.43
The Bank of Tokyo-Mitsubishi UFJ, Ltd. 621,074 3.38
Iwaki Co., Ltd. 533,600 2.90
Japan Trustee Services Bank, Ltd. (trust account) 489,500 2.66
The Nomura Trust and Banking Co., Ltd. (trust account) 486,700 2.65
Nitta Gelatin Employees Shareholding Association 443,300 2.41
Ishizuka Corporation 382,014 2.08
(Note) Shareholding percentage is calculated based on the total number of shares issued minus treasury stock (162 shares).
Percentages are rounded to two decimal places.
■ Share Distribution
<Breakdown of Shareholding by Number of Shares Held><Breakdown of Shareholding by Investor Type>
20
Nitta GelatiN aNNual report 2014

■ Company Outline
Headquarters: 4-26, Sakuragawa 4-chome, Naniwa-ku, Osaka 556-0022, Japan
Establishment: January 1918
Incorporation: February 1945
Capital: ¥3,144,929,440
Number of shares issued: 18,373,974 shares
Net Sales: Non-consolidated: ¥22,169 million(Year ended March 31, 2014)Consolidated: ¥32,814 million(Year ended March 31, 2014)
Employees: Non-consolidated: 255(As of March 31, 2014)Consolidated: 635(As of March 31, 2014)
Main Business: Production and sales of edible gelatin, pharmaceutical gelatin and photographic gelatin.Production and sales of collagen peptidesProduction and sales of collagen casingsProduction and sales of collagen for cosmetics, biomaterials and biochemical productsProduction and sales of edible gelling agents, stabilizers and other food materialsProduction and sales of adhesives and sealants for packaging, bookbinding, building materials, hygiene products and automobiles
Operating facilities: 10 locations in Japan, 13 locations overseas
■ Affiliates
1 Nitta Gelatin NA Inc. (U.S.A.)
2 Nitta Gelatin USA, Inc. (U.S.A.)
3 Nitta Casings Inc. (U.S.A.)
4 Nitta Gelatin Holding, Inc. (U.S.A.)
5 Nitta Gelatin Canada, Inc. (Canada)
6 Nitta Casings (Canada) Inc. (Canada)
7 Alma Corporation (Japan)
8 Nitta Biolab Inc. (Japan)
9 Hikone Gelatin Inc. (Japan)
� Bostik-Nitta Co., Ltd. (Japan)
� Shinju Service Co., Ltd. (Japan)
� Shanghai Nitta Gelatin Co., Ltd. (China)
� Beijing Nitta Collagen Casing Co., Ltd. (China)
� Guangdong Baiwei Bio Material Co., Ltd. (China)
� Nitta Hong Kong, Ltd. (China)
� Nitta Gelatin Vietnam Co., Ltd. (Vietnam)
� Nitta Gelatin India Ltd. (India)
� Bamni Proteins Ltd. (India)
� Reva Proteins Ltd. (India)
Consolidated subsidiaries Equity method affiliates Other affiliates
713
12
1514
17 16
5 63 412
891011
19 18
CoRpoRAte infoRmAtion
21
Nitta GelatiNaNNual report 2014

Business Performance Summary for the Fiscal Year Ended March 31, 2014In the fiscal year ended March 31, 2014, the global econ-omy continued to recover gradually, despite continuing uncertainty due to issues such as the tapering of quantita-tive easing in the United States, concerns of a slowdown among emerging economies, and the future development of the European debt problem. Meanwhile, the Japanese econ-omy also continued to recover gradually, with the yen depre-ciating and stock prices rising as a result of government policies and the Bank of Japan’s monetary easing. Never-theless, the situation remains unclear, due to sluggish consumer spending following an increase in the consump-tion tax rate, along with concerns over the impact of a down-turn in the global economy.
Amid these circumstances, Nitta Gelatin faced challeng-ing business conditions including the increased cost of import procurements in Japan due to the yen’s deprecia-tion, rising prices for gelatin and other raw materials for the Group, and higher energy prices in Japan.
The Group worked to provide products and services a step ahead of customers’ expectations, develop new prod-ucts, cultivate new markets and reduce costs, under the slogan of “Amaze the World!” and a basic strategy to “Win out!! in growing Asian market.”
Meanwhile, the Company issued 2,603,900 shares of common stock by way of public subscription in July and third-party allocation in August 2013. The resulting pro-ceeds of ¥3,135 million in total were used to secure funds for capital investment and to improve the Group’s financial position.
As a result, net sales increased 14.0% year on year to ¥32,814 million in the fiscal year ended March 31, 2014. Operating income declined 40.1% to ¥955 million, mainly due to delays in passing along higher costs in Japan. Ordi-nary income decreased 43.6% to ¥1,115 million on account of a decrease in equity in earnings of affiliates due to a decline in the performance of an Indian affiliate. Net income decreased 56.4% to ¥665 million, mainly reflecting the booking of an extraordinary loss in line with a reduction in the Company’s shareholding in an Indian affiliate due to Indian shareholding regulations.
Consolidated Business Performance for the Fiscal Year Ended March 31, 2014Net Sales and Earnings Net sales
Overseas, the Group posted strong sales owing to sales volume growth and price revisions backed by buoyant demand in the North American and Asian markets. The Group’s performance was strong in the Japanese market, as well. As a result, in the fiscal year ended March 31, 2014, net sales increased ¥4,041 million, or 14.0% year on year to ¥32,814 million.
Management’s Discussion and Analysis
Gross ProfitConsolidated gross profit declined ¥187 million, or 2.8% year on year to ¥6,484 million, mainly due to surging gelatin raw material prices worldwide, higher energy cost in Japan, and higher procurement costs of imports as a result of the yen’s depreciation.
Selling, General and Administrative ExpensesSelling, general and administrative (SG&A) expenses increased ¥452 million, or 8.9%, year on year to ¥5,528 million.
Operating incomeAs a result of the foregoing, operating income decreased ¥640 million, or 40.1%, year on year to ¥955 million.
Net incomeWe booked a gain on compensation income of ¥89 million as other income, and a loss on retirement of noncurrent assets of ¥29 million, and a loss on change in equity of ¥104 million as other expenses. Consequently, net income decreased ¥859 million, or 56.4%, year on year to ¥665 million.
Segment Performance Collagen Material Business
In the gelatin field, sales of mainly edible gelatin and gelatin for capsules increased in the Japanese market. Profit mar-gins declined, however, as a result of increased import procurement costs due to the yen’s sharp depreciation, and insufficient progress in passing along higher costs driven by rising raw material prices worldwide. In the North American and Asian markets, sales increased owing to sales volume growth and price revisions backed by buoyant demand for edible gelatin and gelatin for capsules. Earnings also grew steadily in the North American and Asian markets.
Collagen peptide sales posted strong growth in Japan and Asia overall, but profitability declined because of the rise in raw material prices.
Collagen casing sales were lackluster and a loss was incurred due to quality issues that arose during the first six months of the fiscal year in connection with collagen casing manufactured and sold by a U.S. subsidiary.
As a result, net sales in the Collagen Material business increased 20.1% year on year to ¥22,436 million. Segment profit (operating income) was down 20.8% to ¥1,420 million.
Formula Solution BusinessIn food materials, performance was sluggish on the whole, with sales increasing only slightly. Profit declined despite efforts to curtail advertising expenses.
In adhesives, overall sales increased only slightly due to delays in the adoption of new sealants by customers, despite strong sales of hot-melt adhesives due to increased demand pending the consumption tax rate increase. Profit declined as selling, general and administrative expenses increased due to stronger efforts to develop new customers for sealants.
As a result, net sales in the Formula Solution business increased 2.8% year on year to ¥10,377 million. Segment profit (operating income) declined 20.1% to ¥920 million.
22
Nitta GelatiN aNNual report 2014

Research and Development“As a world leading gelatin manufacturer, the Group uses its proprietary technology to quickly and efficiently provide superior products and services to global customers. The Group produces healthy, functional and valuable products in multinational facilities that are safe, reliable and environ-mentally friendly.” Guided by this vision, we are advancing both the Collagen Material and Formula Solution businesses with the aim of establishing Nitta Gelatin as a global brand that is chosen first by customers.
The markets we face are constantly evolving and diversi-fying on a daily basis. True to our slogan, Amaze the World!, our basic R&D policy is to quickly and efficiently develop products and services that are a half step or a whole step ahead of customer expectations in order to enhance the Company’s brand value and contribute to sustained busi-ness expansion and growth. We have organized a product development structure that is as close to customers as possible in an effort to energize R&D activities and identify shifts in market and customer needs with a constantly posi-tive mindset. In other words, we have stationed sales, development and production personnel across the R&D organization to ensure that requests from the customer, markets and others are directly conveyed to technology, service, product development and production technology development units, so that timely responses are made. While the internal research personnel are focused on prod-uct development and customer service, we also actively conduct joint research with and commission research to external research institutes, universities and other entities, for the purpose of promoting basic research into food ingre-dients, obtaining new fundamental technologies and meet-ing other priorities.
Since 2007, we have held TPM (Technology, Product, Market) Presentations under the guidance of external con-sultants, in an initiative to promote and encourage R&D activities. These presentations are based on the “TPM cycle” approach of obtaining market recognition through product development driven by technology. Group R&D Infor-mation Meetings have been held since 2010, to share information about R&D within our Group by introducing examples of development projects, as well as new technolo-gies and products.
The following is a breakdown of R&D activities by divi-sion in each business during the fiscal year ended March 31, 2014. Total R&D expenses were ¥1,004 million.
Collagen Material BusinessGelatin•Improve and upgrade production technology for raw
material and gelatin processes•Develop new gelatin (new materials, new functions)•Provide optimal quality for each applicationCollagen Peptide•Develop collagen peptide production technology
(peptide synthesis, refining technology)•Research functional characteristics of collagen
peptideCollagen Casing•Improve and upgrade collagen casing production•Develop new markets and productsLife Science•Research and development of collagen for bio-
materials and cell cultures•Research and development of gelatin and collagen for
advanced medical care
R&D expenses in the Collagen Material business were ¥561 million.
Formula Solution BusinessFood Material•Develop applications utilizing application laboratories•Develop novel products (for delicatessen items and
food products for seniors, such as medical foods)•Plan and develop consumer products (collagen supple-
ments, collagen-added cosmetics)Adhesive•Develop high-performance polymers (sealants)•Environmentally friendly hot-melt adhesives
R&D expenses in the Formula Solution business were ¥442 million.
Cash Flows■ Net cash used in operating activitiesNet cash used in operating activities was ¥692 million, compared with ¥2,050 million provided in the previous fiscal year. The main contributing factors were an increase in notes and accounts receivable of ¥2,147 million and inventories of ¥624 million. These outflows were partly offset by income before income taxes and minority interests of ¥1,070 million and depreciation and amortization of ¥914 million.
The increase in notes and accounts receivable reflects a temporary curtailment of the liquidation of receivables due to the fund procurement by way of public subscription and third-party offering.■ Net cash used in investing activitiesNet cash used in investing activities was ¥3,105 million, compared with ¥1,557 million in the previous fiscal year. The main use of cash was the purchase of property, plant and equipment of ¥2,949 million.
23
Nitta GelatiNaNNual report 2014

■ Net cash provided by financing activitiesNet cash provided by financing activities was ¥3,875 mil-lion, compared to ¥376 million used in the previous fiscal year. This mainly reflected ¥3,222 million in proceeds from long-term debt and ¥3,135 million in proceeds from issu-ance of common stock, which were partly offset by ¥2,165 million in repayment of long-term debt.
As a result, cash and cash equivalents were ¥2,406 million as of March 31, 2014, an increase of 6.5% from a year earlier.
Capital InvestmentBased on business strategies under our medium-term man-agement plan, we executed capital investment of ¥3,102 million centered on the Collagen Material business, mainly to achieve global cost competitiveness in gelatin products, strengthen collagen peptide supply capability, and enhance collagen casing productivity.
In the Collagen Material business, we invested ¥1,120 million to construct a new factory (completed in May 2014) as a new collagen peptide manufacturing base at Nitta Gelatin USA, Inc., ¥717 million to buy out leased assets such as gelatin manufacturing plant and equipment at Nitta Gelatin USA, Inc., and ¥596 million to introduce and renew collagen casing manufacturing plant and equipment at Nitta Casings Inc. and Beijing Nitta Collagen Casing Co., Ltd. We also spent ¥400 million on renewing plant and equipment and introducing facilities for saving energy at our Osaka plant and subsidiary, Hikone Gelatin Inc., and at Nitta Gelatin Canada, Inc. to maintain production capacity and enhance quality.
In the Formula Solution business, we invested ¥202 million to construct a new office and laboratory, and upgrade production facilities for the Adhesives Division, and ¥25 million to construct a factory and introduce plant and equipment to Nitta Gelatin Vietnam Co., Ltd.
We allotted our own funds, borrowings, and proceeds from issuances of common stock by way of public subscrip-tion in July and third-party allocation in August 2013 to execute these capital investments.
Expenses amounting to ¥9 million were booked as a loss on retirement of noncurrent assets for relocation and removal of plant and equipment in constructing the new office and laboratory for the Adhesives Division, in addition to ¥20 million in ongoing replacement of machinery and other plant and equipment.
Financial Position Current Assets
Current assets were ¥18,685 million as of March 31, 2014, an increase of ¥3,365 million from March 31, 2013. This was mainly attributable to a ¥147 million increase in cash and deposits, a ¥2,324 million increase in notes and accounts receivable, and a ¥810 million increase in inventories.
Noncurrent AssetsNoncurrent assets were ¥12,704 million as of March 31, 2014, an increase of ¥2,833 million from March 31, 2013. This mainly reflected a ¥2,516 million increase in property, plant and equipment in line with capital investments and an increase of ¥307 million in investment securities.
Current LiabilitiesCurrent liabilities were ¥10,080 million as of March 31, 2014, an increase of ¥443 million from the previous fiscal year-end. This mainly reflected increases of ¥518 million in notes and accounts payable and ¥161 million in other payable, partly offset by decreases of ¥135 million in the current portion of long-term debt and ¥200 million in the current portion of bonds.
Noncurrent LiabilitiesNoncurrent liabilities were ¥7,528 million as of March 31, 2014, an increase of ¥1,699 million from the previous fiscal year-end. This was mainly attributable to increases of ¥1,273 million in long-term debt and ¥175 million in lease obligations.
Net AssetsNet assets stood at ¥13,781 million as of March 31, 2014, an increase of ¥4,056 million from the previous fiscal year-end. This was mainly attributable to increases of ¥429 million in retained earnings and ¥1,567 million each in capital stock and capital surplus resulting from the issuance of common stock by way of public subscription and third-party allocation.
As a result, the equity ratio stood at 43.4% as of March 31, 2014, compared to 38.0% as of March 31, 2013.
Basic Profit Distribution Policy and DividendsOur basic policy on profit distribution is to continuously pay steady dividends, while securing the internal reserves needed to develop future businesses and strengthen our operating structure.
Furthermore, our basic policy is to pay dividends twice every fiscal year, with interim and year-end dividends deter-mined by the Board of Directors and the Annual General Meeting of Shareholders, respectively. In regard to dividends for the fiscal year ended March 31, 2014, in accordance with the aforementioned policies, management has decided to pay a year-end dividend of ¥6.00 per common share. Combined with the interim dividend of ¥6.00, the annual dividend per common share is ¥12.00.
In regard to funds set aside as internal reserves, we intend to effectively invest these funds in enhancing cost competitiveness even more than before, bolstering our technology and product development structure in response to market needs, as well as implementing global strategies. These investments will help us to address anticipated changes in the business environment going forward.
24
Nitta GelatiN aNNual report 2014

Business Risks
This section provides information about the principal busi-ness risks concerning the Nitta Gelatin Group’s operations and related matters that may have a material impact on the decisions of investors. Matters that do not necessarily constitute such risks but are considered to have a material impact on the investment decisions of investors are also disclosed below from the standpoint of actively disclosing information to investors. Recognizing the possibility for such risks to occur, we endeavor to prevent the occurrence of such risks and to respond properly in the event that such risks occur.
This section includes forward-looking statements determined based on information available to us as of June 26, 2014.
(1) Product DevelopmentGuided by our motto of quickly and efficiently providing products and services that address shifting market condi-tions and customer needs, we actively conduct R&D and capital investment. However, there is no guarantee that we can successfully develop new products. In addition, even if a new product is successfully developed, it may not match customer needs and thus fail to gain their acceptance.
In regard to products for medical applications, cus-tomers using our products require an extensive lead time to develop and launch medical products. During this period, the customer may suspend product development or face protracted development delays, among other contingencies, mainly on account of shifting market conditions, changes in operating performance, or delays in obtaining approval from regulatory authorities.
In the event that we face delays or are unable to recover R&D expenses and capital investment as a result, our operating results and financial position may be nega-tively impacted.
(2) Overseas MarketsEver since the establishment of our first overseas sales subsidiary in the U.S. in July 1979, we have been actively working to expand sales in overseas markets. In the fiscal year ended March 31, 2014, sales in overseas markets accounted for 40.0% of our net sales. In the North American market, our primary region for business development so far, our sales expansion may be negatively impacted by competi-tion arising between our products and those of our competi-tors in the same industry.
In addition, in the future strategic Chinese, Indian and Southeast Asian markets, our sales expansion may be negatively impacted by even greater competition than in North America between our products and those of our com-petitors in the same industry.
The Group is working to enhance its competitiveness, mainly by reducing costs, improving quality, developing unique new products, and conducting production in optimal locations. However, if these measures prove ineffective, sales growth could stagnate. This could have a negative impact on our operating results and financial position.
(3) Exchange Rate MovementsWhen selling products to overseas customers either directly or through a subsidiary, we export products on a U.S. dollar-denominated basis. On the procurement front, we purchase raw materials for gelatin, such as bovine bones and ossein, primarily using U.S. dollars. We also import pig skin gelatin from overseas on a Canadian dollar-denominated basis. For this reason, we hedge our foreign exchange risk by conclud-ing foreign exchange forward contracts with financial institu-tions with respect to U.S. dollar-denominated exports, as well as U.S. dollar- and Canadian dollar-denominated imports. Through these measures, we reduce our exposure to foreign exchange risk related to operating transactions. However, in the event of unforeseeable foreign exchange rate movements, our operating results and financial position could be negatively impacted.
Furthermore, gains and losses arising from foreign currency-denominated transactions as well as the transla-tion into Japanese yen of foreign currency-denominated receivables and payables as well as the translation into Japanese yen of the accounts of the financial statements of overseas consolidated subsidiaries prepared in foreign currencies, are subject to foreign exchange rate move-ments. This could have a negative impact on our operating results and financial position.
(4) Price Fluctuations for Primary Raw MaterialsRaw material costs accounted for 57.3% of our cost of manufacturing in the year ended March 31, 2014. Raw material prices fluctuate for a variety of reasons. In the Collagen Material business, primary raw materials such as bovine bones and hides, pig skin and fish scales are all byproducts of the livestock and fishery industries. The raw material price may fluctuate depending on changes in meat consumption reflecting global economic conditions, as well as changes in supply-demand dynamics driven by regula-tions governing food processing and distribution in response to various animal epidemics and other factors. In the Formula Solution business, prices of natural polysaccha-rides, the primary raw material in the food material divisions may fluctuate due to changes in the climate of growing regions and other factors. Prices of petroleum resins, the key raw material for adhesives, may fluctuate due to changes in commodity prices and supply-demand dynamics for heavy oil and naphtha.
Meanwhile, in some cases the market environment and other factors can make it difficult to transfer the impact of price fluctuations for these key raw materials to the selling price of our products. Accordingly, fluctuations in raw materi-als prices could have a negative impact on our operating results and financial position.
25
Nitta GelatiNaNNual report 2014
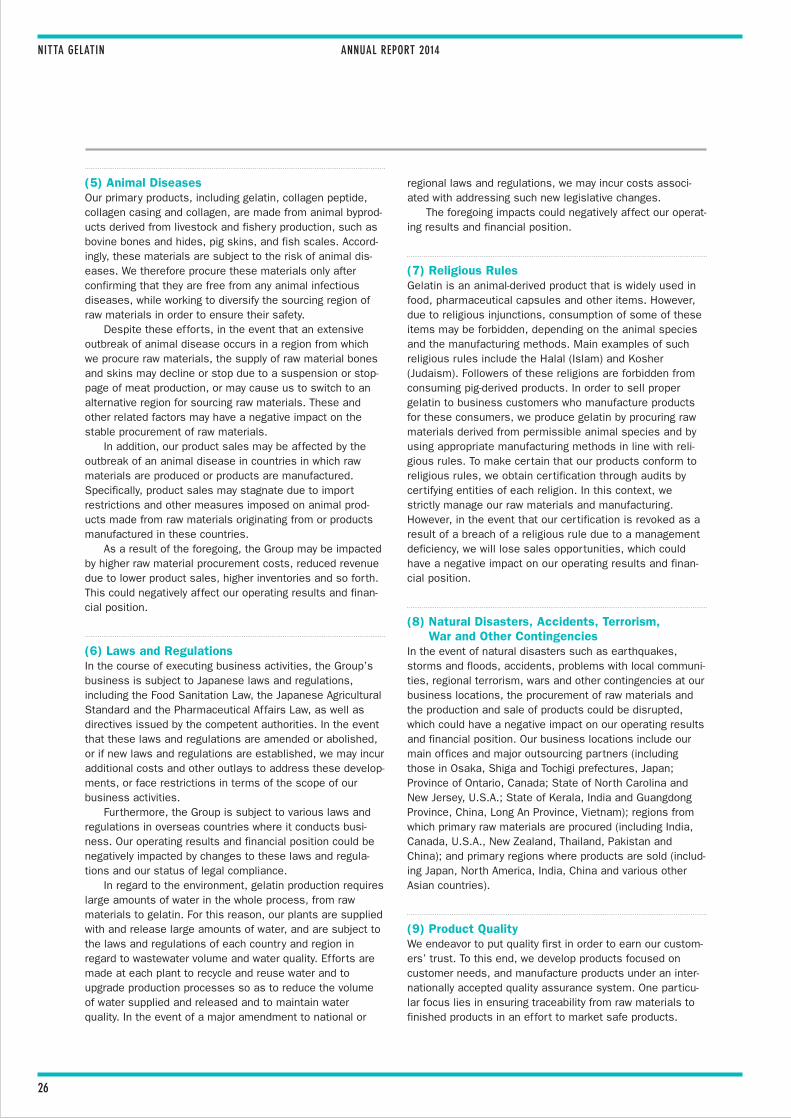
(5) Animal DiseasesOur primary products, including gelatin, collagen peptide, collagen casing and collagen, are made from animal byprod-ucts derived from livestock and fishery production, such as bovine bones and hides, pig skins, and fish scales. Accord-ingly, these materials are subject to the risk of animal dis-eases. We therefore procure these materials only after confirming that they are free from any animal infectious diseases, while working to diversify the sourcing region of raw materials in order to ensure their safety.
Despite these efforts, in the event that an extensive outbreak of animal disease occurs in a region from which we procure raw materials, the supply of raw material bones and skins may decline or stop due to a suspension or stop-page of meat production, or may cause us to switch to an alternative region for sourcing raw materials. These and other related factors may have a negative impact on the stable procurement of raw materials.
In addition, our product sales may be affected by the outbreak of an animal disease in countries in which raw materials are produced or products are manufactured. Specifically, product sales may stagnate due to import restrictions and other measures imposed on animal prod-ucts made from raw materials originating from or products manufactured in these countries.
As a result of the foregoing, the Group may be impacted by higher raw material procurement costs, reduced revenue due to lower product sales, higher inventories and so forth. This could negatively affect our operating results and finan-cial position.
(6) Laws and RegulationsIn the course of executing business activities, the Group’s business is subject to Japanese laws and regulations, including the Food Sanitation Law, the Japanese Agricultural Standard and the Pharmaceutical Affairs Law, as well as directives issued by the competent authorities. In the event that these laws and regulations are amended or abolished, or if new laws and regulations are established, we may incur additional costs and other outlays to address these develop-ments, or face restrictions in terms of the scope of our business activities.
Furthermore, the Group is subject to various laws and regulations in overseas countries where it conducts busi-ness. Our operating results and financial position could be negatively impacted by changes to these laws and regula-tions and our status of legal compliance.
In regard to the environment, gelatin production requires large amounts of water in the whole process, from raw materials to gelatin. For this reason, our plants are supplied with and release large amounts of water, and are subject to the laws and regulations of each country and region in regard to wastewater volume and water quality. Efforts are made at each plant to recycle and reuse water and to upgrade production processes so as to reduce the volume of water supplied and released and to maintain water quality. In the event of a major amendment to national or
regional laws and regulations, we may incur costs associ-ated with addressing such new legislative changes.
The foregoing impacts could negatively affect our operat-ing results and financial position.
(7) Religious RulesGelatin is an animal-derived product that is widely used in food, pharmaceutical capsules and other items. However, due to religious injunctions, consumption of some of these items may be forbidden, depending on the animal species and the manufacturing methods. Main examples of such religious rules include the Halal (Islam) and Kosher (Judaism). Followers of these religions are forbidden from consuming pig-derived products. In order to sell proper gelatin to business customers who manufacture products for these consumers, we produce gelatin by procuring raw materials derived from permissible animal species and by using appropriate manufacturing methods in line with reli-gious rules. To make certain that our products conform to religious rules, we obtain certification through audits by certifying entities of each religion. In this context, we strictly manage our raw materials and manufacturing. However, in the event that our certification is revoked as a result of a breach of a religious rule due to a management deficiency, we will lose sales opportunities, which could have a negative impact on our operating results and finan-cial position.
(8) Natural Disasters, Accidents, Terrorism, War and Other Contingencies
In the event of natural disasters such as earthquakes, storms and floods, accidents, problems with local communi-ties, regional terrorism, wars and other contingencies at our business locations, the procurement of raw materials and the production and sale of products could be disrupted, which could have a negative impact on our operating results and financial position. Our business locations include our main offices and major outsourcing partners (including those in Osaka, Shiga and Tochigi prefectures, Japan; Province of Ontario, Canada; State of North Carolina and New Jersey, U.S.A.; State of Kerala, India and Guangdong Province, China, Long An Province, Vietnam); regions from which primary raw materials are procured (including India, Canada, U.S.A., New Zealand, Thailand, Pakistan and China); and primary regions where products are sold (includ-ing Japan, North America, India, China and various other Asian countries).
(9) Product QualityWe endeavor to put quality first in order to earn our custom-ers’ trust. To this end, we develop products focused on customer needs, and manufacture products under an inter-nationally accepted quality assurance system. One particu-lar focus lies in ensuring traceability from raw materials to finished products in an effort to market safe products.
26
Nitta GelatiN aNNual report 2014

We have enrolled in product liability insurance policies, among other safeguards. However, in the event that a cus-tomer suffers damages as a result of defects in our prod-ucts, there is no guarantee that our liability for damages will be covered within the compensation limits of these insur-ance policies.
Accordingly, in the event of a serious quality problem, the ensuing claims for damages, loss of public trust in the Group and other factors could negatively impact our operat-ing results and financial position.
(10) Alternative ProductsThere is a growing trend to switch the raw materials used in certain pharmaceuticals, cosmetics and food from animal to plant-derived materials. In the capsule market, one of our core markets for gelatin, this trend has given impetus to the development of plant-derived (starch and cellulose deriva-tives) capsule products. Certain pharmaceutical and health food manufacturers have adopted these capsules as an alternative to gelatin capsules. We believe that the popular-ization of plant-derived capsules has been limited only to certain segments of the market.
Nevertheless, in the event of new regulations on animal-derived products or a change in consumer sentiment, the rapid popularization of plant-derived capsules could reduce demand for gelatin capsules, and have a negative impact on our operating results and financial position.
(11) Interest-Rate FluctuationsWe primarily borrow funds from financial institutions to finance capital investments. The percentage of interest-bearing liabilities relative to total assets was 26.1% (including lease obligations) in the fiscal year ended March 31, 2014.
We endeavor to reduce borrowings and other interest-bearing liabilities. However, in the event of an increase in market interest rates going forward, our operating results and financial position could be negatively impacted.
(12) TaxationIn Japan, a 17% tariff is levied on imported gelatin except for photographic use. Going forward, the selling price of these imports may decrease as a result of the reduction or abolition of this tariff. A price difference may arise between imports such as South American bovine hide gelatin and Indian bovine bone gelatin, and bovine bone gelatin produced at the Company’s Osaka Plant. In such an event, our operating results and financial position could be negatively affected.
Moreover, the Group conducts production and sales activities on a global scale, and materials, semi-finished goods and other items are mutually supplied within the Group. Each Group business entity complies with the tax laws to follow the proper procedures for calculating and paying taxes in the country of its jurisdiction. While the
Group pays close attention to international taxation risks such as the transfer pricing taxation applicable in each country, additional taxes may be imposed in the event that the Group’s views on this matter conflict with those of the tax authorities.
(13) Information SecurityWe have established an information system that enables us to obtain and analyze necessary information in real time in various processes, including purchasing, production, sales and management. We put particular emphasis on the strict management of access rights to the system for the purpose of ensuring stable system operation and preventing any leaks of sales data, including client data and personal infor-mation stored on the system. These efforts notwithstand-ing, in the event of difficulty in maintaining the stable operation of the information system due to a software malfunction, unauthorized external access or other factors, our business activities could be disrupted. In the event that sales or client data is leaked outside our Group, we could face consequences such as claims for damages from cus-tomers, and a loss of public trust in our Group. As a result, our operating results and financial position could be nega-tively affected.
(14) Infringement of Intellectual Property RightsWe protect our intellectual property rights through such means as obtaining patents on proprietary technology and other innovations we have developed. Efforts are also made in the product development process to prevent any infringe-ment of rights held by third parties, including intellectual property rights. These efforts notwithstanding, we cannot completely rule out the possibility of becoming subject to allegations and claims by third parties concerning the own-ership or infringement of intellectual property and other rights. In the event that we are subject to claims for dam-ages or cease-and-desist orders as a result, our operating results and financial position could be negatively affected.
(15) Legal Disputes and LitigationIn the course of our business activities, we endeavor to enhance our internal control system and strengthen compli-ance, encompassing legal compliance and observance of social norms, while reducing our exposure to various forms of risk. At the same time, the Group receives advice from lawyers and other experts as necessary. These efforts notwithstanding, the Group may be subject to lawsuits in the course of business activities, irrespective of whether or not there is a breach of laws or regulations. In such an event, our operating results and financial position could be negatively affected.
27
Nitta GelatiNaNNual report 2014

28
Nitta GelatiN aNNual report 2014
Consolidated Balance SheetsNitta Gelatin Inc. and Consolidated SubsidiariesAs of March 31, 2014 and 2013
Millions of yenThousands of U.S.
dollars (Note 1)
2014 2013 2014
AssetsCurrent assets:
Cash and deposits (Notes 6, 10 and 18) ¥ 2,426 ¥ 2,278 $ 23,580Notes and accounts receivable (Notes 3 and 10) 8,164 5,839 79,354Inventories (Note 4) 7,642 6,831 74,280Deferred tax assets (Note 7) 158 134 1,535Other 306 251 2,974Allowance for doubtful accounts (13) (16) (126)
Total current assets 18,685 15,319 181,619
Property, plant and equipment:Buildings and structures (Note 6 ) 7,564 7,204 73,522Machinery, equipment and vehicles (Note 6) 9,841 8,554 95,655Land (Note 6) 768 761 7,465Lease assets (Note 9) 1,136 786 11,041Construction in progress 2,260 777 21,967Other 1,316 1,279 12,791Accumulated depreciation (14,084) (13,077) (136,897)
Net property, plant and equipment 8,804 6,287 85,575
Intangible assets 50 48 486
Investments and other assets:Investment securities (Notes 5, 6 and 10) 3,075 2,768 29,889Long-term loans receivable 8 13 77Deferred tax assets (Note 7) 399 524 3,878Asset for retirement benefits (Note 8) 253 – 2,459Other 111 228 1,078
Total investments and other assets 3,849 3,534 37,412Total assets ¥ 31,389 ¥ 25,190 $ 305,103
See notes to consolidated financial statements.
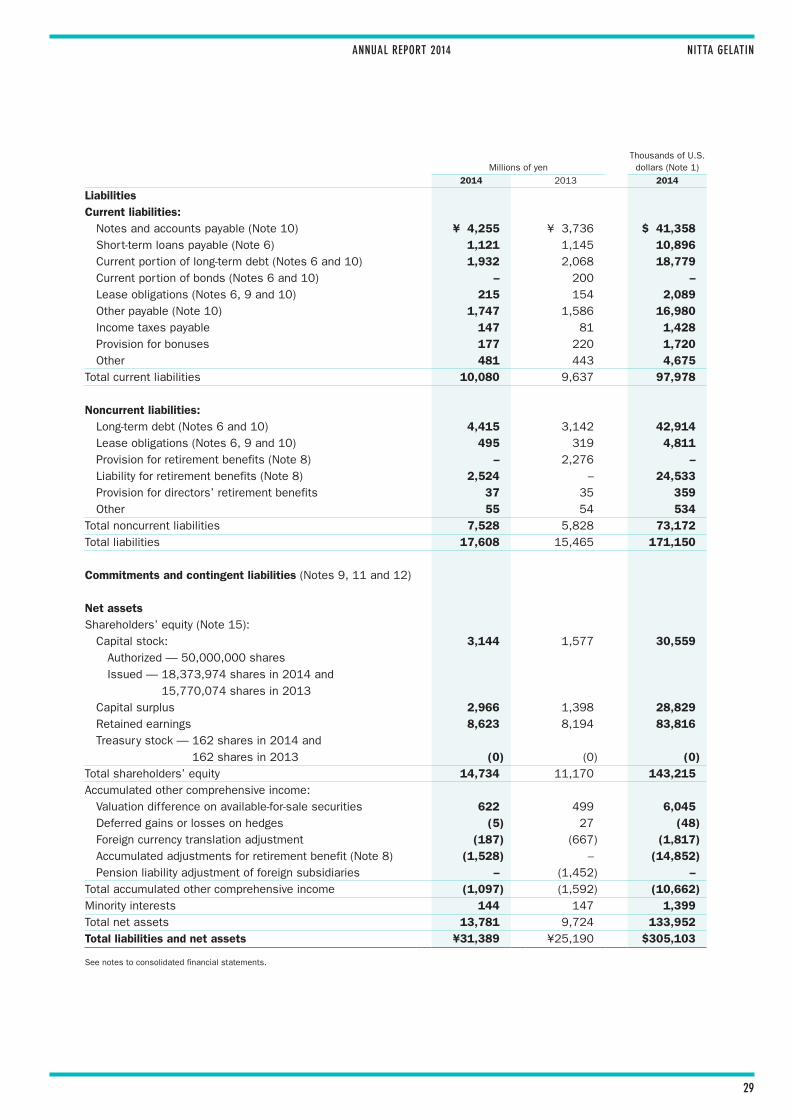
29
Nitta GelatiNaNNual report 2014
Millions of yenThousands of U.S.
dollars (Note 1)
2014 2013 2014
LiabilitiesCurrent liabilities:
Notes and accounts payable (Note 10) ¥ 4,255 ¥ 3,736 $ 41,358Short-term loans payable (Note 6) 1,121 1,145 10,896Current portion of long-term debt (Notes 6 and 10) 1,932 2,068 18,779Current portion of bonds (Notes 6 and 10) – 200 –Lease obligations (Notes 6, 9 and 10) 215 154 2,089Other payable (Note 10) 1,747 1,586 16,980Income taxes payable 147 81 1,428Provision for bonuses 177 220 1,720Other 481 443 4,675
Total current liabilities 10,080 9,637 97,978
Noncurrent liabilities:Long-term debt (Notes 6 and 10) 4,415 3,142 42,914Lease obligations (Notes 6, 9 and 10) 495 319 4,811Provision for retirement benefits (Note 8) – 2,276 –Liability for retirement benefits (Note 8) 2,524 – 24,533Provision for directors’ retirement benefits 37 35 359Other 55 54 534
Total noncurrent liabilities 7,528 5,828 73,172Total liabilities 17,608 15,465 171,150
Commitments and contingent liabilities (Notes 9, 11 and 12)
Net assetsShareholders’ equity (Note 15):
Capital stock: 3,144 1,577 30,559Authorized — 50,000,000 shares
Issued — 18,373,974 shares in 2014 and
15,770,074 shares in 2013Capital surplus 2,966 1,398 28,829Retained earnings 8,623 8,194 83,816Treasury stock — 162 shares in 2014 and
162 shares in 2013 (0) (0) (0)Total shareholders’ equity 14,734 11,170 143,215Accumulated other comprehensive income:
Valuation difference on available-for-sale securities 622 499 6,045Deferred gains or losses on hedges (5) 27 (48)Foreign currency translation adjustment (187) (667) (1,817)Accumulated adjustments for retirement benefit (Note 8) (1,528) – (14,852)Pension liability adjustment of foreign subsidiaries – (1,452) –
Total accumulated other comprehensive income (1,097) (1,592) (10,662)Minority interests 144 147 1,399Total net assets 13,781 9,724 133,952Total liabilities and net assets ¥31,389 ¥25,190 $305,103
See notes to consolidated financial statements.

30
Nitta GelatiN aNNual report 2014
Consolidated Statements of IncomeNitta Gelatin Inc. and Consolidated SubsidiariesYears ended March 31, 2014 and 2013
Millions of yenThousands of U.S.
dollars (Note 1)
2014 2013 2014
Net sales ¥32,814 ¥28,772 $318,954Cost of sales (Note 4) 26,329 22,100 255,919
Gross profit 6,484 6,671 63,024
Selling, general and administrative expenses (Note 13) 5,528 5,075 53,732Operating income 955 1,595 9,282
Other income (expenses):Interest and dividends income 24 19 233Interest expenses (133) (147) (1,292)Rent income 35 29 340Equity in earnings of affiliates 97 262 942Foreign exchange gains 166 179 1,613Going public expenses (23) – (223)Commissions paid (37) (15) (359)Gain on sales of noncurrent assets – 11 –Gain on transfer of business 89 – 865Loss on retirement of noncurrent assets (29) (58) (281)Loss on valuation of investment securities – (12) –Loss on sales of golf club membership – (4) –Loss on change in equity (104) – (1,010)Other, net 31 53 301
114 319 1,108
Income before income taxes and minority interests 1,070 1,915 10,400Income taxes (Note 7):
Current 350 402 3,402Deferred 67 1 651
Total income taxes 418 403 4,062
Income before minority interests 651 1,512 6,327Minority interests in income (13) (13) (126)Net income (Note 17) ¥ 665 ¥ 1,525 $ 6,463
See notes to consolidated financial statements.

31
Nitta GelatiNaNNual report 2014
Consolidated Statements of Comprehensive IncomeNitta Gelatin Inc. and Consolidated SubsidiariesYears ended March 31, 2014 and 2013
Millions of yenThousands of U.S.
dollars (Note 1)
2014 2013 2014
Income before minority interests ¥ 651 ¥1,512 $ 6,327
Other comprehensive income (Note 19):Valuation difference on available-for-sale securities 123 83 1,195Deferred gains or losses on hedges (30) 17 (291)Foreign currency translation adjustment 388 600 3,771Pension liability adjustment of foreign subsidiaries (11) (395) (106)Share of other comprehensive income of associates
accounted for using equity method 105 95 1,020Total other comprehensive income 575 401 5,589Comprehensive income ¥1,227 ¥1,913 $11,926
Comprehensive income attributable to:Owners of the parent ¥1,224 ¥1,918 $11,897Minority interests 2 (4) 19
See notes to consolidated financial statements.

32
Nitta GelatiN aNNual report 2014
Consolidated Statements of Changes in Net AssetsNitta Gelatin Inc. and Consolidated SubsidiariesYears ended March 31, 2014 and 2013
Millions of yen
Shareholders’ equity
Capital stockCapital surplus
Retained earnings
Treasury stock Total
Balance at April 1, 2012 ¥1,577 ¥1,398 ¥6,889 ¥(0) ¥ 9,865Cumulative effect of changes in accounting policies –Balance at April 1, 2012 after reflecting changes in
accounting policies 1,577 1,398 6,889 (0) 9,865Issuance of new shares –Dividends from surplus (220) (220)Net income 1,525 1,525Net changes of items other than shareholders’ equity –
Balance at March 31, 2013 ¥1,577 ¥1,398 ¥8,194 ¥(0) ¥11,170Issuance of new shares 1,567 1,567 3,135Dividends from surplus (236) (236)Net income 665 665Net changes of items other than shareholders’ equity –
Balance at March 31, 2014 ¥3,144 ¥2,966 ¥8,623 ¥(0) ¥14,734
Millions of yen
Accumulated other comprehensive income
Valuation difference
on available-for-sale
securities
Deferred gains or
losses on hedges
Foreign currency
translation adjustment
Accumulated adjustments for retirement
benefit
Pension liability adjustment of foreign
subsidiaries TotalMinority interests
Total net assets
Balance at April 1, 2012 ¥416 ¥ 6 ¥(1,350) ¥ – ¥ (903) ¥(1,832) ¥ 74 ¥ 8,108Cumulative effect of changes
in accounting policies (153) (153) (153)Balance at April 1, 2012
after reflecting changes in
accounting policies 416 6 (1,350) – (1,057) (1,986) 74 7,954Issuance of new shares –Dividends from surplus (220)Net income 1,525Net changes of items other
than shareholders’ equity 83 21 683 – (395) 393 72 465Balance at March 31, 2013 ¥499 ¥ 27 ¥ (667) ¥ – ¥(1,452) ¥(1,592) ¥147 ¥ 9,724
Issuance of new shares 3,135Dividends from surplus (236)Net income 665Net changes of items other
than shareholders’ equity 122 (32) 480 (1,528) 1,452 494 (3) 491Balance at March 31, 2014 ¥622 ¥ (5) ¥ (187) ¥(1,528) ¥ – ¥(1,097) ¥144 ¥13,781
See notes to consolidated financial statements.

33
Nitta GelatiNaNNual report 2014
Thousands of U.S. dollars (Note 1)
Shareholders’ equity
Capital stockCapital surplus
Retained earnings
Treasury stock Total
Balance at March 31, 2013 $15,328 $13,588 $79,646 $(0) $108,573Issuance of new shares 15,231 15,231 30,472Dividends from surplus (2,293) (2,293)Net income 6,463 6,463Net changes of items other than shareholders’ equity –
Balance at March 31, 2014 $30,559 $28,829 $83,816 $(0) $143,215
Thousands of U.S. dollars (Note 1)
Accumulated other comprehensive income
Valuation difference
on available-for-sale
securities
Deferred gains or
losses on hedges
Foreign currency
translation adjustment
Accumulated adjustments for retirement
benefit
Pension liability adjustment of foreign
subsidiaries TotalMinority interests
Total net assets
Balance at
March 31, 2013 $4,850 $ 262 $ (6,483) $ – $(14,113) $(15,474) $1,428 $ 94,517Issuance of new shares 30,472Dividends from surplus (2,293)Net income 6,463Net changes of items
other than
shareholders’ equity 1,185 (311) 4,665 (14,852) 14,113 4,801 (29) 4,772Balance at March 31, 2014 $6,045 $ (48) $(1,817) $(14,852) $ – $(10,662) $1,399 $133,952
See notes to consolidated financial statements.
34
Nitta GelatiN aNNual report 2014
Consolidated Statements of Cash FlowsNitta Gelatin Inc. and Consolidated SubsidiariesYears ended March 31, 2014 and 2013
Millions of yenThousands of U.S.
dollars (Note 1)
2014 2013 2014
Operating activities:Income before income taxes and minority interests ¥ 1,070 ¥ 1,915 $ 10,400
Depreciation and amortization 914 825 8,884Increase (decrease) in provision for retirement benefits – (81) –Increase (decrease) in provision for directors’
retirement benefits 1 1 9Increase (decrease) in provision for bonuses (46) (21) (447)Increase (decrease) in allowance for doubtful accounts (2) 1 (19)Increase (decrease) in liability for retirement benefits (27) – (262)Interest and dividends income (24) (19) (233)Interest expenses 133 147 1,292Foreign exchange losses (gains) (35) (71) (340)Equity in earnings of affiliates (97) (262) (942)Gain on sales of property, plant and equipment – (11) –Loss on retirement of noncurrent assets 29 58 281Loss on valuation of investment securities – 12 –Loss on valuation of golf club membership 104 – 1,010Loss on sales of golf club membership – 4 –Decrease (increase) in notes and accounts receivable (2,147) 897 (20,868)Decrease (increase) in inventories (624) (650) (6,065)Increase (decrease) in notes and accounts payable 324 40 3,149Increase (decrease) in accrued consumption taxes (52) (66) (505)Other, net 88 13 855
Subtotal (391) 2,732 (3,800)Interest and dividends income received 134 153 1,302Interest expenses paid (134) (148) (1,302)Income taxes paid (301) (686) (2,925)
Net cash provided by operating activities (692) 2,050 (6,726)
Investing activities:Payments into time deposits (20) (20) (194)Proceeds from withdrawal of time deposits 20 20 194Purchase of property, plant and equipment (2,949) (1,193) (28,664)Proceeds from sales of property, plant and equipment – 14 –Purchase of intangible assets (12) (40) (116)Purchase of investment securities (6) (38) (58)Purchase of stocks of affiliates (142) (302) (1,380)Proceeds from cancellation of insurance funds 15 29 145Purchase of insurance funds (4) (4) (38)Other, net (5) (21) (48)
Net cash used in investing activities ¥(3,105) ¥(1,557) $(30,180)
See notes to consolidated financial statements.

35
Nitta GelatiNaNNual report 2014
Millions of yenThousands of U.S.
dollars (Note 1)
2014 2013 2014
Financing activities:Net increase (decrease) in short-term loans payable ¥ (91) ¥ 84 $ (884)Proceeds from long-term debt 3,222 2,124 31,318Repayment of long-term debt (2,165) (2,103) (21,043)Redemption of bonds (200) (330) (1,944)Proceeds from issuance of common stock 3,135 – 30,472Proceeds from stock issuance to minority shareholders – 85 –Proceeds from sale and leaseback transaction 432 132 4,199Repayments of lease obligations (216) (140) (2,099)Cash dividends paid (236) (220) (2,293)Cash dividends paid to minority shareholders (5) (8) (48)
Net cash provided by (used in) financing activities 3,875 (376) 37,665Effect of exchange rate change on cash and cash equivalents 70 63 680Net increase in cash and cash equivalents 147 180 1,428Cash and cash equivalents at beginning of period 2,258 2,078 21,947Cash and cash equivalents at end of period (Note 18) ¥ 2,406 ¥ 2,258 $ 23,386
See notes to consolidated financial statements.

36
Nitta GelatiN aNNual report 2014
Notes to Consolidated Financial StatementsNitta Gelatin Inc. and Consolidated Subsidiaries
1. Basis of Presenting Consolidated Financial StatementsThe accompanying consolidated financial statements of Nitta Gelatin Inc. (the “Company”) and its consolidated subsidiaries
(together, the “Group”) have been prepared in accordance with the provisions set forth in the Financial Instruments and
Exchange Act of Japan and its related accounting regulations and in conformity with accounting principles generally accepted
in Japan which are different in certain respects as to application and disclosure requirements of International Financial
Reporting Standards.
In preparing these consolidated financial statements, certain reclassifications and rearrangements have been made to the
consolidated financial statements issued domestically in order to present them in a form which is more familiar to readers
outside Japan. In addition, certain reclassifications have been made in the 2013 financial statements to conform to the
classifications used in 2014.
The consolidated financial statements are stated in Japanese yen, the currency of the country in which the Company is
incorporated and operates. As permitted by the regulations under the Financial Instruments and Exchange Act of Japan,
amounts of less than one million yen have been omitted. As a result, the totals shown in the accompanying consolidated
financial statements in yen do not necessarily agree with the sums of the individual amounts.
The U.S. dollar amounts shown in the accompanying consolidated financial statements and notes thereto were translated
from the presented Japanese yen amounts into U.S. dollar amounts at the rate of ¥102.88 = U.S. $1, the approximate rate
of exchange at March 31, 2014, and were then rounded down to the nearest thousand. As a result, the totals shown in the
accompanying consolidated financial statements in U.S. dollar do not necessarily agree with the sums of the individual
amounts. This translation of Japanese yen amounts into U.S. dollar amounts is included solely for convenience of readers
outside Japan. Such translation should not be construed as a representation that Japanese yen could be converted into U.S.
dollars at that or any other rate.
2. Significant Accounting Policies(1) Principles of consolidation and accounting for investments in unconsolidated subsidiaries and affiliatesThe consolidated financial statements as of and for the year ended March 31, 2014 include the accounts of the Company
and its 14 significant subsidiaries (14 significant subsidiaries in 2013). The fiscal year-end of three consolidated subsidiary
(December 31) is different than the consolidated fiscal year-end (March 31), and necessary adjustments are made for any
significant transactions between its fiscal year-end and the consolidated fiscal year-end.
Under the control or influence concept, those companies in which the Company, directly or indirectly, is able to exercise
control over operations are consolidated, and those companies over which the Group has the ability to exercise significant
influence are accounted for using the equity method.
For the year ended March 31, 2014 three affiliates (three affiliates in 2013) are accounted for using the equity method.
Investments in companies accounted for using the equity method whose fiscal year-ends are different than the consolidated
fiscal year-end are accounted for on the basis of the companies’ respective fiscal year-end. Investments in one unconsoli-
dated subsidiary and two affiliates are excluded from the application of the equity method and stated at cost because the
Group’s share of their net income and retained earnings have slight effects on the accompanying consolidated financial
statements and are considered insignificant overall.
(2) Foreign currency translationReceivables and payables denominated in foreign currencies are translated into yen at the exchange rates as of the consoli-
dated balance sheet date, and differences arising from the translation are included in the consolidated statements of income.
The asset and liability accounts of the foreign consolidated subsidiaries are translated into yen at the exchange rates as
of the consolidated balance sheet date, and revenue and expense accounts are translated at the average rate during the
year. Differences arising from the translation are presented in foreign currency translation adjustment and minority interests
in net assets.
(3) Cash and cash equivalentsCash and cash equivalents consist of cash on hand, cash in banks which can be withdrawn at any time and short-term
investments with a maturity of three months or less when purchased which are readily convertible into cash and are exposed
to insignificant risk of changes in value.

37
Nitta GelatiNaNNual report 2014
(4) Investment securitiesIn general, securities are classified into three categories: trading, held-to-maturity or available-for-sale securities. Securities
held by the Group are all classified as available-for-sale securities. Available-for-sale securities with a determinable market
value are stated at fair value, with any changes in unrealized holding gain or loss, net of the applicable income taxes,
included directly in net assets. Cost of securities sold is determined by the moving-average method. Available-for-sale
securities without a determinable market value are stated at cost determined by the moving-average method.
(5) InventoriesFinished goods are mainly stated at the lower of cost determined by the gross average method or net selling value. Merchan-
dise, semi-finished goods, work in process, raw materials and supplies are mainly stated at the lower of cost determined by
the moving-average method or net selling value.
(6) Property, plant and equipment and depreciation (excluding lease assets)Depreciation of property, plant and equipment held by the Company and its domestic consolidated subsidiaries is computed by
the declining-balance method, except for buildings on which depreciation is computed by the straight-line method. Depreciation
of property, plant and equipment held by foreign consolidated subsidiaries is computed mainly by the straight-line method.
The useful lives of property, plant and equipment are summarized as follows:
Buildings and structures: 7 to 50 years
Machinery, equipment and vehicles: 4 to 10 years
(7) Intangible assets and amortization (excluding lease assets)Intangible assets are amortized by the straight-line method. Internal use software is amortized by the straight-line method
over the estimated useful lives of five years.
(8) Lease assetsLease assets are depreciated by the straight-line method over the lease term with no residual value (residual value guaran-
tee amount if it is agreed).
In addition, the Group accounts for the finance lease transactions that commenced on or before March 31, 2008 and do
not transfer ownership of the leased assets to the lessee as operating lease transactions.
(9) Allowance for doubtful accountsThe Company and its domestic consolidated subsidiaries provide allowance for doubtful accounts mainly to cover a loss from
uncollectible receivables at an amount determined based on the historical experience of bad debt with respect to ordinary
receivables and an estimated uncollectible amount based on individual collectibility of specific doubtful receivables such as
doubtful accounts receivable.
The foreign consolidated subsidiaries provide allowance for doubtful accounts mainly at an estimated uncollectible
amount for specific doubtful receivables.
(10) Provision for bonusesThe Company and its consolidated subsidiaries record provision for bonuses at an amount estimated to cover the bonus
payments for services rendered by employees during each fiscal year.
(11) Provision for directors’ retirement benefitsCertain domestic consolidated subsidiaries record provision for directors’ retirement benefits to cover future payments at an
amount required according to the internal rules as of the balance sheet date.
(12) Accounting method for retirement benefitsThe retirement benefit obligation is calculating by allocating the estimated retirement benefits to period of service by the
straight-line method.
Prior service benefits and costs are recognized as income or expense by the straight-line method over a certain period
(mainly 10 years) which is within the average remaining years of service of the employees at the time they arise.
Actuarial gains and losses are amortized by the straight-line method over a certain period (mainly 10 years), which is
within the average remaining years of service of the employees at the time when the gains or losses arise, from the fiscal
year following the fiscal year in which it arises.

38
Nitta GelatiN aNNual report 2014
(13) Hedge accountingIn principle, deferral hedge accounting is adopted for hedge transactions. Interest rate swaps are accounted for by the excep-
tional treatment if the interest rate swaps meet certain criteria to adopt the treatment.
The following summarizes hedging derivative instruments used by the Group and items hedged:
2014
Hedging instruments Hedged items
Foreign exchange forward contracts Payables denominated in foreign currencies in connection with imports of raw
materials and forecasted transactions denominated in foreign currencies
Interest rate swaps Loans and debt
2013
Hedging instruments Hedged items
Foreign exchange forward contracts Payables denominated in foreign currencies in connection with imports of raw
materials and forecasted transactions denominated in foreign currencies
Interest rate swaps Loans and debt
As a policy, the Group utilizes derivative transactions within a certain range to hedge market fluctuations in connection with
hedged items in accordance with internal management rules defining authorization policies and transaction limits. The Group
assesses the hedge effectiveness by comparing the accumulated gains or losses on the hedging instruments and the related
hedged items during the period from the commencement of the hedging transactions to the assessment of effectiveness. For
interest rate swaps accounted for by the exceptional treatment, however, the assessment of effectiveness is not performed.
(14) Going public expensesGoing public expenses are charged to income as incurred.
(15) Income taxesIncome taxes are computed based on taxable income of each group company.
Deferred tax assets and liabilities are recognized for the future tax consequences attributable to temporary differences
between the financial statement carrying amounts of existing assets and liabilities and their respective tax bases. Deferred
tax assets and liabilities are measured using enacted tax rates expected to apply to taxable income in the years in which
those temporary differences are expected to be recovered or settled. The effect of deferred tax assets and liabilities due to
the change in tax rate is recognized in the statement of income for the period including the enacted date.
(16) Accounting Change(Application of International Accounting Standards (IAS) 19 Employee Benefits)
Certain overseas affiliate companies started applying IAS 19 Employee Benefits (June 16, 2011) from the year ended March
31, 2014. This change in accounting policy was also applied retroactively to restate results for the fiscal year ended March
31, 2013 in the consolidated financial statements.
As a result, net income for the year ended March 31, 2013 decreased ¥40 million after restatement. Moreover, net
assets as of April 1, 2012 were restated ¥153 million lower to mainly reflect the accumulative impact of this accounting
policy change.
Also net asset per share at the year ended March 31, 2013 decreased ¥15.43 and net income per share for the year
ended March 31, 2013 decreased ¥2.58.
(Application of Accounting Standard for Retirement Benefits, etc.)
The Company has applied the “Accounting Standard for Retirement Benefits” (Accounting Standards Board of Japan (“ASBJ”)
Statement No. 26, issued on May 17, 2012) and “Guidance on Accounting Standard for Retirement Benefits” (ASBJ Guidance
No. 25, issued on May 17, 2012) from the fiscal year ended March 31, 2014 (excluding, however, the stipulations of the
body text of Article 35 of the Retirement Benefit Accounting Standard and the body text of Article 67 of the Retirement
Benefit Accounting Guidance).
Under this accounting standard, the Company has adopted the method of recording unrecognized actuarial gains and
losses and unrecognized prior service costs after tax as a liability for retirement benefits. The Company has also recorded
the amounts of retirement benefit obligations minus pension assets as a liability for retirement benefits.

39
Nitta GelatiNaNNual report 2014
In accordance with the transitional treatment stipulated by Article 37 of the Retirement Benefit Accounting Standard, as of
March 31, 2014, the amounts of the impacts resulting from the application of Retirement Benefit Accounting Standard, etc.,
were added to, or deducted from, Accumulated adjustments for retirement benefit in accumulated other comprehensive income.
As a result, the Company recorded liability for retirement benefits of ¥2,524 million ($24,533 thousand) as of March 31,
2014, and accumulated other comprehensive income was reduced by ¥75 million ($729 thousand), as of the same date.
Also net asset per share as of March 31, 2013 decreased ¥4.12 ($0.04).
Following the application of the Retirement Benefit Accounting Standard, etc., the Company has included pension liability
adjustment of foreign subsidiaries in Accumulated adjustments for retirement benefit on the consolidated balance sheets
and the consolidated statements of changes in net assets from March 31, 2014. Previously, the Company had shown
pension liability adjustment of foreign subsidiaries as a separate account on the consolidated balance sheets and the
consolidated statements of changes in net assets.
(17) New accounting standards(Application of Accounting Standard for Retirement Benefits, etc.)
“Accounting Standard for Retirement Benefit” and “Guidance on Accounting Standard for Retirement Benefit”
1. Outline
These accounting standards were revised with regard to the accounting method for unrecognized actuarial gains and losses
and unrecognized prior service costs, the calculation method of retirement benefit obligations and service costs, and
enhanced disclosures.
2. Scheduled adoption date
The revised method for calculating retirement benefit obligations and service costs is scheduled for adoption from April 1, 2014.
In accordance with the transitional treatment provided for these revised accounting standards, past consolidated finan-
cial statements were not restated.
3. Impact of applying the accounting standard and guidance
The Company is currently evaluating the impact of applying the accounting standard and guidance on financial statements
when the accompanying consolidated financial statements were prepared.
(Application of Accounting Standard for Business Combinations, etc.)
Revised Accounting Standard for Business Combination (ASBJ Statement No. 21, issued on September 13, 2013) and other
related revised standards
1. Outline
The main revisions are as follows.
(1) Gain or loss arising from a change in the parent company’s equity in subsidiaries in cases where control is retained was
revised to a method recognizing them as capital surplus. “Minority interests” in financial statements prior to the account-
ing standard revision will be restated as “non-controlling interests” upon adoption of the revision.
(2) Acquisition costs in connection with business combinations were revised to a method expensing them in the consolidated
fiscal year in which they arise.
(3) In the event that the accounting of a business combination is recognized provisionally in the fiscal year following the combi-
nation, when the consolidated financial statements for that year are disclosed together with the statements from the previ-
ous fiscal year in which the combination took place, the disclosure method was revised to restate the distribution of
acquisition cost due to the provisional recognition in the statements of the fiscal year in which the combination took place.
(4) “Income (loss) before minority interest” in financial statements prior to the accounting standard revision will be restated
as “net income” upon adoption of this revision. In conjunction, “net income” in financial statements prior to the account-
ing standard revision will be restated as “net income attributable to owners of the parent” upon adoption of the revision.
2. Scheduled adoption date
This revised accounting standard is scheduled for adoption from April 1, 2015.
3. Impact of applying the accounting standard
The impact of applying the revised accounting standard had not been ascertained at the time when the accompanying consol-
idated financial statements were prepared.

40
Nitta GelatiN aNNual report 2014
3. Notes Receivable and Notes Payable Maturing at Fiscal Year-EndNotes receivable maturing at the fiscal year-end are settled on the date of clearance. As March 31, 2013 was a bank holiday,
the following notes receivable were included in the balances as of March 31, 2014 and 2013.
Millions of yen
2014 2013
Notes receivable ¥– ¥106
4. InventoriesThe balances of inventories as of March 31, 2014 and 2013 consisted of the following:
Millions of yenThousands of U.S. dollars
2014 2013 2014
Merchandise and finished goods ¥4,732 ¥4,404 $45,995Work in process 1,089 918 10,585Raw materials and supplies 1,820 1,508 17,690
Inventories, total ¥7,642 ¥6,831 $74,280
The inventory write-down of ¥(28) million ($(272) thousand) and ¥39 million were recorded in cost of sales for the years
ended March 31, 2014 and 2013, respectively, due to decline in profitability.
5. Investment SecuritiesInformation of available-for-securities as of March 31, 2014 and 2013 was as follows:
Millions of yen
2014 2013
Carrying valueAcquisition
cost Difference Carrying valueAcquisition
cost Difference
Securities whose carrying value
exceeds their acquisition cost:Equity securities ¥1,194 ¥227 ¥966 ¥ 977 ¥201 ¥775
Securities whose carrying value does
not exceed their acquisition cost:Equity securities 5 6 (1) 29 30 (1)Total ¥1,199 ¥234 ¥965 ¥1,006 ¥232 ¥774
Thousands of U.S. dollars
2014
Carrying valueAcquisition
cost Difference
Securities whose carrying value
exceeds their acquisition cost:Equity securities $11,605 $2,206 $9,389
Securities whose carrying value does
not exceed their acquisition cost:Equity securities 48 58 (9)Total $11,654 $2,274 $9,379
Unlisted equity securities of ¥18 million ($174 thousand) as of March 31, 2014 and 2013 were not included in the
above tables as there were no market prices available and it is extremely difficult to determine their fair value.
Investments in unconsolidated subsidiaries and affiliates of ¥1,857 million ($18,050 thousand) and ¥1,743 million were
included in investment securities as of March 31, 2014 and 2013, respectively.

41
Nitta GelatiNaNNual report 2014
Impairment losses on available-for-sale securities with fair market value are recognized if the available fair market value
declined by 50% or more from the acquisition cost or when the fair market value declined of 30% to 50% and the decline was
considered not recoverable.
The impairment losses on available-for-sale securities for the year ended March 31, 2013 were ¥12 million.
6. Short-Term Loans Payable, Long-Term Debt, Bonds and Lease Obligations
Millions of yen Millions of yenThousands of U.S. dollars
2014 2013 2014
Amount
Weighted average
interest rate (%) Due Amount Amount
Current portion of long-term debt ¥ 1,932 1.536% – ¥ 2,068 $ 18,779Lease obligations (current portion) 215 – – 154 2,089Long-term debt excluding
current portion 4,415 1.834 2015 to 2021 3,142 42,914Lease obligations excluding
current portion 495 – 2015 to 2022 319 4,811No. 16 unsecured corporate bonds – 1.82 Aug. 2013 200 –
7,060 5,884 68,623Less: Current portion (2,148) (2,422) (20,878)
¥ 4,911 ¥ 3,461 $ 47,735
The weighted average interest rate of short-term loans payable at March 31, 2014 was 2.460%. Average interest rate on
lease obligations is not provided because the balance of lease obligations includes interest equivalent that is contained in
the total lease payments.
The maturities of bonds, long-term debt and lease obligations outstanding on or after April 1, 2014 were as follows:
Millions of yen Thousands of U.S. dollars
Year ending March 31, Long-term debt Lease obligations Long-term debt Lease obligations
2015 ¥1,932 ¥215 $18,779 $2,0892016 1,520 192 14,774 1,8662017 1,220 144 11,858 1,3992018 741 112 7,202 1,0882019 and thereafter 933 46 9,068 447
Total ¥6,348 ¥711 $61,702 $6,910
The following assets were pledged as collateral as of March 31, 2014 and 2013.
Millions of yenThousands of U.S. dollars
2014 2013 2014
Buildings and structures ¥1,203 ¥1,199 $11,693Machinery, equipment and vehicles 81 122 787Land 191 191 1,856Investment securities 213 373 2,070
Total ¥1,689 ¥1,886 $16,417Assets pledged as factory foundation mortgage included
in the above assets:Buildings and structures ¥1,203 ¥1,199 $11,693Machinery, equipment and vehicles 81 122 787Land 191 191 1,856Total ¥1,475 ¥1,513 $14,337

42
Nitta GelatiN aNNual report 2014
The obligations collateralized by the above assets as of March 31, 2014 and 2013 were as follows:
Millions of yenThousands of U.S. dollars
2014 2013 2014
Long-term debt ¥3,214 ¥3,733 $31,240Factory foundation mortgage included in the above liabilities:
Long-term debt ¥2,920 ¥3,277 $28,382
For the purpose of obtaining working funds effectively, the Company and one consolidated subsidiary have entered into
overdraft agreements and loan commitment agreements amounting to ¥4,950 million ($48,114 thousand) in total with five
banks at March 31, 2014 and 2013. There was no borrowing outstanding under these agreements as of March 31, 2014
and 2013.
7. Income TaxesIncome taxes applicable to the Company and its domestic consolidated subsidiaries comprise corporation, inhabitants and
enterprise taxes. The statutory tax rate applicable to the Company was approximately 38.01% for the years ended March 31,
2014 and 2013. For the years ended March 31, 2013, reconciliations between the statutory income tax rate and the effec-
tive income tax rate as a percentage of income are as follows:
2013
Statutory tax rate 38.01%Adjustments for:
Non-deductible expenses for income tax purposes 0.77Non-taxable income (0.38)Inhabitants taxes—per capita levy 0.24Tax credit for research and development, etc. (2.39)Unrecognized tax benefits of net operating losses of subsidiaries (9.99)Difference in tax rates between the Company and subsidiaries (1.46)Equity in earnings of affiliates (5.21)Effect of change in accounting policy applied retroactively 1.38Other 0.08
Effective tax rates 21.06%
For the years ended March 31, 2014, reconciliations between the statutory income tax rate and the effective income tax
rate as a percentage of income are omitted since the difference between the statutory income tax rate and the effective
income tax rate is less than 5% of the statutory income tax rate.

43
Nitta GelatiNaNNual report 2014
The significant components of deferred tax assets and liabilities at March 31, 2014 and 2013 were as follows:
Millions of yenThousands of U.S. dollars
2014 2013 2014
Deferred tax assets:Loss on valuation of inventories ¥ 47 ¥ 48 $ 456Unrealized profit 38 19 369Provision for bonuses 72 70 699Accrued enterprise tax 15 12 145Loss on valuation of golf club membership 1 1 9Loss on valuation of investment securities 249 250 2,420Provision for retirement benefits – 843 –Liability for retirement benefits 851 – 8,271Provision for directors’ retirement benefits 29 28 281Interest expenses 23 9 223Impairment loss 29 29 281Net loss carried forward 752 853 7,309Other 50 47 486
Subtotal 2,162 2,215 21,014Valuation allowance (996) (959) (9,681)
Total deferred tax assets 1,165 1,256 11,323Deferred tax liabilities:
Depreciation (235) (245) (2,284)
Valuation difference on available-for-sale securities (342) (274) (3,324)Provision for retirement benefits – (64) –Asset for retirement benefits (34) – (330)Other – (15) –
Total deferred tax liabilities (611) (601) (5,938)Net deferred tax assets ¥ 553 ¥ 655 $ 5,375
Following the promulgation on March 31, 2014 of the “Act for Partial Revision of the Income Tax Act etc.,” the Special
Reconstruction Corporation Tax will not be imposed for the fiscal years beginning on or after April 1, 2014.
In line with these changes the effective statutory tax rate used to measure deferred tax assets and liabilities as of March
31, 2014 was changed from approximately 38.0% to 35.6% for temporary differences expected to be utilized in the fiscal
years beginning on or after April 1, 2014.
As a result, total deferred tax assets (excluding the amount of deferred tax liabilities) as of March 31, 2014 decreased by
¥7 million ($68 thousand), and income taxes for the fiscal year ended March 31, 2014 increased by ¥7 million ($68 thousand).
8. Retirement Benefit Plans(For the year ended March 31, 2014)
The Company and certain consolidated subsidiaries have defined benefit plans and defined contribution plans for
employees’ retirement benefits. Defined benefit plans are composed of lump-sum payment plans and defined benefit
corporate pension plans.
The lump-sum payment plans which certain consolidated subsidiaries have are calculated using the simplified account-
ing method.

44
Nitta GelatiN aNNual report 2014
(1) Defined benefit plans including plan applied simplified method(a) Retirement benefit obligations
Millions of yenThousands of U.S. dollars
2014 2014
Retirement benefit obligations:Balance at beginning of year ¥7,632 $74,183
Service cost 179 1,739Interest cost 259 2,517Actuarial gains and losses 372 3,615Benefits paid (357) (3,470)Foreign currency translation adjustment 293 2,847
Balance at end of year ¥8,379 $81,444
(b) Plan assets
Millions of yenThousands of U.S. dollars
2014 2014
Plan assets:Balance at beginning of year ¥5,458 $53,052
Expected return on plan assets 253 2,459Administrative fees (23) (223)Actuarial gains and losses 255 2,478Contribution paid by the employer 172 1,671Contribution paid by the employees 2 19Benefits paid (249) (2,420)Foreign currency translation adjustment 238 2,313
Balance at end of year ¥6,107 $59,360
(c) Reconciliation from retirement benefit obligations and assets to liability (assets) for retirement benefits
Millions of yenThousands of U.S. dollars
2014 2014
Funded retirement benefit obligations ¥ 6,527 $ 63,442Plan assets (6,107) (59,360)
419 4,072Unfunded retirement benefit obligations 1,851 17,991Total Net liability (asset) for retirement benefits ¥ 2,271 $ 22,074Liability for retirement benefits ¥ 2,524 $ 24,533Asset for retirement benefits (253) (2,459)Total Net liability (asset) for retirement benefits ¥ 2,271 $ 22,074
(d) Retirement benefit costs
Millions of yenThousands of U.S. dollars
2014 2014
Service cost ¥ 179 $ 1,739Interest cost 259 2,517Expected return on plan assets (253) (2,459)Administrative fees 23 223Amortization of actuarial gains and losses 75 729Amortization of prior service benefit and cost (13) (126)Total Retirement benefit costs ¥ 270 $ 2,624
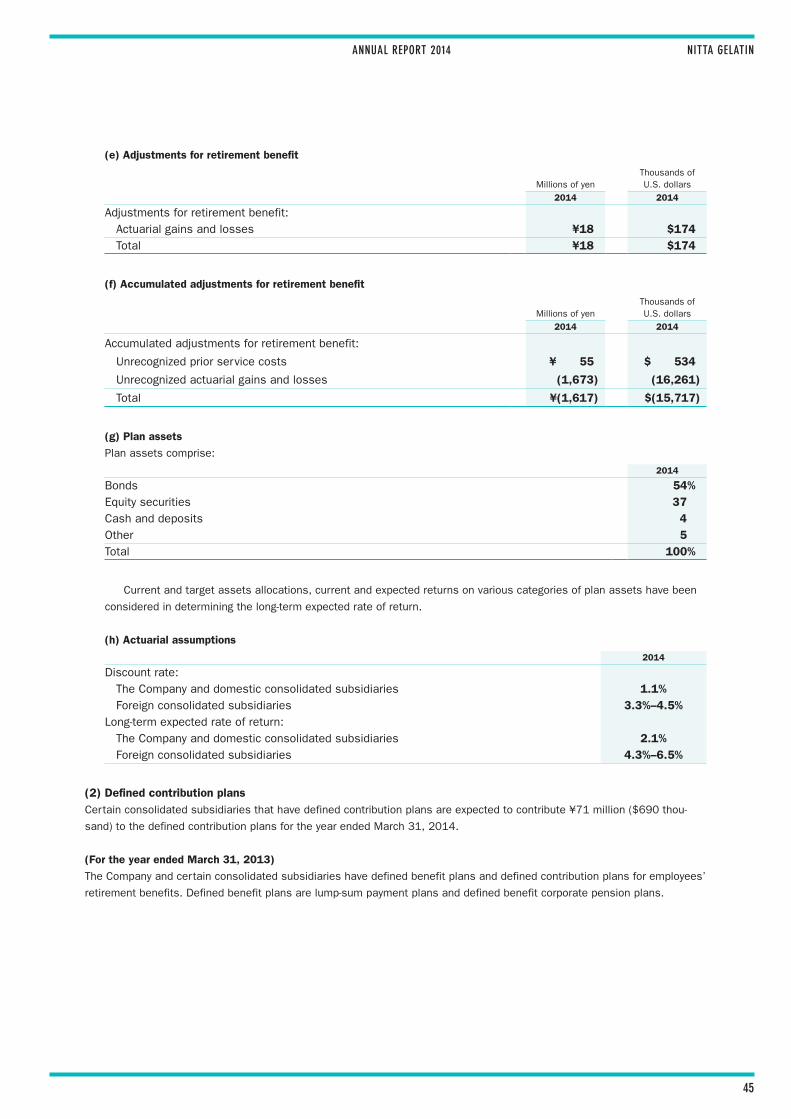
45
Nitta GelatiNaNNual report 2014
(e) Adjustments for retirement benefit
Millions of yenThousands of U.S. dollars
2014 2014
Adjustments for retirement benefit:Actuarial gains and losses ¥18 $174Total ¥18 $174
(f) Accumulated adjustments for retirement benefit
Millions of yenThousands of U.S. dollars
2014 2014
Accumulated adjustments for retirement benefit:
Unrecognized prior service costs ¥ 55 $ 534
Unrecognized actuarial gains and losses (1,673) (16,261)
Total ¥(1,617) $(15,717)
(g) Plan assets
Plan assets comprise:
2014
Bonds 54%Equity securities 37Cash and deposits 4Other 5Total 100%
Current and target assets allocations, current and expected returns on various categories of plan assets have been
considered in determining the long-term expected rate of return.
(h) Actuarial assumptions
2014
Discount rate:The Company and domestic consolidated subsidiaries 1.1%Foreign consolidated subsidiaries 3.3%–4.5%
Long-term expected rate of return:The Company and domestic consolidated subsidiaries 2.1%Foreign consolidated subsidiaries 4.3%–6.5%
(2) Defined contribution plansCertain consolidated subsidiaries that have defined contribution plans are expected to contribute ¥71 million ($690 thou-
sand) to the defined contribution plans for the year ended March 31, 2014.
(For the year ended March 31, 2013)
The Company and certain consolidated subsidiaries have defined benefit plans and defined contribution plans for employees’
retirement benefits. Defined benefit plans are lump-sum payment plans and defined benefit corporate pension plans.

46
Nitta GelatiN aNNual report 2014
The following table sets forth the funded and accrued status of the plans and the amounts recognized in the consoli-
dated balance sheets as of March 31, 2013 for the Company’s and the consolidated subsidiaries’ defined benefit plans.
Millions of yen
2013
Retirement benefit obligation ¥(7,632)
Plan assets at fair value 5,458
Unfunded retirement benefit obligation (2,173)
Unrecognized actuarial loss (6)
Unrecognized prior service benefit and cost (69)
Net retirement benefit obligation (2,249)
Prepaid pension cost 27
Provision for retirement benefits ¥(2,276)
Note: Certain consolidated subsidiaries apply the simplified method in calculating retirement benefit obligation.
The components of retirement benefit expenses for the years ended March 31, 2013 were outlined as follows:
Millions of yen
2013
Service cost (Note 1) ¥ 166
Interest cost 243
Administrative fees 6
Expected return on plan assets (227)
Amortization of actuarial loss 77
Amortization of prior service benefit and cost (24)
Other (Note 2) 52
Retirement benefit expenses ¥ 295
Note 1: Retirement benefit expenses of consolidated subsidiaries which apply the simplified method are included in “Service cost.”
Note 2: “Other” includes contributions to the defined contribution plans.
Both discount rates and expected rates of return on plan assets used in calculation of retirement benefit obligations for
the years ended March 31, 2013 were mainly 2.10%.
9. Leases(1) Finance leases (lessee)The Company leases production facilities (machinery, equipment and vehicles) in connection with collagen material business
as a lessee through finance lease transactions that do not transfer ownership of the leased property to the lessee. Finance
leases that do not transfer ownership of the leased property to the lessee and commenced on or before March 31, 2008 are
accounted for as operating leases.
The following pro forma amounts represent the acquisition cost, accumulated depreciation and net book value of the
leased properties as of March 31, 2013, which would be reflected in the consolidated financial statements if the finance
lease accounting was applied to the finance leases currently accounted for as operating leases.
Millions of yen
2013
Acquisition costAccumulated depreciation Net book value
Machinery, equipment and vehicles ¥240 ¥197 ¥42Total ¥240 ¥197 ¥42

47
Nitta GelatiNaNNual report 2014
Lease payments relating to finance leases accounted for as operating leases and the pro forma depreciation expenses
and interest expenses relating to assets leased under finance leases accounted for as operating leases for the years ended
March 31, 2014 and 2013 were as follows:
Millions of yenThousands of U.S. dollars
2014 2013 2014
Lease payments ¥20 ¥66 $194Depreciation expenses 17 56 165Interest expenses 0 4 0
The pro forma depreciation expenses are computed by the straight-line method over the lease term with no residual value
(residual value guarantee amount if it is agreed), and the pro forma interest expenses are computed by the interest method.
There were no impairment losses allocated to lease assets for the years ended March 31, 2014 and 2013.
(2) Operating LeasesFuture minimum lease payments subsequent to March 31, 2014 for non-cancelable operating leases were as follows:
Year ending March 31, Millions of yenThousands of U.S. dollars
2015 ¥313 $3,0422016 and thereafter 153 1,487Total ¥467 $4,539
10. Financial Instruments(1) Overview
(a) Policy for financial instruments
In consideration of plans for capital investment, the Group raises necessary funds mainly through bank borrowings. The
Group invests temporary surplus funds mainly in highly liquid financial assets and raises short-term operating capital
through bank borrowings. The Group uses derivatives to avoid after-mentioned risks and does not enter into derivatives
for speculative purposes.
(b) Descriptions of financial instruments and related risk
Trade receivables such as notes and accounts receivable are exposed to customer credit risk. Although trade receivables
denominated in foreign currencies arising from foreign operations are exposed to foreign currency risk, the balances of
receivables are always less than payables denominated in the same currencies.
Investment securities are mainly composed of equity securities of companies with business relationship and are
exposed to market risk. The Company also provides long-term loans to companies with business relationship.
Substantially all trade payables such as notes and accounts payable have payment due dates within five months.
Although certain payables denominated in foreign currencies are exposed to foreign currency risk, such risk is hedged by
foreign exchange forward contracts except for payables less than receivables denominated in the same currencies.
Long-term debt, bonds and lease obligations under finance leases are principally for the purpose of making capital
investments and due up to seven years from the balance sheet date. Although certain of them are exposed to interest
rate fluctuation risk, such risk is hedged by derivatives (interest rate swaps).
As for derivatives, the Group has entered into foreign exchange forward contracts to hedge the foreign currency risk
arising from trade payables denominated in foreign currencies and interest rate swap transactions to hedge fluctuation
risk deriving from interest payments of long-term debt.
Information regarding the method of hedge accounting, hedging instruments and hedged items, hedging policy and
assessment of hedge effectiveness is disclosed in Note 2. “Significant Accounting Policies (13) Hedge accounting.”

48
Nitta GelatiN aNNual report 2014
(c) Risk management for financial instruments
Credit risk management (risk of default by customers or counterparties)
In accordance with the credit management rules of the Company, for trade receivables and long-term loans receivable,
sales departments of each division monitor credit worthiness of their main customers periodically and manage due dates
and outstanding balances by customer. In addition, the Company is making efforts to identify uncollectibility in the earlier
stage and mitigate risks of bad debts from customers having financial difficulties. Consolidated subsidiaries similarly
manage such risks in accordance with the Company’s credit management rules.
The Company believes that the credit risk of derivatives is insignificant as it has entered into derivative transactions
only with financial institutions with a sound credit rating.
Market risk management (risks of fluctuations in foreign exchange rates, interest rates and others)
For trade payables denominated in foreign currencies, the foreign currency risk of the Company identified by currency on
a monthly basis is hedged by foreign exchange forward contracts. In addition, in order to mitigate the interest rate risk
for interest payments of long-term debt, the Company has entered into interest rate swap transactions.
For investment securities, the Company periodically monitors the fair values and the financial position of the issuers
(companies with business relationship) and continuously reviews the holding status taking into account market condi-
tions and relationships with the issuers.
Derivative transactions are conducted and managed by the responsible division with the approval of authorized person-
nel in accordance with the internal management rules which define the authorization policies and transaction limits.
Consolidated subsidiaries have not entered into derivative transactions.
Management of liquidity risk on funding (risk of default at due dates)
Based on reports from each division, the responsible division of the Company prepares and updates its cash flow plan
on a timely basis and manages liquidity risk by maintaining liquid funds. Consolidated subsidiaries manage their liquidity
risk in a similar manner.
(d) Supplementary explanation of the fair value of financial instruments
The fair value of financial instruments is based on their market price if available. When there is no market price available,
fair value is reasonably calculated. Since various assumptions and factors are reflected in the calculation of fair value,
different assumptions and factors could result in different fair value. In addition, the notional amounts of derivatives in
Note 11. “Derivative Transactions” are not indicative of the market risk involved in derivative transactions.
(2) Fair value of financial instrumentsCarrying value of financial instruments on the consolidated balance sheets as of March 31, 2014 and 2013, fair value and
their difference are shown in the following table. Financial instruments whose fair value is extremely difficult to determine are
not included in the following table.
Millions of yen
2014
Carrying value Fair value Difference
Cash and deposits ¥ 2,426 ¥ 2,426 ¥ –Notes and accounts receivable 8,164 8,164 –Investment securities 1,199 1,199 –
Total assets ¥11,790 ¥11,790 ¥ –Notes and accounts payable 4,255 4,255 –Other payable 1,747 1,747 –Long-term debt (including its current portion) 6,348 6,359 10
Total liabilities ¥12,352 ¥12,362 ¥10Derivative transactions(*) ¥ 8 ¥ 8 ¥ –(*) The value of assets and liabilities arising from derivative transactions is shown at net value.
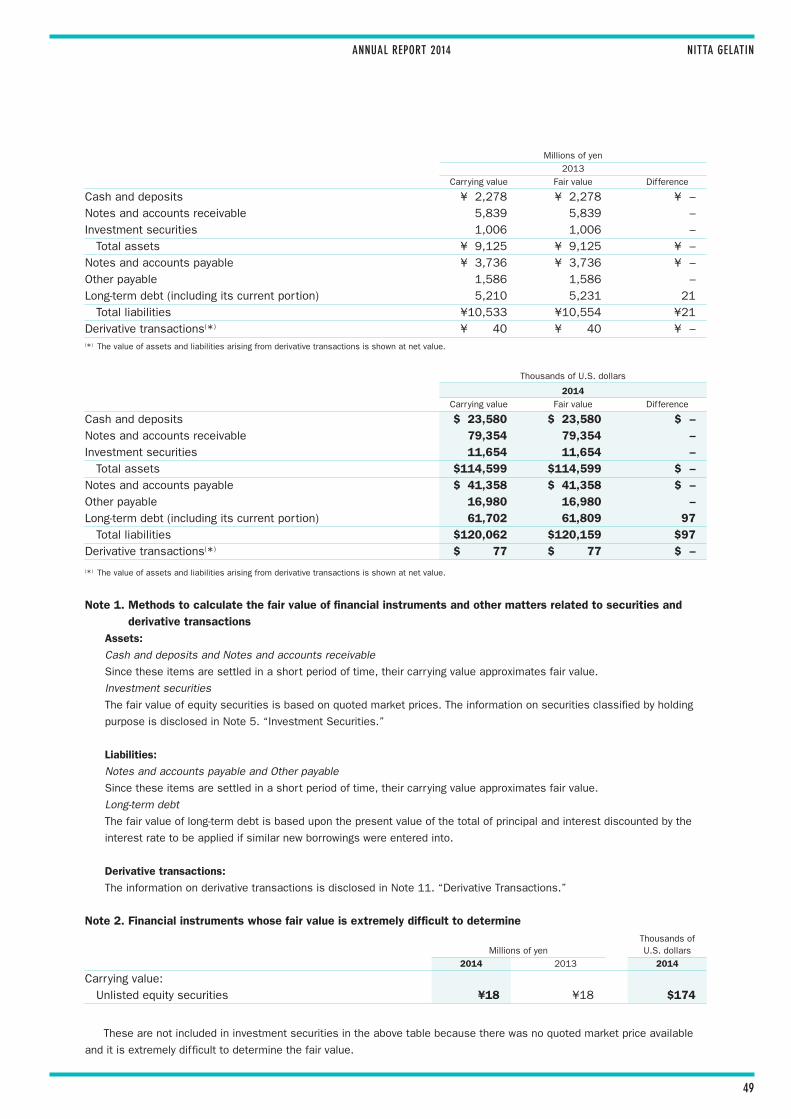
49
Nitta GelatiNaNNual report 2014
Millions of yen
2013
Carrying value Fair value Difference
Cash and deposits ¥ 2,278 ¥ 2,278 ¥ –Notes and accounts receivable 5,839 5,839 –Investment securities 1,006 1,006 –
Total assets ¥ 9,125 ¥ 9,125 ¥ –Notes and accounts payable ¥ 3,736 ¥ 3,736 ¥ –Other payable 1,586 1,586 –Long-term debt (including its current portion) 5,210 5,231 21
Total liabilities ¥10,533 ¥10,554 ¥21Derivative transactions(*) ¥ 40 ¥ 40 ¥ –(*) The value of assets and liabilities arising from derivative transactions is shown at net value.
Thousands of U.S. dollars
2014
Carrying value Fair value Difference
Cash and deposits $ 23,580 $ 23,580 $ –Notes and accounts receivable 79,354 79,354 –Investment securities 11,654 11,654 –
Total assets $114,599 $114,599 $ –Notes and accounts payable $ 41,358 $ 41,358 $ –Other payable 16,980 16,980 –Long-term debt (including its current portion) 61,702 61,809 97
Total liabilities $120,062 $120,159 $97Derivative transactions(*) $ 77 $ 77 $ –
(*) The value of assets and liabilities arising from derivative transactions is shown at net value.
Note 1. Methods to calculate the fair value of financial instruments and other matters related to securities and derivative transactions
Assets:
Cash and deposits and Notes and accounts receivable
Since these items are settled in a short period of time, their carrying value approximates fair value.
Investment securities
The fair value of equity securities is based on quoted market prices. The information on securities classified by holding
purpose is disclosed in Note 5. “Investment Securities.”
Liabilities:
Notes and accounts payable and Other payable
Since these items are settled in a short period of time, their carrying value approximates fair value.
Long-term debt
The fair value of long-term debt is based upon the present value of the total of principal and interest discounted by the
interest rate to be applied if similar new borrowings were entered into.
Derivative transactions:
The information on derivative transactions is disclosed in Note 11. “Derivative Transactions.”
Note 2. Financial instruments whose fair value is extremely difficult to determine
Millions of yenThousands of U.S. dollars
2014 2013 2014
Carrying value:Unlisted equity securities ¥18 ¥18 $174
These are not included in investment securities in the above table because there was no quoted market price available
and it is extremely difficult to determine the fair value.

50
Nitta GelatiN aNNual report 2014
(3) As of March 31, 2014 and 2013, monetary receivables with maturities were deposits of ¥2,422 million ($23,541 thou-
sand) and ¥2,275 million and notes and accounts receivable of ¥8,164 million ($79,354 thousand) and ¥5,839 million,
respectively. These were all due within one year.
11. Derivative TransactionsThe hedge accounting has been applied to all derivative transactions held by the Group as of March 31, 2014 and 2013, and
their fair value information is stated as follows. Fair value is measured based on quotes and prices provided by counterparty
financial institutions.
Currency related:Millions of yen
2014 2013
Contract or notional amount
Maturing after one year Fair value
Contract or notional amount
Maturing after one year Fair value
Deferral hedge accountingForeign exchange forward
contractsBuy: USD and CAD ¥533 ¥– ¥(8) ¥248 ¥– ¥41
Thousands of U.S. dollars
2014
Contract or notional amount
Maturing after one year Fair value
Deferral hedge accountingForeign exchange forward
contractsBuy: USD and CAD $5,180 $– $(77)
Interest related:Millions of yen
2014 2013
Contract or notional amount
Maturing after one year Fair value
Contract or notional amount
Maturing after one year Fair value
Deferral hedge accountingInterest rate swaps
Receive/floating and
pay/fixed ¥ – ¥ – ¥– ¥1,500 ¥ – ¥(1)Exceptional treatment
Interest rate swapsReceive/floating and
pay/fixed 2,050 ¥123 (*) 1,950 ¥290 (*)
Thousands of U.S. dollars
2014
Contract or notional amount
Maturing after one year Fair value
Deferral hedge accountingInterest rate swaps
Receive/floating and
pay/fixed $ – $ – $–Exceptional treatment
Interest rate swapsReceive/floating and
pay/fixed 19,926 1,195 (*)
(*) Interest rate swaps to which the exceptional treatment is applied are accounted for together with long-term debt designated as a hedged item. Therefore, their
fair value is included in the fair value of long-term debt.

51
Nitta GelatiNaNNual report 2014
12. Contingent LiabilitiesAs of March 31, 2013, the Group was contingently liable for the assignment of receivable with recourse in the amount of
¥475 million.
13. Selling, General and Administrative ExpensesThe main components of selling, general and administrative expenses for the years ended March 31, 2014 and 2013 were
as follows:
Millions of yenThousands of U.S. dollars
2014 2013 2014
Packing and freightage expenses ¥ 822 ¥ 740 $ 7,989Salaries 1,305 1,138 12,684Bonuses 205 236 1,992Provision for bonuses 60 61 583Retirement benefit costs 74 81 719Provision for directors’ retirement benefits 1 1 9Provision of allowance for doubtful accounts 3 4 29Depreciation 86 78 835Research and development expenses 814 793 7,912
For the years ended March 31, 2014 and 2013, research and development expenses included in general and administra-
tive expenses and manufacturing costs were ¥1,004 million ($9,758 thousand) and ¥1,026 million, respectively.
14. Information on Related Party TransactionsTransactions of the Company with affiliates for the year ended March 31, 2014 were as follows:
Name Paid in capital Principal business Ownership ratioDescription of transaction
Millions of yen
Thousands of U.S. dollars
Guangdong Baiwei Bio Material Co., Ltd. (Guangdong, China)
(Thousands of RMB)67,600
Manufacture of collagen peptido
Direct 44.6% Subscription of capital stock
¥142 $1,380
Transactions of the Company with affiliates for the year ended March 31, 2013 were as follows:
Name Paid in capital Principal business Ownership ratioDescription of transaction
Millions of yen
Reva Proteins Ltd.
(Gujarat, India)
(Thousands of rupees)
405,675
Manufacture of
ossein
Direct 25.4%
Indirect 34.6%
Subscription of
capital stock
¥196
For the years ended March 31, 2014 and 2013, significant affiliates were Nitta Gelatin India Ltd. and Bostik-Nitta Co.,
Ltd., and the condensed financial information prepared by combining the financial statements of these significant affiliates
was as follows:
Millions of yenThousands of U.S. dollars
2014 2013 2014
Total current assets ¥2,938 ¥3,371 $28,557Total noncurrent assets 2,111 1,599 20,519
Total current liabilities 1,922 1,837 18,681Total noncurrent liabilities 262 142 2,546
Total net assets 2,864 2,990 27,838
Net sales 8,040 7,849 78,149Income before income taxes 327 1,189 3,178Net income 185 747 1,798

52
Nitta GelatiN aNNual report 2014
15. Shareholders’ EquityThe Companies Act of Japan provides that an amount equivalent to 10% of the amount of deduction from surplus as a result
of the payment of dividends shall be recorded as additional paid-in capital (a component of capital surplus) or legal reserve
(a component of retained earnings) on the dividend date until the total of additional paid-in capital and legal reserve equals
25% of the capital stock account.
Such distributions can be made at any time by resolution of the shareholders’ meeting or the board of directors if certain
conditions are met.
Changes in total number of shares of capital stock issued for the years ended March 31, 2014 and 2013 were as follows:
As of March 31, 2012 Increase/(decrease) 2013 Increase/(decrease) 2014
Issued:Common stock 15,770,074 – 15,770,074 2,603,900 18,373,974
Total 15,770,074 – 15,770,074 – 18,373,974
Treasury stock:Common stock 162 – 162 – 162
For the year ended March 31, 2014, the increase in the number of issued shares of common stock was due to issuance
of new shares by public offering, the payment date of which was July 29, 2013 (2,400,000 shares) and issuance of new
shares by third-party allotment, the payment date of which was August 28, 2013 (203,900 shares).
16. Information Related to Consolidated Statements of Changes in Net Assets(1) Dividends paid to shareholders
2014
Resolution Type of sharesAmount
(Millions of yen)
Amount (Thousands of U.S. dollars)
Amount per share (Yen)
Amount per share
(U.S. dollars) Record date Effective date
June 26, 2013 Annual general meet-ing of shareholders
Common stock
¥126 $1,224 ¥8.00 $0.07March 31, 2013
June 27, 2013
November 5, 2013 Board of directors
Common stock
110 1,069 6.00 0.05September 30, 2013
December 6, 2013
2013
Resolution Type of sharesAmount
(Millions of yen)Amount per share (Yen) Record date Effective date
June 27, 2012
Annual general meet-
ing of shareholders
Common
stock¥126 ¥8.00
March 31,
2012
June 28,
2012
November 9, 2012
Board of directors
Common
stock94 6.00
September
30, 2012
December 7,
2012

53
Nitta GelatiNaNNual report 2014
(2) Dividends with a record date during the fiscal year but an effective date subsequent to the fiscal year
2014
Resolution Type of sharesAmount
(Millions of yen)
Amount (Thousands of U.S. dollars) Paid from
Amount per share
(Yen)
Amount per share
(U.S. dollars) Record date Effective date
June 26, 2014 Annual general meeting of shareholders
Common stock
¥110 $1,069Retained earnings
¥6.00 $0.05March 31, 2014
June 27, 2014
2013
Resolution Type of sharesAmount
(Millions of yen) Paid from
Amount per share
(Yen) Record date Effective date
June 26, 2013
Annual general
meeting of
shareholders
Common
stock¥126
Retained
earnings¥8.00
March 31,
2013
June 27,
2013
17. Amounts per ShareNet assets per share is computed based on net assets available for distribution to the shareholders of common stock and
the number of shares of common stock outstanding at the year-end.
Net income per share is computed based on the net income available to shareholders of common stock and weighted
average number of shares of common stock outstanding during the period which was 17,556,927 shares and 15,769,912
shares for the years ended March 31, 2014 and 2013, respectively.
Yen U.S. dollars
2014 2013 2014
Net assets per share ¥742.20 ¥607.31 $7.21Net income per share 37.90 96.72 0.36
Diluted net income per share is not disclosed due to the absence of dilutive shares for the years ended March 31, 2014
and 2013.
Certain overseas affiliate companies started applying IAS 19 Employee Benefits (June 16, 2011) from the year ended
March 31, 2014. This change in accounting policy was also applied retroactively to restate results for the fiscal year ended
March 31, 2013 in the consolidated financial statements.
18. Cash Flow InformationReconciliations between cash and cash equivalents in the consolidated statements of cash flows for the years ended
March 31, 2014 and 2013 and cash and deposits in the consolidated balance sheets as of March 31, 2014 and 2013
were as follows:
Millions of yenThousands of U.S. dollars
2014 2013 2014
Cash and deposits ¥2,426 ¥2,278 $23,580Time deposits with a maturity in excess of three months (20) (20) (194)Cash and cash equivalents ¥2,406 ¥2,258 $23,386

54
Nitta GelatiN aNNual report 2014
19. Comprehensive IncomeReclassification adjustments and income tax benefit (expense) on components of other comprehensive income for the year
ended March 31, 2014 and 2013 were as follows:
Millions of yenThousands of U.S. dollars
2014 2013 2014
Valuation difference on available-for-sale securities:Losses arising during the period ¥191 ¥ 117 $1,856Reclassification adjustments (0) 12 (0)
Pre-tax amount 191 129 1,856Income tax benefit (68) (46) (660)Valuation difference on available-for-sale securities 123 83 1,195
Deferred gains or losses on hedges:Losses arising during the period (15) 75 (145)Reclassification adjustments – 4 –Adjustments to acquisition cost of assets (33) (52) (320)
Pre-tax amount (49) 27 (476)Income tax expense 18 (10) 174Deferred gains or losses on hedges (30) 17 (291)
Foreign currency translation adjustment:Losses arising during the period 388 600 3,771
Pension liability adjustment of foreign subsidiaries:Losses arising during the period (58) (461) (563)Reclassification adjustments 77 51 748
Pre-tax amount 18 (409) 174Income tax expense (30) 14 (291)Pension liability adjustment of foreign subsidiaries (11) (395) (106)
Share of other comprehensive income of associates
accounted for using equity method:Losses arising during the period 53 95 515Reclassification adjustments 52 – 505
Share of other comprehensive income of associates
accounted for using equity method 105 95 1,020Total other comprehensive income ¥575 ¥ 401 $5,589
20. Segment Information(1) Overview of reportable segmentReportable segments are defined as a component of the Group for which separate financial information is available and
whose operating results are regularly evaluated by the board of directors to make decisions about how resources are allo-
cated among the Group and assess its performance.
The Group plans comprehensive domestic and overseas strategies for its products and services and develops business
activities based on business segments by product and service.
Accordingly, the Group consists of two segments by product and service based on the business activities as follows:
“Collagen material business” produces gelatin, collagen peptide, collagen casings and others.
“Formula solution business” produces various materials for foods, adhesives and others.
(2) Basis of measurement for the amounts of net sales, profit, assets and other items by reportable segmentThe accounting policies of each reportable segment are consistent with those disclosed in Note 2. “Significant Accounting
Policies.” Segment profit is based on operating income, and intersegment sales and transfers are based on actual market prices.
(Application of IAS 19 Employee Benefits)
Certain overseas affiliate companies started applying IAS 19 Employee Benefits (June 16, 2011) from the year ended March
31, 2014. This change in accounting policy was also applied retroactively to restate results for the fiscal year ended March
31, 2013 in the consolidated financial statements.

55
Nitta GelatiNaNNual report 2014
As a result, segment profit of Collagen material business for the year ended March 31, 2013 decreased ¥23 million
after restatement.
(3) Information about net sales, profit, assets and other items by reportable segment
Millions of yen
2014
Collagen material business
Formula solution business Total Reconciliation(Note 1)
Amounts on consolidated
financial statements(Note 2)
Net sales:Sales to third parties ¥22,436 ¥10,377 ¥32,814 ¥ – ¥32,814Intersegment sales and transfers 1,487 – 1,487 (1,487) –
Total 23,923 10,377 34,301 (1,487) 32,814Segment profit 1,420 920 2,340 (1,384) 955Segment assets 23,327 5,791 29,118 2,271 31,389
Other items:Depreciation and amortization 808 70 878 35 914Increase in property, plant and
equipment and intangible assets 2,845 229 3,075 27 3,102
Millions of yen
2013
Collagen material business
Formula solution business Total Reconciliation(Note 1)
Amounts on consolidated
financial statements(Note 2)
Net sales:Sales to third parties ¥18,674 ¥10,097 ¥28,772 ¥ – ¥28,772Intersegment sales and transfers 1,304 – 1,304 (1,304) –
Total 19,979 10,097 30,076 (1,304) 28,772Segment profit 1,794 1,151 2,945 (1,349) 1,595Segment assets 18,370 4,528 22,899 2,290 25,190
Other items:Depreciation and amortization 721 72 793 31 825Increase in property, plant and
equipment and intangible assets 1,229 73 1,302 124 1,426
Thousands of U.S. dollars
2014
Collagen material business
Formula solution business Total Reconciliation(Note 1)
Amounts on consolidated
financial statements(Note 2)
Net sales:Sales to third parties $218,079 $100,865 $318,954 $ – $318,954Intersegment sales and transfers 14,453 – 14,453 (14,453) –
Total 232,533 100,865 333,407 (14,453) 318,954Segment profit 13,802 8,942 22,744 (13,452) 9,282Segment assets 226,739 56,288 283,028 22,074 305,103
Other items:Depreciation and amortization 7,853 680 8,534 340 8,884Increase in property, plant and
equipment and intangible assets 27,653 2,225 29,889 262 30,151

56
Nitta GelatiN aNNual report 2014
Note 1. “Reconciliation” included the following:
Millions of yenThousands of U.S. dollars
2014 2013 2014
Segment profit:Intersegment elimination ¥ 3 ¥ 2 $ 29Corporate expense(*) (1,387) (1,352) (13,481)
Total ¥(1,384) ¥(1,349) $(13,452)
(*) “Corporate expense” presents mainly general and administrative expenses that are not allocated to reportable segments.
Millions of yenThousands of U.S. dollars
2014 2013 2014
Segment assets:Intersegment elimination ¥ (567) ¥ (458) $ (5,511)Corporate assets(*) 2,838 2,749 27,585
Total ¥2,271 ¥2,290 $22,074
(*) “Corporate assets” presents mainly cash and deposit, property, plant and equipment and investment securities that are not allocated to reportable segments.
Note 2. Segment profit is reconciled to operating income on the consolidated statements of income.
Note 3. Related information for the years ended March 31, 2014 and 2013
(a) Information by geographical area
Net sales:
Millions of yen
2014
Japan Asia North America Canada Other Total
¥19,684 ¥2,022 ¥8,240 ¥2,006 ¥860 ¥32,814
Millions of yen
2013
Japan Asia North America Canada Other Total
¥19,098 ¥1,239 ¥5,879 ¥1,740 ¥814 ¥28,772
Thousands of U.S. dollars
2014
Japan Asia North America Canada Other Total
$191,329 $19,653 $80,093 $19,498 $8,359 $318,954
Property, plant and equipment:
Millions of yen
2014
Japan Asia North America Canada Total
¥2,990 ¥255 ¥4,664 ¥894 ¥8,804
Millions of yen
2013
Japan Asia North America Canada Total
¥2,955 ¥91 ¥2,344 ¥896 ¥6,287
Thousands of U.S. dollars
2014
Japan Asia North America Canada Total
$29,062 $2,478 $45,334 $8,689 $85,575
(b) Information by product and service has been omitted since similar information is disclosed as information by report-
able segment. Information by major customer has been omitted since there were no sales to single external
customer accounting for 10% or more of the consolidated sales.
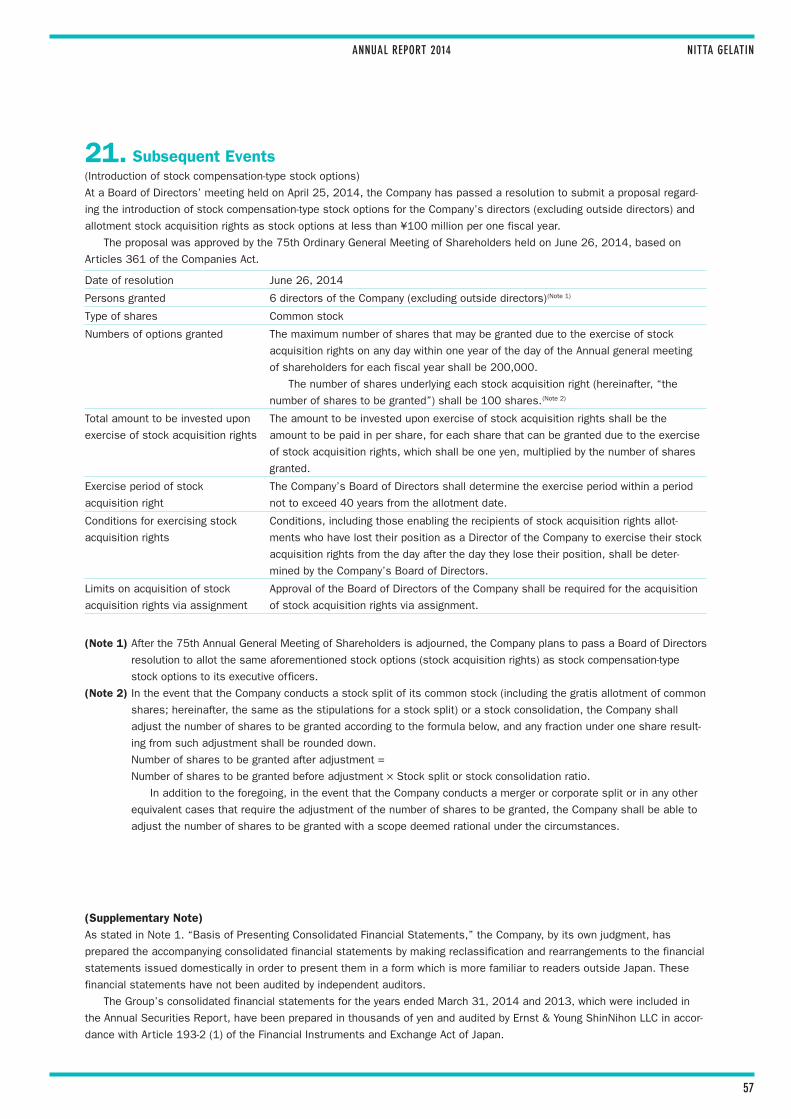
57
Nitta GelatiNaNNual report 2014
21. Subsequent Events(Introduction of stock compensation-type stock options)
At a Board of Directors’ meeting held on April 25, 2014, the Company has passed a resolution to submit a proposal regard-
ing the introduction of stock compensation-type stock options for the Company’s directors (excluding outside directors) and
allotment stock acquisition rights as stock options at less than ¥100 million per one fiscal year.
The proposal was approved by the 75th Ordinary General Meeting of Shareholders held on June 26, 2014, based on
Articles 361 of the Companies Act.
Date of resolution June 26, 2014
Persons granted 6 directors of the Company (excluding outside directors) (Note 1)
Type of shares Common stock
Numbers of options granted The maximum number of shares that may be granted due to the exercise of stock
acquisition rights on any day within one year of the day of the Annual general meeting
of shareholders for each fiscal year shall be 200,000.
The number of shares underlying each stock acquisition right (hereinafter, “the
number of shares to be granted”) shall be 100 shares. (Note 2)
Total amount to be invested upon
exercise of stock acquisition rights
The amount to be invested upon exercise of stock acquisition rights shall be the
amount to be paid in per share, for each share that can be granted due to the exercise
of stock acquisition rights, which shall be one yen, multiplied by the number of shares
granted.
Exercise period of stock
acquisition right
The Company’s Board of Directors shall determine the exercise period within a period
not to exceed 40 years from the allotment date.
Conditions for exercising stock
acquisition rights
Conditions, including those enabling the recipients of stock acquisition rights allot-
ments who have lost their position as a Director of the Company to exercise their stock
acquisition rights from the day after the day they lose their position, shall be deter-
mined by the Company’s Board of Directors.
Limits on acquisition of stock
acquisition rights via assignment
Approval of the Board of Directors of the Company shall be required for the acquisition
of stock acquisition rights via assignment.
(Note 1) After the 75th Annual General Meeting of Shareholders is adjourned, the Company plans to pass a Board of Directors
resolution to allot the same aforementioned stock options (stock acquisition rights) as stock compensation-type
stock options to its executive officers.
(Note 2) In the event that the Company conducts a stock split of its common stock (including the gratis allotment of common
shares; hereinafter, the same as the stipulations for a stock split) or a stock consolidation, the Company shall
adjust the number of shares to be granted according to the formula below, and any fraction under one share result-
ing from such adjustment shall be rounded down.
Number of shares to be granted after adjustment =
Number of shares to be granted before adjustment × Stock split or stock consolidation ratio.
In addition to the foregoing, in the event that the Company conducts a merger or corporate split or in any other
equivalent cases that require the adjustment of the number of shares to be granted, the Company shall be able to
adjust the number of shares to be granted with a scope deemed rational under the circumstances.
(Supplementary Note)As stated in Note 1. “Basis of Presenting Consolidated Financial Statements,” the Company, by its own judgment, has
prepared the accompanying consolidated financial statements by making reclassification and rearrangements to the financial
statements issued domestically in order to present them in a form which is more familiar to readers outside Japan. These
financial statements have not been audited by independent auditors.
The Group’s consolidated financial statements for the years ended March 31, 2014 and 2013, which were included in
the Annual Securities Report, have been prepared in thousands of yen and audited by Ernst & Young ShinNihon LLC in accor-
dance with Article 193-2 (1) of the Financial Instruments and Exchange Act of Japan.